volume 5, issue 3 (i) - empyreal higher education · volume 5, issue 3 ( i ) : july - september...
TRANSCRIPT
Volume 5, Issue 3 (I)July - September 2017
International Journal of Research in Management & Social Science
Volume 5, Issue 3 ( I ) : July - September 2017
Chief Patron Mr. Zahirul Alam Ahmed Director, Empyreal Institute of Higher Education. President , Bhramaputra Welfare Organization
Editor- In-Chief Dr. Tazyn Rahman
Members of Editorial Advisory Board
Mr. Nakibur Rahman Ex. General Manager ( Project ) Bongaigoan Refinery, IOC Ltd, Assam
Dr. Mukesh Saxena Pro Vice Chancellor, University of Technology and Management, Shillong
Dr. Alka Agarwal Director, Mewar Institute of Management, Ghaziabad
Dr. Archana A. Ghatule Director, SKN Sinhgad Business School, Pandharpur
Prof. (Dr.) Sudhansu Ranjan Mohapatra Dean, Faculty of Law, Sambalpur University, Sambalpur
Prof.(Dr.) Sharad Kumar Goel Director, Indirapuram Institute of Higher Studies, Ghaziabad
Dr. P. Malyadri Principal, Government Degree College, Hyderabad
Prof. (Dr.) Monoj Kumar Chowdhury Professor, Department of Business Administration, Guahati University, Guwahati
Prof.(Dr.) Shareef Hoque Professor, North South University, Bangladesh
Prof. (Dr.) Baljeet Singh Hothi Professor, Gitarattan International Business School, Delhi
Prof.(Dr.) Michael J. Riordan Professor, Sanda University, Jiashan, China
Prof. (Dr.) Badiuddin Ahmed Professor & Head, Department of Commerce, Maulana Azad Nationl Urdu University, Hyderabad
Prof.(Dr.) James Steve Professor, Fresno Pacific University, California, USA
Dr. Anindita Sharma Dean & Associate Professor, Jaipuria School of Business, Indirapuram, Ghaziabad
Prof.(Dr.) Chris Wilson Professor, Curtin University, Singapore
Prof. (Dr.) Jose Vargas Hernandez Research Professor, University of Guadalajara,Jalisco, México
Prof. (Dr.) Amer A. Taqa Professor, DBS Department, University of Mosul, Iraq
Prof. (Dr.) Himanshu Pandey Professor, Department of Mathematics and Statistics Gorakhpur University, Gorakhpur
Dr. Nurul Fadly Habidin Faculty of Management and Economics, Universiti Pendidikan Sultan Idris, Malaysia
Prof. (Dr.) Agbo Johnson Madaki Faculty, Faculty of Law, Catholic University of Eastern Africa, Nairobi, Kenya
Dr. Neetu Singh HOD, Department of Biotechnology, Mewar Institute, Vasundhara, Ghaziabad
Prof. (Dr.) D. Durga Bhavani Professor, CVR College of Engineering, Hyderabad, Telangana

Prof. (Dr.) Shashi Singhal Professor, Amity University, Jaipur
Prof. (Dr.) Aradhna Yadav Professor, New Horizon College of Engineering, Bengaluru
Prof. (Dr.) Alireza Heidari Professor, Faculty of Chemistry, California South University, California, USA
Prof.(Dr.) Robert Allen Professor Carnegie Mellon University, Australia
Prof. (Dr.) Badar Alam Iqbal Adjunct Professor, Monarch University, Switzerland
Prof. (Dr.) S. Nallusamy Professor & Dean, Dr. M.G.R. Educational & Research Institute, Chennai
Dr. Dhananjay Prabhakar Awasarikar Associate Professor, Suryadutta Institute, Pune
Dr. Sarmistha Sarma Associate Professor, Institute of Innovation in Technology and Management
Dr. Mohammad Younis Associate Professor, King Abdullah University, Saudi Arabia
Dr. Pranjal Sharma Associate Professor, Department of Management Mile Stone Institute of Higher Management, Ghaziabad
Dr. Kavita Gidwani Associate Professor, Chanakya Technical Campus, Jaipur
Dr. Lalata K Pani Reader, Bhadrak Autonomous College, Bhadrak, Odisha
Dr. Vijit Chaturvedi Associate Professor, Amity University, Noida
Dr. Sunita Dwivedi Associate Professor, Symbosis Center for Management Studies, Noida
Dr. Marwan Mustafa Shammot Associate Professor, King Saud University, Saudi Arabia
Dr. R. Navaneeth Krishnan Associate Professor, Bharathiyan College of Engg & Tech, Puducherry
Dr. Juhab Hussain Assistant Professor, King Abdulaziz University, Saudi Arabia
Dr. Namita Dixit Assistant Professor, ITS Institute of Management, Ghaziabad
Dr. V. Tulasi Das Assistant Professor, Acharya Nagarjuna University, Guntur, A.P.
Mr. Sukhvinder Singh Assistant Professor, Institute of Innovation in Technology & Management
Dr. Urmila Yadav Assistant Professor, Sharda University, Greater Noida
Dr. Nidhi Agrawal Assistant Professor, Institute of Technology & Science, Ghaziabad
Copyright @ 2017 Empyreal Institute of Higher Education, Guwahati All rights reserved. No part of this publication may be reproduced or transmitted in any form or by any means, or stored in any retrieval system of any nature without prior written permission. Application for permission for other use of copyright material including permission to reproduce extracts in other published works shall be made to the publishers. Full acknowledgment of author, publishers and source must be given. The views expressed in the articles are those of the contributors and not necessarily of the Editorial Board or the Institute. Although every care has been taken to avoid errors or omissions, this publication is being published on the condition and understanding that information given in this journal is merely for reference and must not be taken as having authority of or binding in any way on the authors, editors and publishers, who do not owe any responsibility for any damage or loss to any person, for the result of any action taken on the basis of this work. All disputes are subject to Guwahati jurisdiction only.

International Journal of Research in Management & Social Science
Volume 5, Issue 3 ( I ) : July - September 2017
CONTENTS
Research Papers
EXPLORING THE LIFE EXPERIENCES OF WHEELCHAIR USER STUDENTS IN ADDIS ABABA UNIVERSITY: A GROUNDED THEORY PERSPECTIVE
Adugna Bersissa Merdassa
1 – 5
LAND USE AND LAND COVER DYNAMICS IN RELATION TO SLOPE AND TYPES OF LANDSCAPE: A CASE STUDY OF MANIPUR
Kiran Sharma
6 – 12
A STUDY ON MORPHOMETRIC CHARACTERISTICS OF JIADHAL RIVER BASIN USING REMOTE SENSING AND GIS
Akangsha Borgohain and Dhrubajyoti Sahariah
13 – 19
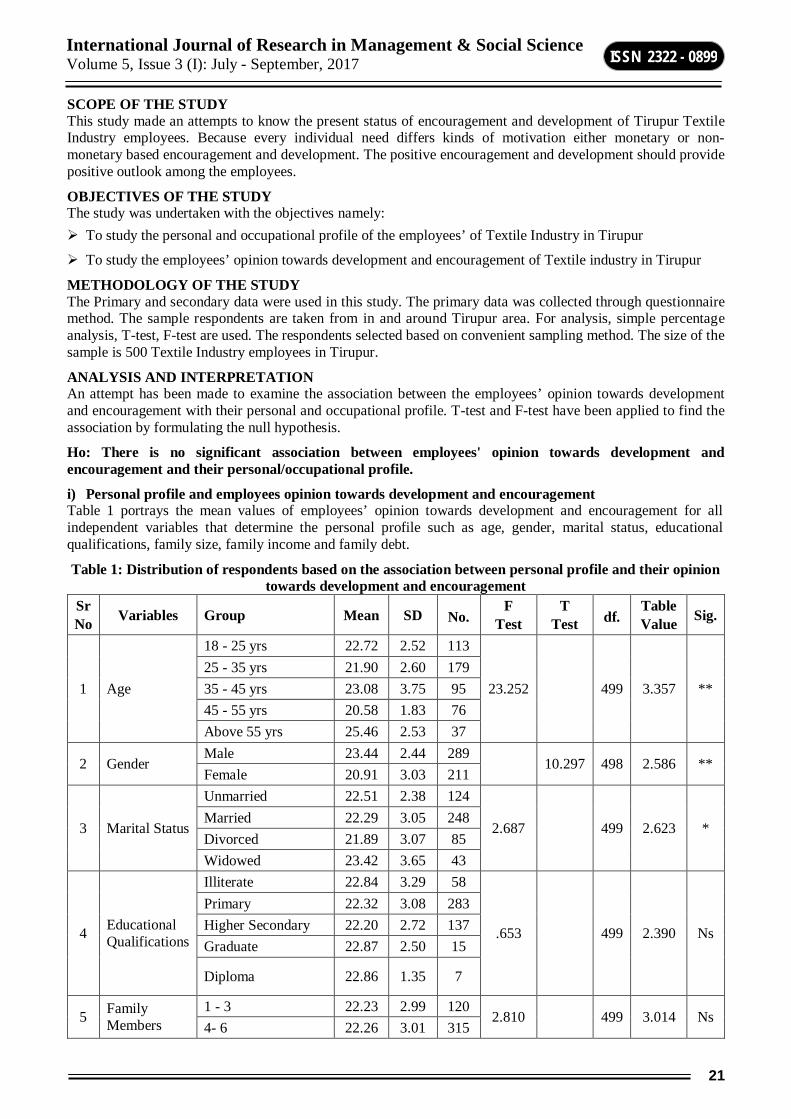
LEVEL OF DEVELOPMENT AND ENCOURAGEMENT TO TEXTILE INDUSTRY EMPLOYEES IN TIRUPUR
Dr. Kanakarathinam. R
20 – 24
DETERMINANTS OF PROFITABILITY IN INDIAN TELECOM INDUSTRY USING FINANCIAL RATIO ANALYSIS
Anita Nandi Barman and Prof. Partha Pratim Sengupta
25 – 29
AN ANALYSIS OF TRENDS OF BANKS IN NIFTY BANK USING RELATIVE STRENGTH INDEX (RSI) AND RATE OF CHANGE INDICATOR (ROC)
V. S. Binu and Dr. T. Vetrivel
30 – 38
THE ROLE OF SEBI IN PROTECTING THE INTERESTS OF INVESTORS AND REGULATION OF FINANCIAL INTERMEDIARIES : A CASE STUDY OF RAYALASEEMA REGION, ANDHRA PRADESH – INDIA
S Mohana Murali
39 – 57
M-COMMERCE: NEW GENERATION
Dr. Brijesh H Joshi
58 – 61
CONSEQUENCES OF DOMINANCE BY AN INTERESTED PERSON IN JUDICIAL PROCEEDINGS IN INDIAN COURTS : A CRITICAL STUDY
Dr. Dhananjay Avasarikar
62 – 65
EMPOWERMENT AND WOMEN ENTREPRENEURSHIP IN TRIBAL AREA [A CASE STUDY FOR INDORE DIVISION OF MP]
Dr. Rajendra Singh Waghela
66 – 70
A STUDY ON CONSUMER BUYING BEHAVIOUR OF MARUTI SUZUKI FOUR WHEELER
Patel Kalpeshkumar Trikamlal
71 – 74
CHARACTERISTICS PATTERN OF FUNCTIONS , FUNCTIONAL HIERARCHIES OF URBAN CENTRES AND IMPACT ON URBANISATION IN DIBRUGARH AND TINSUKIA DISTRICTS, ASSAM
Dr. Sangeeta Boruah Saikia
75 – 82

CHALLENGES AND OPPORTUNITIES IN SOCIAL WORK PROFESSION: REFLECTING ON TEACHING & PRACTICE
Dr. Satish Kumar
83 – 85
FINANCIAL INCLUSION: SERVICES AND STRATEGIES OF RETAIL BANKING
Dr. M. Veerabhadra Rao and B.V.S.S. Subba Rao
86 – 90
HUMAN RESOURCES MANAGEMENT PRACTICES IN BANKING SERVICES IN INDIA
Dr. Vijaya Lakshmi Pothuraju
91 – 96
AN ANALYSIS ON THE CONSEQUENTIAL IMPACTS OF GENDER MAINSTREAMING IN EDUCATIONAL INSTITUTIONS FOR GENDER EQUITY MANAGEMENT USING FUZZY CLUSTERING
Nivetha Martin, P. Pandiammal and W. Lilly Merline
97 – 100

1
International Journal of Research in Management & Social Science Volume 5, Issue 3 (I): July - September, 2017
ISSN 2322 - 0899
EXPLORING THE LIFE EXPERIENCES OF WHEELCHAIR USER STUDENTS IN ADDIS ABABA UNIVERSITY: A GROUNDED THEORY PERSPECTIVE
Adugna Bersissa Merdassa College of Education and Behavioral Sciences, Wollega University, Nekemte, Ethiopia
ABSTRACT This study was aimed at investigating the life experiences of wheelchair user students in Addis Ababa University and to generate a theoretical model about their life experiences in a university. Wheelchair users have unique problems among students with disabilities due to the presence of physical barriers in university environments and some negative attitudinal barriers. In this study, the university life experience of four students with disabilities, who used a wheelchair to attend university education, was explored using semi-structured interviews. The interview sessions were analyzed in stages as suggested for grounded theory research. Accordingly, the study identified the core category or phenomenon (whole experience in the university) interacting with five major categories (1) Motivating factors for university education; (2) Knowledge level of university community; (3) Responsibility of the university; (4) Accessibility features of the university; and (5) Personal support systems. It is indicated that most places in the university are inaccessible for the wheelchair user students. Thus, much attention should be given by Addis Ababa University to alleviate the inaccessibility nature of its campuses. This is possible by making some modifications to the older buildings and designing the new ones in such a way that they can accommodate the need of the wheelchair users. Further research is also needed to better understand the factors in a university environment that prevent wheelchair user students from succeeding.
Key Words: Wheelchair users, Grounded theory research
INTRODUCTION Estimates of the incidence of disability in Ethiopia vary widely. According to the report of the Housing and Population Census of the Ethiopian Government (CSA, 1998), the number of persons with disabilities constitutes 1.9% of the total population. On the other hand, a baseline survey in 1995 gave a higher estimate of 2.95% (Tirussew et al., 1995). Japan International Cooperation Agency (2002) and ILO (2003) also estimated that 7.6%, or five million people were disabled. Moreover, Federal HIV/AIDS Prevention and Control Office (2010) estimated that there are 7 million people living with some kind of disability in Ethiopia, 10% of the total population. Yet, it is believed that the number of persons with disabilities in Ethiopia is likely to be underestimated due to inadequate definitions or what constitutes disability and which disabilities should be included in the count. It is also likely that parents are not willing to disclose that they have a child or family member with a disability because of stigma (Tirussew, 2005). The actual number of people with disabilities in Ethiopia is, therefore, likely to be much higher.
It is obvious that disabled people in developing countries live below the poverty line, and often lack access to key areas of development, including health, education, training and employment. Thus, their problems can be alleviated only if there is a commitment from the highest levels in promoting equality of opportunity and inclusion (ILO, 2011). According to ILO’s report, this can be evidenced by the number of disabled undergraduate students in AAU which has reached 450. This figure reveals that in Ethiopia the number of students with disabilities enrolled in higher institution is increasing. An increase in enrolment is a necessary condition, but not a sufficient condition for disabled people to be successful in higher institution. They must also make some kinds of adjustments. In this regard, Allison (1994) pointed out that on entering college, students with disabilities must make two major adjustments: first, adapting those things every student faces, such as leaving the comfort of home, living on their own, managing their finances and having to compete with other students; and second, dealing with the disability in a college environment. Research on disabled students in general and that of wheel chair users in particular is scanty in Ethiopia. Thus, this study was aimed at investigating the life experiences of wheelchair users in Addis Ababa University and to generate a theoretical model about their life experiences in a university.
MATERIALS AND METHODS Participants There were nine students with physical disabilities requiring them to use a wheelchair in Addis Ababa University in the year 2014/15; of this total population four students were participated in the study. The data gathered related directly to students’ real life experience. Participants were selected based on the criteria that they all were wheelchair users for daily activities and attending university education.

2
International Journal of Research in Management & Social Science Volume 5, Issue 3 (I): July - September, 2017
ISSN 2322 - 0899
DATA COLLECTION The following interview guides with open-ended questions were used for data collection: Could you please describe what it means to attend university in a wheelchair? ; Being a wheelchair user, what would you consider a challenging experience in university? ; Being a wheelchair user, what would you consider a satisfactory experience in a university? These were the major questions explored by the researcher. Other questions also discussed the following issues: accessibility features of their university; disability services; knowledge level of the university community about wheelchair users; their interactions with different people in the university; and their personal support systems.
DATA ANALYSIS Data analysis was undertaken in stages as Creswell (2007) suggested for grounded theory research. The stages include: (1) open coding, in which categories of information were formed; (2) axial coding, in which one open coding category was selected and placed at the center as a core category or phenomenon and then relates all other categories to it; and (3) selective coding, in which a theory was written based on the interrelationship of the categories from axial coding.
RESULTS The purpose of this study was to investigate the life experience of wheelchair users in Addis Ababa University and to generate a theoretical model about their life experiences in a university. Consequently, five major categories and one core category or phenomenon were emerged from the data analysis, which finally resulted in the development of the model for wheelchair users in the university. The major categories include: (1) motivating factors for university education; (2) knowledge level of university community; (3) responsibility of the university; (4) accessibility features of the university; and (5) personal support systems. ‘Whole experience in the university’ is the core category or phenomenon connecting all the five major categories describing students’ experiences in the university.
Fig 1: Theoretical model for wheelchair users in AAU
MOTIVATING FACTORS FOR UNIVERSITY EDUCATION The participants described what motivates them to join the university as follows: (1) family pressure; (2) perception of university education as a means to get recognition and respect from the society; (3) to get the job and to ensure self supporting; (4) to break the traditional belief of the society that people with disability can’t contribute anything to the society and to show that individuals with disabilities in general and wheelchair users in particular have the capabilities to do as much as non-disabled people can do and that physical disabilities need not be a limiting factor in their contribution to society; and (5) to get public view and to make their voice heard. Regarding the fifth motivating factor one participant described:
In Ethiopia wheelchair users start to get the chance for university education only recently than people with visual impairment. Thus, people with visual impairment have better access to media and the better their voice is heard by the government bodies than do the wheelchair users.

3
International Journal of Research in Management & Social Science Volume 5, Issue 3 (I): July - September, 2017
ISSN 2322 - 0899
These participants believe that still the society underestimates people with disabilities, specially the wheelchair users, which motivated them to set their goals on personal achievement. To be successful and contribute something to their society, they want to get university education and become an expert in a particular field. In general, the participants believed that a university education would take them wherever they want to go in life, towards a better job, economic success, proving their accomplishments, reducing misconceptions about individuals with disabilities, and ultimately, self-achievement.
KNOWLEDGE LEVEL OF UNIVERSITY COMMUNITY The university community identified by the participants include: (1) teaching staff; (2) students; and (3) administration workers. Participants described that there is individual differences among the teaching staff in understanding and helping the wheelchair users; some were sensitive and some were uncaring or irresponsive. Regarding the irresponsive teaching staff one participant who is only recently disabled and start to use the wheelchair described:
I was a student without disability when I joined this university. I encountered the problem here in the university. It is strange for me to be on a wheelchair and I am also on medication. Thus, sometimes I miss classes and tests; other times I am going to class being late. Some teachers are unfriendly and do not show any willingness to understand me and to help me.
Participants believe that interaction with the teaching staff with positive attitude towards them increases their satisfaction with the university and strengthen their student life experiences.
Moreover, participants described their interactions with administration workers (cafe workers, security personals, proctors, library workers) were generally friendly. Their interactions with non-disabled students were open and friendly. But when coming to the help they were getting from the non-disabled students to push their wheelchair, they said it ‘is situational’. The help the non-disabled students were rendering to the wheelchair users is situational in the sense that during the seasons of tests and exams everybody is running for his/her own personal achievement without considering the wheelchair users. At this time, asking for and receiving help is more problematic.
Participants considered interaction among the university community is an integral part of their university life. Although there were varying degrees of awareness and social integrations, their interaction with the university community was found to be positive. They were ready to cope with the challenges and to do whatever it takes to complete their education and move on in to the broader society.
RESPONSIBILITY OF THE UNIVERSITY Participants believed that their university should do many things for them to accommodate their specific disability-related needs. They indicated that their university had a lot of limitations. To mention few, among the many buildings in AAU only the NCR first floor is accessible, no recreation facilities for the wheelchair users, no playing fields for the wheelchair users to engage in different kinds of games, no laboratories and libraries accessible for them. One participant described:
I was a natural science student. I was assigned to Arat kilo campus to the department of mathematics. But one of the professors in the department advised me to join Sidist kilo for the buildings in Arat kilo are not accessible. Accordingly, I joined Sidist kilo and assigned to the department of Amharic. But for I had no interest and competence in social sciences, I scored a low grade (1.50 GPA)
There is a computer facility for all the disabled students at the ground floor of Mandela building. Besides, the female participant said that she has accessible dormitory which has facilities like TV. Generally, the participants were optimistic about the future of the AAU for wheelchair users. They expect that by taking adequate actions to accommodate their specific disability needs, the university could help integrate more wheelchair users in to its system.
ACCESSIBILITY FEATURES OF THE UNIVERSITY The major problem of the wheelchair users is mobility. Mobility is an issue of whether a student is physically able to climb stairs or walk across campus. Buildings in the university whether old or the newly built are inaccessible, for there is no lifts and elevators. Thus, there are inaccessible classrooms, laboratories, libraries, etc. Concerning this one participant said:
Our question is not political question but it is the question of human right. We have been given the right to learn but the environment is not made conducive to us to realize our potential to the maximum. The old buildings need to be slightly modified to be accessible for us and the new ones should be built so that wheelchair users can get access.

4
International Journal of Research in Management & Social Science Volume 5, Issue 3 (I): July - September, 2017
ISSN 2322 - 0899
The distance between buildings and the amount of time it would take to travel between classes and dormitories is another challenge to the wheelchair users. One participant described:
It is difficult to access in the campus. I can’t use my time as I have planned. For example, if I want to go to library, I have to wait for someone who pushes my wheelchair. Therefore, I am forced to do what I should do only when it is convenient for other students.
Generally, considering the inaccessibility nature of the university minimize the challenges and the time and energy the wheelchair users’ wastes. This is possible by making some modifications to the older buildings and designing the new ones in such a way that they can accommodate the need of the wheelchair users.
PERSONAL SUPPORT SYSTEM Among the four participants, three of them had a family as a personal support network assisting them with their school-related needs and academic goals. All participants had a support network from the university. They are earning 120 birr as a pocket money every month. Besides the financial support, three participants are receiving emotional support from their family. Even one participant is living in the university with her younger brother who is serving her as personal care attendant for specific physical (assistance with self care) and school related needs (caring books, photocopying). Family emerged as the foremost support network for the three participants. But one participant said:
I do not have a family. My father and my mother were died, and also two of my brothers. I have attended secondary school by being assisted by the school teachers. Now, I don’t have any personal support network except for 120 birr I am earning from the university as a pocket money.
The support the wheelchair users used to obtain from their friends include: academic (note taking, photocopying, and informational), social and emotional help. They also obtained physical support from their friends to access in the campus.
WHOLE EXPERIENCE IN THE UNIVERSITY Whole experience in the university is a core category or phenomenon, which appears central to the study, interweaving all the major categories in the study. All the participants described that a satisfactory university life experience goes beyond the academics. They consider this experience in the university to be a process and their degree to be output. According to these participants, GPA is not the only indicator of success in the university. One participant described:
Grade is very important. But it is not indicating your all success in the university. It is only part of your success. To be satisfied in the university requires being involved in all activities in the university.
Involvement in disability services, teacher-student interactions, peer interactions, and social life in the university have all been mentioned by these students to be important for their success in the university.
DISCUSSION The findings of the study showed that wheelchair users still face physical and attitudinal barriers in the university. While accessibility to different facilities is equally important to wheelchair user students in the same way it is important to their counterparts, physical inaccessibility to most buildings and facilities of the university were among the most difficult challenges they face in the university. Supporting this view, Bowman and Marzouk (1990) revealed that factors such as social life in college, adjustment to disability, services available to students with disabilities, teacher-student interactions and peer interactions were all considered extremely important to satisfactory university life. Similarly, Low (1996) explained that achieving academic success, making friends, expressing their sexuality, developing romantic relationships, etc., are the same concerns which occupy students without disabilities.
Participants believed that the relationship with the university is not limited to education but also to preparation for life beyond the classroom. Building confidence and the necessary social skills of students with disabilities is of equal priority to the necessary academic skills that prepare people to meet feature challenges (Collins, 1995). The result of the present study support this claim, as the participants did not consider grade to be the sole predictor of their success and satisfaction in the university.
Generally, earlier studies revealed that there is a direct relationship between school facilities and student satisfaction and student adjustment. The better the facilities and accommodation, the more satisfied the students (Allison, 1994). The result of this study indicated that physical accessibility to most buildings and facilities of the university are difficult to overcome, which inevitably made wheelchair users to feel dissatisfied in university life.

5
International Journal of Research in Management & Social Science Volume 5, Issue 3 (I): July - September, 2017
ISSN 2322 - 0899
CONCLUSION The purpose of this study was to investigate the life experience of wheelchair users in Addis Ababa University, and to generate a theoretical model about their life experiences in a university. Hence, the study identified the core category or phenomenon (whole experience in the university) interacting with five major categories (1) Motivating factors for university education; (2) Knowledge level of university community; (3) Responsibility of the university; (4) Accessibility features of the university; and (5) Personal support systems.
The data obtained describe university life from the view of the participants. The findings of the study revealed that all wheelchair users perceive life in the university as very difficult for it involves interactions with various human and non-human elements. Physical inaccessibility to most buildings and facilities of the university were among the most difficult challenges the wheelchair users face in the university, which they described as barriers to their satisfaction. Hence, wheelchair users did not consider grade to be the sole predictor of their success and satisfaction in the university.
REFERENCES Allison, L.S. (1994). “Utilization of Reasonable Accommodations for University Students with Disabilities
and their Relationship to Graduation Rates”. Unpublished Theses, California
Bowman, O.J. & Marzouk, D.K. (1990). Using the Americans with Disabilities Act of 1990 to Empower University Students with Disabilities. American Journal of Occupational Therapy 46: 450-6.
Collins, K.D. (1995). “A Model of College Adjustment for Students with Physical Disabilities”. Unpublished Doctoral Dissertation, University of Illinois at Urbana-Champaign
Creswell, J.W. (2007). Qualitative Inquiry and Research Design: Choosing Among Five Approaches. (2nd ed.).Thousand Oaks CA: Sage
CSA (1998). Housing and Population Census Statistical Abstract. Federal Democratic Republic of Ethiopia, Addis Ababa.
Federal HIV/AIDS Prevention and Control Office (2010). Federal HIV/AIDS Prevention and Control Office: Report on Progress towards Implementation of the UN Declaration of Commitment on HIV/AIDS. Federal Democratic Republic of Ethiopia, Addis Ababa
Low, J. (1996). Negotiating Identities, Negotiating Environments: an Interpretation of the Experiences of Students with Disabilities. Disability and Society, vol.11,No. 2, pp. 235- 248.
Japan International Cooperation Agency (2002). Country Profile on Disability. Federal Democratic Republic of Ethiopia, Mimeographed, Addis Ababa.
ILO (2011). Moving Towards Disability Inclusion/ International Labor Office. Geneva
Tirrussew, T. (2005). Disability in Ethiopia: Issues, insights and implications, conceptualizing disability, early intervention, inclusive education, gender and disability, resilience, and success. Addis Ababa, Ethiopia: Addis Ababa University Printing Press.
Tirussew T., Savolainen, Agedew R. and Deaniel D.(1995). Baseline Survey on Disability in Ethiopia, FINNIDA, Project, Institute of Educational Research, Addis Ababa University.

6
International Journal of Research in Management & Social Science Volume 5, Issue 3 (I): July - September, 2017
ISSN 2322 - 0899
LAND USE AND LAND COVER DYNAMICS IN RELATION TO SLOPE AND TYPES OF LANDSCAPE: A CASE STUDY OF MANIPUR
Kiran Sharma
Research Scholar, Department of Geography, Gauhati University, Guwahati
ABSTRACT This paper investigates the relationship between Land use and land cover changes and its relation to slope gradient where all land use types can be found at every gradient from valley to hills in the study area.The changes in the landscape were analyzed using Landsat Multi-Spectral Scanner (MSS) and Landsat- 8 data during the period 2002–2014. ASTER DEM data is used for slope analysis. Supervised classification technique using maximum likelihood algorithm was adopted for land use/land-cover change analyses. The land use land cover data were classified into seven types, forest (dense, moderate and open), agricultural land, water, and fallow land. The area of forest being augmented with the increase in slope gradient, while the area of the other land use types (agricultural land, and built-up) declined. Degradational activities, namely Jhum cultivation, compounded by increasing population pressure and demands for agriculture land are the prime drivers in addition to other proximate drivers of deforestation. The accuracy was checked using GPS and Google map and accuracy assessment was done using kappa statistics.
Key words: Land use land cover change, Deforestation, Mountain topography, Shifting cultivation.
INTRODUCTION The growing population and increasing socio-economic necessities creates a pressure on land use/land cover which results in unplanned and uncontrolled changes in LULC (Seto et al., 2002). This changes impact on water balance (Schilling et al., 2008), land and air resources, ecosystem processes and function (Lambin et al., 2000; Polasky et al., 2011) and climate (Hale et al., 2006); biodiversity (Myers et al., 2000; Gibson et al. 2011; Bouget et al., 2012), soil degradation (Trimble & Crosson, 2000; Biro et al., 2013; Leh et al., 2013) and increasing the amount of carbon released to the atmosphere (Baccini et al., 2012). Land cover change plays a pivotal role in regional social and economic development and global environmental changes (Xiuwan, 2002). As an interface between natural conditions and anthropogenic influence, and the most important socioeconomic driving forces of both global and local environmental change, change in land use and land cover is one of the main factors that man influences the environment and it play a major role in the dynamics and changes of landscapes (Krausmann et al., 2003; Turner et al., 1993; Vitousek, 1992; Vitousek et al., 1997).
OBJECTIVES (1) To quantify changes in land use/land cover from 2002 to 2014.
(2) To identify the influence of slope on land use distribution and transformation.
MATERIALS AND METHODOLOGY
Study Area
Fig.1 Location of the study area (Manipur)
According to the India State of Forest Report (SFR) 2015, Manipur has more than 76 per cent forest cover. The state is well known for its unique ecology and rich biodiversity and is a part of the vulnerable Himalayan ecosystem (ICIMOD, 2010). The inhabitants have high natural resource dependency where more than 33 tribal
7
International Journal of Research in Management & Social Science Volume 5, Issue 3 (I): July - September, 2017
ISSN 2322 - 0899
groups who have natural resource intensive life style and are more vulnerable to climate change (SAPCC, 2013). The state is susceptible to anthropogenic greenhouse gas (GHG) emissions (SAPCC, 2013). If the ecosystem consideration is mountainous, then it becomes more difficult to understand the impact of climate change due to its complexity in topography and orographic features, (ICIMOD, 2010). In a state like Manipur, where about 90% of the total area is in the hills and where forest is the largest land use pattern, taking up large scale afforestation needs no emphasis. Increasing population and decreasing land productivity, relatively higher dependence on natural resources (e.g. forests) are also constraints for the region’s environmental sustainability (INCCA, 2010). According to various reports of FSI and NRSA on an average, the jhum are increased from 46.49% (1991-92) to 69 % (2001-02) in the state. The main districts which are largely affected by jhum are Senapati, Churachandpur, Ukhrul, Tamenglong and Chandel Districts.
Out of total geographical area 77% land was occupied by steep slope (above 73°) where on the other hand only 8% having the gentle slope (below 21°) which is mostly in central valley and Jiribum subdivision. The slope gradient influences water infiltration, runoff and soil erosion and sedimentation processes, and these affect soil genesis and vegetation development (Butler et al., 1986). The dynamic relationship between the slope gradient and LULC emphasizes the need for sustainable land resource management to improve the food security of the local community. The aim of this study, therefore, was to determine spatial and temporal the changes in landuse landcover and to estimate the topographical effect using slope gradient on land use/cover spatial variation.
DATA USED Multi-temporal sets of landsat data of 30m spatial resolution were collected to study the changes in the land use land cover from 2002 to 2014. Supervised classification technique using maximum likelihood classifier was used for landuse calssification. The land use was classified into seven categories: water bodies, open forest, dense forest, shrub, Agricultural land, fallow land and built-up area. Limited field check was carried out to improve the accuracy of land use/ land cover map maps.
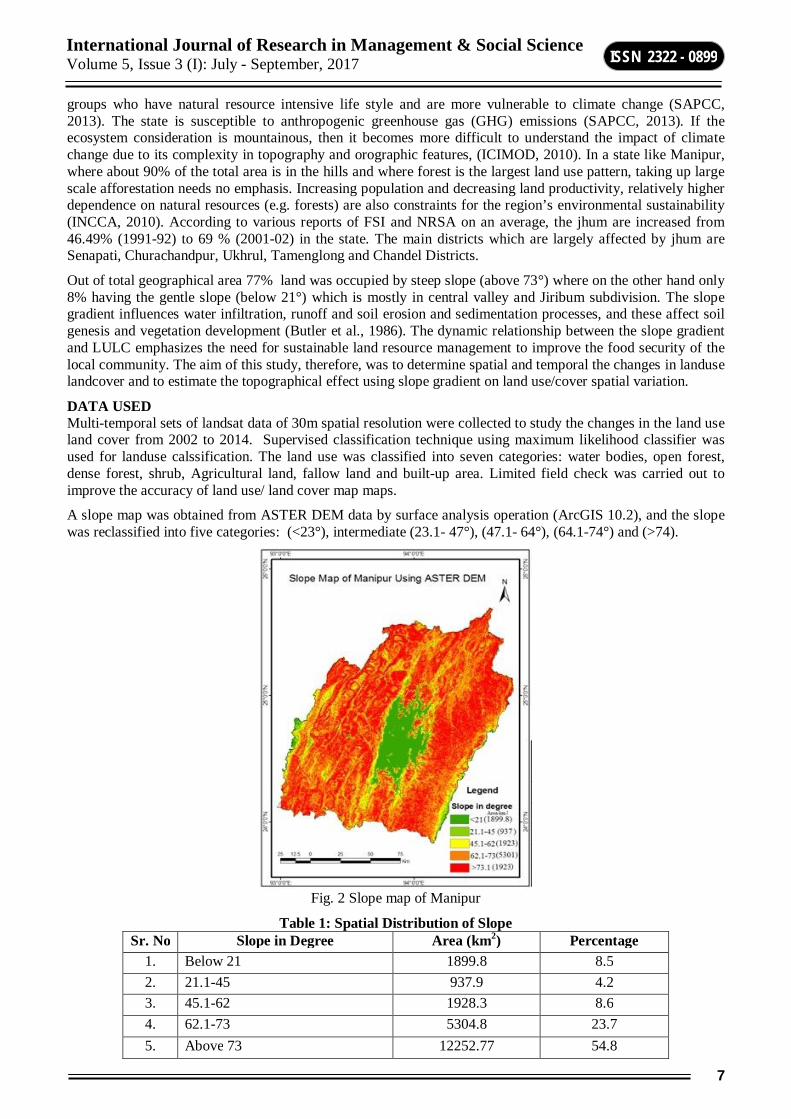
A slope map was obtained from ASTER DEM data by surface analysis operation (ArcGIS 10.2), and the slope was reclassified into five categories: (<23°), intermediate (23.1- 47°), (47.1- 64°), (64.1-74°) and (>74).
Fig. 2 Slope map of Manipur
Table 1: Spatial Distribution of Slope Sr. No Slope in Degree Area (km2) Percentage
1. Below 21 1899.8 8.5 2. 21.1-45 937.9 4.2 3. 45.1-62 1928.3 8.6 4. 62.1-73 5304.8 23.7 5. Above 73 12252.77 54.8

8
International Journal of Research in Management & Social Science Volume 5, Issue 3 (I): July - September, 2017
ISSN 2322 - 0899
RESULTS AND DISCUSSION CHANGE IN LAND USE AND LAND COVER (LULC) Analysis of 2014 land cover data revealed that open forest was the most dominant land cover type covering 64 % of the study area, followed by dense forest 14 % and shrub 9.3, agricultural land with 9.2 %. There has been a gradual decline in the forest cover in the state from 2002 to 2014 (Table 2). The increasing pressure on forested land can be felt by the decreasing percentage (74%) of dense forest category from from 21% in 2002 to 19% in 2009 and 14% in 2014. While on the other hand and increasing built-up and agricultural classes increase to nearly one fourth (25.2%) of the landscape in 2016. The total natural forest cleared between 2002 and 2014 amounts to 65760 ha, which is about 3.6 % of the forest cover that existed in 2002 (Table 2; Fig. 3). Major deforestation took place between 2009 and 2014, destroying about 40083 ha of 2009 total forest cover. Conversely, cultivated land increased from 7% in 2002 to 9.2% in 2014. Though the total expansion of cultivated land from 2002 to 2014 was 40083 ha; shifting cultivation or Jhum farming which is also consider one of the major cause for removal of forest cover has included in Lulc class of shrub and fallow land according to the land cover condition as the land is left open after the Jhuming period. Shrub and fallow land account for 9 % of total geographical area in 2014 which was 7.5% in 2002.
Fig. 3 Landuse land cover map of Manipur 2002-2014
Table 2: Change in area of land use and land cover during 2002-2014
Note: ‘-’ negative sign denote decrease in area.
The dominant land use types in the study area were forest and cultivated land (Table 1), which accounted for about 89 % in 2002 to 88 % in 2014 of the entire area. Two main trends existed in land use changes, i.e. the decrease in dense forest, and the increase in builtup land. Dense forest decreased by approximately 1340 km2; while cultivated and built-up increased by 588 km2 and 223 km2. The changes in each land use type were the combined effects of two processes: conversion to other types and conversion from other types. For example, the area of open forest converted from other land cover types and open forest converted to other land use types; however, the total change area of open forest (1856.7 km2) was less than that of dense forest (-2514.3 km2) during the study period. However, dense forest (forest with crown density greater than 50 per cent) accounted for less than twenty per cent and open forest more than 70 of the forest lands in the study area. For the state, dense forest accounted for a meagre 14.19 per cent of the forest land (2014).

9
International Journal of Research in Management & Social Science Volume 5, Issue 3 (I): July - September, 2017
ISSN 2322 - 0899
Fig. 4 Spatial distribution of Land use and land cover 2002, 2009 and 2014
LAND USE AND LAND COVER CHANGES IN RELATION TO SLOPE AND TYPE OF LANDSCAPE Environmental variables (slope and elevation) constraint the limited expansion of various land use and effect the livelihood and land use decisions. (Trincsi et al., 2014). Topography directly affects forest fragmentation and deforestation (Freitas et al., 2010). Degree of slope was regarded as the major factor influencing soil and water runoff, and it was also the main decisive characteristics for decisions on the reversion of farmland to grassland or woodland (Chen et al., 2001). Degree of slope was also regarded as the main landscape physical parameter influencing on farmers’ landuse decisions (Messing et al., 2003).
Fig 5. Spatial distribution of Lulc in different Slope categories.
Almost all land use types can be found at every slope gradient from valley to hills in the study area. With the increase of slope degree, the area of forest being augmented as well, while the area of the other land use types (agricultural land, and built-up) declined. Gradually almost the steeper slope is also employed for cultivation under shifting cultivation. Degradational activities, namely shifting cultivation, compounded by increasing population pressure and demands for agriculture land are the prime drivers in addition to other proximate drivers of deforestation. The cultivable area is limited while the population pressure has increased. The valley districts, comprising a tenth of the geographical area of the state, support roughly two-thirds of the population (Census, 2011). Most of the permanent agricultural land is in the Central valley; with more than 55% of the entire agricultural land resources of the study area, even though the hills comprise 90 per cent of the state’s total area. There are sharp differences in land use patterns between the valley districts and the hill districts. In the valley, settlements account for more than 55% of their respective areas whereas for the steep slope it accounts for less than two per cent of the area (Fig.5). Forest land for all the hill districts was above 85 per cent of the areas. In valley it is less 10 per cent (2002-2014). Degree of slope observed in this study as discriminating parameters that constrain land use.

10
International Journal of Research in Management & Social Science Volume 5, Issue 3 (I): July - September, 2017
ISSN 2322 - 0899
Table 3: Correlation of Slope and LULC type during 2002- 2014 Year/lulc Open Forest Dense Forest Agriculture Built-up
2002 0.885 0.891 -0.548 -0.626 2009 0.880 0.921 -0.645 -0.588 2014 0.894 0.888 -0.378 -0.628
The correlation value varies from -1 to +1, where +1 positively correlated and -1 indicates perfect negatively correlated. Dense forest shows high positive correlation followed by open forest whereas Agriculture and built-up having negative values shows, as the slope increases the area under landuse decreases. The steepness of slope in the study area act as a main constrain in Landuse.
Fig 6 Lulc change in Gentle Slope and Steep Slope
Degree of slope and the main land use transformation revealed interesting dynamics from 2002 to 2014. There was a distinct relationship between land use and degree of slope during the study period (Fig. 5). Overall, agriculture was the dominant land use type on gentle slopes/valley, followed by open forest and built-up (Fig. 6). While on the steep slopes open forest and dense forest was the dominant land use type. From the figure it is clear that cultivated land dominated on the gentle slope whereas forest land on steeper slope. It can be observe a slight increase of agricultural land despite its steepness. In the valley built-up area increases in the cost of agricultural area these changes reflect the highest potential of the gentle slopes for intensive cultivation in this area and the constraints imposed by steep slopes on such activities.
CONCLUSION The results indicate a greater loss of the natural ecosystem to infrastructural development and both of these classes (urban and agriculture) oftentimes increase at the expense of forest class. The Central valley is one of the most thickly populated areas in the country with a density of 730 persons per sq km as compared to an all India average of 382 persons per sq km. The urban population of valley is four time that of the hill district (Census, 2011). The population growth accelerate deforestation pressure as more the cleared land, more the population it can support (Diaz et al., 2006; DeFries et al., 2010; Reddy et al., 2016). The changes in land use in the study area can be link to increasing population and rapid urbanization. The drivers behind this change are logging; population pressure; unsustainable land-use practices to produce crop after crop in order to remain financially secure. In this study site, the topographic position was an important factor affecting LULC. Positive relationship was found between forest and slope while it was negatively correlated with agriculture and settlement. Higher density of forest cover estimates were found in 20°-30° slope gradient and in an around 1000 m altitude amsl. The abandoned jhum slope at high elevation in the study area shows relatively the low canopy density due to the practice of Jhuming.
REFERENCE Baccini, A. G. S. J., Goetz, S. J., Walker, W. S., Laporte, N. T., Sun, M., Sulla-Menashe, D., ... & Samanta,
S. (2012). Estimated carbon dioxide emissions from tropical deforestation improved by carbon-density maps. Nature Climate Change, 2(3), 182-185.
Biro, K., Pradhan, B., Buchroithner, M., & Makeschin, F. (2013). Land use/land cover change analysis and its impact on soil properties in the northern part of Gadarif region, Sudan. Land Degradation & Development, 24(1), 90-102.

11
International Journal of Research in Management & Social Science Volume 5, Issue 3 (I): July - September, 2017
ISSN 2322 - 0899
Bouget, C., Lassauce, A., & Jonsell, M. (2012). Effects of fuelwood harvesting on biodiversity—a review focused on the situation in Europe 1 1 This article is one of a selection of papers from the International Symposium on Dynamics and Ecological Services of Deadwood in Forest Ecosystems. Canadian Journal of Forest Research, 42(8), 1421-1432.
Butler, J., Goetz, H., & Richardson, J. L. (1986). Vegetation and soil-landscape relationships in the North Dakota Badlands. American Midland Naturalist, 378-386.
Census of India 2011: General Population Totals, Census of India – 2011 Manipur.
Chen, L., Wang, J., Fu, B., & Qiu, Y. (2001). Land-use change in a small catchment of northern Loess Plateau, China. Agriculture, Ecosystems & Environment, 86(2), 163-172.
Díaz, S., Fargione, J., Chapin III, F. S., & Tilman, D. (2006). Biodiversity loss threatens human well-being. PLoS Biol, 4(8), e277.
Díaz, S., Fargione, J., Chapin III, F. S., & Tilman, D. (2006). Biodiversity loss threatens human well-being. PLoS Biol, 4(8), e277.
Freitas, S. R., Hawbaker, T. J., & Metzger, J. P. (2010). Effects of roads, topography, and land use on forest cover dynamics in the Brazilian Atlantic Forest. Forest Ecology and Management, 259(3), 410-417.
FSI (2013). Forest Survey of India. The State of forest report 2013. Dehra Dun: Ministry of Environment & Forests.
Gibson, L., Lee, T. M., Koh, L. P., Brook, B. W., Gardner, T. A., Barlow, J., ... & Sodhi, N. S. (2011). Primary forests are irreplaceable for sustaining tropical biodiversity. Nature, 478(7369), 378-381.
Hale, R. C., Gallo, K. P., Owen, T. W., & Loveland, T. R. (2006). Land use/land cover change effects on temperature trends at US Climate Normals stations. Geophysical Research Letters, 33(11).
ICIMOD, (2010). In: Tse-ring K; Sharma, E; Chettri, N; Shrestha, A (eds) Climate change vulnerability of mountain ecosystems in the Eastern Himalayas; Climate change vulnerability in the Eastern Himalayas – Synthesis report. ICIMOD, Kathmandu.
INCCA report (2010). Indian Network for Climate Change Assessment. CLIMATE CHANGE AND INDIA: A 4X4 ASSESSMENT A SECTORAL AND REGIONAL ANALYSIS FOR 2030S.
Krausmann, F., Haberl, H., Schulz, N. B., Erb, K. H., Darge, E., & Gaube, V. (2003). Land-use change and socio-economic metabolism in Austria—Part I: driving forces of land-use change: 1950–1995. Land use policy, 20(1), 1-20.
Lambin, E. F., Rounsevell, M. D. A., & Geist, H. J. (2000). Are agricultural land-use models able to predict changes in land-use intensity?. Agriculture, Ecosystems & Environment, 82(1), 321-331.
Leh, M., Bajwa, S., & Chaubey, I. (2013). Impact of land use change on erosion risk: an integrated remote sensing, geographic information system and modeling methodology. Land Degradation & Development, 24(5), 409-421.
Messing, I., Fagerström, M. H. H., Chen, L., & Fu, B. (2003). Criteria for land suitability evaluation in a small catchment on the Loess Plateau in China. Catena, 54(1), 215-234.
Myers, N., Mittermeier, R. A., Mittermeier, C. G., Da Fonseca, G. A., & Kent, J. (2000). Biodiversity hotspots for conservation priorities. Nature, 403(6772), 853-858.
Polasky, S., Nelson, E., Pennington, D., & Johnson, K. A. (2011). The impact of land-use change on ecosystem services, biodiversity and returns to landowners: A case study in the State of Minnesota. Environmental and Resource Economics, 48(2), 219-242.
Reddy, C. S., Jha, C. S., Dadhwal, V. K., Krishna, P. H., Pasha, S. V., Satish, K. V., ... & Diwakar, P. G. (2016). Quantification and monitoring of deforestation in India over eight decades (1930–2013). Biodiversity and conservation, 25(1), 93-116.
SAPCC (2013). Manipur state action plan on climate change, 2013. Government of Manipur, directorate of Environment.

12
International Journal of Research in Management & Social Science Volume 5, Issue 3 (I): July - September, 2017
ISSN 2322 - 0899
Schilling, K. E., Jha, M. K., Zhang, Y. K., Gassman, P. W., & Wolter, C. F. (2008). Impact of land use and land cover change on the water balance of a large agricultural watershed: Historical effects and future directions. Water Resources Research, 44(7).
Seto, K. C., Woodcock, C. E., Song, C., Huang, X., Lu, J., & Kaufmann, R. K. (2002). Monitoring land-use change in the Pearl River Delta using Landsat TM. International Journal of Remote Sensing, 23(10), 1985-2004.
SFR (2015) State Forest Report 2005. FSI, Ministry of Environment & Forests, Government of India, Dehra Dun.
Trimble, S. W., & Crosson, P. (2000). US soil erosion rates--myth and reality. Science, 289(5477), 248-250.
Trincsi, K., & Turner, S. (2014). Mapping mountain diversity: Ethnic minorities and land use land cover change in Vietnam's borderlands. Land Use Policy, 41, 484-497.
Turner, B. L., Moss, R. H., & Skole, D. L. (1993). Relating land use and global land-cover change: a proposal for an IGBP-HDP core project. A report from the IGBP/HDP Working Group on Land-Use/Land-Cover Change. Global Change Report (Sweden).
Vitousek, P. M. (1992). Global environmental change: an introduction. Annual review of Ecology and Systematics, 23(1), 1-14.
Vitousek, P. M., Mooney, H. A., Lubchenco, J., & Melillo, J. M. (1997). Human domination of Earth's ecosystems. Science, 277(5325), 494-499.
Xiuwan, C. (2002). Using remote sensing and GIS to analyse land cover change and its impacts on regional sustainable development. International Journal of Remote Sensing, 23(1), 107-124.

13
International Journal of Research in Management & Social Science Volume 5, Issue 3 (I): July - September, 2017
ISSN 2322 - 0899
A STUDY ON MORPHOMETRIC CHARACTERISTICS OF JIADHAL RIVER BASIN USING REMOTE SENSING AND GIS
Akangsha Borgohain1 and Dhrubajyoti Sahariah2
Research Scholar1 & Associate Professor2, Department of Geography, Gauhati University, Guwahati ABSTRACT The morphometric analysis of a drainage basin and channel network play an important role in understanding the behaviour of drainage basin and expresses the prevailing climate, geology, geomorphology, structural antecedents of the catchment. In the present study, morphometric analysis has been carried out using Geographical Information System (GIS) techniques. The measurement and analysis of the basin parameters are carried for Linear, Areal and Relief aspects. Within these aspects there are many parameters which are being determined by using mathematical formula on the data derived from IRS LISS III imagery for the study area. The Jiadhal river catchment covers an area of 1,205 sq.km of which 835 sq.km i.e. 69% lie in Assam. The upper part of the basin is hilly with high gradient of the river. The lower part is in Brahmaputra valley and here the gradient of the river decreases. The drainage pattern of the upper section of the basin is trellis pattern and the lower section is annabranching. The analysis has revealed that the total number and length of stream segments is maximum in first order streams and decreases as the stream order increases. The bifurcation ratio (Rb) between different successive orders varies revealing the geostructural control. The shape parameters indicate the elongated shape of the basin with high relief. The highest order stream available in the basin is six. The stream density is moderate for the whole basin. The analysis and measurement of basin morphometric aspects and parameters in GIS will be of immense utility in river basin evolution, understanding the basin for natural resources assessment, planning and management.
Key Words: Morphometric analysis, Remote sensing and GIS, Drainage basin, Jiadhal River, Bifurcation ratio.
INTRODUCTION Basin morphometry is an important means of understanding a drainage basin using mathematically derived parameters. Measurement of the shape or geometry, of any natural form- be it plant, animal or relief features is termed morphometry (Strahler, 1969). But in geomorphology ‘morphometry may be defined as the measurement and mathematical analysis of the configuration of the earth’s surface and of the shape and dimension of its landforms’ (Clarke, 1970). Infect morphometry incorporates quantitative study of the area, altitude, volume, and slope, profiles of the land and drainage basin characteristics of the area concerned. (Sing, 1972). The drainage basin analysis is important in any hydrological investigations like assessment of ground water potential and ground water management. Various important hydrologic phenomena can be correlated with the physiographic characteristics of drainage basins such as size, shape, slope of drainage area, drainage density, size and length of the tributaries etc. (Rastogi et al., 1976).The various conventional methods of calculating basin morphometry like Horton, 1995: smith, 1950: Schumm, 1956 and Strahler, 1957 are most commonly used, but recently along with these the Remote Sensing and GIS(Geographical Information system) became an important tool to analyze, to update and to correlate the measurements with periodic changes. Remote sensing data can be used in conjunction with conventional data for delineation of ridgelines, characterization, priority evaluation, problem identification, assessment of potentials and management needs, identification of erosion prone areas, evolving water conservation strategies, selection of sites for check dams and reservoirs etc.,(Dutta et al.,2002).
The present paper describes the drainage characteristics of Jiadhal River basin and an attempt has been made in this study to visualise the extent of variations in landform contrasts and their magnitude in the Jiadhal river Sub-basin in proper perspectives, by adopting advanced and current quantitative techniques of fluvial Geomorphology obtained through Remote Sensing and GIS based morphometric analysis. It is felt that the study will be useful to understand the nature of the drainage basin, its hydrological behaviour, its characteristics and this will help in better planning and management of the basin. The Study is focussed on linear, aerial, and relief aspects of the catchments using GIS tools.
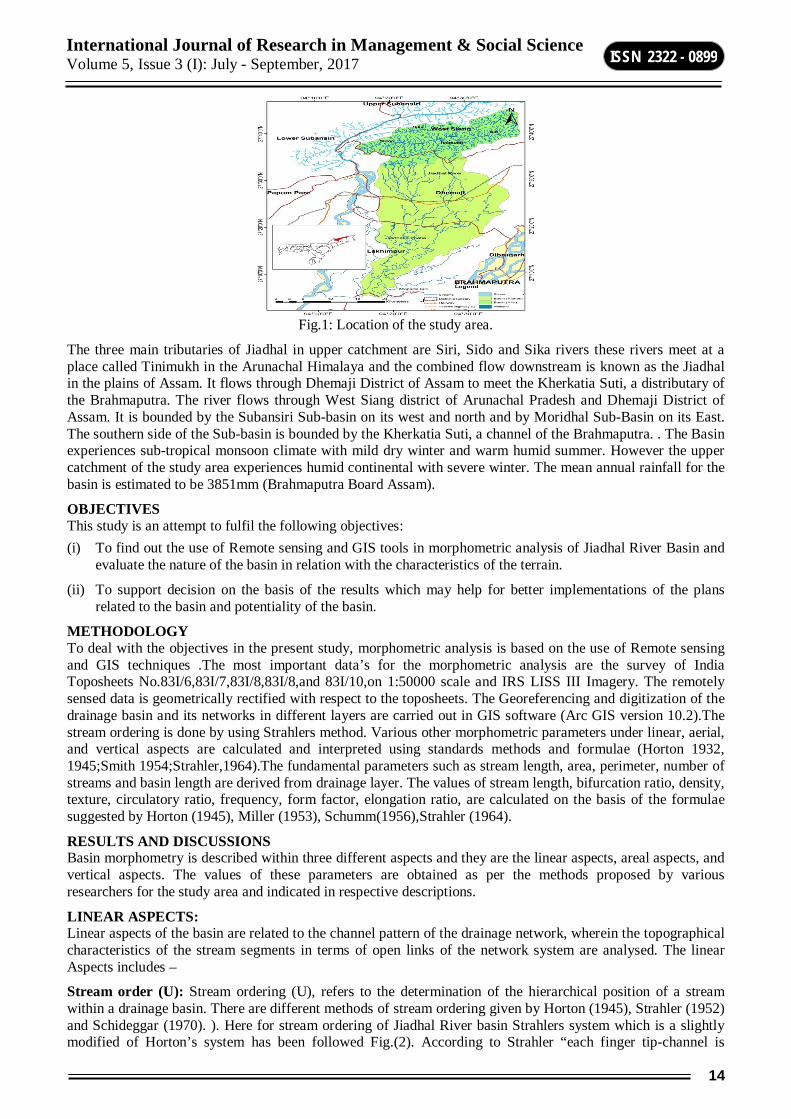
STUDY AREA The Jiadhal River is one of the north bank sub-tributaries of the Brahmaputra River that empties in Charikoria River. Geographically the Basin of the Jiadhal River extends from 27˚15′ N to 27˚45′ N latitudes and 94˚15′ E to 94˚40′ E longitudes, covering an area of 1191.62 sq km, of which 38% (446.6 sq km) lies in Arunachal Pradesh and 62% (746.6 sq km) in Assam (Fig.1).
14
International Journal of Research in Management & Social Science Volume 5, Issue 3 (I): July - September, 2017
ISSN 2322 - 0899
Fig.1: Location of the study area.
The three main tributaries of Jiadhal in upper catchment are Siri, Sido and Sika rivers these rivers meet at a place called Tinimukh in the Arunachal Himalaya and the combined flow downstream is known as the Jiadhal in the plains of Assam. It flows through Dhemaji District of Assam to meet the Kherkatia Suti, a distributary of the Brahmaputra. The river flows through West Siang district of Arunachal Pradesh and Dhemaji District of Assam. It is bounded by the Subansiri Sub-basin on its west and north and by Moridhal Sub-Basin on its East. The southern side of the Sub-basin is bounded by the Kherkatia Suti, a channel of the Brahmaputra. . The Basin experiences sub-tropical monsoon climate with mild dry winter and warm humid summer. However the upper catchment of the study area experiences humid continental with severe winter. The mean annual rainfall for the basin is estimated to be 3851mm (Brahmaputra Board Assam).
OBJECTIVES This study is an attempt to fulfil the following objectives: (i) To find out the use of Remote sensing and GIS tools in morphometric analysis of Jiadhal River Basin and
evaluate the nature of the basin in relation with the characteristics of the terrain.
(ii) To support decision on the basis of the results which may help for better implementations of the plans related to the basin and potentiality of the basin.
METHODOLOGY To deal with the objectives in the present study, morphometric analysis is based on the use of Remote sensing and GIS techniques .The most important data’s for the morphometric analysis are the survey of India Toposheets No.83I/6,83I/7,83I/8,83I/8,and 83I/10,on 1:50000 scale and IRS LISS III Imagery. The remotely sensed data is geometrically rectified with respect to the toposheets. The Georeferencing and digitization of the drainage basin and its networks in different layers are carried out in GIS software (Arc GIS version 10.2).The stream ordering is done by using Strahlers method. Various other morphometric parameters under linear, aerial, and vertical aspects are calculated and interpreted using standards methods and formulae (Horton 1932, 1945;Smith 1954;Strahler,1964).The fundamental parameters such as stream length, area, perimeter, number of streams and basin length are derived from drainage layer. The values of stream length, bifurcation ratio, density, texture, circulatory ratio, frequency, form factor, elongation ratio, are calculated on the basis of the formulae suggested by Horton (1945), Miller (1953), Schumm(1956),Strahler (1964).
RESULTS AND DISCUSSIONS Basin morphometry is described within three different aspects and they are the linear aspects, areal aspects, and vertical aspects. The values of these parameters are obtained as per the methods proposed by various researchers for the study area and indicated in respective descriptions.
LINEAR ASPECTS: Linear aspects of the basin are related to the channel pattern of the drainage network, wherein the topographical characteristics of the stream segments in terms of open links of the network system are analysed. The linear Aspects includes –
Stream order (U): Stream ordering (U), refers to the determination of the hierarchical position of a stream within a drainage basin. There are different methods of stream ordering given by Horton (1945), Strahler (1952) and Schideggar (1970). ). Here for stream ordering of Jiadhal River basin Strahlers system which is a slightly modified of Horton’s system has been followed Fig.(2). According to Strahler “each finger tip-channel is

15
International Journal of Research in Management & Social Science Volume 5, Issue 3 (I): July - September, 2017
ISSN 2322 - 0899
designated as a 1st order stream, two first order streams join together to form a 2nd order stream and similarly two 2nd order stream join to form a segment of 3rd order and so on .When two channel of different order join then the higher order is maintained.
Here in Jiadhal River basin there are total 926 number of streams out of which, 726 are first order streams,170 second order streams, 50 third order streams, 12 fourth order streams,3 fifth order streams and 1 sixth order stream. The Highest order stream that is available in this basin is the 6th order stream. Thus it is found that the Jiadhal river tributaries are of 6th order. The properties of the stream networks are very important to study basin characteristics (Strahler, 2002).
Fig.2: Drainage order map by Strahlers method.
Stream length (Lu): Stream length (LU), Stream length is very significant in determining the hydrological features of the basin as it reveals the surface runoff characteristics. The stream length is measured on the basis of law proposed by Horton (1945).The stream of relatively smaller length is characteristics of areas with larger slopes and finer textures. Longer lengths of streams are generally indicative of flatter gradient. Generally, the total length of stream segments is maximum in first order stream and decreases as stream order increases. The numbers of streams are of various orders in a watershed are counted and their lengths from mouth to drainage divide are measured here with the help of GIS software. The total length of the 1st order stream is 726.84 km, 2nd order stream is 342.02 km, 3rd order stream is 140.60, km, 4th order stream is 118.65, km, 5th order stream is 66.25, km, and 6th order stream is 38.33 km. The total length of all the streams is 1432.69 km. The plotting of the logarithm of stream versus stream order helps in understanding the characteristics of the basin in terms of lithology and topography (Singh and Singh, 1997: Vittala, et al, 2004).
Mean stream length (Lsm): The mean stream length is a characteristics property related to the drainage network and its associated surfaces (Strahler, 1964).The mean stream length (Lsm) has been calculated by dividing the total stream length of the order by the number of streams. The mean stream length of the study area is 1.001 for the 1st order stream, 2.01 for the 2nd order stream, 2.88 for the 3rd order stream, 9.88 for the 4th order stream, 22.08 for the 5th order stream and 38.33 for the 6th order stream. The mean stream length of the stream increases with the increase of the orders.
Stream Length ratio (RL): The stream length ratio can be defined as the ratio of the mean stream length of a given order to the mean stream length of next lower order and has an important relationship with surface flow and discharge (Horton, 1945). By observing the above table it is clear that as the stream order increases the average stream length of respective order increases, thus the gradient of the streams decreases as the order increases. The RL value of 1st order stream is 2.12, 2nd order stream is 2.43, 3rd order stream is 1.18, 4th order

16
International Journal of Research in Management & Social Science Volume 5, Issue 3 (I): July - September, 2017
ISSN 2322 - 0899
stream is 1.79, 5th order stream is 1.72 respectively. The RL values between streams of different order in the basin reveal that there are variations in slope and topography of the River basin.
Bifurcation Ratio (Rb) Bifurcation ratio (Rb) may be defined as the ratio of the number of stream segments of a given order (Nu) to the number of segments of the next higher order (Nu+1) (Schumm 1956). If the bifurcation ratio of a river network is low there is a higher chance of flood. The most common bifurcation ratio is ranging between 3 to 5 is such a basin where the geological structure do not distort the drainage pattern (Strahler, 1964) and it indicates that the drainage system characterise with homogeneous lithology. The bifurcation ratio for the Jiadhal River basin is 3.76 which indicate that the basin is structurally controlled.
Table1: Calculation of Bifurcation Ratio Stream Order No. of Streams Bifurcation Ratio
U NU Rb
1St order 726 4.27 2nd order 170 3.4 3rd order 50 4.16 4th order 12 4 5th order 3 3 6th order 1 0 Total 962
Mean of bifurcation Ratio 3.76
Table 2: Results of the Linear Aspects of Basin Morphometry
Aerial Aspects: Areal aspects of the basin morphometry include the horizontal characteristics of the drainage basin. Among the areal aspects the most important parameters are the Area of the basin (A) and its perimeter (P).The area of the Jiadhal river basin is 1398.46 Sq km and its perimeter is 207.98 km. The other parameters of the areal aspects includes Drainage Density, Stream frequency, Drainage texture, Texture ratio, Form factor, circulatory ratio, Elongation ratio, Length of overland flow.
Drainage Density (Dd): The drainage density of a river basin refers to total stream length per unit area.It is described by Horton in 1932 as the ratio of cumulative length of the stream of a watershed to its area, which is expressed in terms of km/km2.It has been observed from drainage density measurement made over a wide range of geological and climatic type that a low drainage density is more likely to occur in region and highly resistant of highly permeable subsoil material under dense vegetation cover and where relief is low. High drainage density is the resultant of weak or impermeable subsurface material, sparse vegetation and mountainous relief. Low drainage density leads to fine drainage texture (Strahler).In the present study the Jiadhal River basin has a drainage density of 1.01km of channel per unit square kilometre of area, indicating moderate drainage densities. The moderate density indicates the basin is highly permeable subsoil and vegetative cover (Nag, 1998).

17
International Journal of Research in Management & Social Science Volume 5, Issue 3 (I): July - September, 2017
ISSN 2322 - 0899
Fig 3: Drainage Density map
Stream Frequency (FS): Stream frequency is the measure of number of streams per unit area.It exhibits a positive correlation with drainage density in basin indicating an increase in stream population with respect to the increase in drainage density (Horton 1932), Jiadhal river basin has a stream frequency of 0.69, i.e it has a low stream frequency.
Drainage Texture (DT): Drainage texture (DT) is defined as the relative spacing of drainage lines and it is a product of drainage frequency and drainage density. Course drainage texture is generally found in areas with low drainage density, medium in medium drainage density areas and ultra fine in high density regions (Strahler, 1964). Jiadhal drainage basin has a drainage texture of 0.69, which is a low value. Thus it has a low drainage texture.
Texture Ratio (T): Texture Ratio is defined as the number of crenulations in the basin contour having the maximum number of crenulations divided by the basin perimeter (Smith, 1950). Thus in the case of Jiadhal river basin the Texture ratio (T) is 3.49, which indicates a moderate value and moderate infiltration capacity and moderate relief of the terrain.
Elongation Ratio (Re): Elongation ratio is defined by Schumm (1956) as the ratio of the diameter of a circle of the same area as the drainage basin and the maximum length of the basin. It is an important index of analyzing shape of the basin.Higher the value of Elongation ratio indicates very low relief (Strahler 1964). Here in the case of Jiadhal River basin the value of elongation Ratio is 0.54, which is elongated in shape.
Circulatory Ratio (Rc): Circulatory ratio is the ratio of the area of a basin to the area of circle having the same circumference as the perimeter of the basin (Miller, 1953). It is found in the Jiadhal basin the circulatory ratio value is 0.40, and therefore the basin is elongated in shape less permeability of sub-soil condition.
Form Factor Ratio (RF): Form factor is defined as the ratio of the basin area to the square of the basin length. The factor indicates the flow intensity of a basin of a defined area Horton, (1945).Basin with high form factors experiences larger peak flows of shorter duration, whereas elongated watersheds with low form factors experiences lower peak flows of longer duration.The form factor ratio for Jiadhal river basin is 0.23, indicating elongated basin with lower peak flows of longer duration.
Relief Aspects: Relief aspects basically imply the vertical characteristics of the basin. These aspects include the highest and the lowest point of the basin which are observed by the spot heights or the contours that are present in the basin. Relief aspects include- Basin relief, Relative relief, relief ratio, ruggedness number.
Basin relief: It is the difference of elevation between the highest and the lowest point in the basin.The highest point (h) in the basin is 1526 metres above the mean sea level and the lowest point (I) or the remotest point is at 91 metres above the mean sea level. The relief of the basin is 1.435km .The general basin relief is high in the study area.
Relative Relief (Rr): Relative relief (Hammond 1954, Thauer 1955) is also termed as amplitude of relief or local relief which represents actual variations of altitude in a unit of area with respect to its local base level. Here the maximum height differences in each grid square from the relevant toposheets have been used as control for drawing isopleths in Arc Gis Software. The basin has a relative relief of 6.7 km, and this is the relief that actually affects the flow of the river in the basin. The basin has a high relative relief and hence higher gradient(Fig.4).

18
International Journal of Research in Management & Social Science Volume 5, Issue 3 (I): July - September, 2017
ISSN 2322 - 0899
Fig 4: Relative relief map.
Relief Ratio (Rh): The relief Ratio is the ratio of maximum relief to horizontal distance along the longest dimension of the basin parallel to the principal drainage line (Schumm, 1956). It is the measure of overall steepness of the basin and it is an indicator of the intensity of the erosional processes operating on the slope of the basin (Schumm 1956).The present basin has a relief ratio of 18.71 km which is a high value and hence the intensity of the erosion in the basin is also more.
Ruggedness Number (Rn): Ruggedness number is the ultimate outcome of the total watershed relief and the drainage density. Generally, ruggedness number becomes higher with the higher value of relative relief and drainage density values. Extremely high values of ruggedness number generally occur when both the values are large i.e, when slopes are steep as well as long in nature. (Strahler, 1956). The ruggedness number for the present basin is 1.44, which indicates higher erosional intensity in the basin.
Table 3: Results of Morphometric Analysis Sl. No Parameter Value
1 Basin Area (Km) 1376.52 2 Perimeter (km) 207.98 3 Basin length (Lb) Km 76.6 4 Basin order 6 5 Drainage Density (Dd) (km/km2) 1.01 6 Stream Frequency (Fs)(Km2) 0.69 7 Drainage texture (Dt) 0.69 8 Texture Ratio (T) 3.49 9 Elongation ratio (Re) 0.54 10 Circulatory Ratio (Rc) 0.4 11 Form Factor Ratio (Rf) 0.23 12 Length of overland Flow (Lg) 0.49 13 Basin Relief (Bh) (m) 1435 14 Relative relief (Rr) 6.7 15 Relief Ratio (Rh) km 18.71 16 Ruggedness number (Rn) 1.44

19
International Journal of Research in Management & Social Science Volume 5, Issue 3 (I): July - September, 2017
ISSN 2322 - 0899
CONCLUSION Gis and Remote Sensing techniques have proved to be accurate and efficient tool in drainage delineation. From the above discussion it is seen that the linear aspects of the basin morphometric parameters in the Jiadhal river basin suggest that the lower reach of the basin is in old stage of geomorphic development and has a negligible risk of occurrence of flood. The areal aspects of the morphometric parameters suggest the existence of moderately permeable subsoil, coarse drainage texture and elongated shape of the basin. The relief aspect of the basin parameters suggest of high relief in the basin, high steepness of the slope and higher intensity in the basin .High relief along with elongated shape of the basin is prone to floods. Thus the analysis of morphometric parameters is found to be of immense utility in river basin evaluation, watershed prioritization for soil and water conservation, and natural resources management at a micro level.
REFERENCES Agarwal CS (1998). “Study of drainage pattern through aerial data in Naugarh area of Varanasi district,
U.P.”. J. Indian Soc. Rem. Sens. 26:169-175.
Ansari, Z. R. et al., (2013), ‘Comparative Study of Morphometric Parameters Derived from Topographic Maps and ASTER DEM’, International Journal of Scientific & Engineering Research, 4(8): 508-528.
Das,A.k. and Mukhrjee, S.(2005) “Drainage morphometry using satellite data and GIS in Raigad district, Maharastra”,Journal Geol.Soc.India,65: 577-586
Das luna moni and Husain (2014), ‘‘ Morphometric analysis of Jiya Dhol River Basin using Remote Sensing and GIS to understand its role in occurrence of flood”.Geographical Analysis of union Geographic Information Technologist, Department of Geography, Bangalore University,vol.3
Horton RE (1932). “Drainage basin characteristics.” Transaction of American Geophysics Union, 13:350-361.
Horton RE (1945). “Erosional development of streams and their drainage basins: Hydrophysical approach to quantitative morphology.” Bulletin of geological society of America, 5: 275-370.
Melton M.A (1957) an analysis of the relation among elements of climate, surface properties and Geomorphology. Office of Naval Research project, Technical Report 11, Department of geology, Columbia University, Newyork.
Melton MA (1958). “Geometric properties of mature drainage basin systems and their representation in their E4 phase space.” Journal of Geology. 66:35-56.
Miller VC (1953). “A quantitative geomorphic study of drainage basin characteristics in the Clinch Mountain area, Varginia and Tennessee”, office of Naval Research Project , Tech. Report. 3.,Columbia University, Department of Geology, New York.
Nag SK (1998). “Morphometric analysis using remote sensing techniques in the Chaka sub basin Purulia district, West Bengal.” Journal of Indian Society of Remote sensing, 26:69-76.
Schumn SA (1956). “Evaluation of drainage systems and slopes in badlands at Perth Amboy, New Jersy.” Bullitin of Geological Society of America. 67:567-646.
Singh, S.and Singh, M.C, 1997. Morphometric Analysis of Kanhar river basin. National Geographical Journal of India, 43(1):31-43.

20
International Journal of Research in Management & Social Science Volume 5, Issue 3 (I): July - September, 2017
ISSN 2322 - 0899
LEVEL OF DEVELOPMENT AND ENCOURAGEMENT TO TEXTILE INDUSTRY EMPLOYEES IN TIRUPUR
Dr. Kanakarathinam. R Assistant Professor, Department of Commerce, NGM College, Pollachi, Tamilnadu
ABSTRACT Indian textile is embellished, enhanced, decorated and given its character through various modes and techniques and it is reputed throughout the world. Indian Textile Industry plays an important role in the economic development of the country. A major portion of foreign earning comes from the Textile industry. Tirupur textile industry is a backbone of the development of Tamilnadu textile industry and contribute a major share of national income to India. Tirupur is called as dollar city of India. Tirupur helps to solve the unemployment problem of not only Tamil Nadu state and also solve other states like Kerala, Orissa, Bihar. QWL of textile industry employees leads to improve the progress of the firm quickly. So the Quality of Work Life of textile industry employee is identified as important one. Work position offers opportunities for learning, research, discovery, self-development, and enhancement of skills, room for innovation, public recognition, exploration, celebrity-status, and loads of fame. Naturally, this type of works is interesting and very much rewarding also. So the researcher studies the level of encouragement and development present status of the textile industry employees in Tirupur.
Keywords: QWL, encouragement and development, dollar city
INTRODUCTION Indian textile industry has a reputation all over the world. Indian textile industry is ever demanding one in both domestic and export. The industry has abundant availability of raw material and labor forces too. Tamil Nadu textile industry contributes more for the GDP growth. Tirupur is called as dollar city of Tamil Nadu. Tirupur textile industry provides a lot of employment opportunities to unskilled and semi-skilled labor. Because every year people immigration is increased from other states and district to Tirupur for overcoming the employment problems. Every job should offer career development. That is an important factor which decides the Quality of Work Life. Status improvement, more recognition from the management and appreciations are the motivating factors for anyone to take a keen interest in the job.
The work atmosphere should be conducive to achieve organizational goals as well as individual development. It is a win-win situation for both the parties; an employee should be rewarded appropriately for his good work, extra efforts, sincerity and at the same time a lethargic and careless employee should be penalized suitably; this will motivate the former to work with more zeal and deter the latter from being so, and strive for better performance. If an organization does not give chance for growth and personal development, it is very difficult to retain the talented personnel and also to find new talent with experience and skill. So one the factor of encouragement and development also play a major role in the QWL factor. Because every human needs moral support as encouragement and development to stand with a positive attitude about working condition. Working condition of the textile industry wants to know in this situation.
REVIEW OF LITERATURE Deepak Kumar Battacharya (1993)has conducted a study on "Promotion from within: A positive reinforce for enriching Quality of Work Life for white collar employee", with an aim to identify whether technological advancement, structural changes in the economy and change in the occupational pattern influence the perceptual QWL for Indian workers in general and working company employee, in particular, working in public sector banks in the city of Calcutta. The findings of the study disclosed that perceived QWL of bank employees remain unchanged even after computerization. High degree of dependence of the sample employees on union tribunals and other legal machinery for redressal of their grievances, monotonous and repetitive jobs, and inter-alia also badly reflect the QWL on the bank employees.
Duncan Gallie (2003) have made a comparison of employees' perceptions of the Quality of Working tasks, the degree of involvement in decision making, career opportunities, and job security to see whether the Scandinavian countries have a distinctive pattern from other European Union countries. It was found that on the aspects of working life that were most central to the reform programmes, the results were consistent with the view that there could be societal
21
International Journal of Research in Management & Social Science Volume 5, Issue 3 (I): July - September, 2017
ISSN 2322 - 0899
SCOPE OF THE STUDY This study made an attempts to know the present status of encouragement and development of Tirupur Textile Industry employees. Because every individual need differs kinds of motivation either monetary or non-monetary based encouragement and development. The positive encouragement and development should provide positive outlook among the employees.
OBJECTIVES OF THE STUDY The study was undertaken with the objectives namely: To study the personal and occupational profile of the employees’ of Textile Industry in Tirupur
To study the employees’ opinion towards development and encouragement of Textile industry in Tirupur
METHODOLOGY OF THE STUDY The Primary and secondary data were used in this study. The primary data was collected through questionnaire method. The sample respondents are taken from in and around Tirupur area. For analysis, simple percentage analysis, T-test, F-test are used. The respondents selected based on convenient sampling method. The size of the sample is 500 Textile Industry employees in Tirupur.
ANALYSIS AND INTERPRETATION An attempt has been made to examine the association between the employees’ opinion towards development and encouragement with their personal and occupational profile. T-test and F-test have been applied to find the association by formulating the null hypothesis.
Ho: There is no significant association between employees' opinion towards development and encouragement and their personal/occupational profile.
i) Personal profile and employees opinion towards development and encouragement Table 1 portrays the mean values of employees’ opinion towards development and encouragement for all independent variables that determine the personal profile such as age, gender, marital status, educational qualifications, family size, family income and family debt.
Table 1: Distribution of respondents based on the association between personal profile and their opinion towards development and encouragement
Sr No Variables Group Mean SD No.
F Test
T Test df.
Table Value Sig.
1 Age
18 - 25 yrs 22.72 2.52 113
23.252 499 3.357 ** 25 - 35 yrs 21.90 2.60 179 35 - 45 yrs 23.08 3.75 95 45 - 55 yrs 20.58 1.83 76 Above 55 yrs 25.46 2.53 37
2 Gender Male 23.44 2.44 289
10.297 498 2.586 ** Female 20.91 3.03 211
3 Marital Status
Unmarried 22.51 2.38 124
2.687 499 2.623 * Married 22.29 3.05 248 Divorced 21.89 3.07 85 Widowed 23.42 3.65 43
4 Educational Qualifications
Illiterate 22.84 3.29 58
.653 499 2.390 Ns
Primary 22.32 3.08 283 Higher Secondary 22.20 2.72 137 Graduate 22.87 2.50 15
Diploma 22.86 1.35 7
5 Family Members
1 - 3 22.23 2.99 120 2.810 499 3.014 Ns
4- 6 22.26 3.01 315
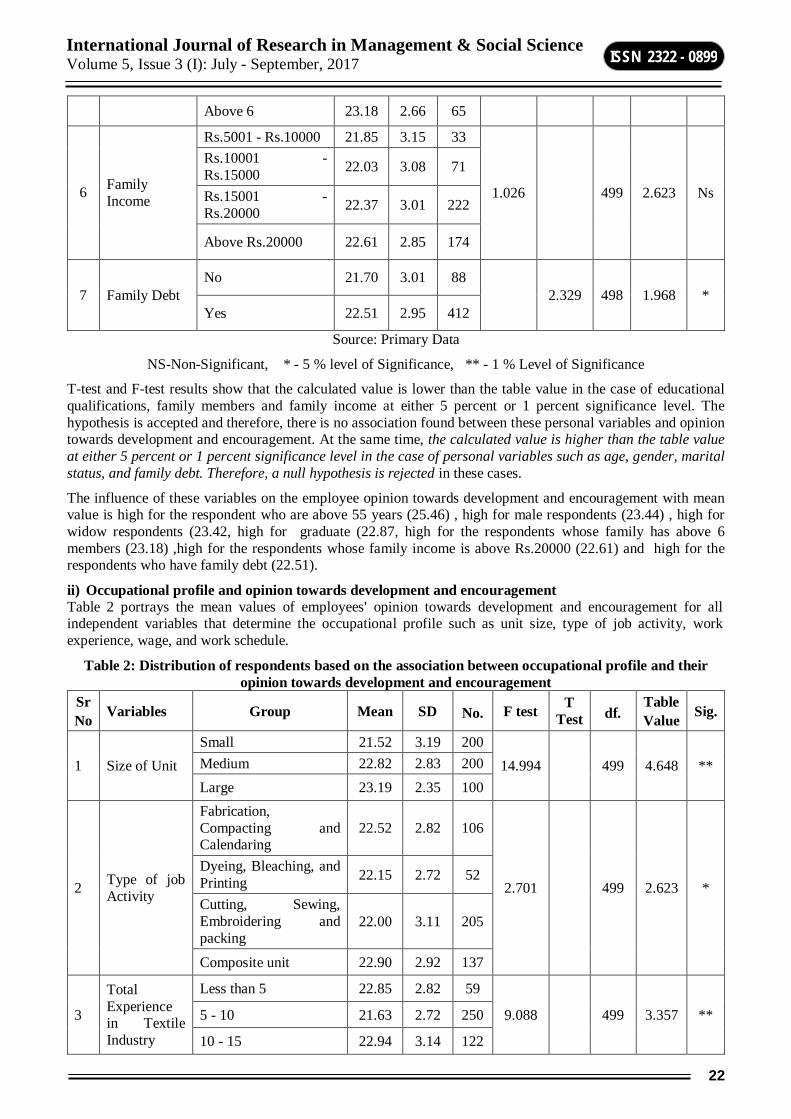
22
International Journal of Research in Management & Social Science Volume 5, Issue 3 (I): July - September, 2017
ISSN 2322 - 0899
Above 6 23.18 2.66 65
6
Family Income
Rs.5001 - Rs.10000 21.85 3.15 33
1.026 499 2.623 Ns
Rs.10001 - Rs.15000 22.03 3.08 71
Rs.15001 - Rs.20000 22.37 3.01 222
Above Rs.20000 22.61 2.85 174
7 Family Debt No 21.70 3.01 88
2.329 498 1.968 * Yes 22.51 2.95 412
Source: Primary Data
NS-Non-Significant, * - 5 % level of Significance, ** - 1 % Level of Significance
T-test and F-test results show that the calculated value is lower than the table value in the case of educational qualifications, family members and family income at either 5 percent or 1 percent significance level. The hypothesis is accepted and therefore, there is no association found between these personal variables and opinion towards development and encouragement. At the same time, the calculated value is higher than the table value at either 5 percent or 1 percent significance level in the case of personal variables such as age, gender, marital status, and family debt. Therefore, a null hypothesis is rejected in these cases.
The influence of these variables on the employee opinion towards development and encouragement with mean value is high for the respondent who are above 55 years (25.46) , high for male respondents (23.44) , high for widow respondents (23.42, high for graduate (22.87, high for the respondents whose family has above 6 members (23.18) ,high for the respondents whose family income is above Rs.20000 (22.61) and high for the respondents who have family debt (22.51).
ii) Occupational profile and opinion towards development and encouragement Table 2 portrays the mean values of employees' opinion towards development and encouragement for all independent variables that determine the occupational profile such as unit size, type of job activity, work experience, wage, and work schedule.
Table 2: Distribution of respondents based on the association between occupational profile and their opinion towards development and encouragement
Sr No Variables Group Mean SD No. F test T
Test df. Table Value Sig.
1 Size of Unit Small 21.52 3.19 200
14.994 499 4.648 ** Medium 22.82 2.83 200 Large 23.19 2.35 100
2 Type of job Activity
Fabrication, Compacting and Calendaring
22.52 2.82 106
2.701 499 2.623 * Dyeing, Bleaching, and Printing 22.15 2.72 52
Cutting, Sewing, Embroidering and packing
22.00 3.11 205
Composite unit 22.90 2.92 137
3
Total Experience in Textile Industry
Less than 5 22.85 2.82 59
9.088 499 3.357 ** 5 - 10 21.63 2.72 250
10 - 15 22.94 3.14 122

23
International Journal of Research in Management & Social Science Volume 5, Issue 3 (I): July - September, 2017
ISSN 2322 - 0899
15 - 20 23.93 2.69 15
Above 20 23.56 3.11 54
4 Wage (p.m)
Below Rs.3000 21.80 2.20 10
18.072 499 3.357 **
Rs.3001 -Rs. 6000 23.65 3.22 49
Rs.6001 -Rs. 9000 20.75 2.84 107
Rs. 9001 -Rs. 12000 21.99 2.96 155
Above Rs.12000 23.36 2.50 179
5 Work Schedule
Day shift 21.08 3.08 165
18.177 499 3.357 **
Afternoon shift 22.79 3.79 29
Night shift 22.56 2.19 9
Irregular shift on Cal 24.11 2.53 93
Rotating shift 22.55 2.50 204 Source: Primary Data
NS-Non-Significant, * - 5 % level of Significance, ** - 1 % Level of Significance
F-test results show that the calculated value is higher than the table value at either 5 percent or 1 percent significance level in the case of unit size, type of job activity, experience, wage, and work schedule. The null hypothesis is rejected in these cases and therefore, there is the association between these occupational variables and opinion towards development and encouragement.
The influence of these variables on employee opinion towards development and encouragement identified with the mean score value is high for the respondents who are working in large units (23.19), high for the respondents who are working in composite units (22.90), high for the respondents having between 15 and 20 years’ experience (23.93), high for the respondents whose wage is between Rs.3001 and Rs.6000 (23.65 and high for the respondents who are working in irregular shifts (24.11).
FINDINGS There is no association of employees' opinion on the development and encouragement of educational
qualification, family member, and family income.
There is an association of employees’ opinion on the development and encouragement with age, gender, marital status and family debt is found.
Male respondents, respondents who are above 55 years, Respondents who are widows. and the respondents who have debt in their family are found to agree more on development and
There is an association of employee opinion on the development and encouragement with unit size, type of job activity, experience, wage and work schedule is found.
The respondents who are working in large units are found to agree more on development and encouragement compared to the respondents who are working in small units.
The respondents who are working in composite units, the respondents having between 15 and 20 years’ experience, the respondents whose wage lies between Rs.3001 and Rs.6000 and the respondents who are working in irregular shifts are found to agree more on development and encouragement.
SUGGESTIONS Employers should take necessary steps to attract dissatisfied female and young employees by offering
benefits such as study allowance, medical allowance and other monetary support at the right time and encourage the employees at their workplace.
Motivational measures such as rewards for cost cutting and time management may also be given to the employees for a better Quality of Work Life.
Employers should develop compassion towards work. The employers should also recognize those who get rid by themselves from personal and work related problems in passionate ways.
24
International Journal of Research in Management & Social Science Volume 5, Issue 3 (I): July - September, 2017
ISSN 2322 - 0899
Employees can be given freedom in deciding about work methods, approval of materials, inviting participation of subordinates, interacting with workers, giving feedback and changing the work environment.
A variety of monetary and non-monetary benefits to an employee will increase the Quality of Work Life.
CONCLUSION In the present era, an employee is major role player because without labor any industry cannot survive. So the employee is the asset of the industry. Textile Industry employer takes care of the Quality of Work Life of employee leads to improve the image of the employer among the employee. The factors namely age, gender, marital status, family debt, unit size, type of job activity, experience, wage and work schedule are mostly associated with the development and encouragement of Tirupur Textile Industry employees. Large unit's employee can get more development and encouragement facilities compare to small and medium units. The employer of the Tirupur Textile Industry should concentrate on the area of development and encouragement facilities to the employee. This facility can encourage the new talented employees to get into their concern.
REFERENCES 1. Deepak Kumar Battacharya (1993), “Promotion from within: A positive reinforce for enriching Quality of
Work Life for White Collar Employee”, Indian Journal of Labour Economics, Vol.36 (4), pp.829-839
2. Dipak Kumar Bhatacharyya (2009), Human Resource Management, 2th Edition, Excel Books, New Delhi, p.418.
3. F.M.Khri, (2009), Indian Textile-ethnic and beyond, Super book house, Mumbai-5, Page No: 1&3
4. Meenakshi Rastogi, (2009), Textile Forming, Sonali Publications, New Delhi-2, Page No: 2 preface page: 1-2.
5. Rahul Chaudhar (2003), “Indian Garments Industry: what is real competitive edge?”,Clothesline, Sep, pp.43-45.
6. Uma Sekaran(2009), Organisational Behaviour Text and Cases, 2nd Edition, Tata McGraw Hill Education Pvt Ltd, New Delhi, P.No:237-238
7. http://www.ibef.org
8. http://encyclopedia.thefreedictionary.com
9. http://en.wikipedia.org/
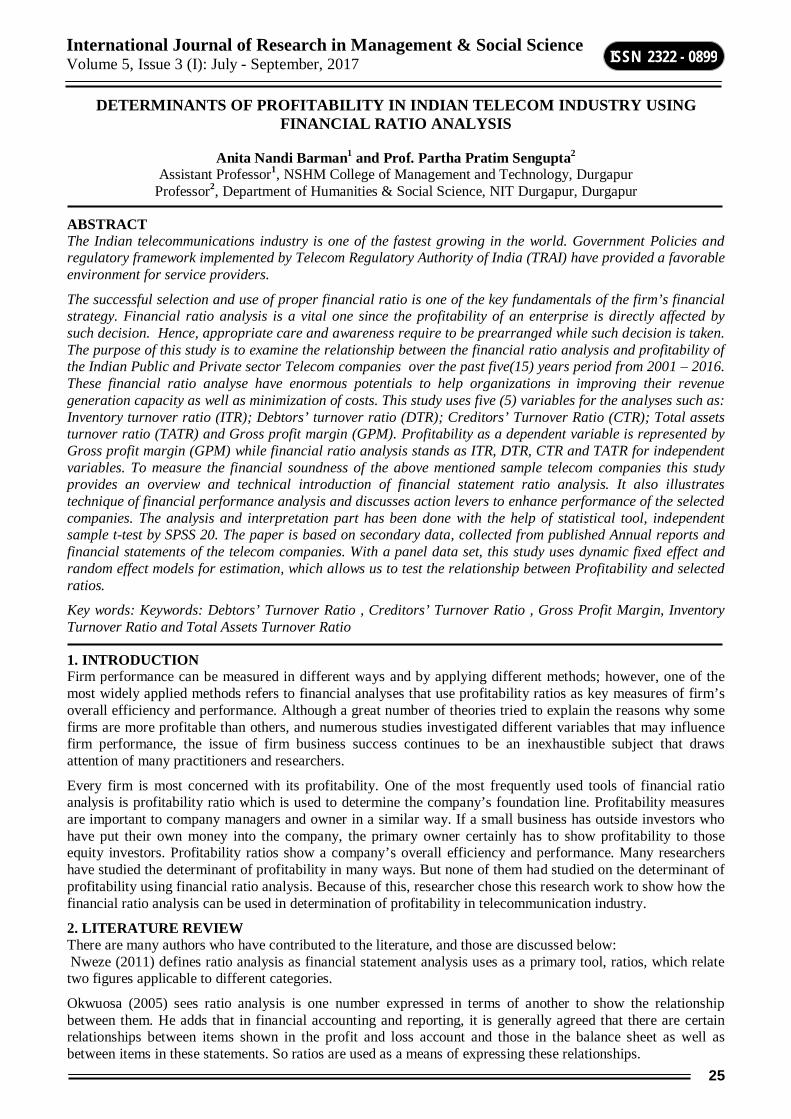
25
International Journal of Research in Management & Social Science Volume 5, Issue 3 (I): July - September, 2017
ISSN 2322 - 0899
DETERMINANTS OF PROFITABILITY IN INDIAN TELECOM INDUSTRY USING FINANCIAL RATIO ANALYSIS
Anita Nandi Barman1 and Prof. Partha Pratim Sengupta2
Assistant Professor1, NSHM College of Management and Technology, Durgapur Professor2, Department of Humanities & Social Science, NIT Durgapur, Durgapur
ABSTRACT The Indian telecommunications industry is one of the fastest growing in the world. Government Policies and regulatory framework implemented by Telecom Regulatory Authority of India (TRAI) have provided a favorable environment for service providers.
The successful selection and use of proper financial ratio is one of the key fundamentals of the firm’s financial strategy. Financial ratio analysis is a vital one since the profitability of an enterprise is directly affected by such decision. Hence, appropriate care and awareness require to be prearranged while such decision is taken. The purpose of this study is to examine the relationship between the financial ratio analysis and profitability of the Indian Public and Private sector Telecom companies over the past five(15) years period from 2001 – 2016. These financial ratio analyse have enormous potentials to help organizations in improving their revenue generation capacity as well as minimization of costs. This study uses five (5) variables for the analyses such as: Inventory turnover ratio (ITR); Debtors’ turnover ratio (DTR); Creditors’ Turnover Ratio (CTR); Total assets turnover ratio (TATR) and Gross profit margin (GPM). Profitability as a dependent variable is represented by Gross profit margin (GPM) while financial ratio analysis stands as ITR, DTR, CTR and TATR for independent variables. To measure the financial soundness of the above mentioned sample telecom companies this study provides an overview and technical introduction of financial statement ratio analysis. It also illustrates technique of financial performance analysis and discusses action levers to enhance performance of the selected companies. The analysis and interpretation part has been done with the help of statistical tool, independent sample t-test by SPSS 20. The paper is based on secondary data, collected from published Annual reports and financial statements of the telecom companies. With a panel data set, this study uses dynamic fixed effect and random effect models for estimation, which allows us to test the relationship between Profitability and selected ratios.
Key words: Keywords: Debtors’ Turnover Ratio , Creditors’ Turnover Ratio , Gross Profit Margin, Inventory Turnover Ratio and Total Assets Turnover Ratio
1. INTRODUCTION Firm performance can be measured in different ways and by applying different methods; however, one of the most widely applied methods refers to financial analyses that use profitability ratios as key measures of firm’s overall efficiency and performance. Although a great number of theories tried to explain the reasons why some firms are more profitable than others, and numerous studies investigated different variables that may influence firm performance, the issue of firm business success continues to be an inexhaustible subject that draws attention of many practitioners and researchers.
Every firm is most concerned with its profitability. One of the most frequently used tools of financial ratio analysis is profitability ratio which is used to determine the company’s foundation line. Profitability measures are important to company managers and owner in a similar way. If a small business has outside investors who have put their own money into the company, the primary owner certainly has to show profitability to those equity investors. Profitability ratios show a company’s overall efficiency and performance. Many researchers have studied the determinant of profitability in many ways. But none of them had studied on the determinant of profitability using financial ratio analysis. Because of this, researcher chose this research work to show how the financial ratio analysis can be used in determination of profitability in telecommunication industry.
2. LITERATURE REVIEW There are many authors who have contributed to the literature, and those are discussed below: Nweze (2011) defines ratio analysis as financial statement analysis uses as a primary tool, ratios, which relate two figures applicable to different categories.
Okwuosa (2005) sees ratio analysis is one number expressed in terms of another to show the relationship between them. He adds that in financial accounting and reporting, it is generally agreed that there are certain relationships between items shown in the profit and loss account and those in the balance sheet as well as between items in these statements. So ratios are used as a means of expressing these relationships.

26
International Journal of Research in Management & Social Science Volume 5, Issue 3 (I): July - September, 2017
ISSN 2322 - 0899
Ezeamama (2010) argues that ratios are most effectively used in interpretation of financial statement when compared to a standard or norm. A single ratio in itself does not indicate favourable or unfavourable condition. It has to be compared with a benchmark or standard before commenting on the ratio.
Thukaram Rao (2009) states that ratio analysis is the process of determining and interpreting numerical relationship based on financial statements. It helps to summarise the large quantities of financial data and to make qualitative judgement about the firm’s financial performance.
Osisioma (1996) says that analysis is the resolutions or separation of data into their elements or component parts, the tracing of facts to their source with a view to discovering the general principles underlying to individual phenomena. He continues that the analysis of financial accounts is therefore, the interpretation, amplification and translation of facts and data contained in the financial statements, the purpose being the drawing of relevant conclusions therefore, making inferences as to business operations, financial position and future prospects.
Chandra (2008) adds that financial ratio analysis is a study of ratios between various items or groups of items in financial statement.
Pandey (2010) sees financial analysis as a process of identifying the financial strengths and weaknesses of the firm by properly establishing relationships between the firm by properly establishing relationships between the items of the balance sheet and the profit and loss account. He adds that ratio analysis is a powerful tool of financial analysis. A ratio is used as a benchmark for evaluating the financial position and performance of a firm. So the relationship between two accounting figures, expressed mathematically, is known as a financial ratio (or simply as a ratio).
3. OBJECTIVE OF THE STUDY The main objective of the study is to determine whether financial ratio analysis have any effect on the profitability of the companies with particular reference to some leading Telecommunication companies in India.
THE SPECIFIC OBJECTIVES OF THIS STUDY ARE: i) To examine the relationship between Gross Profit Margin (GPM) of the public and private sector of
selected telecommunication companies in India.
ii) To analyse the relationship between Inventory Turnover ratio (ITR) of the public and private sector of selected telecommunication companies in India.
iii) To find out the relationship between Debtors turnover ratio (DTR) of the public and private sector of selected telecommunication companies in India.
iv) To examine the relationship between Creditors Turnover ratio (CTR) of the public and private sector of selected telecommunication companies in India.
v) To evaluate the relationship between Total asset Turnover ratio (TATR) of the public and private sector of selected telecommunication companies in India.
4. STATEMENT OF HYPOTHESES Based on the research questions, the following hypotheses were developed: H0: There is no significant difference between mean of GPM, ITR, DTR, CTR and TATR of Private and Public companies.
H1: There is a significant significant difference between mean of GPM, ITR, DTR, CTR and TATR of Private and Public companies
5. FINANCIAL RATIO ANALYSIS TECHNIQUES IN ORGANISATION INVENTORY TURNOVER RATIO (ITR) Nweze (2011) says that inventory turnover is computed by dividing the cost of goods sold by the average inventory. An average inventory is determined by adding the beginning and ending inventories and dividing by two. The decline in the inventory turnover indicates the stocking of more goods. An attempt should be made to determine whether specific inventory categories are not selling well and the reason for this.
DEBTORS’ TURNOVER RATIO (DTR) Leahy (2012) sees debtors’ turnover ratio as accounts receivable variable that measures the impact of a company’s credit function on profitability. This impact includes the risk associated with extending credit. He adds that the higher the ratio of accounts receivable to sales, the greater the manufacturer’s profitability.

27
International Journal of Research in Management & Social Science Volume 5, Issue 3 (I): July - September, 2017
ISSN 2322 - 0899
CREDITORS VELOCITY (CRSV) Okwuosa (2005) says that creditors’ velocity means creditors’ turnover. This indicates the average number of times creditors’ turnover is paid within a year. High creditors’ turnover ratio indicates that the company is not taking advantage of credit facility and this may result in loss of profit as a result of interest on borrowed funds or bank overdraft needed to meet up. On the other hand low creditors’ turnover ratio indicates that the company is not taking advantage of any discount associated with prompt payment and this may lead to increase in their cost of sales and consequently decrease in their profit. Therefore, a company should ensure that its creditors’ turnover ratio is neither too high nor too low. The creditors’ turnover is calculated by dividing Credit purchases by Average creditors.
TOTAL ASSETS TURNOVER RATIO (TATR) Ezeamama (2010) defines total assets turnover as ratio that expresses the number of times the value of assets utilized by the firm has been generated into sales. According to Pandey (2010) total assets’ turnover ratio shows the firm’s ability in generating sales from all financial resources committed to total assets. Nweze (2011) says total assets turnover measures the level of capital investment relative to sales volume. It tells the firm how well it manages its overall assets.
GROSS PROFIT MARGIN (GPM) Osisioma (1996) sees gross profit margin as a measure of the efficiency of a firm’s sales operations with respect to the cost of goods sold. By using the gross profit figure, it avoids the distortion that may be caused by non-operating cost and revenue, and thus, limits itself to an evaluation of the trading and manufacturing operations. This ratio is based on the firm’s net sales, because a firm’s sales are its most important feature. Sales make profit- without sales there can be no profit. A low gross profit margin is an indication that cost of goods is relatively too high.
6. RESEARCH METHODOLOGY Since the purpose of this research is to gain a better insight into the profitability of Telecommunication Industry and the effects of various independent variables on the dependent variables. A descriptive research was adopted to obtain necessary data for the study
6.1 METHOD OF DATA COLLECTION In conducting this research paper, the available data on the study are secondary source of data.
6.2 PERIOD OF STUDY The study is based on last 15 years data i.e. from 2001-2016.
6.3 METHOD OF DATA ANALYSIS Descriptive Analysis Descriptive analysis is the first step of this analysis, it will help researchers to describe relevant aspects of financial management (both mobilization of funds and deployment of funds) and provide detailed information about each relevant variable. Researchers have already been conducted in our area of study and a lot of information is already on hand and SPSS Software has been used for analysis of the different variables in this study.
THE VARIABLES THAT ARE USED FOR THE STUDY ARE 1). Gross Profit Margin (GPM) Gross Profit /Sales
2). Inventory turnover ratio (ITR) Inventory /Sales
3). Debtors’ turnover ratio (ITR) Trade debtors/Sales
4). Creditors’ Turnover Ratio (CTR) Trade creditors/Cost of sales
5). Total Assets turnover ratio (TATR) Total Assets/Sales
7. RESULTS AND DISCUSSIONS OF FINDINGS Variable P Value Status GPM 0.081 0.081>0.05 ITR 0.015 0.015<0.05 DTR 0.000 0.000<0.05 CTR 0.001 0.001<0.05 TATR 0.758 0.758>0.05

28
International Journal of Research in Management & Social Science Volume 5, Issue 3 (I): July - September, 2017
ISSN 2322 - 0899
8. FINDINGS From the result of t-test, it is seen that p value for GPM is 0.081 which is greater than 0.05.
Here the study accepts the null hypothesis at 5 % significant level.
It implies that there is no significant difference between the mean values of GPM among the Private and Public limited companies.
From the result of the t-test it is seen that p value for ITR for public and private sector companies was 0.015 which is lesser than 0.05.Here the study rejects the null hypothesis at 5 % significant level. Therefore the study accepts that there is significant difference between the mean values of ITR among private and public sector.
From the result of t-test, it is seen that p value for DTR is 0.000 which is lesser than 0.05. Here the study rejects the null hypothesis at 5 % significant level. Therefore the study accepts that there is significant difference between the mean values of DTR among private and public sector.
From the result of t-test, it is seen that p value for CTR is 0.001 which is lesser than 0.05. Here the study rejects the null hypothesis at 5 % significant level. Therefore the study accepts that there is significant difference between the mean values of CTR among private and public sector.
From the result of t-test, it is seen that p value for TATR is 0.758 which is greater than 0.05.
Here the study accepts the null hypothesis at 5 % significant level.
It implies that there is no significant difference between the mean values of TATR among the Private and Public limited companies.
9. RECOMMENDATION Telecommunication sector is one of the crucial sector under service sector which comprises of nearly half of the Nations GDP. So it is a well selected sector in the current scenario. The above study can also be put forward to other sectors like Automobile, Pharmaceuticals, Oil Refinery, IT sector etc and a comparative analysis can be prepared.
10. CONCLUSION From this study it has been found out that out of the selected 5 sector, the Gross profit Margin (GPM), and Total Assets Turnover Ratio (TATR) shows that there is significant difference between the mean value among the Private and Public Sector companies.
Whereas out of the selected 5 sectors Inventory Turnover Ratio (ITR) , Debtors Turnover ratio(DTR) and Creditors Turnover ratio (CTR) shows that there is significant difference between the mean values among the Private and Public Sector companies.
The study depicts that most of the ratios like Gross profit Margin (GPM) and Total Assets Turnover Ratio (TATR) falls within Profitability ratios whereas Inventory Turnover Ratio (ITR), Debtors Turnover ratio (DTR) and Creditors Turnover ratio (CTR) comes under liquidity ratios.
11. REFERENCES Akinsulire, O. Financial Management (4th ed.). Lagos: El-Toda Ventures Ltd., 2006.
Boris, B., Donald, R. C., & Pamela, S. S. Business Research methods (2nd ed.). UK: McGraw-Hill Education, 2008
Chandra, P.Investment Analysis and Portfolio Management (3rd ed.). New Delhi: Tata McGraw-Hill publishing Company Limited., 2008
Charitou, M. S., Elfani, M., & Lois, P. The Effect of working capital management on firm’s profitability: Empirical Evidence from an emerging market. Journal of Business and Economics Research, 8(12), 63-68. , 2010
Chary, T. S., Kaskuri, R., & Kumar, S. K. Relationship between working capital and profitability: A statistical Approach. International Journal of Research in Finance and Marketing, 1(7), 1-16., 2011
Chin, A. F. Relationship between capital structure and profitability. Unpublished M.Sc Thesis, Graduate School of management, University of Malaysia., 1997
Damilola, D. A., Corporate Finance: Issues, investigations, innovations and Applications (2nd ed.). Lagos: High Rise publications., 2007

29
International Journal of Research in Management & Social Science Volume 5, Issue 3 (I): July - September, 2017
ISSN 2322 - 0899
Dave, A. R. Financial Management as a determinant of profitability. South Asian Journal of management, 19(1), 124-137. , 2012
Ezeamama, M. C. Fundamentals of Financial management: A practical guide. Enugu: Ema Press Ltd., 2010
Hasan, A. K., Halil, E. A., Arzu, O. C., & Salih, D. The Relationship between working capital and profitability: Evidence from an emerging market. International Research Journal of Finance and Economic, 62, 61-67., 2011
Leahy, A. S. The Determinants of profitability in the pharmaceutical industry. American Journal of Health Sciences, 3(1), 37-42., 2012
Malik, H. Determinants of insurance companies’ profitability: An analysis of insurance sector of Pakistan. Academic Research International, 1(3), 315-321., 2011
Niresh, J. A. Capital structure and profitability in Sirilankan Banks. Global Journal of management and business research, 12(13), 82-90., 2012
Nweze, A. U. Profit Planning: A Quantitative Approach (3rd ed.). Enugu: M’Cal communications International., 2011
Pandey, I. M. Financial management (10th ed.). New Delhi: Vikas publishing House PVT Ltd., 2010
Ross, S. A., Westerfield, R. W., & Jordan, B. D. Fundamentals of corporate finance (6th ed.). New York: Mc Graw-Hill Irwin publications., 2003
Samilioglu, F., & Demirgunes, K., The Effect of working capital management on firm profitability: Evidence from Turkey. International Journey of Applied Economics and Finance, 2, 44-50. http://dx.doi.org/10.3923/ijaef. 44.50. , 2008
Sayeda, T. Q. Relationship between working capital management and profitability in context of manufacturing industries in Bangladesh. International Journal of Business and Management, 7(1), 58-69., 2012
Thukaram Rao, M. E. Accounting for Managers. New Delhi: New Age International (P) Ltd publisher., 2009
Van Horne, J. C., & Wachowicz, J. M. Fundamentals of Financial Management (12th ed.). Harlow: Practice Hall Journals., 2005

30
International Journal of Research in Management & Social Science Volume 5, Issue 3 (I): July - September, 2017
ISSN 2322 - 0899
AN ANALYSIS OF TRENDS OF BANKS IN NIFTY BANK USING RELATIVE STRENGTH INDEX (RSI) AND RATE OF CHANGE INDICATOR (ROC)
V. S. Binu1 and Dr. T. Vetrivel2 Research Scholar1, Department of Management Studies, Bharathiar University, Coimbatore
Professor2, Department of Management Studies, Velalar College of Engineering and Technology, Erode
ABSTRACT Investment in equities involves a lot of risks. All investors who invest in equities should do ample analysis before investing. They should understand the fluctuations in the prices of equities frequently before making his buying and selling decision. The prices of equity stocks always move in unstable trends and cycles. An investor is always interested in buying stocks at low price and selling at high price. So fixing the buying and selling prices of a stock plays a vital role in equities investment. There are two approaches to decide the reasonable buying and selling price of equity stocks, Fundamental Analysis and Technical Analysis. The former approach determines the true value of the stock based on present and future earnings of the company and the latter determines the value of the stock based on the trends and movement of prices in the market. Since the present market is highly speculative, technical analysis works better. In this study, the trends of 12 banks of Nifty Bank index of National Stock Exchange is analyzed technically using oscillators like Relative Strength Index (RSI) and Rate of Change (ROC) indicator, for a period of past months of 2017.
Keywords: Technical Analysis, trends, Nifty Bank index, Relative Strength Index (RSI), Rate of Change Indicator (ROC), closing price, oversold and overbought.
INTRODUCTION Investment in stocks is one of the risky investments. Those who invest in equities should do ample research and analysis before making their investments in stocks. The investors should make their decisions on buying and selling price only on the basis of their analysis rather random decision making. There are two approaches to do this, fundamental and technical analysis. The fundamental analysis is based on current and future earning capacity of the organization and true worth of the share is determined, but the technical analysis is based on the trends and price movements of the stocks only. The price is forecasted using historical price data. The present stocks market in our country is highly volatile and speculation dominates the market. So the technical analysis or trend analysis works better than fundamental analysis. The technical analysis is based on trends. Trends means the direction at which the stocks prices moves in the market. Downtrend or falling trend occurs when prices moves downward and raising trend or uptrend occurs when prices moves upwards. The prices of stocks always move in a trend and the stocks prices will not be in a straight line. The technical analysis can be done using oscillators as well. Rate of Change Indicator (ROC) and Relative Strength Index (RSI) are two of the oscillators. The measure of rate of change of current prices compare to the price of certain days ago is ROC and RSI is an indicator that gives buying and selling signals in advance ahead of market. In this study the researcher has analyzed the trends of stock prices of 12 banks in Nifty bank index of National Stock Exchange for a period of two months from January 1st 2017 to March 31st 2017.
REVIEW OF LITERATURE Many past studies have emphasized the importance of technical analysis in making investment decision in equities. Equity stock is a perpetual financial instrument in which no return is promised by the issuer. So the investor has to do ample analysis before investing. The volatility in today’s stock market has made technical analysis as a better tool. Jensen and Bennington explained that the past information which is used to predict the future will not work out exactly every time. Neftci explains that the process is linear measure and the technical analysis will not work perfectly. Falbo and Retizzari state that there are many methods for technical analysis. The profitability based on the method of technical analysis is dynamic over time. P Selvam and L Rakesh have explained the application of Relative Strength Index in identifying the movements of stock prices and how it is used in trading with regards to Information Technology sector.
OBJECTIVES To identify the best buying and selling price of stocks of banks in nifty bank index
To understand the overbought and oversold condition of stocks of banks in nifty bank index
To measure the expected capital gain or loss of investments made using Relative Strength Index and Rate of Change Index

31
International Journal of Research in Management & Social Science Volume 5, Issue 3 (I): July - September, 2017
ISSN 2322 - 0899
DATA COLLECTION The study is based on secondary data which is obtained from the website of National Stock Exchange. The data are taken for a period of three months starting from 1st January 2017 to 31st March 2017.
TOOLS USED The tools used for the analysis are Rate of Change Index (ROC) and Relative Strength Index (RSI). The formula of Rate of Change Index (ROC) is as follows,
ROC = ((Most Recent Closing Price – Closing Price n Period ago)/Closing Price n Period Ago) * 100
The formula of Relative Strength Index (RSI) is as follows,
RSI = 100-(100/(1+Relative Strength))
Relative Strength = 14 Days Average Gain / 14 Days Average Loss
ANALYSIS OF RATE OF CHANGE INDICATOR (ROC) ROC is used to measure the rate of change of the current price in comparison with the price of certain number of days ago, usually seven days. Each and every day prices are divided by the price of prevailing certain days ago and the same is subtracted to 1. Simply it’s a ratio of current price and price of certain days ago and it is subtracted to 1. The ROC of a stock can be positive, negative and zero. The negative ROC shows the oversold condition .i.e., the price of the particular stock is less because of too much of selling pressure and it is good price to buy the particular share. Hence the negative ROC signals buying. The positive ROC signals best selling price of a stock and the price of the stock will be high, positive ROC shows the overbought condition. Oversold condition means it is a situation in which the supply exceeds the demand and the selling pressure will be high which makes the price of particular share to fall. Overbought is a condition in which the demand exceeds the supply of a share and the price of the share will increase. The oversold condition is good for buying and overbought is good for selling.
The ROC will clearly show the trends and it is used to understand at what trend the particular scrip falls in at present. The two trends which occur usually are the buying and selling trend. The buying trend starts with highest price and ends with lowest price. The selling trend starts with highest price and ends with lowest price. It is very difficult to make buy or sell decision based on trends. ROC helps to understand the position of scrip in the trends. If scrip is found as oversold by ROC means, it is in the buying trend and if the scrip is found overbought means it is in the selling trend.
In this study the researcher has analyze the ROC of twelve banks as follows
1. Axis Bank Ltd.
2. Bank of Baroda
3. Bank of India
4. Canara Bank
5. Federal Bank Ltd.
6. HDFC Bank Ltd.
7. ICICI Bank Ltd.
8. IndusInd Bank Ltd.
9. Kotak Mahindra Bank Ltd.
10. Punjab National Bank
11. State Bank of India
12. Yes Bank Ltd.
The analysis of ROC of these banks from January 1, 2017 to March 31, 2017 is as follows.
The buying and selling trends of the twelve banks and the gain or loss made by an investor by making his investment decision on the basis of ROC is given in the following table.

32
International Journal of Research in Management & Social Science Volume 5, Issue 3 (I): July - September, 2017
ISSN 2322 - 0899
AXIS BANK The lowest price in this period taken for analysis is Rs 445, on 23rd of January and the highest price is Rs 528.15 on 23rd of February. The ROC of the lowest price day is -0.0224, this shows that the stocks of this bank is oversold .i.e., too much of selling and this recommends buying. The ROC of the highest price day is 0.0847,
Trends Buy Trend Sell Trend Gain / Loss (Rs) Date Price (Rs) Date Price (Rs)
Axis Bank Trend 1 12-Jan-17 455.20 19-Jan-17 483.80 28.60 Trend 2 20-Jan-17 450.70 13-Feb-17 490.30 39.55 Trend 3 14-Feb-17 486.90 03-Mar-17 512.90 26.00 Trend 4 06-Mar-17 518.65 14-Mar-17 510.90 -7.75 Trend 5 15-Mar-17 511.70 17-Mar-17 511.8 5.45 Bank of Baroda Trend 1 20-Jan-17 154.35 10-Feb-17 188.05 33.7 Trend 2 13-Feb-17 168.8 31-Mar-17 172.95 4.15 Bank of India Trend 1 20-Jan-17 112.35 13-Feb-17 128.75 16.40 Trend 2 14-Feb-17 128.60 31-Mar-17 139.25 10.65 Canara Bank Trend 1 20-Jan-17 272.65 25-Jan-17 281.75 9.10 Trend 2 27-Jan-17 284 13-Feb-17 300.90 16.90 Trend 3 14-Feb-17 303.20 21-Mar-17 288.45 -14.75 Trend 4 22-Mar-17 282.25 31-Mar-17 302.75 20.50 Federal Bank Trend 1 31-Jan-17 76.05 13-Feb-17 83.95 7.90 Trend 2 14-Feb-17 83.15 1-Mar-17 88.05 4.90 Trend 3 2-Mar-17 84.85 31-Mar-17 91.45 6.60 HDFC Bank Trend 1 10-Feb-17 1303.60 1-Mar-17 1391.65 88.05 Trend 2 2-Mar-17 1380.1 24-Mar-17 1424.35 44.25 Trend 3 27-Mar-17 1409.85 31-Mar-17 1442.55 32.70 ICICI Bank Trend 1 20-Jan-17 263.45 10-Feb-17 281.60 18.15 Trend 2 13-Feb-17 281.65 22-Feb-17 286.15 4.50 Trend 3 23-Feb-17 284.50 20-Mar-17 275.05 -9.45 IndusInd Bank Trend 1 20-Jan-17 1220.25 14-Feb-17 1330.40 110.15 Trend 2 15-Feb-17 1316.45 27-Feb-17 1320.75 4.30 Trend 3 28-Feb-17 1312.60 31-Mar-17 1425.15 112.55 Kotak Mahindra Bank Trend 1 20-Jan-17 723.05 3-Feb-17 765.30 42.25 Trend 2 6-Feb-17 766.70 31-Mar-17 872.20 105.50 Punjab National Bank Trend 1 13-Feb-17 142.35 21-Mar-17 142.85 0.50 Trend 2 22-Mar-17 136.40 31-Mar-17 149.90 13.50 State Bank of India Trend 1 13-Feb-17 271.65 20-Mar-17 273.90 2.25 Trend 2 21-Mar-17 272.35 31-Mar-17 293.40 21.05 Yes Bank Trend 1 6-Feb-17 1398.45 9-Feb-17 1408.20 9.75 Trend 2 10-Feb-17 1412.85 21-Feb-17 1449.75 36.90 Trend 3 22-Feb-17 1446.95 1-Mar-17 1454.65 7.70 Trend 4 2-Mar-17 1424.70 21-Mar-17 1484.75 60.05 Trend 5 22-Mar-17 1470.85 31-Mar-17 1546.75 75.90

33
International Journal of Research in Management & Social Science Volume 5, Issue 3 (I): July - September, 2017
ISSN 2322 - 0899
this shows the stock is overbought .i.e., too much of buying and this recommends selling. Thus the ROC helps to anticipate the trend movements and helps the investors to make buying and selling decisions. There are five trend cycles in this stock. The first trend starts on 12-Jan-17 at a buy price of Rs 455.20 and ROC of -0.0001 and ends with a sell price of Rs 483.80 and ROC of 0.0815 on 19-Jan-17. An investor would have enjoyed a gain of Rs 28.60 per share if he invests in this trend. The second trend starts on 20-Jan-17 at a buy price of Rs 450.70 and ROC of -0.0063 and ends with a sell price of Rs 490.30 and ROC of 0.0161 on 13-Feb-17 with a gain of Rs 39.55 per share. The third trend starts with a buy price of Rs 486.90 and ROC of-0.0077 on 14-Feb-17 and ends with a sell price of Rs 512.90 and ROC of 0.0170 on 03-Mar-17 with a gain of Rs 26 per share. The fourth trend ends with a loss of Rs 7.75 per share and the last trend ends with a gain of Rs 5.45 per share. The buying and selling price is decided on the basis of ROC.
BANK OF BARODA The stocks of Bank of Baroda have two trend cycles in this period. The lowest price in the period taken for analysis is Rs154.20 on 23-Jan-2017. The ROC on that day is -0.0284. The highest price is Rs 188.05 on 10-Feb-2017 with ROC 0.0867. The first trend starts on 20-Jan-17 with a price of Rs 154.35 and ROC of -0.0329, the first trend end on 10-Feb-17 with a price of Rs 188.05 and ROC of 0.0867. An investor would have gained Rs 33.70 per share if he bought a stock in the beginning of the trend and sell at the end of the first trend. The second trend starts on 13-Feb-17 at a price and ROC of Rs 168.80 and -0.0498 respectively. An investor would have gained Rs 4.15 per share in the second trend.
BANK OF INDIA The lowest price of Bank of India is Rs 112.35 on 20-Jan-17 and the highest price is Rs 139.25 on 31-Mar-17. The ROCs of lowest price and highest price are -0.0166 and 0.1069 respectively. There are only two trend cycles occurred in the trend of Bank of India. The first trend starts on 20-Jan-17 with a price of Rs 112.35 and ROC of -0.0166 and ends on 13-Feb-2017 at a price of Rs 128.75 and ROC of 0.0279. An investor would have made of gain of Rs 16.4 per share if he buys in the beginning of the trend and sells at the end of the trend. Similarly, the investors would have gained Rs Rs 10.65 per share.
CANARA BANK The stocks of Canara bank had four trend cycles during the period of analysis. The lowest price is Rs 272.65 on 20-Jan-17 and the highest price is Rs 311.5 on 07-Feb-17. The ROCs on these days are -0.0132 and 0.0968 respectively. An investor would have gained Rs 9.10 and Rs 16.90 in the first two trends respectively. But the third trend ends with loss of Rs -14.75, the third trend starts with a price of Rs 303.20 and ROC of -0.0251. Since the ROC is negative it supports buying, but the trend end with least price. But there are many opportunities in this trend where the investors can buy at lower price and sell at higher price and book profit, for instance if the investor buys the stock on 27-Feb-17 instead of buying on the beginning day of the trend, he would have bought at Rs 288.40 and sold on the highest price day .i.e., on 1-Mar-17 at a price of Rs 296 he would have gained Rs 7.60 instead of incurring loss.
FEDERAL BANK The stocks of Federal Banks had three trend cycles during the period of analysis and all the trends are profitable to the investors. The first trend starts on 31-Jan-2017 with a stock price of Rs 76.05 and ROC of -0.0136 and the trend ends with a price of Rs 83.95 per share and ROC of 0.0006. An investor would have earned a profit of Rs 7.90 per share. Similarly, the investor would have earned a profit of Rs 4.90 and Rs 6.60 in the second and third trends respectively.
HDFC BANK The stocks of HDFC Banks had three trend cycles in the analysis period. The first trend begins on 10-Feb-17 at a price of Rs 1303.60 and ends at a price of Rs 1391.65. The investment in this trend gives a profit of Rs 88.05 per share. The ROC in the beginning and end of this trend is -0.0016 and 0.0106 respectively. Similarly the other two trends are also profitable for investments as given in the table.
ICICI BANK The stocks of ICICI bank had three trend cycles during this period. The first two trends are positive to the investors and the last trend which started on 23-Feb-17 at a price of Rs 284.50 and ROC of -0.0005 and end on 20-Mar-17 at a price of Rs 275.05 ends at a loss of Rs 9.45 per share.
INDUSIND BANK The stocks of the bank had three trend cycles during the period of analysis. The first trend starts on 20-Jan-17 at a price of Rs 1220.25 and ROC of -0.0110. The first trend ends on 14-Feb-17 at a price of Rs 1330.40 and ROC

34
International Journal of Research in Management & Social Science Volume 5, Issue 3 (I): July - September, 2017
ISSN 2322 - 0899
of 0.0209. The gain in this trend cycle is Rs 110.15. Similarly the next two buying and selling trends is also decide on the basis of ROC and it is found that both the trends has a gain of Rs 4.30 and Rs 112.55 respectively.
KOTAK BANK The stocks of Kotak Bank had two trend cycles during the period of analysis. The first trend starts on 20-Jan-17 at a price of Rs 723.05 and ROC of -0.0073. The first trend ends on 3-Feb-17 at a price of Rs 765.30 and ROC of 0.0295. The gain in this trend is Rs 42.25. Similarly in the second trend the gain is Rs 105.50
PUNJAB NATIONAL BANK The stocks of PNB had two cycles in the period of analysis. Both the trends gained Rs 0.5 and Rs13.50 respectively. The first trend starts on 13-Feb-17 with a ROC of -0.0018 and ends on 21-Mar-17 with a ROC of 0.0120. The second trend starts on 22-Mar-17 with a ROC of -0.0374 and ends on 31-Mar-17 with ROC of 0.0990
STATE BANK OF INDIA The stock had two trend cycle in the period of analysis. The first trend starts on 13-Feb-17 at a price of Rs 271.65 at a ROC of -0.0060 and ends at a price of Rs 273.90 at a ROC of 0.0148. The gain in this trend is Rs 2.25 per share. The second trend starts with a price of Rs 272.35 on 21-Mar-17 with ROC of -0.0033 and ends at a price of Rs 293.40 on 31-Mar-17 with ROC of 0.0968. The gain in the second trend is Rs 21.05
YES BANK The stocks had five trend cycles in the period of analysis. All the trend cycles are profitable. The gains in the trends from first to fifth are Rs 9.75, Rs 36.90, Rs 7.70, Rs 60.05 and Rs 75.90. The first trend starts on 6-Feb-17 at a price of Rs 1398.45 and ROC of -0.0059, the trends ends on 9-Feb-17 at a price of Rs 1408.20 and ROC of 0.0087. Similarly the other four trends were also profitable.
ANALYSIS OF RELATIVE STRENGTH INDEX (RSI) Relative Strength Index is a technical indicator which is used to measure the strength or weakness of a stock. It is sued to determine the overbought and oversold condition. Overbought is a condition in which the demand and price of a stock is high and it supports selling. Oversold is a heavy selling condition in which the supply exceeds the demand. The price of a stock will be low and it supports buying. Measuring Relative Strength Index will help an investor to make his investment decisions .i.e., buy and sell decisions wisely. It gives an indication to investors about when to buy and sell a particular stock. Relative Strength Index is a momentum oscillator and it is measured in a scale of 0 to 100. The overbought condition is indicated when RSI of a stock exceeds 70 in the measuring scale and oversold is indicated when RSI of a stocks falls below 30 in the measuring scale .i.e., when RSI is above 70 means it is overbought condition and the price of a stock at this condition will be high and it supports selling. Similarly when RSI is less than 30 means it is oversold condition and the price of a stock at this condition will be low and it supports buying. The profitable Relative Strength Index days of 12 banks from 01-Jan-2017 to 31-Mar-2017 is given in the following table,
Oversold Condition (Buy) Overbought (Sell) Gain/Loss Date Price RSI Date Price RSI Axis Bank 27-Mar-17 487.15 25.50 29-Mar-17 504.20 45.91 17.05 Bank of Baroda 23-Feb-17 168.15 29.34 28-Mar-17 173.90 71.20 5.75 27-Feb-17 164.40 28.13 29-Mar-17 173.50 72.80 9.10 28-Feb-17 165.30 25.64 30-Mar-17 173.65 72.75 8.35 01-Mar-17 165.35 25.75 31-Mar-17 172.95 72.17 7.60 Bank of India 2-Mar-17 125.95 31.07 28-Mar-17 135.95 70.10309 10 3-Mar-17 125.75 34.35 29-Mar-17 138.40 75.97656 12.65 Oversold Condition (Buy) Overbought (Sell) Gain/Loss Date Price RSI Date Price RSI Canara Bank 23-Feb-17 291.50 26.04 29-Mar-17 302.10 63.94 10.60 27-Feb-17 288.40 24.02 30-Mar-17 303.15 66.96 14.75 03-Mar-17 288.70 29.51 31-Mar-17 302.75 69.07 14.05 Federal Bank 23-Feb-17 84.1 48.31 28-Mar-17 90.55 70.62 6.45

35
International Journal of Research in Management & Social Science Volume 5, Issue 3 (I): July - September, 2017
ISSN 2322 - 0899
27-Feb-17 83.55 48.31 29-Mar-17 91.15 73.53 7.6 22-Mar-17 87.05 46.71 31-Mar-17 91.45 73.45 4.4 HDFC Bank 14-Mar-17 1410.7 50.97 23-Mar-17 1430.9 82.94 20.20 15-Mar-17 1416.6 50.64 24-Mar-17 1424.35 79.39 7.75 ICICI Bank 10-Mar-17 270.55 27.07 30-Mar-17 281.35 56.21 10.80 IndusInd Bank 3-Mar-17 1,299.20 42.55 24-Mar-17 1,389.55 80.91 90.35 6-Mar-17 1,319.70 43.75 30-Mar-17 1,422.30 81.00 102.60 Kotak Bank 15-Feb-17 784.30 43.50 24-Mar-17 879.35 93.62 95.05 Punjab National Bank 28-Feb-17 141.40 31.39 16-Mar-17 148.20 66.84 6.80 State Bank of India 27-Feb-17 268.20 28.46 29-Mar-17 288.45 70.81 20.25 28-Feb-17 269.20 28.98 30-Mar-17 291.05 70.31 21.85 03-Mar-17 265.05 29.37 31-Mar-17 293.40 73.74 28.35 Yes Bank 07-Mar-17 1448.20 47.89 30-Mar-17 1552.15 69.17 103.95
AXIS BANK The oversold condition .i.e., RSI less than 30 has occurred only on 27-Mar-2017 during the period taken for analysis. The overbought condition .i.e., the ROC above 70 has never occurred after the above mentioned date. Let us assume that an investor bought this stock on 27-Mar-2017 at a price of Rs 487.15 and RSI 25.50 and sold the stock at a price of Rs 504.20 on 29-Mar-2017. The RSI on this date is 45.91, which the highest RSI after the purchase of the stock and till 31-Mar-2017. So it is assumed that the investor has decided to sell at the highest RSI date rather at 70, because 70 has not occurred after the date of purchase of the stock, hence the investor sold it at the highest RSI date. The investor gains Rs17.05 per share of Axis Bank by buying and selling based on RSI.
BANK OF BARODA The oversold condition has occurred four days, 23rd, 27th and 28th of February and 1st of March with price Rs 168.15, Rs 164.40, 165.30 and 165.35, RSI of 29.34, 28.13, 25.64 and 25.75 respectively. The overbought condition occurs from 28-Mar-2017 to 31-Mar-2017. The RSI of these days are 71.20, 72.80, 72.75, and 72.17 respectively. The RSI of all these days are above 70 and hence it supports selling. The price of the stocks on these days is Rs173.90, Rs 173.50, Rs 173.65 and Rs 172.95 respectively. Let’s assume that an investor bought this stock at all the above oversold condition prices and sold them at the above overbought prices means he will gain Rs 5.75, Rs 9.10, Rs 8.35 and Rs 7.60 respectively.
BANK OF INDIA The oversold condition has never occurred exactly with a RSI of 30 but the ROC of two days is close to 30. The RSI of 2nd and 3rd March is 31.07 and 34.35 respectively with the price of Rs 125.95 and Rs 125.75. It is assumed that the investor buy the stocks on the above mentioned days and sold them on 28-Mar-17 at a price of 135.95 and RSI of 70.10 and on 29-Mar-2017 at a price of Rs 138.40 and RSI of 75.97. By buying on 02-Mar-2017 and selling it on 28-Mar-2017, the investor would gain Rs 10 per share and by buying on 03-Mar-2017 and selling on 29-Mar-2017 would gain Rs 12.65 per share
CANARA BANK The RSI of three days is less than 30. The RSI of 23rd & 27th of February and 3rd March are 26.04, 24.02 and 29.51 respectively. The prices of the stocks on these days are Rs 291.50, Rs 288.40 and Rs 288.70 respectively. The RSI of the stock is not signaling selling in any of the days after the buying day’s .i.e., the above mentioned dates, but there are three days in which the RSI is close to 70. The RSI of 29th, 30th and 31st of March is 63.94, 66.96 and 69.07 respectively and the prices of stocks on these days are Rs 302.40, Rs 303.15 and Rs 302.75 respectively. If an investor buys at the low RSI prices and sells at high RSI prices means he would have earned Rs 10.60, Rs 14.75 and Rs 14.05 respectively.

36
International Journal of Research in Management & Social Science Volume 5, Issue 3 (I): July - September, 2017
ISSN 2322 - 0899
FEDERAL BANK The RSI of the stock didn’t signal buying at any point of time in the period taken for analysis. So the least RSI is considered to be the buy signal and it is assumed that the investor bought at the least RSI. The RSI of the stock on 23rd, 27th of February and 22nd of March is 48.31, 48.31 and 46.71 respectively. The price of the stock on these days is Rs 84.10, Rs 83.55 and Rs 87.05. The RSI of the stock very well signals the selling. The RSI on 28th, 29th and 31st of March is 70.62, 73.53 and 73.45 respectively. The price on these days is Rs 90.55, Rs 91.15 and Rs 91.45. If an investor buys on the low RSI days and sells at high RSI day means he would have gained Rs 6.45, Rs 7.60 and Rs 4.40 respectively.
HDFC BANK The RSI of the stock didn’t signal buying at any point of time in the period taken for analysis. So the least RSI is considered to be the buy signal and it is assumed that the investor bought at the least RSI. The RSI on 14th and 15th March is 50.97 and 50.64 respectively. The price on these days is Rs 1410.70 and Rs 1416.60. The RSI on 23rd and 24th March is 82.94 and 79.39 respectively. The price on these days is Rs 1430.90 and Rs 1424.35 respectively. The gain of an investor would be Rs 20.20 and Rs 7.75.
ICICI BANK The RSI of stock is less than 30 only on 10th March. The RSI and price on this day is 27.07 and Rs 270.55 respectively. The RSI of none of the days signals selling, so it is assumed that the investor decide to sell at the highest RSI. The highest RSI after 10th March .i.e., the day of purchase, is 56.21 on 30-Mar-2017. The price is Rs 281.35. If an investor buy on low RSI day and sells at high RSI day means he would have earned Rs 10.80 per share.
INDUSIND BANK The RSI of the stock didn’t signal buying at any point of time in the period taken for analysis. So the least RSI is considered to be the buy signal and it is assumed that the investor bought at the least RSI. The RSI on 3rd and 6th of March is 42.55 and 43.75 respectively. The highest RSI corresponding to the purchase RSI is 80.90 and 81 on 24 th and 30th of March. The investor will gain Rs 90.35 and Rs 102.60 per share if invest on above mentioned dates.
KOTAK BANK Since the RSI of the stock didn’t signals buying, it is assumed that the investor will buy at the lowest RSI price. The lowest RSI is 43.50 on 15-Feb-2017, the price is Rs 784.30. The highest RSI is 93.92 on 24-Mar-2017; the price is Rs 879.35 per share. The gain of an investor would be Rs 95.05 per share.
PUNJAB NATIONAL BANK The RSI of the stock is not less than or equal to 30 in any of the days taken for analysis, so the RSI very close to 30 is decide to buy. The RSI and price on 28-Feb-2017 are 31.39 and Rs 141.40 respectively. The RSI close to 70 after the date of purchase is on 16-Mar-2017, the RSI on the day is 66.84. The price on this day is Rs148.20. If the investor invests in this stock means he would have earned Rs 6.80 per share.
STATE BANK OF INDIA The RSI of the stock supports buying and selling thrice during the period of analysis. The RSI of three days supports buying. The RSI on 27th, 28th February and 3rd March is 28.46, 28.98 and 29.37 respectively, since all the RSI are less than 30 it support buying. The RSI on 29th, 30th and 31st of March is 70.81, 70.31 and 73.74 respectively. Since all the RSI are above 70, selling is strongly recommended. The investor will gain Rs 20.25, Rs 21.85 and Rs 28.35 if he buy and sell on above dates.
YES BANK The RSI of the stock is not less than or equal to 30. So the least RSI is taken to decide the buying, the least RSI is 47.89 on 7th March. The highest RSI after this date is decided for selling, the highest RSI is on 30th March. The RSI on this date is 69.17, the price is Rs 1552.15. If investor bought and sold as per thr RSI means he would have earned Rs 103.95 per share.
FINDINGS The investment decision made on the basis of RSI is better than ROC. The decision made on the basis RSI should be compared with ROC for a better investment decision. In other words, make a primary decision on the basis of RSI and compare it with ROC. The findings of the analysis made on the basis on the oscillators, ROE and RSI are as follows, In the case of Axis bank, the buying is decided on 27th March at RSI of 25.05 which is less than 30. The
ROC on this day is negative which supports selling as well. Since both the RSI and ROC supports buying, it

37
International Journal of Research in Management & Social Science Volume 5, Issue 3 (I): July - September, 2017
ISSN 2322 - 0899
is decide to buy the stocks on the day mentioned above. Similarly the stocks signals selling on 29th March, the RSI on this day is 45, which is not equal to or above 75, but this is the highest RSI since the day of purchase. The ROC on this day is also negative which supports selling.
The stocks of Bank of Baroda signals buying on 23rd, 27th, 28th of February and 1st of March. The RSI on these days are less than 30, hence it supports buying. The ROC of all these days, except 27th February, is negative. The ROC is 0.01 in 27th February which is very close to neutral; hence it is assumed that it supports buying. The stocks signals selling on 28th to 31st of March, the RSI of all these days are above 70 and ROC is also perfectly positive in all these days as well.
The buying and selling decisions of Bank of India has worked out better using RSI and ROC. The RSI of the stocks in 2nd and 3rd March is 31.07 and 34.35 respectively, the RSI of both of these days are not less than or equal to 30 but these are the least RSI in the period taken for analysis and close to 30 as well. The ROC of these two days is negative which supports buying. The stocks signals selling on 28th and 29th of March because the RSI of both of these days are above 70 and ROC of both the days is positive as well
In the case of Canara Bank, the decision is made as per ROC is perfect because the ROC of buying dates is perfectly negative and ROC of selling dates are perfectly positive. As far as RSI is concerned, the RSI on 29th, 30th and 31st of March are the highest after the day of purchase of the stocks. The RSI of all these days are not equal to or greater than 70 but very close to 70, hence it is decided to sell and ROC of all these days are perfectly positive which supports selling.
The decision made on buying and selling of Federal bank is entirely different from others because both the RSI and ROC are not perfect in making investment decisions because none of the days in the period taken for analysis is perfect for buying or selling as per RSI and ROC. There is no days with RSI is less than or equal to 30. As far as ROC is concerned, only very few days with negative ROC, hence buying decision became very difficult because of irregularities in both the oscillators. So it is decided to take buying decision based on the least RSI, the RSI of 23rd, 27th of February and 22nd of March are least and hence purchased. The ROC of these days is very close to neutral. The selling decision in not much complicated, because the RSI on 28th, 29th, and 31st of March are above 70 and ROC is also positive. The decisions made are profitable.
The RSI of HDFC Bank is not less than or equal to 30 in any of the days taken for analysis. The ROC is also not supportive in buying. There are certain days in which the ROC is negative but the RSI is above 65, hence it is risky to buy. So it is decided to buy in least RSI days. It is found that the RSI is least on 14th and 15th March. The ROC of these two days is positive but close to neutral. The selling decision is very easy to take because the RSI on 23rd and 24th of March is above 70 and ROC of these two days is also positive and supports selling. The buying and selling as per the above dates are profitable.
The buying decision made in the stocks of ICICI Bank, based on RSI and ROC is perfect. The stocks are suitable to purchase on 10th March because the RSI is less than 30 and ROC is negative as well. In the case of selling, there is no day with RSI less than 70 after the day of purchase. So it is decided to sell at a highest RSI day. On 30th March the RSI is 56.21 which are highest after the day of purchase and ROC on this day is also positive which supports selling.
The purchase decision is not made exactly as per RSI in the case of IndusInd bank. There is no day with RSI less than 30. So it is decided to purchase at a least RSI. The RSI on 3rd and 6th March are the least and ROC is also negative. The selling decision is made perfectly because the RSI on 24th and 30th March is 80.90 and 81 respectively and ROC on these days is also positive.
The RSI of Kotak Bank is not less than or equal to 30 in any of the days taken into analysis, so it is decided to considered the least RSI for purchase. The largest RSI is 43.50 on 15th February. The ROC on this day is also negative. The stock has given a gain of Rs 95.05 per share when it is sold on 24th March when the RSI is more than 70 and highest at 93.62. The ROC on the selling day is also positive.
The buy and sell decision in the case of Punjab National bank is not exact as per RSI and ROC. The RSI has never reached 30 or less than 30 in any of the days of analysis. Similarly The RSI has never reached 70 or above. So it is decided to consider the highest and lowest RSI for selling and buying respectively. The least RSI in 31.39 on 28th February and ROC on this day is neutral. The highest RSI is on 16th March which is not equal to or above 70 but close to 70. The ROC on this day is positive which supports selling.

38
International Journal of Research in Management & Social Science Volume 5, Issue 3 (I): July - September, 2017
ISSN 2322 - 0899
The buying and selling decision of State Bank of India on the basis of RSI and ROC is very perfect. All the purchase days RSI are lesser than 30 and all the selling days RSI are higher than 70. The ROC of all the buying is negative and selling ROC is positive.
The investment decision on Yes Bank stocks based on RSI and ROC are not exact. The RSI of stocks is not less than or equal to 30 in any of the days. The least RSI is on 7th March at 47.89. The ROC on this day is neutral. The RSI of this stock is almost close to 70 on 30th March at 69.17. The ROC of the day is positive

39
International Journal of Research in Management & Social Science Volume 5, Issue 3 (I): July - September, 2017
ISSN 2322 - 0899
THE ROLE OF SEBI IN PROTECTING THE INTERESTS OF INVESTORS AND REGULATION OF FINANCIAL INTERMEDIARIES : A CASE STUDY OF RAYALASEEMA REGION, ANDHRA
PRADESH – INDIA
S Mohana Murali Research Scholar, Rayalaseema University, Kurnool, Andhra Pradesh
INTRODUCTION The three important terms in the title are the SEBI, Investors Protection and Regulation of Financial Intermediaries. The “Securities Exchange Board of India (SEBI)” was set up as an administrative body in April 1988 was given statutory status on 30.1.1992 by promulgation of SEBI Ordinance which has since become an Act of Parliament. The SEBI with its over eighteen years of existence has made considerable dent in the Capital market through its various developmental and regulatory measures for investor protection and healthy development and regulation of the capital market.
The Investors and “Investors Protection”: A range of investors, of Indian as well as foreign origin and domicile, participate in the Indian market. Domestic investors are free to subscribe to all offerings of securities to the extent made available to them by the issuer and Investor protection is one of the most important elements of a thriving securities market or other financial investment institution. Investor protection focuses on making sure that investors are fully informed about their purchases, transactions, affairs of the company that they have invested in and the like.
Regulation of Financial Intermediaries: There are a number of financial market intermediaries known as financial intermediaries or merchant bankers, operating in financial system. These are also known as investment managers or investment bankers. The objective of these intermediaries is to smoothen the process of investment and to establish a link between the investors and the users of funds. The SEBI Act provides that stockbrokers, sub-brokers and other financial intermediaries associated with the securities market may buy, sell or deal in securities only in accordance with the conditions of the certificate of registration. SEBI has evolved regulations governing each one of these categories of intermediaries or participants. Typically these regulations specify conditions relating to the size, capital adequacy, business conduct, record keeping and so on. The process of registration and licensing allow SEBI to ensure that those who are associated with the securities trade play by a set of rules governing the trade and have the organizational, financial capacity and, where appropriate, the infrastructure to be able to deliver their contractual obligations. It also allows for collection of valuable data. In addition, SEBI may also issue directions from time to time to intermediaries in the market as well as to issuers so as to protect investors or to ensure proper management of the intermediary’s affairs.
REVIEW OF THE LITERATURE Ravi Singhania & S Venkitaraman (2015) they conducted a study on SEBI Vs Investors Protection and they found that the Section 11 of the Securities and Exchange Board of India Act 1992, which came into force from 13.01.1992 states that it shall be the duty of the Board to protect the interest of the investors in securities and to promote the development of and to regulate the securities market by such measures as it thinks fit. Now that more than 15 years have elapsed since the Act came into force in place of the Capital Issues (Control) Act, which was abolished in the wake of the policy of liberalization announced by the Government, a review is called for as to how far the duty of protecting the interest of investors or development of the Capital Market is fulfilled by SEBI.
promoters group who promote the enterprise and take the risk of huge investments, and being in the control of the company should have analysed the risk of their investments and do not require any education from any government sponsored institution or SEBI for initiating into their ventures. The qualified institutional investors, as the name itself indicates, are institutions, funds, banks, etc who are well qualified to make investments without the guidance of either government or any government sponsored body. The retail investors who are now allowed to invest upto Rs. 1.0 lac in a public offer also are capable of seeking financial advisers for their investments. Hence, the small shareholder is the only investor who require the care and protection of an Organization like SEBI to withstand the vicissitudes of the market fluctuations or the manipulations in the market.
Edgeworth (1888) proposed that financial intermediaries are efficient producers of liquid assets since there is a diversification in the pool of depositories. Liquidity to an economy may be supplied in two ways; One, directly through trade on capital markets; second; indirectly through financial intermediaries. In the first case, liquidity is created by allowing agents with different cash flow needs to trade among themselves claims on productive

40
International Journal of Research in Management & Social Science Volume 5, Issue 3 (I): July - September, 2017
ISSN 2322 - 0899
assets. In the second case, intermediaries introduce producers and consumers, hold in their portfolio claims on productive assets and issue to individual investors in a secondary market which are tailor made as per their requirement.
OBJECTIVES OF THE RESEARCH WORK To analyze the investors age and gender factors and growth of future of savings and Investment Motivation,
Behavior and Experience of Investors in Rayalaseema Region.
To identify the Investors Risk Factors, Knowledge and Control over their Investment and to know the Role of SEBI in Protection of Interest of Investors in Rayalaseema Region.
To study the investors experience of SEBI Complaints Redress System (SCORES) and to bring out the importance of education and awareness among the investors
To analyze the overall strategy of SEBI to promoting, regulating and to strengthen the Financial Intermediaries.
To find the role of SEBI in and training and development of Financial Intermediaries in India.(New Issue Management, E- IPO )
RESEARCH METHODOLOGY The present Case study is primarily based on the primary data and secondary data in nature but for the analysis of the study, SEBI officials, Individual Investors, various Brokers and Sub-Brokers, Financial intermediaries, Invest management experts, and managers of MFIs were consulted. The secondary data was collected from published sources such as SEBI Annual Reports, RBI Bulletin, CME Publications, Finance journals, financial magazines, annual reports Ministry of Finance, Report on trend and progress of MFIs in India, newspapers and websites of RBI, SEBI, NSE, BSE, NSDL.CSDL, and Ministry of Finance, Government of India (GOI).
ANALYSIS FOR INVESTORS PROTECTING THE INTERESTS OF INVESTORS BY SEBI The analysis for the study has been divided into five sections for Investors Survey i.e. a. Personal Information Segment
b. Investment Segments Segment
c. Risk Segment Segment
d. SEBI Role and Regulation of Financial Intermediaries
e. Grievance Redressal Segment
PERSONAL INFORMATION This section including all the information regarding Age, Gender, Residing places in Rayalaseema Region, Profession and employment and Income levels etc. Statistical techniques like X²(Chi Square) were used to test the hypothesis in Rayalaseema Region. The same results are presented in appropriate table and also exhibited in Figure.
INVESTMENT SEGMENT This section to know the following.. Investor’s motivation strategies
Different Investment avenues,
Their previous Investment experience and behavior
Investors DPs
Statistical tools like Mean, Percentage, ²(Chi Square) were used to test the hypothesis and significance for Investment Segments.
RISK SEGMENT The third section is to study the Risk Segment which most important and it includes... Investor’s knowledge about the Investment
To Know about the Risk Segments
Investment Strategies

41
International Journal of Research in Management & Social Science Volume 5, Issue 3 (I): July - September, 2017
ISSN 2322 - 0899
Both the primary and secondary data were used to collect the questionnaire. There were 3 items in the questionnaire. Out of these 3 items 1 to 7, 1 to 5, and 1 to 5 perception statements were provided. For each statement five alternative answers were given on the right side with likert’s five point scale. These were strongly agree, agree, neutral, disagree and strongly disagree. To test the significance level and hypothesis both the Rayalseema Region and Distric wise X²(Chi Square) were used and the same results are presented in appropriate table and also exhibited in Figure .
ROLE OF SEBI IN PROTECTION OF INTEREST OF INVESTORS This section is designed in the questionnaire to help and identify the satisfaction level with respect to SEBI Role and guidelines towards the protection of Interest of Investors thru various statements and each every statement has five alternative answers were given, these are Highly satisfied, Satisfied, Average Satisfied, Dissatisfied, and Highly Dissatisfied. Statistical techniques like X²(Chi Square) were used to test the hypothesis and significance level in Rayalaseema Region.
GRIEVANCE REDRESSAL SECTION This section is to know SEBI investor grievance redressal mechanism. The upgraded mechanism SCORES (SEBI Complaints Redress System) would be a webbased, centralized grievance redress system for SEBI. All grievances will be in electronic mode with facility for online updation of action taken reports by the users. The questionnaire were designed in such a way the investors how best he/she receiving results from the SEBI and accountability towards the all grievance problems etc. In the following section, the study emphasis the Investment Segments such as before investing into an particular Investment avenue like Equity, Debt, or Mutual Fund etc. humans beings do not always in a rational predictable manner. A an basically an irrational creature motivated by emotions, impulses of the moment, instincts, vague hopes, fears and expectations, uncontrollable desires and greed almost everything but logic and reason. Here is an attempt to highlight certain Segments before investment Decision in Rayalaseema Region there has been five Segments were focused i.e. 1. Established and Reputations Companies 2. Ideas/Recommendations of Brokers/Friends/Portfolio Analysis 3. Annual Reports of the Company and related websites 4. Financial Process (Business Magazines) 5. The Internet (relevant websites related blogs etc.) The above five Segments were considered by the investors before investing in a particular investment avenues in Rayalaseema region, the District wise results were presented in the tables and same exhibited appropriate charts.
Depository Participant in Rayalaseema Region
DISTRICT DEMAT ACCOUNT TOTAL NSDL CDSL
Kurnool 139 11 150 Anantapur 119 26 145 Kadapa 94 41 135 Chittoor 103 17 120 Grand Total 455 95 550 ² 27.43200803
Р - Value P<=0.001
Source : Field Survey Data Type : Normal Data Test applied : ² test Level of significance : 95% Degree of Freedom : 3 Result : Significant
From the above table it is found that in Rayalaseema Region more than 80% are being members of NSDL (National Securities Depository Ltd) and 20% are being account holders in CDSL (Central Depository Services Ltd.). The sentiment of the investors of holding maximum numbers of accounts in NSDL is because it is the

42
International Journal of Research in Management & Social Science Volume 5, Issue 3 (I): July - September, 2017
ISSN 2322 - 0899
first Indian depository. But there is significance difference between the districts wise investors were holding DEMAT accounts in both the NSDL and CDSL in Rayalaseema Region.
Investors Investment Options in Rayalaseema Region
District Investment Options
Total Equity Shares
Preference Shares
Debt/ Bonds /PSU Derivatives Mutual
Funds Kurnool 78 10 30 10 22 150 Anantapur 68 28 14 19 11 140 Kadapa 91 11 12 11 10 135 Chittoor 61 10 19 12 23 125 Grand Total 298 59 75 52 66 550 ² 42.99019761
Р - Value 0.00002 significant
Source : Field Survey Data Type : Normal Data Test applied : ² test Level of significance : 95% Degree of Freedom : 12 Result : Significant
From the above it is found that 54% of the investors are investing in Equity Shares, 13% of investors are investing in Debt/PSU/Bonds, 12% for Mutual Funds schemes, 10% are Preferes Shares and only 9% of Investors are going for the Derivative Instruments. From this analysis the investors are expecting High Return and Low Risk and they are expecting risk free securities are also. But there is a lot of difference in selecting and placing the investments in different avenues in Rayalaseema region.

43
International Journal of Research in Management & Social Science Volume 5, Issue 3 (I): July - September, 2017
ISSN 2322 - 0899
INVESTORS GRIEVANCE REDRESSAL SYSTEM
Complaints District Total (%) Kurnool Anantapur Kadapa Chittoor
Non-Receipts Dividend/Interest/Rights/Bonus/AMFI Role/Mutual Fund Role 10 21 12 18 61(11) DEMAT Charges are too heavy 30 31 34 32 127(23) DEMAT Charges on unlisted or non-traded shares to be removed 5 8 4 12 29(5.2) Brokerage Commission are too high/ transparency 50 43 32 21 146(26) Shares do not appear in Demat Account so enough/webased Grivance proposal 51 33 47 26 157(28) Shares sale proceeds do not come to you in time/Investors website response etc 4 4 6 16 30(5.4) Grand Total 150 140 135 125 550(100) X² 46.75190595
Р – Value 0.00004 Significant
Source: Field Survey Data Type: Normal Data Test applied: ² test Level of Significance: 95% Degree of Freedom: 15 Results: Significant
From the above in Rayalseema region from total sample i.e.550 investors response is that 26% of the investors are saying that the commission and other charges are too high from company to company in India and 23% of investor were responded regarding annual charges of the DEMAT Account is differ from Broking Company to Company. 11% respondents are Regarding non receipt of dividend and AMFI transparency has to improve and 28% of the investors are not satisfying regarding webbased grievance proposal. 5.4% of the investors are unable to get sale proceeds.
The test results, there is significant difference among the Investors Grievance Redrssal System in Rayalaseema Region since p < 0.001. SEBI needs to strengthen Grievance Redrssal System in order to restore the investor’s confidence in stock market in India.

44
International Journal of Research in Management & Social Science Volume 5, Issue 3 (I): July - September, 2017
ISSN 2322 - 0899
FINANCIAL INTERMEDIARIES ANALYSIS The analysis and data interpretation for the for the financial intermediates has grouped into twenty questions is as follows.. And (Leading 50 broking companies were selected for analysis) 1. From question No 1 to 5 including the name and address of the company. Nature and membership of the
company and to know the whether the company belongs to fee-based or advisory financial Intermediaries or asset based intermediaries.
2. Question No 6 describes that what kind or service rendered by the company to the clients. Today almost all the Broking firm or financial companies has been offering all segments like DP, Trustees, Lead bankers, Merchant Banking activates, Portfolio and Mutual Fund etc. In Rayalseema Region almost all the broking firms has been offering all kind of segments.
3. To know the Role of Securitas Exchange Board of India (SEBI) in Protection of Interest of Financial Intermediaries in India. My study pertains to Rayalseema Region only buy it encompass to rest of Rayalseema Region also. i.e. Question No 7 to 20. The questions in questioner is as under..
Role of SEBI for the Training and Development of Market Intermediaries.
SEBI Role in Protection of Interest of Financial Intermediaries
Inspection of Books and AMFI and MF Regulations
Promotion and Regulation of SRO’s
Prohibition of Insider Trading
Investors Education and Training and Vetting Role
Commission and Recommendations of Various Committees
Penalties regarding violation of norms and Norms for Compulsory delisting of Shares by stock exchanges
NSE – Paperless Mode and Large Investors
To know the satisfaction levels for each and every above statement five alternative answers were given in the questionnaire on the right side with five point scale. These were Highly Satisfied, Satisfied, Average Satisfied, Dissatisfied and Highly Dissatisfied. To test the significance level and hypothesis both the Rayalseema Region and Distric wise X²(Chi Square) were used and the same results are presented in appropriate tables and also exhibited in Figure.
Nature and Services rendered by the Company In Rayalaseema Region
Nature and Service rendered Districts Total Kurnool Anantapur Kadapa Chittoor
Brokers(For All Segments) 42(84) 38(76) 44(88) 36(72) 160 Specific* 8(16) 12(14) 6(12) 14(28) 40 Total 50 50 50 50 200 ² 5 Р - Value 0.171797
Source : Field Survey Data Type : Normal Data Test applied : ² test Level of significance : 95% Degree of Freedom : 4 Result : Significant

45
International Journal of Research in Management & Social Science Volume 5, Issue 3 (I): July - September, 2017
ISSN 2322 - 0899
From the above table : Financial Intermediaries are has been offering different types of financial Segments/Product and services and some of the Intermediaries which are offering only few Specific segments/services to the clients and analysis and interpretation have been made in Rayalasema Region i.e. . In Kadapa district 88% companies are offering all segments and 12% of the companies were offering only specific segments only. In Kurnool district there were 84% of the companies has been offering in all segments and 16% of the companies are offering only specific segments. In Anantapur district 76% of the companies offering all segments, 14% of the companies are offering only specific segments. In Chittoor District 72% of the companies were offering all segments, 28% of the companies were offering only specific segments only in Rayalaseema Region.
The result there is significance difference nature and service rendered by the Companies in Rayalaseema Region since P Value <0.001.
Role of SEBI and Regulation for Training and Development to the Intermediaries
District Satisfaction level
Total Highly Satisfied Satisfied
Average Satisfied Dissatisfied
Highly Dissatisfied
Kurnool 25 8 5 6 6 50 Anantapur 24 11 6 5 4 50 Kadapa 19 13 8 7 3 50 Chittoor 21 9 9 4 7 50 Total (%) 89(44) 41(20) 28(14) 22(11) 20(10) 200 ² 6.799159
Р - Value 0.870596
Source : Field Survey Data Type : Normal Data Test applied : ² test Level of significance : 95% Degree of Freedom : 12 Result : No Significant
*Specific Segments included: Credit Rating Agencies Custodians Registrars to an Issue & Share Transfer Agents Merchant Bankers Bankers an Issue Debenture Trustee Foreign VCFs Portfolio Management Collective Investment Schemes Underwriters VCFs FIIs DP Mutual Funds
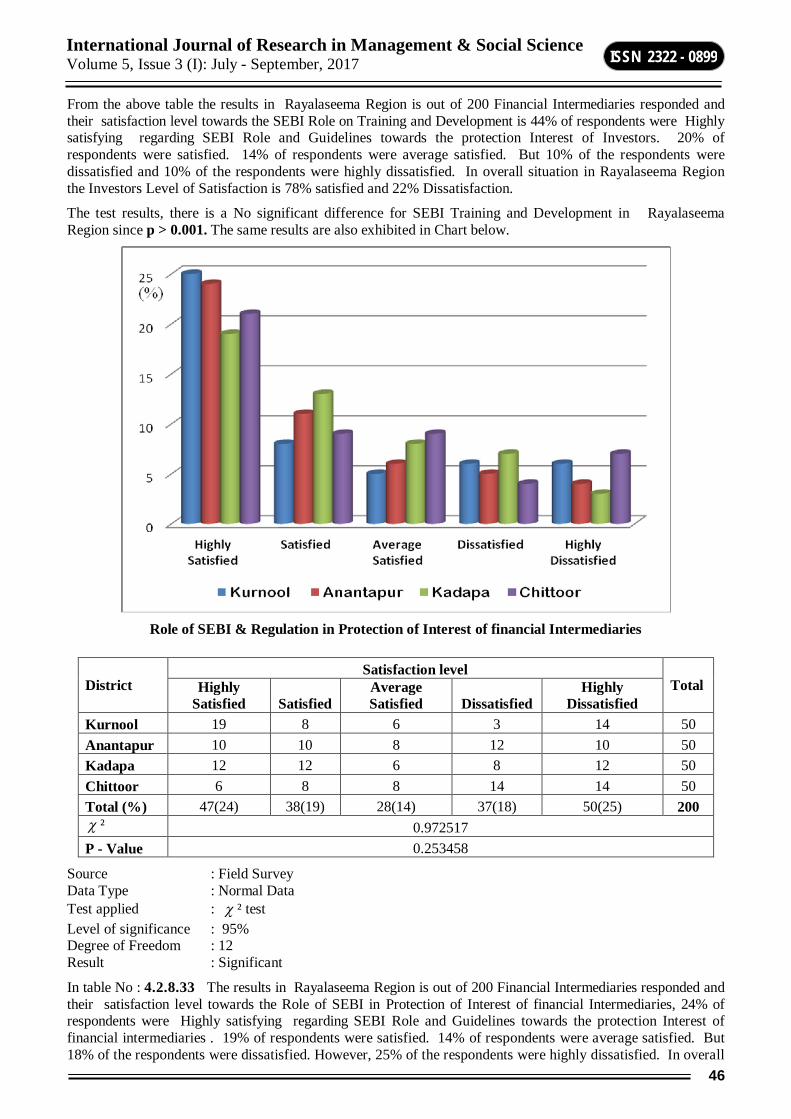
46
International Journal of Research in Management & Social Science Volume 5, Issue 3 (I): July - September, 2017
ISSN 2322 - 0899
From the above table the results in Rayalaseema Region is out of 200 Financial Intermediaries responded and their satisfaction level towards the SEBI Role on Training and Development is 44% of respondents were Highly satisfying regarding SEBI Role and Guidelines towards the protection Interest of Investors. 20% of respondents were satisfied. 14% of respondents were average satisfied. But 10% of the respondents were dissatisfied and 10% of the respondents were highly dissatisfied. In overall situation in Rayalaseema Region the Investors Level of Satisfaction is 78% satisfied and 22% Dissatisfaction.
The test results, there is a No significant difference for SEBI Training and Development in Rayalaseema Region since p > 0.001. The same results are also exhibited in Chart below.
Role of SEBI & Regulation in Protection of Interest of financial Intermediaries
District
Satisfaction level Total Highly
Satisfied Satisfied Average Satisfied Dissatisfied
Highly Dissatisfied
Kurnool 19 8 6 3 14 50 Anantapur 10 10 8 12 10 50 Kadapa 12 12 6 8 12 50 Chittoor 6 8 8 14 14 50 Total (%) 47(24) 38(19) 28(14) 37(18) 50(25) 200 ² 0.972517 P - Value 0.253458
Source : Field Survey Data Type : Normal Data Test applied : ² test Level of significance : 95% Degree of Freedom : 12 Result : Significant
In table No : 4.2.8.33 The results in Rayalaseema Region is out of 200 Financial Intermediaries responded and their satisfaction level towards the Role of SEBI in Protection of Interest of financial Intermediaries, 24% of respondents were Highly satisfying regarding SEBI Role and Guidelines towards the protection Interest of financial intermediaries . 19% of respondents were satisfied. 14% of respondents were average satisfied. But 18% of the respondents were dissatisfied. However, 25% of the respondents were highly dissatisfied. In overall
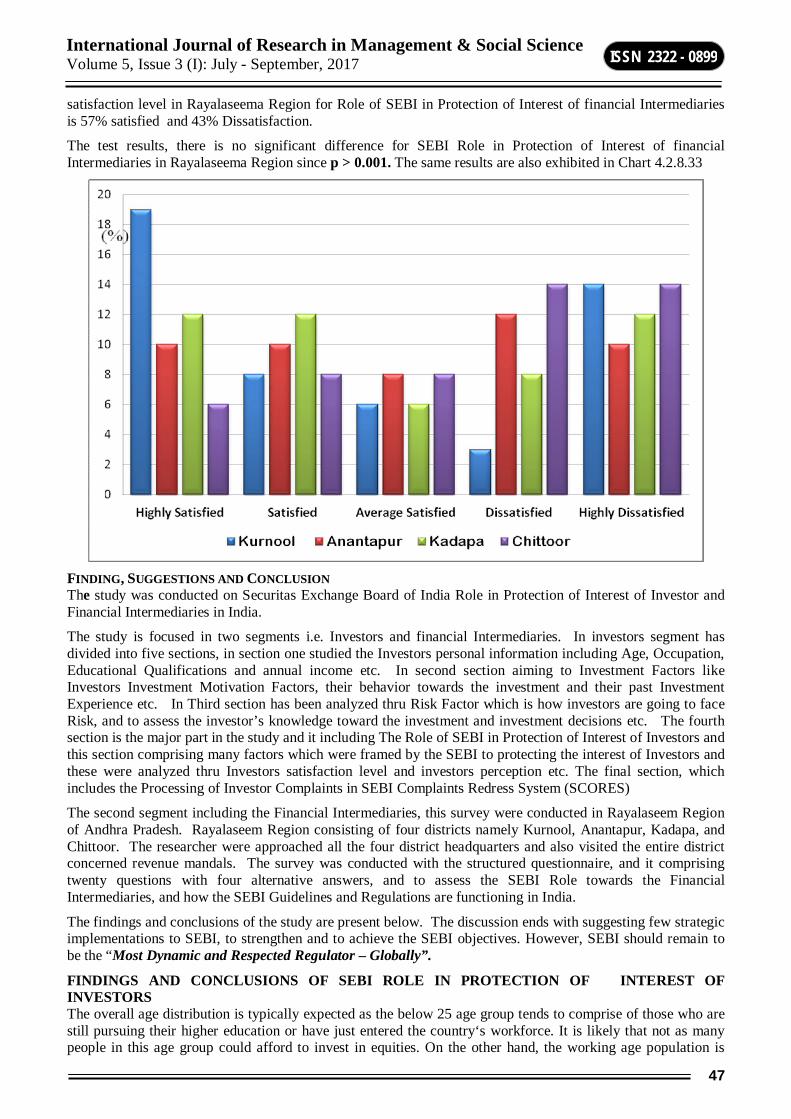
47
International Journal of Research in Management & Social Science Volume 5, Issue 3 (I): July - September, 2017
ISSN 2322 - 0899
satisfaction level in Rayalaseema Region for Role of SEBI in Protection of Interest of financial Intermediaries is 57% satisfied and 43% Dissatisfaction.
The test results, there is no significant difference for SEBI Role in Protection of Interest of financial Intermediaries in Rayalaseema Region since p > 0.001. The same results are also exhibited in Chart 4.2.8.33
FINDING, SUGGESTIONS AND CONCLUSION The study was conducted on Securitas Exchange Board of India Role in Protection of Interest of Investor and Financial Intermediaries in India.
The study is focused in two segments i.e. Investors and financial Intermediaries. In investors segment has divided into five sections, in section one studied the Investors personal information including Age, Occupation, Educational Qualifications and annual income etc. In second section aiming to Investment Factors like Investors Investment Motivation Factors, their behavior towards the investment and their past Investment Experience etc. In Third section has been analyzed thru Risk Factor which is how investors are going to face Risk, and to assess the investor’s knowledge toward the investment and investment decisions etc. The fourth section is the major part in the study and it including The Role of SEBI in Protection of Interest of Investors and this section comprising many factors which were framed by the SEBI to protecting the interest of Investors and these were analyzed thru Investors satisfaction level and investors perception etc. The final section, which includes the Processing of Investor Complaints in SEBI Complaints Redress System (SCORES)
The second segment including the Financial Intermediaries, this survey were conducted in Rayalaseem Region of Andhra Pradesh. Rayalaseem Region consisting of four districts namely Kurnool, Anantapur, Kadapa, and Chittoor. The researcher were approached all the four district headquarters and also visited the entire district concerned revenue mandals. The survey was conducted with the structured questionnaire, and it comprising twenty questions with four alternative answers, and to assess the SEBI Role towards the Financial Intermediaries, and how the SEBI Guidelines and Regulations are functioning in India.
The findings and conclusions of the study are present below. The discussion ends with suggesting few strategic implementations to SEBI, to strengthen and to achieve the SEBI objectives. However, SEBI should remain to be the “Most Dynamic and Respected Regulator – Globally”.
FINDINGS AND CONCLUSIONS OF SEBI ROLE IN PROTECTION OF INTEREST OF INVESTORS The overall age distribution is typically expected as the below 25 age group tends to comprise of those who are still pursuing their higher education or have just entered the country‘s workforce. It is likely that not as many people in this age group could afford to invest in equities. On the other hand, the working age population is
48
International Journal of Research in Management & Social Science Volume 5, Issue 3 (I): July - September, 2017
ISSN 2322 - 0899
ideally placed to invest as most presumably have been working for a number of years and have thus amassed a certain amount of wealth/capital for investment purposes. After the age of 56, a considerable percentage of the population is eligible for retirement. As pensioners have lesser income, they may be less willing and/or able to invest in equities. This reasoning seems to explain the trends within Table 6.1 quite well. Overall, with five out of the six categories being represented by at least 10% of respondents, findings should provide a fair indication of the actual behavioural tendencies of this investor class along this particular dimension.
Gender, male-dominated Districts are higher in Rayalaseema region and expected to result in even higher proportions of male respondents compared to female respondents in these samples. In fact that more females are not willing to participate in the study. If they are willing the cash handling and dealing of all financial traction in male only and it is customs to Rayalaseema region.
There is a significance difference among the occupation/profession in Rayalaseema region.
It is very clear that the low level income group is interested in investments in stock markers and high level income groups are very interested and they are willing to take risk and they want maximize the wealth as quick as possible in Rayalaseema region hence, There is a significance difference among the Investors Income levels in Rayalaseema region.
Just graduates and Postgraduate are very interesting towards the income generation and searching for Income Avenue and where as Professional groups are not so interesting because they were settled and they will think before investing. Last but not least the below graduates and just educated persons are also lagging because lack of awareness and fear. Therefore, there is a significance difference between the educational qualifications of the investors in Rayalaseema region.
In Rayalaseema Region there is a adequate representation of investors along this dimension, from beginners to very experienced ones. But there is significance difference between the districts wise investors investments experience.
There is significance difference between the districts wise investors were holding DEMAT accounts in both the NSDL and CDSL in Rayalaseema Region.
From this analysis the investors are expecting High Return and Low Risk and they are expecting risk free securities are also. But there is a lot of difference in selecting and placing the investments in different avenues in Rayalaseema region.
It is found that with each districts in Rayalaseema Region being represented by at least 10% of investors (approximately), are having trade experience in a month. But there is no significance difference between the districts wise investors trading experience.
it is found that in Kurnool District Investors Preference are the five factors such as Short term price, long term price hike , Stable Dividend, Speculation/Gambling and Pride/Ego are analyzed with four preference in that 35% are very important, 30% are Slightly Important 18% are irrelevant and 17% are Important in the Kurnool District Investors. But there is a no significant difference in four factors in Kurnool District of Rayalaseema region.
It is found that in Anantapur District Investors Preference are the five factors such as Short term price, long term price hike , Stable Dividend, Speculation/Gambling and Pride/Ego are analyzed with four preference in that 36% are very important, 23% are Slightly Important 20% are irrelevant and 19% are Important in the Kurnool District Investors. But there is a no significant difference in four factors in Anantapur District of Rayalaseema region.
it is found that in Kadapa District Investors Preference are the five factors such as Short term price, long term price hike , Stable Dividend, Speculation/Gambling and Pride/Ego are analyzed with four preference in that 50% are very important, 17% are Slightly Important 17% are irrelevant and 15% are Important in the Kurnool District Investors. But there is a no significant difference in four factors in Kadapa District of Rayalaseema region
it is found that in Chittoor District Investors Preference are the five factors such as Short term price, long term price hike , Stable Dividend, Speculation/Gambling and Pride/Ego are analyzed with four preference in that 56% are very important, 16% are Slightly Important 13% are irrelevant and 11% are Important in the Kurnool District Investors. But there is a no significant difference in four factors in Chittoor District of Rayalaseema region.

49
International Journal of Research in Management & Social Science Volume 5, Issue 3 (I): July - September, 2017
ISSN 2322 - 0899
There is no significance difference in Investment Risk, Investment Knowledge and control over the investment in Rayalaseema region.
The investors were considering all the five factors their investment in Rayalaseema region and there is no significant difference among the five Investment factors in four districts of Rayalaseema Region since p > 0.001.
The test results, there is no significant difference among the Nineteen factors in Kurnool districts of Rayalaseema Region since p > 0.001. From the investors point of view in Kurnool City, overall all the SEBI Role towards protection of interest of investors are satisfactory but some of the issues like Investors Education, Redressal System, Insiders trading Control mechanism, SMAC etc. These are not satisfied by the investor. In this junction SEBI needs to strengthen guidelines and regulation in order to restoring investor’s confidence level etc.
The test results, there is no significant difference among the Nineteen factors in Anantapur districts of Rayalaseema Region since p = 0.001. From the investors point of view Anantpur Distict, overall all the SEBI Role towards protection of interest of investors are satisfactory but some of the issues like SEBI Advertising Code for Public and Right Issue, ,Regulation Relates Fraudulent/Unfair Trade Practices, Rolling settlements, Eligibility norms for issuing company, Pricing by companies issuing securities Insiders trading Control mechanism, SMAC etc. These are not satisfied by the investor. In this junction SEBI needs to strengthen guidelines and regulation in order to restoring investor’s confidence level etc.
The test results, there is no significant difference among the Nineteen factors in Kadapa districts of Rayalaseema Region since p > 0.001. From the investors point of view in Kadapa, overall all the SEBI Role towards protection of interest of investors are satisfactory but some of the issues like AMFI Guidelines Eligibility norms for issuing company, Pricing by companies issuing securities Insiders trading Control mechanism, content of the offer documents, Z group delisted shares, Net – Based Purchasing /trading in shares, control of insider trading and SMAC etc. These are not satisfied by the investor. In this junction SEBI needs to strengthen guidelines and regulation in order to restoring investor’s confidence level etc.
Rayalseema region from total sample i.e.550 investors response is that 26% of the investors are saying that the commission and other charges are too high from company to company in India and 23% of investor were responded regarding annual charges of the demat Account is differ from Broking Company to Company. 11% respondents are regarding non receipt of dividend and AMFI transparency has to improve and 28% of the investors are not satisfying regarding web based grievance proposal. 5.5% of the investors are unable to get sale proceeds. The test results, there is significant difference among the Investors Grievance Redrssal System in Rayalaseema Region since p < 0.001. SEBI needs to strengthen Grievance Redrssal System in order to restore the investor’s confidence in stock market in India.
FINDINGS AND CONCLUSIONS OF SEBI ROLE IN PROTECTION OF FINANCIAL INTERMEDIARIES The major finding in second analysis is that the SEBI role towards the Financial Intermediaries in Rayalaseema Region. The researcher were find twenty major finding and arrived relevant suggestion or recommendation to SEBI in order to fulfill the SEBI objectives and the overall strategy and Role to promote and to regulate and to strengthen the Financial Intermediaries. The researches were also finding out to know the role of SEBI in Protection and training and development of Financial Intermediaries in India.
The Broking Companies has been divided into two categories i.e. main intermediaries or sub-intermediaries. it is true that the registration of sub- brokers is being improved in current financial year, there is a lot of variation between the main and sub intermediaries in Rayaseema Region of four District, and some of companies are very interesting for to be su-brokers rather than the brokers. Hence, the result there is significance difference in role of the Company in Rayalaseema Region since P <0.001
In Rayalaseem Region there is more numbers of Fee – Based or Advisory Financial Intermediary were excising when compare to Asset Based Financial Intermediary. The result there is significance difference role of the Company in Rayalaseema Region since P Value <0.001.
Financial Intermediaries are has been offering different types of financial Segments/Product and services and some of the Intermediaries which are offering only few Specific segments/services to the clients and analysis and interpretation have been made in Rayalasema Region i.e. 80% companies are offering all segments and 20% of the companies were offering only specific segments only. In district wise comparison it is being differ
50
International Journal of Research in Management & Social Science Volume 5, Issue 3 (I): July - September, 2017
ISSN 2322 - 0899
from on district to another district. Hence, the result there is significance difference role of the Company in Rayalaseema Region since P <0.001.
The findings regarding Training and Develpment in Rayalaseema Region. In overall impact on Financial Intermediaries Level of Satisfaction is 78% satisfied and 22% Dissatisfaction.
The test results, there is a No significant difference for SEBI Training and Development in Rayalaseema Region since p > 0.001. But in some district in Rayalaseema Region i.e. kadapa and Chittoor is unable maximum satisfaction level for training and development rendered by the SEBI.
In overall satisfaction level in Rayalaseema Region for Role of SEBI in Protection of Interest of financial Intermediaries is 57% satisfied and 53% Dissatisfaction has been finding in this factors but it is not favorable effect to the SEBI. If SEBI is going to neglect it the percentage of dissatisfaction level is gong to increase to maximum extent. Test findings is, there is no significant difference for SEBI Role in Protection of Interest of financial Intermediaries in Rayalaseema Region .
Findings towards the Role of SEBI in Inspection of Books of Accounts of AMC and Custodians, in overall satisfaction level in Rayalaseema Region is 63.5% satisfied and 36.5% Dissatisfaction, there is no significant difference for SEBI Role in Inspection of Books of Accounts of AMC and Custodians in Rayalaseema Region.
The Role of SEBI in AMFI and Mutual Fund Regulations the researcher has finds that In overall satisfaction level in Rayalaseema Region is 73.5% satisfied and 26.5% Dissatisfaction. The test results, there is no significant difference for SEBI Role in Mutual Fund Regulations in Rayalaseema Region since.
Findings pertaining to the Role of SEBI Self Regulatory Organizations (SRO In overall satisfaction level in Rayalaseema Region for Role of SEBI in Self Regulatory Organizations (SRO) is 76% satisfied and 25% Dissatisfaction. Bu it in district wise comparison it is been showing different there is variation especially Anantapur and Chittors are showing more dissatisfaction towards this factors. And the results, there is no significant difference for SEBI Role in Self Regulatory Organizations (SRO) in Rayalaseema Region since p > 0.001.
Findings towards the Role of SEBI on Prohibition of Insiders tradings the satisfaction level in Rayalaseema Region, is 76% satisfied and 25% Dissatisfaction. But in Kurnool and Chittoor based Financial Intermediaries has showing maximum dissatisfaction with this factors SEBI needs some have modified regulated guidelines for this factor. Hence the test results, there is no significant difference for SEBI Role in Prohibition of Insiders trading in Rayalaseema Region since p > 0.001.
Findings regarding Vetting or transparency by SEBI the satisfaction level in Rayalaseema Region are 72.5% Satisfied and 27.5% Dissatisfaction. This is the more important factors to all SEBI registered Financial Intermediaries, in district wise the dissatisfaction level is been increasing SEBI needs to re regulating to this factors and the test results, there is no significant difference for Vetting Role by SEBI in Rayalaseema Region since.
Satisfaction level towards the M R Maya Recommended Four - Part Model Regarding BROKER CODE. In overall satisfaction level in Rayalaseema Region, is 75% satisfied and 25% Dissatisfaction. The test results, there is no significant difference Brokers Code in Rayalaseema Region.
The results in Rayalaseema Region is out of 200 Financial Intermediaries responded and their satisfaction level towards the SEBI Role on Penalties Regarding Violation of Norms In Rayalaseema Region, is 71% satisfied and 28.5% Dissatisfaction. The test results, there is no significant difference Penalties Regarding Violation of Norms in Rayalaseema Region .
Findings for SEBI Role on Norms for Compulsory Delisting of Shares by Stock Exchanges in Rayalaseema Region, is 68% satisfied and 31.5% Dissatisfaction. The test results, there is significant difference in Rayalaseema Region since p < 0.001. Many of broking companies were not satisfying regarding these norms which SEBI needs to additional guidelines and regulations to restoring FI confidence in the Market.
The major findings in Rayalaseema Region is out of 200 Financial Intermediaries responded and their satisfaction level towards the SEBI Role on Introduction of NSE Paperless mode. 72.2% satisfied and 27.5% Dissatisfaction. Some of the broking companies were opposing with this system because many of the investors unable to access to this system, but some of the broking company are welcoming this system and there were happy with this system. Therefore, FI and Investors needs extensive training and information. The test results, there is no significant difference SEBI Role on Introduction of NSE Paperless mode in Rayalaseema.

51
International Journal of Research in Management & Social Science Volume 5, Issue 3 (I): July - September, 2017
ISSN 2322 - 0899
SEBI Role on Regulatory Bias toward Institutions/Corporate Sector and Large Investor. In Rayalaseema Region is Large Investor 67% satisfied and 32.5% Dissatisfaction. The test results, there is no significant difference SEBI Role Regulatory Bias toward Institutions/Corporate Sector in Rayalaseema Region. SEBI is been taking many measures and regulating towards the small investors but it needs and required some of the additional guidelines and regulation for strengthen the small investors in Indian stock market.
Last and Major findings in this study the Overall SEBI Regulation and Guidelines, In overall satisfaction level in Rayalaseema Region, Overall SEBI Regulation and Guidelines 57% satisfied and 52.5% Dissatisfaction. Which means the satisfaction level is very poor. In overall all Financial Intermediaries were not happy with the SEBI Regulation and Guidelines. They need revised regulation and guidelines etc. all the requirements has mentioned in the suggested or recommended for necessary action by SEBI. The test results, there is no significant difference Overall SEBI Regulation and Guidelines in Rayalaseema Region since p > 0.001.
SUGGESTIONS Based on the findings and conclusions of SEBI Role in Protection of Interest of Investors and Financial
Intermediaries and the observations of the research the suggestions are offered to SEBI. These suggestions are as follows..
Only the young middle age groups are very interesting to entering and into market and soon after they are just quit from the market or they can be ideal for some time or they are going to stop trading permanently.
Regarding middle old age people are not turning into financial market because of no guarantee returns and chance of more loss and normally Indians are inclined to invest household savings in Gold, some of risk free savings like post office NSC, and also keep cash in hand and lockers.
SEBI need to make awareness to all kind of age group individuals about the role and importance of various financial products and financial markers and there should be more training and awareness camps by SEBI every district head quarters and main revenue divisions so that to guide the investors how to invest in stock market and what are the Various formalities that must comply with. This will encourage investment in financial markers.
Males are investing more in stock market as compared to female. But to today in Rayalaseem Region there is Micro finance and Self Help Group mania going on and these women are saving corers of money in their regional banks if SEBI takes necessary steps to encourage women to entering into stock market there is tremendous growth in all aspects. And domestic investment participation should be increased, given more weightage and Household and Self Help Group savings participation in Capital Market to be taken up from 9 to 10% by 2011
Well settled and high income group individual has been entering into to the financial market but regarding the small investors who are getting less income, they lost faith in the capital market due to continuous crashes in the market and scams. Therefore to encourage the small investor to continuous investment in the market and restore the small investor confidence on SEBI and capital market, SEBI need to have strong regulations regarding scams and relevant information regarding market crashes and how to overcome from it etc.
Only graduate were more interesting in the stock market, professional and below graduates were not seeking investments in stock market because professional may having lack of time or too knowledge about it, regarding below graduate or land lord they don’t have full knowledge and clear information about the stock market just they completely depending on the stock broker decision only. In this Junction SEBI has to appoint one regional executive or agents for making awareness and dealing the stock market proceedings etc.
Investment motivation factors, Investors Investment Behavior and Experience concern there is a more dropout in the financial market no one don’t having more than 10 years trading experience, SEBI has to curb the dropout by making awareness and techniques for long lasting trading in the financial market.
There is only two depository participant are functions some of the investors suggesting that there is some more DP. Numbers of Investors are consults the brokers or agents to seek information and advice for investment decision only for Equity, Mutual Fund and Debit they are not even knowledge about derivative market and other financial instruments which are traded in the market should merely be based on agents advice rather the decision should be based on their careful investigation.

52
International Journal of Research in Management & Social Science Volume 5, Issue 3 (I): July - September, 2017
ISSN 2322 - 0899
SEBI has to advice to the listed companies or issuing firms to make large publicity and toll free numbers for free counseling and guidance purpose and rating agencies are also make large publicity regarding to this issue.
SEBI has to make guidelines for trading only investors presence only the brokers has to trade and operate the investors account in orders to increasing trading activity by the investors.
Investors are expecting stable dividend and short term price increases, SEBI has to fulfill the investors expectations by controlling and regulating prompt dividend payment by the companies and to controlling gambling and speculative activities in the market. Investors are going lost money due stock market crash in any segments Equity or Debt or other instruments for that SEBI has to implement the following
1. Curb the price manipulative practices,
2. Strong punishments and penalty to Brokers for violation of rules and regulations
3. All the companies must be maintain good corporate governess in order to maintain the transparency
4. Information of corrupted companies in mass advertisements
5. Make awareness international economic environment factors and their impact on the Indian stock market like Oil price hike, inflation, exchange rate and interest rate etc.
6. Effective utilization Investors Education Protection Fund (IEPF) and to make awareness among all the investors and there should transparency regarding IPF utilization. Therefore, the investors, does one really need to worry about this Indian stock market crash or scams.
Investors risk, knowledge and control over the investment point of view only few investors Obviously Investors are rational and prefer less risky investments to risker. Investors are quite often facing Investment loss due to many external factors which are beyond control of investors and this segment is contributed 15 to 23% and it is very high. 13 to 20% of the investors are feels that they only responsible for personal Investment decisions or financial planning. (Table No. 5.3.16 to 5.3.19).
Therefore, SEBI need an extensive advertisement and each and every financial instruments information and more information regarding external forces which are badly adverse impact on the stock exchanges to mange all above thins SEBI has to develop a software in the SEBI official website for Investment Plan and how to behave while market in adverse situation all the things the investors may come to thru a trail version software.
For personal financial planning and fixed income strategies purpose many investors were approaching some of internet based financial planners, but there is a chance to the investors to lose the money and wrong recommendation and advice for investments decision so to avoid and to protect the interest of investors SEBI needs has implement in a specialized software for investment knowledge and financial planning.
All the investors are not aware of the guidelines and regulations which is farmed by the SEBI and after my approach only they come to know the all the fact. Some of the Investors opinion is that SEBI has to delegate some segments to other regalities so that each and every guidelines and regulations may be reaching to all.
SEBI’s rules and regulations issued quite often thru circulars and press note but it is suggested to that SEBI hast sent mail or circular to all the investors Email IDs for effective functioning of the rules. But some of the districts in Rayalasseem Region they don’t have any idea about the SEBI Code and investors protections guidelines. For that SEBI needs to organize frequent workshops and seminars to make full awareness among the investors and other individuals to encourage to invest in the stock market and to make awareness among abut the financial instruments or products in order to maintain SEBI has a strong role on to protection of interest of investors.
There should be local tribunals that deals with the problems of investors in different districts of state, because we see very few people approach SEBI Complaint Redress System (SCORES) thru on line and having a toll free numbers or company law board and they go to exchange cells as per their convenience, so the people living away from exchanges, prefer to not filing complaint
Various grievances regarding Demat Charges, DP etc. required to be studied in totality and suggestions and solutions to be arrived in consultation with Investor Associations etc.

53
International Journal of Research in Management & Social Science Volume 5, Issue 3 (I): July - September, 2017
ISSN 2322 - 0899
SEBI has to look into the matter or the Sub and Main Intermediaries, but day by day Sub intermediaries and broker is been increasing due to registration fee and too legal formalities and getting delay for registration process. SEBI needs to simplify the registration process and to encourage new and main intermediaries.
SEBI has to take care about the Training and Development of Financial Intermediaries and it has to compulsory, because many operators and brokers they don’t have full knowledge about the SEBI rules and guidelines may of the brokers were working as a tailored mad work environment. Therefore, to make awareness all the rule and regulations for the Financial Intermediaries training and development is mandatory.
SEBI need to encourage Asset Based Financial Intermediaries. And it has to advice to all Financial Intermediaries has to offer Segments/Product and services. It is been Suggested to SEBI regarding Inspection Books of Accounts has to take maximum effort for better transparency and restoring the investors confidence.
SEBI has to frame some more regulations for Asset Management Companies in order to make full awareness among the small investor for all types of Mutual Fund Schemes so that the asset management companies can provide the right kind of need base solutions to their Investors. Then the small investors are willing to invest in mutual funds irrespective of its occupation and time frame
Self Regulatory Organizations (SRO In overall satisfaction level in Rayalaseema Region for Role of SEBI in Self Regulatory Organizations (SRO) is satisfactory but dissatisfaction level is been also increasing SEBI need to re – regulate SRO for better performance.
Insiders trading is slow poison to stock market SEBI is been taking maximum measures to controlling it but still it is prevailing in the market. The investor’s opinion is that SEBI has to take rigors punishment and high penalty who are practicing of insider trading activates in the financial market. In this junction Investors are pleasing to the SEBI the particular person or firm who are in insider trading practices should be vanished from the market permanently.
Transparency or vetting guideline must be strengthened. So that SEBI can achieve the objective like to protection of interest of investors and Financial Intermediaries in markets all the listed and registered brokers must disclosed all the necessary information to all.
There is some more additional adjust for M R Maya Recommended Four - Part Model Regarding BROKER CODE. Because 20 to 30% are not satisfying with this code SEBI need open debate on this issue and make necessary adjustments and guidelines for better performance in the market and do quality service to the investors. An SEBI need strong and strict norms for Brokers who are violating the norms.SEBI need to giving the guideline and support for implementing Paper less exchange in all the regional exchange.
Investor’s and Financial Intermediaries has to participation in Decision making process, it should be made mandatory, compulsory to invite all Investors, Investors Associations to participate in decision making process connected with Capital Market. A system to be developed at all levels including informal discussion, Conference, Seminars. MEA, DCA, RBI, SEBI to come together to prepare guidelines for the same.
The overall performance of the SEBI regarding Financial Intermediaries in Rayalaseema Region is satisfactory but in district wise comparison it is not up to the mark, SEBI need lot of structural changes regarding all the rules and regulations, some most important is as follows..
Parliament and Government of India must undertake evaluation of functioning of Indian Regulatory System.
Public Debate is initiated for Accountability, Transparency, and Co-ordination, and if it should be a Single Regulator - Super Regulator and we can find simplification of Regulatory process and overlapping regulatory provision should be cleared at one stroke Improve the Investors Knowledge about the financial market instrument To encourage all kind of age group individual to entering into stock market especially self –Help group
female Investors. Better utilization of Investors Education Protection Fund Implementation of local tribunals for grievances purpose. To increase registration of intermediaries rather than sub intermediaries To encourage all the broking firm has to implement all service to the client.

54
International Journal of Research in Management & Social Science Volume 5, Issue 3 (I): July - September, 2017
ISSN 2322 - 0899
Training and Development must implement in every district head quarter and related district revenue divisions.
India has several Regulators. The Regulatory System available in very few metro cities. Investors spread all over India finds it inaccessible, unapproachable. Get lost in regulatory mechanism. To over come to this problems SEBI has to take necessary steps is as follows.. Education of Investors regarding Grievances Redressal System One lead Regulator may be provided in each District of India. SEBI or DCA shall be given the responsibility to receive all / any grievances connected with Security
Market and should pass it to the concerned Regulator. All over India finds regulatory system is inaccessible, unapproachable. Get lost in regulatory mechanism.
In all regulatory bodies, Stock Exchanges, i.e. self-regulatory organizations, Director from all the connected communities, i.e. Investors, Brokers, Industries, be selected, appointed as Directors, Member.
And this study needs to encompass to all over the India, for assessing the SEBI role exactly how it is functioning and performing in the India. In Region wise comparison in Andhrapradesh at Rayaseema Region is showing the Role of the SEBI in Investors point of view is satisfactory but district wise comparison it is not satisfied. It is same to the Financial Intermediaries point of view. Therefore, this study has spread all over India for keeping our SEBI is to be the most Dynamic and Respected Regulator – Globally.
REFERENCES BOOKS/ARTICLS/JOURNALS 1. Seccurity Exchange Board of India Act,1992 4th April , Gazettes.20110
2. K Sekhar, SEBI Capital Issues & Listing, Wadhawa & Company , p.235
3. R.P. Rustagi, Investment Management (Theory and Practice),2015 fourth edition, Sultan Chand & Sons Company: New Delhi p.20.
4. R.P. Rustagi, Investment Management (Theory and Practice),2015 Reprint edition, Sultan Chand & Sons Company New Delhi p.24
5. V.K Bhalla, Investment Management, Security Analyis & Portfolio Management 11th Edition S.Chand Publishing Company, New Delhi p 26
6. http: www.sebi.gov.se http://invesor.sebi.gov.in.
7. www.bseindia.com.
8. www.nssindia.com.
9. S. Kevin, Portfolio Management, Second Edition, PHI Learning Pvt. Ltd, New Delhi, p.15
10. Rustagi R.P Investment Management (Theory and Practice),2011 S. Chand, New Delhi p.336
11. Securitas Exchange Board of India, Disclosure and Investors Protection Guidelines, 2000.
12. Securitas Exchange Board of India, Disclosure Processing of Investor Complaints in SEBI Complaints Redress System (SCORES), 2010.
13. Pavan Duggal, advocate, Supreme Court , New Delhi,2009
14. http://investor.sebi.gov.in/faq/investorright.html
15. SM Murali & Dr N. Sasikala A study on Investors Preference on SEBI Multi-Pronged Approach –Pertaining to Kurnool City – AP,2008
16. Investors Alert, Quarterly Newsletter CREAT focusing on Investors Protection ,April-June, 2008p 3
17. SEBI Under Investor Protection and Education Fund updated, feb 24,2009
18. SEBI Financial Education A -(Investor Protection and Education Fund (IPEF) Published by BSE on Behalf of the SEBI-2015
19. Indian Security Market Review Volume XII by National Stock Exchange of India (NSE),2011, Exchange Plaza Mumbai

55
International Journal of Research in Management & Social Science Volume 5, Issue 3 (I): July - September, 2017
ISSN 2322 - 0899
20. Market Simplified to launch trading platform, The Hindu Daily New Paper3.09.2010
21. Management of Financial Services, Issue Management, Intermediaries Regulation sand SEBI Guidelines Rai University,p255, Bangalore..
22. SEBI Regulation and Guidelines for Market Intermediaries Regulation and Supervision Department (MIRSD.2011
23. SEBI Gazette Notification on Merchant Bankers Amendment Regulation on5th July,20151 Mumbai
24. SEBI Gazette Notification on Underwriters Amendment Regulation on5th July,2011 Mumbai
25. SEBI Gazette Notification on Bankers to Issue Amendment Regulation on5th July,2011 Mumbai
26. SEBI Gazette1stock Brokers and Sub Brokers Amendment Regulation on6th April,2011 Mumbai
27. SEBI Gazette Notification on Registrar to issue and share transfer agents Regulation on5th July,201 Mumbai
28. SEBI Gazette Notification on Portfolio Managers Amendment Regulation on5th July,201 Mumbai
29. Securities Exchange Board of India Annual Report 2010-2011,p12
30. http//www.Rayalaseem.AP. Official Website of NIC - Andhra Pradesh State Unit, Hyderabad
31. http//www.Kurnool.nic.in: Official Website of NIC - Andhra Pradesh State Unit, Hyderabad
32. http//www.Anantapur.nic.in: Official Website of NIC - Andhra Pradesh State Unit, Hyderabad
33. http//www.Kadapa.nic.in: Official Website of NIC - Andhra Pradesh State Unit, Hyderabad
34. http//www.Chittoor.nic.in: Official Website of NIC - Andhra Pradesh State Unit, Hyderabad
35. Securities and Exchange Board of India - Role as a Regulator Publishing Date 2005 by ICMR-1999-2004.
36. Restoring Investors Confidence a survey by Equity Master, Equity Research Company in India, 2002,
37. Different Persons opinion about the investor’s awareness campaign:by G.Anataramn at Federation of Andhra Pradesh Chambers of Commerce and Industry and Hyderabad Stock Exchange,2004.
37. Different Persons opinion about the investor’s awareness campaign: T.M. Nagarajan at Investors Awareness Programme by SEBI at Chennai on September 27, 2003.
38. G. N. Bajpai, Enhancing Investor Awareness: “Securities Market Awareness Campaign” at New Delhi on January 17, 2003.
39. Investor Awareness Programme on "Empowering Investors through Education"by Madras Stock Exchange CHENNAI SEPT. 27.2008.
40. The SEBI Board meeting with Expert Group August 05, 2004
41. The Joint Parliamentary Report (JPC) on securities scams recommendation, 2001.
42. “Safe Investing in Stock Markets” by SEBI on Launching of SMAC at New Delhi, 2003
43. Regional Council of Institute the of Chartered Accountants of India (WIRC-ICAI), The Hindu Monday Dec, 21, 2010.
44. Capital market regulation on an even keel, The Hindu Dec, 2010
45. Betrayal of investors: Calling for retail investors in public issues doubled. 26th Oct, 2010 the Hind business desk. Mumbai:
46. SEBI Committee on Disclosures and Accounting Standers (SCODA), 2010
47. SEBI Modifies arbitration procedure The Hindu 1-09-2010 Mumbai:
48. MS.K Hema Malini and ER R Deepa, A study on benefits and risk analysis of future and options in Madurai: IJRCM VOLUME NO: 2 (2011), ISSUE NO. 4 (APRIL) ISSN 0976
49. Dr. R.V.Selvam,Investors Perception About Internet Stock Trading A Constraint Vellore : IJRCM VOLUME NO: 1 (2010), ISSUE NO. 8 (DECEMBER) ISSN 0976-2183

56
International Journal of Research in Management & Social Science Volume 5, Issue 3 (I): July - September, 2017
ISSN 2322 - 0899
50. Son V Gupta and Prakesh Chwla:An Analysis of Investors Preception Regarding Mutual Fund Gujarath. IJRCM VOLUME NO: 2 (2011), ISSUE NO. 5 (MAY) ISSN 0976-2183
51. Tiffany Y. Tang, Pinata Winoto and Xiaolin Niu Department of Computer Science University of Saskatchewan 57 Campus Drive, Saskatoon, Saskatchewan, S7N 5A9 Canada {yat751, piw410, xin978}@mail.usask.ca
52. Mark Gerard Hayes: Investment and Finance Under fundamental Uncertainty: Doctor of Philosophy July 2003, USA
53. Sebi Circular, Sebi Registered Market Intermediaries, 2011
54. Sebi Circular, All Recognized Stock Exchange s 2011
55. Redressal of investor grievances against Depository Participants (DPs) in SEBI Complaints Redress System (SCORES), 2011, Circular
56. Redressal of investor grievances against stock brokers and sub brokers in SEBI Complaints Redress System (SCORES), 2011 Circular
57. SEBI Uniform Know Your Client (KYC) Requirements for the Securities Markets and Registered Market Intermediaries, Circular 2011
58. Sri Kirit Jayantilal Somiya: Scientific Mangement of Small Investors Prtotection in the New millennium with reference to India.2005 vol 1
59. Preliminary investigations carried out by Shri Prashant Saran(SEBI Whole Time Member) on IPO on,2011
60. Economic Survey: Financial Intermediation and Market,2010-11
61. C.R Kothari Research Methodology, I Revised Edition: New Age International P
62. Donald H. Mc Burney Research Methods, fifth edition Thomos wadsworth.
63. Richard I. Levin David S. Rubin: Statistics for Management, Seventh Edition, PHI, New-Delhi.
64. India Fact Sheet.2011 www.indiafactsheet.com,
65. Indian Securitas Market Review. Published by National Stock Exchange of India, 2011, Mumbai.
66. www.nseindia.com: Nse publications on stock market, 2011. Mumbai
67. SEBI, Mutual Funds 1996 Regulations, Mumbai, 2011
68. Association of Mutual Fund Institutions Regulation and Guidelines By SEBI, 2011
69. Financial Education Part A Published By SEBI 2010, Mumbai
70. The SEBI (Foreign Institutional Investors) Regulations 1995,
71. SEBI Allocation through bidding process, 2009,
72. Allocation through first come first serve process (FCFS): In terms of SEBI circular dated January 31, 2008.
73. Regulations by Securities and Exchange Board of India (Issue of Capital and Disclosure requirements) Regulations, 2011
74. http/www.sebi.gov SEBI website for public information site.
75. http//www.sebi.gov/ investorcomplaints and [email protected]
76. An Educated Investor is a Protected Investor by former Prime Minister, Shri Atal Bihari Vajpayee, on January 17, 2003
77. Rolling Settlement Guidelines/Working Hours: SEBI, December 28, 2010
78. Regulation Relates Fraudulent/Unfair Trade Practices SEBI (Prohibition of Insider Trading) (Substantial Acquisition of Shares and Takeovers) ,2011
79. Unit Linked Insurance Plan (ULIP) Guidelines by SEBI 2011, Mumbai
80. K Sekahr, SEBI Capital Issues & Listing Wadhawa &Publishing Company: Nagapur

57
International Journal of Research in Management & Social Science Volume 5, Issue 3 (I): July - September, 2017
ISSN 2322 - 0899
81. SEBI Annual Report 2010-11
82. www.indiabudet.nic.in. Economic Survey: Financial Intermediation and Market,2010-11
83. Indian Securitas Market Review. Published by nseindia.in, 2011, Mumbai.
84. Regulatory Action towards financial intermediaries SEBI Annual report, 2010-11
85. “Risk is at the centre of all investment decisions” (Bernstein, 2007)
86. Ken Yeoh. Investors Governance in Malaysian Stock Market ,2005
87. Dr. K.R.K. Sarma, Financial Markets & Service,Dr. BR Ambedkar Open Univesity, Hyderabad Aandhra Pradesh. P. 211.
88. ‘SCORES’SEBI Circular, Dated on September 2011
89. Nayak, M. K. (2010) ‘The nature of investor`s grievances and assessing the role of the Grievance redressal agencies’ ’spectrum e-journal of KBSCMR’ Volume 3, February 2010.ISSN 0973-1513, page 45
90. Chandra, A. (2008), Decision Making in the Stock Market: Incorporating Psychology with Finance Jamia MIllia Islamia Central University, National Conference on Forecasting Financial Markets of India, 2008.
91. Tripathi, V. (2008) ‘Investment Strategies in Indian Stock Market: A Survey’ in ‘journal of financial economics’ vol 32, PP. 663-682.

58
International Journal of Research in Management & Social Science Volume 5, Issue 3 (I): July - September, 2017
ISSN 2322 - 0899
M-COMMERCE: NEW GENERATION
Dr. Brijesh H Joshi B. L. Parikh College of Business Administration, Gujarat
ABSTRACT India is a fastest growing economy in 21st century. Today, technology are changing very fast and people are now become habituate with that. It is a positive side in the development of nation. India is a highest populated country and people are very busy in their routine life. They don’t have much time to communicate properly with their family members but mobile has change the scenario. Before many years ago, people used landline devices to communicate but now majority of the people have mobile devices. Mobile is not only helpful in communication purpose only but also it is very useful to business, education, government and too many others. In the year of 2016, 616 million users subscribed to mobile service in India, making it the second largest mobile market in the world. Almost half the country’s population now subscribe to a mobile services. It is predicted that, the total number of users will increase and reach up to 330 million by 2020 taking the penetration rate to 68 percent. India is now also the world’s second largest smartphone market, overtaking the US in the first half of 2016, with an installed base of 275 million as of June 2016.
The main goal of M-Commerce is to finalize that online business shopping experience is well suited to the smaller screen sizes that people see on smartphones and tablets. The current research paper is on “M-Commerce: The Next Generation”. The paper focused on current scenario of m-commerce and significant contribution in the online shopping activities.
Key words: M-commerce, Characteristics, Applications and Current Scenario,
INTRODUCTION India is a fastest growing economy in 21st century. Today, technology are changing very fast and people are now become habituate with that. It is a positive side in the development of nation. India is a highest populated country and people are very busy in their routine life. They don’t have much time to communicate properly with their family members but mobile has change the scenario. Before many years ago, people used landline devices to communicate but now majority of the people have mobile devices. Mobile is not only helpful in communication purpose only but also it is very useful to business, education, government and too many others. In the year of 2016, 616 million users subscribed to mobile service in India, making it the second largest mobile market in the world. Almost half the country’s population now subscribe to a mobile services. It is predicted that, the total number of users will increase and reach up to 330 million by 2020 taking the penetration rate to 68 percent. India is now also the world’s second largest smartphone market, overtaking the US in the first half of 2016, with an installed base of 275 million as of June 2016.
Today people uses a smartphone and also businesses has change the strategy of business. They are trying to attract the customers through mobile phones. Even online companies sell its products and giving services through customer’s mobile numbers. So today, new concept of business and commerce arise and it is known as Mobile Commerce (M-Commerce). Mobile e-commerce is a term that describes online sales transactions that use wireless electronic devices such as hand held computer network or laptops. These wireless devices interact with computer networks that have ability to conduct online merchandise purchases. Any type of cash exchange is referred to as an e-commerce transaction. Mobile e-commerce may also be known as mobile commerce.
The main goal of M-Commerce is to finalize that online business shopping experience is well suited to the smaller screen sizes that people see on smartphones and tablets. The current research paper is on “M-Commerce: The Next Generation”. The paper focused on current scenario of m-commerce and significant contribution in the online shopping activities.
LITERATURE REVIEW According to Sujata P. Deshmukh, PrashantDeshmukh and G.T. Thampi, The М commerce is the branch of E-commerce technology; in short we can say that, e-commerce transaction carried out using a mobile hand held devices. Today internet is the part of our daily life for communication, business transaction and market transaction, but India is a country of many different languages, only 4% of people know very well about the English language. If М-commerce uses local language, this will not only ensure quickly adoption by the customers but also will be an instant success.
Paul Budde’s paper, “Australia -Mobile Data -Mobile commerce and M-Payment” (2010), communication expert, provides the overview of mobile commerce in the Australia and identifies the impact factor that will be

59
International Journal of Research in Management & Social Science Volume 5, Issue 3 (I): July - September, 2017
ISSN 2322 - 0899
important for the future of the market transaction. Paul resist that, М-commerce market place in Australia is small compare to Asian market.
K.S. Sanjay (2007) states that, Mobile hand held technology is less cost included and also provides a better flexibility and effectiveness to its users. М-commerce is also a subset of E-commerce, but the difference lies that М-commerce uses wireless technology. So it gives flexible and convenient experience
(Gupta & Vyas, 2014) says that m commerce is at emerging level in India and it is complex to adapt. People have started using mobile not only to make phone call but use it for web access, chatting, surfing and also shopping. He has discussed about how m-commerce is developing in India and identified clear context and assistant mechanism. He had discussed about benefits and drawbacks of m-commerce in India, similarly as coin has two aspects so as every technology has.
M Commerce by Lehman Brothers, Ovum, and Forrester, the various devices had been discussed. He had also studied the sales and available users of smartphones in India which shows tremendous increase in the graph although it is new in India. According to him the growth drivers of m-commerce are Instant Connectivity, Personalization factor, mobility Factor, Immediacy, Localization etc.
NEW FACE OF COMMERCE M-commerce is the next revolutionary way of doing business after e-commerce, which is set to change the landscape of businesses. The term m-commerce came into existence in 1997 when it was first used by Kevin Duffey at the launch of the Global Mobile Commerce Forum organized in the UK, to mean “the delivery of electronic commerce capabilities directly into the consumer’s hand, anywhere, via wireless technology.
ONLINE SHOPPING PREFERENCE IN INDIA
Desktop Mobile Website Mobile Application
39% 19% 42%
Source: www.dazeinfo.com
M-commerce has come a long way from the first service delivered in 1997 (mobile-phone enabled Coca Cola vending machines were installed in the Helsinki area in Finland where the machines accepted payment via SMS text messages) and is driven by a combination of the current trend of electronic commerce (e-commerce) and the emerging developments in personal computing, which has technologically leaped forward from desktops to smartphones; dawning a new era of anytime, anywhere commerce through on-the-go internet/wireless connectivity.
CHARACTERISTICS OF M-COMMERCE Sr.No Particular Details
1 Mobility Users can carry their cell phones or other mobile devices easily
2 Reach Users can be contacted anywhere, any time

60
International Journal of Research in Management & Social Science Volume 5, Issue 3 (I): July - September, 2017
ISSN 2322 - 0899
3 Accessibility Information can be accessed on real-time basis 4 Convenience Devices facilitate storage of data and has wireless connectivity
5 Personalization Device owner has an exclusive access to the contents/services
6 Willingness People seem willing to pay for mobile services 7 Varied users Kids to teenage to youth to middle aged to senior people
8 Targeted Marketing
Knowing what the user prefers and where the user is located at any given time
Source: http://www.grantthornton.in
KEY REASONS FOR CONSUMER PREFERENCE FOR M-COMMERCE
EVOLVING M-COMMERCE OFFERING
Business engaged in retail, groceries, jewelry etc. Many reputed retail companies include Flipcart, Amazon,
Snapdeal, Myntra, Jabong etc.
Business also enegaed in transportation and logistics. Key companies like OLA, UBER, Lbibo etc.
Business also has connection with digital and mobile payement services. Key companies like Mobiwik, Free charge, Pay U Money etc.
Business engaged in Food groceries. Key companies like Swiggy, Halachef, Tiny Owl etc.
CONCLUSION The present research paper is focused on M-Commerce and it reflects that how m-commerce rapidly changes and growing very fast. The reason is easily availability of smartphones from the Indian market. M-commerce is game changer in the future online market. It is a wireless technology and it changing very fast. The enhance of 3G and 4G penetration have opened up new possibilities of m-commerce.
Today, majority of the people preferred to purchase the products from the online shopping and they give order by mobile applications. People also do online payment by mobile applications. People booked travel ticket by mobile applications. So, finally we can say that m-commerce is a new generation and ultimately it is the future of India.
61
International Journal of Research in Management & Social Science Volume 5, Issue 3 (I): July - September, 2017
ISSN 2322 - 0899
REFERENCES Sujata P. Deshmukh, Prashant Deshmukh and G.T. Thampi (2013), “Transformation from E-commerce to
M-commerce in Indian Context”, International Journal of Computer Science Issues, Vol. 10, Issue 4, No 2, July 2013
Satinder Niharika (2015), The Impact Of Mobile Commerce In India: A Swot Analysis, pp: 1-11.
Nisha Chanana Sangeeta Goele, Future of E-Commerce in India, International Journal of Computing & Business Research Issn (Online): 2229-6166
WEBSITES http://www.grantthornton.in/globalassets/1.-member-firms/india/assets/pdfs/m-commercethe-next-
generation-commerce.pdf
http://www.hongkiat.com/blog/why-m-commerce-important/
https://www.techopedia.com/definition/1540/mobile-e-commerce-m-commerce
https://www.gsma.com/mobileeconomy/india/

62
International Journal of Research in Management & Social Science Volume 5, Issue 3 (I): July - September, 2017
ISSN 2322 - 0899
CONSEQUENCES OF DOMINANCE BY AN INTERESTED PERSON IN JUDICIAL PROCEEDINGS IN INDIAN COURTS : A CRITICAL STUDY
Dr. Dhananjay Avasarikar Professor, Suryadatta Institute of Management and Mass Communication, Pune.
ABSTRACT It is noticed on a number of occasions that a person interested in a specific matter, which is initially discussed and subsequently put to vote, participates in the proceedings of a meeting. Thereafter, by misusing or abusing his position during the course of the meeting, he succeeds in getting the matter decided in his favor, as per the rule of majority. This has resulted in many fields, Politics, Corporate, Education and Corporation, to mention a few. However, this is, no doubt, not only unethical and illegal but it is also against equity and natural principles of justice and fairness. In such situations justice is not obtained in real sense of the term.
In this Research Paper, the Researcher has attempted, quite honestly, to study the Consequences of dominance by an Interested Person in the Judicial Proceedings in Indian Courts. In this Research Paper, there is a detail description of a service matter which resulted in Indian Courts.
INTRODUCTION It is noticed on a number of occasions that a person interested in a specific matter, which is initially discussed and subsequently put to vote, participates in the proceedings of a meeting. Thereafter, by misusing or abusing his position during the course of the meeting, he succeeds in getting the matter decided in his favor, as per the rule of majority. Even if the chairman of the meeting and some other members are well aware about the vested interest of the concerned person, deliberately, they do not, at all, object and allow the proceedings of the meeting to be carried forward.
This has resulted in many fields, Politics, Corporate, Education and Corporation, to mention a few. However, this is, no doubt, not only unethical and illegal but it is also against equity and natural principles of justice and fairness. As a matter of fact, such practices lead to unnecessary harassment of the suppressed or minority class at the hands of majority or dominant people. In other words, in such situations justice is not obtained in real sense of the term.
REVIEW OF LITERATURE For undertaking Review of relevant Literature, two sections from The Companies Act, were studied, in detail, in order to ascertain the provisions in this Act as regards ‘Interested Person.’
The following two sections, namely,
(i) S. 299, stating about the ‘Disclosure of Interest by the Director,’ and
S. 300 stating about the ‘Interested Director not to Participate and vote in Board’s Proceedings,’
from the Act were found out, which throw light on the topic of the Research.
(i) Disclosure of Interest by the Director – S. 299, Companies Act Every director of a company who is directly or indirectly, interested or concerned in a contract or a proposed contract entered into or to be entered to, by or on of behalf of the company, shall disclose the nature of his interest or concern at a meeting of Board of Directors. In the case of a proposed contract, such disclosure shall be made by a director at the meeting of the Board at which the question of entering into the contract or agreement is first taken into consideration. In the case of any other contract or arrangement, the required disclosure shall be made at the first meeting of the Board held after the director becomes interested in the contract. For this purpose, the Director shall give a notice to the Board to this effect. This is supposed to be sufficient disclosure of interest or concern in relation to any contract so made. Any such general notice shall expire at the end of the Financial Year in which it is given. But it may further be renewed. The notice shall not be of any effect unless it is given at the meeting of the Board or the director concerned takes reasonable steps to ensure that it is brought up and read at the first meeting of the Board after it is given.
(ii) Interested Director not to Participate and vote in Board’s Proceedings - S. 300, Companies Act. A director of a company must not place himself in a position in which his personal interest conflicts with his duty. (Parker V. Mckenna, (18714) 10 ch. App. 96) This kind of conflict will invariably arise when a director is personally interested in a transaction entered into with or by the company. He must not take part in the discussion of or vote as a director on any contract or arrangement in which he is directly or indirectly interested

63
International Journal of Research in Management & Social Science Volume 5, Issue 3 (I): July - September, 2017
ISSN 2322 - 0899
unless authorized by the company’s articles. In case he votes, his vote would not be counted, also, his presence would not be counted while deciding the quorum for the transaction of business at a Board meeting.
During the course of Review of pertinent Literature, the Researcher also came across a Case Precedent, from the field of Politics, in which one of the Chief Ministers of a state was interested. However, in order to evade the possibility of controversy, neither the name of the Minister is disclosed nor the precedent is included in this Research Paper
RESEARCH PAPER OBJECTIVE The following is the Objective of the Research Paper. 1. To Study the Consequences of Dominance by an Interested Person in the Judicial Proceedings in Indian
Courts RESEARCH PAPER SCOPE The Practical Scope of the Research Paper extends to the critical Study of the consequences of Dominance by an Interested Person in the Judicial Proceedings in the Indian Courts.
RESEARCH PAPER METHODOLOGY The following Research Methodology is adopted for writing this Research Paper. 1. The Research Paper is based exclusively on the Secondary Data.
2. Review of pertinent Literature is done to gather secondary Data for the Research in order to understand, in depth, the consequences of Dominance by an Interested Person in the Judicial Proceedings in the Indian Courts.
3. After Review of Literature, the Researcher came across different cases of ‘Interest’ in different fields, as mentioned above. However, for the sake of simplicity and convenience, it was decided to put forward only a case precedent from an Educational field.
TECHNIQUE AND TOOL USED FOR SECONDARY DATA COLLECTION A precedent is referred to, in this Research Paper in order to reveal several consequences of Dominance by an Interested Person in the Judicial Proceedings in the Indian Courts.
SOURCES OF SECONDARY DATA For this Research Paper, the sources of Secondary Data include only a book. The details about the book are included in the Section of ‘Categorized Bibliography,’ which is located towards the end of the Research Paper.
CASE PRECEDENT An Assistant Professor working in one reputed Institute affiliated to one of the Statutory Universities was terminated on certain grounds in a meeting in which the Chairman, President and some other members representing the Institute were present. First, as per the standard legal procedure, he filed an appeal before the Hon. Presiding Officer, University and College Tribunal. After one year or so, here, it was held that that it has no Jurisdiction to decide various Questions of Laws rose in this matter.
As per the Maharashtra Universities Act, 1994, the matters for which the Hon. Presiding Officer, University and College Tribunal has no Jurisdiction, the Hon. President, Grievance Committee, University has the Jurisdiction. This is a statutory body constituted as per the provisions of the Maharashtra Universitites Act. Thus, thereafter, the Assistant Professor aggrieved by the Judgment of the Hon. Presiding Officer, University and College Tribunal filed his complaint in the prescribed form while paying the requisite fee. Simultaneously, he also filed a writ Petition in the Hon. High Court, against the judgment of the Hon. Presiding Officer, University and College Tribunal.
As per the provisions of the Maharashtra Universities Act, 1994, the Grievance of the complainant should be settled forthwith preferably within the period of six months from the date of filing of the complaint. In the instant case, the Grievance Committee did not decide the complaint within the statutorily fixed time of sis months. Aggrieved by this inaction, the complainant was compelled to file another Writ Petition in the Hon. High Court. When this Writ Petition came before the Hon. High Court for admission, the petitioner’s advocate attracted Court’s attention on the earlier Writ Petition also. The Hon. Judge ordered to club both the Writ Petitions with the permission of the Hon. Chief Justice, High Court.
After the clubbing, as described, was over, when the matter was heard in the Hon. High Court, it was directed to the Hon. President, Grievance Committee, University, to be decided preferably within six weeks. In-spite of this direction, the matter was not decided within the period of six weeks. Again aggrieved by this indecision, the Assistant Professor had to file a Contempt Petition in the Hon. High Court against the President, Grievance

64
International Journal of Research in Management & Social Science Volume 5, Issue 3 (I): July - September, 2017
ISSN 2322 - 0899
Committee, University. After patiently listening to the Petition, the Contempt was accepted by the Hon. High Court and on specific request of the advocate of the Hon. President, Grievance Committee, University, it sanctioned the period of fifteen days to the decide the matter.
Only because of the fear and tension of the attempted or contemplated arrest, resulting from consequent indecision, the Hon. President and other members of the Grievance Committee, University, decided the matter forthwith, strictly on the basis of merit in favor of the Assistant Professor and set aside the termination of the Assistant Professor. At this stage, it is obligatory to learn the legal nature or character of the constitution or composition of the Grievance Committee, University. As a matter of fact, this committee is, no doubt, a judicial body, but, it is a quasi-judicial body. Thus, because of its secondary legal charter, it is only a Recommendatory Body and not a Decisive Body in its legal scope, practical nature and actual consequence. Its decision, therefore, carries legal weight-age only after its decision is fully approved by the Management Council, which is another Statutory Body, constituted under the provisions of Maharashtra Universities Act.
In the meeting of the Management Council, the decision of the Grievance Committee was reversed. Again aggrieved by this decision, the Assistant Professor had no option but to prefer an appeal in the Hon. High Court against this decision. It was emphasized in the Hon. High Court that one of the dominant members of the Management Council was highly interested in the matter, because he was none other than the Chairman of the Institute himself who was present in a meeting in which the decision of termination of an Assistant Professor was, in fact, arrived at. In other words, a person who was a party to arrive at a specific decision –termination of an Assistant Professor, in one meeting in a specific position as an Institute Chairman was the same person who ratified-confirmed the decision in another meeting of Management Council in a different position as a member. A person who advocated for termination of an Assistant Professor in one meeting as a chairman decided against reinstatement, in another meeting as a member, when the decision of termination was reversed by another Statutory Body- Grievance Committee, University. Subsequently, the Hon. High Court upheld the decision of the Grievance Committee and reversed the decision of the Management Council not only on the basis of merit of the Assistant Professor but also on the ground of ‘Vested Interest’ of the chairman.
QUESTIONS OF FACT IN CASE PRECEDENT After going through the Case Precedent, as above, quite critically, especially because of the Institute Chairman’s attendance at the meeting when there was a matter in which he was interested not only institutionally but also personally, to be discussed, the following unanswered, yet, inevitable Questions of Fact crop up. (a) Was the Chairman of the Institute of the view that the Assistant Professor would never ever come to know
about his interest and subsequent domination in the meeting? (b) During the course of the meeting, did the Chairman of the meeting of the Management Council not suspect
about a fact that the Chairman of the Institute is representing the interest of his Institute and not of the Assistant Professor, which he is supposed to do in the capacity a member of the Management Council?
Alternatively, is it that the chairman of the meeting of the Management Council did very well know about the illegality regarding Institute Chairman’s attendance in the meeting, but, simply he neglected this fact and protected the interest of the ‘Interested Person’, may be for some direct or indirect benefit or gain?
(c) Why both the Chairmen, of the Institute and at the meeting of the Management Council, have not cared for the career of the Assistant Professor?
Had at least one out of the two had reasonably cared for him; it could really have saved tremendous hardship, time and money of the Assistant Professor which he wasted for judicial proceedings.
RESEARCHER’S OPINION ABOUT ‘INTEREST’ In this Research Paper, only a precedent as a Representative Precedent is put forward to exhibit the impact of ‘Interest’ in any Judicial Proceeding. In practice, there may be several such cases happening. In the present case, when the chairman was deeply interested in the matter to be decided in a meeting of the Management Council, he should not have attended the said meeting. Thereafter, he might have dominated the scene while reversing the decision of the Grievance Committee and converting the decision not only favorable to him, personally but also favorable to his Institute.
Had the interested Chairman not attended the meeting of the Management Council, it could have maintained the decision of the Grievance Committee of reinstatement of an Assistant Professor and he would not have required preferring an appeal, consequently in the Hon. High Court.
65
International Journal of Research in Management & Social Science Volume 5, Issue 3 (I): July - September, 2017
ISSN 2322 - 0899
RESEARCHER’S RECOMMENDATION FOR CHAIRMEN On the basis of deep scrutiny of some other Case Precedents, in general and the above Case Precedent in particular, besides overall observation about the functioning of several chairmen in different meetings; their casual attitude and approach to conduct the meeting, the Researcher would like to recommend, as under.
The chairman of each and every meeting, irrespective of the fact whether he is acting in such a capacity in an Educational Institute, Company, Corporation, etc., at the start of the meeting itself, should strictly check the interest of all the members present at and forming the part of the meeting. He should proceed with the transaction of business at the meeting only after he is fully convinced about a fact that none of the members present thereat are interested in either of the matters to be discussed in the meeting. He must ask the interested members, if any, to leave the meeting hall, at least, for the time when the matter in which they are interested is discussed and voted at the meeting.
If this Recommendation is strictly followed in true spirit by the chairman of any meeting, as mentioned above, at last, it would definitely help to avoid the hardship that would be caused to the minority or the suppressed.
RESEARCH PAPER LIMITATIONS The following are the limitations of the Research Paper. 1. Only a Precedent is referred to, in this Research Paper for want of its length in order to reveal several
consequences of Dominance by an Interested Person in the Judicial Proceedings in the Indian Courts,
2. In order to maintain confidentiality of the legal matter as it is still pending in the Hon. Supreme Court for final judgment, the names of the Respondents and the Petitioners are deliberately not disclosed in the Research Paper.
3. As the study for this Research Paper is fully based on Secondary Data, all the limitations of Secondary Data have direct and deep impact on various views formed, questions of facts raised, inferences arrived at and recommendations put forward.
4. As the Research Paper study is based on Researcher’s own experiences of some other Court cases, personal views and opinions, intellectual agreement with all the views and opinions is ideally not expected, in practice.
SCOPE FOR FUTURE RESEARCH During the course of the study of this Research Paper, the researcher found out that there is an ample scope and adequate potential for research in future for the following topics related to
1. Measures undertaken to Deal with an Interested Person in a Meeting – An Empirical Study
Foot Notes 1. As a precedent described in this Research Paper predates back to the year 2017, the provisions of
Maharashtra Universities Act, 2017 are not applicable. Thus, for the precedent, the provisions of Maharashtra Universities Act, 1994 were applicable.
2. In order to evade possible controversy, Case Precedents from the fields of Politics, Corporate or Corporations are not included in this Research Paper.
BIBLIOGRAPHY BOOK 1. Lawani (Dr.) B. T. (Compiler), 2007, Social Justice and Empowerment, Om Publications, India, New Delhi,
edn1.

66
International Journal of Research in Management & Social Science Volume 5, Issue 3 (I): July - September, 2017
ISSN 2322 - 0899
EMPOWERMENT AND WOMEN ENTREPRENEURSHIP IN TRIBAL AREA [A CASE STUDY FOR INDORE DIVISION OF MP]
Dr. Rajendra Singh Waghela Profressor, Govt. Arts & Commerce College, Indore
ABSTRACT With sweeping economic reforms since 1990s, the major challenges as well as opportunities in the Indian economy has created an entirely new concept of development in many areas. Development of women entrepreneurship on rural tribal area is of great significant. With free economy and market economy creating ripple globally, the entrepreneurship among women has become the need of the hours. Women entrepreneurship development should be viewed as a way of not only saving the problem of unemployment factor, but also of overall economic and social advancement of the rural tribal area. Rural development without participation of women is meaningless. Women entrepreneurs are those who explore new paths for involvement and contribution women entrepreneurship have been making a significant impact in all segment of the economy. The paper attempts to analyses the challenge and opportunities of women entrepreneurship in rural area of western Madhya – Pradesh. The western Madhya Pradesh is of mainly dominated by poor rural tribal and along with modern innovation techniques are prevalent among them, hence it is of great importance to conduct a systematic study and analyze the effect of the above mention in such areas in order to establish the guidelines for the development of rural entrepreneurship. The objective of the study is to examine the involvement of these rural women entrepreneurs. The data has been collected through random sampling of 100 women entrepreneurs in the tribal districts of Western Madhya- Pradesh. The significance of the proper hypothesis has been established statistically. The result revealed that the women entrepreneurs of the study area, have a high need for achievement, ability for decision making and future planning but also experience various challenges like, low risk taking, low education level and low mobility. There is also a need for effective research for locating gaps in emerging needs of women entrepreneurship. The implication of the result of this study is bi-fold: firstly it acts as a guideline to the government machinery in order to re-orient their entrepreneurial strategies in the rural area and secondly, it acts as a mirror of the various NGO’s and social organizations, working in the field, to review their policies and programmes for the tribal rural development.
Key words: Need for achievement, Risk taking ,Tribal development, women entrepreneurs.
INTRODUCTION Women entrepreneurship is consider to be an important factor for the development of tribal area. The role of women worldwide is undergoing a tremendous change. Women empowerment is recognized universally, as a key element to achieve progress in all areas. In developing countries like, India, economy could play a vital role in coping with various socio economic problems. Widespread unemployment is one of the gravest problems confronting the Indian economy. The problem of unemployment can not be resolved, unless the tribal women are trained and involved in entrepreneurship oriented jobs.
Women contribution almost half of the tribal population in the tribal areas. Women entrepreneurship has a great potential in empowering women and transforming society. The sustainable development of tribal area is possible only if each rural household is provided with profit oriented employment. In this regard, women entrepreneurs play un important role to generate additional income and to create move employment in tribal economy. So an attempt can been made to analyze some of the significance aspects of women entrepreneurs in tribal areas.
NEED FOR WOMEN ENTREPRENEURSHIP Entrepreneurs have played and playing a crucial role in the socio-economic development of tribal areas. According to Gunderson-"Not resources, not protestant ethic but entrepreneurship explains economic growth", The availability of entrepreneurial skills is an vital assets and an instrument for economic growth. Entrepreneurship among women in the tribal economic, is significant on the following grounds - (a) Proper utilization of available human resources.
(b) It promotes equal opportunities and human dignity.
(c) It makes women economically self dependent and provides for new challenges for self-fulfillment.
(d) It provide more status and respect in the society and raises self confidence.
(e) It accelerates the pace of tiny, collage and small industries development.

67
International Journal of Research in Management & Social Science Volume 5, Issue 3 (I): July - September, 2017
ISSN 2322 - 0899
(f) It brings special qualities in women such as innovative approach, dedication, risk taking and patience in the work place.
CHARACTERISTICS OF TRIBAL WOMEN ENTREPRENEURS Today women have made their mark in different walk of life and are completing successfully despite the social economic and psychological differences. Women have a strong potential in various aspects of economic growth in tribal areas. The researchers found the following characteristics by staying in tribal areas for a long time and by interacting with them from time to time - (1) Tribal women like to work in groups and also like to move together.
(2) They have strong organizational skills.
(3) They have physical stamina, therefore they can work for longer time.
(4) Tribal women are usually risk takers and handling the economic uncertainties.
(5) They think of their daily need. Therefore they sell their goods even at lower price.
INTRODUCTION TO TRIBAL AREA IN WESTERN M. P. Indore division is a tribal dominated area in western Madhya Pradesh. The division has eight districts, out of these, five districts - Alirajpur, Jhabua, Dhar, Burwani and Khargone are known as tribal districts. The majority of population in these districts belongs to the scheduled tribes. The main tribes in these areas are Bhills and Bhilallas. Alirajpur and Jhabua districts are highly tribal clusters. The majority of population depends upon agriculture as the source of livelihood. Low productivity, low income and unemployment are the basic indicators of the tribal areas. Due to this, from six to ten months in the year, subalterns go for securing employment in urban areas. So, there is a drastic need for expanding and developing the existing entrepreneurial obstacles to exploit the multiple opportunities available in the tribal areas.
OBJECTIVES OF THE STUDY (1) To study the factors affecting the development of women entrepreneurs in tribal areas.
(2) To study the role of women for creation of assets.
(3) To study the interest of women entrepreneurs in tribal areas.
(4) To measure the economic success of the sample respondents.
(5) To study the challenges coming in the development of women entrepreneurs.
(6) To identity the opportunities for the women entrepreneurs.
(7) To establish the guide line for the success of women entrepreneurship.
HYPOTHESIS The hypothesis of the present study is that there are many challenges for the department of women entrepreneurship in the tribal areas.
METHODOLOGY The study is based on descriptive survey. An interview schedule used for collection of information from women entrepreneurs. Question asked to respondents such as determining factors of women entrepreneurs, problems faced by women, opportunities available for tribal areas etc. The primary data collected from women entrepreneurship of tribal district Alirajpur and Jhabua of westerns Madhya Pradesh. Alirajpur and Jhabua are highly tribal dominated areas, in western M.P., in which Alirajpur district has 93% of scheduled tribes and Jhabua has 83% schedule tribes. The sample size was 100 women entrepreneurs actively engaged in agriculture and allied activities, cottage, small and household industries and service sectors, in which 50 respondents from alirajpur and 50 from Jhabua, were interviewed. The primary data analysis has been arrived at with the help of statistical tools such as percentage, chi-secure analysis.
ANALYSIS OF SURVEY DATA An entrepreneurs is one of the boric segments of economic growth. The emergence of women entrepreneurs and their contribution to the tribal economic is quite visible. The number of women entrepreneur in tribal areas, The primary data analysis has been arrived at with the help of statistical tools such so percentage, chi-square analysis.

68
International Journal of Research in Management & Social Science Volume 5, Issue 3 (I): July - September, 2017
ISSN 2322 - 0899
ANALYSIS OF SURVEY DATA An entrepreneur is one of the basic segments of economic growth. The emergence of women entrepreneurs and their contribution to the tribal economy is quite visible. The number of women entrepreneur has grown over period of time in tribal areas. To know the information about women entrepreneur in tribal areas, the primary data were collected and analyzed here.
AGE GROUP WIPE Age group wise analysis of respondents shows that 48 percent respondents were 35-45 age group, while 24 percent were 30-35 age group. District wise wipe data shows that 54 percent respondents in Jhabua district were 35-45 age group while in Alirajpur district were 42 percent. Only 8 percent were 50 and above age group. It has been observed that the work force is mainly the young.
TABLE – 1: Respondent Age-Group District Age group Total
18-30 30-35 35-45 45-50 50 and above Alirajpur 5 14 21 8 2 50 Jhabua 4 10 27 3 6 50 Total 9 24 48 11 8 100
Source : Primary Data
SOCIAL CATEGORY WISE The survey data shows that 50 percent respondents were schedule tribe, 28 percent were OBC's and 17 percent were general category. It is clear that schedule tribes entrepreneurs play greater role in tribal areas.
TABLE-2: Social category of Respondents District Category Total
ST SC OBC General Alirajpur 32 2 13 3 50 Jhabua 18 3 15 14 50 Total 50 5 28 17 100
Sources : Primary data
CLASSIFICATION OF RESPONDENT'S BUSINESS Classification of respondents has been done according to their business under three sectors such as agriculture, cottage and small industries and service sectors. The data shows that 46 percent respondents were working in service sectors, 34 percent in tiny, cottage and small scale industries and only 20 percent were engaged in agriculture and its allied activities. It is oblivious that women are highly preferred to work in service sectors such as green marketing, beauty parlor, Boutique , tailoring, Jewellery making etc.
TABLE-3: Classification of Respondent Business District Agriculture Tiny/ Small Industries Service Sector Total
Alirajpur 12 14 24 50 Jhabua 8 20 22 00 Total 20 34 46 100
Source : Primary data
FACTORS AFFECTING WOMEN ENTREPRENEUR Question asked through likared method about the factors affecting the women entrepreneur success, more than 50 percent respondents agree and strongly agree with personal factors, need for achievement, risk taking are innovation, social and cultural and economic factors. It is obvious that personal, social, cultural and economic factors strongly affect the women entrepreneurial behavior which contributes to entrepreneur’s growth and success.
TABLE-4: Factors Affecting Entrepreneurial Development Factors Strongly
Agree Agree Neutral Disagree Strongly
Disagree 1. Need for achievement 44 28 10 7 11 2. Risk tanking 37 25 25 10 3 3. Innovation 23 38 19 12 8

69
International Journal of Research in Management & Social Science Volume 5, Issue 3 (I): July - September, 2017
ISSN 2322 - 0899
4. Training and education 41 35 20 3 1 5. Economic factor 51 29 5 9 6 6. Social and cultural 24 24 4 18 10 7. Efficiency and communication 18 28 27 14 13
Sources : Primary data
CHALLENGES FOR WOMEN ENTREPRENEURSHIP The women entrepreneurs faced various problem in tribal areas. Such as social barriers. Problem of finance, marketing and information, large of infrastructure and practical knowledge. To know the respondents opinion about these, five scale likert method is used the data shows that 70 percent respondent agrees or strongly agrees with the inadequate market coverage. More than 50 percent respondents feel that shortage of finance, raw materials, power & skill were main challenging for women entrepreneurs. It is obvious that women entrepreneurs are facing challenges in tribal areas.
TABLE-5: Respondent Opinion about Challengers for Entrepreneur Development Challengers Strongly
Agree Agree Neutral Disagree Strongly
Disagree 1. Lack of market coverage 42 28 14 12 4 2. lack of finance 25 32 13 15 12 3. Shortage of Raw material 32 40 3 15 12 4. Shortage of power 45 33 10 12 0 5. Inefficient management 12 19 49 10 12 6. Lack of skill 13 37 21 18 11 7. Lack of entrepreneur ability 8 21 42 25 4 8. Lack of training facilities 24 29 27 15 5
Sources : Primary data
TESTING OF HYPOTHESIS There are many challenges for the department of women entrepreneurship in the tribal areas.
The above hypothesis has been examined through Chi-square test. The various challenges for women entrepreneurial, have been considered for Chi-square. The calculated value of x2 is 9.13. The table value of x2, at 7-1= 6 degree of freedom and 5 percent significance level is 12.59 since, the table value of x2 is more than the computed value. Hence there are many challenges for the department of women entrepreneurship in the tribal areas.
SUGGESTION 1. Women entrepreneurs should be provided with achievement motivation training and promotional support.
2. Marketing intelligence should be made available to women entrepreneurs.
3. The development of infrastructure in tribal areas such as road, communication, electricity etc. will promote for women entrepreneurs.
4. To provide more practical knowledge for improving the operation efficiency of women entrepreneurs.
5. To secure concession, subsidies and more assistance to women entrepreneurs.
6. To create environment for development of self confidence and hope among women entrepreneurs.
CONCLUSION The study reveals that there is a vast sense of women entrepreneurship development in tribal areas. It is also observed that socio-economic environment of tribals and the opportunities available in the tribal area also influence women entrepreneurship significantly. There is a need for three tier efforts for the development of women entrepreneurs in tribal areas first to create entrepreneurs environment including safety sense among women in tribal area, second changing social attitude towards women and third, to provide proper infrastructure in tribal area.
REFERENCE 1. Naik Sumangala (2009) Need for developing rural women entrepreneurs, Rural entrepreneurial and
employment, Indus valley publication PP 122-128.
2. District statistical Book, Jhabua, Alirajpur District.

70
International Journal of Research in Management & Social Science Volume 5, Issue 3 (I): July - September, 2017
ISSN 2322 - 0899
2. Jayanti, C (2009), Rural women entrepreneurs in the new wave economic development, Indus valley publication PP 118.
3. Verma SB, Singh Mahendra (2009) Rural women entrepreneurs, Indus valley publication PP 117.
4. Pandey Manas (2011) development of women entrepreneurship challenges and opportunities, The Indian Journal of commerce vol 64, No.-2 April-May PP 117.
5. Waghela Rajendra Singh (2011) – Determining factors influencing entrepreneurial growth in tribal area. STM Journal.
6. Sharma, Virendra Prakash (2004) Research methodology Panchsheel Prakashan, PP 166

71
International Journal of Research in Management & Social Science Volume 5, Issue 3 (I): July - September, 2017
ISSN 2322 - 0899
A STUDY ON CONSUMER BUYING BEHAVIOUR OF MARUTI SUZUKI FOUR WHEELER
Patel Kalpeshkumar Trikamlal Assistant Professor, Shree G. N. Patel Commerce College, Nanikadi, Gujarat
ABSTRACT The automotive industry in India is one of the largest automotive markets in the world. It had previously been one of the fastest growing markets globally, but is currently experiencing flat or negative growth rates. The majority of India's car manufacturing industry is based around three clusters in the south, west and north. The southern cluster consisting of Chennai is the biggest with 35% of the revenue share. The western hub near Mumbai and Pune contributes to 33% of the market and the northern cluster around the National Capital Region contributes 32%. Kolkata with Hindustan Motors, Noida with Honda and Bangalore with Toyota are some of the other automotive manufacturing regions around the country. Maruti Udyog Limited was established in February 1981, though the actual production commenced only in 1983. It started with Maruti Alto 800, based on the Suzuki Alto k10 car which at the time was the only modern car available in India. In the face of the multitude in fundamental inner and outer changes in the automotive environment it is necessary to identify economic and social drivers.
Key words: Consumer Buying Behaviour
INTRODUCTION The automotive industry in India is one of the largest automotive markets in the world. It had previously been one of the fastest growing markets globally, but is currently experiencing flat or negative growth rates. India's passenger car and commercial vehicle manufacturing industry is the sixth largest in the world, with an annual production of more than 3.9 million units in 2011. According to recent reports, India overtook Brazil to become the sixth largest passenger vehicle producer in the world. Throughout the course of 2011 and 2012, the industry grew 16-18%, selling around three million units. In 2009, India emerged as Asia's fourth largest exporter of passenger cars, behind Japan, South Korea, and Thailand. In 2010, India beat Thailand to become Asia's third largest exporter of passenger cars.
The majority of India's car manufacturing industry is based around three clusters in the south, west and north. The southern cluster consisting of Chennai is the biggest with 35% of the revenue share. The western hub near Mumbai and Pune contributes to 33% of the market and the northern cluster around the National Capital Region contributes 32%. Kolkata with Hindustan Motors, Noida with Honda and Bangalore with Toyota are some of the other automotive manufacturing regions around the country.
In 2011, there were 3,695 factories producing automotive parts in all of. India. The average firm made US$6 million in annual revenue with profits close to US$400 thousand. The first car on India's roads in 1897. Until the 1930s, cars were imported directly, but in very small numbers.
The first car showroom in Secunderabad
HISTORY OF MARUTI SUZUKI Maruti Udyog Limited was established in February 1981, though the actual production commenced only in 1983. It started with Maruti 800, based on the Suzuki Alto K10 car which at the time was the only modern car available in India. Its only competitors were Hindustan Ambassador and Premier Padmini. Originally, 74% of the company was owned by the Indian government, and 26% by Suzuki of Japan. As of May 2007, the

72
International Journal of Research in Management & Social Science Volume 5, Issue 3 (I): July - September, 2017
ISSN 2322 - 0899
government of India sold its complete share to Indian financial institutions and no longer has any stake in Maruti Udyog.
REVIEW OF LITERATURE Balakrishnan Menon, Jagathy Raj V. P. (2012), shows that due to price differences in Gasoline and Diesel, about one third of the car owners was having diesel vehicles. The result showed that about one seventh of car for the city drive for family usage, while using the second car for office and business usage. Foreign brand cars show clear preference in the Kerala car market.
Ramita Verma, Shubhkamana Rathore (2013), studied the luxury car segment of India. Researches and studies have revealed that the luxury car market is growing at a steady speed of 25 per cent per annum with more and more numbers of luxury cars entering the Indian car market. Luxury cars are preferred by HNI (High Net worth Individuals). HNI wants to differentiate themselves from crowd for various reasons.
INDIAN SCENARIO Aim at doing things a bit differently and plan to come up with multiple forms of reads, reviews and stories not only on market trends and new product ranges, but also on the journey of automobiles in India from an embryonic industry in the early sixties to potentially becoming the sixth largest Automobile manufacturer in the world by 2015. A number of automotive designs institutes have been conceived and they’ve come up with exclusive training programs for students, offering to provide them with various skills like sketching, rendering, utilising digital platforms and tools to communicate their ideas and concepts to well trained faculties from around the world.
OBJECTIVE OF THE STUDY To find out the consumer buying behaviour of Maruti Suzuki four wheeler.
HYPOTHESES Ho: There is a significant difference in response to Budget for purchasing a new car of Maruti Suzuki various
income groups.
H1: There is no significant difference in response to Budget for purchasing a new car of Maruti Suzuki among various income groups.
Ho: There is a significant difference in response on various models of Maruti Suzuki cars between various occupation groups.
H1: There is no significant difference in response on various models of Maruti Suzuki cars between various occupation groups.
RESEARCH METHODOLOGY DATA COLLECTION Primary data The primary data is that which details they collect first time from the market and also use first time in the research. To collect the primary data, questionnaire was prepared and showing information in tabular form is primary data.
Secondary data Secondary data are those data which are already collected by someone for some purpose and are available for the present study. Secondary data consist of published material, or any other reference material which can be useful in the particular project.
RESEARCH APPROCH I adopted survey approach for this study because it is best suited for describing and it is only concerned with getting practical knowledge. I made face to face interaction with the respondents and fill up the questionnaire.
1. Research instrument My research is based on structure Questionnaire. I have used open ended and close ended questions.
2. Sampling technique I have used non probability sampling technique, in that convenient sampling was used in project study, because it was convenient with regards to time, cost and place of the research and also for analysis of the data.
3. Sampling Unit The sample units of my research are a consumer behaviour regarding Maruti Suzuki car in Kadi city.

73
International Journal of Research in Management & Social Science Volume 5, Issue 3 (I): July - September, 2017
ISSN 2322 - 0899
4. Sample size I have taken sample size of 118 respondents. The sample size of respondents is decided by considering 95% significance level.
5. Sample Method I have used Non-probability Sampling method in my research.
6. Research Design I have used Descriptive Research as it describes some market characteristics of the auto mobile market and the consumer behaviour regarding the auto mobiles of the Maruti Suzuki Company among the respondents.
LIMITATIONS OF THE RESEARCH The study is restricted only to the Kadi city. So, the result may not be applicable to the other areas. Limited sampling size. The time factor was also limited. The availabilities of the information were limited. The knowledge about the products and company were also limited. HYPOTHESES TESTING BY ANOVA ONE-WAY Ho: There is a significant difference in response to Budget for purchasing a new car of Maruti Suzuki various
income groups.
H1: There is no significant difference in response to Budget for purchasing a new car of Maruti Suzuki among various income groups.
Budget and various income groups
Sum of Squares Df Mean Square F Sig.
Related Hypothesis
Between Groups 15.265 5 3.053 2.44 0.125 H0:1 Within Groups 146.25 117 1.25
Total 161.515 122
H0 : A one-way ANOVA was conducted to the significant difference in response to Budget for purchasing a new car of Maruti Suzuki among various income groups.
There is a significant difference in response to Budget for purchasing a new car of Maruti Suzuki various income groups at the p>0.05 level for two conditions [F=2.44, p=0.125], so here H0 is accepted.
HYPOTHESES TESTING BY ANOVA ONE-WAY Ho: There is a significant difference in response on various models of Maruti Suzuki cars between various
occupation groups.
H1 : There is no significant difference for response on various models of Maruti Suzuki cars between various occupation groups.
Various models of Maruti Suzuki cars and various occupation groups
Sum of Squares Df Mean Square F Sig.
Related Hypothesis
Between Groups 8.256 3 2.752 2.202 0.654 H0:2 Within Groups 146.25 117 1.25
Total 154.506 120
H0 : A one-way ANOVA was conducted to the significant difference in response on various models of Maruti Suzuki cars between various occupation groups.
There is a significant difference in response on various models of Maruti Suzuki cars between various occupation groups at the p>0.05 level for two conditions [F=2.202, p=0.654], so here H0 is accepted.
FINDINGS In recent duration Maruti Suzuki is becoming more and more popular in the automobile industry among
the people.

74
International Journal of Research in Management & Social Science Volume 5, Issue 3 (I): July - September, 2017
ISSN 2322 - 0899
The Maruti Suzuki Company has produced many cars since last 40 year. But the swift & Wagon R cars are more preferable among the customers.
I found that, when the customers buy a new car the following main feature are considering like look, mileage, easy availability, price, color, space. In addition to that consumers prefer features like price, easily available and mileage the most.
People having a higher budget can have purchase different categorized cars of Maruti Suzuki like Ertiga, Ciaz, people having a medium budget can have purchase Wagon R, Swift & DZire, people having low budget can have purchase Alto 800. Occupation is the reason behind the purchasing habits of the car.
When the customers buy a new car the following main facilities are considered by them. The three facilities are more preferable that discount on the stereo system, spare parts, and accessories by the consumers.
CONCLUSION After the completion of research I have seen the different aspects of this Research. Also, I have gained some new experience about the consumer research. While surveying I have met a large number of people, with different perceptions, with different nature, and as a result of this I have learnt a lot of things like how to talk with the different people with different behavior. Also the outcome that came out of this research work is that in Kadi SWIFT is the Market leader of the market share and ALTO 800 market share is low compared to swift. Through this research I also come to know that young generation is the potential market for automobile industry.
REFERENCES Puto C. ( 1987), The Framing of Buying Decisions (Journal of Consumer Research, December Vol.14,
1987), Issue 3, pp303
Balakrishnan Menon, Jagathy Raj V. P. (2012), Dominant partial Least square factors of consumer behavior of passenger cars, Asian Journal of Management Research Vol.3, Issue-1, pp.83-99.
Balakrishnan Menon, Jagathy Raj V. P. (2012), Model Development and Validation for Studying Consumer Preferences of Car Owners, IJMT Vol.2, Issue 5, pp. 148-173.
Ramita Verma, Shubhkamana Rathore (2013), PEST Analysis for Indian Luxurious Car Market, IJMSSR Vol. 2, No.1 pp.22-26.
WEBSITES www.google.com www.automobile.com www.marutiudhyog.com

75
International Journal of Research in Management & Social Science Volume 5, Issue 3 (I): July - September, 2017
ISSN 2322 - 0899
CHARACTERISTICS PATTERN OF FUNCTIONS , FUNCTIONAL HIERARCHIES OF URBAN CENTRES AND IMPACT ON URBANISATION IN DIBRUGARH AND TINSUKIA DISTRICTS, ASSAM
Dr. Sangeeta Boruah Saikia Assistant Professor, Department of Geography, Digboi College, Digboi
INTRODUCTION Urbanization is an important event of modern times. It is essentially related with the changes in urban population and social index that reflects the standard of living and stands as indicator signifying the level of economic growth and development of a country. The increase of literacy, its economic affluence, changes of social customs and life style increase the mobility of the people. All these changes also help to change the occupational structure. Generally urbanization means the gradual in depth shift of occupational structure and social life of the people from primary to secondary and tertiary ones.
Dibrugarh and Tinsukia Districts previously constituting the Dibrugarh District is an emerging urbanized area next to Kamrup District area located in between 275 N and 2758N and 9435 E and 960 E in eastern most part of Assam south of the Brahmaputra. It is the area where modern life started first in Assam through the establishment of tea gardens and coal and oil industries. First railway lines and trunk roads were initiated in this area during colonial era laying ground for modern urbanization. It covers a total area of 7171 km2 consisted mostly of plains with scattered hill and hilly area in its eastern and southern margins bordering Arunachal Hills. Since the British period, the area has been a place for urban growth, though the process being a slower one. The region has the second highest number of urban population after Kamrup District where in Guwahati is located. Dibrugarh and Tinsukia Districts have been a functional coherence since the time of development of transport network and associated modern industrial and commercial activities, so it is legitimate to consider these two present districts as a single unique region. The two districts have inseparable functional coherence and unique interdependence in respect of the process of urbanization since inception. But inspite of presence of abundant resources and infrastructure in the region, the emerging trend of urbanization is not satisfactory and also the development process of the region is not fast. So it requires proper investigation in the characteristics pattern of urban function in the region. With this objective and rationale in mind, the topic of ‘characteristics pattern of functions and functional hierarchies of urban centres in Dibrugarh and Tinsukia districts’ is taken for investigation. It will attempt to find out the character of growth and development of urbanisation with impact on regional development of the region. The study will include all the urban centres viz. Dibrugarh, Tinsukia, Duliajan, Digboi, Margherita, Chabua, Naharkatia, Doom Dooma, Makum, Namrup, Moran, Ledo, etc. Study reveals that the region deserves a unique location and its urban centres have good hinterlands within the region. Dibrugarh and Tinsukia towns act as two main urban nodes within the node’s region. Based on differences in range of goods or services, different orders in the functional hierarchy of urban centres can be identified and it also observed that rank size regularity is missing in the region.
OBJECTIVES 1. To investigate the characteristic pattern of functions, functional hierarchies of urban centres.
2. To study about rank-size relationship of urban centres in the region.
METHODOLOGY The data are collected from census reports of India from 1961 to 2011, Gazetteer of Lakhimpur Districts and personal data collection. The topic for investigation is taken through intensive library work to find out relevant information’s in books, journals, articles, monographs etc. and also assembling personal experiences, theoretical knowledge and imaginations, opinion, observation in the field. Zapf’s rank –size Rule is used to see the rank size relationship of towns in Dibrugarh and Tinsukia districts.
RESULTSAND DISCUSSIONS CHARACTERISTIC PATTERN OF URBAN FUNCTION IN THE REGION The urbanization of Dibrugarh and Tinsukia Districts as its stands today was initially started from a fort on the bank of the river Brahmaputra known as Dibrugharh or Dibrugarh. The Ahom built the fort on the bank of the Dibru, a tributary of the mighty Brahmaputra. British had started the present Dibrugarh Town also with the construction of another large fort nearby. To the site of the former fort area, merchants came by boats for trading purposes and a market sprang up which is known as Purana Bazar (old market). The new market was established in 1907 after Purana bazar has been eroded away by the river (Govt. of Assam, 2007). Later on, residential area of the British developed through establishment of Head Quarter, district offices, medical school,

76
International Journal of Research in Management & Social Science Volume 5, Issue 3 (I): July - September, 2017
ISSN 2322 - 0899
etc. After development of different mode of transport, economic and other activities, the process of modern urban development started to grow in the whole upper Assam area slowly and very irregularly.
Dibrugarh and Tinsukia Districts deserves a unique location and its urban centres have hinterlands within the region and surrounding Arunachal Pradesh. The historical development of modern economy (table -1) of the region is responsible for the growth of urbanisation.
Table-1: Dibrugarh and Tinsuklia Districts Region Inventory of Industry and Industrial Activities through time and space
Year Industry and Industrial Activities 1835 First tea garden at Kundilmukh, Sadiya 1840 Tea Industry developed at chabua and later developed in the whole of the region 1866 First oil well at Margherita 1866 Started Construction of Assam Trunk Road No.37.(1922 passenger movement started ) 1881 The Assam Railway and Trading company at Margherita 1881 Wood based industry ( saw mill ) at Margherita by ARTC 1881 Railway workshop at Dibrugarh 1882 Dibru- Sadiya railway line and Inland water transport established 1882 Ledo- Coal Field 1884 Margherita Coal Field 1889 Digboi Oil well 1890 Brick industry in Ledo 1893 Digboi small Refinery under The Assam Railway and Trading company 1896 Margherita small Refinery under The Assam Railway and Tradingcompany 1897 Namdang Collieries 1898 Tirap Collieries 1898
Railway connection established with Assam Bengal Railway ( Gauhati to Tinsukia) up to Chittagong and Calcutta ports
1901 Digboi Refinery under Assam oil Corporation Ltd. 1904 Borgolai Collieries 1924 Tipong Collieries 1924 Plywood Factory at Margherita. 1951 Naharkatiya and Namrup Drilling well 1953 Natural gas discovered at Naharkatiya and Moran Oil Field. 1956 Moran Drilling well 1962 Oil India pipe line Project 1962 Oil India Ltd Duliajan and oil well drilling 1962 Namrup Thermal Power Project 1969 Namrup Fertilizer Project 1971 The Assam Petro Chemical Limited,Namrup 1976 NEEPCO Thermal Power Project Kathalguri , Dibrugarh 2007 Gas Cracker Project (BCPL) Lapetkata, Dibrugarh ( not start working)
2014 Plastic Park at Tinsukia ( not start working) Source: Gazetteer of Lakhimpur District, Internet and personal data collection
From the table no -1 we have seen that inventory of Industries and industrial activities having a forcing on urbanisation of the region. It served some permanent market places where trade was conveniently carried on. Gradually, with the growth of region, the trade operations expanded so much, so that later, not only goods but

77
International Journal of Research in Management & Social Science Volume 5, Issue 3 (I): July - September, 2017
ISSN 2322 - 0899
‘services’ formed a major part of the manifold economic activities of the people of the region. Thus, people possessing various capabilities immigrated to the region thereby leading the expansion of the region.
Dibrugarh and Tinsukia towns act as two main urban functional nodes within the region. Based on differences in range of goods and services, different orders in the functional hierarchy of urban centres can be recognized. The classification has been done on the basis of 1961 and 2011 census and personal observation based on theoretical frame work which has been seen the changing pattern of functional categories of towns.
Table-2: Dibrugarh and Tinsukia Districts Region Changing Pattern of Functional Categories of Urban Centres
Nos Urban Centres
1961 2011 Total
Population Functional Categories Total
Population Functional Categories
1 Chabua 2,533 Trade and commerce 8,788 Trade & commerce cum-services
2 Dibrugarh 58,480 Transport-Cum-Services
1,45,220 Services-cum-trade and commerce cum-transport
3 Digboi 35,028 Industry 33,718 Trade and commerce-cum-industry.
4 Doom Dooma
8,192 Service-cum-Trade and Commerce, Primary Activities
21,469 Trade and commerce.
5 Duliajan - Industry 29,350 Industry
6 Makum - Trade and commerce cum-transport.
16,875 Trade and commerce-cum-industry-cum-transport.
7 Margherita - Industry-cum-trade and commerce.
26,913 Industry-cum-trade and commerce-cum-transportation
8 Naharkatiya 8,877 Services,cum-industry-cum primary Activities
18,924 Trade and commerce cum-industry-cum primary Activities
9 Namrup - Industry 15,483 Industry 10 Tinsukia 28,468 Trade and commerce-
cum –services 1,15,556 Trade and commerce-cum
industry-cum-transport.
Source : Based on Census report 1971, 2011 and personal observation
The Dibrugarh and Tinsukia Districts Region has Dibrugarh and Tinsukia nodal urban centres. Most of its towns engaged in secondary and tertiary activities. These urban centres are distributed heterogeneously because of the layout of transport routes. In Dibrugarh and Tinsukia Districts Region, 74 percent workers are engaged in different activities (excluding marginal workers) in 2001 census. 30 percent people are cultivators which are an important economic activity of urban population of the region but not considered as urban function. Agricultural labourers constitute 7 % out of these populations. There is observed of 1/3 decrease of agricultural workers in town population within 20 years. Of course, it is observed that agriculture is still becoming the dominant occupation in some relatively lower class urban centres having population less than 10,000. Only 2 % workers have been seen engaged in manufacturing, processing, servicing and repairing activities. Most powerful occupation sectors are construction, trade and commerce, transport and communication, storage where about 61 percent people are engaged in this region.
FUNCTIONAL HIERARCHIES The hierarchy of the urban centres for Dibrugarh and Tinsukia Districts Region has been calculated both on the basis of the % of population engaged in ‘other services’ and size of population. According to 2001 census, other services category includes all those who have worked more than six months in any field of economic activities other than cultivation as agricultural labourer or in household industry centres. More than 95% of population if

78
International Journal of Research in Management & Social Science Volume 5, Issue 3 (I): July - September, 2017
ISSN 2322 - 0899
engaged in other services is called 1st order, between 90 to 95 % is called 2nd order and between 85 to 90 % is called 3rd order urban centres. In Dibrugarh and Tinsukia Districts region there are three 1st order, eight 2nd order and two third order urban centres ( Table -3).
Table—3: Dibrugarh and Tinsukia Districts Region Hierarchy of Urban Centres Based on Function and Size of Population
Source: Based on Census of India 2001
From functional point of view devoid of the consideration of size of population, Namrup, Duliajan, Digboi (oil town) are purely industrial town where population related to trade and commerce is very less and are included into first category as per census definition. But in urban science, volume of function and complexity of services cannot be dominant the size of urban population in respect of functional hierarchy in ranking. So, here the size of urban population criterion is considered for scientific determination of hierarchy.
The 2nd order centres namely Chabua, Naharkatiya, Doom Dooma, Digboi, Margherita, Moran, etc are distributed haphazardly on all over the Dibrugarh and Tinsukia region and 3rd and 4thorder are on the east and the south-east of the Dibrugarh and Tinsukia towns. All these urban centres are under the influence of districts head quarter towns of Dibrugarh and Tinsukia. These centres are marked by changes in population and concentration of public utility services, but trade and commercial activities have always appeared dominating over other services to emerge them as urban centres in urban hierarchy. Depending on the hierarchical order of these activities, the real picture comes up and urban centres appear in order as given in table-3. Single function is not a scientific basis for ordering urban centres in hierarchy. Among commercial activities, size of commercial population and volume of goods and services are to be considered to find out the real functional picture of urban centres.
RANK-SIZE RULE The distance between any two adjacent towns in the same size class fits fairly well the formula ( P1P2 ) / D = A, in which P1 and P2 stand for the populations of the two towns and D for the distance between them and A is a constant for any given region. The distribution of towns by size has also been shown to follow an empirical rule, the so-called Rank-size Rule. The regularity in the above relationship was originally observed by Zipf (Zipf, 1941), and later on Berry (Berry, 1961). In Zipf’s version the rule states that if all towns in a region are arranged in descending order by population, the size of the rth town 1/r the size of the largest town according to the series 1, 1/2, 1/3, 1/4……1/r. More analytical work, notably which of Christaller and Losch, based on function rather than on population, seeks to demonstrate a regularity in the town hierarchy, both in the relative numbers of towns serving as local, regional and inter - regional centres and in the consequent ratios of the distance between towns in the several stages of subordination and super ordination of function.
Thus, if on a log log paper the population (Pr) of towns of an area are plotted on Y axis and their ranks (R) are plotted on X axis, we will get a scatter diagram which will closely form a straight line having a negative slope.
Statistically this regularity can be examined by fitting a regression line of log Pr on log R. The regression coefficient of this line reflects the degree of primacy in the entire urban system and the coefficient of determination may be taken as a measurement of its goodness of fit to the system of rank-size regularity.

79
International Journal of Research in Management & Social Science Volume 5, Issue 3 (I): July - September, 2017
ISSN 2322 - 0899
Table-4 gives the population of first towns of Dibrugarh and Tinsukia districts region in 2011 with their ranks. These populations and their ranks have been converted into logarithms and a regression line is worked out to fit in the usual manner as given below.
Logx = a+b logy —> Regression of log x on log y Log y = a + b log x —> Regression of log y on log x x= ranks ( R ) y= Population (Pr)
Table-4: Dibrugarh and Tinsukia Districts Population Rank Size Relationship, 2011 Urban
Centres RankX
Population Y
Log X= x x2 LogY = y y2 Xy
Dibrugarh 1 1,45,220 0 0 5.1620 26.65 0
Tinsukia 2 1,15,556 .301 .090601 5.0628 25.63 1.524 Digboi 3 43,260 .477 .227529 4.6361 21.49 2.2114
Duliajan 4 29,350 .602 .362404 4.4676 19.96 2.689
Margherita 5 26,913 .700 .490000 4.4300 19.62 3.101 Doom Dooma
6 21,469 .778 .6205284 4.3318 18.76 3.370
Naharkatia 7 18,924 .845 .714025 4.2770 18.29 3.614 Makum 8 16,875 .903 .815409 4.2272 17.87 3.817 Namrup 9 15,483 .954 .910116 4.1899 17.56 3.997 Ledo Town 10 11,718 1.000 1.000000 4.0689 16.56 4.0689 Chapakhowa 11 10,320 1.041 1.083681 4.0137 16.11 4.178 Chabua 12 8,788 1.079 1.164241 3.9439 15.55 4.255 Moran 13 8,445 1.114 1.240000 3.9266 15.42 4.374
9.794 8.7185344 56.7375 249.47 41.1993 ∑xy - ∑x ∑y n b= _____________________________ ∑x2 – ( ∑x )2 n 41.1993- 9.794X56.7375 13 = _______________________________________
8.7185344 - (9.794X9.794) 13 - 1.5458596 = ______________________________
1.339885477
= - 1.15372517
56.7375 9.794 a = y-bx= _______________ -(- 1.15372517 ) __________
13 13
= 4.364423+ 0.8691988
=5.233622
Thus the equation of log y on log x is log y = 5.233622-1.15372517 log x
Where a= 5.233622 and b = -1.15372517
To draw the regression line y on x (line of best fit), we have the linear equation y=a-bx
80
International Journal of Research in Management & Social Science Volume 5, Issue 3 (I): July - September, 2017
ISSN 2322 - 0899
as y=5.234-1.154x
When in a regression equation (y = a-bx) different values of x are put, we get the corresponding estimated values of y. This is also termed as estimated y or ŷ
The coefficient of correlation r can be found out as follows—
∑ xy - ∑ x∑y N r= _________________________________________
√∑x 2 ( ∑x ) 2
√ ∑ y 2 – ( ∑y ) 2
N N 41.1993-9.794 X 56.74 13 = _________________________________________________________________
√ 8.7185344 – (9.794)2 √ 249.47 – (56.74)2 13 13 41.1993-42.75 = ___________________________________________________________
√8.7185344-7.378649 X √249.47-247.6482769
- 1.5507 = _____________________ 1.56234 = - 0.9925 = - 99.25 % To find out t (Significance test of Correlation Coefficient) t= r √ n-2__
1-r2
t= r √ 13-2_ 1-(-0.99) 2
t = .99 √__11_ 1.98 t= 2.33
The coefficient of determination of this equation was found to - 0.9925 to i.e - 99.25 % variations in log Pr are being explained by log R. This is a very low level of explanation. If ‘ t’ is greater than the tabulated ‘t’ the correlation coefficient is said to be 1% level of significant and the population correlation coefficient between the two variables in this case is not considered to be zero. The result shows that there exists a negative relationship between the rank and population size.
The original equation from the values of the constants as found above can be written as Pr = 171246-1.15372517 ( as per table -5 )
If in equation we put R=1,2,3,4 and 5,etc we get the population of cities ranking 1st , 2nd, 3rd,4th and 5th etc. according to the rank - size rule. Actual population of the towns may not be equal to these estimated populations, as no town system fits completely into a rank size rule. At the same time if the coefficient of determination is low, the difference between actual and estimated is supposed to be very large.

81
International Journal of Research in Management & Social Science Volume 5, Issue 3 (I): July - September, 2017
ISSN 2322 - 0899
Fig-1
Table-5: Dibrugarh and Tinsukia Districts Region Actual and Estimated Rank Size Population, of Urban Centres, 2011
City Rank Estimated Population
Actual Population
Difference % difference
Dibrugarh 1 171246 145220 +26026 +15.20 Tinsukia 2 76964 115556 -38592 -50.14 Digboi 3 48211 29350 +4951 +10.27 Duliajan 4 34595 26913 +5245 +15.16 Margherita 5 26758 21791 +5289 +19.77 Doom Dooma 6 21676 21469 +2752 +12.70 Naharkatia 7 18140 18924 +1265 +6.97 Makum 8 15567 16875 +84 +0.54 Namrup 9 13569 15483 +1851 +13.64 LedoTown 10 12017 11927 +299 +2.49 Chapakhowa 11 10770 11718 +450 +4.18 Chabua 12 9741 10320 +953 +9.78 Moran 13 8882 8788 +437 +4.92
These results are given in Table-5 with actual populations and the deviations have been worked out here on the basis of the relationship between 13 towns. From the above results it is seen that rank size regularity is missing in Dibrugrh and Tinsukia Districts Region as in whole of India ( Ghosh,1998). But the centrality though irregular, exists in functional hierarchical forms which have not any definite mess of hexagonal network, but have some irregular pattern not fitting with the theoretical framework of western world (Berry and Garrison, 1958).
CONCLUSION AND RECOMMENDATIONS To conclude the present work on characteristics pattern of functions and functional hierarchies in Dibrugarh and Tinsukia districts, it is perceived after a pretty long discussion that the problem is simple in appearance, but complex in nature. Urbanization is a process of development of an area that is not only a physical aspect but also a functional one. Resource and industry oriented towns have no natural growth and always dependent on the arrangement and management policy of the resource and industry. Normal process of urbanization takes the course after establishment of certain germinating aspects of development. Dibrugarh and Tinsukia districts thus came to the natural process of urbanization after development of its tea industry, transport and communication system and history of development of resource points. This type of study requires for understanding the

82
International Journal of Research in Management & Social Science Volume 5, Issue 3 (I): July - September, 2017
ISSN 2322 - 0899
problem of urbanization based on different type of resource with a backward infrastructure of development in the region.The region deserves a unique location and its urban centres have good hinterlands within the region. Dibrugarh and Tinsukia towns act as two main urban nodes within the node’s region. Based on differences in range of goods or services, different orders in the functional hierarchy of urban centres can be identified and it also observed that rank size regularity is missing in the region.
A well-organized monitoring, planning and implementing unit in the administration is required all the time which will work to generate data, plans etc. necessary for understanding the process of urbanization, peopling, implementation and administration of plans to attain at better goals.
BIBLIOGRAPHY Berry B.J.L. (1971) – “Comparative Factorial Ecology” – Economic Geography (Supplement) P. 47.
Berry, B.J.L., and Garrison, W.L. (1958): Alternate explanations of urban rank size relationships. Annals, Associaton of American Geographers pp. 83-91
Census of India (1991): Series –4 Assam, part –II B Primary Census Abstract, General Population Scheduled Casts & Scheduled Tribes – Service director of Census operation India.
Census of India (1991): Series-4 part ix-A Assam, Town Directory Director of Census operations. Assam.
Census of India 1901-1961 VOI III, Assam part I and Part II, GoI
Census of India 1991, 2001 primary census abstract series 4 & 19 Assam, GoI
Census of India 1971, Series & Assam part II-A General Population Table, GoI
Census of India 1971 Series 3 Assam part X-A & Town Directory. – Lakhimpur District.
Census of India 1981 Part XIII-A Village & Town Directory – Dibrugarh –XI
Census of India 2011 provisional population totals, paper 2, Volume 2 of 2011 Rural- Urban Distribution Assam Series 19
Dutta & Dutta ( 1901 Rep 1976) Assam District Gazetteers, Guwahati, Assam.
Ghosh, Sumita (1998): Introduction to Settlement Geography -Orient Longman Limited –17 Chittaranjan Avenue Calcutta.
Govt. of India (1976, Rep.1999): Gazetteer of Insdia, vol. A, Assam State Lakhimpur District pp 109, 231, 481
Hunter, W.W. (1879): A statistical account of Assam VOL II B.R. Publishing corporation, Delhi 1975 (Rep) - P-364.
Zipf,G.K.: National Unity and Disunity, Bloomington, Ind. Principia Press, 1941.

83
International Journal of Research in Management & Social Science Volume 5, Issue 3 (I): July - September, 2017
ISSN 2322 - 0899
CHALLENGES AND OPPORTUNITIES IN SOCIAL WORK PROFESSION: REFLECTING ON TEACHING & PRACTICE
Dr. Satish Kumar Assistant Professor, Faculty of Social Work, The Maharaja Sayajirao University of Baroda, Vadodara
ABSTRACT Social work is an evolving activity both in the practice and academic domains and it is not surprising, therefore, that diverse opinions about the profession's identity, preferred practice methods, research endeavors, educational standards and future goals should be expressed on a regular basis. Even though some social work academics find debates on these issues repetitive and tiresome, an ongoing discussion on these and the other important matters affecting the profession should be welcomed.
Globalization has changed the world in which we live. Social workers witness the challenges for individuals, communities and societies that are resulting from this rapid transformation of our world. Social work is a practice-based profession and an academic discipline. The curricula of Social work are increasingly subjected to the priorities of governments, requirements of employers and regulations by professional bodies and higher education organisations in many countries. The move towards privatization and managerialism within social welfare services has impacted on the profession.
In a time of rising specialisation within almost all professions there is the danger of losing sight of the unity and connectedness that exists in the real world. Social work, as with other professions, is under pressure to be increasingly specialised both in its education curricula and in practice. At the same time there are many supporters of the generic approach in social work education. There is a need to challenge both the advantages and disadvantages in each of these approaches.
A fundamental challenge for the future enhancement of social work education and for the increasing and deepening of social work knowledge is the development of a robust social work research base.
So keeping in view the current opportunities and challenges efforts should be made to connect Theory and practice by bridges such as reflective practice and other strategies for more effective social work intervention. Student-centered methods have shown their effectiveness in facilitating deep understanding of content, the acquisition of critical thinking, developing a creative problem-solving attitude and an increasing level of confidence in knowledge and skills. So a student centered education need to focus on activity from teachers to learners.
INTRODUCTION The development of social work as a profession has been under debate both within the social work fraternity and outside of it. As a helping profession, the primary mission of social work is to help clients meet their needs and enhance their well-being. In order to effectively respond to clients’ needs and demands, professional social workers are equipped with a wide range of knowledge.
Social work as a profession continues to face many challenges in the 21st century as it strives to promote well-being and enhance welfare in a socio-political climate driven by economics and individualism. Over the years, the definition of a profession has undergone change and new vocations or semi-professions have come to be accepted as professions.
MAJOR CHALLENGES IN SOCIAL WORK PROFESSION The major challenges in social work profession are as follows. Status of Social Work Profession The biggest challenge that social work faces for being recognized as a profession is the haziness of its social status. It is still assumed that social work is voluntary in nature and any individual who wishes to pursue social work can do so. Even it is observed that all the peoples those who are engaged or doing charity work are calling themselves social workers. In India, the lack of governmental support compounds this problem. Many social work educators and practitioners have sought to organize National level associations that would be recognised by the government and they also need to work together and need to think out of box not only conducting seminar and workshops.
The Theory and Practice Relationship Social work is a profession and practice based academic discipline. In social work profession the role of theory in practice continues to be an on-going discussion in the profession. Simon (1994) insists that it is crucial for

84
International Journal of Research in Management & Social Science Volume 5, Issue 3 (I): July - September, 2017
ISSN 2322 - 0899
social work practitioners to learn theoretical knowledge because theory can serve as an anchoring frame and a conceptual screen for case assessment, causal explanation, intervention planning, and outcome evaluation. Although this kind of expert debate provides a vehicle for scholars or educators to thoroughly discuss the role of social work theory in practice, it does not offer an opportunity for the general consumers of the outcome to express their views, especially students who are required to learn and apply theory in practice.
Puolter (2005) thinks learning and applying social work theory in practice is an on-going reflective evaluation of practice guided by current and emerging theoretical knowledge and research to learn when and how to add or replace theory and practice strategies for practice effectiveness.
When theory is applied to practice, one of the biggest challenges facing social work students is integrating theory with practice in an effective way. Vayda and Bogo (1991) state that social work students often experience the disconnection between classroom and practicum, and frequently experience difficulty in applying concepts learnt in the classroom to practice. Munro (2002) points out social work students cannot explicitly and systematically apply any relevant theory when they work with clients unless practice supervisors provide a clear theoretical framework.
In recent years, there has been a trend that theory and practice should be integrated, which implies that social work theory should play certain roles in practice.
Teaching Social Work practice at the time of Crisis In the recent years all the societies are facing dramatic challenges. The financial, economic and other social crisis have led many countries to implement severe policies. In the light of the changing practice environment students are facing challenges how to respond appropriately in the crisis circumstances. Students need to learn and understand the problem from different Prospects, work methodology, research and innovatory practice.
Reflecting on Social Work Teaching Methods In the recent time a student centred education shifting the focus of activity from teachers to learners. The acquisition of critical thinking, developing a creative problem-solving attitude among students and an increasing level of confidence in knowledge and skills are the other challenges among the professional.
Social Work Research on Practice and Education A fundamental challenge for the future enhancement of social work education and for the increasing and deepening of social work knowledge is the development of a robust social work research base. There is a need to assess the impact of research in social work education and practice development. There is also a challenge to promote and utilise research on practice to update its curricula and develop research-based comparative knowledge among the students and practitioners and also need to understand how social work research can inform the link between theory and practice.
Challenges in Developing & Updating Social Work Curricula The another challenge the profession is facing is in term of developing and updating curriculum keeping in view the changing needs of the society. The move towards privatization and managerialism within social welfare services has impacted on the profession. Cuts in the public sector have resulted in reduced welfare services for many people. Social work education is seeing increased academisation of its curricula. At the same time, service users and their organisations’ voices are regarded as valuable in developing the curricula of social work. As we look to the future, how should social work education change?
A Generic or Specialist Social Work Education In a time of rising specialisation within almost all professions there is the danger of losing sight of the unity and connectedness that exists in the real world. Social work, as with other professions, is under pressure to be increasingly specialised both in its education curricula and in practice. At the same time there are many supporters of the generic approach in social work education. There is a need to challenge both the advantages and disadvantages in each of these approaches.
MAJOR OPPORTUNITIES IN THE SOCIAL WORK PROFESSION The opportunities are in the following areas. There is a need to create awareness among the masses regarding the social work profession and all the
association of social work should work together in order to promote the professional status.
There is a need to understand how the dialogues can be strengthened between the professional world and the academic world and how can social work education contribute to its own academic knowledge production and practice development. There is also a need to understand how can systematic reflection on social work

85
International Journal of Research in Management & Social Science Volume 5, Issue 3 (I): July - September, 2017
ISSN 2322 - 0899
action give life to new theories and how new theories born in the academic work can be useful in the practice.
In times of deep economic, ecological and social crisis it could seem that the promotion of social and economic equalities and the dignity and worth of peoples hopelessly clash against the reality of a lack of resources So there is a need to train the students regarding this particular aspect.
There is a need to understand what should we teach students to be better prepared as social workers in times of crisis.
There is a need to create a forum for the sharing of experience and knowledge between different generations of social work educators and researchers, as well as with social work professionals, students and service users.
There is a need to provide a forum for the discussion of the above-mentioned challenges while devising and formulating new pedagogies aimed at addressing their specific implications.
There is also a need to know how should we balance the professional, academic and skills-based nature of social work in our curricula.
CONCLUSION Globalization has changed the world in which we live. Social workers witness the challenges for individuals, communities and societies that are resulting from this rapid transformation of our world. The social work community need to respond by introducing the Global Agenda for Social Work and Social Development that committed the social work community to four main priorities like promoting social and economic equalities, promoting the dignity and worth of peoples, working toward environmental sustainability and Strengthening recognition of the importance of human relationships.
REFERENCES European Association of Schools of Social Work(2015) Social Work Education in Europe: towards 2025.
John T (2007) Social Work in the twenty first century, Challenges and opportunities, Journal of Sociology and social Welfare, Voll. 34,Issue-III

86
International Journal of Research in Management & Social Science Volume 5, Issue 3 (I): July - September, 2017
ISSN 2322 - 0899
FINANCIAL INCLUSION: SERVICES AND STRATEGIES OF RETAIL BANKING
Dr. M. Veerabhadra Rao1 and B.V.S.S. Subba Rao2 Professor, Department of MBA, SRK Institute of Technology, Vijayawada, Andhra Pradesh
Research Scholar, Krishna University, Machilipatnam, Andhra Pradesh
ABSTRACT The benefits of economic growth have not equitably reached different parts of our society. The rural and agricultural sector, in particular, has not gained the desired momentum of growth and development.
Access to finance by the poor and vulnerable groups is a prerequisite for poverty reduction and social cohesion. This has to become an integral part of our efforts to promote inclusive growth. In fact, providing access to finance is a form of empowerment of the vulnerable groups. The various financial services include credit, saving, insurance payments and remittance facilities. The objective of financial inclusion is to extend the scope of activities of the organized financial system to include within its ambit people with low incomes. Through graduated credit, the attempt must to be lifting the poor from one level to another so that they come out of poverty.
As the economy began to grow at higher rates, the regional and societal disparities called for new strategies to ensure that the banking system met the requirements of inclusive growth. Such strategies needed to be fashioned in a manner that they did not undermine the stability and efficiency of the financial system. Specific focus on financial inclusion commenced in November 2005, when Reserve bank advised banks to make available a basic banking ‘no-frills’ account with low or nil balance as well as charges, with a view to expanding the outreach of such accounts. In such accounts, banks are required to make available all printed material used by retail customers in the regional language concerned.
Financial inclusion rest on three pillars viz., access to financial services, affordability of such services and actual utilization of such services. Financial inclusion can be achieved only if all the three pillars show affirmative results.
Key Words: Financial Services, Inclusive Growth, Financial Inclusion, Organized Financial System.
INTRODUCTION Financial Inclusion means extending the banking habit and ensuring access to financial services and adequate credit where needed by vulnerable groups such as weaker sections and low income groups at an affordable cost. But the path of financial inclusion is daunting. The benefits of economic growth have not equitably reached different parts of our society. The rural and agriculture sector, in particular, has not gained the desired momentum of growth and development.
The Recent developments in banking technology have transformed banking from the traditional brick – and – mortar infrastructure like staffed branches to a system supplemented by other channels like automated teller machines (ATM), credit /debit cards, internet banking, online money transfers, etc. The moot point, however, is that access to such technology is restricted only to certain segments of the society. Indeed, Some trends, such as increasingly sophisticated customer segmentation technology – allowing, for example, more accurate targeting of sections of the market – have led to restricted access to financial services for some groups. There is a growing divide, with an increased range of personal finance options for a segment of high and upper middle income population and significantly large section of the population who lack access to even the most basic banking services. This is termed “financial exclusion”. These people, particularly, those living on low incomes, cannot access mainstream financial products such as bank accounts, credit, remittances and payment services financial advisory services, insurance facilities, etc.
Deliberations on the subject of Financial Inclusion contributed to a consensus that merely having a bank account may not be a good indicator of financial inclusion. Further, indebtedness as quantified in the NSSO 59th round (2003) may not also be a reflective indicator. The ideal definition should look at people who want to access financial services but are denied the same. If genuine claimants for credit and financial services are denied the same, then that is case of exclusion. As this aspect would raise the issue of credit worthiness or bank ability, it is also necessary to dwell upon what could be done to make the claimants of institutional credit bankable or creditworthy. This would require re-engineering of existing financial products or delivery systems and making them more in tune with the expectations and absorptive capacity of the intended clientele.

87
International Journal of Research in Management & Social Science Volume 5, Issue 3 (I): July - September, 2017
ISSN 2322 - 0899
LITERATURE REVIEW FINANCIAL INCLUSION Financial inclusion is defined as “a process that ensure the case of access, availability and usage of the formal financial system for all members of an economy” (Sarma, 2008, p.3). Ease of access is measured by proxies such as number of banks branches or number of ATMs per 1000 population. Availability and usage are measured by the extent of utilization as well as the size of bank credit and bank deposits, relative to the GDP of country. An inclusive financial system should have as many users as possible as this gives an indication of how much the financial system has penetrated among users (Sarma, 2007). The various dimensions of inclusion that are encompassed in this definition, together build an inclusive financial system. As banks are the gateways to the most basic forms of financial services, banking inclusion/exclusion is often used as analogous to financial inclusion/exclusion. It has been observed that even “well developed” financial services have not succeeded to be “all inclusive” and certain segment of the population remain outside the formal financial system (Sarma, 2008).
UNBANKED AND UNDER BANKED MARKETS (Worthington, 2008, p.101) defines the unbanked as “those individuals without a traditional saving or checking account”. They are distinct from the under banked who have some limited relationship with a financial institution. (Sarma, 2008 p.8) defines the under banked as people with bank account, but who make very little use of the services an offer. Surma purports that merely having an bank account is not enough for an inclusive financial system: It is also imperative that the banking services are adequately utilized.
The under banked tend to rely on alternative financial institutions even through they have bank accounts because they are not fully integrated into the banking services. As a result, these individuals may pay more for basic financial services
OBJECTIVE OF THE STUDY The objective of the research described in this study was to investigate the financial services and strategies that are being employed by Indian retail banking to optimize financial inclusion.
NEED FOR INCLUSION The essence of financial inclusion is trying to ensure that a range of appropriate financial services is available to every individual and enabling them to understand and access those services. A part from the regular form of financial intermediation, it may include a basic no frills banking account for making and receiving payments, a saving product suited to the pattern of cash flows of a poor house hold, money transfer facilities, small loans and over drafts for productive personnel and other purposes etc.
How ever, inclusive finance does not require that everyone who is eligible uses each of these services, but they should be able to choose to use them, if they so desired. To this end, strategies for building inclusive financial sectors have to be creative flexible, appropriate to the national situation and if necessary, nationally owned. For promoting financial inclusion we have to address the issue of exclusion of people who desire the use of financial services, but are denied access to the same. In countries with a large ruler population like India, financial exclusion has a geographic dimension as well. In accessibility distances and lack of proper infrastructure hinder financial inclusion. Vast majorities of population living in rural areas of the country have serious issues in accessing formal financial services. Another facet of exclusion which needs to be address is “social exclusion” – which is an extreme consequence of what happens when people do not get a fair deal through their lives, often because of disadvantages they face at birth, and this can be transmitted from one generation the next. Social exclusion is about more than income poverty. It is a very short hand term for what can happen when people or areas have a combination of problem such as unemployment discrimination, poor skills, low incomes, poor housing and also perceived difficulties in doing business. These difficulties are linked and mutually reinforcing.
ABC OF FINANCIAL INCLUSION Financial inclusion rests on three pillars viz, access to financial services, affordability of such services and actual utilization of such services. Financial inclusion cab be archived only if all the three pillars show alternative results. Thus the ABC of financial inclusion is advice, Banking and credit. It must also be noted that while for developing countries like India, generally the process of financial inclusion starts with opening of savings bank accounts. The process, at a later stage, must also incorporate credit facilities and other financial services such as insurance. Thus, promotion of financial inclusion would require holistic and coherent approach on the part of the banking industry as also the regulator (RBI) and the Government.

88
International Journal of Research in Management & Social Science Volume 5, Issue 3 (I): July - September, 2017
ISSN 2322 - 0899
FINANCIAL INCLUSION –CRUCIAL ROLE OF MICRO FINANCE Report of the committee of financial inclusion, 2008 is quoted that “Access to finance by the poor and vulnerable groups is a prerequisite for poverty reduction and social cohesion. This has to become an integral part of our efforts to promote inclusive growth. In fact, providing access to finance is a form of empowerment of the vulnerable groups. The various financial services include credit, saving, insurance payments and remittance facilities. The objective of financial inclusion is to extend the scope of activities of the organized financial system to include within its ambit people with low incomes. Through graduated credit, the attempt must be to lift the poor from one level to another so that they come out of poverty (Report of the committee on financial inclusion, 2008)” - The committee further opined that to achieve inclusion. Existing micro finance innovations should be put to use extensively and further strengthened.
SHG federations may take up quite a lead in this regard.
Joint liability groups can be promoted to upscale the lending and meet the specific requirement of a particular section of vulnerable populations.
Extend the outreach by leveraging technology to open up lacerating technology to open up channels beyond branch network.
The business facilitator/ Business correspondent (BF/BC) models riding on appropriate technology can deliver this outreach and should from the core of the strategy.
STRATEGIES FOR SERVING THE BOTTOM OF THE PYRAMID As the economy began to grow at higher rates, the regional an societal disparities called for new strategies to ensure that the banking system met the requirements of inclusive growth. Such strategies needed to be fashioned in a manner that they did not undetermined the stability and efficiency of the financial system. Specific focus on financial inclusion commenced in November 2005, when reserve bank advised banks to make available a basic banking ‘no-frills’ account with low or ‘nil’ minimum balances as well as charges, with a view to expanding the outreach of such accounts. In such accounts, banks are required to make available all printed material used by retail customers in the regional language concerned.
In order to ensure that persons belonging to low income groups both in the urban and rural areas do not encounter difficulties in opening bank accounts, the know your customer(KYC) procedure for opening accounts has been simplified. Besides the Kisan Credit Cards (KCC), banks have been asked to consider introduction of a general purpose credit card (GCC) facility up to Rs 25000 at their rural and semi urban branches.
This facility is in the nature of revolving credit, which entitles the holder to withdraw up to the limit sanctioned. Based on assessment of household cash flows, limits are sanctioned without insistence on security or purpose. Interest rate on the facility is completely deregulated. Fifty percent of GCC loans can treat as priority sector. Financial inclusion is intended to connect people to banks with consequential benefits. A decentralized strategy has been adopted for ensuring financial inclusion.
NO FRILLS ACCOUNTS AND GENERAL PURPOSE CREDIT CARDS In November 2005, banks were advised to make available a basic banking ‘no-frills’ account with low or nil minimum balances as well as charges to expand the outreach of such accounts to vast sections of the population.
Banks are required to make available all printed material used by retail customers in the concerned regional language.
In order to ensure that persons belonging to low income group, both in urban and rural areas do not encounter difficulties in opening banks accounts, the know your customer(KYC) procedure for opening accounts has been simplified for those accounts with balances not exceeding Rs. 50,000 and credits thereto not exceeding Rs 1,00,000 in a year. The simplified procedure allows introduction by a customer on whom full KYC drill has been fallowed.
MEASURES BY RBI AND GOI TOWARDS FINANCIAL INCLUSION Historically, the Reserve Bank of India (RBI) and the Government of India (GOI) have been making efforts to increase banking penetration in the country in November 2005, banks were advised to make available a basic banking ‘no-frills’ account with low or nil minimum stipulated balances as well as charges to expend the outreach of such accounts to vast sections of the population. In order to ensure that persons belonging to low income group, both in urban and rural areas do not encounter difficulties in opening bank accounts owing to procedural hassles, the know your customer (KYC) procedures for opening accounts has been simplified. The

89
International Journal of Research in Management & Social Science Volume 5, Issue 3 (I): July - September, 2017
ISSN 2322 - 0899
reserve bank has directed banks to make available all printed material used by retail customers in English, Hindi and the concerned regional language.
More recently in January 2006, banks were permitted to utilize the services of non-governmental organizations (NGOs/SGH), micro finance institutions and other civil society organizations as intermediaries in providing financial and banking services through the use of business facilitator and business correspondent models. To extend hassle-free credit to bank customers in rural areas, the guidelines on General Credit card (GCC) schemes were simplified to enable customers’ access credit on simplified terms and conditions, without insistence on security, purpose or end- use of credit. With a view of providing hassle free credit to customers, banks were allowed to issue general credit cards akin to Kisan Credit Cards (KYC).
The reserve bank has also been periodically issuing guidelines on public grievance redressal mechanism in banks, including constitution of customer service centers for ensuring improvements in quality of service rendered. In the reserve bank the customer service department has recently been constituted to inter alia, serve as the interface between customers and banks. Moreover, the Government of India has also expressed its explicit concern on the issue of overall inclusion in the development process through its various initiatives such as the rural employment guarantee scheme, the Bharat Nirman Programme, the Sarva Shiksha Abhiyan, and the like. A committee on the financial inclusion, with Dr. C. Rangarajan as chairman, has also been constituted by the government of India in June 2006, to recommend a strategy to archive higher financial inclusion in the country.
SUGGESTIONS A financially sound cooperative structure can do wonders for financial inclusion given its extensive
outreach.
Making banking more inclusive through expending the coverage of banking services by reaching the vast un-banked and under-banked population of the country.
Banks also need to have flexibility in terms of working hours, documentations, mode of interactions and transactions and need to explore ways to generate and utilize local knowledge for effective loan monitoring and risk mitigation.
Product and services needs to be developed that are adapted to the needs of the majority at affordable price time to time.
A monitoring mechanism to access the quality and quantum of financial inclusion including indicators for assessing regular progress.
CONCLUSION To conclude, I wish to stress that with increasing liberalization and higher economic growth, the role of banking sector is poised to increase in the financing pattern of economic activities within the country. To meet the following credit demand, the banks need to mobilize resource from a winder deposits base and extend credit to activities hitherto not financed by banks. The trend of increasing commercialization of agriculture and rural activities should generate greener pastures, and banks should examine the benefits of increasing penetration therein. Financial inclusion will strengthen financial depending and provide resources to the banks to expand credit delivery. Thus, financial inclusion will lead to financial development in our country which will help to accelerate economic growth.
REFERENCES 1. Economic growth, financial depending and financial inclusion by Dr. Rakesh mohan annual banker’s
conference 2006, at Hyderabad on Nov 2006.
2. Inclusive growth the role of financial education by shyamala gopinath, deputy governor RBI.
3. No-frills bank accounts financial inclusion is good economic by C.J. punnathara, business lines Thursday June 8, 2006.
4. Reserve bank of India. Government of India. Economic survey (various years), government of India New Delhi.
5. Sarma, M.2007 index of financial inclusion. Indian council for research on international economic relations, Delhi November 2007.

90
International Journal of Research in Management & Social Science Volume 5, Issue 3 (I): July - September, 2017
ISSN 2322 - 0899
6. Sarma, M.2008 index of financial inclusion. Indian council for research on international economic relations, Delhi June 2008.
7. Sherbet, G.(2009) Responding to new pressures Ithala limited changing role in serving the unbanked and the poor in KwaZilu-Natal. School of development studies research.no 79. Available from WWW.SDS.UKZN.AC.ZA.
8. Taking banking services to the common man-financial inclusion by V Leeladhar WWW.LIBF.ORG.IN WWW.RBI.ORG
9. Worthington, S.(2008)
10. Financial services for the unbanked in the US- way who and what? Journal of financial information, 101-105.

91
International Journal of Research in Management & Social Science Volume 5, Issue 3 (I): July - September, 2017
ISSN 2322 - 0899
HUMAN RESOURCES MANAGEMENT PRACTICES IN BANKING SERVICES IN INDIA
Dr. Vijaya Lakshmi Pothuraju Associate Professor, Department of Management Studies, Sagar Group of Institution, Hyderabad
ABSTRACT Effective management of human resources play a vital role in sound management of banks as human resource management is a central sub system of modern management system. Management of human resources, adaptation to any kind of change and effective functioning of banks are possible only when human resources are developed. Thus, HRD facilitated for all round development of banks in addition to allowing them to be dynamic and responsive to the environmental changes. The study on Human Resource Management practices in Banks, under present economic scenario in the country is essential to understand bank’s present HRM philosophy, practice and outcome with a view to offer suggestions for formulation of right philosophy and practice of HRM in Banks. The present study has been undertaken in view of the absence of systematic studied on the subject. Nationalization has changed the complexion and dimensions of banking services in India. It helped to hasten the pace of geographical and functional diversification. The new dimensions have placed the varying responsibilities on the shoulders of banks such as expansion of branch offices to unbanked and remote rural areas on a massive scale so as to cover small scale sector, cottage and rural industries, self-employed persons, artisans, weaker sections of the society, small traders and other persons of small means. The study covers all the important areas of human resource development in banks. These areas include conceptual clarification about human resource management in banks, essentials of HRM practices, sub-system of human resource management like performance appraisal, training, management development, career planning and development, organization development, participative management, quality circles etc. These primary areas of human resources practices will be studied thoroughly to the maximum extent through the means of discussion, interviews, reports, accounts, observations etc.
Key Words: Human Resources, Banking Services, Practices, Functions.
INTRODUCTION HRM Practices in banking industry in India have evolved over a long period of time through a reactive process. To understand the evolution of HRM Practices, it becomes necessary to examine the historical development of the establishment of these practices. To have an understanding of bank employees and their service conditions, one has to look back to early forties and fifties of the previous centuries and accept that the condition of bank employees vis-a-vis other middle and working class employees was worse. The employees in the sector were unorganized, had helplessly low wages, worked in inhuman and intolerable working conditions for unlimited working hours, had no leave facility, no security of service and the policy of hire and fire was ruling the roast.
Dramatic advances of Information and Communication Technology (ICT), changing mix and personal values of the workforce, emergence of the knowledge economy and increasing global competition have created enormous challenges on organizations. To cope with the challenges efficiently, human resource has been considered as one of the most important factors in today’s hypercompetitive market place. In the context of a developing economy like India, where the need for formation of capital is pressing, where developments in the field of industrial and bank management are dynamic, and where financial crises accompanying pangs of economic growth are frequent, the challenges posed by HRM are great importance; and, as a sequel, exploring the possibilities of the application of HRM becomes a very relevant field of enquiry and research. Beerdwell et. al. (1984) defined HRM as a strategic approach to the management of human resources that involves all management decisions and actions that affect the relationship between the organization and employees. Beardwell et al., (2004) regard HRM as the philosophy, policies, procedures, and practices related to the management of people within an organization.
SIGNIFICANCE OF THE STUDY The HRM is a growing concept. It has tremendous relevance to service sector like banking. Human input is the single largest input that goes in the banking industry. The level of efficiency/production of this input gets reflected in the quality of service offered by banks to its customers, as also in its ultimate growth, productivity and profitability. Hence, the banks today lay great stress on HRM functions.
92
International Journal of Research in Management & Social Science Volume 5, Issue 3 (I): July - September, 2017
ISSN 2322 - 0899
OBJECTIVES OF THE STUDY The objectives of the study are to identify HRM practices of banking Services in India. To that end, the specific objectives are: To provide an overview and analysis of HRM practices;
To focus the dimensions of HRM practices;
To provide some suggestions for improving HRM practices to provide better banking services.
LITERATURE REVIEW According to Macky & Boxall (2007), the scientific literature assumes a causal link flowing from HRM practices to organizational performance via the responses of employees. Organizations that do not pay equitably compared to others may lose their employee’s because of the non-competitive compensation package.
According to Lawler (2005), society has entered a new era in the relationship between organizations and their employees. In this new era, people are the primary source for a company’s competitive advantage and organizational prosperity and survival depends on how employees are treated.
According to Klaus et al. (2003), through better job assignment or work design, employees may display greater commitment, leading to better job performance
Buck and Watson’s (2002) indicated nine important HRM practices such as decentralization, Compensation, Participation, training, development, employment security, social interactions, management style, communications, and performance appraisal.
On the basis of the above literature review, the study consider the following dimensions of HRM practices have impacts on employees’ satisfaction towards organization such as recruitment and selection systems, compensation package, job security, career growth, training and development, management style, job design and responsibilities, reward and motivation, and working environment.
HRM IN INDIAN BANKS The study of HRM policies, practices and trends in banks has been made mainly on the basis of secondary data. The policies and practices with respect to recruitment, selection and promotion, compensation, training and development have been studied for public and private sector banks. There are 26 commercial banks operating in the public sector in India. SBI and its 5 Associate banks, 19 nationalized banks and IDBI Bank appear under the public sector. Out of 21 private sector commercial banks, 14 appear under old private sector banks, while the remaining 7 are grouped under new private sector banks. The data regarding all these banks and banking sectors has been gathered from different sources like the published documents, such as annual reports of the banks, manuals, office records of different Training Institutes, divisional offices and head offices of the sample banks and from other available published sources like various annual and monthly publications of Indian Banks Association, Bombay (IBA) and RBI Bulletins and supplements to RBI Bulletin, various journals related to banking industry, websites, etc. Following are some of the areas of concern regarding HRM policies and practices of the Indian banks which have been discussed here under:
1. Selection and Recruitment 2. Promotion 3. Compensation 4. Training and Development. An analysis of HRM policies and practices of the Indian public and private sector banks has also been done through “content analysis.‟ Total 29 different HRM areas have been identified with respect to recruitment, selection, promotion, compensation, training and development policies and practices; and these have been compared through “content analysis”.
MEETING HR CHALLENGES The banking sector has been growing at a very fast pace in India not only in the terms of its size but also in terms of the services being provided. With banks reaching the remote areas in the country one can anticipate positive things like financial aid to farmers and increased financial awareness. However, with the increase in size and activities of banks, the number of banks in private sectors has also increased thereby posing challenges like cost-efficiency, technological advancement, and credibility related issues. The task before the HR is to develop strategies that help banks in gaining competitive advantage and encourage innovation in its products and services.

93
International Journal of Research in Management & Social Science Volume 5, Issue 3 (I): July - September, 2017
ISSN 2322 - 0899
MANAGING HUMAN RESOURCE Considering the above HR challenges which our Indian banking industry is facing, we can manage the human resources by proper Planning like Hiring the right person for the right job Retaining and Developing Managing people/ conducting exit interviews
HIRING THE RIGHT PERSON FOR THE RIGHT JOB In assessing whether the "right person" has been selected for the "right job", the most prominent theoretical concept that emerges is the concept of "fit". Different writers emphasize different types of fit. Sekiguchi (2004: 179) in a review of literature on person-environment fit discusses two types of fit that emerge as the most prominent types of fit: person job fit and person-organization fit. In pursuing person-job fit, companies seek to match the job holder's knowledge, skills and abilities to the requirements of the job. Companies can ascertain person-organization fit by focusing on how well the individual fits with the culture or values of the company and the individual's capacity to work well with other company employees. Banks will have to plan for the following: A steady, carefully calibrated recruitment programme, As rapid technological changes transform business – continuous skill up-gradation. A new generation of the workforce will be working alongside an older generation as a team. Banking, in my opinion is a team work and this new situation will require cultural adjustments and therefore, change management.
RETAINING AND DEVELOPING EMPLOYEES We may be able to get the most suited people for our work but then the challenge is to retain these people and to develop them. There are several dimensions to this issue such as training/ re-skilling of employees, performance measurement, promotion policy, transfer policy, talent management, communication, etc. I will like to discuss some of them:
TRAINING AND DEVELOPMENT With drastic growth of banks it calls for efficient and well trained staff members to handle/deal with the consumer needs. Banks are shaping up as financial hub for their clients to grow in size and well recognized in the world market. To pull consumers banks are offering traditional with advance services like SMS banking, ATM, internet banking, priority banking, demat. So we can say that it caters to the need of the bottom to the highest class of society providing something to everyone. Universal banks have become modern day’s supermarket extending almost every facility of banking under one roof.
Banks like Bank of Baroda are conducting Grooming and etiquettes programmes for front-line employees and also for employees selected for overseas posting in order to improve their service levels and qualitative interaction with customers and various stakeholders better. SEED (Self efficiency and effectiveness development) programme being run for frontline staff of the Bank in order to improve their service skills and servicing efficiency.
In Punjab National Bank, in the light of the large scale human resources gaps that Bank is likely to face in the next few years need for Succession Policy has been felt. The Policy envisages mapping of the 'existing pool' against the 'future requirement' from the projected business figure to ensure that adequate number of officials are available in the pool and also to foresee the surplus / deficit in the pool for ascertaining the requirement of succession in a particular vertical.
PERFORMANCE MANAGEMENT Banking service is one sector where a great degree of attention is being paid to performance appraisal system. Several of the nationalized banks have changed their performance appraisal system or are in the process of changing them. In most of the banks that follows the traditional system, their officers are being assessed on the following characteristics: General Intelligence Job Knowledge Initiative and resourcefulness Supervision
94
International Journal of Research in Management & Social Science Volume 5, Issue 3 (I): July - September, 2017
ISSN 2322 - 0899
Business Capacity Ability to assess sound Business propositions Dependability Relationship with junior & senior colleagues Relationship with public Conduct, manners, Managerial ability Failures that attracted issue of warning by superiors
Several of the banks also have self-appraisal as a part of performance appraisal, although mostly such self-appraisal is more of a communication of achievements. A fair, transparent and objective mechanism for performance management is a must for all banks because an effective Performance Management System is the key to talent management and succession planning. RBI is shortly going to introduce a new Performance Management System that will work on goal setting, potential appraisal of performers and developing a talent pipeline. With all these changes we are also going to face major challenges on the Talent Management front. In coming times, the work force will get complex and there will be a need to juggle a wide variety of people with varied needs and preferences, resulting in an array of relationships between the organization and those who work for it. Peter Drucker had, more than a decade ago, expressed the need for what he called “non-traditional” work relations: flexible schedules, contract arrangements, virtual teams, etc.
MANAGING SEPARATION In recent years, with the high levels of attrition in the service sector, it has become imperative for firms to have a structured separation plan for orderly exits of employees. Of course, the concept of “pink slips” or involuntary exits are another matter altogether and involve some bitterness that results because of the employee losing his or her job. In conclusion, it is our view that employee separations must be handled in a professional and mature manner and though attrition is a fact that concerns everyone in the industry, once an employee decides to leave, the separation must be as smooth as possible.
ROLE OF HR MANAGER IN EXIT INTERVIEW Discover the employees reason for leaving Give positive attention to the departing employees in order to alleviate possible frustrations and/or negative
attitude toward the organization Allow departing employees to have a voice about what their work experience was like Receive valuable feedback from departing employees about compensation, working conditions,
management, and the culture of the organization Explore areas of the departing employee’s most serious concerns, and record details of what they enjoyed
most Departing employees have an opportunity to transfer knowledge and experience to a successor or
replacement; may also brief a team on current projects, issues and contacts
Chance for departing employees to give constructive feedback, and to leave on a positive note, with good relations and mutual respect
SOME OTHER HR PRACTICES AND BENEFITS GIVEN TO EMPLOYEES GRATUITY HDFC Bank provides for gratuity to all employees. The benefit is in the form of lump sum payments to vested employees on resignation, retirement, death while in employment or on termination of employment of an amount equivalent to 15 days basic salary payable for each completed year of service. Vesting occurs upon completion of five years of service.
SUPERANNUATION Employees of the Bank, above a prescribed grade, are entitled to receive retirement benefits under the Bank’s Superannuation Fund. The Bank contributes a sum equivalent to 13% of the employee’s eligible annual basic salary (15% for the Managing Director, Executive Directors and for certain eligible erstwhile Centurion Bank of Punjab (‘eCBoP’) staff) to insurance companies, which administer the fund. The Bank has no liability for

95
International Journal of Research in Management & Social Science Volume 5, Issue 3 (I): July - September, 2017
ISSN 2322 - 0899
future superannuation fund benefits other than its contribution, and recognizes such contributions as an expense in the year incurred, as such contribution is in the nature of defined contribution.
SHORT TERM EMPLOYEE BENEFITS In State Bank of India the undiscounted amount of short-term employee benefits, such as medical benefits, casual leave etc. which are expected to be paid in exchange for the services rendered by employees are recognized during the period when the employee renders the service.
The Bank operates a Provident Fund scheme. All eligible employees are entitled to receive benefits under the Bank’s Provident Fund scheme. The Bank contributes monthly at determined rate (currently 10% of employee’s basic pay plus eligible allowance). These contributions are remitted to a trust established for this purpose and are charged to Profit and Loss Account. The Bank provides for pension to all eligible employees. The benefit is in the form of monthly payments as per rules and regular payments to vested employees on retirement, on death while in employment, or on termination of employment. Vesting occurs at different stages as per rules. SUGGESTIONS The banking sector has grown from a few institutions primarily involved in deposit acceptance and trade finance into a complex multi-player markets where large number of commercial banks, financial institutions and specialized banks are operating with various product activities. Like many other organized sectors, banking requires multi-layer manpower for its various requirements of professionals and support staff. The range may require reasonably educated security guards on the one hand and a highly educated and trained professional as head of corporate finance. With liberalization of activities within the banking sector, for example, more emphasis on consumer and house finance and personal loans, etc Banking has turned itself into a more market based business where banks have expanded their reach more to customer’s door step in a big way making banking more practical. This has further highlighted the need for proper development of man power to run banks efficiently.
In spite of all these facilitations there still exist several lacunas in the HRM practices in banking industry. Some of the specific suggestions based on survey of literature as well as the group discussions and survey are given here under: There should be a balanced compromise between organizational need and individual need. Total
insensitiveness to individual preference gives rise to frustration at some point of time, which as a consequence has a real damaging effect on the organizational growth itself.
While there must be rewards for performance, non-performance must be punished/ reprimanded. Promotions must be only on merit.
There must be uniform, impartial and balanced “employee performance review system”. This system in fact needs a total review.
Enthusiastic and pleasant Behaviour of staff to the customer is necessary. There must be a clearly defined system of succession planning and career growth planning in banks. Attitudinal changes are required at the top level. Human resource Balance Sheet should accompany financial statements. In order to become HRD conscious, the Public Sector Banks should allow independent functioning of HRD
section, where the top person should be himself a good successful banker, a real HRD person free from any biases.
More openness, transparency in personal matters, high value of human dignity, people oriented management system, creating belongingness and trust, two-way communication.
Banks should have a system, whereby the training needs of an employee are identified and are duly fulfilled at every stage of career growth.
Have special R & D wings in HRD Department for ongoing in house & external research development, review and implementation of HRD policies.
There should be award schemes administered by prestigious organizations and Govt. agencies for best HRD policies & Practices amongst Public Sector Banks. Etc
REFERENCES Beardwell, I., Holden, L., Claydon, T. (2004). Human Resource Management a Contemporary Approach.
4th (edn.), Harlow: Prentice Hall.
96
International Journal of Research in Management & Social Science Volume 5, Issue 3 (I): July - September, 2017
ISSN 2322 - 0899
Macky, K., Boxall, P. (2007). The relationship between ‘high performance work practices’ and employee attitudes: an investigation of additive and interaction effects. The International Journal of Human Resource Management, 18(4), 537-567.
Lawler, E.E. (2005). Creating high performance organizations. Asia Pacific Journal of Human Resources, 43(1), 10-17.
Klaus, T., LeRouge, C., Blanton, J.E. (2003). An examination of the relationships between select nature of work characteristics and organizational commitment of IT professionals, Special Interest Group on Computer Personnel Research Annual Conference, Session 3.2, 147–149.
M. N. Rudrabasavaraj, Dynamic personnel Administration, Himalaya Publishing House, Bombay, 1979, p.39
Douglas Mc Gregor, The Human Side of Enterprise , Tata McGraw Hill Publishing Co., Ltd. Bombay, 1971, pp.3-4
Dunlop. Lohn T. Et.Al, Industrialism and industrial Man Reconsidered, Some Perspective on a Study over Two Decades of Problems of labour and Management in Economic Growth, The Inter-University study of Human resources in National Development, New Jersey, 1975,p.41.
Ernest Dale, Management Theory and Practice, McGraw Hill Book Company, New York, 1965.
Edwin. B. Flippo, Principles of Personnel Management, McGraw Hill Kogakusha Ltd., Tokyo, 1969, p.8
Human Resource Management in. Banks – Need for a New Perspective*. K. C. Chakrabarty. Shri Alok Misra, CMD, Bank of India, Dr. K. Ramakrishnan
97
International Journal of Research in Management & Social Science Volume 5, Issue 3 (I): July - September, 2017
ISSN 2322 - 0899
AN ANALYSIS ON THE CONSEQUENTIAL IMPACTS OF GENDER MAINSTREAMING IN EDUCATIONAL INSTITUTIONS FOR GENDER EQUITY MANAGEMENT USING FUZZY CLUSTERING
Nivetha Martin1, P. Pandiammal2 and W. Lilly Merline3 Faculty1, Department of Mathematics, Arul Anandar College, Madurai, Tamil Nadu
Faculty2, Department of Mathematics, GTN Arts College, Dindigul, Tamil Nadu Faculty3, Department of Mathematics, Periyar EVR College, Tiruchi, Tamil Nadu
ABSTRACT Gender is a socially built phenomenon which refers to the chronological and sociological association between men and women. Gender Bias and gender difference exists in all organizations and institutions at all levels and it act as hurdles for global growth. Imparting gender equality through education will pave way for creating gender equity society and it will be more realistic only when the implementation of gender mainstreaming takes place in educational institutions which highly focus on diminishing gender disparities. The main focus of this article is to throw lime light on the characteristics and the essentials of gender mainstreaming. This paper also aims in finding the consequential impacts of accomplishing gender mainstreaming in Educational institutions by using the concept of Fuzzy clustering, a scientific tool for systematic investigation and inference.
Keywords: Gender equity, gender mainstreaming, fuzzy, clustering, Educational Institutions.
1. INTRODUCTION Our Indian nation has undergone several transformations with regard to culture, civilization in the context of political, social, economic and religious dimensions for global growth, but the empowerment of the country depends on the status of gender equality, which is yet to be attained. The conventional societal set up has designated males to be dominant sector and categorized females as vulnerable. This traditional thought process paved the origin of gender discrimination and it got strengthened in all the earlier eras of Indian history. But in recent years the insight of women empowerment is taking its lead in various aspects which has initiated the ways of improving women’s societal status. In reality the women empowering process is not sustained at all stages which hurdles the attainment of gender equality. To enhance the position and power of women, education has to be imparted to make them dynamic, but the questions of equal opportunities are still to be answered. The existence of gender equity and gender sensitivity is not highly prevalent in educational institutions which have the prime responsibility of advocating to the society. To facilitate the thrive of society with gender equality, educational institutions have to take up gender mainstreaming, which means the persistent use of a gender perspective at all stages of the development and implementation of policies, plans, programmes and projects.
The concept of Gender Mainstreaming emerged in 1970’s which mainly focuses on integration of women’s concern rather than the addition of a women component; assimilation of women to financial systems for better amplification. Many sociologists and anthropologists are in favour of such policy perspectives as it opens the doors of WID approach, women in development. The literature also caters brief description about major gender issues in Higher Education. Women are disabled to continue their secondary and tertiary levels of education due to many factors. The exposure of new technology and training is first advocated to men rather than women with the pre built mind set of underestimation of women’s capacity and lack of education. In general women are considered to be physically weaker and socially diffident sector which deprive them the opportunities. Taiwo, 2014 has presented his works on the practices of gender mainstreaming in African nations in which he underlined the contribution of Wanda 2005, Assise-lumumba, 2008, Singh, 2008 with regard to the comparative statistical data of women status with that of men at administrative level in Asian and African nations. He also discussed the core reasons for such social stratification. He also strongly emphasized the consideration of gender as one of the ideologies of development will enable gender mainstreaming to gain attention.
This article foresees the effects of putting into practice of gender mainstreaming in educational institutions in Indian context so as to hatchet gender prejudice at elementary stage by inculcating gender equity education and providing a suitable platform for gender equity roles. As there are several substantial outcomes of gender mainstreaming, the most noteworthy of it has to be determined for creating strong grounds for it to pave way for institutional growth. There are several mathematical methods to resolve the core impact of gender mainstreaming, but in this paper to handle the realistic situations the concept of fuzzy clustering is used which resembles the inference process of conventional statistical methods of decision making employed in social research. These fuzzy clustering methods are highly feasible and they assist in finding the extent of compatibility of the factors considered for study.

98
International Journal of Research in Management & Social Science Volume 5, Issue 3 (I): July - September, 2017
ISSN 2322 - 0899
The paper is organized as follows: section 2 comprises of the methodology of fuzzy clustering, section 3 elucidates the consequential impacts of gender streaming in educational institutions, section 4 consists of the adaptation of the problem considered, section 5 contains the results and discussion and section 6 concludes the paper.
2. FUZZY CLUSTERING Clustering is a technique of grouping the similar factors, but practically factors will never fall only to one group always. Therefore conventional clustering is getting upgraded to fuzzy clustering which provides weightage for the factors to fall in many clusters. Suppose if we form three clusters namely low, moderate and high and consider the degree of influence of the factors for study. Some factors may fall in two clusters depending on the pragmatic analysis, which is the essence of fuzzy clustering.
2.1 METHODOLOGY To carry out the analysis the factors considered for study are fixed on a 10-point rating scale. The cluster 1 = Low is defined with the range 2.0 (beginning value 1)-5.5(ending value 1), cluster 2 = Moderate with range 3.0 (bv 2)-8.0 (ev 2), cluster 3 = High with range 7.0 (bv 3)-10 (ev 3). The mean value is found from the scale. The weightage for each factors are assigned as follows
If the calculated mean from the responses for a particular factor is > bv2 then the factor lies in both cluster 1 and cluster 2 with the weightage ev1 – mean : mean –bv2. If the mean value of the factor is > bv3, then the weightage for the factor to lie in cluster 2 and cluster 3 is ev2 – mean: mean –bv3. If the factors fall in only one cluster then the weightage is assigned to be 1. If the factors lie in many clusters then their sum of the weightage must be 1
3. CONSEQUENTIAL IMPACTS OF GENDER MAINSTREAMING IN EDUCATIONAL INSTITUTIONS
Gender mainstreaming has several positive components which together contribute for the stabilizing gender equity in educational institutions. The consequential impacts are listed as follows which were collected from a group of persons comprising of educationalists, sociologists and administrators at all echelons. 1. Equal employment opportunities will be given to all genders and a standard service ratio will be
maintained. 2. The female gender will be able to express and share their views and opinions on any issue. 3. The people of both the genders will get equal participation role in all the academic events. 4. Women gender will be given administrative responsibilities and they receive a space in decision making. 5. The institution will undergo overall growth in all dimensions. 6. The gender discrimination in the institution will get weakened. 7. Mutual and moral support towards the faculty members will take place. 8. Women gender will be acknowledged and recognized for their works. 9. Gender bias will begin to get declined. 10. The degree of work amicability will get enhanced. 11. The space for women empowerment and promotion of their status will get created in the institution. 12. Capacity building will get accelerated. 13. Gender issues will be addressed in a deeper sense. 14. Institution will get the capability to take up the problems of gender equity in the existing surroundings 15. Students will acquire a wide sense of understanding about gender equity and equality 16. The enrichment of the student’s knowledge on gender sensitivity will be a reality. 17. The chances for strengthening the competency of women gender will be made available. 18. Students will be made prepared to create gender unbiased society. 19. The resources of the institution will get manipulated if the decision authorities include women gender. 20. Women liberation gets enlightened. The above factors are the effects of putting gender mainstreaming into practice. The prime significant factor is determined in the following section using the computational tool.

99
International Journal of Research in Management & Social Science Volume 5, Issue 3 (I): July - September, 2017
ISSN 2322 - 0899
4. ADAPTATION OF THE METHOD TO STUDY The factors listed in section 3 are fixed in the 10 – point rating scale. The diagrammatic representation of Mean rating of Consequential impact level is given below.
Fig.1. Mean Impact Level of the Factors favouring Gender Mainstreaming
The classification of the clusters based on the impact level is tabulated as follows:
Table - 1: Classification of Clusters Cluster 1 Cluster 2 Cluster 3 Range 2.0-5.5 3.0-8.0 7.0-10 Mid-Value 3.75 5.5 8.5 Classification Low Moderate High
By applying the method of fuzzy clustering to the factors considered, the weightage of the factors are tabulated.
Table – 2: Weightage of the Factor’s Impactness Factors Mean Low Impact Moderate Impact High Impact
1. 8.2 0 0 1 2. 9.2 0 0 1 3. 9.1 0 0 1 4. 8.3 0 0 1 5. 9.0 0 0 1 6. 8.3 0 0 1 7. 9.2 0 0 1 8. 9.0 0 0 1 9. 8.9 0 0 1 10. 8.6 0 0 1 11. 8.2 0 0 1 12. 8.0 0 0 1 13. 8.1 0 0 1 14. 8.0 0 0 1 15. 8.8 0 0 1 16. 8.1 0 0 1 17. 8.2 0 0 1 18. 8.3 0 0 1 19. 7.5 0 0.5 0.5 20. 7.6 0 0.4 0.6

100
International Journal of Research in Management & Social Science Volume 5, Issue 3 (I): July - September, 2017
ISSN 2322 - 0899
5. RESULTS AND DISCUSSION The Table 2 clearly explicates the mean values of the factors and also it reveals the impactness degree of each factor considered favouring gender equity. The factors 2,3,5 and 8 have high mean values and all the factors taken for consideration fall in the cluster 3, which strongly emphasize that the implementation of gender mainstreaming in educational institutions will certainly add up to its growth. Secondly the most significant favouring factor is that women will get chances to share their views and equal participation roles will together promote institution to the next level of development. Inculcating value based system of education comprises all these concepts into consideration.
CONCLUSION This article has addressed the recent trends of stabilizing gender equity in terms of implementation of gender mainstreaming in institutions. The method of fuzzy clustering is used to find the weightage of factors so as to allocate the factors in the clusters of impact levels. The computational results in section 4 state that gender mainstreaming has positive and progressive reach and it will certainly render high support for the growth of the institution and the society. This paper also clearly states the attributes and role of gender mainstreaming.
REFERENCE Abiola, O. (2003). Women in Higher Education in Nigeria, MCGILL Journal of Education, 38(3).
Assié-Lumumba, N.T. (2007). Human Capital, Human Capabilities, and Gender Equality: Harnessing the Development of Human Potential as a Human Right and the Foundation for Social Progress. In: Assié-Lumumba, N .T. (ed.), Women and Higher Education in Africa Reconceptualizing Gender-based Human Capabilities and Upgrading Human Rights To Knowledge, Abidjan, CEPARRED. Forthcoming
Bhasin, K (1993). Education for Women Empowerment: Some Reflections in Adult Education and Development. German Adult Education Association. Book, PP. 11 – 24
Etzkowitz, H, Kemelgor, C. and Uzzi, B. (2000) Athena Unbound The Advancement of Women in Science and Technology, Cambridge: Cambridge University Press
European Commission Research Directorate-General (2000) Science policies in the European Union: Promoting excellence through mainstreaming gender equality. A report from the ETAN (European Technology Assessment Network) Expert Working Group on Women and Science, Brussels: European Commission Research Directorate-General accessed from Federal Ministry of Education (2006) Education Sector Situation Analysis, Abuja: FME.
Kumar, L. Jeyaseelan, S. Suresh, RC, Ahuja (2005), “Domestic violence and its mental health correlates in Indian women”, Br J Psychiatry .
Singh, JKS. (2008) Still a Single Sex Profession? Female Staff Numbers in Commonwealth Universities. London, Association of Commonwealth Universities. UNDP (2002). Gender mainstreaming: learning and development pack. New York: UNDP. World Bank (2004) Gender stats. [online] Available from: http://devdata.worldbank.org/edstats/ & http://devdata. worldbank.org/ genderstats/ [Accessed November 2012]
Strauss, (2007) “Conflict Tactics Scales. In: NA. Jackson, editor Encyclopedia of Domestic violence”,
TAIWO modupeoladunni (2014), Best Practices in Gender Mainstreaming in the Academia: Lessons from African Higher Education Institutions, International Journal of Humanities Social Sciences and Education (IJHSSE) Volume 1, Issue 10, October 2014, PP 81-87
Varma, PS. Chandra, T. Thomas, MP. Carey (2007), Intimate partner violence and sexual coercion among pregnant women in India: Relationship with depression and post traumatic stress disorder. J Affect Disord; 102:227-35.
Zimmermann (2011) , “Fuzzy Set Theory and its application”, Fourth Edition Springer .

International Journal of Research in Management & Social Science is a quarterly double blind reviewed research journal of Empyreal Institute of Higher Education, Guwahati, India. It seeks to provide a platform to research scholars, practicing managers, and academicians in business management, commerce and allied fields, to present their research findings and share their views and experiences. Its aim is to promote research education worldwide and to establish acquaintances between management and Information Technology. The journal focuses on issues related to the development and implementation of new methodologies and technologies, which improve the operational objectives of an organization. These include, Project management, logistics, production management, e-commerce, quality management, financial planning, risk management, General Management, Banking, Insurance, International Business, Health Care Administration, Human Resource Management , Non-Profit Organizations, Operations Research/Statistics, Operations Management, Organizational Behavior and Theory, Organizational Development, Organizational Management, Production/Operations, Public Administration, Purchasing/Materials Management, Entrepreneurship, Strategic Management Policy, Technology/Innovation, Tourism and Hospitality, Supply Chain Management, Rural Management, Public Management, Knowledge Management, Business Ethics, Corporate Social Responsibility , Negotiations and Competitive Decision Making, Data Analysis, Hotel Management and emerging trends in allied subjects. The journal provides a forum for researchers and practitioners for the publication of innovative scholarly research, which contributes to the adoption of a new holistic managerial approach that ensures a technologically, economically, socially and ecologically acceptable deployment of new technologies in today’s business practices.
ABOUT THE JOURNAL
Guidelines for Contributors
1. Manuscripts should be submitted preferably through email and the research article / paper should
preferably not exceed 8 – 10 pages in all.
2. Book review must contain the name of the author and the book reviewed, the place of publication and publisher, date of publication, number of pages and price.
3. Manuscripts should be typed in 12 font-size, Times New Roman, single spaced with 1” margin on a standard A4 size paper. Manuscripts should be organized in the following order: title, name(s) of author(s) and his/her (their) complete affiliation(s) including zip code(s), Abstract (not exceeding 350 words), Introduction, Main body of paper, Conclusion and References.
4. The title of the paper should be in capital letters, bold, size 16” and centered at the top of the first page. The author(s) and affiliations(s) should be centered, bold, size 14” and single-spaced, beginning from the second line below the title.
First Author Name1, Second Author Name2, Third Author Name3 1Author Designation, Department, Organization, City, email id 2Author Designation, Department, Organization, City, email id
3Author Designation, Department, Organization, City, email id 5. The abstract should summarize the context, content and conclusions of the paper in less than 350
words in 12 points italic Times New Roman. The abstract should have about five key words in alphabetical order separated by comma of 12 points italic Times New Roman.
Examples of References
All references must be arranged first alphabetically and then it may be further sorted chronologically also. Abrams, F. W., (1951), ‘Managements Responsibilities in a Complex World’, Harvard Business
Review, 29(3): 29 – 34.
Bateson, C. D.,(2006), ‘Doing Business after the Fall: The Virtue of Moral Hypocrisy’, Journal of Business Ethics, 66: 321 – 335
French, P. A. (1984), “Collective and Corporate Responsibility”, Colombia University Press, New York.
Morris, C. (1999) Quantitative Approaches to Business Studies (5th edn), London, Financial Times Pitman Publishing.
Khushalani, Lakhan and Kulkarni, Prasad (2007), “Network Security”, Presented at the National Conference on Emerging Technologies in Control and Instrumentation, October 19-20 2007, Mumbai: TSEC, 53 – 55.
Dees, J.G. (2001), “The Meaning of Social Entrepreneurship”, Retrieved from: http://www.caseatduke.org/documents/dees_sedef.pdf (accessed 10th December 2010).
K. Mae Heussner (2008). Jeff Ooi - from digital to political clout? Accessed 15 May 2008 from http://www.Malaysiakini.com.news/78757.

INDEXED AT