volume 75 j number 5 j october 2010 american sociological ... · the electronic files should be...
TRANSCRIPT
volume 75 j number 5 j october 2010
j A Journal of the American Sociological Association j
AmericanSociological
ReviewQ
Racial and Ethnic inEquality
Racial Segregation and the American Foreclosure Crisis Jacob S. Rugh and Douglas S. Massey
Stratification by Skin Color in Contemporary Mexico Andrés Villarreal
WoRkplacE dynamics
Personal Characteristics, Sexual Behaviors, and Male Sex Work Trevon D. Logan
The Motherhood Penalty across White Women’s Earnings DistributionMichelle J. Budig and Melissa J. Hodges
cRoss-national invEstigations
Postwar Labor’s Share of National Income in Capitalist DemocraciesTali Kristal
The Rise of the Nation-State across the World, 1816 to 2001Andreas Wimmer and Yuval Feinstein
suRvEy mEthods
Requests, Blocking Moves, and Rational (Inter)action in Survey IntroductionsDouglas W. Maynard, Jeremy Freese, and Nora Cate Schaeffer
ASR_v75n1_Mar2010_cover revised.indd 1 01/10/2010 7:44:45 PM

ASA Members of the Council
Editors
Deputy Editors
Tony N. Brown
Vanderbilt University
Katharine M. Donato
Vanderbilt University
Larry W. Isaac
Vanderbilt University
Holly J. McCammon
Vanderbilt University
Nicola BeiselNorthwestern
Claudia BuchmannOhio State
Karen CookStanford
Daniel Cornfield Vanderbilt
Guang GuoUNC, Chapel Hill
Gary JensenVanderbilt
Editorial Board
Patricia A. AdlerColorado
Sigal AlonTel-Aviv U.
Edwin AmentaUC, Irvine
Kenneth T. AndrewsUNC, Chapel Hill
Sandra L. BarnesVanderbilt
Paul E. BellairOhio State
Lawrence D. BoboHarvard
Kenneth A. BollenUNC, Chapel Hill
John Sibley ButlerUT, Austin
William C. CockerhamAlabama-Birmingham
Mark CooneyGeorgia
William F. DanaherCollege of Charleston
Timothy J. DowdEmory
Jaap DronkersMaasticht U.
Mitchell DuneierPrinceton & CUNY
Jennifer EarlUC, Santa Barbara
Rachel L. EinwohnerPurdue
Wendy Nelson Espeland
Northwestern
Ron F. EyermanYale
Joseph GalaskiewiczArizona
Adam GamoranWisconsin
Peggy C. GiordanoBowling Green
Karen HeimerIowa
Rubén Hernández-León
UCLA
Alexander HicksEmory
Dennis P. HoganBrown
Gregory HooksWashington State
Matt L. HuffmanUC, Irvine
Guillermina JassoNYU
Gloria Jones-JohnsonIowa State
Prema KurienSyracuse
Erin LeaheyArizona
Matthew R. LeeLouisiana State
Nan LinDuke
J. Scott LongIndiana
Wendy D. ManningBowling Green
Karin A. MartinMichigan
Cecilia MenjivarArizona State
Joya MisraMassachusetts,
Amherst
Phyllis MoenMinnesota
John F. MylesToronto
Orlando PattersonHarvard
Trond PetersenUC, Berkeley
Townsand Price-Spratlen
Ohio State
Charles C. RaginArizona
Raka RayUC, Berkeley
Jen’nan ReadDuke
Linda RenzulliGeorgia
Barbara Jane RismanUI, Chicago
William G. RoyUCLA
Deirdre RoysterNYU
Rogelio SaenzTexas A&M
Vicki SmithUC, Davis
David T. TakeuchiWashington
Maxine S. ThompsonNC State
Andrés VillarrealUT, Austin
Henry A. WalkerArizona
Mark WarrUT, Austin
Bruce WesternHarvard
Mark WesternQueensland
Jonathan ZeitlinWisconsin
American Sociological Review
Managing EditorMara Nelson Grynaviski
Editorial CoordinatorLaura White Dossett
Senior Editorial AssociateHeather Hensman Kettrey
Editorial AssociateMary Laske
Editorial Assistants
Kate Pride BrownBecky Conway
Carly Rush Samuel C. Shaw
Jarrett Thibodeaux
Randall Collins, President, PennsylvaniaDavid Snow, Vice President,
California-IrvineCatherine White Berheide, Secretary,
Skidmore College
Erik Olin Wright, President-Elect, Wisconsin-Madison
Edward Telles, Vice President-Elect, PrincetonEvelyn Nakano Glenn, Past President,
California-Berkeley
John Logan, Past Vice President, Brown Donald Tomaskovic-Devey,
Past Secretary, Massachusetts-AmherstSally T. Hillsman, Executive Officer
Elected-at-Large
Sarah Fenstermaker, California-Santa Barbara
Rosanna Hertz, Wellesley College
Pierrette Hondagneu-Sotelo, Southern California
Jennifer Lee, California-Irvine
Omar M. McRoberts, Chicago
Cecilia Menjivar, Arizona State College
Debra Minkoff, Barnard
Joya Misra, Massachusetts-Amherst
Mario Luis Small, Chicago
Sandra Smith, California-Berkeley
Sarah Soule, Stanford
Robin Wagner-Pacifici, Swarthmore College
ASR_v75n1_Mar2010_cover revised.indd 2 01/10/2010 7:44:45 PM

Contents
Articles
Racial Segregation and the American Foreclosure Crisis Jacob S. Rugh and Douglas S. Massey 629
Stratification by Skin Color in Contemporary Mexico Andrés Villarreal 652
Personal Characteristics, Sexual Behaviors, and Male Sex Work: A Quantitative Approach Trevon D. Logan 679
Differences in Disadvantage: Variation in the Motherhood Penalty across White Women’s Earnings Distribution Michelle J. Budig and Melissa J. Hodges 705
Good Times, Bad Times: Postwar Labor’s Share of National Income in Capitalist Democracies Tali Kristal 729
The Rise of the Nation-State across the World, 1816 to 2001 Andreas Wimmer and Yuval Feinstein 764
Calling for Participation: Requests, Blocking Moves, and Rational (Inter)action in Survey Introductions Douglas W. Maynard, Jeremy Freese, and Nora Cate Schaeffer 791
Erratum 815
Volume 75 Number 5 October 2010
American Sociological Review

The American Sociological Review (ISSN 0003-1224) is published bimonthly in February, April, June, August, October, and December on behalf of the American Sociological Association by Sage Publications, 2455 Teller Road, Thousand Oaks, CA 91320. Copyright ©2010 by American Sociological Association. All rights reserved. No portion of the contents may be reproduced in any form without written permission from the publisher. Periodicals postage paid at Thousand Oaks, California, and at additional mailing offices. POSTMASTER: Send address changes to American Sociological Review, c/o SAGE Publications, Inc., 2455 Teller Road, Thousand Oaks, CA 91320.
Scope and Mission: The American Sociological Review (ASR) publishes original (not previously published) works of interest to the discipline in general, new theoretical developments, results of qualitative or quantitative research that advance our understanding of fundamental social processes, and important methodological innovations. All areas of sociology are welcome. Emphasis is on exceptional quality and general interest.
Ethics: Submission of a manuscript to another professional journal while it is under review by the ASR is regarded by the ASA as unethical. Significant findings or contributions that have already appeared (or will appear) elsewhere must be clearly identified. All persons who publish in ASA journals are required to abide by ASA guidelines and ethics codes regarding plagiarism and other ethical issues. This requirement includes adhering to ASA’s stated policy on data-sharing: “Sociologists make their data available after completion of the project or its major publications, except where proprietary agreements with employers, contractors, or clients preclude such accessibility or when it is impossible to share data and protect the confidentiality of the data or the anonymity of research participants (e.g., raw field notes or detailed information from ethnographic interviews)” (ASA Code of Ethics, 1997).
Manuscript Submission Format: Manuscripts should meet the format guidelines specified in the Notice to Contributors published in the February and August issues of each volume. The electronic files should be composed in MS Word, WordPerfect, or Excel. All text must be printed double-spaced on 8-1/2 by 11 inch white paper. Use Times New Roman, 12-point size font. Margins must be at least 1 inch on all four sides. On the title page, note the manuscript’s total word count (include all text, references, and footnotes; do not include word counts for tables or figures). You may cite your own work, but do not use wording that identifies you as the author.
Submission Requirements: Submit two (2) print copies of your manuscript and an abstract of 150 to 200 words. Include all electronic files on a CD. Enclose a $25.00 manuscript processing fee in the form of a check or money order payable to the American Sociological Association. Provide an e-mail address and ASR will acknowledge the receipt of your manuscript. In your cover letter, you may recom-mend specific reviewers (or identify individuals ASR should not use). Do not recommend colleagues, collaborators, or friends. ASR may choose to disregard your recommendation. Manuscripts are not returned after review.
Address for Manuscript Submission: American Sociological Review, PMB 351803, 2301 Vanderbilt Place, Nashville, TN 37235; phone: 615-343-0426 (e-mail: [email protected]).
Editorial Decisions: Median time between submission and decision is approximately 12 weeks. Please see the ASR journal website for more information (http://www2.asanet.org/journals/asr/).
Non-Member Subscription Information: All non-member subscription inquiries, orders, back issues, claims, and renewals should be addressed to SAGE Publications, 2455 Teller Road, Thousand Oaks, CA 91320; telephone: (800) 818-SAGE (7243) and (805) 499-0721; fax: (805) 375-1700; e-mail: [email protected]; http://www.sagepublications.com. Subscription Price: Institutions: $311 (online/print), $280 (online only). Individual subscribers are required to hold ASA membership. For all customers outside the Americas, please visit http://www.sagepub.co.uk/customerCare.nav for information. Claims: Claims for undelivered copies must be made no later than six months following month of publication. The publisher will supply replacement issues when losses have been sustained in transit and when the reserve stock will permit.
Member Subscription Information: American Sociological Association member inquiries, change of address, back issues, claims, and membership renewal requests should be addressed to the Executive Office, American Sociological Association, 1430 K Street NW, Suite 600, Washington, DC 20005; website: http://www.asanet.org; e-mail: [email protected]. Requests for replacement issues should be made within six months of the missing or damaged issue. Beyond six months and at the request of the American Sociological Association the publisher will supply replacement issues when losses have been sustained in transit and when the reserve stock permits.
Abstracting and Indexing: Please visit http://asr.sagepub.com and, under the “More about this journal” menu on the right-hand side, click on the Abstracting/Indexing link on the left-hand side to view a full list of databases in which this journal is indexed.
Copyright Permission: Permission requests to photocopy or otherwise reproduce material published in this journal should be submitted by accessing the article online on the journal’s website at http://asr.sagepub.com and selecting the “Request Permission” link. Permission may also be requested by contacting the Copyright Clearance Center via their website at http://www.copyright.com, or via e-mail at [email protected].
Advertising and Reprints: Current advertising rates and specifications may be obtained by contacting the advertising coordinator in the Thousand Oaks office at (805) 410-7772 or by sending an e-mail to [email protected]. To order reprints, please e-mail [email protected]. Acceptance of advertising in this journal in no way implies endorsement of the advertised product or service by SAGE or the American Sociological Association. No endorsement is intended or implied. SAGE reserves the right to reject any advertising it deems as inappropriate for this journal.
Change of Address for Non-Members: Six weeks’ advance notice must be given when notifying of change of address. Please send the old address label along with the new address to the SAGE office address above to ensure proper identification. Please specify name of journal.
The American Sociological Association acknowledges with appreciation the facilities and assistance provided by Vanderbilt University.
Printed on acid-free paper

Racial Segregation and theAmerican Foreclosure Crisis
Jacob S. Rugha and Douglas S. Masseya
Abstract
The rise in subprime lending and the ensuing wave of foreclosures was partly a result of mar-ket forces that have been well-identified in the literature, but it was also a highly racializedprocess. We argue that residential segregation created a unique niche of minority clients whowere differentially marketed risky subprime loans that were in great demand for use inmortgage-backed securities that could be sold on secondary markets. We test this argumentby regressing foreclosure actions in the top 100 U.S. metropolitan areas on measures of black,Hispanic, and Asian segregation while controlling for a variety of housing market conditions,including average creditworthiness, the extent of coverage under the Community Reinvest-ment Act, the degree of zoning regulation, and the overall rate of subprime lending. Wefind that black residential dissimilarity and spatial isolation are powerful predictors of fore-closures across U.S. metropolitan areas. To isolate subprime lending as the causal mecha-nism through which segregation influences foreclosures, we estimate a two-stage leastsquares model that confirms the causal effect of black segregation on the number and rateof foreclosures across metropolitan areas. We thus conclude that segregation was an impor-tant contributing cause of the foreclosure crisis, along with overbuilding, risky lending prac-tices, lax regulation, and the bursting of the housing price bubble.
Keywords
segregation, foreclosures, race, discrimination
Four decades after passage of the Fair Hous-
ing Act, residential segregation remains
a key feature of America’s urban landscape.
Levels of black segregation have moderated
since the civil rights era, but declines are
concentrated in metropolitan areas with small
black populations (Charles 2003). In areas
with large African American communities—
places such as New York, Chicago, Detroit,
Atlanta, Houston, and Washington—declines
have been minimal or nonexistent (Iceland,
Weinberg, and Steinmetz 2002). As a result,
in 2000 a majority of black urban dwellers
continued to live under conditions of hyper-
segregation (Massey 2004). At the same
time, levels of Hispanic segregation have
been rising; during the 1990s, Latinos in
New York and Los Angeles joined African
Americans among the ranks of the hyper-
segregated (Wilkes and Iceland 2004).
Although much of the increase in Hispanic
segregation stems from rapid popula-
tion growth during a period of mass immigra-
tion, levels of anti-Latino prejudice and
aPrinceton University, Office of Population
Research
Corresponding Author:Douglas S. Massey, Princeton University, Office
of Population Research, Wallace Hall, Princeton,
NJ 08544
E-mail: [email protected]
American Sociological Review75(5) 629–651� American SociologicalAssociation 2010DOI: 10.1177/0003122410380868http://asr.sagepub.com
discrimination have also risen in recent years
(Charles 2003; Massey 2009; Ross and
Turner 2005). In addition, much research
shows that dark-skinned Latinos experience
higher levels of segregation than do their
light-skinned counterparts (Denton and Mas-
sey 1989; Massey and Bitterman 1985; Mas-
sey and Denton 1992).
During the 1990s, rates of subprime mort-
gage lending, home equity borrowing, and
home ownership increased among minorities;
in the context of high segregation, many
new borrowers were necessarily located in
minority neighborhoods (Been, Ellen, and
Madar 2009; Squires, Hyra, and Renner
2009). Williams and colleagues (2005) esti-
mate, for example, that subprime lending ac-
counted for 43 percent of the increase in
black home ownership during the 1990s and
33 percent of the growth in ownership within
minority neighborhoods. As a result, when the
housing bubble burst in 2007 and deflated in
2008 and 2009, the economic fallout was
unevenly spread over the urban landscape
(Immergluck 2008). Given that segregation
concentrates the effects of any economic
downturn spatially (Massey and Denton
1993), the rise in foreclosures hit black and
Hispanic neighborhoods with particular force
(Bromley et al. 2008; Hernandez 2009; Im-
mergluck 2008; Schuetz, Been, and Ellen
2008).
Economic studies generally conclude that
leveraged refinancing, overbuilding, the col-
lapse of home prices, and a poorly regulated
mortgage market were primarily responsible
for the rise in foreclosures across metropolitan
areas (Doms, Furlong, and Krainer 2007; Ger-
ardi, Shapiro, and Willen 2009; Glaeser,
Gyourko, and Saiz 2008; Haughwout, Peach,
and Tracy 2008; Khandani, Lo, and Merton
2009). We argue that the foreclosure crisis
also had significant racial dimensions.
Although prior research has considered race
as a factor, it was mainly to attribute inter-
group disparities in defaults and foreclosures
to minority group members’ weaker econo-
mic position. A careful reading of recent
scholarship on segregation and mortgage
lending reveals, however, that racial discrimi-
nation occurred at each step in the complex
chain of events leading from loan origination
to foreclosure (Bond and Williams 2007;
Immergluck 2009; Stuart 2003; Williams,
Nesiba, and McConnell 2005; Wyly et al.
2006). Specifically, ongoing residential segre-
gation and a historical dearth of access to
mortgage credit in U.S. urban areas combined
to create ideal conditions for predatory lending
to poor minority group members in poor
minority neighborhoods (Been et al. 2009;
Squires et al. 2009). This racialized the ensu-
ing foreclosure crisis and focused its negative
consequences disproportionately on black bor-
rowers and home owners (Hernandez 2009;
Oliver and Shapiro 2006; Shapiro, Meschede,
and Sullivan 2010; Wyly et al. 2006, 2009).
SEGREGATION AND THEFORECLOSURE CRISIS
High levels of segregation create a natural
market for subprime lending and cause
riskier mortgages, and thus foreclosures, to
accumulate disproportionately in racially
segregated cities’ minority neighborhoods.
By definition, segregation creates minority-
dominant neighborhoods, which, given the
legacy of redlining and institutional discrim-
ination, continue to be underserved by main-
stream financial institutions (Renuart 2004;
Ross and Yinger 2002). Moreover, the finan-
cial institutions that do exist in minority
areas are likely to be predatory—for exam-
ple, pawn shops, payday lenders, and check
cashing services that charge high fees and
usurious rates of interest—so that minority
group members are accustomed to exploita-
tion and frequently unaware that better serv-
ices are available elsewhere (Immergluck
and Wiles 1999). Segregation also spatially
concentrates the disadvantages associated
with minority status, such as poverty and job-
lessness (Massey and Fischer 2000). When
the economy stagnated, families in minority
630 American Sociological Review 75(5)
neighborhoods were more likely than others
to turn to home equity loans as a means of
maintaining consumption, thereby creating
a ready demand for unscrupulous brokers to
exploit (Sullivan, Warren, and Westbrook
2000).
Under conditions of high residential segre-
gation, individual disadvantages associated
with minority status are compounded in space
and amplified in markets that are necessarily
organized geographically (Dymski and Veitch
1992; Immergluck 2008). By concentrating
underserved, financially unsophisticated, and
needy minority group members who are
accustomed to exploitation in certain well-
defined neighborhoods, segregation made it
easy for brokers to target them when market-
ing subprime loans (Stuart 2003). Avery, Bre-
voort, and Canner (2008) found that among
mortgage lenders who went bankrupt in
2007, black borrowers who received loans in
2006 were three times more likely to receive
a subprime than a prime loan (74 versus 26
percent) and Hispanics were twice as likely
to receive a subprime than a prime loan (63
versus 37 percent). By contrast, whites were
slightly more likely to get a prime than a sub-
prime loan from the same lenders (46 versus
54 percent). Among institutions that did not
go bankrupt in 2007, blacks who borrowed in
2006 were just as likely to receive prime as
subprime loans (51 versus 49 percent), under-
scoring the discriminatory nature of predatory
lending practices in the United States.
Securitization and Rewards to
Risky Lending
Residential segregation has always created
dense concentrations of potentially exploitable
clients in need of capital, but in the 1990s,
these borrowers’ attractiveness to mortgage
lenders changed. Before the 1980s, lenders
avoided inner-city minority neighborhoods
through a combination of fear, prejudice,
and institutional discrimination (Squires
1994). The invention of securitized mortgages,
however, changed the calculus of mortgage
lending and made minority households very
desirable as clients. Indeed, the spread of
mortgage-backed securities during the 1980s
transformed home lending throughout the
United States by splitting apart the origination,
servicing, and selling of mortgages into dis-
crete transactions that made it possible for
banks to earn more money quickly by originat-
ing and selling loans than by lending money
and collecting interest payments over time
(Raynes and Rutledge 2003; Sowell 2009).
The advent of securitized mortgages
transformed what had been a bank-based
intermediary credit system into a securities-
based market system (Dymski 2002). In so
doing, the new financial instruments vastly
expanded the pool of money available for
lending. Under traditional systems of lend-
ing, the number of mortgages was limited
by the amount of deposits a bank had on
hand to lend. Under the new system, the vol-
ume of mortgages was no longer limited by
deposits, but by the number of potential bor-
rowers and investors’ willingness to pur-
chase mortgage-backed securities. The new
arrangements thus created a demand on the
part of banks to expand the pool of
borrowers.
Securitized mortgages are not sold whole
but are pooled together and divided into dif-
ferent shares, or tranches, on the basis of
risk (Raynes and Rutledge 2003). High inter-
est mortgages pay more to investors, of
course, but they also carry more risk; to man-
age the risk, financial engineers combined dif-
ferent risk tranches into diversified bonds that
could be sold on secondary markets. By mix-
ing different tranches together, financiers
could create a salable security with almost
any risk rating and interest rate they wished.
In theory, the risk of default by borrowers in
high-risk tranches was offset by the surety
of payments within low-risk tranches, thereby
yielding a relatively safe investment that rat-
ing services beholden to the financiers were
happy to affirm for a generous fee (Raynes
and Rutledge 2003).
Rugh and Massey 631

Because virtually any mortgage, however
shaky, could be sold and repackaged as part
of a collateralized debt obligation, risky bor-
rowers who were formerly shunned by lenders
suddenly became quite attractive. The resul-
tant wave of predatory lending was spear-
headed by independent mortgage brokers
who did not bear the risk of their reckless
lending practices. They simply generated
mortgages and immediately sold them to
banks and other financial institutions, which
in turn capitalized the shaky subprime instru-
ments as securities and sold them to third-
party investors who ended up assuming the
risk, typically in ways they neither appreciated
nor understood (Engel and McCoy 2007;
Lewis 2010; Peterson 2007). These lucrative
subprime lending and securitization practices
did not suddenly appear ‘‘at the fringes of
finance,’’ but were produced and legitimated
by the financial industry using new, high-
tech tools such as credit scoring, risk-based
pricing, securitization, credit default swaps,
and variable rate mortgages that were billed
as rational, scientific, and safe (Langley
2008, 2009; Stuart 2003).
How Segregation Shaped Unequal
Lending
With the move to securitized lending, dis-
crimination in real estate lending shifted
from the outright denial of home loans to
the systematic marketing of predatory loans
to poor black and Hispanic households,
which were easily found within segregated
neighborhoods (Engel and McCoy 2008;
Massey 2005a). Before the subprime boom,
black borrowers were more likely to be
denied loans overall, especially in white
areas, whereas whites were often denied
loans in minority neighborhoods (Holloway
1998). During the boom, minority borrowers’
underserved status made them prime targets
for subprime lenders who systematically tar-
geted their communities for aggressive
marketing campaigns (Dymski and Veitch
1992; Holloway 1998; Stuart 2003). Discrim-
inatory real estate practices (e.g., steering)
prevented black and Latino homebuyers
from accessing better housing and sounder
loan products in affluent suburbs (Friedman
and Squires 2005; Hanlon 2010) and chan-
neled them into depressed inner-ring suburbs
that were undergoing sustained disinvest-
ment (Hackworth 2007).
In a very real way, as Williams and col-
leagues (2005) show, the old inequality in
home lending made the new inequality possi-
ble by creating geographic concentrations of
underserved, unsophisticated consumers that
unscrupulous mortgage brokers could easily
target and efficiently exploit (see also Hernan-
dez 2009; Lee 1999). A study of subprime
borrowers in Los Angeles, Oakland, Sacra-
mento, and San Diego found that African
Americans were significantly more likely
than whites (40 versus 24 percent) to report
lender marketing efforts as the impetus for
taking out a home equity loan (California
Reinvestment Committee 2001). In the end,
subprime lending not only saddled borrowers
with onerous terms and unforeseen risks, but
it also reinforced existing patterns of racial
segregation and deepened the black-white
wealth gap (Bond and Williams 2007; Fried-
man and Squires 2005; Williams et al. 2005).
In the new regime of racial inequality,
African American and Latino homeowners
bore a disproportionate share of costs stem-
ming from the bursting of the housing bubble.
Compared with whites with similar credit pro-
files, down payment ratios, personal charac-
teristics, and residential locations, African
Americans were much more likely to receive
subprime loans (Avery, Brevoort, and Canner
2007; Avery, Canner, and Cook 2005; Bocian,
Ernst, and Li 2006; Pennington-Cross, Yezer,
and Nichols 2000). Moreover, after control-
ling for background factors, black and His-
panic homeowners were significantly more
likely than whites to receive loans with unfa-
vorable terms such as prepayment penalties
(Bocian et al. 2006; Farris and Richardson
2004; Quercia, Stegman, and Davis 2007;
632 American Sociological Review 75(5)

Squires 2004), higher cost ratios (Elliehausen,
Staten, and Steinbuks 2008; LaCour-Little and
Holmes 2008), and higher rate spreads (Bo-
cian et al. 2006). The racial gap in subprime
lending holds across all income levels (Brom-
ley et al. 2008; Immergluck and Wiles 1999;
Williams et al. 2005), with perhaps an
increase at higher income levels (Institute on
Race and Poverty 2009; Williams et al. 2005).
During the 1990s, the United States was
increasingly characterized by a dual, racially
segmented mortgage market, one that was
structured by the race of borrowers and the
racial composition of neighborhoods (Apgar
and Calder 2005; Stuart 2003; U.S. Depart-
ment of Housing and Urban Development
2000). Controlling for neighborhood charac-
teristics, the incidence of subprime lending
was significantly greater among black and
Hispanic borrowers (Calem, Hershaff, and
Wachter 2004) and among people who had
not gone to college (Manti, Raca, and Zorn
2004). As a result, from 1993 to 2000, the
share of subprime mortgages going to house-
holds in minority neighborhoods rose from 2
to 18 percent (Williams et al. 2005).
The rise of racially targeted subprime lend-
ing destabilized minority neighborhoods by
increasing turnover (Gerardi and Willen
2008), and the destabilizing effects on home-
ownership did not remain confined to minor-
ity neighborhoods, but spilled over into
adjacent white and mixed neighborhoods
(Schuetz et al. 2008). National evidence
from a longitudinal study of homeowners
from 1999 to 2005 shows that the racial gap
in homeownership exit rates widened in
a way that cannot be explained by social, eco-
nomic, or financial factors that historically ac-
counted for black-white differentials (Turner
and Smith 2009). The coincidence of the
peak in subprime lending with the inexplica-
ble decline in the stability of black home own-
ership and exit rates offers compelling
evidence that segregation and the new face
of unequal lending combined to undermine
black residential stability and erode any accu-
mulated wealth (Shapiro et al. 2010).
Race and the Housing Bust
From a lender’s perspective, the new system
worked well as long as real estate and lend-
ing markets remained liquid and housing pri-
ces continued to rise. For a while, minority
ownership rates rose and everyone involved
in securitized lending made good money—
the broker who originated the loan, the lender
who put up the money, the firm that pack-
aged and underwrote the mortgage-backed
security, the rating agency that affirmed its
creditworthiness, and the company that
insured the investments through novel instru-
ments known as credit default swaps. To
keep the system in operation and profits roll-
ing in, however, more borrowers had to be
constantly found and housing prices had to
continue rising. As the number of buyers
increased and housing prices inflated, a spec-
ulative fever took hold (Andrews 2009; Shil-
ler 2008). People began to finance home
purchases on the assumption that home
prices would rise indefinitely (Khandani et
al. 2009), buying properties with interest-
only loans, waiting for real estate prices to
rise, and then ‘‘flipping’’ the properties to
realize the capital gain. Research shows
that minority-owned properties were more
likely than others to be involved in loan flip-
ping and equity stripping schemes (Immer-
gluck and Wiles 1999).
After 2004, as the market peaked, specula-
tors, dubious lenders, negligent securities
dealers, and compromised ratings firms
increasingly focused on a select few booming
regional markets, such as Las Vegas, Phoenix,
and South Florida. These markets appear to
have played a large role in the final run-up
in risky lending. At the height of the bubble,
fraud may have been the rule rather than the
exception. When Pendley, Costello, and
Kelsch (2007:4) analyzed a sample of delin-
quent subprime loans made in 2006, for exam-
ple, they found widespread ‘‘appearance of
fraud or misrepresentation’’; two-thirds of
stated owner-occupied dwellings were never
actually occupied, and nearly half of all
Rugh and Massey 633

claims to first-time ownerships did not appear
to be valid. These findings suggest that the in-
flated housing bubble motivated sophisticated
lenders, brokers, and buyers to engage in an
unparalleled level of deceit.
As the market became fully saturated in
2006, housing prices ultimately stalled, fore-
closures rose, and faith in mortgage-backed
securities evaporated, bringing down the
entire system of collateralized debt obliga-
tions and taking much of the U.S. economy
with it (Khandani et al. 2009; Shiller 2008).
Ultimately, brokers, lenders, securitizers, and
most of all, ratings agencies, failed to foresee
the perils of ‘‘default correlation,’’ or the
interrelated risks bound up in interconnected
portfolios of troubled loans (Langley 2009).
The utter collapse of subprime lending
exposed the extremes of a pricing regime
that assessed risks individually but not collec-
tively, not accounting for the aggregate risk of
ever-increasing subprime lending and securiti-
zation. Less than 1 percent of mortgage loans
were in foreclosure at the end of 2005; this
rate more than quadrupled to over 4.6 percent
by the end of 2009. At the same time, the fore-
closure rate on riskier subprime loans went
from 3.3 percent in 2005 to 15.6 percent in
2009 (Mortgage Bankers Association 2006,
2010).
The resulting tidal wave of foreclosures
was concentrated in areas that only a few
years earlier had been primary targets for the
marketing of subprime loans (Bond and Wil-
liams 2007; Edmiston 2009), and minority
neighborhoods often bore the brunt of the
foreclosures (Bromley et al. 2008; Edmiston
2009; Hernandez 2009; Immergluck 2008;
Institute on Race and Poverty 2009; Mallach
2009; Marquez 2008). In the end, the housing
boom and the immense profits it generated
frequently came at the expense of poor minor-
ities living in central cities and inner suburbs
who were targeted by specialized mortgage
brokers and affiliates of national banks and
subjected to discriminatory lending practices
(Been et al. 2009; Engel and McCoy 2008;
Peterson 2007; Powell 2010; Squires et al.
2009).
Two additional lines of research also sug-
gest that predatory lending and subsequent
asset stripping were structured on the basis
of race as well as class. First, contrary to con-
ventional wisdom, the housing crisis was not
caused primarily by a decline in underwriting
standards (Haughwout 2009; see also Khan-
dani et al. 2009). Bhardwaj and Sengupta
(2009) show, for example, that average credit
scores within the subprime loan sector actu-
ally increased in years prior to the housing
bust and that most of the loans fell into the
near-prime, low- or no-documentation ‘‘Alt-
A’’ category, rather than in more speculative
B and C categories. Second, the crisis cannot
be attributed to riskier lending engendered by
the Community Reinvestment Act (CRA).
Using a regression discontinuity design,
Bhutta (2008) examined lending rates just
below and above the CRA neighborhood
income cutoff and found that while CRA
oversight did increase lending in targeted
areas, unregulated lending activity also
increased substantially in the same places.
Only 6 percent of subprime loans were
made to low-income borrowers or individuals
in neighborhoods subject to CRA oversight,
and less than 2 percent of loans that originated
with unregulated independent mortgage
brokers were CRA credit-eligible (Bhutta
and Canner 2009).
Although lending standards often left much
to be desired, it appears that ongoing racial
segregation, discriminatory lending, and an
overheated housing market combined to leave
minority group members uniquely vulnerable
to the housing bust. As Immergluck (2009)
wryly notes, financial literacy and creditwor-
thiness did not suddenly plummet on the eve
of the crisis—home prices did. At the same
time, although CRA regulations stimulated
lending to minority households in low-income
neighborhoods, the increase was not nearly
enough to bring about the housing crisis
(Bhutta and Canner 2009; Park 2008).
634 American Sociological Review 75(5)

DATA SOURCES
From the above research, we conclude that
residential segregation was significant in
structuring how the rise of predatory lending
and the consequent wave of foreclosures
played out in U.S. housing markets (Bond
and Williams 2007; Engel and McCoy
2008; Hernandez 2009; Stuart 2003; Wil-
liams et al. 2005; Wyly et al. 2006, 2009).
We hypothesize, first, that segregation facil-
itated racially targeted subprime mortgage
lending during the boom and, second, that
it magnified the consequences of the housing
crisis for blacks and Latinos by concentrating
foreclosures in poor minority neighborhoods
during the bust. To test these assertions, we
draw on two principal sources of data. We
define our dependent variables based on
data obtained from RealtyTrac, the nation’s
largest provider of foreclosure listings. We
compute the number of properties with
at least one foreclosure action in 2006,
2007, and 2008 in the nation’s 100 largest
metropolitan statistical areas and divisions
(MSAs), as defined in 2003. We then divide
this figure by the number of housing units in
2006 to derive a foreclosure rate.1 Over 77
percent of all foreclosure properties during
the period under consideration were located
in this set of MSAs. This sample is especially
useful for making inferences about minorities
in the United States because these 100 MSAs
were home to over 75 percent of African
Americans, nearly 80 percent of Hispanics,
and 90 percent of Asians in the country in
2000.
Our principal explanatory variables are
measures of residential unevenness and spatial
isolation for Hispanics, African Americans,
and Asians computed across census tracts in
the top 100 metropolitan areas (see Iceland
et al. 2002). We measured unevenness with
the well-known index of dissimilarity and iso-
lation using the P* within-group isolation
index. The former gives the relative propor-
tion of minority group members who would
have to exchange tracts with majority group
members to achieve an even residential distri-
bution; the latter gives the proportion of own-
group members in a tract inhabited by the
average minority group member. Of the five
dimensions of segregation identified by Mas-
sey and Denton (1988), evenness and isolation
are the most important and empirically
account for most of the common variation
(Massey, White, and Phua 1996).
Our analytic strategy is to regress the num-
ber and rate of foreclosures in MSAs on these
two measures of segregation while holding
constant the effect of metropolitan-level fac-
tors shown to influence the odds of foreclo-
sure. Our controls include standard census-
based variables, such as 2008 MSA popula-
tion and racial and ethnic composition from
2000, as well as socioeconomic characteristics
obtained from the 2005 to 2007 American
Community Surveys, such as percent of per-
sons holding a college degree, median house-
hold income, and percent of homeowners with
a second mortgage (all defined as of 2006).
We also include the median age of MSA
housing stock from the 2000 housing census.
The 2006 unemployment rate and the 2000
to 2006 change in rate of annual unemploy-
ment come from the Bureau of Labor Statis-
tics; the share of the workforce that was
unionized comes from Hirsch and MacPher-
son (2007). In initial specifications of the
model we also tested for effects of the poverty
rate, share of female-headed households, and
per capita income, but these variables add
nothing to the explanatory power of the mod-
els and were dropped from further consider-
ation. The final models also include dummy
variables to control for region, coastal loca-
tion, and location along the Texas border
with Mexico (the Rio Grande River).
In addition to these standard indicators, we
include three specialized measures of condi-
tions in metropolitan real estate markets that
prior research finds to be important in explain-
ing the foreclosure crisis. First, we construct
a measure of overbuilding by computing the
ratio of 2000 to 2006 MSA housing starts to
housing units in 2000, a procedure closely
Rugh and Massey 635

following that of Glaeser and colleagues
(2008). Second, we include the Wharton Res-
idential Land Use Regulation Index as a mea-
sure of local land use planning regulation.
Gyourko, Summers, and Saiz (2008) devel-
oped this index for different municipalities;
following Rothwell and Massey (2009), we
take the weighted average of the index for
municipalities within each MSA that responds
to Gyourko’s survey. We then center the dis-
tribution on the mean for the top 100 areas to
yield a measure that controls for housing price
premiums stemming from regulatory con-
straints on housing supply (Fischel 1990;
Glaeser 2009; Glaeser and Gyourko 2003,
2008; Glaeser et al. 2008). Finally, we include
a measure of the housing price boom in each
MSA by using the Federal Housing Finance
Agency’s quarterly metropolitan area House
Price Index (HPI), which is a weighted,
repeat-sales index based on transactions
involving single-family homes. We bench-
mark the housing price boom for each MSA
by dividing annualized change in HPI from
2000 to 2006 by the annualized change in
the two decades prior to 2000.
We also include MSA-level controls for
the degree of subprime lending, the extent of
CRA regulatory oversight, and borrowers’
average creditworthiness. To assess the preva-
lence of subprime lending, we compute the
aggregate share of all loans originated in
2004, 2005, and 2006 that were subprime,
drawing on data from the Federal Financial
Institutions Examination Council (http://
www.ffiec.gov/hmda). The FFIEC tabulates
information that lending institutions must pro-
vide to the federal government under the
Home Mortgage Disclosure Act (HMDA).
These data cover more than 28 million loans
originated during the peak years of the hous-
ing boom. More than 6.9 million loans, or
nearly one in four, were subprime, meaning
that the interest rate at origination exceeded
that for a comparable U.S. Treasury security
(e.g., a 30-year bond) by 3 percent or more.
This is the cutoff for reporting a loan in the
data files (rates of lower priced loans are
intentionally left blank in fields) and is the
definition of subprime lending used in other
research (e.g., Been et al. 2009; Bocian
et al. 2006; Squires et al. 2009).2
To measure the degree of regulatory over-
sight, we draw on 2004 to 2006 HMDA data
and compute the weighted share (by dollar
amount) of all 2004 to 2006 loans in each
MSA that were originated by CRA-covered
lending banking institutions (following Fried-
man and Squires 2005). In doing so, we use
HMDA data on conventional loans (i.e., those
not guaranteed by government) for the pur-
chase of single-family properties (1 to 4 units)
and take a 20 percent extract of the nearly 28
million mortgage loans originated in the top
100 metropolitan areas and compute the share
of subprime loans going to borrowers. On
average, less than two-thirds of total lending
per MSA fell under the ambit of federal
CRA regulation, but this share is noticeably
lower, about half or less, in MSAs with ele-
vated foreclosures (e.g., Detroit, Michigan;
Las Vegas, Nevada; and Bakersfield, Califor-
nia). This suggests that greater CRA lending
oversight reduces foreclosures even as it
makes more loans available to minority group
members (Bond and Williams 2007; Friedman
and Squires 2005).
Finally, to control for borrowers’ credit-
worthiness, we compute the average consumer
credit score at the MSA level using informa-
tion obtained from the Experian National
Score Index. The index ranges from 672 to
720 for the top 100 MSAs and constitutes
the mean FICO (Fair Isaac Corporation) credit
score for all consumers living in all counties
of each MSA whose credit behavior is re-
ported to Experian, one of the nation’s three
major credit reporting bureaus. We expect
that higher overall MSA credit scores will
be associated with lower foreclosure rates
because of the higher aggregate creditworthi-
ness of borrowers, and by extension, mortgage
holders. To mitigate omitted variables bias,
we include this variable as a proxy for differ-
ences in credit history and access that co-vary
with racial composition and segregation.
636 American Sociological Review 75(5)

Table 1 presents means and standard devi-
ations of the foregoing variables. In terms of
our leading explanatory variable, levels of
segregation are highest for African Ameri-
cans, lowest for Asians, and Hispanics are
in-between. The index of dissimilarity, for
example, averages .59 for blacks with a range
of plus or minus two standard deviations that
goes from .34 to .83. By convention, dissimi-
larities below .3 are considered low, those
from .3 to .6 are considered moderate, and
those above .6 are regarded as high, with any-
thing above .75 considered extremely high.
Under these criteria, black segregation runs
from moderate to extremely high. By contrast,
the comparable range for Asians is .25 to .52
with a mean of .39, and Hispanics have a range
of .24 to .67 with a mean of .46. Asians range
from low to moderate, and Hispanics range
from low to high.
Similar patterns prevail with respect to the
isolation index. The black isolation index
averages .45 and ranges from .07 to .84, going
from minus to plus two standard deviations;
the Hispanic index averages .32 and ranges
from zero to .75; and the Asian mean stands
at a very low .14 and ranges from zero to
.40. If segregation creates a natural niche for
subprime lending, then the more extreme
maxima and greater variability of black segre-
gation measures hold by far the greatest
potential to predict foreclosures, followed by
Hispanic segregation measures. The generally
low averages and restricted variation of isola-
tion and dissimilarity among Asians suggest
a more limited potential to influence inter-
metropolitan variation in foreclosures.
Segregation’s effect in creating fertile ter-
rain for subprime lending also depends on
a group’s socioeconomic status. This general-
ization holds because segregation not only
concentrates minority group members spa-
tially within particular neighborhoods, but it
also concentrates any characteristic associated
with minority group status (Massey and Den-
ton 1993; Massey and Fischer 1999). For
underprivileged minorities, segregation spa-
tially concentrates poverty and its correlates
to create areas of concentrated disadvantage
that constitute prime targets for subprime
lending. For privileged minorities, segregation
has the opposite effect—it concentrates
advantage and its correlates to produce areas
that are unlikely targets for subprime lending.
As of 2008, the poverty rate for Asians stood
at 12 percent, compared with 25 percent
among African Americans and 23 percent
among Hispanics (DeNavas-Walt, Proctor,
and Smith 2009). Likewise, the median per
capita income for Asians was $30,000 in
2008, compared with just $18,000 for Afri-
can Americans and $16,000 for Hispanics.
The Asian median income even exceeded
that for non-Hispanic whites ($28,500). To
the extent that segregation has an effect
on the economic geography of Asians, it
would be to concentrate advantage and
thus diminish the frequency of subprime
lending and foreclosures.3
SEGREGATION’S EFFECT ONFORECLOSURES
Despite the persistence of residential segre-
gation and its prevalence in areas with large
minority populations, racial segregation is
no longer as universal across U.S. urban
areas as it once was. As indicated by the
wide variance just described, there is now
considerable variation across metropolitan
areas in the degree of black and Hispanic
segregation (Charles 2003; Iceland et al.
2002; Massey, Rothwell, and Domina
2009). In addition to a small minority popu-
lation, other characteristics that predict lower
levels of residential segregation are a small
urban population, newer housing stock, pres-
ence of a college or a university, proximity to
a military base, higher socioeconomic status,
and location in the West or the Southwest
(Farley and Frey 1994). Inter-urban differen-
tials in Hispanic and black segregation thus
carry the potential to contribute significantly
to variation in foreclosure rates across U.S.
metropolitan areas.
Rugh and Massey 637
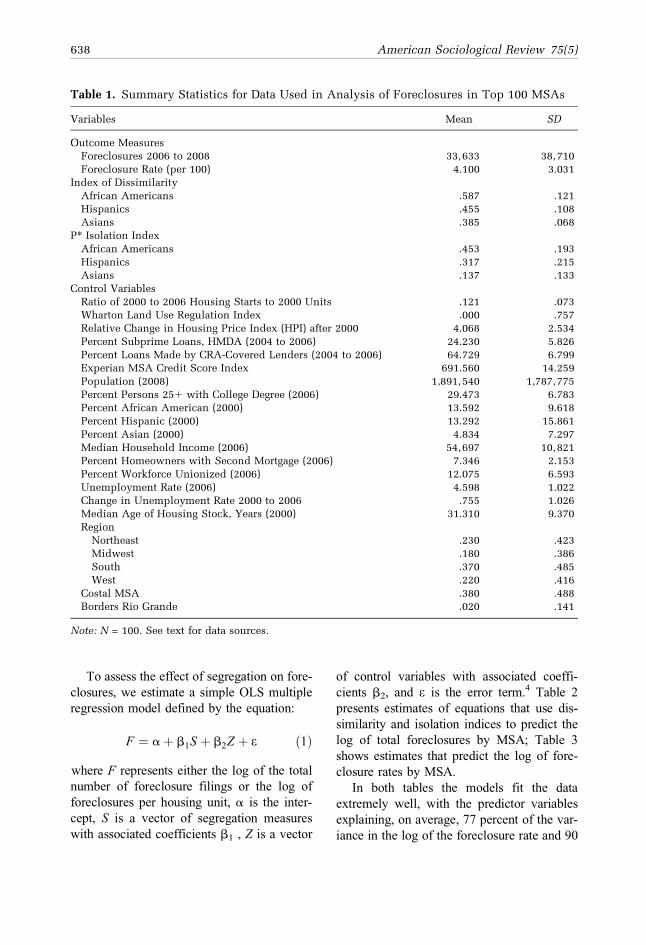
To assess the effect of segregation on fore-
closures, we estimate a simple OLS multiple
regression model defined by the equation:
F ¼ aþ b1S þ b2Z þ e ð1Þ
where F represents either the log of the total
number of foreclosure filings or the log of
foreclosures per housing unit, a is the inter-
cept, S is a vector of segregation measures
with associated coefficients b1 , Z is a vector
of control variables with associated coeffi-
cients b2, and e is the error term.4 Table 2
presents estimates of equations that use dis-
similarity and isolation indices to predict the
log of total foreclosures by MSA; Table 3
shows estimates that predict the log of fore-
closure rates by MSA.
In both tables the models fit the data
extremely well, with the predictor variables
explaining, on average, 77 percent of the var-
iance in the log of the foreclosure rate and 90
Table 1. Summary Statistics for Data Used in Analysis of Foreclosures in Top 100 MSAs
Variables Mean SD
Outcome Measures
Foreclosures 2006 to 2008 33,633 38,710
Foreclosure Rate (per 100) 4.100 3.031
Index of Dissimilarity
African Americans .587 .121
Hispanics .455 .108
Asians .385 .068
P* Isolation Index
African Americans .453 .193
Hispanics .317 .215
Asians .137 .133
Control Variables
Ratio of 2000 to 2006 Housing Starts to 2000 Units .121 .073
Wharton Land Use Regulation Index .000 .757
Relative Change in Housing Price Index (HPI) after 2000 4.068 2.534
Percent Subprime Loans, HMDA (2004 to 2006) 24.230 5.826
Percent Loans Made by CRA-Covered Lenders (2004 to 2006) 64.729 6.799
Experian MSA Credit Score Index 691.560 14.259
Population (2008) 1,891,540 1,787,775
Percent Persons 251 with College Degree (2006) 29.473 6.783
Percent African American (2000) 13.592 9.618
Percent Hispanic (2000) 13.292 15.861
Percent Asian (2000) 4.834 7.297
Median Household Income (2006) 54,697 10,821
Percent Homeowners with Second Mortgage (2006) 7.346 2.153
Percent Workforce Unionized (2006) 12.075 6.593
Unemployment Rate (2006) 4.598 1.022
Change in Unemployment Rate 2000 to 2006 .755 1.026
Median Age of Housing Stock, Years (2000) 31.310 9.370
Region
Northeast .230 .423
Midwest .180 .386
South .370 .485
West .220 .416
Costal MSA .380 .488
Borders Rio Grande .020 .141
Note: N = 100. See text for data sources.
638 American Sociological Review 75(5)

percent of the variance in the logged absolute
number of foreclosures. Moreover, coeffi-
cients for the segregation indices closely
follow theoretical expectations. Whether mea-
sured in terms of residential dissimilarity or
spatial isolation, segregation of African Amer-
icans is a powerful and highly significant pre-
dictor of the number and rate of foreclosures
across U.S. metropolitan areas. For instance,
a .1 unit increase in black dissimilarity is asso-
ciated with 37 percent more foreclosure ac-
tions and a 34 percent increase in the
foreclosure rate. Inter-metropolitan variation
in the segregation of Hispanics, however,
does not consistently affect the rate and abso-
lute number of foreclosures. As we discuss in
the next section, the effect of Hispanic segre-
gation may be overwhelmed by the effect of
black segregation. These statistical estimates
are consistent with the findings of Been and
colleagues (2009) and Squires and colleagues
(2009).
By contrast, Asian-white residential dis-
similarity significantly reduces the number
and rate of foreclosures across metropolitan
areas, and spatial isolation also has a negative,
Table 2. OLS Estimates of Effect of Selected Measures of Residential Segregation on Log ofTotal Foreclosures
Dissimilarity Index Isolation Index
Variables B SE B SE
Index of Segregation
African Americans 3.718** .725 2.122** .619
Hispanics 2.773 .596 .080 .656
Asians 22.080* .920 22.161 1.636
Control Variables
Housing Starts Ratio 2.980** .960 3.067** 1.077
Wharton Land Use Index .250** .082 .272** .096
Change in Housing Price Index .082** .024 .092** .029
CRA-Covered Lending Share 21.295 .912 2.810 1.061
Subprime Loan Share 3.022* 1.353 4.310** 1.581
MSA Credit Score Index 2.015* .007 2.016* .007
Log of Population 1.008** .089 1.013** .093
Percent with College Degree 21.341 1.315 2.997 1.459
Log Median Household Income .253 .509 .340 .515
Percent with Second Mortgage .751 3.687 .225 4.350
Percent Workforce Unionized 2.025** .011 2.022* .011
Unemployment Rate 2.010 .064 .012 .071
Change in Unemployment Rate .245** .052 .213** .063
Age of Housing Stock .004 .012 .014 .013
Region
Midwest .434* .200 .631** .200
South .042 .257 .081 .296
West .463 .384 .679 .436
Coastal MSA 2.053 .123 .070 .133
Borders Rio Grande 21.030** .370 21.054** .380
Constant 1.960 7.557 .979 8.150
R2 .91 .90
Joint F-Test for Region 3.35* 7.97**
Joint F-Test for Segregation 10.48** 6.28**
Note: N = 99. Robust standard errors. Model also includes percent black, percent Hispanic, and percentAsian.*p \ .05; **p \ .01 (two-tailed tests).
Rugh and Massey 639

although insignificant, effect. Residential seg-
regation concentrates group characteristics,
whatever they are, in space. In the case of
blacks, the prevailing characteristics are pov-
erty and socioeconomic deprivation; given
that Asian incomes exceed those of whites,
on average, their prevailing characteristics
are affluence and socioeconomic privilege.
By concentrating affluence, the segregation
of Asians creates communities that are inher-
ently resistant to the entreaties of subprime
lenders—hence the negative relationship
between Asian segregation and foreclosures.
The various control variables generally
function as hypothesized, lending face validity
to the equation estimates. As expected, fore-
closures are positively predicted by greater
housing start shares, higher rates of subprime
lending, increasing unemployment, rising
home prices, lower credit scores, more second
mortgages, higher median incomes, greater
levels of land use regulation, and location in
the Midwest or the West.5 If we assume that
the housing start ratio measures overbuilding
and that rising relative home prices capture
the housing bubble, then our results are
Table 3. OLS Estimates of Effect of Selected Measures of Residential Segregation on the Logof the Foreclosure Rate
Dissimilarity Index Isolation Index
Variables B SE B SE
Index of Segregation
African Americans 3.412** .725 1.990** .604
Hispanics 2.686 .580 .074 .642
Asians 21.7611 .906 21.572 1.562
Control Variables
Housing Starts Ratio 2.868** .946 2.973** 1.032
Wharton Land Use Index .236** .081 .259** .092
Change in Housing Price Index .072** .023 .080** .027
CRA-Covered Lending Share 21.331 .901 2.847 1.026
Subprime Loan Share 3.269* 1.358 4.560** 1.547
MSA Credit Score Index 2.0141 .007 2.015* .007
Log of Population .012 .087 .010 .089
Percent with College Degree 21.746 1.291 21.420 1.410
Log Median Household Income .750 .489 .8581 .500
Percent with Second Mortgage 1.468 3.643 .703 4.190
Percent Workforce Unionized 2.027* .010 2.024* .011
Unemployment Rate .016 .063 .031 .068
Change in Unemployment Rate .224** .051 .200** .060
Age of Housing Stock .003 .012 .012 .013
Region
Midwest .409* .194 .583** .192
South .032 .251 .072 .286
West .448 .372 .663 .422
Coastal MSA 2.077 .124 .030 .129
Borders Rio Grande 21.040* .392 21.042* .395
Constant 1.121 7.443 .098 8.005
R2 .78 .76
Joint F-Test for Region 3.17* 7.44**
Joint F-Test for Segregation 8.71** 5.62**
Note: N = 99. Robust standard errors. Model also includes percent black, percent Hispanic, and percentAsian.1p \ .10; *p \ .05; **p \ .01 (two-tailed tests).
640 American Sociological Review 75(5)
consistent with prior work on the economic
causes of the U.S. foreclosure crisis (e.g.,
Glaeser et al. 2008; Haughwout et al. 2008;
Immergluck 2009; Kochhar, Gonzalez-Bar-
rera, and Dockterman 2009; Mayer, Pence,
and Sherlund 2009; National Association of
Realtors 2004).
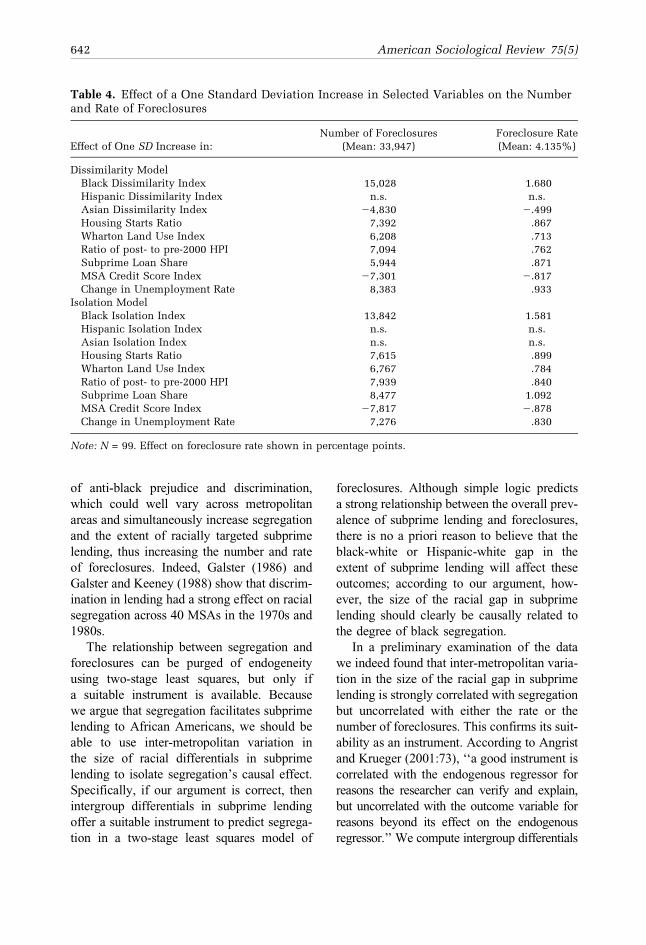
In the attempt to understand the foreclo-
sure crisis, our study adds the important
and independent role played by racial segre-
gation in structuring the housing bust. Table
4 shows segregation’s relative predictive
power compared with other significant fac-
tors by reporting the standardized effect
sizes evaluated at the sample mean of the
foreclosure total and rate (in terms of num-
ber of foreclosures and percentage points,
respectively). In the model using dissimilar-
ity indexes, a standard deviation increase in
the segregation of African Americans in-
creases the number of foreclosures by
15,028 actions and the rate of foreclosures
by 1.68 percentage points. This effect ex-
ceeds the effect of MSA home building,
house price booms, and all other important
explanatory variables. Changes in the proxy
measures of economic conditions, land use
restrictions, and overbuilding exert a consid-
erably smaller impact on foreclosures, with
absolute standard effect sizes just 40 to 56
percent of that for black segregation.
In the isolation model, one standard devia-
tion in black segregation leads to a large
change in foreclosures (13,842) and the fore-
closure rate (1.58 percentage points). Stan-
dardized changes in the subprime lending
share lead to an increase of nearly 8,500 fore-
closures and an even greater effect on foreclo-
sure rates, at 1.1 percentage points. Relative
changes in house prices and housing starts,
average credit scores, and changes in unem-
ployment rates show an increase of 7,000 to
8,000 foreclosures and .8 to .9 percentage
points in the foreclosure rate. While the effect
size of Hispanic segregation in the dissimilar-
ity model is not statistically distinguishable
from zero, Hispanic isolation has a standard-
ized effect of more than 3,800 foreclosures
and a .66 percentage point increase in the
foreclosure rate.
FORECLOSURES AND THESEGREGATION-SUBPRIMELINK
Taking into account the distribution of effect
sizes estimated in Table 4, we conclude that
the influence of black residential segregation
clearly exceeds that of other factors linked by
earlier studies to inter-metropolitan variation
in foreclosures. Furthermore, racial segrega-
tion is an important and hitherto unappreci-
ated contributing cause of the current
foreclosure crisis. This conclusion rests, of
course, on a cross-sectional ecological
regression and thus may be subject to certain
methodological criticisms. Because we are
not seeking to infer individual behavior
from aggregate data, ecological bias itself is
not an issue—our argument is structural
and specified at the metropolitan, not the
individual, level.
As with any cross-sectional analysis, how-
ever, endogeneity or reverse causality is
a potential problem. In this case, it does not
seem likely that foreclosures could reasonably
cause segregation. Patterns of racial segrega-
tion are the cumulative product of decades
of actions in the public and private spheres,
and high levels of black segregation were
well institutionalized in U.S. urban areas by
the mid-twentieth century (Massey and Den-
ton 1993). In addition, we measure segrega-
tion in 2000 and foreclosures in 2006 to
2008, so the independent variable is tempo-
rally prior to the dependent variable.
A more serious threat to causal inference is
endogeneity. Perhaps there is a third, unmea-
sured variable that influences both segregation
and foreclosures to bring about the observed
association between them. Although we
endeavored to apply a rather exhaustive set
of controls, it is simply not possible to control
for all potential confounding variables. One
possible confounding variable is the degree
Rugh and Massey 641
of anti-black prejudice and discrimination,
which could well vary across metropolitan
areas and simultaneously increase segregation
and the extent of racially targeted subprime
lending, thus increasing the number and rate
of foreclosures. Indeed, Galster (1986) and
Galster and Keeney (1988) show that discrim-
ination in lending had a strong effect on racial
segregation across 40 MSAs in the 1970s and
1980s.
The relationship between segregation and
foreclosures can be purged of endogeneity
using two-stage least squares, but only if
a suitable instrument is available. Because
we argue that segregation facilitates subprime
lending to African Americans, we should be
able to use inter-metropolitan variation in
the size of racial differentials in subprime
lending to isolate segregation’s causal effect.
Specifically, if our argument is correct, then
intergroup differentials in subprime lending
offer a suitable instrument to predict segrega-
tion in a two-stage least squares model of
foreclosures. Although simple logic predicts
a strong relationship between the overall prev-
alence of subprime lending and foreclosures,
there is no a priori reason to believe that the
black-white or Hispanic-white gap in the
extent of subprime lending will affect these
outcomes; according to our argument, how-
ever, the size of the racial gap in subprime
lending should clearly be causally related to
the degree of black segregation.
In a preliminary examination of the data
we indeed found that inter-metropolitan varia-
tion in the size of the racial gap in subprime
lending is strongly correlated with segregation
but uncorrelated with either the rate or the
number of foreclosures. This confirms its suit-
ability as an instrument. According to Angrist
and Krueger (2001:73), ‘‘a good instrument is
correlated with the endogenous regressor for
reasons the researcher can verify and explain,
but uncorrelated with the outcome variable for
reasons beyond its effect on the endogenous
regressor.’’ We compute intergroup differentials
Table 4. Effect of a One Standard Deviation Increase in Selected Variables on the Numberand Rate of Foreclosures
Effect of One SD Increase in:
Number of Foreclosures
(Mean: 33,947)
Foreclosure Rate
(Mean: 4.135%)
Dissimilarity Model
Black Dissimilarity Index 15,028 1.680
Hispanic Dissimilarity Index n.s. n.s.
Asian Dissimilarity Index 24,830 2.499
Housing Starts Ratio 7,392 .867
Wharton Land Use Index 6,208 .713
Ratio of post- to pre-2000 HPI 7,094 .762
Subprime Loan Share 5,944 .871
MSA Credit Score Index 27,301 2.817
Change in Unemployment Rate 8,383 .933
Isolation Model
Black Isolation Index 13,842 1.581
Hispanic Isolation Index n.s. n.s.
Asian Isolation Index n.s. n.s.
Housing Starts Ratio 7,615 .899
Wharton Land Use Index 6,767 .784
Ratio of post- to pre-2000 HPI 7,939 .840
Subprime Loan Share 8,477 1.092
MSA Credit Score Index 27,817 2.878
Change in Unemployment Rate 7,276 .830
Note: N = 99. Effect on foreclosure rate shown in percentage points.
642 American Sociological Review 75(5)

in subprime lending by metropolitan area
using the combined HMDA data from
2004, 2005, and 2006 (described in the
Data Sources section). If lending discrimi-
nation is greater in more segregated MSAs,
then racial-ethnic differentials in subprime
lending permit us to identify the causal
effect of residential segregation on MSA
foreclosure rates, enabling us to specify
the following two-stage model:
S ¼ hþ dRACEDIFF þWlþ n ð2Þ
F ¼ aþ ðhþ RACEDIFFd
þWlþ nÞb1 þ Zb2 þ e:ð3Þ
In this system, Equation 2 expresses the
first-stage relationship between segregation,
S, and RACEDIFF, the black-white or
Hispanic-white gap in the likelihood of ob-
taining a subprime loan in 2006. In this equa-
tion, d is the coefficient associated with this
variable; W is a vector of controls including
percent black, percent Hispanic, and percent
Asian; l is a vector of coefficients associated
with these variables; and n is the error term.
Equation 3 simply substitutes the value of seg-
regation predicted from this first-stage equa-
tion into Equation 1 to yield a second-stage
equation that expresses foreclosures as a func-
tion of the segregation instrument plus the
variables in Z. b1 and b2 are then re-estimated
in the second-stage equation, along with e.
To generate a more refined measure of
lending discrimination to use as our instru-
ment, we estimate black-white and Hispanic-
white differentials in the likelihood of receiv-
ing a subprime loan after adjusting for bor-
rower and neighborhood characteristics
reported in the HMDA data. That is, using
an extract of 5,360,007 HMDA loan-level
records with non-missing data, we predict
RACEDIFF for each MSA using a probit
model where the dependent variable is
a dichotomous indicator equal to one if the
loan is flagged as subprime in the data by
a non-missing interest rate greater than or
equal to 3 percent. The probit model expresses
the likelihood of receiving a subprime loan as
a function of the type (i.e., home purchase,
refinance, or improvement) and amount of
the loan, borrower income, first or second
lien status, occupancy (i.e., investor or
owner), type of loan purchaser (i.e., govern-
ment agency, private, bank, finance company,
lender affiliate, or other independent entity),
median tract income and tract-to-MSA ratio,
ratio of total tract single-family units to popu-
lation, and tract minority percentage.
We also merge the following extended
control variables to the foregoing data com-
puted from the HMDA data: tract population
density in persons per square mile, median
age of tract housing stock, and the MSA-level
average credit score index, described earlier.
The probit estimation clusters errors at the
MSA level. Avery and colleagues (2005)
show that HMDA data file variables explain
nearly half (48 percent) of the black-white
gap in subprime lending, whereas credit fac-
tors such as FICO scores, loan-to-value ratios,
and interest rate type account for only an addi-
tional one-sixth (17 percent) of the observed
gap. Although we recognize the limitations
of ecological data at the tract- and MSA-
levels, we believe our proxies for credit fac-
tors in the probit equation adequately reduce
potential bias in our estimates.
For each MSA, we average the group like-
lihood of receiving a subprime loan in 2004 to
2006 by summing the predicted probability by
race and ethnicity across all loans and then
dividing by the total number of loans to
each borrower race/ethnic group (i.e., non-
Hispanic white, non-Hispanic black, and His-
panic). We then calculate the black-minus-
white and Hispanic-minus-white differences
in regression-adjusted predicted subprime
lending probabilities for each of the 100
MSAs. The black-white differential has
a mean of 11.8 percent (sd 4.3 percent) and
ranges from 2.3 to 24.0 percent; the
Hispanic-white differential is also always pos-
itive, with a mean of 8.1 percent (sd 3.8 per-
cent) and a range of 1.4 to 17.5 percent. We
Rugh and Massey 643
merge these two differential variables to the
main data file.
We use the regression-adjusted black-
white and Hispanic-white differentials in
subprime lending by MSA to predict the
segregation instrument inserted into the sec-
ond-stage equation. Table 5 reports OLS
and 2SLS estimates of the effect of black
and Hispanic segregation on the rate of fore-
closures for the top 100 MSAs, excluding
Honolulu, Hawaii, as in our main analysis.
The model includes the same covariates as
in Table 1 except log of population, level
of unemployment, the Rio Grande border
dummy, and age of housing stock.6
The estimated OLS coefficient for black
segregation (see the first column in Table 5)
is highly significant, and at 3.84 it is compara-
ble to that in our initial model (see Table 2).
This suggests that a .10-point rise in black
segregation is associated with a 38 percent
increase in the foreclosure rate. By contrast,
the instrumental variable estimate of the coef-
ficient is 4.64. This coefficient is estimated
quite precisely and attains significance at the
.001 level. Its higher point estimate implies
that a .10-point increase in black segregation
is associated with a 46 percent increase in
the foreclosure rate. While this effect is not
statistically different from the OLS effect
due to overlapping confidence intervals, its
higher value offers more evidence that segre-
gation indeed has a causal effect on the MSA
foreclosure rate by producing racial differen-
tials in subprime lending.
Test statistics for endogeneity indicate that
the racial differential instrument is indeed
exogenous, a conclusion corroborated by the
fact that it is uncorrelated with the residuals
of the reduced form model in Equation 3.
The percent of the MSA population that is
black has no impact whatsoever on our segre-
gation estimates and a much smaller offsetting
impact on the rate of foreclosures. This auxil-
iary finding underscores our hypothesis that
racial concentration in space, and not race
alone, is a significant structural cause of the
current foreclosure crisis.
Likewise, the coefficient for Hispanic seg-
regation is initially insignificant with a coeffi-
cient of .81 when estimated using OLS, but
using the instrumental variable estimator the
value rises to 1.12, which is nearly statistically
significant ( p = .15 using a two-tailed test and
p = .08 under a one-tailed test). A .10-point
increase in Hispanic dissimilarity is estimated
to result in an 11 percent increase under IV
estimation, indicating that unexplained His-
panic-white differences in subprime loan
usage augment our understanding of the effect
of Latino segregation on metropolitan-level
foreclosures.7 Note that the OLS and IV mod-
els yield similar coefficient estimates for the
effect of economic trends, housing market
conditions, land use regulation, region, and
other controls. This suggests that segregation
contributes to explaining variation in the fore-
closure rate above and beyond the standard in-
dicators heretofore employed in analytic
models.
CONCLUSIONS
The analyses provide strong empirical sup-
port for the hypothesis that residential segre-
gation constitutes an important contributing
cause of the current foreclosure crisis, that
segregation’s effect is independent of other
economic causes of the crisis, and that segre-
gation’s explanatory power exceeds that of
other factors hitherto identified as key causes
(e.g., overbuilding, excessive subprime lend-
ing, housing price inflation, and lenders’
failure to adequately evaluate borrowers’
creditworthiness). Simply put, the greater
the degree of Hispanic and especially black
segregation a metropolitan area exhibits, the
higher the number and rate of foreclosures
it experiences. Neither the number nor the
rate of foreclosures is in any way related to
expanded lending to minority home owners
as a result of the Community Reinvestment
Act.
The confluence of low interest rates, un-
paralleled levels of equity extraction via
644 American Sociological Review 75(5)

refinancing, and the bust of the housing bub-
ble may have combined with overbuilding
and lax regulation to make the foreclosure cri-
sis possible (Glaeser 2009; Khandani et al.
2009). However, we add a crucial addition
to the understanding of the causes and
consequences of the foreclosure crisis by
demonstrating the key role of residential seg-
regation in shaping how the crisis played out.
By concentrating foreclosures in metropolitan
areas with large racial differentials in sub-
prime lending, segregation structured the
causes of the crisis, as well as the geo-
graphic and social distribution of its costs,
on the basis of race. Segregation therefore
racialized and intensified the consequences
of the American housing bubble. Hispanic
and black home owners, not to mention
entire Hispanic and black neighborhoods,
bore the brunt of the foreclosure crisis.
This outcome was not simply a result of
neutral market forces but was structured on
the basis of race and ethnicity through the
social fact of residential segregation.
Table 5. Estimates of the Effect of Residential Segregation on Log of 2006 to 2008 ForeclosureRate via Black-White and Hispanic-White Adjusted Differentials in the Likelihood ofObtaining a Subprime Loan in 2004 to 2006
Black Segregation Hispanic Segregation
OLS IV OLS IV
B SE B SE B SE B SE
Dissimilarity Index
African Americans 3.842** .630 4.638** .888
Hispanics .811 .662 1.124 .788
Selected Control Variables
Housing Starts Ratio 2.581** .773 2.728** .714 1.874* .939 1.901* .832
Ratio of pre- to post-2000 HPI .086** .022 .083** .020 .101** .032 .101** .029
Wharton Land Use Index .221* .083 .229** .078 .182* .091 .178* .078
Subprime Loan Share, 2004 to 2006 2.5681 1.404 2.085 1.292 4.893* 1.887 4.965** 1.654
MSA Credit Score Index 2.015* .007 2.015* .006 2.0141 .008 2.0144* .007
Change in Unemployment Rate .239** .041 .247** .039 .203** .057 .199** .048
Percent Black, 2000 21.649* .685 21.826** .595 2.797 .907 2.881 .805
Percent Hispanic, 2000 2.752 .538 2.635 .48621.315 .737 21.441* .698
Percent College Degree, 2006 21.9571 1.161 22.265* 1.147 2.475 1.700 2.445 1.517
Region
Midwest .386* .188 .297* .152 .813** .213 .840** .199
South 2.007 .216 2.010 .189 .009 .288 .060 .280
West .501 .326 .525* .289 .382 .395 .419 .366
Constant 1.396 6.839 .608 6.363 5.195 8.035 5.751 7.239
R2 .77 .76 .65 .65
F 27.4 10.65
Wald x2 534.72 257.27
[F, 2SLS 1st stage] [38.89] [27.08]
Tests of Endogeneity (Null: Instrument is Exogenous)
Robust x2 (p value) 1.18 (.27) .45 (.50)
Robust F (p value) .99 (.32) .35 (.56)
Covariance (Instrument, eIV) 2.00001 2.0041
Note: N = 99. Ordinary Least Squares (OLS) and Indirect Least Squares or Instrumental Variables (IV)estimates with robust standard errors. Additional covariates included in model but not shown here arelisted in Table 2 excluding log of 2008 population, 2006 unemployment rate, borders Rio Grande, and ageof housing stock. See text for detailed description of adjusted racial and ethnic differences in subprimelending instrument. eIV is the residual error term value from the corresponding IV regression model.1p \ .10; *p \ .05; **p \ .01 (two-tailed tests).
Rugh and Massey 645
Ultimately, the racialization of America’s
foreclosure crisis occurred because of a sys-
tematic failure to enforce basic civil rights
laws in the United States. Discriminatory sub-
prime lending is simply the latest in a long
line of illegal practices that have been foisted
on minorities in the United States (Satter
2009). It is all the more shocking because
these practices were well-known and docu-
mented long before the housing bubble burst
(e.g., Squires 2004; Stuart 2003; U.S. Depart-
ment of Housing and Urban Development
2000; Williams et al. 2005). In addition to
tighter regulation of lending, rating, and secu-
ritization practices, greater civil rights
enforcement has an important role to play in
cleaning up U.S. markets.
It is in the nation’s interest for federal
authorities to take stronger and more energetic
steps to rid U.S. real estate and lending mar-
kets of discrimination, not simply to promote
a more integrated and just society but to avoid
future catastrophic financial losses. Racial dis-
crimination is easily detected through a meth-
odology known as the audit study, in which
trained testers identifiable as black or white
are sent into markets to seek out proffered
goods and services. Black and white testers’
experiences over a number of trials are com-
piled and compared to discern systematic dif-
ferences in treatment (Fix and Struyk 1993;
Yinger 1986). Numerous audit studies docu-
ment the persistence of anti-black discrimina-
tion not only in markets for real estate (Yinger
1995; Zhao, Ondrich, and Yinger 2006) and
credit (Ross and Yinger 2002; Squires
1994), but also in markets for jobs (Bertrand
and Mullainathan 2004; Pager 2007; Turner,
Fix, and Struyk 1991), goods (Ayres and Sie-
gelman 1995), and services (Feagin and Sikes
1994; Ridley, Bayton, and Outtz 1989). None-
theless, the discrimination continues.
An important goal in expanding civil rights
enforcement should be the creation of federal
programs to monitor levels of discrimination
in key U.S. markets and to take remedial
action on a routine basis. If a society uses
markets to allocate production, distribute
goods and services, generate wealth, and pro-
duce income, then it is incumbent upon gov-
ernment to ensure that all citizens have the
right to compete freely in all markets (Massey
2005b). In a market society, lack of access to
markets translates directly into a lack of equal
access to material well-being and ultimately
into socioeconomic inequality (Massey 2007).
Unfortunately, to secure passage of the
Civil Rights Acts of 1964, 1968, 1974, and
1977 and to avoid a southern filibuster, most
of the enforcement mechanisms included in
the original legislation were stripped away
and the federal government is largely pro-
hibited from playing an active role in uncover-
ing discrimination or instigating actions to
sanction those who discriminate. The existing
body of civil rights law must be updated to
establish within the U.S. Departments of Trea-
sury, Labor, Commerce, and Housing and
Urban Development permanent offices autho-
rized to conduct regular audits in markets for
jobs, goods, services, credit, and housing
based on representative samples of market
providers, both for purposes of enforcement
and to measure progress in the elimination
of discrimination from U.S. markets.
Acknowledgment
The authors would like to thank the reviewers for their
helpful comments and criticisms that have helped to
improve the article.
Notes
1. The RealtyTrac database does not include tabulations
for foreclosures in the Grand Rapids–Wyoming,
Michigan MSA; it substitutes the Charleston–North
Charleston, South Carolina MSA.
2. Subprime loan pricing data were first made available
in the 2004 HMDA data. Comparing extremes in our
data, about 40 percent of all 2004 to 2006 loans were
subprime in the Detroit-Livonia-Dearborn, MI Metro
Division and the Miami–Miami Beach–Kendall, FL
Metro Division, but less than 10 percent of loans
were subprime in the San Francisco-San Mateo-
Redwood City, CA Metro Division.
3. Asian Americans are also clustered in MSAs with
either very high (e.g., coastal California, New
York, and Hawaii) or remarkably affordable (e.g.,
646 American Sociological Review 75(5)
Texas) home prices, which somewhat forestalled the
rise of subprime lending.
4. The error term is specified to be robust to heterosce-
dasticity using the ‘‘robust’’ option in Stata statistical
software version 10.
5. The share of lending made by CRA-covered banks is
negative, as predicted, and is insignificant only in the
presence of the subprime lending share (the two var-
iables are significantly negatively correlated, r =
2.31, p \ .01).
6. Additionally, in the Hispanic segregation models,
black segregation is omitted.
7. To estimate the potential effects of Hispanic segrega-
tion, we undertook a separate analysis of the nation’s
largest state, California, where Hispanics are numer-
ous and there are far fewer blacks. In the analysis of
California foreclosures at the city- and county-levels
that control for a much more extensive array of loan
underwriting factors, such as weighted loan-to-value
ratios, average credit scores, and interest rates and
matched city-level home price trends, we estimated
a significant, robust effect of Hispanic segregation.
Notwithstanding the incredible boom and bust in pla-
ces like the Central Valley and Inland Empire, the
residential segregation of Latinos matters a great
deal to local differences in foreclosure trends. These
results support our proposition about the primacy of
segregation in structuring the foreclosure crisis and
do not bode well for the housing market fortunes of
Hispanics, who became the largest minority group
during the housing boom.
References
Andrews, Edmund L. 2009. Busted: Life Inside the
Great Mortgage Meltdown. New York: W.W.
Norton.
Angrist, Joshua D. and Alan B. Krueger. 2001. ‘‘Instru-
mental Variables and the Search for Identification:
From Supply and Demand to Natural Experiments.’’
Journal of Economic Perspectives 15:69–85.
Apgar, William and Allegra Calder. 2005. ‘‘The Dual
Mortgage Market: The Persistence of Discrimination
in Mortgage Lending.’’ Pp. 101–123 in Geography
of Opportunity: Race and Housing Choice in Metro-
politan America, edited by X. De Souza Briggs.
Washington, DC: Brookings Institution Press.
Avery, Robert B., Kenneth P. Brevoort, and Glenn B.
Canner. 2007. ‘‘The 2006 HMDA Data.’’ Federal
Reserve Bulletin 93:73–109.
———. 2008. ‘‘The 2007 HMDA Data.’’ Federal
Reserve Bulletin 94:107–146.
Avery, Robert B., Glenn B. Canner, and Robert E. Cook.
2005. ‘‘New Information Reported Under HMDA
and Its Implication in Fair Lending Enforcement.’’
Federal Reserve Bulletin 91:344–94.
Ayres, Ian and Peter Siegelman. 1995. ‘‘Race and Gen-
der Discrimination in Bargaining for a New Car.’’
American Economic Review 85:304–321.
Been, Vicki, Ingrid Ellen, and Josiah Madar. 2009. ‘‘The
High Cost of Segregation: Exploring Racial Dispar-
ities in High-Cost Lending.’’ Fordham Urban Law
Journal 36:361–93.
Bertrand, Marriane and Sendhil Mullainathan. 2004.
‘‘Are Emily and Greg More Employable than Laki-
sha and Jamal? A Field Experiment on Labor Market
Discrimination.’’ American Economic Review
94:991–1013.
Bhardwaj, Geetesh and Rajdeep Sengupta. 2009.
‘‘Where’s the Smoking Gun? A Study of Underwrit-
ing Standards for US Subprime Mortgages.’’ Federal
Reserve Bank of St. Louis Working Paper 2008-
036C. Retrieved June 14, 2010 (http://research
.stlouisfed.org/wp/2008/2008-036.pdf).
Bhutta, Neil. 2008. ‘‘Giving Credit Where Credit Is
Due? The Community Reinvestment Act and Mort-
gage Lending in Lower-Income Neighborhoods.’’
Finance and Economics Discussion Series Divisions
of Research & Statistics and Monetary Affairs Fed-
eral Reserve Board, Washington, DC. Working
Paper 2008-61.
Bhutta, Neil and Glenn B. Canner. 2009. ‘‘Did the CRA
Cause the Mortgage Market Meltdown?’’
Community Dividend (Federal Reserve Bank of
Minneapolis). Retrieved June 14, 2010 (http://
www.minneapolisfed.org/publications_papers/pub_
display.cfm?id=4136).
Bocian, Debbie, Keith Ernst, and Wei Li. 2006. ‘‘Unfair
Lending: The Effect of Race and Ethnicity on the
Price of Subprime Mortgages.’’ Center for Responsi-
ble Lending. Retrieved June 14, 2010 (http://
www.responsiblelending.org/mortgage-lending/
research-analysis/rr011-Unfair_Lending-0506.pdf).
Bond, Carolyn and Richard Williams. 2007. ‘‘Residen-
tial Segregation and the Transformation of Home
Mortgage Lending.’’ Social Forces 86:671–98.
Bromley, Charles, Jim Campen, Saara Nafici, Adam
Rust, Geoff Smith, Kevin Stein, and Barbara van
Kerkhove. 2008. ‘‘Paying More for the American
Dream: The Subprime Shakeout and Its Impact on
Lower-Income and Minority Communities.’’ A joint
report by the California Reinvestment Coalition,
Community Reinvestment Association of North Car-
olina, Empire Justice Center, Massachusetts Afford-
able Housing Alliance, Neighborhood Economic
Development Advocacy Project, Ohio Fair Lending
Coalition, and Woodstock Institute.
Calem, Paul S., Jonathan E. Hershaff, and Susan M.
Wachter. 2004. ‘‘Neighborhood Patterns of Sub-
prime Lending: Evidence from Disparate Cities.’’
Housing Policy Debate 15:603–622.
California Reinvestment Committee. 2001. Stolen
Wealth: Disparities in California’s Subprime
Rugh and Massey 647

Lending Market. San Francisco, CA: California
Reinvestment Committee. Retrieved June 14, 2010
(http://www.calreinvest.org/system/assets/16.pdf).
Charles, Camille Zubrinsky. 2003. ‘‘The Dynamics of
Racial Residential Segregation.’’ Annual Review of
Sociology 29:167–207.
DeNavas-Walt, Carmen, Bernadette D. Proctor, and Jes-
sica C. Smith. 2009. ‘‘Income, Poverty, and Health
Insurance Coverage in the United States: 2008.’’
U.S. Census Bureau, Current Population Reports
P60-236(RV). Washington, DC: U.S. Government
Printing Office. Retrieved June 14, 2010 (http://
www.census.gov/prod/2009pubs/p60-236.pdf).
Denton, Nancy A. and Douglas S. Massey. 1989.
‘‘Racial Identity among Caribbean Hispanics: The
Effect of Double Minority Status on Residential Seg-
regation.’’ American Sociological Review 54:790–
808.
Doms, Mark, Fred Furlong, and John Krainer. ‘‘Sub-
prime Mortgage Delinquency Rates.’’ Federal
Reserve Bank of San Francisco, Working Paper
2007-33.
Dymski, Gary A. 2002. ‘‘U.S. Housing as Capital Accu-
mulation: The Transformation of American Housing
Finance, Households, and Communities.’’ Pp. 63–96
in Seeking Shelter on the Pacific Rim: Financial
Globalization, Social Change, and the Housing Mar-
ket, edited by G. A. Dymski and D. Isenberg. Ar-
monk, NY: M.E. Sharpe.
Dymski, Gary A. and John M. Veitch. 1992. ‘‘Race and
the Financial Dynamics of Urban Growth: L.A. as
Fay Wray.’’ Pp. 131–57 in City of Angels, edited
by G. Riposa and C. G. Dersch. Dubuque, IA: Ken-
dall/Hunt.
Edmiston, Kelly D. 2009. ‘‘Characteristics of High-
Foreclosure Neighborhoods in the Tenth District.’’
Federal Reserve Bank of Kansas City Economic
Review (2nd Quarter):51–75.
Elliehausen, Gregory, Michael E. Staten, and Jevgenijs
Steinbuks. 2008. ‘‘The Effect of Prepayment Penal-
ties on the Pricing of Subprime Mortgages.’’ Journal
of Business and Economics 60:33–46.
Engel, Kathleen C. and Patricia A. McCoy. 2007.
‘‘Turning a Blind Eye: Wall Street Finance of Pred-
atory Lending.’’ Fordham Law Review 73:2039–
2103.
———. 2008. ‘‘From Credit Denial to Predatory Lend-
ing: The Challenge of Sustaining Minority Home-
ownership.’’ Pp. 81–123 in Segregation: The
Rising Costs for America, edited by J. H. Carr and
N. K. Kutty. New York and London: Routledge.
Farley, Reynolds and William H. Frey. 1994. ‘‘Changes
in the Segregation of Whites from Blacks during the
1980s: Small Steps toward a More Integrated Soci-
ety.’’ American Sociological Review 59:23–45.
Farris, John and Christopher A. Richardson. 2004. ‘‘The
Geography of Subprime Mortgage Prepayment
Penalty Patterns.’’ Housing Policy Debate 15:
687–714.
Feagin, Joe R. and Melvin P. Sikes. 1994. Living with
Racism: The Black Middle-Class Experience. Bos-
ton, MA: Beacon Press.
Fischel, William. 1990. ‘‘Do Growth Controls Matter? A
Review of Empirical Evidence on the Effectiveness
and Efficiency of Local Government Land Use Reg-
ulation.’’ Lincoln Institute of Land Policy Working
Paper Series 87:1–66.
Fix, Michael and Raymond J. Struyk. 1993. Clear and
Convincing Evidence: Measurement of Discrimination
in America. Washington, DC: Urban Institute Press.
Friedman, Samantha and Gregory D. Squires. 2005.
‘‘Does the Community Reinvestment Act Help
Minorities Access Traditionally Inaccessible Neigh-
borhoods?’’ Social Problems 52:209–231.
Galster, George C. 1986. ‘‘More than Skin Deep: The
Effects of Housing Discrimination on the Extent
and Pattern of Racial Residential Segregation in
the United States.’’ Pp. 119–38 in Housing Discrim-
ination and Federal Policy, edited by J. M. Goering.
Chapel Hill, NC: University of North Carolina.
Galster, George C. and W. Mark Keeney. 1988. ‘‘Race,
Residence, Discrimination, and Economic Opportu-
nity: Modeling the Nexus of Urban Racial Phenom-
ena.’’ Urban Affairs Quarterly 24:87–117.
Gerardi, Kristopher S., Adam Hale Shapiro, and Paul S.
Willen. 2009. ‘‘Decomposing the Foreclosure Crisis:
House Price Depreciation versus Bad Underwrit-
ing.’’ Federal Reserve Bank of Atlanta, Working
Paper 2009-25. Retrieved June 14, 2010 (http://
www.frbatlanta.org/filelegacydocs/wp0925.pdf).
Gerardi, Kristopher S. and Paul S. Willen. 2008. ‘‘Sub-
prime Mortgages, Foreclosures, and Urban Neigh-
borhoods.’’ Federal Reserve Bank of Boston,
Public Policy Discussion Paper 2008-06. Retrieved
June 14, 2010 (http://www.bos.frb.org/economic/
ppdp/2008/ppdp0806.pdf).
Glaeser, Edward L. 2009. ‘‘Foreclosing the Crisis.’’ The
New Republic, February 4. Retrieved June 14, 2010
( http://www.tnr.com/article/books/foreclosing-the-
crisis).
Glaeser, Edward L. and Joseph Gyourko. 2003. ‘‘The
Impact of Building Restrictions on Housing Afford-
ability.’’ Federal Reserve Bank of New York Eco-
nomic Policy Review 9:21–39.
———. 2008. Rethinking Federal Housing Policy.
Washington, DC: American Enterprise Institute
Press.
Glaeser, Edward L., Joseph Gyourko, and Albert Saiz.
2008. ‘‘Housing Supply and Housing Bubbles.’’
Journal of Urban Economics 64:198–217.
Gyourko, Joseph, Anita Summers, and Albert Saiz.
2008. ‘‘A New Measure of the Local Regulatory
Environment for Housing Markets.’’ Urban Studies
45:693–729.
648 American Sociological Review 75(5)
Hackworth, Jason R. 2007. The Neoliberal City. Ithaca,
NY: Cornell University Press.
Hanlon, Bernadette. 2010. Once the American Dream:
Inner-Ring Suburbs of the Metropolitan United
States. Philadelphia, PA: Temple University Press.
Haughwout, Andrew, Richard Peach, and Joseph Tracy.
2008. ‘‘Juvenile Delinquent Mortgages: Bad Credit
or Bad Economy?’’ Journal of Urban Economics
64:246–57.
Hernandez, Jesus. 2009. ‘‘Redlining Revisited: Mort-
gage Lending Patterns in Sacramento 1930–2004.’’
International Journal of Urban and Regional
Research 33:291–313.
Hirsch, Barry T. and David A. MacPherson. 2007.
‘‘Metropolitan Area: Union Membership, Coverage,
Density, and Employment by Metropolitan Area and
Sector, 1986–2006,’’ Unionstats.com: Union Mem-
bership and Coverage Database from the CPS [elec-
tronic file].
Holloway, Steven R. 1998. ‘‘Exploring the Neighbor-
hood Contingency of Race Discrimination in Mort-
gage Lending in Columbus, Ohio.’’ Annals of the
Association of American Geographers 88:252–76.
Iceland, John, Daniel H. Weinberg, and Erika Steinmetz.
2002. Racial and Ethnic Residential Segregation in
the United States, 1980–2000. U.S. Census Bureau,
Special Report Series, CENSR-3. Washington, DC:
U.S. Government Printing Office. Retrieved June
14, 2010 (http://www.census.gov/hhes/www/housing/
housing_patterns/pdf/censr-3.pdf).
Immergluck, Dan. 2008. ‘‘From the Subprime to the
Exotic: Excessive Mortgage Market Risk and Impli-
cations for Metropolitan Communities and Neigh-
borhoods.’’ Journal of the American Planning
Association 74:59–76.
———. 2009. Foreclosed: High-Risk Lending, Deregu-
lation, and the Undermining of America’s Mortgage
Market. Ithaca, NY: Cornell University Press.
Immergluck, Dan and Marti Wiles. 1999. Two Steps
Back: The Dual Mortgage Market, Predatory Lend-
ing, and the Undoing of Community Development.
Chicago, IL: Woodstock Institute.
Institute on Race and Poverty. 2009. Communities in
Crisis: Race and Mortgage Lending in the Twin Cit-
ies. University of Minnesota Law School. Retrieved
June 14, 2010 (http://www.irpumn.org/uls/resources/
projects/IRP_mortgage_study_Feb._11th.pdf).
Khandani, Amir E., Andrew W. Lo, and Robert C. Mer-
ton. 2009. ‘‘Systemic Risk and the Refinancing
Ratchet Effect.’’ MIT Sloan Research Paper No.
4750-09; Harvard Business School Finance Working
Paper No. 1472892. Retrieved June 14, 2010 (http://
web.mit.edu/alo/www/Papers/refi9.pdf).
Kochhar, Rakesh, Ana Gonzalez-Barrera, and Daniel
Dockterman. 2009. ‘‘Through Boom and Bust:
Minorities, Immigrants and Homeownership.’’ Pew
Hispanic Center, Washington, DC. Retrieved June
14, 2010 (http://pewhispanic.org/files/reports/109
.pdf).
LaCour-Little, Michael and Cynthia Holmes. 2008.
‘‘Prepayment Penalties in Residential Mortgage
Contracts: A Cost-Benefit Analysis.’’ Housing Pol-
icy Debate 19:631–73.
Langley, Paul. 2008. ‘‘Sub-prime Mortgage Lending: A
Cultural Economy.’’ Economy and Society 37:469–94.
———. 2009. ‘‘Debt, Discipline, and Government:
Foreclosure and Forbearance in the Subprime
Mortgage Crisis.’’ Environment and Planning A 41:
1404–19.
Lee, Matthew. 1999. ‘‘Strategies to Combat Predatory
Subprime Lending, Particularly When Targeted at
Communities of Color.’’ National Fair Housing
Advocate Online, May. Retrieved June 14, 2010
( http://www.fairhousing.com/index.cfm?method=page
.display&pagename=guest_room_lee).
Lewis, Michael. 2010. The Big Short: Inside the Dooms-
day Machine. New York: W.W. Norton.
Mallach, Alan. 2009. ‘‘Addressing Ohio’s Foreclosure
Crisis: Taking the Next Steps.’’ Brookings Institution
Metropolitan Policy Program Papers Series, no. 6.
Manti, Michael, Paul Raca, and Peter Zorn. 2004. ‘‘Sub-
prime Lending: An Investigation of Economic Effi-
ciency.’’ Housing Policy Debate 15:533–71.
Marquez, Mercedes. 2008. ‘‘Models of Vacant Property
Disposition: Los Angeles Housing Department.’’
Presented at the Federal Reserve Board Symposium,
‘‘Confronting the Neighborhood Impacts of Foreclo-
sure,’’ October 20, Washington, DC.
Massey, Douglas S. 2004. ‘‘Segregation and Stratifica-
tion: A Biosocial Perspective.’’ The DuBois Review:
Social Science Research on Race 1:1–19.
———. 2005a. ‘‘Racial Discrimination in Housing: A
Moving Target.’’ Social Problems 52:148–51.
———. 2005b. Return of the L-Word: A Liberal Vision
for the New Century. Princeton, NJ: Princeton Uni-
versity Press.
———. 2007. Categorically Unequal: The American
Stratification System. New York: Russell Sage
Foundation.
———. 2009. ‘‘Racial Formation in Theory and Prac-
tice: The Case of Mexicans in the United States.’’
Race and Social Problems 1:12–26.
Massey, Douglas S. and Brooks Bitterman. 1985. ‘‘Ex-
plaining the Paradox of Puerto Rican Segregation.’’
Social Forces 64:307–31.
Massey, Douglas S. and Nancy A. Denton. 1988. ‘‘The
Dimensions of Residential Segregation.’’ Social
Forces 67:281–315.
———. 1992. ‘‘Racial Identity and the Segregation of
Mexicans in the United States.’’ Social Science
Research 21:235–60.
———. 1993. American Apartheid: Segregation and the
Making of the Underclass. Cambridge, MA: Harvard
University Press.
Rugh and Massey 649

Massey, Douglas S. and Mary J. Fischer. 1999. ‘‘Does
Rising Income Bring Integration? New Results for
Blacks, Hispanics, and Asians in 1990.’’ Social Sci-
ence Research 28:316–26.
———. 2000. ‘‘How Segregation Concentrates Pov-
erty.’’ Ethnic and Racial Studies 23:670–91.
Massey, Douglas S., Jonathan Rothwell, and Thurston
Domina. 2009. ‘‘Changing Bases of Segregation in
the United States.’’ Annals of the American Academy
of Political and Social Science 626:74–90.
Massey, Douglas S., Michael J. White, and Voon-Chin
Phua. 1996. ‘‘The Dimensions of Segregation Revis-
ited.’’ Sociological Methods and Research 25:172–206.
Mayer, Christopher, Karen Pence, and Shane M. Sher-
lund. 2009. ‘‘The Rise in Mortgage Defaults.’’ Jour-
nal of Economic Perspectives 23:27–50.
Mortgage Bankers Association. 2006. ‘‘Residential
Mortgage Delinquencies Increase, According to
MBA National Delinquency Survey [NDS].’’ Press
Release, NDS, March 16. Retrieved June 14, 2010
(http://www.mortgagebankers.org/NewsandMedia/Press
Center/40245.htm).
———. 2010. ‘‘Delinquencies, Foreclosure Starts Fall
in Latest MBA National Delinquency Survey
[NDS].’’ Press Release, NDS, February 19.
Retrieved June 14, 2010 (http://www.mortgageban
kers.org/NewsandMedia/PressCenter/71891.htm).
National Association of Realtors, Research Division.
2004. ‘‘Rising Foreclosure Rates in Indiana: An
Explanatory Analysis of Contributing Factors.’’
Retrieved June 14, 2010 (http://www.mibor.com/
_pdfs/ForeclosureStudy2004.pdf).
Oliver, Melvin L. and Thomas M. Shapiro. 2006. Black
Wealth/White Wealth: A New Perspective on Racial
Inequality, 2nd ed. New York and London:
Routledge.
Pager, Devah. 2007. Marked: Race, Crime, and Finding
Work in an Era of Mass Incarceration. Chicago, IL:
University of Chicago Press.
Park, Kevin. 2008. ‘‘Subprime Lending and the Commu-
nity Reinvestment Act.’’ Joint Center for Housing
Studies at Harvard University, Cambridge, MA.
Pendley, M. Diane, Glenn Costello, and Mary Kelsch.
2007. ‘‘The Impact of Poor Underwriting Practices
and Fraud in Subprime RMBS Performance.’’ Fitch
Ratings Structured Finance U.S. Mortgage Special
Report. Retrieved June 14, 2010 (http://www.fitch
ratings.com/creditdesk/reports/report_frame.cfm?rpt_
id=356624).
Pennington-Cross, Anthony, Anthony Yezer, and Joseph
Nichols. 2000. ‘‘Credit Risk and Mortgage Lending:
Who Uses Subprime and Why?’’ Research Institute
for Housing America Working Paper 00–03.
Peterson, Christopher L. 2007. ‘‘Predatory Structured
Finance.’’ Cardozo Law Review 28:2185–282.
Powell, Michael. 2010. ‘‘Blacks in Memphis Lose Decades
of Economic Gains.’’ New York Times, May 30, p. A1.
Quercia, Roberto G., Michael A. Stegman, and Walter
R. Davis. 2007. ‘‘The Impact of Predatory Loan
Terms on Subprime Foreclosures: The Special
Case of Prepayment Penalties and Balloon Pay-
ments.’’ Housing Policy Debate 18:311–46.
Raynes, Sylvain and Ann Rutledge. 2003. The Analysis
of Structured Securities: Precise Risk Measurement
and Capital Allocation. Oxford and New York:
Oxford University Press.
Renuart, Elizabeth. 2004. ‘‘An Overview of the Preda-
tory Lending Mortgage Lending Process.’’ Housing
Policy Debate 15:467–502.
Ridley, Stanley E., James A. Bayton, and Janice H.
Outtz. 1989. ‘‘Taxi Service in the District of Colum-
bia: Is it Influenced by Patron’s Race and Destina-
tion?’’ Paper prepared for the Washington, DC
Lawyer’s Committee for Civil Rights Under the Law.
Ross, Stephen L. and Margery A. Turner. 2005. ‘‘Hous-
ing Discrimination in Metropolitan America: Ex-
plaining Changes between 1989 and 2000.’’ Social
Problems 52:152–80.
Ross, Stephen L. and John Yinger. 2002. The Color of
Credit: Mortgage Discrimination, Research Method-
ology, and Fair-Lending Enforcement. Cambridge,
MA and London: MIT Press.
Rothwell, Jonathan and Douglas S. Massey. 2009. ‘‘The
Effect of Density Zoning on Racial Segregation in
U.S. Urban Areas.’’ Urban Affairs Review 44:779–
806.
Satter, Beryl. 2009. Race, Real Estate and the Exploita-
tion of Black Urban America. New York: Metropol-
itan Books.
Schuetz, Jenny, Vicki Been, and Ingrid Gould Ellen.
2008. ‘‘Neighborhood Effects of Concentrated Mort-
gage Foreclosures.’’ Journal of Housing Economics
17:306–319.
Shapiro, Thomas M., Tatjana Meschede, and Laura Sul-
livan. 2010. ‘‘The Racial Wealth Gap Increases
Fourfold.’’ Institute on Assets and Social Policy
Research and Policy Brief. Retrieved June 14,
2010 (http://iasp.brandeis.edu/pdfs/Racial-Wealth-
Gap-Brief.pdf).
Shiller, Robert J. 2008. The Subprime Solution: How To-
day’s Global Financial Crisis Happened, and What
to Do about It. Princeton, NJ: Princeton University
Press.
Sowell, Thomas. 2009. The Housing Boom and Bust.
New York: Basic Books.
Squires, Gregory D. 1994. Capital and Communities in
Black and White: The Intersections of Race, Class,
and Uneven Development. Albany, NY: State Uni-
versity of New York Press.
———, ed. 2004. Why the Poor Pay More. Westport,
CT: Praeger.
Squires, Gregory D., Derek S. Hyra, and Robert N. Ren-
ner. 2009. ‘‘Segregation and the Subprime Lending
Crisis.’’ Presented at the 2009 Federal Reserve
650 American Sociological Review 75(5)

System Community Affairs Research Conference.
Retrieved June 14, 2010 (http://www.kansascityf
ed.org/carc2009/pdf/carc2009%20Hyra%20paper
.pdf).
Stuart, Guy. 2003. Discriminating Risk: The U.S. Mort-
gage Lending Industry in the Twentieth Century.
Ithaca, NY: Cornell University Press.
Sullivan, Teresa A., Elizabeth Warren, and Jay Law-
rence Westbrook. 2000. The Fragile Middle Class:
Americans in Debt. New Haven, CT: Yale Univer-
sity Press.
Turner, Margery A., Michael Fix, and Raymond J.
Struyk. 1991. Opportunities Denied, Opportunities
Diminished: Racial Discrimination in Hiring. Wash-
ington, DC: Urban Institute Press.
Turner, Tracy M. and Marc T. Smith. 2009. ‘‘Exits from
Homeownership: The Effects of Race, Ethnicity, and
Income.’’ Journal of Regional Science 49:1–32.
U.S. Department of Housing and Urban Development
(HUD). 2000. Unequal Burden: Income and Racial
Disparities in Subprime Lending in America.
Retrieved June 14, 2010 (http://www.huduser.org/
publications/fairhsg/unequal.html).
Williams, Richard, Reynold Nesiba, and Eileen Diaz
McConnell. 2005. ‘‘The Changing Face of Inequality
in Home Mortgage Lending.’’ Social Problems
52:181–208.
Wilkes, Rima and John Iceland. 2004. ‘‘Hypersegrega-
tion in the Twenty-First Century: An Update and
Analysis.’’ Demography 41:23–36.
Wyly, Elvin K., Mona Atia, Holly Foxcroft, Daniel J.
Hamme, and Kelly Phillips-Watts. 2006. ‘‘Ameri-
can Home: Predatory Mortgage Capital and Neigh-
bourhood Spaces of Race and Class Exploitation in
the United States.’’ Geografiska Annaler 88:
105–132.
Wyly, Elvin, Markus Moos, Daniel Hammel, and Ema-
nuel Kabahizi. 2009. ‘‘Cartographies of Race and
Class: Mapping the Class-Monopoly Rents of Amer-
ican Subprime Mortgage Capital.’’ International
Journal of Urban and Regional Research 33:332–54.
Yinger, John. 1986. ‘‘Measuring Racial Discrimination
with Fair Housing Audits: Caught in the Act.’’ Amer-
ican Economic Review 76:991–93.
———. 1995. Closed Doors, Opportunities Lost: The
Continuing Costs of Housing Discrimination. New
York: Russell Sage.
Zhao, Bo, Jan Ondrich, and John Yinger. 2006. ‘‘Why
Do Real Estate Brokers Continue to Discriminate?
Evidence from the 2000 Housing Discrimination
Study.’’ Journal of Urban Economics 59:394–419.
Jacob S. Rugh is a PhD candidate in Public Affairs at
the Woodrow Wilson School of Public and International
Affairs at Princeton University. His research focuses on
urban policy and the intersection of housing markets,
land use regulation, and local politics. His forthcoming
dissertation will focus on the social, economic, and local
regulatory roots of the recent U.S. housing crisis and
their implications for public policy.
Douglas S. Massey is the Henry G. Bryant Professor of
Sociology and Public Affairs at Princeton University. He
currently serves as President of the American Academy
of Political and Social Science and is past-President of
the American Sociological Association and the Popula-
tion Association of America. His latest book is Brokered
Boundaries: Creating Immigrant Identity in Anti-Immi-
grant Times, coauthored with Magaly Sanchez and pub-
lished by the Russell Sage Foundation.
Rugh and Massey 651