volume22,issue1,spring2017 - usma.edu militaris/v22_issue1.pdf · thevalueofairforcesabbaticalsto...
TRANSCRIPT

Volume 22, Issue 1, Spring 2017
Mathematica Militaris, Vol. 22, Issue 1 1

Table of ContentsSpring 2017, Volume 22, Issue 1
The Value of Air Force Sabbaticals to Operations, Academia, andCadets Ralph Boedigheimer, Michael Brilleslyper, Dale Peter-son, and Bradley Warner 4
An Application of Matrix Theory to Baseball Rankings DavidJoyner 29
Humans are Underrated: Geoff Colvin on the Importance of Empa-thy Caroline Melles 40
Mathematica Militaris, Vol. 22, Issue 1 2

A Note from the Editors:
Beginning in 1989, Mathematica Militaris has served as a forum forexchanging ideas, views, experiences, and faculty research concern-ing mathematics education at the five Federal Service Academies.We are excited to publish Volume 22 of the Journal in 2017, and weintend to publish the journal each year.
First in this issue, Ralph Boedigheimer, Michael Brilleslyper,Dale Peterson, and Bradley Warner summarize their sabbatical timespent addressing problems at the Headquarters of the Air ForceSpace Command Analysis Division, and the resulting academic ben-efits. This is followed by David Joyner’s application of Massey rank-ing to Patriot League men’s baseball which includes both Armyand Navy. Lastly, Caroline Melles details the implications of GeoffColvin’s book Humans are Underrated to our way of teaching at theservice academies.
We hope you enjoy this edition of Mathematica Militaris, and welook forward to receiving new submissions in the near future. Besure to visit our website:
http://www.usma.edu/math/SitePages/Mathematica%20Militaris.aspx
LTC Randal [email protected]
Dr. Ivan [email protected]
Mathematica Militaris, Vol. 22, Issue 1 3

The Value of Air Force Sabbaticals toOperations, Academia, and Cadets
Ralph Boedigheimer, Michael Brilleslyper, Dale Peterson, andBradley WarnerDepartment of Mathematical SciencesUnited States Air Force Academy
Introduction
From 2002 through 2011, five civilian faculty members at the US-AFA Department of Mathematical Sciences (DFMS), including thefour authors of this paper, did a one-year sabbatical at Headquar-ters, Air Force Space Command (HQ AFSPC) Analysis Division(A9).
Moore [4] summarizes the types of problems that DFMS facultymembers addressed at HQ AFSPC/A9: “Challenges include solvingproblems in the areas of predictive analysis for current and futurespace systems, constellation optimization for increased military util-ity, operational effects of terrain masking, jamming and innovativemitigation tactics, techniques and procedures (TT & Ps), and assess-ments of the military utility of improved space weather observationand forecast systems.” HQ AFSPC/A9 has sponsored these sab-baticals and appreciated the expertise that DFMS personnel havebrought to their operational mission. The second section describeseach of the author’s work and the benefits HQ AFSPC/A9 has re-alized from their efforts.
Moreover, DFMS personnel have taken problems back to USAFAand realized academic benefits, including conference presentationsand publications, described in Academic Benefits section. Notably,the partnership that we have fostered with HQ AFSPC has been ofgreat benefit to our cadets. The final section describes the advancedstudies projects that have resulted from academic sabbaticals.
Mathematica Militaris, Vol. 22, Issue 1 4

Description of Sabbaticals and Operational Bene-fits
DFMS faculty members have been able to leverage their depthof mathematical knowledge to solve difficult operational problemsfor HQ AFSPC/A9. Moore [4] states that “this visiting professorprogram has proven to be a valuable collaboration between HQ AF-SPC and USAFA. HQ AFSPC has benefited by being able, oftenfor the first time, to solve some of our thorniest analysis challengesfor Space acquisition, sustainment and operations.”
The subsections below describe the operational problems thatDFMS faculty members tackled at HQ AFSPC/A9.
Bradley Warner: 2002-2003
Professor Warner spent a year prior to his sabbatical developing con-nections, scoping work, and arranging funding to make a sabbaticalat HQ AFSPC possible. He accomplished this with the help andvision of HQ AFSPC Col T.S. Kelso, Col Kent Lambert, Col (ret)Greg Keethler, and Lt Col Lee Lehmkuhl. The first purpose of thesabbatical was to understand and gain an appreciation for the workdone at an operational Air Force command. The second was to helpA9 with their projects. Finally, he sought ways for USAFA and HQAFSPC to continue to work together after the sabbatical.
Professor Warner spent the first month of his sabbatical learningabout the different programs and projects at A9. Likewise, A9 foundprojects to capitalize on Dr. Warner’s expertise. The end result wasthat he learned about the type of work Air Force analysts perform,contributed on several projects, and developed some opportunitiesfor future collaboration. As summary of the work:
• He assisted in the analysis on a classified project for Task ForceEnduring Look that resulted in a novel approach to examiningthe impact of the Global Positioning System (GPS) errors onthe accuracy of Joint Direct Attack Munition (JDAM). The
Mathematica Militaris, Vol. 22, Issue 1 5

idea was that modeling the distribution of errors for the muni-tion was a hybrid between a discrete distribution and a contin-uous distribution. If the target was inside a bomb blast crater,then the error was recorded as a zero. If the target was outsidethe blast crater then a distance could be measured. Modelingthis required Dr. Warner’s team to estimate parameters forthe two different distributions and combine them into a singlecumulative distribution function. The weighting of these twodistributions also had to be estimated. The result was a predic-tive model that gave the probability of specified miss distance.This could then be used to determine if assets needed to beused to adjust the GPS satellites.
• He was a teammember on the Operationally Responsive SpaceliftAnalysis of Alternatives. The team developed a novel approachby determining measures of effectiveness and then defining re-quirements and analyzing possible solutions, alternatives. Indeveloping these measures of effectiveness, the team developedseveral animated .gif files to help decision makers understandthe impact of space assets on operational outcomes. This wasan early attempt at visual analytics. The team also assistedin the design of experiments to determine the impact of thedifferent alternatives for measures of effectiveness in campaignlevel simulations of a futuristic war.
• He assisted the Covariance Accuracy Working Group on devel-oping metrics to summarize satellite tracking error information.Previous work included spherical error regions and elliptical er-ror regions. The spherical error regions were too large especiallyfor low Earth orbit satellites where most of the error was in thedirection of the satellite motion. The ellipsoid error regionsdid not have this problem but also assumed that the errorswere independent. The team found a way to quickly find anerror ellipsoid using the entire covariance matrix. There wasalso a question about finding a rectilinear region that incorpo-rated at least as much probability. This was desirable becauseit was easier to understand and report. This region was de-termined using a variation of the Bonferroni inequality ( ref:https://en.wikipedia.org/wiki/Boole%27s_inequality ).Figure 1 illustrates the error ellipsoid and corresponding Bon-
Mathematica Militaris, Vol. 22, Issue 1 6

Figure 1: Error ellipsoid and a bonferroni box.
ferroni box for a hypothetical low Earth orbit satellite.
• He taught a number of seminars for the analysts. The top-ics included visual representation of data, the bootstrap, andcategorical data analysis.
• He established links between USAFA and HQ AFSPC that re-sulted in academic benefits, described in Section 3 below.
As a result of Dr. Warner’s work, a memorandum of agreementwas established that paved the way for other faculty members totake sabbaticals at HQ AFSPC. For his accomplishments ProfessorWarner received the U.S. Air Force Award for Exemplary CivilianService.
Michael Brilleslyper: 2007-2008
Dr. Brilleslyper worked with Mr. Mark Staley of HQ AFSPC/A9 tohelp develop a database that contains information about the world’sterrain. The purpose was to allow more realistic evaluation of GPSperformance in different regions. In order for the GPS to function,the user on the ground must have a direct line of sight (LOS) to atleast four (of the currently 31) satellites in the GPS constellation.Historically, GPS performance models assumed that a user on the
Mathematica Militaris, Vol. 22, Issue 1 7

Figure 2: Complete terrain mask for a location in the Colorado Springs foothills:elevation angle in degrees as a function of azimuth.
ground had direct LOS to all points in the sky that were 5 degreesor more above the local horizon. While such an assumption may beappropriate for Kansas, it is certainly not reasonable for the moun-tains of Afghanistan.
The goal was to build a database that contained complete terrainmask information for every point on Earth that was not “flat.” Aterrain mask is a plot that shows the angle of elevation from a userto every point of that user’s local horizon. For example, someonestanding at the bottom of a steep canyon might have very large el-evation angles in two directions, but much smaller angles lookingtowards the length of the canyon. Someone standing in the middleof the desert might have a terrain mask where every point on thehorizon has an elevation angle of less than 5 degrees. Any locationwith a terrain maximum elevation angle (MEA) below 5 degrees isconsidered flat for our purposes. Figure 2 shows a (not flat) terrainmask for a point in the Colorado Springs foothills. (A terrain maskdoes not display negative elevation angles even though they mayoccur.)
Dr. Brilleslyper contributed to this effort in the following ways:
Mathematica Militaris, Vol. 22, Issue 1 8

• The first significant part of this project was to identify whichearth locations are flat. Fortunately, terrain data for mostof the world’s land masses is freely available; unfortunately,the data is huge. In February 2000, the Space Shuttle En-deavor spent ten days in orbit collecting surface radar returnsof the Earth’s land masses. Over 12 terabytes of raw data wasprocessed by NASA into roughly 15,000 separate files each ofsize 2.8 megabytes. This database is referred to as the ShuttleRadar Topography Mission (SRTM) data. This data containsinformation on about 23 billion posts - an earth location with el-evation data. Using brute force, to compute the MEA for everypost would have been intractable; it would have required tensof thousands of years on a fast PC. In contrast, Dr. Brilleslyperand Mr. Staley developed a program that found and stored theMEA for every location in the SRTM database in only a fewhours.Their algorithm used a number of techniques for limiting whereto look and also for performing calculations very quickly. Theyemployed several geographic ideas that took advantage of thefact that the Earth is curved and tall objects appear to getshorter as one moves further away (eventually all objects dis-appear over the horizon). This allowed them to limit the searcharea for each post. They then employed a “divide and conquer”method: they divided the posts into cells of 441 posts each,identified the maximum altitude in each cell, and from thatdid a small exhaustive search to set up an “interim” maximumelevation angle against which to measure the cells.Another key idea in the program for calculating elevation an-gles was to translate both the user location and the distant postfrom local North, East, up coordinates into Cartesian Earth-centered, Earth-fixed coordinates (ECEF). In this system, thez-axis runs through the poles, the equatorial plane coincideswith the equator and the positive x-axis points through thePrime Meridian. The slope of the elevation angle is found byprojecting the difference of the position vectors into the tangentplane of the user to obtain the run and onto the user vectoritself to obtain the rise. This allowed them to quickly iden-tify flat cells (MEA less than five degrees) without searchingthem exhaustively. They incorporated a number of time-saving
Mathematica Militaris, Vol. 22, Issue 1 9

Figure 3: Terrain maximum map: central Rocky Mountains. The Southwestcorner is located at 38N, 106W.
techniques, such as comparing rise-over-run (slope) to tan(5◦)rather than using the square root and the arctangent function intheir calculations. Using this approach, their program quicklydiscovered that roughly 17 billion of the 23 billion posts areflat. Hence, about 74% of the planet’s land masses and coastalareas are essentially smooth with regard to LOS applications forsatellites.
• Finding the MEA at every location was only a stepping stoneto the ultimate goal of cataloging and storing full terrain masksfor locations with potential LOS blockages. However, it yieldedan unexpected and fascinating alternative view of the Earth’stopography. Figure 3 shows a terrain maximum map of a re-gion in the central part of the Rocky Mountains in Colorado.The different colors correspond to distinct ranges of maximumelevation angles. Note that there is no direct indication of dis-tance or direction to the locations that cause the maximumelevation angle. Figure 4 shows a more standard topographicmap of the same region. Note how certain geographic featuresare reflected in both figures. Each of these two maps representsabout 4000 square miles and was generated by over 1.4 millionpixels.
Mathematica Militaris, Vol. 22, Issue 1 10

Figure 4: Topographic map: central Rocky Mountains. The Southwest corneris located at 38N, 106W.
Ultimately HQ AFSPC/A9, relying in large part on Dr. Brilleslyper’scontributions, realized the entire project’s goal, and HQ AFSPCuses the full terrain mask data operationally to provide more robustperformance metrics for the GPS in local regions. Moreover, thereare additional uses involving constellations of other systems besidesthe GPS. The project spurred several conference presentations anda technical paper; see the Academic Benefits section.
Dr. Brilleslyper’s time at HQ AFSPC began a string of threeconsecutive sabbaticals, all dealing largely with computer modelingof the GPS. This solidified the relationship and continuity betweenUSAFA/DFMS and HQ AFSPC/A9.
Dale Peterson: 2008-2009
Dr. Peterson came into his sabbatical with nearly 10 years priorexperience in space systems in the aerospace industry, includingsatellite control. This made him a good fit to continue with theGPS program to which Professors Warner and Brilleslyper had con-tributed.
One of the missions of HQ AFSPC/A9 is GPS satellite constella-tion design. This includes identifying the satellite positioning thatleads to the most accurate receiver readings at earth locations. Most
Mathematica Militaris, Vol. 22, Issue 1 11
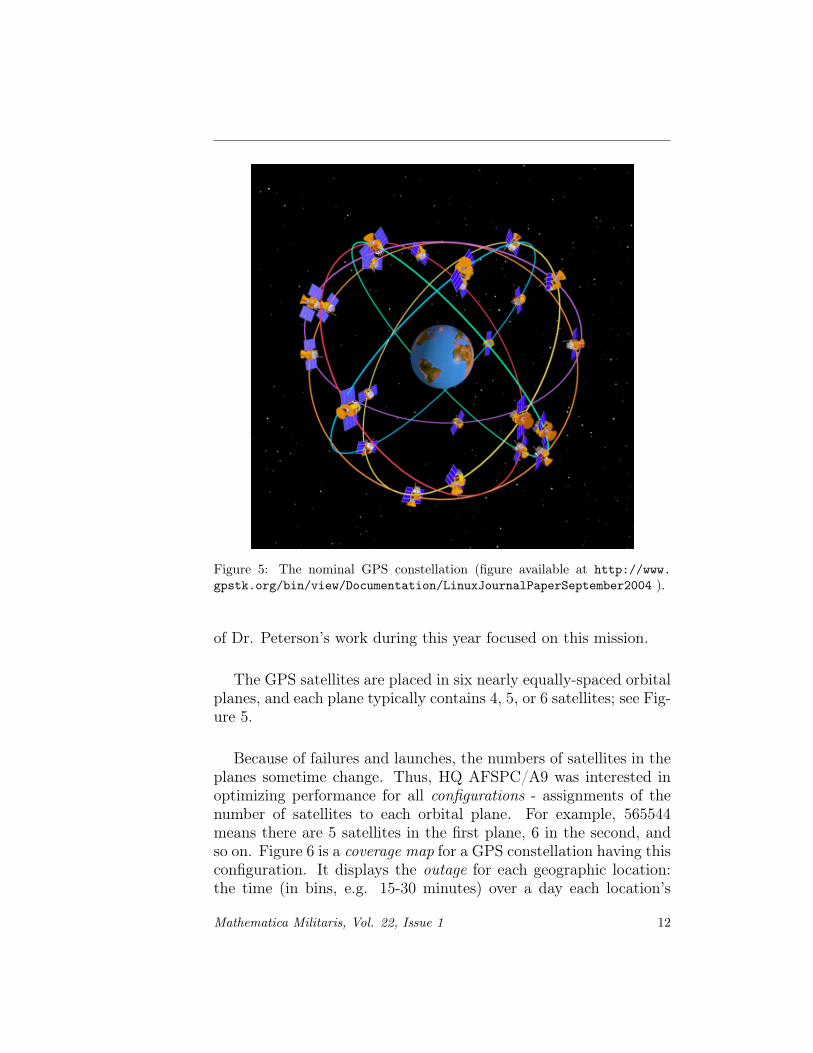
Figure 5: The nominal GPS constellation (figure available at http://www.gpstk.org/bin/view/Documentation/LinuxJournalPaperSeptember2004 ).
of Dr. Peterson’s work during this year focused on this mission.
The GPS satellites are placed in six nearly equally-spaced orbitalplanes, and each plane typically contains 4, 5, or 6 satellites; see Fig-ure 5.
Because of failures and launches, the numbers of satellites in theplanes sometime change. Thus, HQ AFSPC/A9 was interested inoptimizing performance for all configurations - assignments of thenumber of satellites to each orbital plane. For example, 565544means there are 5 satellites in the first plane, 6 in the second, andso on. Figure 6 is a coverage map for a GPS constellation having thisconfiguration. It displays the outage for each geographic location:the time (in bins, e.g. 15-30 minutes) over a day each location’s
Mathematica Militaris, Vol. 22, Issue 1 12
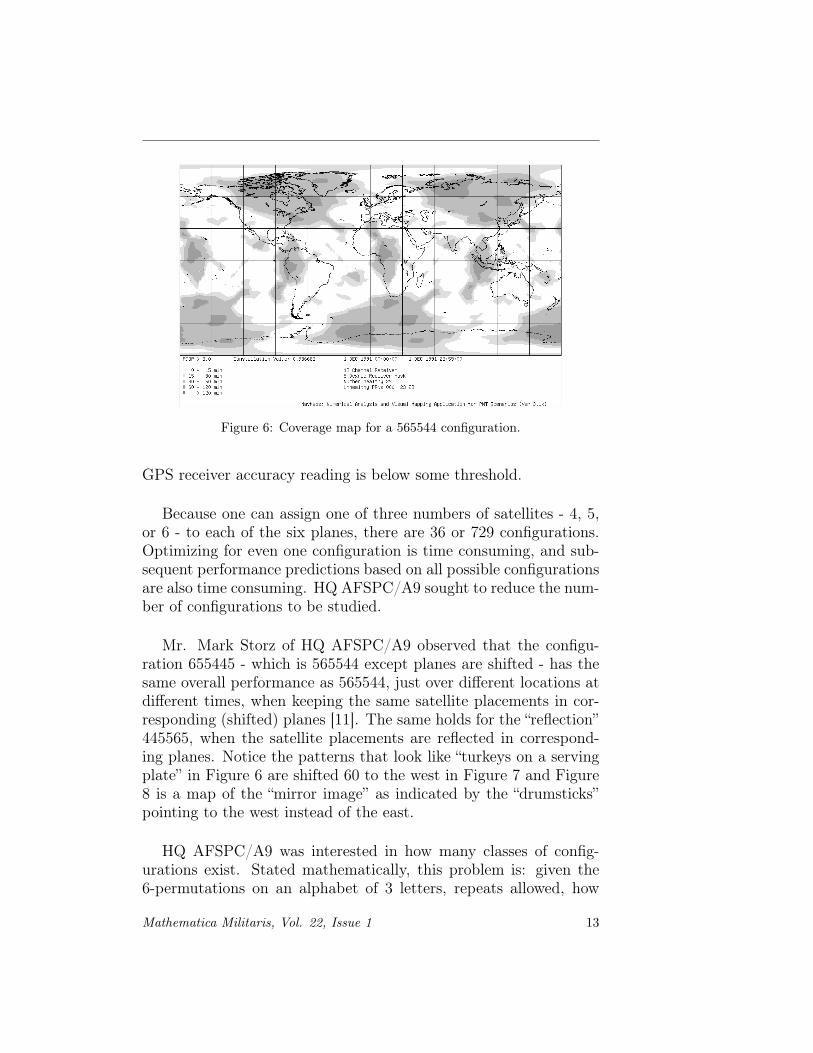
Figure 6: Coverage map for a 565544 configuration.
GPS receiver accuracy reading is below some threshold.
Because one can assign one of three numbers of satellites - 4, 5,or 6 - to each of the six planes, there are 36 or 729 configurations.Optimizing for even one configuration is time consuming, and sub-sequent performance predictions based on all possible configurationsare also time consuming. HQ AFSPC/A9 sought to reduce the num-ber of configurations to be studied.
Mr. Mark Storz of HQ AFSPC/A9 observed that the configu-ration 655445 - which is 565544 except planes are shifted - has thesame overall performance as 565544, just over different locations atdifferent times, when keeping the same satellite placements in cor-responding (shifted) planes [11]. The same holds for the “reflection”445565, when the satellite placements are reflected in correspond-ing planes. Notice the patterns that look like “turkeys on a servingplate” in Figure 6 are shifted 60 to the west in Figure 7 and Figure8 is a map of the “mirror image” as indicated by the “drumsticks”pointing to the west instead of the east.
HQ AFSPC/A9 was interested in how many classes of config-urations exist. Stated mathematically, this problem is: given the6-permutations on an alphabet of 3 letters, repeats allowed, how
Mathematica Militaris, Vol. 22, Issue 1 13

Figure 7: Coverage map for a 655445 configuration (565544 shifted 60 to thewest).
Figure 8: Coverage map for a 445565 configuration (mirror image of 565544).
Mathematica Militaris, Vol. 22, Issue 1 14

many classes are there where two permutations are in the same classwhenever one can be obtained from the other by a reversal or anynumber of wrap-around shifts? Dr. Peterson’s research backgroundincludes combinatorics, so HQ AFSPC/A9 asked him to identify thenumber of classes. He solved this problem using a combinatorial al-gebraic result known as Polya’s Theorem. He found that there are92 classes and identified other properties about the classes, such astheir sizes and structures [6].
Among the other problems on which Dr. Peterson worked:
• GPS receivers at earth locations may receive up to r channels(satellite signals), but there may be n satellites in view wherer < n. The problem is to identify which r satellites yield thebest performance. A brute force application of the performanceequation, which requires matrix multiplications and inversionsapplied to all
(nr
)combinations at earth locations over time,
resulted in numbers of operations that were impractical forcomputer studies. But the number of operations required wasreduced by orders of magnitude by ordering the combinationssuch that the change between successive combinations consistsof a swap of just two satellites, then using a linear algebratechnique called the Sherman-Morrison formula [7] to updatea matrix inverse with only a small number of operations. Suchan ordering of combinations is called a binary-reflected Graycode order [9]. Dr. Peterson programmed these techniques intoan HQ AFSPC/A9 computer model called Numerical Analysisand Visual Mapping Application (NAVMAPS). NAVMAPS isused operationally to position satellites.
• A common metric for measuring the effectiveness of a GPS con-stellation is coverage. This is computed from coverage maps:the outages from all locations are changed from minutes topercentages, subtracted from 100%, and then averaged. HQAFSPC/A9, however, was interested in a more robust perfor-mance function. Dr. Peterson developed a performance func-tion based on a logistic curve that is a continuous function ofperformance readings, and also weights “trouble” spots. Usingthis as an objective function in optimization studies reduced
Mathematica Militaris, Vol. 22, Issue 1 15
the variability in outages [5].
• HQ AFSPC/A9 wished to expand NAVMAPS into a majorsoftware tool called Operational Performance Mapping Avail-ability Program (OPMAP) that analyzes multiple GPS con-stellations and displays, based on probabilities of satellite fail-ures and expected launches, expected performance values andmaps over time. Dr. Peterson designed the structure and pro-grammed the prototype. He coauthored a Statement of Work(SOW) for a contractor to add interfaces and helped overseeits work. Dr. Boedigheimer continued work on OPMAP; seein the second section of this paper.
For his accomplishments Professor Peterson received the U.S. AirForce Award for Exemplary Civilian Service.
In ongoing collaborative work, Dr. Peterson and one of his for-mer students, Lt Sam Rinaldi, identified an appropriate nonlinearprogramming algorithm and coded it to find optimal GPS satelliteplacements.
Ralph Boedigheimer: 2009-2010
Dr. Boedigheimer’s specialty is statistics, which became an impor-tant need for HQ AFSPC/A9 during this year. Dr. Boedigheimercontributed to several projects.
• He performed a thorough, formal verification of the Opera-tional Generalized Availability Program (OpGAP), which is HQAFSPC’s main software application for predicting the satellitefunctional availability resulting from planned launch schedulesand expected satellite functional lifetimes. His deliverables in-cluded Technical Report 10-01 [1] and a briefing to the GPSFunctional Availability Working Group. The screen shot of oneof the OpGAP menus given in Figure 9 is an example of theverification performed. On this screen, several non-functioningwindows were noted, input interdependencies were identified,and an ineffective help toggle was detected.
Mathematica Militaris, Vol. 22, Issue 1 16

Figure 9: OpGAP menu
• He contributed to the OPMAP software tool begun by Profes-sor Peterson the year before. OPMAP was further developed totranslate OpGAP results into maps of warfighter-relevant met-rics. For version 1, he completed nearly 200 test cases requiredto formally accept OPMAP software from the contractor. Forthe next version, he revised the statistics presented by the soft-ware, retooled the software engine needed to compute some ofthose statistics to incorporate a Monte Carlo approach, andreshaped the way those statistics are displayed for the user.The software provided a more realistic and useful result for thewarfighter as can be seen in the example screen in Figure 10.The screen shot shows a world view of GPS satellite coverage(top window), the reliability of each GPS satellite in the con-stellation (bottom-left window), and a time series of criticalconstellation statistics as satellites fail and are replaced in aMonte Carlo simulation (bottom right window).
• He studied the sensitivity of OpGAP output to input parame-ters. Over a 6-month period, he teamed with HQ AFSPC/A9Apersonnel to completely scrub GPS predictive analysis. Theirnew analysis and reporting process became the “gold standard”for other satellite programs to follow. The reliability study
Mathematica Militaris, Vol. 22, Issue 1 17

Figure 10: OPMAP screen output.
provided a comprehensive review of the process for developingthe four-parameter failure models used to predict individualsatellite reliability for the GPS. The final report demonstratedhow multiple sources of error affect the variability of the four-parameter failure models used for each satellite and how thatvariability propagates to the final result. This study removeda pessimistic bias in reliability parameters and provided a solidbasis for senior leaders to make informed GPS sustainment andacquisition decisions. Deliverables included Technical Report11-01 [2] with over 200 pages of computer code in R and abriefing to HQ AFSPC commander General C. Robert Kehler(HQ AFSPC/CC). The key recommendations were:
– Establish the accuracy of the GPS reliability predictions– Evaluate the constellation using mission reliability– Generate a verifiable technical failure analysis report bien-
nially– Establish an approved method to update the random ef-
fects model– Institute a verifiable reporting system for failure data
Mathematica Militaris, Vol. 22, Issue 1 18

– Apply rigorous scrutiny to model selection
– Correct specific errors identified by this study
– Apply lessons learned to Block IIF and GPS III satellites
For his accomplishments on the GPS Predictive Analysis Team,Professor Boedigheimer was awarded the Team of the Quarter forHQ AFSPC.
Academic Benefits
Moore [4] states that “the knowledge gained by the visiting pro-fessors in performing operational analysis has led to a stronger em-phasis of the mathematics curriculum on real-world applications.”Benefits to cadets have included:• In the classroom we have related our applications of advancedmathematics to actual Air Force operational missions. Theseapplications have motivated the cadets in their mathematicaleducation in anticipation of their Air Force careers.
• We have expressed the importance of computer programmingto our mathematics majors. This emphasis increased follow-ing Dr. Brilleslyper’s sabbatical, which began a string of sab-baticals where advanced mathematical techniques were madeoperational through computer models.
• We have brought HQ AFSPC personnel to speak in USAFAcourses. Col Kelso spoke to a general audience, Mr. Bob Morrispresented to cadets in Astro 321, and Capt. Mike Warner’sadvanced astrodynamics course visited NORAD.
• The HQ AFSPC-USAFA collaborations have led to severalcadet advanced study projects; see theDescription of cadet projectssection.
The academic benefits of these sabbaticals extend beyond ped-agogy to scholarly activities. The following conference talks weregiven by the authors and collaborating HQ AFSPC personnel.
Mathematica Militaris, Vol. 22, Issue 1 19

• Warner, Bradley, “Applicability of Equivalence Testing for Com-paring OT&E and M&S Data”, Military Operations ResearchSymposium (MORS), Albuquerque, October 2002.
• Boedigheimer, Ralph, Jeffrey Grobman, and Bradley Warner,“Simulation V&V with Bioequivalence Testing”, Institute forOperations Research and the Management Sciences (INFORMS)Annual Meeting, Denver, October 24-27, 2004.
• Staley, Mark, and Mike Brilleslyper, “Mapping the Earth withElevation Angles”, Rocky Mountain Section Meeting of theMathematical Association of America (MAA), Spearfish, SD,April 2008.
• Staley, Mark, and Mike Brilleslyper, “Integrating High Resolu-tion Terrain Data into Global PDOP Calculations”, Instituteof Navigation, Global Navigation Satellite System (ION GNSS)2008, Savannah, GA, 19 Sep 2008.
• Staley, Mark, and Mike Brilleslyper, “Mapping the Earth withElevation Angles”, 100th Annual Meeting of the MathematicalAssociation of America (MAA) - Joint Mathematics Meetings,Special session on Imaging the Earth, San Antonio, TX, 12 Jan2015.
• Peterson, Dale, “GPS satellite configurations and their astrody-namic and algebraic ‘orbits’ ”, Intermountain/Rocky Mountainjoint Regional Conference of the Mathematical Association ofAmerica (MAA), Grand Junction, CO, Apr 2016.
Finally, our work resulted in several publications:
• Dr. Warner and Dr. Boedigheimer coauthored a paper on astatistical method applied to validating simulations titled “TheApplicability of Equivalence Testing to Simulation Validation”that appeared in a MORS journal [12].
• Dr. Warner coauthored the chapter “Critical Thinking” in thebook Methods for Conducting Military Operational Analysis,published by MORS [8].
• Dr. Brilleslyper coauthored a paper on terrain masking titled“Integrating High Resolution Terrain Data into Global PDOP
Mathematica Militaris, Vol. 22, Issue 1 20

Calculations” in a prominent journal dedicated to the position-ing, navigation, and timing mission that is published by theInstitute of Navigation (ION) [10].
• Dr. Peterson coauthored a paper titled “Global PositioningSystem Performance Optimization using a Normalized Func-tion on Configuration Classes” in a prominent journal publishedby the The American Institute of Aeronautics and Astronau-tics (AIAA). The paper presents his performance function toreplace coverage and applies it to several configurations [5].
• Dr. Peterson coauthored a paper titled “Group Orbits of GPSSatellite Configurations for Constellation Management” thatapplied algebraic combinatorial techniques to identify classesof configurations on which to optimize [6].
Descriptions of cadet projects
Beginning 2009-2010 the USAFA Department of MathematicalSciences (DFMS) instituted a year-long capstone course for seniormath majors. The following year it became a major requirement.Some projects are individual research and some are in teams [3].This course became an excellent vehicle for HQ AFSPC projects.
Below are descriptions of the projects. They were all directed byone of the authors, Dale Peterson, with the support of Mark Storzand Mark Staley of HQ AFSPC/A9. These projects have givencadets valuable operational and mathematical experiences.
Title: Optimizing a Spare GPS Satellite Using Mathemati-cal Programming.Year: 2009-2010.Cadet(s): Jacob Belka.Description: The GPS satellite nominal constellation con-sists of 24 satellites, four in each of the six equally spacedorbital planes. If we can add a spare satellite, which orbitalplane do we pick and where in that plane should we place itfor optimal performance? Our approach uses mathematicalprogramming and numerical methods, a technique that doesnot appear to have been previously applied to GPS. We arecomparing our new results with those found by the Air Force
Mathematica Militaris, Vol. 22, Issue 1 21

Space Command and contractors using other techniques.Presentation(s): Southwestern Undergraduate Mathemat-ics Research Conference (SUnMaRC), El Paso, TX, Mar.2010; Service Academy Student Mathematics Conference (SASMC),USAFA, Apr. 2010.
Title: Universal Time and Leap Seconds in Space Opera-tions.Year: 2011-2012.Cadet(s): Jackie Mozingo. Description: The time scale thatforms the basis for civil time is known as Coordinated Uni-versal Time (UTC). It slows down in an irregular fashionas the tidal forces change the mass distribution of the earthand slow its rotation rate. Some international stakeholders,e.g. bankers, would like to change to Atomic Time, becauseit does not vary. But UTC is more convenient for satel-lite control. Nevertheless, atomic time may be adopted by2018. Thus it is important to develop tools to evaluate theerror that can be expected in operational software that tracksspace objects from the ground or ground objects from space.We discuss these tools and how they provide the user a senseof the adverse operational impacts as the biased position de-viates more and more from the true position.Presentation(s): USAFA Department of Mathematical Sci-ences, Apr. 2012.
Title: Genetic Algorithm for GPS Satellite Positioning.Year: 2013-2014.Cadet(s): Zachary SaundersDescription: Develop a genetic nonlinear programming al-gorithm to optimize the performance of the GPS constellationby improving the positions of the GPS satellites within theconstellation.
Title: Chebyshev Missile Trajectory Tool.Year: 2014-2015.Cadet(s): Lacey Dreppard, Stuart Evers, and James Kegyes.Description: The team created a new algorithm for mis-sile trajectory simulation and estimation to serve as a key
Mathematica Militaris, Vol. 22, Issue 1 22

contributor to Air Force Space Command. Using Chebyshevpolynomials in accordance with the Gauss-Newton algorithm,our team applied an iterative approach to the convergence ofa missile trajectory. Applications of this project extend torealms such as scientific research regarding the acquisitionof ground-based sensors as well as serving as a tool for na-tional security in predicting harmful possibilities and miti-gating threats.Presentation(s): Service Academy Student MathematicsConference (SASMC), USAFA, Apr. 2015; Mathematical As-sociation of America (MAA) National MathFest Conference,Washington DC, Aug. 2015.
Title: Missile Trajectory Simulation and Estimation UsingChebyshev Polynomial.Year: 2015-2016.Cadet(s): Joshua Bradley, Conner Smith, and Robert Sell-ers.Description: This follow-on to the previous year’s projectimproved the trajectory model, including using higher orderChebyshev polynomials, developed an improved seed for thenonlinear program that corrected infeasible trajectories, andallowing the user to input a specific thrust profile. Presenta-tion(s): Service Academy Student Mathematics Conference(SASMC), USMA, Apr. 2016.
Title: Genetic algorithm for GPS satellite positioning.Year: 2015-2016.Cadet(s): Felix Knutson, Marika Nemeth, Ron Malloy, andAndrew Vanden Berg.Description: The Air Force Space Command is interested infinding an optimal GPS satellite constellation to provide thebest performance. To determine this optimal constellation,the team implemented a genetic algorithm that evaluates theprecision of a constellation by analyzing the location of pointsaround the globe over the satellite’s period and iteratively se-lects constellations that are most “fit” by employing mutationand crossover.Presentation(s): Service Academy Student Mathematics
Mathematica Militaris, Vol. 22, Issue 1 23

Conference (SASMC), USMA, Apr. 2016; Mathematical As-sociation of America (MAA) Regional Conference, ColoradoMesa University, Grand Junction, CO, Apr. 2016.
Title: Modeling missile trajectories and radar suites.Year: 2016-2017.Cadet(s): Lauren Bramblett, Cinthya Elizondo Gamez, andJuan Orozco.Description: This is follow-on to the past two years’ projects.Verify missile trajectory model, adjust missile profiles to ac-count for changing thrust, and incorporate radar observationerrors.Presentation(s): Anticipated: Service Academy StudentMathematics Conference (SASMC), USNA, Apr. 2017.
Additionally, in 2012-2013, Mark Storz and Dr. Peterson workedwith casual status 2nd Lieutenant Samuel Rinaldi to implement asimulation and optimization algorithm to optimally position GPSsatellites. Lt. Rinaldi identified an appropriate nonlinear program-ming method, incorporated it into a GPS computer simulation, andperformed extensive analysis on the outputs. Lt. Rinaldi presentedtheir work to the Air Force Operational Test & Evaluation CenterDetachment 4 (AFOTEC DET4 - space and missiles component),Peterson Air Force Base, Colorado Springs, CO. This work culmi-nated in a publication [5].
Conclusion
Beginning with Dr. Warner, USAFA/DFMS and HQ AFSPC/A9have established a strong connection that has paid off in both op-erational benefits to HQ AFSPC and academic benefits to USAFA.Some of the operational benefits include examining the effects ofGPS errors on JDAM, increased understanding of the impact ofspace assets on operations, and the use of graphical tools such aserror ellipsoids applied to satellite tracking (Dr. Warner); a com-prehensive terrain mask map of the Earth that benefits in particularthe assessment of GPS performance (Dr. Brilleslyper); solutions ofproblems in GPS satellite constellation design and the development
Mathematica Militaris, Vol. 22, Issue 1 24

of OPMAP, a comprehensive GPS performance prediction tool (Dr.Peterson); and upgrades to the OpGAP tool for predicting the satel-lite functional availability and sophisticated statistical techniquesapplied to the OPMAP tool (Dr. Boedigheimer).
Academic benefits have included six conference presentations, fivepublications, and several advanced study projects for our mathe-matics majors. These projects have given our cadets a significantexperience with an operational Air Force command. The types ofproblems on which they have worked have included GPS constel-lation design, leap second effects on space operations, and missiledefense / radar study.
We expect this trend to continue with more cadet projects, con-tinuing collaboration, and possibly more sabbaticals.
Acknowledgement
The authors acknowledge the support of Headquarters, Air ForceSpace Command, Analysis Division HQ AFSPC/A9, for its supportof sabbaticals. Author Dale Peterson is grateful in particular toMark Storz for his support of cadet projects and for reviewing thispaper.
Mathematica Militaris, Vol. 22, Issue 1 25


Bibliography
[1] Boedigheimer, R. A. and M. Staley, “Verification of the Oper-ational Generalized Availability Program (OpGAP) Version 2.0Beta,” Air Force Space Command Directorate of Plan, Programs,and Analyses Technical Report 10-01 (January 2010).
[2] Boedigheimer, R. A. and M. Staley, “Independent Evaluation ofthe Accuracy of the GPS Reliability Prediction Parameters Usedfor the Operational Generalized Availability Program,” Air ForceSpace Command Directorate of Plan, Programs, and AnalysesTechnical Report 11-1 (February 2011).
[3] Herzinger, K., T. Holcomb, D. Peterson, and B. Schaubroeck,“Developing a Mathematics Capstone Experience at The U.S.Air Force Academy,” PRIMUS, 23:4 (2013) 403-411.
[4] Moore, L., ed. Analyses Newsletter, Headquarters Air ForceSpace Command, Plans, Programs, and Analyses Directorate(HQ AFSPC A8/9), V. 3, Issue 1 (January 2010).
[5] Peterson, D. C., S. P. Rinaldi, and M. F. Storz, “Global Posi-tioning System Performance Optimization using a NormalizedFunction on Configuration Classes,” Journal of Guidance, Con-trol, and Dynamics, to appear.
[6] Peterson, D. and M. Storz, “Group Orbits of GPS Satellite Con-figurations for Constellation Management,” Journal of Mathe-matics and System Science, Vol 7 (2017) 1-13.
[7] Press, W. H., S. A. Teukolsky, W. T. Vetterling, and B. P.Flannery, Numerical Recipes: The Art of Scientific Computing,3rd ed., Cambridge University Press, Cambridge, Massachusetts,Section 2.7 (2007).
27
[8] Rainey, L., K. Kreitman, B. Warner, and S. Johnson, “CriticalThinking,” in Loerch, A. and Rainey, L. (Ed), Methods for Con-ducting Military Operational Analysis (583 - 618). Alexandria:Military Operations Research Society (MORS) (2007).
[9] Roberts, F. S. and B. Tesman, Applied Combinatorics, 2nd ed.,CRC Press, Boca Raton, Florida, Section 2.16.3 (2009).
[10] Staley, M. A., & M. A. Brilleslyper, “Integrating High Reso-lution Terrain Data into Global PDOP Calculations,” Instituteof Navigation, Global Navigation Satellite System (ION GNSS)2008 Meeting Proceedings (2008).
[11] Storz, M., “Development of GPS Performance Metric Capabil-ity for OpGAP: Statement of the Problem and ‘Sub-problems’,”white paper (unpublished), Headquarters Air Force Space Com-mand, Force Enhancement (HQ AFSPC/A9AE) (19 May 2008).
[12] Warner, B., J. Grobman„ and R. Boedigheimer., “The Applica-bility of Equivalence Testing to Simulation Validation,” Phalanx,Vol 39, No. 4, December 2006.
Mathematica Militaris, Vol. 22, Issue 1 28

An Application of Matrix Theory to BaseballRankings
David JoynerUnited Stats Naval AcademyDedicated to the memory of TS Michael.
Introduction
In the Application section, we give a variation on Massey’s rank-ing, applied to the U.S. Naval Academy 2016 men’s baseball team.That’s not quite the same as the typical application to football,where it’s used for bowl rankings by the NCAA (see, for example,[1]). In that section, we use the data from the entire Patriot league,including the Patriot league championship tournament.
In the Pre-tournament Ranking section, we apply the samemethod but only use the pre-tournament Patriot league data.
In the Final section, we follow a formula explained to me by T.S.Michael. In this “multi-graph version,” we record the win-loss record(a +1 for a win, −1 for a loss) in a 59 × 6 matrix M , one for eachgame. While more accurate in general, we find that the final rankingis the same as in Pre-tournament Ranking section of this paper.
Mathematica Militaris, Vol. 22, Issue 1 29

Throughout, we roughly follow the presentation of Massey’s methodby C. Wessell (see [3]). Further examples of matrix-theoretic rank-ing methods applied to baseball can be found on the author’s matrixtheory course page at the USNA.
Keywords: Baseball, Matrix Theory
Mathematica Militaris, Vol. 22, Issue 1 30

Application: (a variation on) Massey’s ranking
In this section we give an application of orthogonal projection tothe ranking of team sports. Massey’s method, currently in use bythe NCAA, was developed by Kenneth P. Massey while an under-graduate math major in the late 1990s. We present a variation ofMassey’s method adapted to baseball, where teams typically playeach other multiple times.
In our application, we shall consider Patriot League men’s base-ball:
1. Army (U.S. Military Academy),
2. Bucknell,
3. Holy Cross,
4. Lafayette,
5. Lehigh,
6. Navy (U.S. Naval Academy).
The cumulative results of the 2016 regular season1 are collectedin Figure 11. The total score (since the teams play multiple gamesagainst each other) of the team in the vertical column on the leftis listed first and the team in the horizontal row second. In otherwords, “a - b” in row i and column j means a runs were scored byteam i against team j in all their games, and b runs were scored byteam j against team i over all the games. For instance if X playedY and the scores were 10− 0, 0− 1, 0− 1, 0− 1, 0− 1, 0− 1, thenthe table would read 10− 5 in the position of X and Y.
First, we order the 6 teams as above. There are exactly 15 pair-ing between these teams. These pairs are sorted lexicographically,as follows:
(1,2),(1,3),(1,4), . . . , (5,6).1We count only the games played in the Patriot league, including the Patriot league tour-
nament.
Mathematica Militaris, Vol. 22, Issue 1 31

x\y Army Bucknell Holy Cross Lafayette Lehigh NavyArmy × 14-16 14-13 14-24 10-12 8-19
Bucknell 16-14 × 27-30 18-16 23-20 28-42Holy Cross 13-14 30-27 × 19-15 27-13 43-53Lafayette 24-14 16-18 15-19 × 12-23 17-39Lehigh 12-10 20-23 43-53 23-12 × 12-18Navy 19-8 42-28 30-12 39-17 18-12 ×
Figure 11: Sorted/ordered as Army vs Bucknell, Army vs Holy Cross, Army vsLafayette, . . . , Lehigh vs Navy.
That is to say, we sort them as
Army vs Bucknell, Army vs Holy Cross, Army vs Lafayette,. . . , Lehigh vs Navy.
In this ordering, we record their (sum total) win-loss record (a 1for a win, -1 for a loss) in a 15× 6 matrix:
M =
−1 1 0 0 0 01 0 −1 0 0 0−1 0 0 1 0 0−1 0 0 0 1 0−1 0 0 0 0 10 −1 1 0 0 00 1 0 −1 0 00 1 0 0 −1 00 −1 0 0 0 10 0 1 −1 0 00 0 1 0 −1 00 0 −1 0 0 10 0 0 −1 1 00 0 0 −1 0 10 0 0 0 −1 1
.
We also record their total losses in the entries of a column vector:
Mathematica Militaris, Vol. 22, Issue 1 32

b =
2110211323144141011226
.
The Massey ranking of these teams is a vector r which best fitsthe equation
Mr = b.
While this is over-determined, we can look for a best approximatesolution using the orthogonal projection formula
PV = B(BtB)−1Bt. (1)
Unfortunately, in this case B = M does not have linearly inde-pendent columns, so (1) does not apply.
Massey’s clever idea is to solve
M tMr = M tb (2)
by row-reduction and determine the rankings from the parameter-ized form of the solution.
To this end, we compute
Mathematica Militaris, Vol. 22, Issue 1 33

M tM =
5 −1 −1 −1 −1 −1−1 5 −1 −1 −1 −1−1 −1 5 −1 −1 −1−1 −1 −1 5 −1 −1−1 −1 −1 −1 5 −1−1 −1 −1 −1 −1 5
and
M tb =
−24−1010−29−1063
.
Then we compute the rref of
A = (M tM |M tb) =
5 −1 −1 −1 −1 −1 −24−1 5 −1 −1 −1 −1 −10−1 −1 5 −1 −1 −1 10−1 −1 −1 5 −1 −1 −29−1 −1 −1 −1 5 −1 −10−1 −1 −1 −1 −1 5 63
,
which is
rref(M tM |M tb) =
1 0 0 0 0 −1 −87
60 1 0 0 0 −1 −73
60 0 1 0 0 −1 −53
60 0 0 1 0 −1 −92
30 0 0 0 1 −1 −73
60 0 0 0 0 0 0
.
If r = (r1, r2, r3, r4, r5, r6) denotes the ratings of Army, Bucknell,Holy Cross, Lafayette, Lehigh, Navy, in that order, then
r1 = r6−87
6, r2 = r6−
73
6, r3 = r6−
53
6, r4 = r6−
92
6, r5 = r6−
73
6.
Mathematica Militaris, Vol. 22, Issue 1 34

Massey adds the condition
r1 + r2 + r3 + r4 + r5 + r6 = 0, (3)
so
r1 = −4, r2 = −5/3, r3 = 5/3, r4 = −29/6, r5 = −5/3, r6 = 21/2.
Therefore
Lafayette < Army = Bucknell = Lehigh < Holy Cross < Navy.
Pre-tournament (Massey-like) ranking
We shall use the above method to determine the ranking beforethe Patriot league tournament. The ranking used by the Patriotleague is simply the win-loss record:
Army (6-13) < Lafayette (7-13) < Bucknell (9-11)< Lehigh (9-10) < Holy Cross (13-7) < Navy (15-5).
The pre-tournament matrix is displayed in Figure 12.
x\y Army Bucknell Holy Cross Lafayette Lehigh NavyArmy × 14-16 14-13 14-24 10-12 8-19
Bucknell 16-14 × 27-30 18-16 23-20 10-22Holy Cross 13-14 30-27 × 19-15 17-13 9-16Lafayette 24-14 16-18 15-19 × 12-23 17-39Lehigh 12-10 20-23 13-17 23-12 × 12-18Navy 19-8 22-10 16-9 39-17 18-12 ×
Figure 12: Regular season results, sorted/ordered as Army vs Bucknell, Armyvs Holy Cross, Army vs Lafayette, . . . , Lehigh vs Navy.
Note that the Patriot league tournament involved only threeteams, so Figure 12 only differs in relatively few entries compared
Mathematica Militaris, Vol. 22, Issue 1 35

to Figure 11. In this case, their total losses is:
b =
21102113231244711226
and
M tb =
−24−83
−29058
.
We then compute the rref of
A = (M tM |M tb) =
5 −1 −1 −1 −1 −1 −24−1 5 −1 −1 −1 −1 −8−1 −1 5 −1 −1 −1 3−1 −1 −1 5 −1 −1 −29−1 −1 −1 −1 5 −1 0−1 −1 −1 −1 −1 5 58
to get
Mathematica Militaris, Vol. 22, Issue 1 36

rref(A) =
1 0 0 0 0 −1 −82
60 1 0 0 0 −1 −66
60 0 1 0 0 −1 −55
60 0 0 1 0 −1 −87
60 0 0 0 1 −1 −58
60 0 0 0 0 0 0
.
If r = (r1, r2, r3, r4, r5, r6) denotes the rankings of Army, Buck-nell, Holy Cross, Lafayette, Lehigh, Navy, in that order, then
r1 = r6−82
6, r2 = r6−
66
6, r3 = r6−
55
6, r4 = r6−
87
6, r5 = r6−
58
6.
Using this and (3), one can obtain the Massey ratings of these(this is left as an exercise). Therefore,
Lafayette < Army < Bucknell < Lehigh < Holy Cross < Navy.
“Multi-graph” pre-tournament Massey ranking
This section includes strategies initiated by T.S. Michael.
In this multi-graph version, we record the win-loss record (a 1for a win, -1 for a loss) in a 59 × 6 matrix M , one for each game.The display of the matrix is omitted as it won’t fit on the page, butit’s similar to the incidence matrix used in the previous sections.However, we do display the product
M tM =
19 −4 −4 −4 −3 −4−4 20 −4 −4 −4 −4−4 −4 20 −4 −4 −4−4 −4 −4 20 −4 −4−3 −4 −4 −4 19 −4−4 −4 −4 −4 −4 20
.
We also must record the loss vector (which has length 59) b, butit too is omitted as it won’t fit on the page. It records the (positive)
Mathematica Militaris, Vol. 22, Issue 1 37

difference (number of runs of winner)-(number of runs of loser), onefor each game. However, we do display the augmented matrix
A = (M tM |M tb) =
19 −4 −4 −4 −3 −4 −24−4 20 −4 −4 −4 −4 −14−4 −4 20 −4 −4 −4 11−4 −4 −4 20 −4 −4 −29−3 −4 −4 −4 19 −4 −8−4 −4 −4 −4 −4 20 64
,
as well as its rref:
rref(A) =
1 0 0 0 0 −1 −122
330 1 0 0 0 −1 −13
40 0 1 0 0 −1 −53
240 0 0 1 0 −1 −31
80 0 0 0 1 −1 −98
330 0 0 0 0 0 0
.
If r = (r1, r2, r3, r4, r5, r6) denotes the rankings of Army, Buck-nell, Holy Cross, Lafayette, Lehigh, Navy, in that order, then
r1 = r6−976
264, r2 = r6−
858
264, r3 = r6−
583
264, r4 = r6−
1023
264, r5 = r6−
784
264.
Using this and (3), one can obtain the Massey rankings of these:
Lafayette < Army < Bucknell < Lehigh < Holy Cross < Navy.
Acknowledgements:
I think T.S. Michael for both encouraging comments and help onthis paper. I also thank the anonymous referees for numerous sug-gestions which improved the paper.
Mathematica Militaris, Vol. 22, Issue 1 38

Bibliography
[1] K. Massey, Statistical models applied to the rating of sportsteams, available at masseyratings.com.
[2] Sagemath Developers, Sagemath - a mathematical softwarepackage, version 7.5, http://www.sagemath.org/.
[3] C. Wessell, Massey’s method, available at public.gettysburg.edu/~cwessell/RankingPage/massey.pdf.
39

Humans are Underrated: Geoff Colvin on theImportance of Empathy
Caroline MellesUnited States Naval Academy
The questions Geoff Colvin discusses in his book, Humans are Un-derrated, are relevant to both how and what we teach. He asks, ascomputers gain the ability to act in ways that were thought of as ex-clusively human, what will be the most essential human skills in thefuture? Colvin predicts that interpersonal skills will become increas-ingly valuable, while the demand for cognitive skills will decrease.He stresses the importance of empathy, the ability to understandand share the feelings of others and respond appropriately.
Coincidentally, at about the time I began reading this book, Ireceived the annual guidelines on excellence in teaching from theNaval Academy. I was struck by the fact that eleven of the thir-teen guidelines were related in some way to empathy and interper-sonal skills. Faculty members were reminded to be “encouraging,approachable, caring, ...supportive and fair,” to adapt to differentstudent learning styles, to take into consideration other demandson students’ time, to be “self-aware of demeanor,” and to exhibitcollegiality when working with other faculty members.
Colvin explains why empathy is critical in medicine, service in-dustries, and teamwork. He gives examples to show the value al-ready accorded interpersonal skills by the U. S. Military. A chapteris devoted to empathy lessons from combat, describing innovativetraining methods developed by the military. Research on teams inbusiness, sports, and elsewhere shows that the quality of social in-teractions within a team and with others can determine its successor failure.
Rather than attempt to predict the future capabilities of com-puters, Colvin seeks to identify roles that we will always want tobe filled by humans. We want to follow human leaders. We wanthumans to identify problems and goals for us. We want to negoti-ate important agreements with humans. Most importantly, we want
Mathematica Militaris, Vol. 22, Issue 1 40

humans to make decisions about values and be accountable.
There are few specific recommendations for the classroom, butColvin’s research suggests that the best use of our time togetherwith our students in person is for tasks involving social interaction.Basic content can be learned online. Students need to learn to com-municate, listen, negotiate, and collaborate. We can use class timeto help students formulate good problems and solve them in teams.Colvin argues that education in science, technology, engineering,and mathematics needs to include training in social interaction, col-laboration, and leadership, and concludes:
“... the meaning of great performance has changed. It used to bethat you had to be good at being machinelike. Now, increasingly,you have to be good at being a person.”
Undoubtedly Colvin is exaggerating for effect the past value ofbeing machinelike. Yet his arguments for the importance of empa-thy highlight the vital role it plays, not only in the classroom, butin all aspects of modern life.
Mathematica Militaris, Vol. 22, Issue 1 41