a network analysis of capital markets daniel evans margaret moten network science center...
TRANSCRIPT

A Network Analysis of Capital Markets
Daniel EvansMargaret Moten
Network Science [email protected]
www.netscience.usma.edu

Why Capital Market Networks?
Link Between Economic Development and Stabilityo Developed capital markets are correlated with
improved economic performance -Levine and Zevros (1996)
o An efficient financial system will allow for a higher level of investment by maximizing the proportion of savings that actually finances investment.” -Pagano (1993)
Limitations of Economic Theory
• Questions assumptions such as:o Representative agento Stabilityo Uniqueness of equilibriao Individual rationalityo Information availabilityo Anonymous market
- Alan Kirman (2010)
• Macroeconomic theory needs to incorporate:o The network of interacting individualso The structure of their interactionso The consequences of network activity

Influences

Research Objectives• Develop Topologies of Capital Market
Networks• Quantitatively determine “difference”
between “Current” Network and “Goal” Network “If we wish to influence a
Capital Market’s Efficiency are there specific Organizations, People, Things, Roles, or Beliefs on which we could/should focus in order to bring the desired outcome?”
“If we wish to influence a Capital Market’s Efficiency are there specific Organizations, People, Things, Roles, or Beliefs on which we could/should focus in order to bring the desired outcome?”

Social Network Development

Frontier Capital Markets
• Tanzania• Ghana• Trinidad & Tobago

Social Network Development

Social Network Development
Financial Services Government
Professional Services
Resume • Broker/Dealer• Parliament• Consultant
Resume • Broker/Dealer• Parliament• Consultant
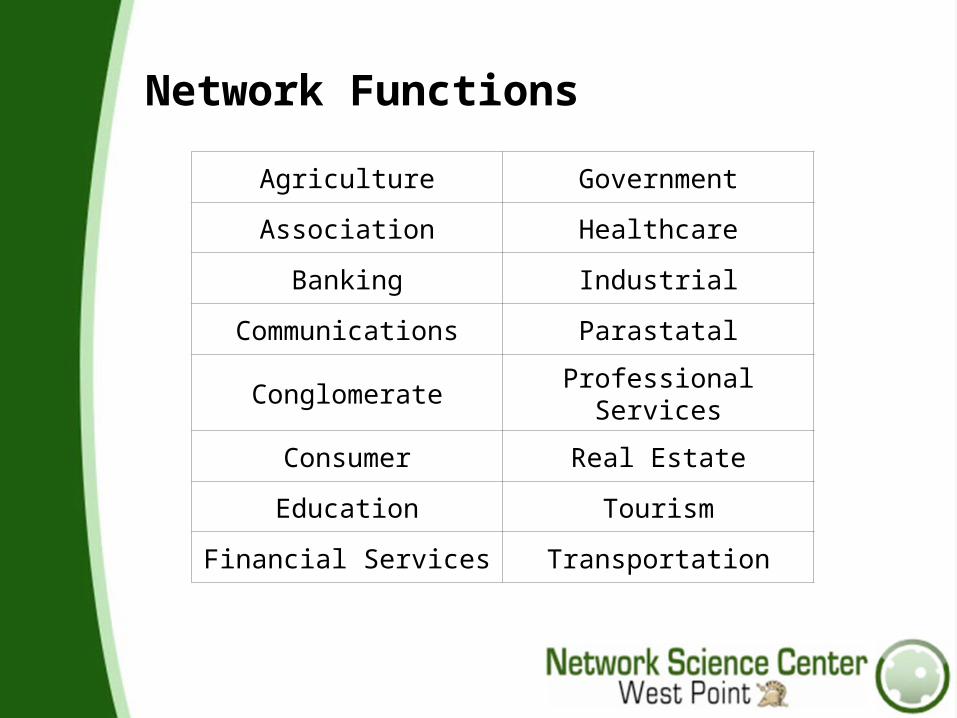
Network Functions
Agriculture Government
Association Healthcare
Banking Industrial
Communications Parastatal
Conglomerate Professional Services
Consumer Real Estate
Education Tourism
Financial Services Transportation

Ghana Functions Network

Weighted Networks Comparison
Weighted Functions Model
Measure - Average Ghana Trinidad & Tobago Tanzania
Link count 134 124 144
Density 0.5580 0.5900 0.6000
Characteristic path length 5.4670 7.3520 7.4750
Clustering coefficient 0.7120 0.8200 0.8420
Total Degree centralization 0.7940 0.8040 0.6750
Eigenvector centrality 0.3380 0.3410 0.4490
Betweenness centralization 0.2790 0.2170 0.2540
Closeness centralization 0.1610 0.1180 0.1030
Clique membership count 5.3750 4.4670 2.6880

Ghana Top Functions
Ghana Weighted Functions
Betweenness centrality Closeness centrality Eigenvector centrality Total degree centrality
Communications Communications Banking BankingEducation Education Financial Services Financial ServicesGovernment Government Professional Services Professional ServicesTourism Transportation Government GovernmentTransportation Professional Services Parastatal Parastatal
Ghana Unweighted Functions
Betweenness centrality Closeness centrality Eigenvector centrality Total degree centrality
Professional Services Professional Services Banking BankingTransportation Communications Financial Services Financial ServicesCommunications Transportation Professional Services Professional ServicesIndustrial Healthcare Government GovernmentHealthcare Association Parastatal Parastatal

Eigenvector Centrality Comparison
Weighted Eigenvector Centrality
Ghana Trinidad & Tobago Tanzania
Banking 1.000 Financial Services 1.000 Association 1.000
Financial Services 0.870 Banking 0.963 Financial Services 0.959
Professional Services 0.833 Professional Services 0.819 Industrial 0.876
Government 0.609 Government 0.337 Professional Services 0.818
Parastatal 0.544 Parastatal 0.311 Government 0.667
Unweighted Eigenvector Centrality
Ghana Trinidad & Tobago Tanzania
Banking 1.000 Financial Services 1.000 Financial Services 1.000
Financial Services 0.870 Banking 0.976 Association 0.885
Professional Services 0.772 Professional Services 0.781 Government 0.826
Government 0.663 Government 0.427 Professional Services 0.819
Parastatal 0.605 Industrial 0.386 Industrial 0.816

What’s Next?
• Determine appropriate metric(s) for comparison• Conduct “Vertical” Comparison
• Experimentation/Simulation• Social Capital Study• Capital Flow Model
Thanks to…
• Army Research Office
This research was funded in part by U.S. Army Project Number 611102B74F and MIPR Number
9FDATXR048 • Dan Evans is a participant in the Scientific
Services Program sponsored by the Battelle Memorial Institute

A Network Analysis of Capital Markets
Daniel EvansMargaret Moten
Network Science [email protected]
www.netscience.usma.edu