voluntary national review - … · ción para el desarrollo y juventud a.c., buffet of...
TRANSCRIPT

VOLUNTARY NATIONAL REVIEWFOR THE HIGH-LEVEL POLITICAL FORUM
ON SUSTAINABLE DEVELOPMENTBasIS FOR A LONG-TERM SUSTAINABLE
DEVELOPMENT VISION IN MEXICO
progress on the implementation of the 2030 Agenda
2018VOLU
NTAR
Y NA
TION
AL R
EVIE
W F
OR T
HE H
IGH-
LEVE
L POL
ITIC
AL F
ORUM
ON
SUST
AINA
BLE
DEVE
LOPM
ENT
2018
PORTADA INFORME NACIONAL VOLUNTARIO OK.indd 3 7/5/18 9:00 PM

VOLUNTARY NATIONAL REVIEW FOR THE HIGH-LEVEL POLITICAL FORUM ON SUSTAINABLE DEVELOPMENTBasis for a Long-Term Sustainable Development Vision in Mexico
Progress on the Implementation of the 2030 Agendaand the Sustainable Development Goals
Federal Government2018

Enrique Peña Nieto
President of Mexico
Luis Videgaray Caso
Secretary of Foreign Affairs
Francisco Guzmán Ortiz
Chief of Staff of the Presidency of Mexico
and Executive Secretary of the National Council for the 2030 Agenda
for Sustainable Development

The federal government acknowledges the valuable contributions of the United Nations Development Programme (UNDP) in Mexico and its sup-port for the preparation of this review, as well as the United Nations System and all other international, bilateral and multilateral organizations, agencies and funds that have contributed to the implementation of the 2030 Agen-da for Sustainable Development in Mexico, particularly the German contri-bution to sustainable development through the Deutsche Gesellschaft für Internationale Zusammenarbeit (GIZ, for its acronym in German).
Finally, we would like to thank the federal and local government agencies and private sector, academic and civil society institutions and organiza-tions that have contributed to the implementation of the 2030 Agenda in Mexico, including, among others, the following (all acronyms in Spanish):
Interior Secretariat (SEGOB), Foreign Affairs Secretariat (SRE), National De-fense Secretariat (SEDENA), Navy Secretariat (SEMAR), Finance and Public Credit Secretariat (SHCP), Social Development Secretariat (SEDESOL), Envi-ronmental and Natural Resources Secretariat (SEMARNAT), Energy Secre-tariat (SENER), Economy Secretariat (SE), Agriculture, Livestock, Fisheries and Food Secretariat (SAGARPA), Communication and Transportation Sec-retariat (SCT), Civil Service Secretariat (SFP), Health Secretariat (SSA), La-bor and Social Welfare Secretariat (STPS), Agrarian, Land and Urban Devel-opment Secretariat (SEDATU), Culture Secretariat (SC), Public Education Secretariat (SEP), Tourism Secretariat (SECTUR), Attorney General of the Republic (PGR) and Legal Counsel to the President (CJEF).
ACT! 2030, Mexican Academy of Sciences (AMC), Mexican Agency for In-ternational Development Cooperation (AMEXCID), Alliance for Sustainabil-ity (AxS), Almas Cautivas A.C., Mexican Banking Association (ABM), Mex-ican Scouting Association, Mexican Association of Insurance Institutions (AMIS), Mexican Association of Stockbrokers (AMIB), National Associa-tion of Self-Service and Department Stores (ANTAD), National Association of Universities and Higher Education Institutions (ANUIES), Balance Promo-
ACKNOWLEDGEMENTS
7
ción para el Desarrollo y Juventud A.C., Buffet of Interdisciplinary Stud-ies, National Chambers of Commerce, Services and Tourism (CANACO), National Chamber of Industry (CANACINTRA), Center for the Study of Development and Social Services (CEIDAS), Center for Research and Teaching in Economics (CIDE) – National Public Policy Lab (LNPP), Re-search Center for Policy Equity and Development, Center for Private Sector Economic Studies (CEEPS), National Disaster Prevention Center (CENAPRED), International Coalition for Development Action – Mexico (CAIDMEX), National Farmer-City Coalition (CNCU), Commission of Private Sector Studies on Sustainable Development (CESPEDES), Feder-al Electric Commission (CFE), National Aquaculture and Fishing Com-mission (CONAPESCA), National Water Commission (CONAGUA), Mexican Commission for the Knowledge and Use of Biodiversity (CON-ABIO), National Commission for the Development of Indigenous Peo-ples (CDI), Energy Regulatory Commission (CRE), Mexican Confedera-tion of Chambers of Industry (CONCAMIN), Confederation of Nacional Chambers of Commerce, Services and Tourism (CONCANACO-SERVI-TUR), Mexican Employers’ Confederation (COPARMEX), National Gov-ernors’ Conference (CONAGO), Business Coordinating Council (CCE), Mexican Business Council on Foreign Trade, Investment and Technology (COMCE), Mexican Business Council (CMN), National Agricultural Council (CNA), National Council of Science and Technology (CONA-CYT), National Council for the Evaluation of Social Development Policy (CONEVAL), National Population Council (CONAPO), National Council for the Incorporation of People with Disabilities (CONADIS), National Council for the Prevention of Discrimination (CONAPRED), Desarrollo, Educación y Cultura Autogestionarios - Equipo Pueblo A.C., (DECA-Equi-po Pueblo), El Clóset de Sor Juana, El Colegio de México A.C. (COLMEX), Equidad de Género: Ciudadanía, Trabajo y Familia A.C., Espacio Autóno-mo A.C., Civil Society Coordinating Space for Following Up on the 2030 Agenda, Social Security and Services Institute for State Workers Hous-ing Fund (FOVISSSTE), Science and Technology Consultative Forum (FC-CyT), Freshwater Action Network Mexico (FANMex), Fundación Ar-coíris, Fundación Cántaro Azul, Marist International Solidarity Foundation, Mexican Foundation for Family Planning (MEXFAM), Fun-dación Tlátoc, Senate Working Group for Monitoring the Legislative Im-plementation of the Sustainable Development Goals, Habitat for Hu-manity Mexico, Social Security and Services Institute for State Workers (ISSSTE), National Workers Housing Fund Institute (INFONAVIT), Feder-al Telecommunications Institute (IFT), Mexican Youth Institute (IM-JUVE), Mexican Social Security Institute (IMSS), National Social Devel-opment Institute (INSEDOL), National Institute of Statistics and Geography (INEGI), National Educational Infrastructure Institute
8

(INIFED), National Women’s Institute (INMUJERES), National Senior Citi-zens’ Institute (INAPAM), National Migration Institute (INM), National In-stitute for Federalism and Municipal Development (INAFED), National Insti-tute for the Evaluation of Education (INEE), Investigación, Organización y Acción Comunitaria Atlepetl, Las Reinas Chulas Cabaret and Human Rights, Movement of Latin American and Caribbean Youth Against Climate Change, Network of Iberoamerican Women for Budget Equality Between Women and Men (MIRA), My World Mexico, Nacional Financiera (NAFIN), Baja Cal-ifornia Sur Social and Gender Violence Observatory, Oxfam Mexico, Pensa-doras Urbanas, Petróleos Mexicanos (PEMEX), Attorney General for Tax-payer Defense (PRODECON), Development, Education and Research (PODER), Global Youth Action Network Mexico (GYAN-Mexico), Latin American Network of Students in Atmospheric Sciences and Meteorology (RedLAtm), Save the Children Mexico, Tax Administration Service (SAT), National System for the Comprehensive Protection of Children and Adoles-cents (SIPINNA), Hunger Project Mexico, The Nature Conservancy, Ibe-ro-American University (UIA), National Autonomous University of Mexico (UNAM), and World Vision Mexico.

“Achieving development where no one is left behind is a cause that brings us together and commits us all.
It is one reason that moves us to unity and solidarity, but above all to work together.”
Enrique Peña Nieto
President of Mexico
Creation of the National Council for the 2030 Agenda for Sustainable Development (April 26, 2017).


TABLE OF CONTENTS
Summary 19
I. Introduction 23
II. Design of the Voluntary National Review 25
III. Measures and commitments for the implementation of the 2030 Agenda 27
3.1 Institutional mechanisms 27
Specialized Technical Committee on the Sustainable Development Goals 27
Senate Working Group for Monitoring the Legislative Implementation of the SDGs 28
National Council for the 2030 Agenda for Sustainable Development 28
Creation of Subnational 2030 Agenda Implementation and Follow-Up Agencies 31
3.2 Incorporation of the SDGs into national and subnational development goals and budgets 32
Reform of the Planning Law 32
Aligning the Federal Budget with the SDGs 32
Analyzing Global Indicators 34
Subnational Strategic Planning for the 2030 Agenda 35
National Strategy for the Implementation of the 2030 Agenda 36

3.3 Ownership of the new development paradigm 37
Civil Society 37
Private Sector 41
Academic and Scientific Community 41
International Cooperation Agencies and Funds 42
Political Parties 42
3.4 To leave no one behind 43
IV. Review of goals (HLPF thematic review) 45
4.1 Transformation towards sustainable and resilient societies: SDGs 6, 7, 11, 12, 15 45
SDG 6: Ensure availability and sustainable management of water and sanitation for all 45
SDG 7: Ensure access to affordable, reliable, sustainable and modern energy for all 50
SDG 11: Make cities and human settlements inclusive, safe, resilient and sustainable 52
SDG 12: Ensure sustainable consumption and production patterns 55
SDG 15: Protect, restore and promote sustainable use of terrestrial ecosystems, sustainably manage forests, combat desertification, and halt and reverse land degradation and halt biodiversity loss 57
4.2 Empowering people and ensuring inclusiveness and equality: SDGs 4, 8, 10, 13, 16 59
SDG 4: Ensure inclusive and equitable quality education and promote lifelong learning opportunities for all 59
SDG 8: Promote sustained, inclusive and sustainable economic growth, full and productive employment and decent work for all 62
SDG 10: Reduce inequality within and among countries 64
SDG 13: Take urgent action to combat climate change and its impacts 67
SDG 16: Promote peaceful and inclusive societies for sustainable development, provide access to justice for all and build effective, accountable and inclusive institutions at all levels 69

4.3 Eradicating poverty and promoting prosperity in a changing world: SDGs 1, 2, 3, 5, 9, 14 72
SDG 1: End poverty in all its forms everywhere 72
SDG 2: End hunger, achieve food security and improved nutrition and promote sustainable agriculture 74
SDG 3: Ensure healthy lives and promote well-being for all at all ages 75
SDG 5: Achieve gender equality and empower all women and girls 77
SDG 9: Build resilient infrastructure, promote inclusive and sustainable industrialization and foster innovation 79
SDG 14: Conserve and sustainably use the oceans, seas and marine resources for sustainable development 81
4.4 Means and partnerships for implementing the 2030 Agenda 83
SDG 17: Strengthen the means of implementation and revitalize the global partnership for sustainable development 83
Means of Implementing the SDGs 85
International Cooperation for Implementing the SDGs 85
Partnerships 86
V. Conclusions 89
5.1 State Commitment and Continuity 89
5.2 Next Steps 90
Glossary of abbreviations 93
Appendix 99
Appendix 1 101
Appendix 2 115


Around the world, through their artistic creations and performances, artists are working to generate awareness of the 2030 Agenda for Sustainable Development. PienZa Sostenible is a project that analyzes and reflects on Mexico’s current state of development in relation to the 17 SDGs, promotes linkages to this topic, as well as implementation of the SDGs in the county. This project brings together individuals and organizations from the public and private sector.
The project includes studying data relevant to each of the SDGs, organizing expert panels, publishing research, and exhibiting work created by artists in response to specific elements of the 2030 Agenda.
The work of art by Mexican artist Stefan Brügemann is dedicated to the 17 SGDs, their 169 goals and 232 indicators. The piece is printed on vinyl over a mirror and forces the viewers to observe themselves amidst a large amount of graffiti-covered data. Are we part of the problem or of the solution?
Mexican sculptor and architect Carlos García Noriega Bueno also created a piece for PienZa Sostenible, titled “Poverty”. His work of art is made up of seven sculptures; each of them describes one of the deprivations that together define the concept of multidimensional poverty.
www.pienzasostenible.com

18

SUMMARY
Mexico has undertaken many initiatives to implement the Sustainable De-velopment Goals (SDGs) with a long-term vision, including but not limited to the following:
• In 2015, the National Institute of Statistics and Geography (INEGI) created the Specialized Technical Committee on the Sustainable Development Goals (CTEODS), which is responsible for coordinating research on indicators that track progress on the implementation of the 2030 Agenda at the national level.
• INEGI has mapped the global indicators for the 2030 Agenda, identi-fying that Mexico can domestically track 169 of the 232 indicators.
• In 2016, the Senate created a working group to monitor the imple-mentation of the SDGs at the legislative level.
• In 2017, the National Council for the 2030 Agenda for Sustainable Development was created as the coordinating mechanism for the implementation of the SDGs at the highest level of the federal gov-ernment; it is overseen by the president and includes participation of many sectors.
• At the subnational level, the National Governors’ Conference (CONA-GO) created the 2030 Agenda Executive Implementation Commis-sion, led by the governor of Colima.
• As of June 2018, 31 of Mexico’s 32 states have implementation and follow-up mechanisms (OSIs) for the 2030 Agenda. Some municipal governments have similar mechanisms as well.
19

• With the goal of increasing the amount of information available on the importance of public investments on development issues and the opportunities they represent, an analysis was conducted on the contribution of Budgetary Programs (BPs) to the SDGs, identifying that 80.7% of BPs address issues connected to the SDGs.
• In 2018, congress approved the president’s proposed reform of the Planning Law, which incorporated the three dimensions of sustain-able development, as well as the principles of equity, inclusion and non-discrimination, into national planning. To ensure a long-term vision, this reform also established that the National Development Plan (NDP) must incorporate projections and considerations for 20 years out.
• During the 2017-2018 electoral process, Mexico’s main political parties and coalitions came out in favor of the 2030 Agenda in their position papers and electoral platforms.
• At the multilateral level, Mexico signed on to Resolution 77/242, “Impact of Rapid Technological Change on the Achievement of the Sustainable Development Goals,” which establishes that the United Nations, in collaboration with academia, civil society and the private sector, must analyze the impact of rapid technological change, arti-ficial intelligence and automatization on the implementation of the 2030 Agenda.
• The National Strategy for the Implementation of the 2030 Agenda is currently in the public review phase. By proposing priorities, goals, indicators and challenges, the National Strategy could become an essential tool for the preparation of the 2018-2024 National Development Plan.
In Mexico, important progress has been made on the adoption of the 2030 Agenda. The Foreign Affairs Secretariat, for example, has organized four thematic discussions. Furthermore, during the development of the Nation-al Strategy, five regional dialogues were held with civil society organiza-tions (CSOs) –in Mexico City, Colima, Mazatlán, Monterrey and Tuxtla Gutiérrez– in order to introduce the 2030 Agenda and adopt its perspec-tives, priorities and concerns.
The government is in constant dialogue with the private sector, conducted through the Business Coordinating Council (CCE) and its associates. Other communication channels have also been established, such as the Alliance for Sustainability (AxS), created by the Mexican Agency for International Development Cooperation (AMEXCID). The AxS has established five work-ing committees in strategic areas.
20

The academic and scientific community has begun to reflect on proposals for sustainability policies and has contributed to the development of infor-mation useful to the implementation of the 2030 Agenda. With the sup-port of the National Autonomous University of Mexico (UNAM), a Sustain-able Development Solutions Network (SDSN) is being created to orient and support the implementation of the SDGs. A team of researchers at the Ibero-American University is also exploring some of the policy implications of the five pillars of the 2030 Agenda, while the National Public Policy Lab (LNPP) at the Center for Research and Teaching in Economics (CIDE) is working on local development indicators. Finally, important contacts have been made with the National Association of Universities and Higher Educa-tion Institutions (ANUIES), the Science and Technology Consultative Forum (FCCyT), the Mexican Academy of Sciences (AMC) and universities from across the country to make progress on tasks related to the implementa-tion of the SDGs.
Despite this progress, there are still many major challenges associated with ensuring the effective participation of different actors, such as that of guaranteeing interinstitutional coordination, both vertically and horizon-tally; institutionalizing effective participation and co-creation mechanisms for the development of policy through innovative spaces for multi-stake-holder dialogue and action; consolidating the adoption of the Agenda by different sectors of society; expanding strategies for the communication and dissemination the Agenda; training actors at the federal, state and mu-nicipal levels of government; guaranteeing mechanisms for following-up on and reviewing actions and policies beyond the limits of any given adminis-tration; having a long-term plan with intermediate goals, budgetary re-sources available for implementation and robust systems for measuring and evaluating their success; as well as using new technologies and big da-ta1 in combination with other sources of information that have the proper level of disaggregation to guarantee that all sectors of society are repre-sented.
1 Big data refers to data of such great volume, variety and velocity that specialized programs are needed to process it. It can be of tremendous use in studying trends and associations.
21


I. INTRODUCTION
Three years have gone by since the 2015 United Nations Sustainable. Since then, Mexico has undertaken major transforma-tions to move towards a development mod-el that harmonizes social inclusion, environ-mental protection and economic growth. Achieving the SDGs requires innovation and forces us to think and act differently. For Mexico, to leave no one behind has meant understanding the SDGs in a comprehen-sive and holistic fashion, exploring methods to integrate human rights and gender ap-proaches and utilizing participatory imple-mentation mechanisms. These elements define Mexico’s vision for the implementa-tion of the 2030 Agenda, representing the enduring path by means of which the coun-try will advance towards 2030 and onward into the future.
Mexico’s first Voluntary National Review (VNR), from 2016, presented the prepara-tory measures aimed at creating an ade-quate environment for the implementation of the 2030 Agenda. It also mentioned the steps to be taken to ensure adoption and compliance in Mexico.
This second VNR seeks to reflect the ad-vances, challenges and lessons learned from the first three years of the 2030 Agenda. The participation of all social actors and levels of government is necessary to con-front current challenges and assume the Agenda as a state commitment. For this reason, this review is not limited to the ac-tions of the government. It also presents the contributions of a variety of actors that are key to sustainable development.
This review includes an overview of the op-portunities and challenges of implement-ing the 2030 Agenda in Mexico. In particu-lar, the “Review of Goals” section contains advances, emblematic actions and chal-lenges. The valuable contributions of CSOs and the United Nations System are summa-rized in boxes labeled “Complementary Po-sitions for SDG X Expressed in the Review Process.” The data and sources included therein are the responsibility of the par-ticipants.
23


II. DESIGN OF THE VOLUNTARY NATIONAL REVIEW
The monitoring and review of the imple-mentation of the 2030 Agenda has meant recognizing challenges and sharing best practices and lessons learned. As one of the 47 countries that will present its VNR at the 2018 High-Level Political Forum on Sustain-able Development (HLPF), Mexico seeks to contribute to a global dialogue that allows us to accelerate the implementation of the 2030 Agenda.
The objective of this review is to describe the path that Mexico has taken in imple-menting the 2030 Agenda at the national
and subnational levels; it details the domes-tic progress made on each of the 17 SDGs and contributes to the domestic dissemina-tion and adoption of the 2030 Agenda.
While the Office of the President of the Re-public (OPR) coordinated the preparation of this document, it includes valuable contri-butions from other sectors, which were the product of an enriching dialogue among federal agencies, CSOs, representatives of the private sector, scientists, academics, the United Nations System and members of vulnerable populations.
25

III. MEASURES AND COMMITMENTS FOR THE IMPLEMENTATION OF THE 2030 AGENDA
3.1 INSTITUTIONAL MECHANISMS
Ensuring the continuity of efforts over the long term is essential to the implementation of the 2030 Agenda. Nevertheless, factors such as changes of government, legal and budgetary restrictions and temporary con-tingencies can jeopardize continuity.
To address this challenge, Mexico has made it a priority to guarantee the continuity of the 2030 Agenda over time, creating new planning, implementation and follow-up mechanisms and transforming national and subnational institutions.
Some of these measures have included the transformation of the Specialized Technical Committee for the Millennium Develop-ment Goals (CTESIODM) into the Special-ized Technical Committee on the Sustain-able Development Goals (CTEODS) in late 2015, the creation of the Senate Working Group for Monitoring the Legislative Imple-mentation of the Sustainable Development Goals, the creation of the National Council
for the 2030 Agenda for Sustainable Devel-opment in April 2017, and the creation of implementation and follow-up agencies (OSIs) for the SDGs at the state and munic-ipal levels.
Specialized Technical Committee on the Sustainable Development Goals
In November 2015, the INEGI Governing Board modified an agreement establishing the CTEODS as the body responsible for generating and following up on the data and indicators needed to monitor the imple-mentation of the SDGs. The CTEODS is chaired by the Office of the President and brings together 29 federal entities.
This committee has worked to monitor global indicators for Mexico in accordance with its statistical capacity. This process re-quired the characterization of indicators and the organization of 15 interinstitutional working groups for the technical analysis of each. To facilitate online access to these in-
27

actions implementing the SDGs.2 This Council is the highest decision-making body, as it connects the executive, legisla-tive and judicial branches of the federal government with local governments, the private sector, civil society and academia. Chaired by the president, it has an execu-tive secretary in the OPR. It includes multi-sectoral working groups specializing in the 17 SDGs as grouped into four thematic ax-es (Free, Healthy and Safe People; Prepared, Productive and Innovative People; People Committed to Cities, Nature and the Envi-ronment; and People United to Leave No One Behind); a National Strategy Commit-tee that analyzes and discusses actions, proposals and recommendations made by the working groups; and a Follow-Up and Evaluation Committee. (Figure 1).
As these committees are organized in accor-dance with the participatory and multi-stake-holder emphasis of the 2030 Agenda, they include representatives of the agencies and institutions that make up the federal gov-ernment, CSOs, the academic and scientific communities, the private sector and cross- sectoral national systems.
2 In March 2018, the committee of international experts that follows up on the International Cov-enant on Economic, Social and Cultural Rights (ICESCR) recommended that “the state party take fully into account its obligations under the Covenant and ensure the full enjoyment of the rights enshrined therein in its implementation of the 2030 Agenda for Sustainable Develop-ment at the national level, with international assistance and cooperation when needed, by incorporating them into the work of the Nation-al Council for the 2030 Agenda for Sustainable Development.”
dicators, the CTEODS –in collaboration with the OPR’s National Digital Strategy Depart-ment– designed the open data platform www.agenda2030.mx (see Appendix 1).
The process of defining national goals and indicators is currently in the review and re-flection stage, which forms part of the preparation of the National Strategy for the Implementation of the 2030 Agenda.
Senate Working Group for Monitoring the Legislative Implementation of the SDGs
In September 2016, the Senate Working Group for Monitoring the Legislative Imple-mentation of the Sustainable Development Goals was created, which has connections to over 30 congressional committees. This group has organized awareness and train-ing forums on the Agenda that are aimed at legislators and has developed a diagnostic on the legislative capacity to address the 2030 Agenda in Mexico.
National Council for the 2030 Agenda for Sustainable Development
The decree creating the National Council for the 2030 Agenda for Sustainable Devel-opment was published in the Official Ga-zette of the Federation on April 26, 2017 and the Council held its first meeting that same day.
This mechanism aims to coordinate the de-sign, execution, follow-up and evaluation of
28

FIGURE 1. Structure of the committees that make up the National Council for the 2030 Agenda for Sustainable Development
The Follow-Up and Evaluation Committee, as the body responsible for monitoring the development and progress of policies relat-ed to each SDG, will be made up of research
professionals, representatives of higher ed-ucation institutions from every region of the country and members of CSOs, INEGI and the National Council for the Evaluation
National Council for the 2030 Agenda for Sustainable
Development
Working Group 1: Free, Healthy
and Safe People;
Working Group 2:
Prepared, Productive and Innovative
People;
Working Group 3:
People Committed to Cities, Nature and the
Environment;
Working Group 4: People United to Leave
No One Behind.
Follow-Up and Evaluation Committee
Interinsti-tutional Working Groups
NC Decree and Operating
Guidelines
NC Decree and Operational Guidelines
NC Decree and Operating Guidelines
April 26, 2017 Decree
CTEODS
November 6, 2015 INEGI
Agreement
NC Decree and Operational Guidelines
National Strategy
Committee
NC Decree and Operational Guidelines
NC Decree and Operational Guidelines
29

of Social Development Policy (CONEVAL). It is expected that the committee’s evalua-tions, studies and diagnostics will have a fo-cus on gender and cultural diversity, to en-sure that the principle of “leaving no one behind” be both intersectional and sustain-able over the long term.
The First Ordinary Session of the National Council for the 2030 Agenda for Sustain-able Development was held on May 31, 2018, bringing together representatives of the public, academic, private and civil sec-tors. The accomplishments of this meeting include the approval of its operating guide-lines, mechanisms for multi-stakeholder participation, the yearly program of activi-ties and the initial draft of the National Strategy. There were also discussions of the need to incorporate a focus on sustain-able development into planning and bud-
getary processes, particularly the 2019-2024 National Development Plan, as well as the 2019 federal budget.
The following steps were also approved:
1. Creating OSIs in all remaining states;2. Promoting the implementation of the
2030 Agenda at the municipal level;3. Establishing working groups for the
2030 Agenda;4. Submitting the initial draft of the
National Strategy for the Implemen-tation of the 2030 Agenda to public review via the platform www.gob.mx/participa.
As a result of the open dialogue held at this session, it was also agreed to “analyze mod-ifications to the decree creating the National Council for the 2030 Agenda for Sustainable
Creation of the Council for the Implementation of the 2030 Agenda of the state of Hidalgo.
30

Development to ensure the representation of civil society organizations, the private sector and academia with a voice and vote.” This proposal was made by the CSO present.
Creation of Subnational 2030 Agenda Implementation and Follow-Up Agencies
At the subnational level, the 2030 Agenda has been implemented through two key spaces for promoting local development: CONAGO and the National Institute for Federalism and Municipal Development (IN-AFED).
In June 2017, CONAGO created the 2030 Agenda Executive Implementation Com-mission, which serves as an organizing space through which governors can contrib-
ute to implementing the SDGs, share expe-riences, coordinate actions and develop state-level monitoring and follow-up mech-anisms. One of the commitments of this commission has been the creation of OSIs in each state, which involve municipal au-thorities, federal delegates, representatives of civil society, academics and entrepre-neurs. As of June 2018, 31 of the country’s 32 states3 have created OSIs and 29 of these have been formally launched. Local OSIs are in charge of coordinating the de-sign and execution of strategies, policies,
3 Aguascalientes, Baja California, Baja Califor-nia Sur, Campeche, Chiapas, Chihuahua, Coa-huila, Colima, Durango, Guanajuato, Guerrero, Hidalgo, Jalisco, Mexico City, Mexico State, Michoacán, Morelos, Nayarit, Nuevo León, Oax-aca, Puebla, Querétaro, Quintana Roo, San Luis Potosí, Sinaloa, Sonora, Tabasco, Tamaulipas, Tlaxcala, Veracruz and Zacatecas.
Presentation of the 2017-2023 Development Plan of the State of Mexico (March 15, 2018). The State of Mexico has embraced the 2030 Agenda as the central axis of its planning.

programs and actions for the implementa-tion of the 2030 Agenda at the state level, as well as bringing together different local actors. Due to the differences in size and need between each state, there are major variations in terms of the number of mem-bers of each local OSI, as well as which sec-tors and government agencies are repre-sented and made full voting members. Over 300 municipalities have also created mech-anisms for the implementation of the 2030 Agenda.
3.2 INCORPORATION OF THE SDGs INTO NATIONAL AND SUBNATIONAL DEVELOPMENT GOALS AND BUDGETS
Reform of the Planning Law
With the goal of guaranteeing the incorpo-ration of the 2030 Agenda into national democratic planning, a reform of the plan-ning law was published in the Official Ga-zette of the Federation on February 16, 2018.
The bill proposed by the president and ap-proved by congress includes the three di-mensions of sustainable development and the principles of equity, inclusion and non-discrimination as guides for orienting long-term national development projects.
The modification of the Planning Law also introduced the concept of sustainability in-to national planning, established precise cri-teria for guaranteeing the human right to a
healthy environment, and determined the participation of government agencies in the preparation of the National Development Plan (NDP). This reform also strengthened the long-term vision of the NDP, which must now contain:
1. Projections and considerations for 20 years out;
2. A general overview of the current status of priority issues;
3. Specific goals and strategies to reach them, taking their interrelations into account;
4. Performance indicators that allow for the evaluation of each objective and goal.
These modifications recognize the rele-vance and continuity of the 2030 Agenda across presidential administrations through the definition of new criteria for the formu-lation and instrumentalization of the NDP, the programs that derive from it and the ac-tions of the federal government.
Aligning the Federal Budget with the SDGs
To increase the amount of information on the opportunities and importance of public investments on development issues, the OPR and the Finance and Public Credit Sec-retariat (SHCP) have analyzed the federal budget to identify which items contribute to the implementation of each SDG. (Fig-ure 2 and 3)
This analysis revealed that, in the 2018 fed-eral budget, 80.7% of Budgetary Programs
32

FIGURE 2. Number of BPs connected to each SDG
Number of BPs connected to the SDGs
FIGURE 3. SDGs connected to Budgetary Programs
% of SDG targets connected to a given BP
NO POVERTY
01
NO POVERTY
01
ZERO HUNGER
02
ZERO HUNGER
02
GOOD HEALTH AND WELL-BEING
03
GOOD HEALTH AND WELL-BEING
03
QUALITY EDUCATION
04
QUALITY EDUCATION
04
GENDER EQUALITY
05
GENDER EQUALITY
05
CLEAN WATER AND SANITATION
06
CLEAN WATER AND
SANITATION 06
AFFORDABLE AND CLEAN ENERGY
07
AFFORDABLE AND CLEAN ENERGY
07
DECENT WORK AND ECONOMIC
GROWTH 08
DECENT WORK AND ECONOMIC
GROWTH 08
INDUSTRY, INNOVATION AND INFRASTRUCTURE
09
INDUSTRY, INNOVATION AND INFRASTRUCTURE
09
REDUCED INEQUALITIES
10
REDUCED INEQUALITIES
10
SUSTAINABLE CITIES AND
COMMUNITIES 11
SUSTAINABLE CITIES AND
COMMUNITIES 11
RESPONSIBLE CONSUMPTION
AND PRODUCTION 12
RESPONSIBLE CONSUMPTION
AND PRODUCTION 12
CLIMATE ACTION
13
CLIMATE ACTION
13
LIFE BELOW WATER
14
LIFE BELOW WATER
14
LIFE ON LAND
15
LIFE ON LAND
15
PEACE, JUSTICE AND STRONG INSTITUTIONS
16
PEACE, JUSTICE AND STRONG INSTITUTIONS
16
PARTNERSHIP FOR THE GOALS
17
PARTNERSHIP FOR THE GOALS
17
33
(BPs) are connected to the 2030 Agenda, while 156 of the 169 SDG indicators are connected to at least one BP.4
After this stage of relating the budget with the SDGs, the effectiveness or impact of public spending on compliance with the 2030 Agenda must be evaluated. This will allow us to reorient public spending to guar-antee the implementation of the SDGs.
4 http://www.transparenciapresupuestaria.gob.mx/work/models/PTP/Presupuesto/Docu-mentos_anteriores/mexico_ods.pdf
Analyzing Global Indicators
The 2030 Agenda’s targets and indicators are the central pillar of the process of mea-suring and monitoring the implementation of the SDGs. In June 2016, INEGI initiated a national mapping process for the 2030 Agenda’s 232 global indicators to determine which indicators are applicable in Mexico, what their level of availability and dissagre-gation is, and which government agencies served as the sources for this information. As a result of this analysis, it was determined that 169 global indicators are applicable in Mexico, while the other 63 indicators either do not apply domestically or require addi-tional regional or global calculations. Of the 169 indicators that apply domestically, 83 are measured periodically (although they present disaggregation challenges), 36 are
34

not measured periodically and 50 are either not measured or do not yet have an estab-lished methodology for their measurement. Analyzing alternatives for these indicators represents a significant challenge for the im-plementation of the 2030 Agenda in Mexi-co. It will also be important to make progress in the analysis, proposal and collection of other domestic indicators that can contrib-ute to monitoring high-impact policies.
Besides these measures, the 2030 Agenda has also provided a framework for structur-ing other development goals in different sectors and in cross-sectoral systems. One concrete example is the policy “25 by 25: National Objectives on the Rights of Chil-dren and Adolescents,” which uses the SDGs to establish national goals for this demo-graphic segment.
Subnational Strategic Planning for the 2030 Agenda
Apart from the creation of the OSIs, several states have already made significant prog-ress on the implementation of the 2030 Agenda. Twelve states have aligned their State Development Plans (SDPs) with the SDGs. One of them, the state of Hidalgo, besides aligning its strategic programs with the Agenda, has developed a regulatory framework that includes long-term plan-ning. Mexico City, in turn, has developed a publicly available digital platform for follow-ing-up on the General Development Plan for the Capital, which includes monitoring the SDGs and other associated goals. In 2017, the Inter-American Development Bank rec-ognized the Mexico City government’s ef-forts on this platform. Meanwhile, the gov-
ernment of the State of Mexico has requested the support of the United Na-tions System in designing a State Develop-ment Plan that incorporates the 2030 Agenda from its earliest stages.
To make this process easier for state gov-ernments, the OPR prepared a publication titled Guide for Incorporating a 2030 Agen-da Focus in the Preparation of State and Municipal Development Plans.5
Since June 2017, the INAFED has been im-plementing an Inter-institutional Program for strengthening the capacities of local governments with the objective of consoli-dating inclusive, resilient and sustainable municipalities. This program includes a Technical Assistance Model for the imple-mentation of the SDGs at the municipal lev-el, with 17 goals that correspond to the ju-risdiction of this level of government. Starting in June 2018, this model will in-clude a Municipal Identification Card for each municipality evaluated.
The INAFED has also raised awareness of the 2030 Agenda among government offi-cials, held organizational manual prepara-tion workshops, aligned Municipal Develop-ment Plans with the SDGs and analyzed police and good government proclamations.
5 https://www.gob.mx/agenda2030/documen-tos/guia-para-incorporar-el-enfoque-de-la-agen-da-2030-en-la-elaboracion-de-planes-estatales-y-municipales-de-desarrollo
35

National Strategy for the Implementation of the 2030 Agenda
In 2017, the president began development on a National Strategy for the Implementa-tion of the 2030 Agenda, the first draft of which is expected to be completed in 2018. Its primary objectives are: defining the prin-cipal lines of action that could orient the de-velopment strategies of present and future governments; identifying existing policies that have a potential impact on compliance with the SDGs; establishing concrete com-mitments for areas where Mexico still has pending issues; and ensuring continuity and visibility for existing federal policies.
The National Strategy is the result of col-laborative efforts between different actors with focuses that are relevant in terms of thematic priorities, challenges and pro-posed solutions. Its actions include: the analysis of each SDG by federal institutions; the organization of five regional forums with representatives of civil society, the Na-tional Institute of Social Development (IN-DESOL), the Foreign Affairs Secretariat (SRE) and the Mexican Agency for Interna-tional Development Cooperation (AMEX-CID); dialogues with the private sector in conjunction with the SRE and AMEXCID; an online public review process through the gob.mx/participa platform; a Senate forum on a comprehensive approach to the 2030 Agenda; the development of five analyses prepared by the Ibero-American University; and the work on national goals and indica-tors done by INEGI in collaboration with other actors.
The ultimate goal of the National Strategy is to ensure continuity across administra-
tions, independently of any political chang-es that may occur, as well as serving as a base for the National Development Plans for the 2018-2024 and 2024-2030 presi-dential administrations. The National Strat-egy is being developed with the participa-tion of approximately 50 federal agencies and will be brought for consultation before all sectors of society. Its contents, including challenges and barriers to implementation, will be revised periodically, as will the contri-butions of all sectors and specific actions that have made an impact.
As part of the development of the National Strategy, 12 units of the federal government were designated as Coordinating Units for each of the 17 SDGs, in accordance with their thematic and sectoral characteristics (the SEMARNAT coordinates 5 SDGs, for ex-ample). Each one of these units has been in charge of coordinating the collection and in-corporation of inputs into the National Strat-egy and communicating with the Shared Re-sponsibility Units (UGC) that directly or indirectly affect compliance with each SDG. The SRE is a key agency here, as it serves as a UGC for all 17 SDGs.
One outstanding example of this is the Agrarian, Land and Urban Development Secretariat (SEDATU) –responsible for SDG 11: “Make cities and human settlements in-clusive, safe, resilient and sustainable”– which has prepared a matrix for identifying and following up on those initiatives, proj-ects and actions with which the Mexican government has contributed to the imple-mentation of the New Urban Agenda ap-proved at the United Nations Conference on Housing and Sustainable Urban Develop-ment (Habitat III), held in October 2016.
36

3.3 OWNERSHIP OF THE NEW DEVELOPMENT PARADIGM
Civil Society
CSOs have mobilized to develop channels for dialogue and constructive, effective par-ticipatory processes alongside the govern-ment, so that the 2030 Agenda can be im-plemented with a bottom-up focus.
Some of the primary demands of CSOs are for the OSIs to organically incorporate civil society; for the National Strategy to include short, medium and long-term goals, as well as to better include an explicit focus on the promotion and defense of human rights; and to develop and reinforce the SDG ca-
pacities of CSOs and public servants at the national, state and municipal levels.
The CSOs that are following up on the im-plementation of the 2030 Agenda issue very specific proposals and recommenda-tions. The process of preparing the 2018 Voluntary National Review has allowed for many of these to be shared.
In terms of measurement, monitoring and evaluation systems, this sector has empha-sized the problems connected to national indicators and the disaggregation of data. To confront the challenges of redefining and updating indicators, the participation of CSOs in these processes is encouraged. Fur-thermore, there is a need to integrate pre-cise measurements into the Agenda’s offi-
SEDESOL SAGARPA SALUD
SEMARNATSEP INMUJERES
SENER SHCP SE / STPS SE
SEDESOL SHCP SEDATU SEMARNAT
SEMARNAT SEMARNAT SEMARNAT
SEGOB AMEXCID
FIGURE 4. State coordinating units for each SDG
37

cial monitoring, including a focus on human rights, as well as a consideration of inequal-ity gaps associated with each goal. CSOs have also insisted on the need for Mexico to participate in the definition of regional indi-cators.
In terms of inclusion, CSOs mentioned the importance of continuous participation and feedback in the process of designing, imple-menting and following up on the 2030 Agenda, as well as guaranteeing the partic-ipation of a larger number of CSOs and citi-zens and strengthening the capacities of organizations that work with vulnerable populations. They have identified sensitive areas in the formalization of opportune and participatory mechanisms for implement-ing and following up on global and regional agendas that would allow for the promotion of bottom-up policies. Regarding the Na-tional Strategy, an immediate need has been identified for its final design to include proper mechanisms that allow for the ef-fective participation of civil society.
In terms of CSOs’ participation in the Na-tional Council, they underscored the need to increase the proportion of representa-tion of civil society in the different working groups; to have committees that are fo-cused on the 2030 Agenda’s cross-sectoral issues; and to ensure that the participation criteria for these committees is based on the experience or impact of participating organizations.
Representatives of civil society have also recognized the mechanisms used by the Foreign Affairs Secretariat to jointly devel-op the country’s position at international follow-up forums as being good practices. Some organizations mentioned the need to
use public resources to ensure that partici-pation is nondiscriminatory.
As illustrations of the possible cooperation between civil society and the government, the work done for the preparation of the 2016-2030 National Strategy and Action Plan on Mexican Biodiversity (Enbiomex) under the oversight of the Mexican Com-mission for the Knowledge and Use of Biodi-versity (CONABIO) and the work on the National Strategy for the Prevention of Teen Pregnancy (ENAPEA) show the impor-tance of using effective participation mech-anisms to bring together different sectors of society.
One lesson learned through the recent talks between the government and civil society has been the need to establish a new rela-tionship between these actors that does not just focus on providing information, but instead truly encourages political dialogue and impact.6
CSOs have also insisted on the importance of promoting a critical, active and multi-ac-tor adoption of the 2030 Agenda. One im-portant challenge has been the execution of a nationwide awareness campaign di-rected at the entire population, with an em-
6 Mexico has created a legal framework that serves as a model for government-civil soci-ety relations. The Federal Law on Promoting the Activities of Civil Society Organizations (LFFAROSC) recognizes the contributions of civil society organizations to the public interest and the country’s development. Furthermore, this law brings together those federal agencies that act as liaisons with civil society to define the policies for promoting the activities of CSOs, preparing reports on these actions, providing federal grants to CSOs and operating the Feder-al CSO Registry.
38

phasis on public servants, CSOs and high school students.
The multi-stakeholder initiatives aimed at strengthening the adoption of the 2030 Agenda by the citizenry have included the 2016-17 training sessions carried out through the Social Co-Investment Project. These sessions were held in 10 states across the country during regional meet-ings organized by INDESOL that drew over 1,500 organizations. Another initiative was the 2016-17 Technologies for the Greater Good project, which involved training over 500 CSOs in eight states across Mexico on the 2030 Agenda and volunteerships for development, sharing technological tools offered by allies to build different capaci-ties. In April 2018, the app Voluntariado Generación 2030 was launched, which was designed and promoted under the frame-work of an alliance for sustainable develop-
ment between different sectors, bringing CSOs and the government together with volunteers who are interested in contribut-ing to reaching the SDGs. The SRE’s Depart-ment of Outreach to Civil Society Organiza-tions (DGVOSC) has also organized conferences and seminars on the role of civil society in defining and adopting the 2030 Agenda. These activities culminated in the publication of the book titled Citizen Diplomacy and Sustainable Development in Mexico.7
In terms of youth participation and the adoption of the 2030 Agenda, one import-ant policy has been the creation of the Hos-
7 Luz Elena Baños Rivas (ed.), Diplomacia Ciudad-ana y Desarrollo Sostenible en México, Mex-ico City, Secretaría de Relaciones Exteriores, 2017, available at: www.gob.mx/cms/uploads/attachment/file/294560/Diplomacia_ciudad-ana_y_desarrollo_sostenible_en_M_xico.pdf
39

pital of Emotions; this project provides mental health services to young people be-tween the ages of 12 and 29. The initiative was born out of the results of the organiza-tion My World 2030: The United Nations Survey for a Better World, as well as a study of other youth trends. My World Mexico has also mobilized individuals and organiza-tions for the implementation, monitoring, and dissemination of the 2030 Agenda in 27 states.
As part of the youth adoption of the 2030 Agenda at the subnational level, the Mexi-can Youth Institute (IMJUVE), in collabora-tion with several universities and state gov-ernments, created the Youth for SDGs project. Between 2017 and June 2018, this project has promoted awareness of the SDGs and volunteerships for development
involving over 1,000 young people in nine states across Mexico. The state govern-ment of Morelos is also implementing a project known as Generation 2030, which is training 30 young volunteer leaders on SDG issues, comprehensive approaches, volunteership and methods of influencing policy. Through these leaders, around 900 young people have been mobilized across the state, sharing their knowledge with their peers. Finally, the state government of Puebla, in collaboration with other sectors, organized the Re-Design Puebla Social Inno-vation Hackathon, a technology fair that promoted initiatives from young people aimed at implementing the 2030 Agenda at the subnational level.
To encourage the participation of young people in the future, IMJUVE has prepared a
40

proposal to incorporate the youth perspec-tive on the 2030 Agenda in a comprehen-sive manner. There is currently a nationwide communication plan to inform young peo-ple of the actions that the government and other interested actors are undertaking with regards to SDG implementation.
Private Sector
The Mexican government has established different channels of communication with the private sector, including the Alliance for Sustainability (AxS) launched by AMEXCID, as well as a permanent dialogue with the Business Coordinating Council (CCE) and its members. The over 50 members of the AxS –which include companies, foundations and business associations– have created five working groups on strategic areas of the 2030 Agenda: Affortable and Clean Energy; Sustainable Cities and Communities; Re-sponsible Production and Consumption; Edu-cation; and Social Inclusion. Each working group established an action plan for 2017 and 2018 that identified the shared needs of their business models and the SDGs with the goal of promoting international cooperation projects that confront these challenges. The AxS and the CCE have also contributed to the National Strategy with proposals for the implementation of the 2030 Agenda.
Academic and Scientific Community
The implementation of the 2030 Agenda requires a strong academic, technical and scientific component to ensure that deci-sion makers promote consistent, viable and evidence-based policies.
In Mexico, communication with the aca-demic and scientific community regarding the implementation of the 2030 Agenda has occurred through various channels. A group of researchers coordinated by the Ibero-American University, for example, has prepared policy proposals for each of the five pillars of the 2030 Agenda (people, planet, prosperity, peace and partnerships). These documents will be submitted for dis-cussion and consideration to the National Council’s working groups. These five docu-ments present an overview of the status of each pillar in Mexico and describe policies from around the world that have worked to confront obstacles in each area, as well as identifying 24 axes of solutions and 85 spe-cific policies that can be applied to confront these challenges.
In 2018, the Sustainable Development Solu-tions Network (SDSN) will be launched in Mexico, which will have three lines of action: 1) Strengthening dialogue and serving as a bridge between academia and the public sector; 2) Generating technological solu-tions that support sustainable development; and 3) Promoting education on sustainabili-ty issues and awareness of the 2030 Agen-da. To ensure the impact of this network, it will also participate in the National Council. As the network will have a national scope, the National Autonomous University of Mexico (UNAM) will be in charge of coordi-nating the work of the SDSN Mexico.
Parallel to this development, important progress has been made in terms of aca-demia’s contributions to the implementa-tion of the 2030 Agenda in Mexico. The National Public Policy Lab (LNPP) of the Center for Research and Teaching in Eco-
41

nomics (CIDE), with the support of Citi-Banamex and in collaboration with the Ma-rio Molina Center and the state government of Guanajuato, has completed a subnation-al mapping of SDG indicators that covers 59 metropolitan areas and Mexico’s 32 states. This will allow comparisons to be made and experiences to be shared in the process of confronting shared challenges (see Appendix 2).
Furthermore, INFONAVIT’s Center for Sus-tainable Development Research worked on the Housing and SDGs in Mexico Project. This initiative describes the role of housing as the unifying element of development and urban prosperity under the framework of the New Urban Agenda approved at the United Nations Conference on Housing and Sustainable Urban Development (Habitat III), held in Quito, Ecuador in 2016.
International Cooperation Agencies and Funds
Many bilateral and multilateral internation-al cooperation agencies have collaborated on the implementation of the SDGs in Mex-ico. In accordance with current international cooperation programs and laws, the 2030 Agenda has provided international coopera-tion agencies with a framework for struc-turing their financial, technical and analytic support and aligning it with the govern-ment’s development objectives and strate-gies. This support is not only directed to federal institutions and local governments, but also universities, the private sector and representatives of civil society.
International cooperation has focused on is-sues including but not limited to the adoption and institutionalization of the 2030 Agenda and its application to different policy cycles.
International cooperation agencies have al-so worked with the government to create tools to measure progress on the imple-mentation of the SDGs. The City Prosperity Initiative (CPI) used by INFONAVIT to mea-sure urban prosperity, for example, was de-veloped with international support. These agencies, in conjunction with a variety of CSOs, have also contributed to the defini-tion of national indicators for SDG 16 through a study of the Mexican context that identified problems related to this goal.
Regarding the institutionalization of the 2030 Agenda, several agencies have worked with the authorities to operationalize and strengthen national systems, spaces and mechanisms, such as the National Council for the 2030 Agenda. Different international cooperation agencies have also organized regional dialogues and training sessions to raise awareness of the 2030 Agenda among CSOs and young people.
Political Parties
In a democratic country like Mexico, which has a highly competitive electoral environ-ment, the continuity of the 2030 Agenda requires different political forces to commit to its principles and objectives.
Fortunately, in the current electoral cycle, Mexico’s main political parties and coali-tions have come out in favor of the 2030 Agenda in their position papers and elector-
42

al platforms. For example, in the document titled Notes for an Administrative Program, the coalition of the National Action Party, the Party of the Democratic Revolution and the Citizens’ Movement mentions the 2030 Agenda and the importance of reducing in-equality within and among countries.8
The Institutional Revolutionary Party (PRI), in turn, has incorporated the 2030 Agenda and the focus on sustainable development into the new version of its Statement of Principles,9 Action Program,10 Bylaws11 and Vision of the Future.12
The coalition of the Labor Party (PT), the National Renewal Movement (MORENA) and the Social Encounter Party (PES) has al-so referenced the 2030 Agenda in the doc-ument National Project 2018-2024.”13
3.4 TO LEAVE NO ONE BEHIND
“Leaving no one behind” represents a major challenge. While the population as a whole enjoys a better standard of living than in
8 http://repositoriodocumental.ine.mx/xmlui/bitstream/handle/123456789/94343/CG2ex 201712-22-rp-5.1-a3.pdf
9 http://pri.org.mx/SomosPRI/Documentos/DeclaraciondePrincipios2017.pdf
10 http://pri.org.mx/SomosPRI/Documentos/ProgramadeAccion2017.pdf
11 http://pri.org.mx/SomosPRI/Documentos/Estatutos2017.pdf
12 http://pri.org.mx/SomosPRI/Documentos/VisiondeFuturo2017.pdf
13 “Proyecto de Nación 2018-2024”, 2017, available at: https://drive.google.com/file/d/11B0aN BuVpHB7GDVXhCKdYvVKw7D7Ta-x/view
previous years, it is important to ensure that all groups can exercise their rights, in-cluding rural populations, indigenous peo-ples, Afro-Mexicans, senior citizens, chil-dren and adolescents, people with disabilities, the LGBTI community, migrants and refugees. For example, only 46.5% of young people with disabilities go to school (INEGI, 2014), there is a salary gap of 5.1% between women and men (ENOE, 2017), 58.2% of the rural population is below the poverty line and, of a total indigenous pop-ulation of 12 million, 71.9% are poor or ex-tremely poor (CONEVAL, 2016).
To address these challenges and protect the human rights of vulnerable populations, Mexico has promoted institutional mea-sures that range from constitutional re-forms to specific projects, such as the Mex-ican Norm NMX-R-025-SCFI-2015 on Labor Equality and Non-Discrimination. These actions reaffirm the country’s desire and political commitment to dismantle the structures that produce and reproduce dy-namics of exclusion, segregation, discrimi-nation and underrepresentation, as with other forms of social, economic and envi-ronmental injustice.
43

44

IV. REVIEW OF GOALS (HLPF THEMATIC REVIEW)
SDGs 6, 7, 11, 12, 15), the 2019 High-Level Political Forum (Empowering people and en-suring inclusiveness and equality: SDGs 4, 8, 10, 13, 16) and the 2017 High-Level Politi-cal Forum (Eradicating poverty and promot-ing prosperity in a changing world: SDGs 1, 2, 3, 5, 9, 14). The last section is dedicated to partnerships and means for implementing the Agenda (SDG 17).
4.1 TRANSFORMATION TOWARDS SUSTAINABLE AND RESILIENT SOCIETIES: SDGs 6, 7, 11, 12, 15
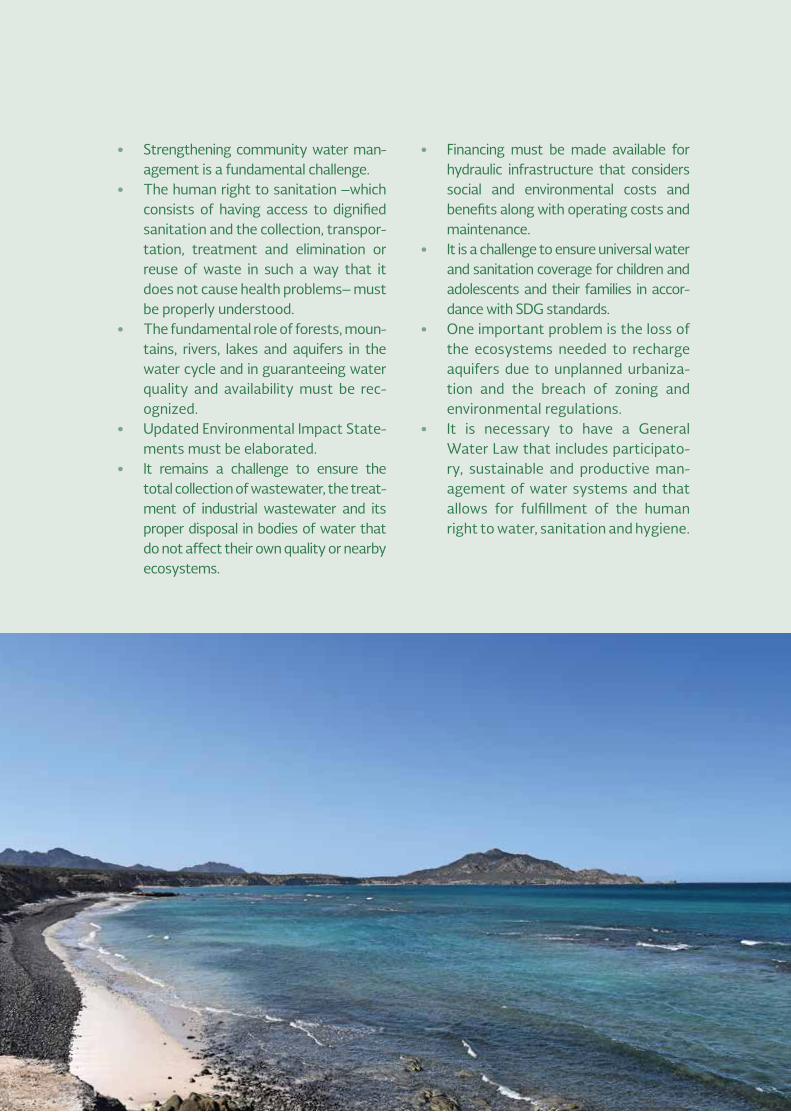
SDG 6: Ensure availability and sustainable management of water and sanitation for all.
Mexico faces major challenges in terms of efficient and sustainable water use, in the preservation of ecosystems that are essen-tial to the water cycle and in the supply of quality services to the entire population.
In Mexico, we have an analysis for each SDG that utilizes a set of priority national goals and their associated indicators. This infor-mation is contained in the National Strate-gy for the Implementation of the 2030 Agenda, which has the objective of consult-ing different sectors and orienting future actions by starting from a solid base of shared information. In the following pages of the VNR, there is relevant information for each SDG, divided into advances, emblem-atic actions and challenges. The informa-tion contained in these sections derives from the analyses of each SDG that were conducted by federal agencies during the design of the National Strategy. Each SDG also includes boxes with complementary positions provided independently by other actors from civil society and the United Na-tions System.
This section is organized into four parts. The first three belong to the thematic focuses of the 2018 High-Level Political Forum on Sus-tainable Development (Transformation to-wards sustainable and resilient societies:
45

ADVANCES
• Running water coverage at the nation-al level was 94.5% in 2015 (CON-AGUA, 2017) and 95.3% of the popu-lation has continuous access to a source of water (INEGI, 2015).
• 96.97% of the water supply is disin-fected (CONAGUA, 2017).
• 93.6% of the population living in pri-vate dwellings has drainage (INEGI, 2016).
• 87.2% of indigenous households in Mexico have potable running water and 73.1% have drainage (CDI, 2015).
• Current hydraulic infrastructure allows for the treatment of 63% of municipal wastewater (CONAGUA, 2018).
• 32.8% of wastewater from the indus-trial sector is treated (CONAGUA, 2017).
• Mexico is the country with second highest number of wetlands at 6,331; 142 of these are listed on the Con-vention on Wetlands of International Importance (CONAGUA, 2017).
• The volume of Official Development Assistance that Mexico receives from the OECD for water and sanitation is 120.8 million dollars (OECD, 2016).

EMBLEMATIC ACTIONS
• The National Rainwater Collection and Green Technology in Rural Areas Program (PROCAPTAR), operated by the National Water Commission (CONAGUA), contributes to expand-ing coverage of water and sanitation services.
• The National Water Reserves Pro-gram covers 295 watersheds through 13 decrees, in excess of the goals for this administration.
• CONAGUA’s National Water Quality Monitoring Network operates at 5,000 sites.
• The National Water Reserves Pro-gram seeks to ensure water levels or minimum volumes in order to protect the environment and conserve eco-systems associated with surface water. Surface water reserves have also been established for sustainable use or conservation.
• The Payment for Ecosystem Services Program, operated by the National Forest Commission (CONAFOR), supports conservation practices and prevents rezoning; the National Wet-land Inventory surveys, classifies and evaluates wetlands for their protec-tion, restoration and use.
• The CONAGUA-led Comprehensive Water and Sanitation Agency Devel-opment Plan (PRODI) makes invest-ments that allow these agencies to be more efficient and sustainable.
• The Indigenous Infrastructure Pro-gram (PROII-CDI) has undertaken actions to fight the underdevelop-ment of indigenous communities in terms of basic infrastructure (pota-ble water, drainage and sanitation).
CHALLENGES
• Achieving a rate of zero overexploita-tion of aquifers and watersheds and ecological degradation of rivers, tak-ing the impact of climate change into account.
• Providing the human, material and budgetary resources needed to ensure the sustainability of the water supply, particularly for human con-sumption.
• Guaranteeing the conservation of ecosystems that depend on water.
• Reducing industrial pollution, particu-larly from the mining and hydrocar-bon industries, as well as the over-concession of the nation’s water.
• Improving the regulation of potable water and sanitation services at the municipal level.
• Improving hydraulic infrastructure to meet the country’s growing needs, particularly in terms of wastewater treatment and the quality of drain-age services in rural communities.
• Providing access to potable water, sanitation and hygiene services to indigenous, Afro-Mexican, suburban and rural communities.
• Increasing the reuse of water in industry and municipal services and the practice of aquifer recharging.
47
48
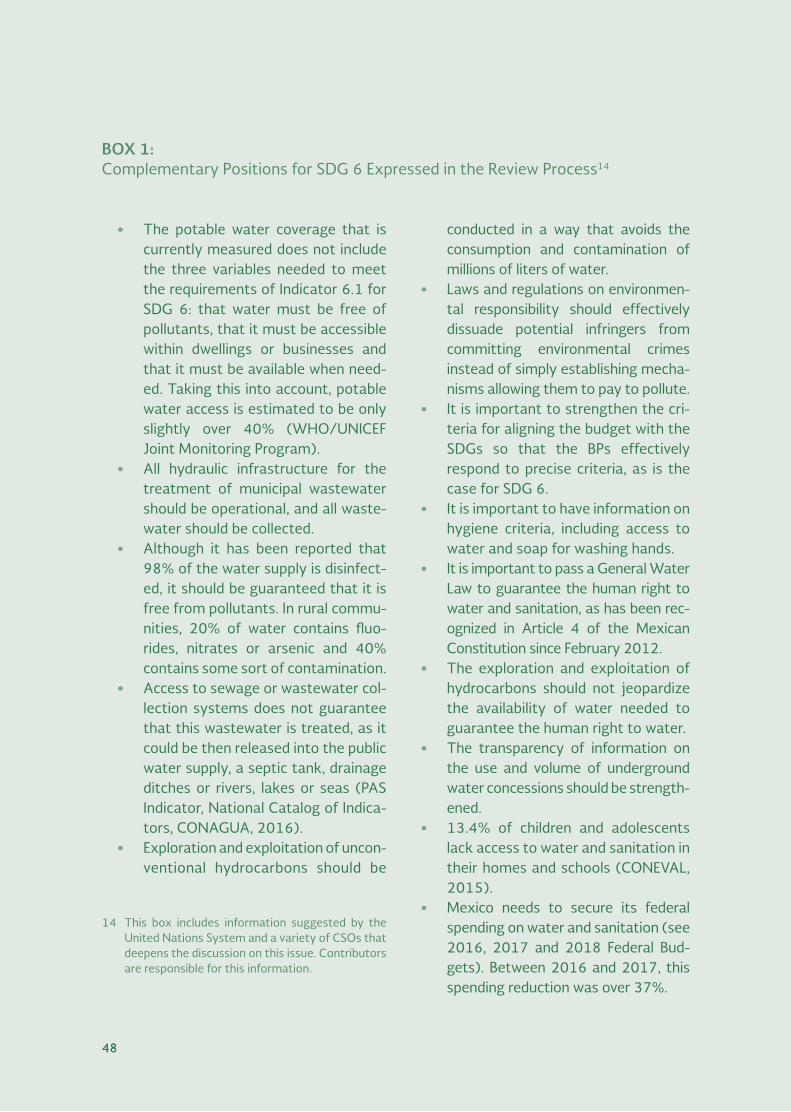
BOX 1: Complementary Positions for SDG 6 Expressed in the Review Process14
• The potable water coverage that is currently measured does not include the three variables needed to meet the requirements of Indicator 6.1 for SDG 6: that water must be free of pollutants, that it must be accessible within dwellings or businesses and that it must be available when need-ed. Taking this into account, potable water access is estimated to be only slightly over 40% (WHO/UNICEF Joint Monitoring Program).
• All hydraulic infrastructure for the treatment of municipal wastewater should be operational, and all waste-water should be collected.
• Although it has been reported that 98% of the water supply is disinfect-ed, it should be guaranteed that it is free from pollutants. In rural commu-nities, 20% of water contains fluo-rides, nitrates or arsenic and 40% contains some sort of contamination.
• Access to sewage or wastewater col-lection systems does not guarantee that this wastewater is treated, as it could be then released into the public water supply, a septic tank, drainage ditches or rivers, lakes or seas (PAS Indicator, National Catalog of Indica-tors, CONAGUA, 2016).
• Exploration and exploitation of uncon-ventional hydrocarbons should be
14 This box includes information suggested by the United Nations System and a variety of CSOs that deepens the discussion on this issue. Contributors are responsible for this information.
conducted in a way that avoids the consumption and contamination of millions of liters of water.
• Laws and regulations on environmen-tal responsibility should effectively dissuade potential infringers from committing environmental crimes instead of simply establishing mecha-nisms allowing them to pay to pollute.
• It is important to strengthen the cri-teria for aligning the budget with the SDGs so that the BPs effectively respond to precise criteria, as is the case for SDG 6.
• It is important to have information on hygiene criteria, including access to water and soap for washing hands.
• It is important to pass a General Water Law to guarantee the human right to water and sanitation, as has been rec-ognized in Article 4 of the Mexican Constitution since February 2012.
• The exploration and exploitation of hydrocarbons should not jeopardize the availability of water needed to guarantee the human right to water.
• The transparency of information on the use and volume of underground water concessions should be strength-ened.
• 13.4% of children and adolescents lack access to water and sanitation in their homes and schools (CONEVAL, 2015).
• Mexico needs to secure its federal spending on water and sanitation (see 2016, 2017 and 2018 Federal Bud-gets). Between 2016 and 2017, this spending reduction was over 37%.
48
• Strengthening community water man-agement is a fundamental challenge.
• The human right to sanitation –which consists of having access to dignified sanitation and the collection, transpor-tation, treatment and elimination or reuse of waste in such a way that it does not cause health problems– must be properly understood.
• The fundamental role of forests, moun-tains, rivers, lakes and aquifers in the water cycle and in guaranteeing water quality and availability must be rec-ognized.
• Updated Environmental Impact State-ments must be elaborated.
• It remains a challenge to ensure the total collection of wastewater, the treat-ment of industrial wastewater and its proper disposal in bodies of water that do not affect their own quality or nearby ecosystems.
• Financing must be made available for hydraulic infrastructure that considers social and environmental costs and benefits along with operating costs and maintenance.
• It is a challenge to ensure universal water and sanitation coverage for children and adolescents and their families in accor-dance with SDG standards.
• One important problem is the loss of the ecosystems needed to recharge aquifers due to unplanned urbaniza-tion and the breach of zoning and environmental regulations.
• It is necessary to have a General Water Law that includes participato-ry, sustainable and productive man-agement of water systems and that allows for fulfillment of the human right to water, sanitation and hygiene.

SDG 7: EnSurE accESS to afforDablE, rEliablE, SuStainablE anD moDErn EnErGy for all.
Mexico is a country with a high degree of electricity coverage, but challenges remain in isolated rural areas. Electricity is primarily generated through fossil fuels, although the percentage of clean energy has increased and it is expected that the budget for this sector will double over the next five years.
ADVANCES
• 98.6% of the population has access to electricity (CFE, 2016).
• 95.6% of indigenous households have electricity (CDI, 2015).
• 20% of the country’s electricity comes from a clean source (SENER, 2016).
• Energy intensity fell by 5% between 2012 and 2016, which means that less energy is needed to produce each peso of the GDP (SENER, 2017).
• From 2013 to 2015, 1.084 billion pesos were invested in research and development on sustainable energy (SENER, 2018).
EMBLEMATIC ACTIONS
• In terms of clean energy, the Electri-cal Industry Law, the Geothermal Law, the Energy Transition Law and the Biofuel Promotion and Develop-ment Law promote and regulate the sustainable development of the elec-tric industry.
• Clean Energy Certificates accredit the production of a quantity of elec-tricity produced from sustainable sources.
• The Energy Management System establishes methods and processes for improving energy efficiency.
• The National Atlas of Areas with High Energy and Renewable Energy Potential promotes the use of renew-able energy resources.

51
• Reducing dependence on fossil fuels, which currently represent 79.7% of the electricity generated domestically.
• Ensuring that the Energy Transition Law is tied to the federal budget and modifying current legislation that prevents energy companies from working on energy efficiency for fed-eral institutions.
• Expanding the executive abilities of the National Commission for Energy Efficiency and promoting invest-ments in energy efficiency through changes to power rates.
• Setting a fixed budget for invest-ments in energy efficiency.
• The launch of the Natural Gas Mar-ket has contributed to the creation of an energy market based on the reli-able and accessible supply of hydro-carbons.
• In 2018, Mexico was admitted to the International Energy Agency (the first and, to date, only member from Latin America and the Caribbean).
CHALLENGES
• Providing basic energy services to all populations.
• Having a 100% reliable census of the population that lacks electricity.
BOX 2: Complementary Positions for SDG 7 Expressed in the Review Process15
• The Electrical Industry Law considers large hydroelectric dams and ther-monuclear reactors to be clean ener-gies, but steps must be taken to ensure that they do not have a nega-tive social or environmental impact.
• If not disposed of properly, ener-gy-saving halogen lamps pollute the soil with heavy metals (mercury) when discarded.
• Resources invested in combined cycle power plants could be used on locally distributed renewables.
• Women are the primary administra-tors of energy in the home and play an important role in the transition to sustainable energy, so it is important to have a gender approach to this SDG.
• It is important to recognize how the health of women and girls is affected by the use of polluting fuels within the home.
15 This box includes information suggested by the United Nations System and a variety of CSOs that deepens the discussion on this issue. Contributors are responsible for this information.
51

SDG 11: Make cities and human settlements inclusive, safe, resilient and sustainable.
In Mexico, over three quarters of the popu-lation lives in urban areas, the majority of which face many obstacles to implementing inclusive, safe, resilient and sustainable ur-ban development plans.
ADVANCES
• 98% of municipalities have an urban development plan, but 84% of them have not been implemented or updat-ed or are otherwise deficient (SEDA-TU).
• In 2015, 62.9% of Mexico’s popula-tion lived in cities with over 15,000 inhabitants and 77% in cities with more than 2,500 inhabitants (INEGI, 2016).
• 56% of residences are located in urban areas (SEDATU/CONAVI, 2012).
• 50% of dwellings already meet the necessary quality standards (SEDA-TU/CONAVI).
EMBLEMATIC ACTIONS
• The incorporation of the Right to the City into zoning and urban develop-ment legislation.
• The launch of the Sustainable Cities Network, whose goal is to reinforce actions at the institutional and com-munity levels that are aimed at envi-ronmental protection and social development.
• Updates to urban development plans now include a focus on urban sustain-ability.
• The Regional Development Plans for Northern, Central and South-South-eastern Mexico have the goal of rein-vigorating regional development.
• The General Human Settlement, Zoning and Urban Development Law has set the groundwork for a national zoning strategy.
• The Sustainable Cities Network is a strategy for handling solid waste, restoring public spaces and building housing that makes use of green technology.
• INFONAVIT’s Green Mortgage Pro-gram grants credits for dwellings that utilize green technology to save water, electricity and gas.
• The Areas Voluntarily Destined for Conservation Initiative of the Nation-al Commission on Natural Protected Areas (CONANP) reinforces the shared responsibility of civil society and the private sector in protecting natural areas.
• The Natural Disaster Risk Reduction Program and the Urban Resilience Guide, designed by SEDATU, contrib-ute to safe and resilient development in vulnerable regions of southeastern Mexico through capacity building.
CHALLENGES
• Providing the financing needed for the development of urban infrastruc-ture at the local level in a context of unplanned urban growth, environ-mental degradation and vulnerability to natural disasters.
52

• Reducing the vulnerability of commu-nities to violence and crime in certain areas.
• Overcoming obstacles to the regular-ization of land rights in rural areas.
• Improving the quality of public trans-portation in Mexican cities to reduce its economic, environmental and social costs, which primarily affect vulnerable populations. There are efficiency, qual-ity and safety challenges to achieving this.
53
54
BOX 3: Complementary Positions for SDG 11 Expressed in the Review Process16
• The quality of a dwelling should not be measured solely by the use of non-re-silient construction materials: it is also necessary to consider aspects such as resistance to earthquakes.
• It must be ensured that urbanization processes are not dominated by real estate interests, which generate high levels of inequality and environmental degradation, a lower quality of life and deficiencies in mobility and access to services.
• It is essential to expand the Natural Disaster Risk Reduction Program, which currently only covers six states, 60 municipalities and 400 rural com-munities.
• It is important to improve coordina-tion between different levels of gov-ernment.
• Traffic accidents are the second most common cause of death in Mexico for children between the ages of 5 and 14, and the fifth most common cause of death for the population as a whole (INEGI, 2015).
• Mobility is poor in Mexico’s cities. In Mexico City, for example, only 40% of residents have access to a mass tran-sit station less than 800 meters from their home (Institute for Transporta-tion & Development Policy, 2014).
• The City Prosperity Initiative (CPI), which identifies factors that affect the quality of residences and the well-being of individuals, as well as generating new data on cities for the use of municipal governments, con-stitutes a “public good,” allowing pol-icies to be aligned with the recom-mendations of the New Urban Agenda and the SDG 11 indicators.
• Violence, a lack of personal safety and the harassment of women in public spaces and on public transpor-tation should be considered.
• The Right to the City should kept in mind, that is, equal access to the bene-fits and opportunities offered by cities and participation in their design and redesign both by men and women.
• It is imperative that Municipal Urban Development Plans include measur-able goals and follow-up methodol-ogies.
16 This box includes information suggested by the United Nations System and a variety of CSOs that deepens the discussion on this issue. Contributors are responsible for this information.
54

EMBLEMATIC ACTIONS
• The National Sustainable Production and Consumption Policy promotes sustainable production and consump-tion patterns for goods and services through a variety of policy tools.
• Mexico, through SEMARNAT, forms part of a working group addressing food waste. This initiative was creat-ed under the framework of the North American Commission for Environ-mental Cooperation and is supported by the World Bank and Worldwide Responsible Accredited Production (WRAP).
• Mexico has legislation on the compre-hensive management of solid waste, solid waste management plans and decentralized Comprehensive Urban Solid Waste Management Agencies.
• The National Chemical Substances Profile shows the country’s infra-structure for the management of waste and other substances.
• The National Management Plan for Vehicles at the End of their Useful Life and the analog television collec-tion program contribute to the prop-er management of dangerous sub-stances.
• Legislative reforms on public purchas-es have been made that include sus-tainability criteria, such as (1) modifi-cations to Article 14 of the Law on Public Sector Acquisitions, Leases and Services and Article 34 of the General Law on Equality Between Women and Men, which incorporates gender equality provisions; and (2) the Ener-gy Transition Law, which regulates sustainable electricity use.
SDG 12: Ensure sustainable consumption and production patterns.
Mexico has made important advances in the design of policies to promote sustain-able consumption and production, but prog-ress in terms of transforming these sys-tems has been very limited and major changes are needed.
ADVANCES
• 24% of Mexico’s 66 million hectares of forests and jungles are managed under the sustainable forest manage-ment paradigm (CONAFOR, 2017).
• Mexico is the country with the fifth highest use of cardboard and paper secondary fibers.
• In 2017, 0.77% of the federal budget for administrative materials and offi-cial documents and articles was spent on sustainable purchases.
• It is estimated that 34.5% of the country’s total food production is wasted (over 20 million pounds of foodstuffs). This wasted food would be enough to feed 7.4 million Mexi-cans (World Bank, 2017).
• Approximately 9.6% of the 42.9 mil-lion tons of solid waste generated in Mexico’s cities is recycled each year (SEMARNAT, 2010).
• 70% of urban solid waste ends up in landfills (INEGI, 2016).
• Investments in nature tourism, eco-tourism and adventure tourism add-ed up to 146 billion pesos (SHCP, 2016).
55

• Mexico has a legal framework that ensures the sustainable use of ener-gy and water resources and environ-mental safeguards in acquisitions, leases and other services contracted by the federal government.
CHALLENGES
• Ensuring compatibility in the national legal framework for public purchases between the clauses on sustainabili-ty and other criteria.
• Eliminating, reforming or transform-ing incentives for the use of fuels that result in the deterioration of natural resources and biodiversity.
• Improving infrastructure for the transportation, storage and commer-cialization of food to reduce waste in the post-harvest period.
• Improving food management at stra-tegic points of the production chain, with some food being rediverted to food banks.
• Strengthening environmental legisla-tion on chemical substances and establishing regulatory guidelines for the prevention and mitigation of the environmental side effects of insecti-cides, fertilizers and other toxic sub-stances.
• Promoting the adoption of sustainabil-ity certificates in the tourism sector.

SDG 15: Protect, restore and promote sustainable use of terrestrial ecosystems, sustainably manage forests, combat desertification, and halt and reverse land degradation and halt biodiversity loss.
Mexico is a megadiverse country in which almost 17% of its land surface is protected through a variety of conservation methods. It also has programs to fight desertification, reduce deforestation and conserve species.
ADVANCES
• The Natural Protected Areas (ANP) System protects 10.8% of the coun-try’s land surface (CONANP, 2017). In total, 16.29% of the country’s land surface is protected through systems of protected areas and other conser-vation methods (SEMARNAT, 2018).
• 23.6 million hectares are managed using sustainable forestry practices (CONAFOR, 2017) and 337,735 hectares of commercially logged for-ests are managed under the sustain-ability criteria established between 2000 and 2017 (CONAFOR, 2017).
• 2.6 million hectares of forest ecosys-tems are covered by the Payment for Ecosystem Services Program (CON-AFOR, 2017).
EMBLEMATIC ACTIONS
• Mexico has National Strategies on the Reduction of Emissions due to Deforestation and Forest Degrada-
tion, on Mexican Biodiversity, on Sus-tainable Forest Management and on Sustainable Land Management.
• The ANP system provides protection for the country’s terrestrial surface.
• The Payment for Ecosystem Services Program has been addressing the problem of deforestation since 2003.
• The Action Program to Fight Deserti-fication in Mexico seeks to slow and stop the advance of desertification, promote productivity in arid regions and improve the quality of life of their residents. There is also a Sustainable Land Management Program that seeks to improve terrestrial ecosys-tems.
• SAGARPA’s Agriculture Promotion Program prevents changes to land use patterns in forest areas.
• CONANP’s Species Conservation Action Program (PACE) focuses con-servation efforts for 45 endangered species.
CHALLENGES
• Providing proper financial resources and legislation for the protection and management of ecosystems and bio-diversity.
• Passing domestic legislation to prop-erly implement the Nagoya Protocol on Access to Genetic Resources and the Fair and Equitable Sharing of Ben-efits Arising from their Utilization (ABS) to the Convention on Biologi-cal Diversity
• Ensuring policy consistency at the federal, state and municipal levels and transparency regarding practices of productive and extractive industries.
57
• Creating opportunities to attract financing for Mexico’s national and international commitments under this SDG, as well as promoting projects that make sustainable use of the country’s biodiversity.
• Slowing the change of land use pat-terns due to agriculture and ranching.
• Reducing the overexploitation of lum-ber and non-lumber forest products, as well as illegal trafficking of forest resources.
• Developing capacities and methodol-ogies to measure the economic value of natural goods and services.
BOX 4: Complementary Positions for SDG 15 Expressed in the Review Process17
be imposed on communities, affecting their economic and cultural activities.
• Mexico, together with other Latin American and Caribbean countries, participates in the Initiative 20x20 to restore degraded land.
17 This box includes information suggested by the United Nations System and a variety of CSOs that deepens the discussion on this issue. Contributors are responsible for this information.
• Mining exploration and exploitation concessions in Natural Protected Areas (ANPs) and private conserva-tion areas threaten the conservation of biodiversity and the rights of rural and indigenous communities.
• ANPs should be established with the binding participation of rural commu-nities that inhabit the territories that are to be protected. ANPs should not
58

4.2 EMPOWERING PEOPLE AND ENSURING INCLUSIVENESS AND EQUALITY: SDGs 4, 8, 10, 13, 16
SDG 4: Ensure inclusive and equitable quality education and promote lifelong learning opportunities for all.
In Mexico, ensuring access to child develop-ment services, improving the physical infra-structure of educational facilities, guaran-teeing quality education (particularly for vulnerable populations) and harmonizing the education system with the demands of the labor market, among other measures, are essential elements for meeting this goal.
ADVANCES
• In the 2015-16 school year, the per-centage of students who began ele-mentary school with at least one year of preschool was 91.9% (SEP).
• In the 2015-16 school year, the gross attendance ratio (on-site and dis-tance learning) was 78.7% (SEP).
• 78.2% of the school age population (from 3 to 23 years of age) is enrolled in the National Education System (2015-16 school year, SEP).
• 70.5% of ninth grade students were placed at the elemental knowledge level or higher of the Language and Communication section of the stan-dardized test applied under the National Plan for the Evaluation of Learning (PLANEA/SEP, 2015).
• 46.5% of disabled children, adoles-cents and young adults (3 to 29 years of age) go to school (SEP, CONADIS).
• 31.4% of young people and adults have knowledge of information and communications technology (INEGI, 2016).
EMBLEMATIC ACTIONS
• The New Educational Model, launched in 2017, is structured around five axes: curricular planning, schools at the cen-tre of the educational model, teacher training, inclusion and equity and gov-ernance of the education system.
• The Schools at ONE HUNDRED PER-CENT Program, operated by the National Educational Infrastructure Institute (INIFED), has improved the physical infrastructure of more than 33,000 educational facilities across the country.
• The SEP’s Full Time Schools Program has the objective of getting the most out of the time available for academ-ic, athletic and cultural development, as well as freeing time for parents that had been used for raising their children so it can be dedicated to oth-er activities, particularly remunerat-ed work.
• The SEP’s Schools at the Center Strategy has the goal of improving the quality of education.
• The National Plan for the Evaluation of Learning (PLANEA) has the goal of measuring the extent to which stu-dents have mastered a set of essen-tial skills in the fields of language, communication and mathematics.
• The INEE’s Professional Teaching Ser-vice is a mechanism that guarantees teachers to have the proper knowledge and skills for their job.
59

• The SEP’s Digital Inclusion Program, part of the Learning 2.0 strategy (@prende 2.0), seeks to develop digital skills and computational thinking of students and teaching staff.
CHALLENGES
• Ensuring that efforts to improve the education system are not just concen-trated on preschool education, but on early education as part of an inter-in-stitutional policy that affirms the right of all children to quality education.
• Continuing and expanding physical improvements to educational infra-structure.
• Incorporating children and adoles-cents with special needs into the education system, as well as those belonging to indigenous or Afro-Mex-ican communities and those who live in isolated areas.
• Increasing the supply of quality edu-cation, particularly at the high school and college levels, and reducing the dropout rate.

BOX 5: Complementary Positions for SDG 4 Expressed in the Review Process18
• 14.9% of children and adolescents do not attend school; this percentage ris-es to 16.2% if we only look at adoles-cents, that is, nearly 2.2 million people between the ages of 12 and 17.
• 82.2% of children between 36 and 59 months of age developed proper-ly in at least three of the following four categories: literacy-numerical ability, physical development, social and emotional development and domination of learning (ENIM, 2015).
• The dropout rate during the 2016-17 school year was 0.4% in elemen-tary school, 3.9% in middle school and 11.8% in high school.
• One major challenge is the inclusion of a gendered approach in the strate-gy used to lower the high school drop-out rate, as at this level, girls drop out at a higher rate than boys do.
• One out of every four children between the ages of 3 and 5 does not attend preschool.
• Five out of every ten students have not learned the necessary lessons in language and communication to a satisfactory degree, which rises to six out of every ten for mathematics.
• The average level of education among the indigenous population is elemen-tary school, which rises to middle school in the rest of the country.
• 76.6% of children and adolescents do not have access to internet.
• In 2015, one third of teachers did not have study plans and programs and one fourth of teachers did not have enough textbooks for their students (INEE).
• Two out of every three schools report that they have at least one student with special needs, while only 30% have staff trained to meet their needs (INEE, 2016).
• Enrollment in preschool needs to be increased and a comprehensive early education policy needs to be devel-oped that recognizes and strengthens models of community intervention.
• It is a challenge to ensure a supply of teachers with initial and continuing education that contributes to the development of the knowledge and skills needed to foster positive behav-ior and well-being in children and ado-lescents.
• The Health in Your School Program needs to be strengthened, as health and education are the two pillars for enjoying a full life.
• A life cycle approach needs to be incor-porated into the design of educational programs, strategies and policies.
18 This box includes information suggested by the United Nations System and a variety of CSOs that deepens the discussion on this issue. Contributors are responsible for this information.
61
SDG 8: Promote sustained, inclusive and sustainable economic growth, full and productive employment and decent work for all.
In Mexico, productivity and access to finan-cial services have increased and the unem-ployment rate has remained low. Despite this progress, Mexico faces many major challenges to ensuring full, productive and decent employment for all.
ADVANCES
• Between 2013 and 2017, the Mexi-can economy grew in real terms at an average annual rate of 2.4% (UPEHP, 2018).
• In 2017, the contribution of different economic sectors to the GDP was as follows: primary, 3.3%; secondary, 30.9%; and tertiary, 65.7% (INEGI, 2017).
• 55.8% of the population does not have social security (CONEVAL, 2016).
• According to data from the National Occupation and Employment Study (INEGI), the unemployment rate in 2017 was 3.44% and the percentage of people working in the informal economy was 57%.
• The unemployment rate for young people was 6.1% (ENOE-INEGI, 2017).
• The Labor Force Participation Rate for women was 43% (ENOE-INEGI, 2017).
• The Labor Force Participation Rate for people with disabilities was 39.1% in 2014 (ENADID-INEGI, 2014).
• 52.1 million people have access to financial services (ENIF, 2015)
• 22.5% of micro-enterprise owners stated that they were unable to expand due to a lack of credit (ENAP-ROCE, 2014).
• 16% of International Development Cooperation projects are aimed at supporting commerce (AMEXCID, 2016).
EMBLEMATIC ACTIONS
• The National Productivity Commit-tee (CNP) is a consultative body whose purpose is to identify policies and actions that will increase produc-tivity, by working holistically, sec-torally and regionally.
• The STPS’s National Employment Service (SNE) provides free assis-tance to people looking for work through job leads and economic or in-kind support for job training or self-employment.
• Special Economic Zones (SEZs) have the goal of closing regional gaps by taking advantage of the natural and logistical advantages of a geographic area.
• The STPS’s Workplace Human Traffick-ing Prevention and Detection Inspection Protocol establishes mechanisms allow-ing workplace inspectors to act to pre-vent, detect and eradicate human traf-ficking.
• IMJUVE’s Youth Employment Strate-gy has the goal of coordinating, con-necting and bringing together actors in the job market to provide better job opportunities for the country’s young people.
62

• The STPS’s Workplace Health and Safe-ty Self-Management Program encour-ages businesses to ensure safe and hygienic workplaces.
• Mexican Norm NMX-R-025-SCFI-2015 on Labor Equality and Non-Discrimi-nation incorporates the principle of non-discrimination into job recruit-ment procedures. It also closes the pay gap, along with other measures aimed at preventing and addressing workplace violence.
• The Tourism Connection Strategy promotes economic growth through credit incentives such as Improve Your Hotel and Improve Your Restaurant.
CHALLENGES
• Closing the pay gap and incorporat-ing a gender perspective into social programs.
• Creating jobs and ensuring the long-term financial sustainability of social programs.
• Democratizing and expanding access to financial services.
• Raising the minimum wage.• Consolidating a tax system that gen-
erates enough revenue to finance a comprehensive economic develop-ment policy.
• Incorporating women, including trans-gender women, into economic activi-ties from which they have traditionally been excluded.
• Guaranteeing that people with dis-abilities enjoy equal opportunities on the job market.
• Promoting training, resources and financing for micro-entrepreneurs and other sectors of the economy in accor-dance with their needs.
BOX 6: Complementary Positions for SDG 8 Expressed in the Review Process19
• Access to a dignified job is related to a living wage. Labor policy should ensure proper remuneration.
• Around 7.5 million people earn mini-mum wage, which is equivalent to 14% of the population employed in the formal economy. It is necessary to raise the minimum wage to make it a living wage.
• Changes should be made to the INEGI methodology used to measure the youth unemployment rate, as it may be underestimating the true percent-age of unemployed youth.
19 This box includes information suggested by the United Nations System and a variety of CSOs that deepens the discussion on this issue. Contributors are responsible for this information.
63
SDG 10: Reduce inequality within and among countries.
Mexico is among the 25% of countries with the highest levels of inequality in the world. It is therefore vital to reduce inequalities be-tween both individuals and regions of the country so that no one is left behind. This means getting rid of discriminatory laws, regulations and practices and questioning and changing structures that contribute to the permanence and reproduction of in-equalities.
ADVANCES
• The Foreign Direct Investment (FDI) accumulated between Q1/2013 and Q1/2018 was 181.793 billion dollars (SE).
• The national GINI coefficient is 0.498 (CONEVAL, 2016).
• As of December 2017, the income needed for a minimum standard of living was 1,491.65 pesos per month (CONEVAL, 2017).
• There is a pay gap between women and men of 5.1% (ENOE, 2017).
• Domestic financing of the private sec-tor represents 34.89% of GDP (SHCP, 2018).
• Mexico receives 7.8 billion dollars in Official Development Assistance and Other Official Flows (OECD, 2016).
EMBLEMATIC ACTIONS
• The tax reform has promoted a sys-tem of progressive taxation.
• The Tax Incorporation Regime (RIF) seeks out workers in the informal economy and aims to formalize their jobs, giving them access to insurance, housing, pension and credit benefits.
• SEZs have been created to encourage sustainable regional economic growth that reduces poverty, increases access to basic services and expands oppor-tunities for healthy, productive lives.
• SEDESOL’s National Inclusion Strate-gy (ENI) has the goal of improving access to social services and reducing deficiencies.
• In 2017, the Technical Group for the Incorporation of a Gender Perspec-tive into Aid and Protection Policies for Migrant Women was created as part of the Interior Secretariat’s Council on Immigration Policy.
• Comprehensive Border Traffic Assis-tance Centers have been opened in Huixtla, Catazajá and Trinitaria, Chi-apas, as have mobile social programs in municipalities along the southern border.
• Regional Visitor and Border Worker cards have been issued to immigrants from Guatemala and Belize who wish to work in one of the states along the southern border.
• SEGOB and SRE’s We Are Mexicans Strategy establishes comprehensive support measures for a safe, digni-fied return for deported Mexicans.
64

CHALLENGES
• Reducing inequalities in social infra-structure and promoting the econom-ic integration of the country’s most underdeveloped regions through an approach based on universal social rights.
• Strengthening the stability of the nation’s financial system when faced
with shocks arising from global mar-kets.
• Ensuring financial stability of the social security and pension systems, as well as eradicating structural dis-crimination against senior citizens.
• Creating formal mechanisms that take advantage of the capacity of young migrants to act as agents of social change and economic development.
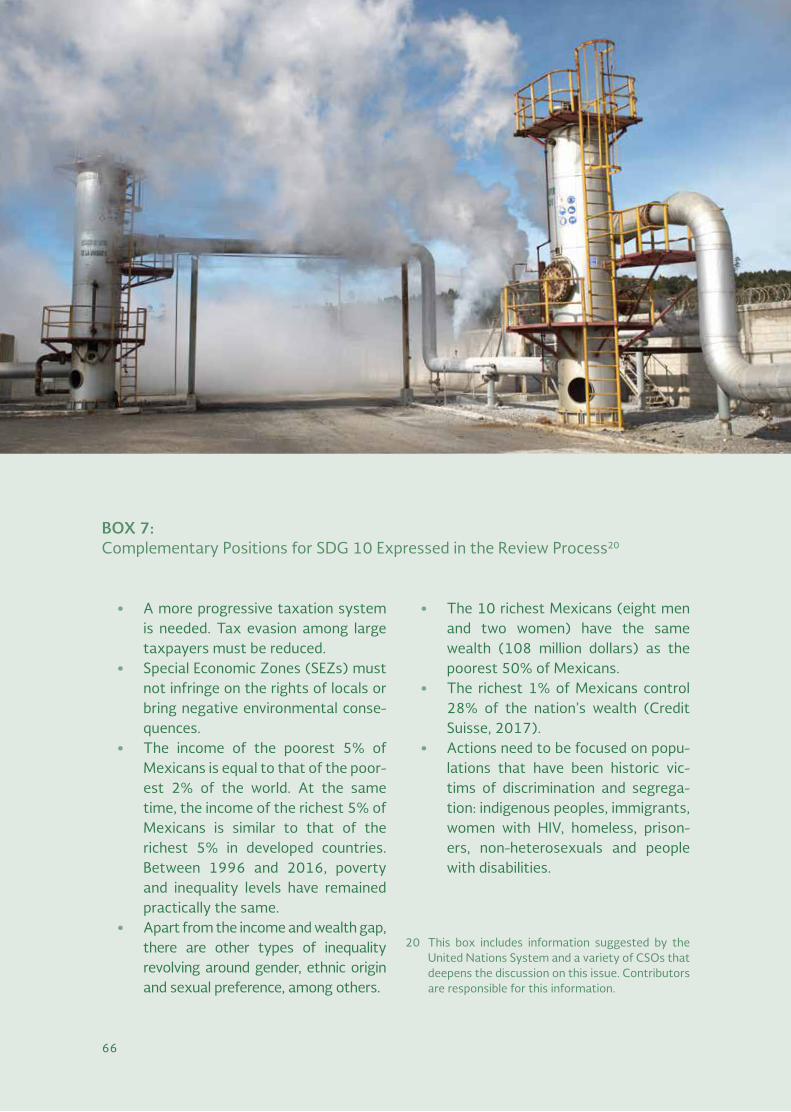
BOX 7: Complementary Positions for SDG 10 Expressed in the Review Process20
• A more progressive taxation system is needed. Tax evasion among large taxpayers must be reduced.
• Special Economic Zones (SEZs) must not infringe on the rights of locals or bring negative environmental conse-quences.
• The income of the poorest 5% of Mexicans is equal to that of the poor-est 2% of the world. At the same time, the income of the richest 5% of Mexicans is similar to that of the richest 5% in developed countries. Between 1996 and 2016, poverty and inequality levels have remained practically the same.
• Apart from the income and wealth gap, there are other types of inequality revolving around gender, ethnic origin and sexual preference, among others.
• The 10 richest Mexicans (eight men and two women) have the same wealth (108 million dollars) as the poorest 50% of Mexicans.
• The richest 1% of Mexicans control 28% of the nation’s wealth (Credit Suisse, 2017).
• Actions need to be focused on popu-lations that have been historic vic-tims of discrimination and segrega-tion: indigenous peoples, immigrants, women with HIV, homeless, prison-ers, non-heterosexuals and people with disabilities.
20 This box includes information suggested by the United Nations System and a variety of CSOs that deepens the discussion on this issue. Contributors are responsible for this information.
66

SDG 13: Take urgent action to combat climate change and its impacts.
Mexico is a country that is highly vulnerable to the effects of climate change. It has for-malized its adherence to the Paris Agreement and is carrying out a series of mitigation and adaptation measures. To fully comply with its national and international commitments on climate change, it must consolidate a green and inclusive economy that depends less and less on fossil fuels and that reverses trends towards rising emissions.
ADVANCES
• Casualties during extreme weather events have fallen, although they have caused an annual average of 186 deaths between 2000 and 2014 (CENAPRED).
• Mexico emits 683 million tons of car-bon dioxide (INECC, 2015), which correspond to the consumption of fossil fuels in the transportation of people and merchandise (26.2%), electricity generation (19%) and industrial processes (17.3%).
• There were 125,000 tons of black car-bon emissions in 2016 (BUR, INECC, 2016).
• Of Mexico’s 2,456 municipalities, 1,071 are not considered highly vul-nerable to or at high risk of extreme weather events (PECC, 2014).
EMBLEMATIC ACTIONS
• The National Greenhouse Gases and Compounds Emissions Inventory allows the country to analyze its emissions by emission source.
• The National Emissions Registry (RENE) compiles information on industrial emissions of greenhouse gases and compounds.
• A tax on fossil fuel imports and sales (carbon tax) contributes to reducing carbon emissions.
• Regulations for the launch of an emis-sions trading or carbon market sys-tem.
• The National Climate Change Vulner-ability Atlas is a structured, system-atic collection of maps that shows the country’s vulnerability to climate change.
• The National Risk Atlas identifies the areas that are at the highest risk of extreme weather events.
• Ecological zoning programs include criteria for mitigating or adapting to the effects of climate change.
• The 2014-18 Special Climate Change Program contributes to national plan-ning in the face of the effects of cli-mate change.
• Mexico is taking steps to restore and reforest coastal wetlands.
• Climate Change Adaptation Pro-grams in Natural Protected Areas (ANPs) provide information that ori-ents adaptation measures.
• The National Strategy for Reducing Emissions due to Deforestation and Degradation helps mitigate climate change.
67

• The General Climate Change Law was reformed in April 2018 to adapt it to the Paris Agreement.
• Mexico’s targets for climate change mitigation are to reduce greenhouse gas emissions by 22% and short-lived air pollutants by 51% by 2030.
• The National Council of Science and Technology (CONACYT) and the National Ecology and Climate Change Institute (INECC) have created the Mexican Climate Change Report, which compiles a large part of the information generated on climate change over the last two decades.
Challenges
• Updating and consolidating instru-ments and regulations to meet the country’s commitments in terms of mitigating and adapting to the effects of climate change.
• Universalizing the focus on environ-mental protection among all levels of government.
• Launching Mexico’s Emissions Trading System.
• Financing the measures needed to cre-ate a low-carbon economy. A $120-bil-lion-dollar investment is needed over a 15-year period.
• Reducing the country’s dependence on fossil fuels. Current emissions trends could make it difficult to meet our commitments under the Paris Agreement.
• Understanding, quantifying and report-ing on the effects of climate change.
BOX 8: Complementary Positions for SDG 13 Expressed in the Review Process21
• The government must increase global and cross-sector planning to address the problem of climate change, pre-venting different agencies from pur-suing contradictory ends.
• Combined cycle plants and uncon-ventional hydrocarbons extraction are being promoted, which increase methane emissions.
• There is a need to adopt a gender approach to the construction of com-prehensive strategies for the preven-tion of natural disasters and the struggle to rebuild afterwards.
21 This box includes information suggested by the United Nations System and a variety of CSOs that deepens the discussion on this issue. Contributors are responsible for this information.
68

SDG 16: Promote peaceful and inclusive societies for sustainable development, provide access to justice for all and build effective, accountable and inclusive institutions at all levels.
Mexico has an institutional architecture based around the defense of human rights, the eradication of violence, transparency and support for victims, among other is-sues. Nevertheless, the country faces many challenges arising from its institutional weakness and the presence of criminal or-ganizations, which condition the implemen-tation of this SDG.
ADVANCES
• In 2015, Mexico came in second place from among 25 countries evaluated under the Management for Develop-ment Results criteria. (IDB).
• In 2016, the homicide rate was 20 per 100,000 people (INEGI, 2017).
EMBLEMATIC ACTIONS
• The National Human Rights Program, launched during this administration, is the central axis of the government’s policy on consolidating a rights-based society.
69

• The General Law on the Rights of Children and Adolescents recognizes them as subjects with rights, as well as groups that are highly vulnerable.
• Mexico’s Action Plan under the Global Partnership to End Violence Against Children includes the creation of a 2019-2030 Agenda of Priorities aimed at ending abuse, exploitation, torture, trafficking and all forms of violence against children and adolescents.
• The new accusatory criminal justice system guarantees better protection of the rights of both victims and sus-pects.
• The Violence Against Women Alert (AVGM) is a mechanism promoted by the Interior Secretariat through the National Commission for Pre-venting and Eradicating Violence Against Women (CONAVIM) that is aimed at confronting violence against women with coordinated actions.
• The Centers for Women’s Justice (CJMs), operated by the CONAVIM, are spaces that provide legal advice and support services for women and their children.
• The National Victim Support System is in charge of defining and applying policies for supporting victims.
• The National Transparency System is in charge of coordinating efforts in terms of transparency, access to information and the protection of per-sonal information.
• The National Anticorruption System is a body in charge of coordinating efforts between authorities at all levels of gov-ernment to prevent, investigate and punish corruption.
• The National Single Window includes a participatory platform and allows citi-zens to access information, services and data.
CHALLENGES
• Reducing the presence and opera-tional capacity of criminal organiza-tions.
• Achieving effective international coor-dination and collaboration in the pre-vention of money laundering, drug trafficking and gun running, particu-larly with the United States of Ameri-ca and other countries where Mexican criminal organizations operate.
• Consolidating the implementation of government policies on human rights.
• Coordinating actions among the pri-mary actors working to eradicate gender violence.
• Creating societal trust in the Victim Support System.
• Establishing a unified criminal code.• Consolidating the National Anticor-
ruption System and making it effec-tive.
• Consolidating and maintaining bud-get transparency measures.
70

BOX 9: Complementary Positions for SDG 16 Expressed in the Review Process22
• Comprehensive data is needed on vio-lence against children and adolescents in order to develop violence preven-tion and child protection policies.
• Together with civil society, efforts have been made to contextualize and define the problems and indicators for SDG 16, thus contributing to the definition of priority measures and a framework for monitoring this goal. In 2015, there were 1,057 homicides of children and adolescents (INEGI, 2017). Further-more, four out of every 10 sexual crimes are committed against a minor (CEAV, 2016). Between 2010 and 2016, 8,644 children and adolescents were murdered.
• 63% of children between the ages of 1 and 14 have been victims of psy-chological or physical abuse by a fam-ily member (National Study on Wom-en and Children in Mexico, 2015).
• As of October 2017, 33,513 people have been disappeared in Mexico, 6,189 of them are children and ado-lescents, representing 18.5% of the total. Of the total disappeared chil-dren and adolescents, six out of every 10 cases are girls or young women (REDIM, 2017).
• In 2014, an average of 152 cases of children and adolescents were pro-cessed each day for suspected abuse, of which 35% were cases of physical abuse, 27% neglect, 18% emotional abuse, 15% abandonment and 4% sexual abuse (DIF).
• Mexico has a legal protocol for cases involving sexual orientation or gen-der identity that helps those working in the justice system to comply with the constitutional mandate on the rights of LGBTI people.
• It is essential to establish a national registry of hate crimes against LGBTI people as the first step towards reduc-ing current rates.
• Together with the legislative branch, legal lacunae must be identified that prevent children and adolescents from living a violence-free life, particularly in terms of explicitly prohibiting phys-ical and humiliating punishments.
22 This box includes information suggested by the United Nations System and a variety of CSOs that deepens the discussion on this issue. Contributors are responsible for this information.
71

4.3 ERADICATING POVERTY AND PROMOTING PROSPERITY IN A CHANGING WORLD: SDGs 1, 2, 3, 5, 9, 14
SDG 1: End poverty in all its forms everywhere.
In Mexico, implementing this goal is both a considerable challenge and a unique oppor-tunity to dignify the lives of the 43.6% of the population living in poverty.
ADVANCES
• In accordance with the national pov-erty and scarcity indicators mea-sured by CONEVAL (2016), of the country’s total population:
• Over 2 million Mexicans have moved out of extreme poverty. In 2016, 9.4 million people were classified as extremely poor.
• 53.4 million people are living in pov-erty.
• The number of Mexicans with access to healthcare has risen by 6.2 million people.
• The number of Mexicans with social security has risen by 3.4 million people.
EMBLEMATIC ACTIONS
• SEDESOL’s National Inclusion Strate-gy (ENI) contributes to securing social rights and reducing shortcom-ings through the coordination of poli-cies and social programs that improve the lives of Mexicans. The results show improved coverage for people facing extreme food poverty through the National Crusade Against Hunger and the expansion of the network of community kitchens, which currently number 5,786 (SEDESOL, 2018).
• INFONAVIT and SEDATU’s Papelito Habla Program serves as a tool pro-viding legal certainty over one’s prop-
72

erty through the regularization of land and real estate.
• In terms of inclusion in the labor force, SEDESOL’s PROSPERA Program coordi-nates institutional efforts and social policies relating to production, income generation, economic well-being, finan-cial and labor inclusion and nutritional and health education for people living in poverty.
• The National Commission for the Development of Indigenous Peoples’ (CDI) Program for Improving Indige-nous Productivity is one example of the measures taken to increase the productivity and income of vulnera-ble groups.
• The SE’s National Financing Program for Micro-entrepreneurs and Rural Women contributes to the creation of productive businesses and increas-ing the productivity of existing busi-nesses.
• The Comprehensive Social Information System (SISI) improves articulation of institutional responses to social short-falls.
• The Social Portfolio promotes policy dialogue between citizens and author-ities, reports on access to rights and social programs and allows citizens to follow up on measures and programs and express their priorities and needs.
CHALLENGES
• Having a mechanism in place to detect and provide immediate sup-port for vulnerable groups.
• Creating quality jobs and sustained and inclusive economic growth on the basis of a strong internal market.
• Transforming the vision in which fighting poverty is solely the respon-sibility of one subset of government institutions, when the dimensions of the challenge demand coordination and holistic policies.
• Incorporating a life-cycle approach into the design of programs, strate-gies and policies aimed at fighting poverty.
BOX 10: Complementary Positions for SDG 1 Expressed in the Review Process23
• In 2016, 52.3% of Mexican children were living in poverty and 9.7% in extreme poverty, while 48.8% of ado-lescents (12 to 17 years of age) were living in poverty and 7.8% in extreme poverty.
• Conditions for reducing poverty in Mexico should be improved.
23 This box includes information suggested by the United Nations System and a variety of CSOs that deepens the discussion on this issue. Contributors are responsible for this information.
73

SDG 2: End hunger, achieve food security and improved nutrition and promote sustainable agriculture.
In Mexico, the population facing food inse-curity has been reduced in recent years, as has the percentage of children suffering from chronic malnutrition. Nevertheless, guaranteeing quality nutrition and sustain-able agricultural production continue to be major challenges.
ADVANCES
• The number of Mexicans who have proper access to food has risen by 2.8 million people (CONEVAL, 2016).
• Mexico is the world’s 12th biggest food producer.
EMBLEMATIC ACTIONS
• The National Crusade Against Hun-ger includes a network of 5,560 com-
munity kitchens, feeding over half a million people every day.
• Price distortions for consumers have been regulated through legal decrees and the complementary supply of agricultural and livestock products.
• Access to financing for farmers con-tributes to improving logistics and the food supply.
• Mexican agricultural products have been positioned in international mar-kets.
CHALLENGES
• Guaranteeing effective access to var-ied, quality food in sufficient quanti-ties for all people.
• Guaranteeing the access of local products to value-added markets.
• Improving planning and investment in infrastructure and transportation to increase opportunities for transition-ing towards more sustainable agricul-tural models.
• Promoting the environmental resil-ience of the agricultural sector through universal insurance coverage for small producers.
74

SDG 3: Ensure healthy lives and promote well-being for all at all ages.
Ensuring a healthy life and promoting the well-being of the population is a basic con-dition for ending inequality and poverty and guaranteeing the comprehensive human development of all.
ADVANCES
• The number of people with access to healthcare has risen by 6.2 million people (CONEVAL, 2016).
• The Popular Insurance Program has 53.7 million people enrolled (SSA, 2017).
• 84.5% children and adolescents have healthcare coverage (SIPINNA, 2018).
• 96.7% of children have all of their vaccinations (SSA, 2015).
EMBLEMATIC ACTIONS
• The following prevention programs are in place: Health in Your School, Safe Consultation, PreventIMMS and PreventISSSTE and the National Strategy for the Prevention and Con-trol of Obesity and Diabetes.
• The SSA’s Universal Vaccination Pro-gram and National Health Weeks prevent the primary causes of infant mortality.
• The INMUJERES National Strategy for the Prevention of Teen Pregnancy (ENAPEA) consists of inter-institu-tional measures aimed at preventing teen pregnancy that are coordinated with national, state and municipal policies and plans.
• IMSS-PROSPERA’s Early Childhood Development Strategy promotes holistic growth, nutritional monitor-ing, cognitive and socio-emotional development and the timely detec-tion and response to developmental issues.
• The Mexican Social Security Insti-tute’s mobile app allows members to schedule appointments with their doctor, saving them time and money.
CHALLENGES
• Ensuring effective access to quality healthcare services, eliminating dis-criminatory barriers, closing service gaps between different social groups and regions and ensuring the genera-tion and effective use of healthcare resources.
• Guaranteeing the existence of rele-vant, reliable and truthful information on sexual and reproductive health, as well as access to birth control meth-ods.
• Having a properly implemented legal framework for the control of drugs.
75

BOX 11: Complementary Positions for SDG 3 Expressed in the Review Process24
• Two out of every ten Mexican children are born to a mother younger than 20 (ENSANUT, 2012) and one out of every two sexually active girls between the ages of 12 and 19 gets pregnant (INEGI, 2016).
• It is necessary to reduce anemia among non-pregnant women of reproductive age by 50% and to reduce chronic mal-nutrition among children under the age of five by 40% by 2025.
• Food security policies must be designed and supported that ensure the sustain-ability of nutritional goals, such as through economic, technical and infra-structure aid to small producers.
24 This box includes information suggested by the United Nations System and a variety of CSOs that deepens the discussion on this issue. Contributors are responsible for this information.
• In 2018, the Public Education Secre-tariat launched the early education program A Good Start, which adopts a new focus on early childhood devel-opment and a framework of affec-tionate care as the basis of early edu-cation in Mexico.
• 16.2% of children in Mexico lack access to healthcare services; the rate of maternal mortality is 34.6 per 100,000 live births (CONEVAL, 2015) and the mortality rate for children under the age of five is 15.1 per 1,000 live births (INEGI, 2018).
• 27.6% children and adolescents lack regular access to food (CONEVAL, 2014) and chronic malnutrition affects 1.5 million children under the age of five (INSP, 2012); 33.2% of children between the ages of five and 11 are overweight or obese.
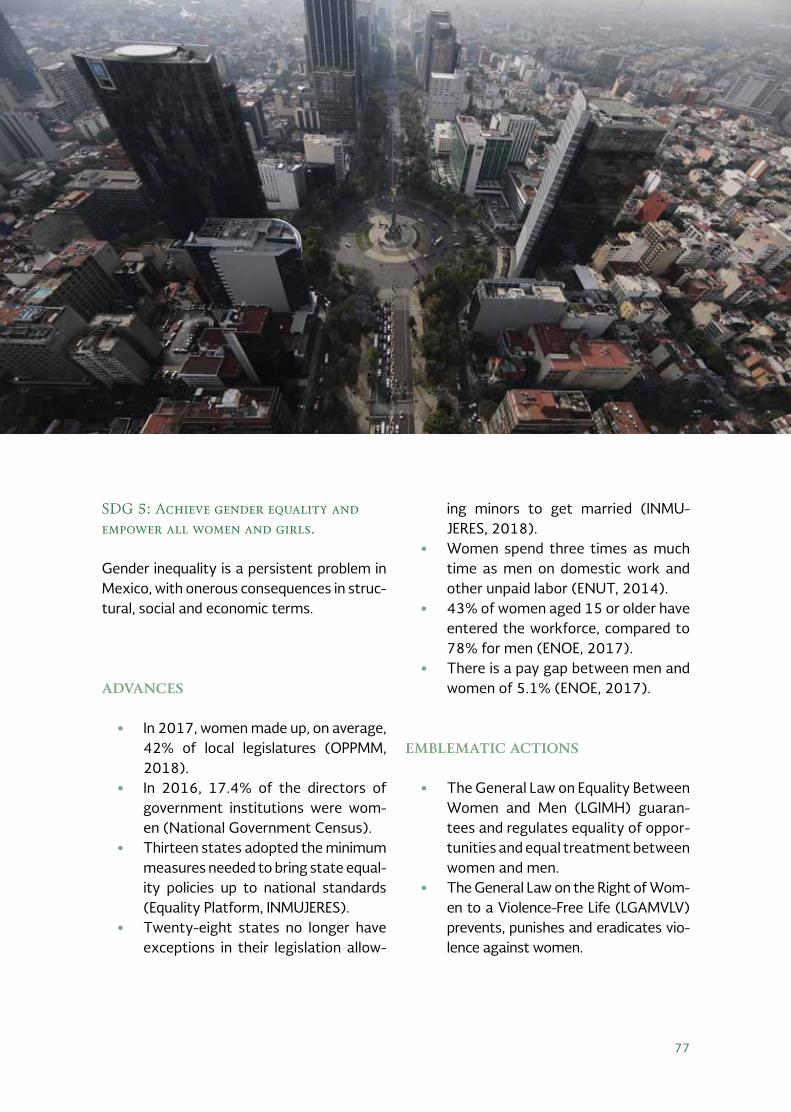
SDG 5: Achieve gender equality and empower all women and girls.
Gender inequality is a persistent problem in Mexico, with onerous consequences in struc-tural, social and economic terms.
ADVANCES
• In 2017, women made up, on average, 42% of local legislatures (OPPMM, 2018).
• In 2016, 17.4% of the directors of government institutions were wom-en (National Government Census).
• Thirteen states adopted the minimum measures needed to bring state equal-ity policies up to national standards (Equality Platform, INMUJERES).
• Twenty-eight states no longer have exceptions in their legislation allow-
ing minors to get married (INMU-JERES, 2018).
• Women spend three times as much time as men on domestic work and other unpaid labor (ENUT, 2014).
• 43% of women aged 15 or older have entered the workforce, compared to 78% for men (ENOE, 2017).
• There is a pay gap between men and women of 5.1% (ENOE, 2017).
EMBLEMATIC ACTIONS
• The General Law on Equality Between Women and Men (LGIMH) guaran-tees and regulates equality of oppor-tunities and equal treatment between women and men.
• The General Law on the Right of Wom-en to a Violence-Free Life (LGAMVLV) prevents, punishes and eradicates vio-lence against women.
77

• Financing programs such as Small Business Women –a project of INMU-JERES, SHCP, INADEM and NAFIN– and the National Financing Program for Micro-entrepreneurs and Rural Women –a project of the SE– give women preferential access to credit.
• Article 41 of the Mexican Constitu-tion requires parity between women and men as candidates for local and federal legislatures.
• The 2013-2018 National Develop-ment Plan includes a holistic gender perspective.
• Mexico is one of the few countries to have a methodology for earmark-ing budgetary resources for gender equality.
CHALLENGES
• Strengthening systems for following up on resources earmarked for gen-der equality and the empowerment of women.
• Developing a methodology that stan-dardizes the data collected on femi-cides.
• Achieving the recognition, remunera-tion and equal redistribution between women and men of household labor, as well as guaranteeing full labor rights and protections for women and men who perform this work.
BOX 12: Complementary Positions for SDG 5 Expressed in the Review Process25
• CONAPRED estimates that there is a pay gap between men and women of 34%.
• Although Mexico is one of the few countries to have a methodology for earmarking budgetary resources for gender equality, the rules of opera-tion need to have a consistent meth-odology for evaluating a “gender per-spective” or “gender equality.”
• Equality must be promoted in the dis-tribution of tax payments and benefits to avoid negatively affecting women and girls.
• It is necessary to document and raise awareness of the problem of forced union and concubinage among wom-en under the age of 18.
• A methodology is needed to stan-dardize data on femicides.
• State governments must harmonize their laws and regulations with the National Policy on Equality Between Women and Men and with the coun-try’s most progressive legislation on sexual and reproductive health.
25 This box includes information suggested by the United Nations System and a variety of CSOs that deepens the discussion on this issue. Contributors are responsible for this information.
78

SDG 9: Build resilient infrastructure, promote inclusive and sustainable industrialization and foster innovation.
It is important for Mexico to increase the competitiveness of its businesses, consoli-date a modern and resilient transportation network and guarantee the presence of qual-ity communication infrastructure across the nation while maintaining sustainable eco-nomic development that incorporates the use of exponential technology to accelerate the implementation of the 2030 Agenda.
ADVANCES
• 11% of Mexico’s businesses are in the manufacturing sector, creating 25% of the country’s jobs and repre-senting 37% of its income (INEGI, 2016).
• 2.8% of small and medium manufac-turing enterprises are part of global production chains, compared to 8.4% for large enterprises (SE).
• The primary destination of direct for-eign investment is the manufacturing sector, with dynamism in the automo-tive sector and the aerospace industry.
• The federal highway network connects 66% of the population, 73% of the economically active population and 94% of gross total production (SCT).
• Mexico came in 51st place in the Glob-al Competitiveness Index 2017-2018.
• Total spending on research and development represented 0.50% of the GDP in 2016, triple the amount at the start of the current adminis-tration (CONACYT).
• 36.4% of the business community finances research and development spending (CONACYT, 2012).
• 4.2% of businesses develop techno-logical innovations (CONACYT, 2014).

• There are 365 researchers per million people (CONACYT, 2016).
• 63.9% of the population uses the internet, 45.3% uses computers and 72.2% uses mobile phones (INEGI).
• In 2016, Mexico received 910 million dollars through International Devel-opment Cooperation for infrastruc-ture development (AMEXCID).
EMBLEMATIC ACTIONS
• The National Infrastructure Program requires projects to be built in accor-dance with environmental, inclusive-ness and efficiency criteria.
• The Law for Promoting Sustained Productivity Increases and Economic Competitiveness promotes econom-ic growth, investment, productive infrastructure and technological con-tent, as well as added value products.
• The INADEM’s National Entrepreneur Fund supports projects for micro, small and medium-sized enterprises.
• The Mexico Connected Program offers free internet connections. The Shared Network will offer 4G tele-
communications services with cover-age that will reach at least 92% of the population by 2024. The Mexico Connected Points Project provides training and digital education. All three are operated by the SCT.
CHALLENGES
• Having a regulatory framework that properly encourages the growth of domestic businesses.
• Regulating the microfinance sector to increase the productivity of micro, small and medium-sized enterprises.
• Improving airport, aeronautic, highway, port, railway and highway capacity.
• Promoting capacity for technology adoption by businesses, as well as a culture of innovation and a long-term vision.
• Analyzing the impact of new technol-ogies such as artificial intelligence, in compliance with the 2030 Agenda, as technological backwardness can increase inequality, affect vulnerable populations and create ethical dilem-mas that threaten sustainable devel-opment.
80

SDG 14: Conserve and sustainably use the oceans, seas and marine resources for sustainable development.
Oceans, seas and coasts form an essential part of the country’s sustainable develop-ment. The resources they provide not only create jobs, but they also contribute to reg-ulating global temperatures and absorbing carbon dioxide. The pollution and degrada-tion of marine ecosystems has negative ef-fects in terms of quality of life and the coun-try’s social and economic development.
ADVANCES
• There are 37 Natural Protected Areas (ANPs) on Mexico’s coasts, represent-ing 22.05% of the seas under Mexican jurisdiction (SEMARNAT, 2017).
• In 2016, 0.4% of the total research budget was destined for marine tech-nology (CONACYT).
• Port and maritime transport activi-ties have steadily risen at an annual rate of 6.8% over the last ten years.
• Around 65% of fisheries are at maxi-mum output, while 10% have growth potential, 15% are in decline and 10% are recovering (SEMARNAT).
EMBLEMATIC ACTIONS
• The creation of new ANPs: 14.7 mil-lion hectares in the Revillagigedo National Park, 1 million hectares in the Pacific Islands Biosphere Reserve, 5.7 million hectares in the Mexican Caribbean Biosphere Reserve and
43.6 million hectares in the Mexican Pacific Deep Biosphere Reserve.
• Mexico has guiding documents on seas and coasts, such as the 2016-2030 National Strategy and Action Plan on Mexican Biodiversity, the 2016-2022 Integration Strategy for the Conservation and Sustainable Use of Biodiversity in the Fishing and Aquaculture Sector and the National Oceanographic Research Program.
• SEMARNAT’s Clean Beaches Program monitors water quality and the Let’s Clean Up Mexico Initiative organizes brigades to clean up public spaces, including rivers and beaches.
• Blue Flag certification of Mexican beaches (35 beaches and 2 marinas) establishes standards on quality, safety, education and environmental information.
• The prohibition of gill nets in the Upper Gulf of California contributes to the protection of marine fauna.
• Participatory Environmental Vigi-lance Committees care for and defend the natural resources of their communities.
CHALLENGES
• Guaranteeing that national planning has a comprehensive approach to watershed management to prevent the pollution of oceans via terrestrial sources.
• Expanding the capacity for conduct-ing inspections and demanding com-pliance with the law in industrial sec-tors responsible for pollution.
81

• Generating nationwide estimates on the magnitude of the impact and threat of coastal degradation caused by the use of agrochemicals, the exploitation of energy sources and maritime transport.
• Modifying legislation on the conser-vation and preservation of marine and coastal zones to ensure coher-ence and compliance.
• Designing a General Law on the Com-prehensive Management of Coastal and Marine Areas and a Regulation for the General Law on Sustainable Fishing and Aquaculture.
• Undertaking scientific research to gath-er information on the health of the oceans that will help orient decisions.
• Establishing a permanent system to evaluate the management of marine Natural Protected Areas.
BOX 13: Complementary Positions for SDG 14 Expressed in the Review Process26
• Steps must be taken to ensure that underwater mining and the exploita-tion of methane hydrates from beneath the sea floor do not cause environ-mental problems.
• Mexico must reduce hydrocarbon spills and atmospheric emissions of
greenhouse gases from offshore drilling platforms.
26 This box includes information suggested by the United Nations System and a variety of CSOs that deepens the discussion on this issue. Contributors are responsible for this information.
82

4.4 MEANS AND PARTNERSHIPS FOR IMPLEMENTING THE 2030 AGENDA
SDG 17: Strengthen the means of implementation and revitalize the global partnership for sustainable development.
Under the framework of its international development cooperation efforts, Mexico has worked on all aspects of financing for development, such as tax collection, debt sustainability, trade and investment. This has meant strengthening alliances with de-veloped countries, international organiza-tions and multilateral development banks, as well as other development actors, with the goal of mobilizing resources and obtain-ing knowledge to meet the SDGs.
ADVANCES
• Over the last five years, Mexico has granted an average of 250 million dollars each year for international development cooperation.
• In 2017, Mexico had 12 free trade agreements with 46 countries, giving it access to a market of 1.172 billion consumers around the world (SE, 2017).
• In 2017, non-petroleum exports rep-resented 93.1% of total exports (SE, 2017).
EMBLEMATIC ACTIONS
• The creation of the Alliance for Sus-tainability (AxS) between AMEXCID and the private sector.

• The Program for the Prevention of Unaccompanied Migration by Chil-dren and Adolescents in the Northern Triangle of Central America has been undertaken by Mexico and Germany to benefit the Northern Triangle of Central America.
• The Open Government Partnership promotes gender equality, transpar-ency, accountability, citizen partici-pation and innovation as tools for better governability.
• The Strategy for Promoting Pub-lic-Private Partnerships complements the government’s efforts to develop infrastructure and provide goods and services demanded by society.
• Mexico has an Action Plan under the framework of the Global Partnership to End Violence Against Children. This initiative is promoted by a vari-ety of actors, including governments, international organizations and civil society, and aims to reduce child abuse and exploitation.
• At the multilateral level, Mexico signed on to Resolution 77/242, “The Impact of Rapid Technological Change on the Achievement of the Sustain-able Development Goals,” which
establishes that the United Nations, in collaboration with academia, civil soci-ety and the private sector, must ana-lyze the impact of rapid technological change, artificial intelligence and automatization on the implementa-tion of the 2030 Agenda.
CHALLENGES
• Earmarking additional expenses in the budget for knowledge exchanges with other countries and strengthen-ing inter-institutional coordination.
• Updating trade regulations and the legal framework to ensure consisten-cy between national and international regulations, as well as that Mexican products and services meet the stan-dards demanded in other markets.
• Strengthening the government’s capac-ity to process paperwork and promot-ing closer collaborations between the government, academia, the private sec-tor, civil society and other development actors in a way that goes beyond each presidential administration.

MEANS OF IMPLEMENTING THE SDGs
In Mexico, the first step towards mobilizing resources that contribute to reaching the SDGs has been to link public spending with the 2030 Agenda. This has allowed us to identify critical lacunae and evaluate the re-sources needed to delineate a budgetary planning strategy focused on sustainable development.
As part of the national strategy to mobilize financial resources in order to meet the SDGs, the OPR, in collaboration with other federal agencies, is working on three lines of action:
1. Modifying fiscal policy in terms of revenue generation.
2. Modifying fiscal policy in terms of spending.
3. Mobilizing national resources. In a complementary fashion, the OPR is pro-moting a proposal to introduce green, social and sustainable bonds in Mexico, that will also contribute to compliance with the 2030 Agenda and the Paris Agreement.
At the global level, with the goal of contrib-uting to dialogue and promoting positive re-sults at the Forum on Financing for Develop-ment and following up on the Addis Ababa Action Agenda, Mexico has been the site of three retreats of the Group of Friends in Monterrey, Mexico City (2016 and 2017), and Oaxaca (2018). This is a space for dia-logue that addresses international commit-ments that contribute to the implementa-tion of the 2030 Agenda and the mobilization of all sources of financing.
INTERNATIONAL COOPERATION FOR IMPLEMENTING THE SDGs
Mexico participates in international develop-ment cooperation through AMEXCID. One of its functions is to contribute to the exchange of good practices and skills through bilateral, regional, multilateral, north-south, south-south and triangular cooperation mecha-nisms. AMEXCID has taken on the responsi-bility of aligning the cooperation accepted and offered by Mexico with the 2030 Agen-da, as well as incentivizing the participation of various international development coop-eration actors.
Over the last five years, Mexico has granted an average of 250 million dollars each year for international development cooperation. In 2017, Mexico carried out 595 interna-tional development cooperation projects in fields connected to the SDGs, such as cli-mate action, education, health and energy, among others.
Another tool that contributes to reaching the SDGs is the Catalog of Mexican Capac-ities, which was prepared by AMEXCID and other institutions to provide information on best practices and incentivize the offer of international development cooperation: it currently includes 110 initiatives. Mexico has also created alliances with Central American and Caribbean countries, particu-larly on issues such as climate change and resilience, as well as with Germany, Canada, Spain, the United States of America, France, Italy, Japan, the United Kingdom and Euro-pean Union member states. It also cooper-ates with international agencies that have a presence in Mexico, multilateral develop-ment banks and other development actors.
85

Mexico has given special importance to the creation of regional and thematic strategies to increase the impact of Mexican coopera-tion in Latin America and the Caribbean, such as the cooperation strategy for the Northern Triangle of Central America, which was launched following the successes seen in the Mesoamerican Project and the Con-ference on Prosperity and Security in Central America (2017); the Hunger-Free Meso-america Program, which has become a refer-ence for the rest of Latin America; the Mexi-co-CARICOM Strategy for Comprehensive Disaster Risk Management, Resilience and Reconstruction; the Franco-Mexican Initia-tive to support adaptation and resilience to climate change in the Caribbean; and the strategy for designing and presenting proj-ects from Caribbean countries to the Green Climate Fund (GCF) and the Global Environ-mental Fund (GEF).
In regional terms, Mexico belongs to the Forum of Latin American and Caribbean Countries on Sustainable Development (FPALCDS), a regional mechanism for fol-lowing up on the 2030 Agenda and the Ad-dis Ababa Action Agenda.
Within the framework of the Economic Commission for Latin America and the Ca-ribbean (ECLAC), Mexico has promoted the establishment of a network to strengthen the ability of countries to implement and follow up on the 2030 Agenda for Sustain-able Development in the region. This net-work has the goal of sharing experiences and strengthening institutional and techni-cal capacities of governments, which will help align international cooperation strate-gies with the SDGs.
Mexico participated in the OECD publica-tion titled Policy Coherence for Sustainable Development 2018: Towards Sustainable and Resilient Societies, which collects the experiences of many countries and the in-stitutional agreements for the implementa-tion of the 2030 Agenda.
Mexico also participated in the first round of the Voluntary Peer Learning Mechanism on the Implementation of the 2030 Agen-da. As part of this process, Mexico partici-pated in two groups, one with Germany and China on the alignment of national strate-gies and policy coherence for the imple-mentation of the 2030 Agenda, and anoth-er with Norway and the Netherlands on the role of the private sector. These sessions were held between September 2017 and April 2018 and resulted in the preparation of two documents, which will be presented to the development working group at the 2018 G20 summit in Argentina.
PARTNERSHIPS
Mexico has many national alliances that fall under the framework of the 2030 Agenda, such as the Alliance for Sustainability, CO-NAGO’s 2030 Agenda Executive Imple-mentation Commission and the Sustainable Development Solutions Network (SDSN), which will be launched under the oversight of the UNAM in 2018.
In terms of partnerships with CSOs, there is the International Coalition for Development Action Mexico (CAIDMEX), an alliance be-tween domestic and Mexico-based interna-tional CSOs that has the goal of implement-
86

ing the SDGs. Outreach has also been made to the Civil Society Coordinating Space for Following Up on the 2030 Agenda in Mexi-co, among others. Despite the existence of these spaces for collaboration among CSOs, more partnerships between the govern-ment and CSOs under the framework of the 2030 Agenda should be institutionalized.
At the international level, Mexico is a mem-ber of a variety of alliances, such as the German government’s Partners for Review network, which monitors the SDGs; the Partnering for Green Growth and the Glob-
al Goals 2030 network, which supports public-private partnerships for the imple-mentation of the SDGs; the Global Part-nership for Effective Development Cooper-ation, which seeks to share experiences with international development coopera-tion; the Global Partnership to End Vio-lence Against Children, which contributes to the implementation of SDGs 16 and 17; the NDC Partnership, which aims to im-prove cooperation on SDG 13; and the Pa-cific Alliance (which includes Chile, Colom-bia, Mexico and Peru), which is working towards the establishment of sustainabili-ty criteria for public acquisitions.
87


V. CONCLUSIONS
5.1 STATE COMMITMENT AND CONTINUITY
Ever since Mexico assumed the 2030 Agen-da as a state commitment, it has undertak-en many measures for its implementation. Through political will at the highest level, the groundwork has been laid to ensure the continuity of these transformations over time. The process of preparing a National Strategy with objectives, goals and priori-ties that are defined through a shared diag-nostic and the participation of different sectors has laid out the path towards the future.
Nevertheless, many major challenges re-main. It is necessary to strengthen capaci-ties at all levels to eliminate asymmetries and work towards achieving a shared vision. Sustainable development not only requires efforts from all sectors, but above all, the commitment of all parties to remain in col-laboration.
Another challenge is the adoption of the 2030 Agenda by all actors. To confront this, it is essential to improve outreach, aware-ness and mobilization efforts for the SDGs. Mechanisms are also needed that facilitate the participation of state and municipal governments. Achieving these goals de-pends on the existence of partnerships and collaborations, as well as coordination be-tween different levels of government.
Placing people at the center of all actions en-sures a bottom-up transformation founded on trust and alliance-building. Only based on evidence, we will be able to find the best ways to transform our development reality. Defining, updating and disaggregating indi-cators for following up on the SDGs is essen-tial to evaluating the impact of policies. Inno-vation requires new sources of information,
89

technologies and big data,27 as well as com-prehensive financing for economic, social and environmental development.
27 National averages may hide inequalities. For this reason, it is essential to disaggregate data when monitoring and evaluating progress on goals. Furthermore, though big data can be useful, it is vital to leave no one behind and to ensure the representation of all members of society when measuring advancement towards the SDGs. Many sources of data require literacy and access to the internet or cellular services, which can exclude vulnerable groups. Big data should therefore be used with care, and only in combination with other sources of information that guarantee the representation of all mem-bers of society. This disaggregation requires the perspectives of statistical experts, civil society organizations, national human rights institutions, service providers and marginalized populations.
The success of these paths will lie not only in their ability to lead to concrete actions that contribute to sustainability, but also in their capacity to constantly transform them-selves in accordance with new realities.
5.2 NEXT STEPS
In accordance with the National Council for the 2030 Agenda for Sustainable Develop-ment’s yearly program of activities, ap-proved on May 31, 2018, the initial draft of the National Strategy for the Implementa-tion of the 2030 Agenda will be submitted for public review. This document will define priorities, goals, indicators and challenges, as well as the roles and functions of differ-
90
ent actors, incorporating the vision of dif-ferent sectors. Inter-institutional working groups will also be created to hold discus-sions on goals and indicators that will be based on the inputs provided by the Spe-cialized Technical Committee on the Sus-tainable Development Goals (CTEODS) and the contributions of a variety of sectors.
The National Strategy could also be consol-idated as a tool to be used as a base for elaborating the 2019-2024 National De-velopment Plan and future federal budgets. Furthermore, to ensure that the 2030 Agen-da becomes a reality at the state and munic-ipal levels, it is important for the OSIs to have practical tools that allow them to transform the territories under their jurisdiction.
To the historic challenges of Mexico’s dif-ferent regions, we can add the efforts to protect natural resources and mitigate the adverse effects of climate change. The rise in global temperatures will only remain be-low 2ºC if we reduce fossil fuel use and transform systems of consumption and production around the world.
Lastly, it is also necessary to be increasing-ly ambitious when implementing the 2030 Agenda. To achieve this, instead of being barries, we must make accelerated techno-logical change, artificial intelligence and au-tomatization into enablers of sustainable development.
91

GLOSSARY OF ABBREVIATIONS
AMC Mexican Academy of Sciences AMEXCID Mexican Agency for International Development CooperationANP Natural Protected AreasANUIES National Association of Universities and Higher Education Institutions AVGM Violence Against Women AlertAxS Alliance for Sustainability BP Budgetary ProgramsBUR Biennial Update ReportCAIDMEX International Coalition for Development Action – MexicoCARICOM Caribbean CommunityCCE Business Coordinating CouncilCDI National Commission for the Development of Indigenous PeoplesCEEPS Center for Private Sector Economic StudiesCEAV Executive Victim Support CommissionCEIDAS Center for the Study of Development and Social ServicesCENAPRED National Disaster Prevention CenterCFE Federal Electric CommissionCIDE Center for Research and Teaching in EconomicsCJEF Legal Counsel to the PresidentCJM Centers for Women’s JusticeCNDH National Human Rights CommissionCNDHE State Human Rights CensusCNDHF Federal Human Rights CensusCNIJE State Justice Administration CensusCNP National Productivity CommitteeCNPJE State Justice Prosecution CensusCONABIO Mexican Commission for the Knowledge and Use of Biodiversity CONACYT National Council of Science and TechnologyCONAFOR National Forestry CommissionCONAGO National Governors Conference CONAGUA National Water CommissionCONANP National Commission on Natural Protected AreasCONAPO National Population Council
93

CONAPRED National Council for the Prevention of DiscriminationCONAVI National Housing CommissionCONAVIM National Commission for Preventing and Eradicating Violence Against WomenCONEVAL National Council for the Evaluation of Social Development Policy CPI City Prosperity Initiative CTEODS Specialized Technical Committee on the Sustainable Development GoalsCTESIODM Specialized Technical Committee for the Millennium Development Goals DGVOSC Department of Outreach to Civil Society OrganizationsDIF Family Development InstituteECLAC Economic Commission for Latin America and the CaribbeanENADID National Demographic Dynamics StudyENADIS National Discrimination StudyENAPEA National Strategy for the Prevention of Teen Pregnancy ENAPROCE National Study on the Productivity and Competitiveness of Micro, Small and Medium-Sized EnterprisesENCODAT National Study on the Consumption of Drugs, Alcohol and TobaccoENDIREH National Study on Intra-Family DynamicsENI National Inclusion StrategyENIGH National Study on Household Income and ExpensesENIM National Study on Women and Children in MexicoENOE National Study on Jobs and EmploymentFCCyT Science and Technology Consultative ForumFDI Foreign Direct InvestmentFRA Global Forest Resources AssessmentGCF Green Climate FundGDP Gross Domestic ProductGEF Global Environmental FundGIZ Gesellschaft für Internationale ZusammenarbeitHLPF High-Level Political ForumICESCR International Covenant on Economic, Social and Cultural Rights IDB Inter-American Development BankIDC International Development CooperationIMJUVE Mexican Youth InstituteINAFED National Institute for Federalism and Municipal Development INDESOL National Institute of Social Development INECC National Ecology and Climate Change InstituteINEE National Institute for the Evaluation of EducationINEGI National Institute of Statistics and Geography INFONAVIT National Workers’ Housing Fund InstituteINIFED National Educational Infrastructure InstituteINMUJERES National Women’s InstituteINSP National Public Health Institute
94
LGAMVLV General Law on the Right of Women to a Violence-Free LifeLGBTI Lesbian, Gay, Bisexual, Trans, IntersexLGIMH General Law on Equality Between Women and MenLNPP National Public Policy LabMC Citizens’ MovementMORENA National Renewal MovementNDP National Development Plan CSO Civil Society OrganizationOECD Organisation for Economic Cooperation and DevelopmentOPR Office of the President of the Republic OSI Implementation and Follow-Up AgencyPACE Species Conservation Action ProgramPAN National Action PartyPES Social Encounter PartyPLANEA National Plan for the Evaluation of LearningPRD Democratic Revolution PartyPRI Institutional Revolutionary PartyPROCAPTAR National Rainwater Collection and Green Technology in Rural Areas ProgramPRODI Comprehensive Water and Sanitation Agency Development PlanPROII Indigenous Infrastructure ProgramPT Labor PartyREDIM Mexican Children’s Rights NetworkRENE National Emissions RegistryRIF Tax Incorporation RegimeSAGARPA Agriculture, Livestock, Fisheries and Food SecretariatSDG Sustainable Development Goal SDSN Sustainable Development Solutions Network SE Secretariat of the EconomySEDATU Agrarian, Land and Urban Development SecretariatSEDESOL Social Development SecretariatSEGOB Interior SecretariatSEMARNAT Environmental and Natural Resources SecretariatSENER Energy SecretariatSEP Public Education SecretariatSEZ Special Economic ZonesSHCP Finance and Public Credit SecretariatSIPINNA National System for the Comprehensive Protection of Children and Adolescents SISI Comprehensive Social Information System SNE National Employment ServiceSRE Foreign Affairs SecretariatSSA Health Secretariat
95

STPS Labor and Social Welfare Secretariat UGH Shared Responsibility UnitUIA Ibero-American UniversityUN United NationsUNAM National Autonomous University of MexicoUNDP United Nations Development Programme UNICEF United Nations Children’s FundUNHCR United Nations High Commissioner for Refugees VNR Voluntary National ReviewWHO World Health Organization
96

The National Governors’ Conference (CONAGO) installed the 2030 Agenda Executive Implementation Commission (June 15, 2017). This Commission, coordinated by the state government of Colima, has contributed to implementing the SDGs at the state level. Furthermore,
it will foster sharing of experiences, collaborative actions, and the development of monitoring, follow-up and review mechanisms.

Top: The First Ordinary Session of the National Council for the 2030 Agenda for Sustainable Development (May 31, 2018). Middle and buttom: For the drafting of the initial document of the National Strategy for the Implementation of the 2030 Agenda, five regional dialogues were held with civil society organizations
–in Mexico City, Colima, Mazatlán, Monterrey and Tuxtla Gutiérrez– in order to introduce the 2030 Agenda and adopt its perspectives, priorities and concerns.

APPENDIX

This appendix contains 58 global indicators that Mexico is monitoring on its official SDG platform (www.agenda2030.mx). Some of them, due to their nature, have been disaggre-gated into more than one indicator.
SDG 1: END POVERTY IN ALL ITS FORMS EVERYWHERE
INDICATOR BASELINE LAST INFORMATION AVAILABLE UNIT SOURCE
GOAL 1.1.
By 2030, eradicate extreme poverty for all people everywhere, currently measured as people living on less than $1.25 a day
Indicator 1.1.1.
Proportion of population living below the international poverty line, by sex, age, employment status and geo-graphical location (urban/rural)
6.4
N/A PercentageCONEVAL,
INEGI, ENIGH2014
GOAL 1.2.
By 2030, reduce at least by half the proportion of men, women and children of all ages living in poverty in all its dimensions according to national definitions
Indicator 1.2.1.
Proportion of population living below the national poverty line, by sex and age
53.2N/A Percentage CONEVAL,
MCS-ENIGH2014
Indicator 1.2.2.
Proportion of men, women and chil-dren of all ages living in poverty in all its dimensions according to national definitions
46.2
N/A Percentage CONEVAL, MCS-ENIGH
2014
GOAL 1.5.
By 2030, build the resilience of the poor and those in vulnerable situations and reduce their exposure and vul-nerability to climate-related extreme events and other economic, social and environmental shocks and disas-ters
Indicator 1.5.1.
Number of deaths, missing and directly affected persons attributed to disas-ters per 100,000 population
2,358.5 4,469.70 Rate per 100,000
inhabitants
SEGOB, CONAPO,
CENAPRED2015 2016
APPENDIX 1
101

SDG 1: END POVERTY IN ALL ITS FORMS EVERYWHERE
INDICATOR BASELINE LAST INFORMATION AVAILABLE UNIT SOURCE
GOAL 1.A.
Ensure significant mobilization of resources from a variety of sources, including through enhanced development cooperation, in order to provide adequate and predictable means for developing countries, in particular least developed countries, to implement programmes and policies to end poverty in all its dimensions
Indicator 1.a.2.
Proportion of total government spend-ing on essential services (education, health and social protection)
38.0 36.2Percentage
SHCP
2015 2016
SDG 2: END HUNGER, ACHIEVE FOOD SECURITY AND IMPROVED NUTRITION AND PROMOTE SUSTAINABLE AGRICULTURE
INDICATOR BASELINE LAST INFORMATION AVAILABLE UNIT SOURCE
GOAL 2.1.
By 2030, end hunger and ensure access by all people, in particular the poor and people in vulnerable situations, including infants, to safe, nutritious and sufficient food all year round
Indicator 2.1.2.
Prevalence of moderate or severe food insecurity in the population, based on the Food Insecurity Experience Scale (FIES)
23.4
N/A Percentage CONEVAL
2014
SDG 3: ENSURE HEALTHY LIVES AND PROMOTE WELL-BEING FOR ALL AT ALL AGES
INDICATOR BASELINE LAST INFORMATION AVAILABLE UNIT SOURCE
GOAL 3.1.
By 2030, reduce the global maternal mortality ratio to less than 70 per 100,000 live births
Indicator 3.1.1.
Maternal mortality ratio
34.6N/A
Maternal deaths per 100,000
live births
SSA, DGIS
2015
Indicator 3.1.2.
Proportion of births attended by skilled health personnel
98.2 98.0Percentage SSA, DGIS
2015 2016
GOAL 3.2.
By 2030, end preventable deaths of newborns and children under 5 years of age, with all countries aiming to reduce neonatal mortality to at least as low as 12 per 1,000 live births and under-five mortality to at least as low as 25 per 1,000 live births
Indicator 3.2.1.
Mortality rate, under-5
15.1N/A
Mortality rate, under-5 (per
1,000 live births)
SSA, DGIS
2015
102

SDG 3: ENSURE HEALTHY LIVES AND PROMOTE WELL-BEING FOR ALL AT ALL AGES
INDICATOR BASELINE LAST INFORMATION AVAILABLE UNIT SOURCE
GOAL 3.3.
By 2030, end the epidemics of AIDS, tuberculosis, malaria and neglected tropical diseases and combat hepatitis, water-borne diseases and other communicable diseases
Indicator 3.3.3.
Incidence of malaria per 1,000 population
0.4N/A Per 100,000
inhabitantsSSA,
CENAPRECE2015
GOAL 3.7.
By 2030, ensure universal access to sexual and reproductive health-care services, including for family planning, information and education, and the integration of reproductive health into national strategies and programmes
Indicator 3.7.1.
Proportion of women of reproductive age (aged 15–49 years) who have their need for family planning satisfied with modern methods
81.56
N/A Percentage CONAPO, ENADID
2014
Indicator 3.7.2.a.
Adolescent birth rate (aged 10–14 years) per 1,000 women in that age group
1.6 1.6 Number of births per
1,000 women in this age group
CONAPO, INEGI2015 2016
Indicator 3.7.2.b.
Adolescent birth rate (aged 15–19 years) per 1,000 women in that age group
65.5 65.4 Number of births per
1,000 women in this age group
CONAPO2015 2016
SDG 4: ENSURE INCLUSIVE AND EQUITABLE QUALITY EDUCATION AND PROMOTE LIFELONG LEARNING OPPORTUNITIES FOR ALL
INDICATOR BASELINE LAST INFORMATION AVAILABLE UNIT SOURCE
GOAL 4.4.
By 2030, substantially increase the number of youth and adults who have relevant skills, including technical and vocational skills, for employment, decent jobs and entrepreneurship
Indicator 4.4.1.
Proportion of youth and adults with information and communications technology (ICT) skills, by type of skill:
Copy files from one folder to another35.7
N/A Percentage ITF
2016
Create text files38.0
2016
Create spreadsheets25.6
2016
Create presentations31.0
2016
103

SDG 4: ENSURE INCLUSIVE AND EQUITABLE QUALITY EDUCATION AND PROMOTE LIFELONG LEARNING OPPORTUNITIES FOR ALL
INDICATOR BASELINE LAST INFORMATION AVAILABLE UNIT SOURCE
GOAL 4.4.
By 2030, substantially increase the number of youth and adults who have relevant skills, including technical and vocational skills, for employment, decent jobs and entrepreneurship
Indicator 4.4.1.
Proportion of youth and adults with information and communications technology (ICT) skills, by type of skill:
Create / use databases23.5
N/A Percentage ITF
2016
Download content from the internet (music, videos, documents, etc.)
40.3
2016
Send and receive emails35.4
2016
Install accessories (printers, projectors, etc.)
21.5
2016
SDG 5: ACHIEVE GENDER EQUALITY AND EMPOWER ALL WOMEN AND GIRLS
INDICATOR BASELINE LAST INFORMATION AVAILABLE UNIT SOURCE
GOAL 5.1.
End all forms of discrimination against all women and girls everywhere
Indicator 5.1.1.
Whether or not legal frameworks are in place to promote, enforce and monitor equality and non-discrimina-tion on the basis of sex
68.8 75.0
Percentage INMUJERES, SCJN
2015 2016
GOAL 5.2.
Eliminate all forms of violence against all women and girls in the public and private spheres, including trafficking and sexual and other types of exploitation
Indicator 5.2.1.a.
Proportion of ever-partnered women and girls aged 15 years and older sub-jected to physical, sexual or psycho-logical violence by a current or former intimate partner in the previous 12 months, by form of violence and by state
24.7
N/A
Percentage of women who
suffered at least one incident of physical, sexual
or emotional violence
INEGI, ENDIREH
2011
Indicator 5.2.1.b.
Proportion of ever-partnered women and girls aged 15 years and older subjected to physical, sexual or psychological violence by a current or former intimate partner in the previous 12 months, by form of vio-lence and by age
28.1
N/A
Percentage of women who
suffered at least one incident of physical, sexual
or emotional violence
INEGI, ENDIREH
2011
104

SDG 5: ACHIEVE GENDER EQUALITY AND EMPOWER ALL WOMEN AND GIRLS
INDICATOR BASELINE LAST INFORMATION AVAILABLE UNIT SOURCE
GOAL 5.2.
Eliminate all forms of violence against all women and girls in the public and private spheres, including trafficking and sexual and other types of exploitation
Indicator 5.2.2.a.
Proportion of women and girls aged 15 years and older subjected to sexual violence by persons other than an intimate partner in the previ-ous 12 months, by state and place of occurrence
15.2
N/A
Percentage of women who
suffered at least one incident
INEGI, ENDIREH
2011
Indicator 5.2.2.b.
Proportion of women and girls aged 15 years and older subjected to sexual violence by persons other than an intimate partner in the previ-ous 12 months, by age and place of occurrence
19.4
N/A
Percentage of women who
suffered at least one incident
INEGI, ENDIREH
2011
GOAL 5.3.
Eliminate all harmful practices, such as child, early and forced marriage and female genital mutilation
Indicator 5.3.1.
Proportion of women aged 20–24 years who were married or in a union
Before age 153.7
N/A Percentage INEGI, ENADID
2014
Before age 1821.4
2014
GOAL 5.5.
Ensure women’s full and effective participation and equal opportunities for leadership at all levels of decision making in political, economic and public life
Indicator 5.5.1.a.
Proportion of seats held by women in the Chamber of Deputies
39.8 42.4Percentage Chamber of
Deputies2015 2016
Indicator 5.5.1.b.
Proportion of governorships held by women
3.125 3.125Percentage CONAGO
2015 2016
Indicator 5.5.1.c.
Proportion of judgeships held by women
41.1N/A Percentage
INEGI-State Justice
Administration Census2015
Indicator 5.5.1.d.
Proportion of mayoralties held by women
9.43 14.18
Percentage
INMUJERES, Mexican
Observatory on Political
Participation by Women
2015 2016
Indicator 5.5.2.
Proportion of women in managerial positions
34.0 36.1Percentage INEGI, ENOE
2015 2016
105
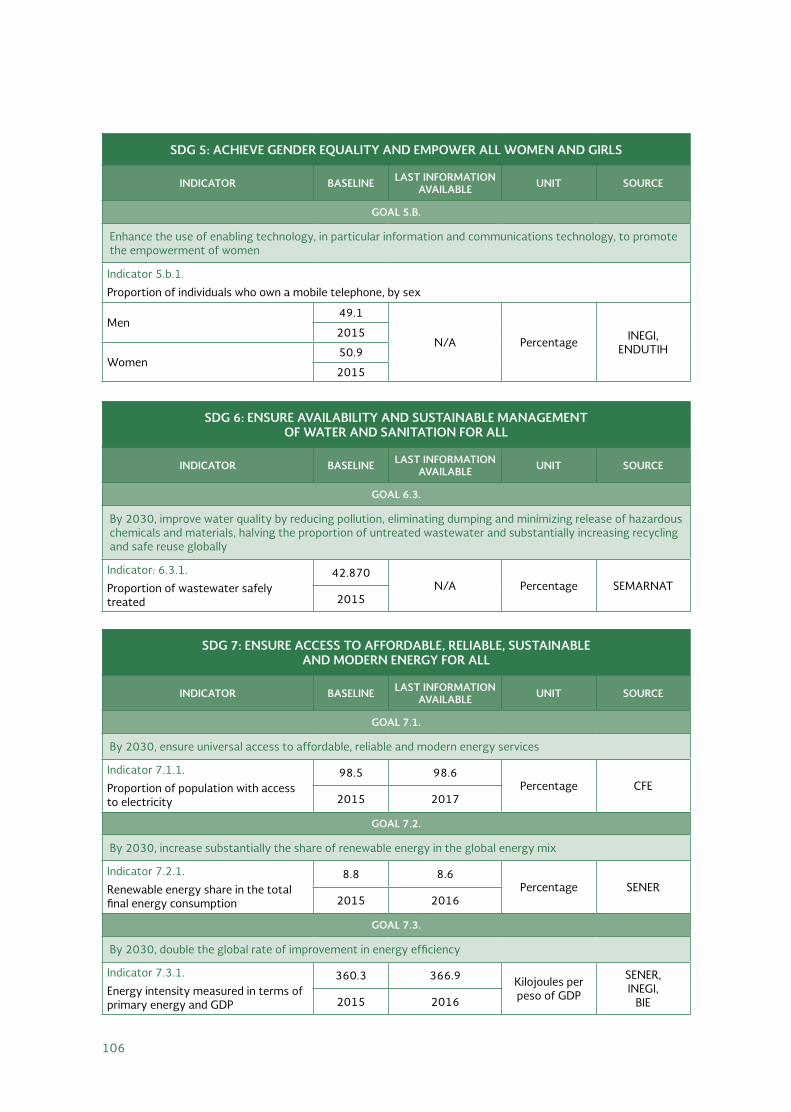
SDG 5: ACHIEVE GENDER EQUALITY AND EMPOWER ALL WOMEN AND GIRLS
INDICATOR BASELINE LAST INFORMATION AVAILABLE UNIT SOURCE
GOAL 5.B.
Enhance the use of enabling technology, in particular information and communications technology, to promote the empowerment of women
Indicator 5.b.1.
Proportion of individuals who own a mobile telephone, by sex
Men49.1
N/A Percentage INEGI, ENDUTIH
2015
Women50.9
2015
SDG 6: ENSURE AVAILABILITY AND SUSTAINABLE MANAGEMENT OF WATER AND SANITATION FOR ALL
INDICATOR BASELINE LAST INFORMATION AVAILABLE UNIT SOURCE
GOAL 6.3.
By 2030, improve water quality by reducing pollution, eliminating dumping and minimizing release of hazardous chemicals and materials, halving the proportion of untreated wastewater and substantially increasing recycling and safe reuse globally
Indicator: 6.3.1.
Proportion of wastewater safely treated
42.870N/A Percentage SEMARNAT
2015
SDG 7: ENSURE ACCESS TO AFFORDABLE, RELIABLE, SUSTAINABLE AND MODERN ENERGY FOR ALL
INDICATOR BASELINE LAST INFORMATION AVAILABLE UNIT SOURCE
GOAL 7.1.
By 2030, ensure universal access to affordable, reliable and modern energy services
Indicator 7.1.1.
Proportion of population with access to electricity
98.5 98.6Percentage CFE
2015 2017
GOAL 7.2.
By 2030, increase substantially the share of renewable energy in the global energy mix
Indicator 7.2.1.
Renewable energy share in the total final energy consumption
8.8 8.6Percentage SENER
2015 2016
GOAL 7.3.
By 2030, double the global rate of improvement in energy efficiency
Indicator 7.3.1.
Energy intensity measured in terms of primary energy and GDP
360.3 366.9 Kilojoules per peso of GDP
SENER, INEGI,
BIE2015 2016
106

SDG 8: PROMOTE SUSTAINED, INCLUSIVE AND SUSTAINABLE ECONOMIC GROWTH, FULL AND PRODUCTIVE EMPLOYMENT AND DECENT WORK FOR ALL
INDICATOR BASELINE LAST INFORMATION AVAILABLE UNIT SOURCE
GOAL 8.2.
Achieve higher levels of economic productivity through diversification, technological upgrading and innovation, including through a focus on high-value added and labour-intensive sectors
Indicator 8.2.1.
Annual growth rate of real GDP per employed person
-2.4 2.4Percentage STPS
2015 2016
GOAL 8.3.
Promote development-oriented policies that support productive activities, decent job creation, entrepreneur-ship, creativity and innovation, and encourage the formalization and growth of micro-, small- and medium- sized enterprises, including through access to financial services
Indicator 8.3.1.
Proportion of informal employment in non-agriculture employment, by sex
53.0 52.5Percentage INEGI,
STPS2015 2016
GOAL 8.5.
By 2030, achieve full and productive employment and decent work for all women and men, including for young people and persons with disabilities, and equal pay for work of equal value
Indicator 8.5.2
Unemployment rate, by sex, age and persons with disabilities
4.3 3.9Percentage STPS
2015 2016
GOAL 8.7.
Take immediate and effective measures to eradicate forced labour, end modern slavery and human trafficking and secure the prohibition and elimination of the worst forms of child labour, including recruitment and use of child soldiers, and by 2025 end child labour in all its forms
Indicator 8.7.1.
Proportion and number of children aged 5–17 years engaged in child labour, by sex and age
7.5N/A Percentage INEGI, STPS
2015
GOAL 8.8.
Protect labour rights and promote safe and secure working environments for all workers, including migrant workers, in particular women migrants, and those in precarious employment
Indicator 8.8.1.
Frequency rates of fatal and non-fatal occupational injuries, by sex and migrant status
2.5 2.2Percentage STPS
2015 2016
GOAL 8.10.
Strengthen the capacity of domestic financial institutions to encourage and expand access to banking, insur-ance and financial services for all
Indicator 8.10.1.a.
Number of commercial bank branches per 100,000 adults
14.0N/A Rate per
100,000 adults IMF2014
107

SDG 8: PROMOTE SUSTAINED, INCLUSIVE AND SUSTAINABLE ECONOMIC GROWTH, FULL AND PRODUCTIVE EMPLOYMENT AND DECENT WORK FOR ALL
INDICATOR BASELINE LAST INFORMATION AVAILABLE UNIT SOURCE
GOAL 8.10.
Strengthen the capacity of domestic financial institutions to encourage and expand access to banking, insur-ance and financial services for all
Indicator 8.10.1.b.
Number of automated teller machines (ATMs) per 100,000 adults
50.7N/A Rate per
100,000 adults IMF2015
Indicator 8.10.2.
Proportion of adults (15 years and older) with an account at a bank or other financial institution or with a mobile-money-service provider
39.13
N/A Percentage World Bank
2014
SDG 9: BUILD RESILIENT INFRASTRUCTURE, PROMOTE INCLUSIVE AND SUSTAINABLE INDUSTRIALIZATION AND FOSTER INNOVATION
INDICATOR BASELINE LAST INFORMATION AVAILABLE UNIT SOURCE
GOAL 9.2.
Promote inclusive and sustainable industrialization and, by 2030, significantly raise industry’s share of employ-ment and gross domestic product, in line with national circumstances, and double its share in least developed countries
Indicator 9.2.2.
Manufacturing employment as a proportion of total, by sex
Men16.4 16.5
Percentage INEGI, STPS
2015 2016
Women15.5 15.9
2015 2016
GOAL 9.4.
By 2030, upgrade infrastructure and retrofit industries to make them sustainable, with increased resource-use efficiency and greater adoption of clean and environmentally sound technologies and industrial processes, with all countries taking action in accordance with their respective capabilities
Indicator 9.4.1.
CO2 emission per unit of value added
0.326
N/A Kilograms per dollar
SEMARNAT, INECC,
Department of Low Carbon
Development Models, INEGI,
National Accounting System of
Mexico
2013
108

SDG 9: BUILD RESILIENT INFRASTRUCTURE, PROMOTE INCLUSIVE AND SUSTAINABLE INDUSTRIALIZATION AND FOSTER INNOVATION
INDICATOR BASELINE LAST INFORMATION AVAILABLE UNIT SOURCE
GOAL 9.5.
Enhance scientific research, upgrade the technological capabilities of industrial sectors in all countries, in partic-ular developing countries, including, by 2030, encouraging innovation and substantially increasing the number of research and development workers per 1 million people and public and private research and development spending
Indicator 9.5.1.
Research and development expendi-ture as a proportion of GDP
0.53 0.51Percentage CONACYT,
ESIDET2015 2016
Indicator 9.5.2.
Researchers (in full-time equivalent) per million inhabitants
362.2 365.0 Investigators per million inhabitants
CONACYT, DAPE
2015 2016
SDG 11: MAKE CITIES AND HUMAN SETTLEMENTS INCLUSIVE, SAFE, RESILIENT AND SUSTAINABLE
INDICATOR BASELINE LAST INFORMATION AVAILABLE UNIT SOURCE
GOAL 11.5.
By 2030, significantly reduce the number of deaths and the number of people affected and substantially decrease the direct economic losses relative to global gross domestic product caused by disasters, including water-related disasters, with a focus on protecting the poor and people in vulnerable situations
Indicator 11.5.1.
Number of deaths, missing and directly affected persons attributed to disas-ters per 100,000 population
2,358.5 4,469.7 Rate per 100,000
inhabitants
SEGOB, CONAPO,
CENAPRED2015 2016
SDG 13: TAKE URGENT ACTION TO COMBAT CLIMATE CHANGE AND ITS IMPACTS
INDICATOR BASELINE LAST INFORMATION AVAILABLE UNIT SOURCE
GOAL 13.1.
Strengthen resilience and adaptive capacity to climate-related hazards and natural disasters in all countries
Indicator 13.1.1.
Number of deaths, missing persons and directly affected persons attributed to disasters per 100,000 population
2,358.5 4,469.7 Rate per 100,000
inhabitants
SEGOB, CONAPO,
CENAPRED2015 2016
109

SDG 14: CONSERVE AND SUSTAINABLY USE THE OCEANS, SEAS AND MARINE RESOURCES FOR SUSTAINABLE DEVELOPMENT
INDICATOR BASELINE LAST INFORMATION AVAILABLE UNIT SOURCE
GOAL 14.5.
By 2020, conserve at least 10 per cent of coastal and marine areas, consistent with national and international law and based on the best available scientific information
Indicator 14.5.1.Coverage of protected areas in relation to marine areas
1.54 1.54Percentage SEMARNAT
2015 2016
GOAL 14.A.
Increase scientific knowledge, develop research capacity and transfer marine technology, taking into account the Intergovernmental Oceanographic Commission Criteria and Guidelines on the Transfer of Marine Technol-ogy, in order to improve ocean health and to enhance the contribution of marine biodiversity to the develop-ment of developing countries, in particular small island developing States and least developed countries
Indicator 14.a.1.Proportion of total research budget allocated to research in the field of marine technology
0.2 0.4Percentage CONACYT
2015 2016
SDG 15: PROTECT, RESTORE AND PROMOTE SUSTAINABLE USE OF TERRESTRIAL ECOSYSTEMS, SUSTAINABLY MANAGE FORESTS, COMBAT DESERTIFICATION, AND HALT AND REVERSE LAND
DEGRADATION AND HALT BIODIVERSITY LOSS
INDICATOR BASELINE LAST INFORMATION AVAILABLE UNIT SOURCE
GOAL 15.1.
By 2020, ensure the conservation, restoration and sustainable use of terrestrial and inland freshwater ecosys-tems and their services, in particular forests, wetlands, mountains and drylands, in line with obligations under international agreements
Indicator 15.1.1.Forest area as a proportion of total land area
33.78628N/A Percentage SEMARNAT
2011
Indicator 15.1.2.Proportion of important sites for ter-restrial and freshwater biodiversity that are covered by protected areas, by ecosystem type
10.6498 10.5490
Percentage SEMARNAT
2015 2016
GOAL 15.5.
Take urgent and significant action to reduce the degradation of natural habitats, halt the loss of biodiversity and, by 2020, protect and prevent the extinction of threatened species
Indicator 15.5.1.Red List Index
Algae0.041
N/A Percentage SEMARNAT
2010
Amphibians50.919
2010
Birds35.315
2010
110

SDG 15: PROTECT, RESTORE AND PROMOTE SUSTAINABLE USE OF TERRESTRIAL ECOSYSTEMS, SUSTAINABLY MANAGE FORESTS, COMBAT DESERTIFICATION, AND HALT AND REVERSE LAND
DEGRADATION AND HALT BIODIVERSITY LOSS
INDICATOR BASELINE LAST INFORMATION AVAILABLE UNIT SOURCE
GOAL 15.5.
Take urgent and significant action to reduce the degradation of natural habitats, halt the loss of biodiversity and, by 2020, protect and prevent the extinction of threatened species
Indicator 15.5.1.Red List Index
Bryophytes0.371
N/A Percentage SEMARNAT
2010
Gymnosperms and Angiosperms3.626
2010
Fungi1.028
2010
InvertebratesND
2010
Mammals52.338
2010
Fish7.333
2010
Pteridophytes2.609
2010
Reptiles50.056
2010
SDG 16: PROMOTE PEACEFUL AND INCLUSIVE SOCIETIES FOR SUSTAINABLE DEVELOPMENT, PROVIDE ACCESS TO JUSTICE FOR ALL AND BUILD EFFECTIVE, ACCOUNTABLE
AND INCLUSIVE INSTITUTIONS AT ALL LEVELS
INDICATOR BASELINE LAST INFORMATION AVAILABLE UNIT SOURCE
GOAL 16.1.
Significantly reduce all forms of violence and related death rates everywhere
Indicator 16.1.1Number of victims of intentional homi-cide per 100,000 population, by sex and age
17.2N/A
Cases per 100,000
inhabitants
INEGI, CONAPO
2015
GOAL 16.6.
Develop effective, accountable and transparent institutions at all levels
Indicator 16.6.1. Primary government expenditures as a proportion of original approved budget, by sector (or by budget codes or similar)
108.0 116.2
Percentage SHCP
2015 2016
111

SDG 17: STRENGTHEN THE MEANS OF IMPLEMENTATION AND REVITALIZE THE GLOBAL PARTNERSHIP FOR SUSTAINABLE DEVELOPMENT
INDICATOR BASELINE LAST INFORMATION AVAILABLE UNIT SOURCE
GOAL 17.1.
Strengthen domestic resource mobilization, including through international support to developing countries, to improve domestic capacity for tax and other revenue collection
Indicator 17.1.1.
Total government revenue as a propor-tion of GDP, by source
23.4 24.8Percentage SHCP
2015 2016
Indicator 17.1.2.
Proportion of domestic budget funded by domestic taxes
48.4 50.8Percentage SHCP
2015 2016
GOAL 17.3.
Mobilize additional financial resources for developing countries from multiple sources
Indicator 17.3.2.
Volume of remittances (in United States dollars) as a proportion of total GDP
1.9 2.6
Percentage BANXICO, INEGI2015/I 2017/I
GOAL 17.4.
Assist developing countries in attaining long-term debt sustainability through coordinated policies aimed at fostering debt financing, debt relief and debt restructuring, as appropriate, and address the external debt of highly indebted poor countries to reduce debt distress
Indicator 17.4.1
Debt service as a proportion of exports of goods and services
9.2 11.2Percentage SHCP
2015 2016
GOAL 17.6.
Enhance North-South, South-South and triangular regional and international cooperation on and access to sci-ence, technology and innovation and enhance knowledge sharing on mutually agreed terms, including through improved coordination among existing mechanisms, in particular at the United Nations level, and through a global technology facilitation mechanism
Indicator 17.6.2.
Fixed internet broadband subscriptions per 100 inhabitants, by speed
Between 256 Kbps and 2 Mbps0.4570 0.5552
Rate per 100 inhabitants IFT
2015/I 2016/IV
Between 2 Mbps and 10 Mbps9.3879 2.2513
2015/I 2016/IV
10 Mbps or higher1.2690 10.4494
2015/I 2016/IV
GOAL 17.8.
Fully operationalize the technology bank and science, technology and innovation capacity-building mechanism for least developed countries by 2017 and enhance the use of enabling technology, in particular information and communications technology
Indicator 17.8.1.
Proportion of individuals using the internet
57.43 59.54Percentage IFT
2015 2016
112

SDG 17: STRENGTHEN THE MEANS OF IMPLEMENTATION AND REVITALIZE THE GLOBAL PARTNERSHIP FOR SUSTAINABLE DEVELOPMENT
INDICATOR BASELINE LAST INFORMATION AVAILABLE UNIT SOURCE
GOAL 17.8.
Fully operationalize the technology bank and science, technology and innovation capacity-building mechanism for least developed countries by 2017 and enhance the use of enabling technology, in particular information and communications technology
Indicator 17.8.1.a
Proportion of individuals using the internet, inside or outside the home
Inside the home40.74 47.31
Percentage IFT2015 2016
Outside the home16.69 12.23
2015 2016
113

APPENDIX 2
INTRODUCTION
In its 2016 Voluntary National Review, Mexico stated that “local authori-ties contribute to guaranteeing the affordability and accessibility of ser-vices, starting with the smallest units of government and those in remote regions. It is in these places that the implementation of the 2030 Agenda becomes most important in ending the cycle of poverty and inequality and promoting economic growth and the sustainable management of natural resources.”1 Converting the 2030 Agenda’s projections into a reality re-quires an ambitious effort in which the Sustainable Development Goals (SDGs) should be seen holistically rather than in isolation, horizontally encompassing different sectors of society and vertically encompassing different levels of government.
Horizontal mainstreaming implies establishing coordination mecha-nisms between government, civil society, academia and the private sec-tor to co-create and take shared responsibility for the country’s sustain-able development policies. This is crucial, given that the problems the country needs to solve have many causes and unequal effects. As such, no single actor is able to diagnose and resolve them in isolation.
With regard to vertical mainstreaming, it is necessary to recognize that sustainable development is achieved at the local level and that under-standing different contexts is key to conducting an appropriate diagnostic regarding the actions to be undertaken. It is therefore important to involve subnational governments together with the federal government so that they share the responsibility for providing citizens with goods and services. Metropolitan areas also play an important role. The actions taken in met-ropolitan areas to reach the SDGs have a major potential impact on na-
1 Office of the President of the Republic and the United Nations Development Pro-gramme, “Mexico’s Voluntary National Review for the High-Level Political Forum on Sustainable Development,” 2016.
115

tional progress. Monitoring at the subnational level is therefore essential, as understanding the status of the SDGs in a state or municipality can drive local authorities to take action and implement policies focused on advancing towards the implementation of the 2030 Agenda.
The 2030 Agenda also implies an emphasis on results, which requires infor-mation so that the proper diagnostics can be made and progress towards the Sustainable Development Goals can be monitored. Consequently, it is fundamental to not only build the capacity to gather information at the federal level, but also at subnational levels, involving state and municipal governments in its collection, analysis and use.
The National Public Policy Lab (LNPP)2 of the Center for Research and Teaching in Economics (CIDE) has carried out two SDG monitoring pro-grams at the subnational level in Mexico: the Guanajuato Observatory 2040, conducted on behalf of the state government of Guanajuato; and the City Sustainability Index, financed by Citibanamex and conducted in collaboration with the Mexican Competitiveness Institute and the Mario Molina Center.3 The data contained in this appendix is the result of these two projects and represent a partnership between academia, a subna-tional government, a private sector enterprise and non-governmental organizations.
SELECTION OF INDICATORS
The indicators included in this appendix were selected in accordance with a series of criteria. The most important was that they match the global indi-cators or the official national indicators defined by the CTEODS. Of these, indicators were selected that are monitored periodically, preferably using national statistics tools, and that can be disaggregated at the state or mu-nicipal level. Finally, the indicators selected were complemented with other, non-official indicators that provide crucial information to complement the subnational SDG outlook. Together, the indicators presented herein pro-
2 The LNPP is the Mexico’s premier social sciences laboratory, as well as a center specialized in data science, behavioral science and collective intelligence. It is oriented towards solving social problems through applied research, collective decision-making and the development of human resources.
3 The results of these projects and the indicators they generated can be found at the following web addresses: http://observatorio.guanajuato.gob.mx/extensions/plangto/index.html and http://lnpp.cide.edu/indicedeciudadessostenibles2018.
116

vide information on each SDG and focus on showing subnational variations in terms of development.
The following table lists the indicators included in this subnational report and their total or partial correspondence with the 2030 Agenda’s global indicators.
SDG INDICATORCORRESPONDS TO A GLOBAL
INDICATOR
LEVEL OF DISAGGREGATION
1 Lack of access to social security No Metropolitan Area
1 Percentage of the population that lacks access to social security Yes State
1 Percentage of the population living in poverty Yes State and Metropolitan Area
1 Percentage of the population living in extreme pov-erty Yes State and Metropolitan Area
2 Food insecurity Yes Metropolitan Area
2 Population with income lower than the minimum standard of living No Metropolitan Area
2 Percentage of the population facing food insecurity Yes State
2 Percentage of children under the age of five who are underweight Yes State
3 Infant mortality Yes Metropolitan Area
3 Maternal mortality Yes State and Metropolitan Area
3 Under-five mortality rate Yes State
3 Suicide rate Yes Metropolitan Area
4 Average educational level of the population age 15 and above No Metropolitan Area
4 Women who study No Metropolitan Area
4 Literate population age 15 and above Yes State
4 Population between the ages of 3 and 14 that attends school Yes Metropolitan Area
4 Average PLANEA score No State
4 Net preschool enrollment rate (age 3 to 5) Yes State
4 Net middle school enrollment rate (age 12 to 14) No State
5 Labor equity No Metropolitan Area
5 Wage equity No Metropolitan Area
5 Women in municipal governments Yes Metropolitan Area
5 Labor force participation rate of women No State
5Prevalence of violence against married or partnered women age 15 and above by their partner in the last 12 months
Yes State
5 Prevalence of violence against women age 15 and above throughout their lives No State
5 Proportion of women occupying mayoralties by state Yes State
5 Teenage pregnancy rate Yes Metropolitan Area
117
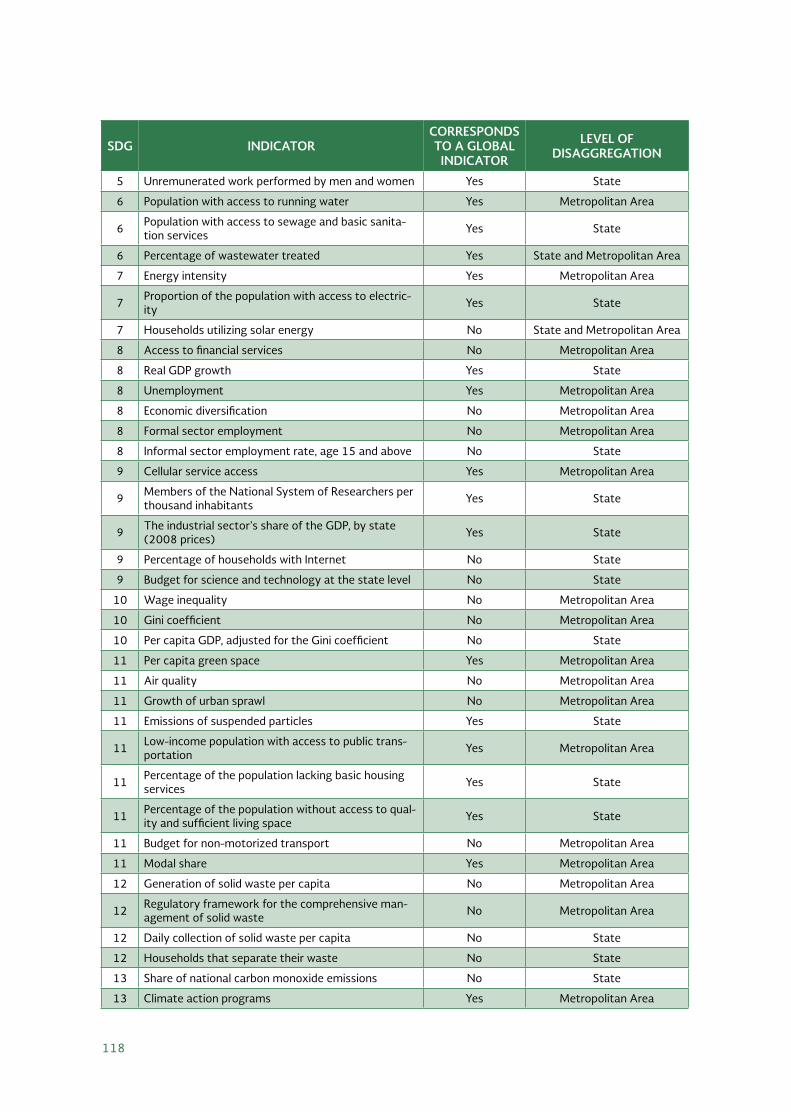
SDG INDICATORCORRESPONDS TO A GLOBAL
INDICATOR
LEVEL OF DISAGGREGATION
5 Unremunerated work performed by men and women Yes State
6 Population with access to running water Yes Metropolitan Area
6 Population with access to sewage and basic sanita-tion services Yes State
6 Percentage of wastewater treated Yes State and Metropolitan Area
7 Energy intensity Yes Metropolitan Area
7 Proportion of the population with access to electric-ity Yes State
7 Households utilizing solar energy No State and Metropolitan Area
8 Access to financial services No Metropolitan Area
8 Real GDP growth Yes State
8 Unemployment Yes Metropolitan Area
8 Economic diversification No Metropolitan Area
8 Formal sector employment No Metropolitan Area
8 Informal sector employment rate, age 15 and above No State
9 Cellular service access Yes Metropolitan Area
9 Members of the National System of Researchers per thousand inhabitants Yes State
9 The industrial sector’s share of the GDP, by state (2008 prices) Yes State
9 Percentage of households with Internet No State
9 Budget for science and technology at the state level No State
10 Wage inequality No Metropolitan Area
10 Gini coefficient No Metropolitan Area
10 Per capita GDP, adjusted for the Gini coefficient No State
11 Per capita green space Yes Metropolitan Area
11 Air quality No Metropolitan Area
11 Growth of urban sprawl No Metropolitan Area
11 Emissions of suspended particles Yes State
11 Low-income population with access to public trans-portation Yes Metropolitan Area
11 Percentage of the population lacking basic housing services Yes State
11 Percentage of the population without access to qual-ity and sufficient living space Yes State
11 Budget for non-motorized transport No Metropolitan Area
11 Modal share Yes Metropolitan Area
12 Generation of solid waste per capita No Metropolitan Area
12 Regulatory framework for the comprehensive man-agement of solid waste No Metropolitan Area
12 Daily collection of solid waste per capita No State
12 Households that separate their waste No State
13 Share of national carbon monoxide emissions No State
13 Climate action programs Yes Metropolitan Area
118

SDG INDICATORCORRESPONDS TO A GLOBAL
INDICATOR
LEVEL OF DISAGGREGATION
14 Percentage of the Federal Maritime Zone set aside for conservation Yes State
15 State biodiversity strategies No Metropolitan Area
15 Existence of forests and jungles No State
15 Loss of virgin forest and jungle No State
15 Percentage of the state’s surface area set aside for federal Protected Natural Areas Yes State
15 Protection of key ecosystems Yes Metropolitan Area
16 Open Government Index No State
16 Municipal Budget Transparency Index No Metropolitan Area
16 Transparency Metric No State
16 Number of judges per 100,000 inhabitants No State
16 State and municipal police per 100,000 inhabitants No State
16 Homicide rate per 100,000 inhabitants Yes State
16 Homicide rate Yes Metropolitan Area
16 Rate of people age 18 and up who feel their neigh-borhood or town is unsafe, per 100,000 inhabitants Yes State
17 Financial dependence No State and Metropolitan Area
17 Number of international development cooperation projects per state No State
17 Share of total exports, by state No State
SDG 1 – NO POVERTY
Mexico was one of the countries that promoted the multidimensional mea-surement of poverty in the process of defining the SDGs. Along with in-come, the domestic definition of poverty analyzes six other social short-falls: lack of educational, access to health services, access to social security, quality and sufficient living space (which refers to housing materials and overcrowding), basic housing services (which refers to access to water, drainage, power and the type of fuel used for cooking) and access to food. Individuals are considered to be living in poverty when their income is enough to cover their food and non-food needs but they suffer from at least one social shortfall, and to be living in extreme poverty when their income is enough to cover their food needs but they suffer from three or more social shortfalls.4
4 CONEVAL, “Pobreza en México,” retrieved May 16, 2018, https://www.coneval.org.mx/Medicion/Paginas/PobrezaInicio.aspx.
119

PERCENTAGE OF THE POPULATION LIVING IN POVERTY (MODERATE AND
EXTREME)
State Indicators5
• Metropolitan areas have a smaller population living in poverty than the states in which they are located.
Metropolitan Area Indicators6
5 CONEVAL, “Anexo Estadístico pobreza 2016,” 2016, https://www.coneval.org.mx/Medicion/MP/Paginas/AE_pobreza_2016.aspx.
6 CONEVAL, “Anexo estadístico de la pobreza a nivel municipio 2010 y 2015”, 2015, https://www.coneval.org.mx/Medicion/Paginas/AE_pobreza_municipal.aspx.
Perc
enta
ge o
f th
e po
pula
tion
0
10
20
30
40
50
60
70
80
90
Moderate poverty Extreme poverty National average (total poverty)
0
10
20
30
40
50
60
70
80
Mon
terre
yM
oncl
ova-
Fron
tera
Salt
illo
Chi
huah
uaQ
ueré
taro
Tep
icSa
n Lu
is P
otos
íM
exic
ali
Agu
asca
lient
esM
érid
aPu
erto
Val
lart
aPi
edra
s N
egra
sJu
árez
Vill
aher
mos
aC
ancú
nC
olim
a-V
illa
de Á
lvar
ezZa
cate
cas-
Gua
dalu
peLa
Lag
una
Tiju
ana
Gua
ymas
Gua
dala
jara
Pach
uca
Ver
acru
zLe
ónRe
ynos
a-Rí
o Br
avo
Cel
aya
Nue
vo L
ared
oT
ula
Val
le d
e M
éxic
oT
ampi
coO
cotl
ánX
alap
aC
oatz
acoa
lcos
Mat
amor
osC
uern
avac
aSa
n Fr
anci
sco
del R
incó
nM
orel
iaT
laxc
ala-
Api
zaco
Oriz
aba
Cór
doba
Tol
uca
Tec
omán
Oax
aca
Teh
uant
epec
Tul
anci
ngo
La P
ieda
d-Pé
njam
oPu
ebla
-Tla
xcal
aC
uaut
laZa
mor
a-Ja
cona
Tux
tla
Gut
iérre
zM
orol
eón-
Uria
ngat
oA
capu
lco
Ríov
erde
-Ciu
dad
Fern
ánde
zM
inat
itlá
nPo
za R
ica
Tia
ngui
sten
coT
eziu
tlán
Aca
yuca
nT
ehua
cán
Moderate poverty Extreme poverty
Perc
enta
ge o
f th
e po
pula
tion
120

PERCENTAGE OF THE POPULATION THAT LACKS ACCESS TO SOCIAL
SECURITY
State Indicators7
• Lack of access to social security is less prevalent in metropolitan areas than in the states in which they are located.
Metropolitan Area Indicators8
7 CONEVAL.8 CONEVAL.
Perc
enta
ge o
f th
e po
pula
tion
0
10
20
30
40
50
60
70
80
90
Access to social security National average
Perc
enta
ge o
f th
e po
pula
tion
0
10
20
30
40
50
60
70
80
90
Mon
clov
a-Fr
onte
raPi
edra
s N
egra
sM
onte
rrey
Salt
illo
Gua
ymas
La L
agun
aJu
árez
Chi
huah
uaA
guas
calie
ntes
Reyn
osa-
Río
Brav
oM
exic
ali
Tep
icSa
n Lu
is P
otos
íM
érid
aZa
cate
cas-
Gua
dalu
peQ
ueré
taro
Nue
vo L
ared
oG
uada
laja
raM
atam
oros
Oco
tlán
Can
cún
Puer
to V
alla
rta
Tam
pico
Tiju
ana
Coa
tzac
oalc
osV
erac
ruz
León
Col
ima-
Vill
a de
Álv
arez
Oriz
aba
Val
le d
e M
éxic
oC
uern
avac
aC
elay
aX
alap
aM
orel
iaV
illah
erm
osa
Cór
doba
Tol
uca
Tla
xcal
a-A
piza
coPa
chuc
aA
capu
lco
Tul
aLa
Pie
dad-
Pénj
amo
Pueb
la-T
laxc
ala
Min
atit
lán
Teh
uant
epec
Zam
ora-
Jaco
naC
uaut
laT
ecom
ánRí
over
de-C
iuda
d Fe
rnán
dez
Tul
anci
ngo
Oax
aca
Poza
Ric
aM
orol
eón-
Uria
ngat
oT
uxtl
a G
utié
rrez
San
Fran
cisc
o de
l Rin
cón
Tez
iutl
ánT
iang
uist
enco
Aca
yuca
nT
ehua
cán
National average Percentage at state level
121

SDG 2 – ZERO HUNGER
Food insecurity is one of the components of the multidimensional mea-surement of poverty used in Mexico. It is measured using the Mexican Food Security Scale, which takes into account the variety of food consumed, whether individuals have skipped a meal, or whether they have suffered from hunger.9
State Indicators
PERCENTAGE OF THE POPULATION FACING FOOD INSECURITY AND OF
CHILDREN UNDER THE AGE OF FIVE WHO ARE UNDERWEIGHT10
• The states with the highest percentage of population facing food insecurity do not directly correspond to the states with the highest percentage of underweight children under the age of five. In Tabasco, for example, 45% of the population faces food insecurity, but it is below the national average for underweight children under the age of five. Chiapas, in turn, is below the national average in terms of the population facing food insecurity, but it is the state with the highest percentage of underweight children under the age of five.
9 National Council for the Evaluation of Social Development Policy, Metodología de la medición de pobreza en México, second edition (Mexico City: CONEVAL, 2014), https://www.coneval.org.mx/Medicion/MP/Paginas/Metodologia.aspx.
10 CONEVAL, “Anexo Estadístico pobreza 2016”; Instituto Nacional de Salud Pública, “Encuesta Nacional de Salud y Nutrición”, 2012, https://ensanut.insp.mx/.
0
1
2
3
4
5
6
7
8
9
0
5
10
15
20
25
30
35
40
45
50
% o
f ch
ildre
n un
der
the
age
of �
ve w
ho a
re u
nder
wei
ght
% fa
cing
food
inse
curit
y
Percentage of the population facing food insecurity Percentage of children under the age of 5 who are underweight
Mich
oacán
Méx
ico
San L
uis Po
tosí
Yucatá
n
Nuevo Le
ón
Queréta
ro
Ciudad de M
éxico
122

Metropolitan Area Indicators
PERCENTAGE OF THE POPULATION FACING FOOD INSECURITY AND WITH
AN INCOME BELOW THE MINIMUM STANDARD OF LIVING11
• In metropolitan areas, the percentage of the population with income lower than the minimum standard of living does not always corre-spond to the percentage of the population facing food insecurity. Less than 5% of the population of Monterrey, for example, lives on less than the minimum standard of living, but the percentage of the population facing food insecurity is similar to cities with twice the percentage of the population living on less than the minimum stan-dard of living.
11 CONEVAL, “Anexo estadístico de la pobreza a nivel municipio 2010 y 2015”.
0
5
10
15
20
25
30
35
40
45
Mon
terre
yQ
ueré
taro
Salt
illo
Mér
ida
Puer
to V
alla
rta
Can
cún
Mon
clov
a-Fr
onte
raV
illah
erm
osa
Col
ima-
Vill
a de
Álv
arez
Mex
ical
iC
hihu
ahua
Gua
dala
jara
Tep
icSa
n Lu
is P
otos
íT
ijuan
aG
uaym
asA
guas
calie
ntes
Zaca
teca
s-G
uada
lupe
Pach
uca
Ver
acru
zLa
Lag
una
Coa
tzac
oalc
osJu
árez
Nue
vo L
ared
oLe
ónT
ula
San
Fran
cisc
o de
l Rin
cón
Pied
ras
Neg
ras
Reyn
osa-
Río
Brav
oT
ampi
coO
axac
aX
alap
aV
alle
de
Méx
ico
Cel
aya
Tla
xcal
a-A
piza
coT
ecom
ánO
cotl
ánT
ehua
ntep
ecM
orel
iaM
atam
oros
Cue
rnav
aca
Zam
ora-
Jaco
naC
órdo
baPu
ebla
-Tla
xcal
aT
ulan
cing
oLa
Pie
dad-
Pénj
amo
Tol
uca
Tux
tla
Gut
iérre
zA
capu
lco
Min
atit
lán
Poza
Ric
aC
uaut
laM
orol
eón-
Uria
ngat
oT
iang
uist
enco
Tez
iutl
ánO
rizab
aRí
over
de-C
iuda
d Fe
rnán
dez
Teh
uacá
nA
cayu
can
Population with an income below the minimum standard of livingPopulation facing food insecurity
Perc
enta
ge o
f th
e po
pula
tion
123

SDG 3 – GOOD HEALTH AND WELL-BEING
MATERNAL MORTALITY RATE PER 1,000 LIVE BIRTHS12
State Indicators
Metropolitan Area Indicators
12 Health Secretariat, “Bases de Datos Estándar Defunciones,” 2015, http://www.dgis.salud.gob.mx/contenidos/basesdedatos/std_defunciones_gobmx.html;
Num
ber o
f m
ater
nal d
eath
s pe
r 10
0,0
00
live
birt
hs
0
10
20
30
40
50
60
70
80
Que
réta
ro
Tla
xcal
a
Qui
ntan
a Ro
o
Sina
loa
Col
ima
Nue
vo L
eón
Baja
Cal
ifor
nia
Sur
Jalis
co
Agu
asca
lient
es
Coa
huila
Ver
acru
z
San
Luis
Pot
osí
Méx
ico
Dur
ango
Gua
naju
ato
Tam
aulip
as
Baja
Cal
ifor
nia
Sono
ra
Pueb
la
Hid
algo
Zaca
teca
s
Yuca
tán
Mic
hoac
án
Mor
elos
Tab
asco
Chi
huah
ua
Ciu
dad
De
Méx
ico
Cam
pech
e
Oax
aca
Gue
rrero
Nay
arit
Chi
apas
National average
0
10
20
30
40
50
60
70
80
90
Oco
tlán
Tia
ngui
sten
coT
ecom
ánA
cayu
can
Min
atit
lán
Reyn
osa-
Río
Brav
oLa
Pie
dad-
Pénj
amo
Agu
asca
lient
esT
ula
Cór
doba
Puer
to V
alla
rta
Cue
rnav
aca
Zam
ora-
Jaco
naRí
over
de-C
iuda
d Fe
rnán
dez
Poza
Ric
aC
oatz
acoa
lcos
Tiju
ana
Mon
clov
a-Fr
onte
raO
rizab
aT
ulan
cing
oC
olim
a-V
illa
de Á
lvar
ezT
epic
Xal
apa
Tam
pico
León
San
Luis
Pot
osí
Teh
uacá
nG
uada
laja
raJu
árez
Cua
utla
Mex
ical
iC
elay
aT
eziu
tlán
Nue
vo L
ared
oC
ancú
nM
orol
eón-
Uria
ngat
oM
onte
rrey
La L
agun
aV
alle
de
Méx
ico
Pied
ras
Neg
ras
Que
réta
roM
atam
oros
Mér
ida
Pueb
la-T
laxc
ala
Teh
uant
epec
Zaca
teca
s-G
uada
lupe
Chi
huah
uaSa
ltill
oA
capu
lco
Mor
elia
Tol
uca
Tla
xcal
a-A
piza
coG
uaym
asV
illah
erm
osa
San
Fran
cisc
o de
l Rin
cón
Ver
acru
zO
axac
aPa
chuc
aT
uxtl
a G
utié
rrez
Num
ber o
f m
ater
nal d
eath
s pe
r 10
0,0
00
live
birt
hs
124

UNDER-FIVE MORTALITY RATE PER 1,000 LIVE BIRTHS13
State Indicators
INFANT MORTALITY RATE PER 1,000 LIVE BIRTHS
Metropolitan Area Indicators
13 Health Secretariat, “Bases de Datos Estándar Nacidos Vivos Ocurridos,” 2015, http://www.dgis.salud.gob.mx/contenidos/basesdedatos/std_nacimientos_gobmx.html.
0
2
4
6
8
10
12
14
16
18
20
Que
réta
ro
Tla
xcal
a
Qui
ntan
a Ro
o
Sina
loa
Col
ima
Nue
vo L
eón
Baja
Cal
ifor
nia
Sur
Jalis
co
Agu
asca
lient
es
Coa
huila
Ver
acru
z
San
Luis
Pot
osí
Méx
ico
Dur
ango
Gua
naju
ato
Tam
aulip
as
Baja
Cal
ifor
nia
Sono
ra
Pueb
la
Hid
algo
Zaca
teca
s
Yuca
tán
Mic
hoac
án
Mor
elos
Tab
asco
Chi
huah
ua
Ciu
dad
de M
éxic
o
Cam
pech
e
Oax
aca
Gue
rrero
Nay
arit
Chi
apas
National average
Num
ber o
f un
der-
�ve
deat
hs p
er 1
00
,00
0 li
ve b
irths
0
5
10
15
20
25
30
San
Fran
cisc
o de
l Rin
cón
Aca
yuca
nG
uaym
asO
cotl
ánRí
over
de-C
iuda
d Fe
rnán
dez
Teh
uant
epec
Zam
ora-
Jaco
naC
olim
a-V
illa
de Á
lvar
ezT
ula
Tec
omán
Tul
anci
ngo
Zaca
teca
s-G
uada
lupe
Cua
utla
Puer
to V
alla
rta
Cór
doba
Agu
asca
lient
esC
ancú
nM
inat
itlá
nSa
n Lu
is P
otos
íLa
Pie
dad-
Pénj
amo
Mor
oleó
n-U
riang
ato
Tiju
ana
Mor
elia
Mex
ical
iA
capu
lco
Reyn
osa-
Río
Brav
oPi
edra
s N
egra
sM
onte
rrey
Salt
illo
La L
agun
aQ
ueré
taro
Mat
amor
osT
epic
León
Tam
pico
Mér
ida
Cue
rnav
aca
Val
le d
e M
éxic
oX
alap
aG
uada
laja
raPo
za R
ica
Cel
aya
Tla
xcal
a-A
piza
coPu
ebla
-Tla
xcal
aJu
árez
Nue
vo L
ared
oT
ehua
cán
Oriz
aba
Tol
uca
Pach
uca
Oax
aca
Coa
tzac
oalc
osC
hihu
ahua
Tia
ngui
sten
coT
uxtl
a G
utié
rrez
Tez
iutl
ánV
erac
ruz
Mon
clov
a-Fr
onte
raV
illah
erm
osa
Num
ber o
f in
fant
dea
ths
per 1
,00
0 li
ve b
irths
125
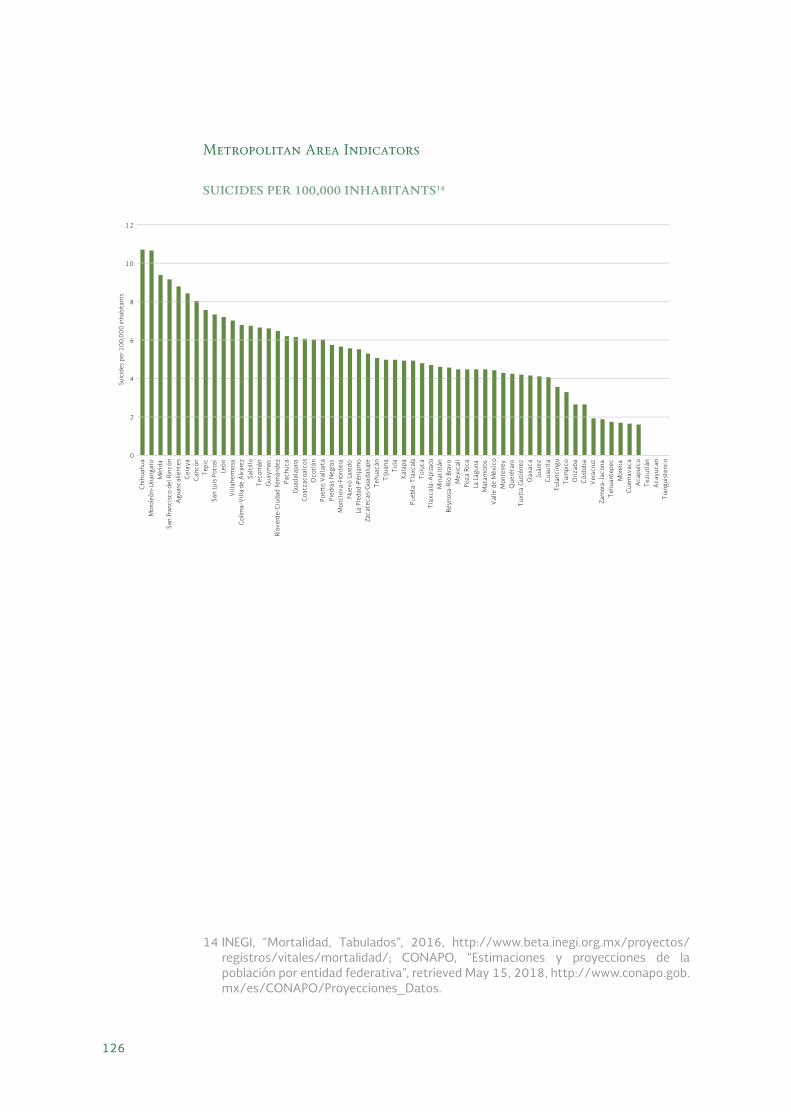
Metropolitan Area Indicators
SUICIDES PER 100,000 INHABITANTS14
14 INEGI, “Mortalidad, Tabulados”, 2016, http://www.beta.inegi.org.mx/proyectos/registros/vitales/mortalidad/; CONAPO, “Estimaciones y proyecciones de la población por entidad federativa”, retrieved May 15, 2018, http://www.conapo.gob.mx/es/CONAPO/Proyecciones_Datos.
Suic
ides
per
10
0,0
00
inha
bita
nts
0
2
4
6
8
10
12
Tia
ngui
sten
coA
cayu
can
Tez
iutl
ánA
capu
lco
Cue
rnav
aca
Mor
elia
Teh
uant
epec
Zam
ora-
Jaco
naV
erac
ruz
Cór
doba
Oriz
aba
Tam
pico
Tul
anci
ngo
Cua
utla
Juár
ezO
axac
aT
uxtl
a G
utié
rrez
Que
réta
roM
onte
rrey
Val
le d
e M
éxic
oM
atam
oros
La L
agun
aPo
za R
ica
Mex
ical
iRe
ynos
a-Rí
o Br
avo
Min
atit
lán
Tla
xcal
a-A
piza
coT
oluc
aPu
ebla
-Tla
xcal
aX
alap
aT
ula
Tiju
ana
Teh
uacá
nZa
cate
cas-
Gua
dalu
peLa
Pie
dad-
Pénj
amo
Nue
vo L
ared
oM
oncl
ova-
Fron
tera
Pied
ras
Neg
ras
Puer
to V
alla
rta
Oco
tlán
Coa
tzac
oalc
osG
uada
laja
raPa
chuc
aRí
over
de-C
iuda
d Fe
rnán
dez
Gua
ymas
Tec
omán
Salt
illo
Col
ima-
Vill
a de
Álv
arez
Vill
aher
mos
aLe
ónSa
n Lu
is P
otos
íT
epic
Can
cún
Cel
aya
Agu
asca
lient
esSa
n Fr
anci
sco
del R
incó
nM
érid
aM
orol
eón-
Uria
ngat
oC
hihu
ahua
126
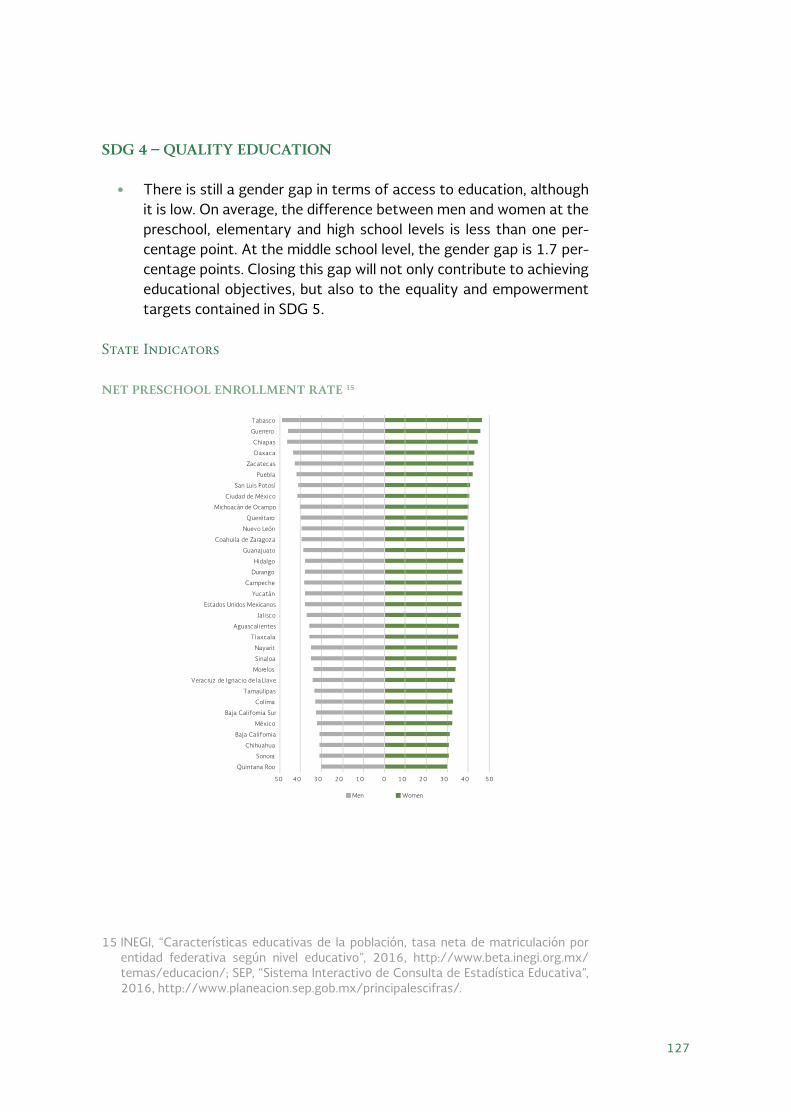
SDG 4 – QUALITY EDUCATION
• There is still a gender gap in terms of access to education, although it is low. On average, the difference between men and women at the preschool, elementary and high school levels is less than one per-centage point. At the middle school level, the gender gap is 1.7 per-centage points. Closing this gap will not only contribute to achieving educational objectives, but also to the equality and empowerment targets contained in SDG 5.
State Indicators
NET PRESCHOOL ENROLLMENT RATE 15
15 INEGI, “Características educativas de la población, tasa neta de matriculación por entidad federativa según nivel educativo”, 2016, http://www.beta.inegi.org.mx/temas/educacion/; SEP, “Sistema Interactivo de Consulta de Estadística Educativa”, 2016, http://www.planeacion.sep.gob.mx/principalescifras/.
50 40 30 20 10 0 10 20 30 40 50
Quintana Roo
Sonora
Chihuahua
Baja California
México
Baja California Sur
Colima
Tamaulipas
Veracruz de Ignacio de la Llave
Morelos
Sinaloa
Nayarit
Tlaxcala
Aguascalientes
Jalisco
Estados Unidos Mexicanos
Yucatán
Campeche
Durango
Hidalgo
Guanajuato
Coahuila de Zaragoza
Nuevo León
Querétaro
Michoacán de Ocampo
Ciudad de México
San Luis Potosí
Puebla
Zacatecas
Oaxaca
Chiapas
Guerrero
Tabasco
Men Women
127

NET HIGH SCHOOL ENROLLMENT RATE16
AVERAGE PLANEA SCORE17
16 INEGI, “Características educativas de la población, tasa neta de matriculación por entidad federativa según nivel educativo”; SEP, “Sistema Interactivo de Consulta de Estadística Educativa”.
17 INEE, “Bases de datos PLANEA, Evaluaciones de Logro referidas al Sistema Educativo Nacional. Sexto grado de primaria y Tercer grado de secundaria, ciclo escolar 2014-2015”, 2015, https://www.inee.edu.mx/index.php/planea/bases-de-datos-planea.
60 40 20 0 20 40 60 8080
Guerrero
Michoacán de Ocampo
Oaxaca
Jalisco
Chiapas
Guanajuato
Colima
Nuevo León
México
San Luis Potosí
Chihuahua
Coahuila de Zaragoza
Quintana Roo
Campeche
Veracruz de Ignacio de la Llave
Estados Unidos Mexicanos
Zacatecas
Tlaxcala
Yucatán
Tamaulipas
Nayarit
Aguascalientes
Durango
Querétaro
Puebla
Sonora
Baja California Sur
Morelos
Baja California
Sinaloa
Hidalgo
Tabasco
Ciudad de México
Men Women
Ciudad de M
éxico
460
480
500
520
540
560
Language and communication (middle school) Language and communication (elementary school)
Mathematics (middle school) Mathematics (elementary school)
Méx
ico
Nuevo Le
ón
Queréta
ro
San Lu
is Po
tosí
Yucatá
n
128

LITERATE POPULATION AGE 15 AND ABOVE18
• The populations with the highest rates of illiteracy are concentrated in three states in southern Mexico: Guerrero, Oaxaca and Chiapas.
Metropolitan Area Indicators
AVERAGE EDUCATIONAL LEVEL OF THE POPULATION AGE 15 AND ABOVE19
18 INEGI, “Encuesta Intercensal 2015, Tabulados”, 2015, http://www.beta.inegi.org.mx/proyectos/enchogares/especiales/intercensal/.
19 INEGI.
98%
84%
0
2
4
6
8
10
12
San
Fran
cisc
o de
l Rin
cón
Tec
omán
Mor
oleó
n-U
riang
ato
La P
ieda
d-Pé
njam
oZa
mor
a-Ja
cona
Ríov
erde
-Ciu
dad
Fern
ánde
zA
cayu
can
Tez
iutl
ánO
cotl
ánT
ehua
cán
Tul
anci
ngo
Teh
uant
epec
Min
atit
lán
Poza
Ric
aC
uaut
laO
rizab
aT
iang
uist
enco
Cel
aya
León
Aca
pulc
oRe
ynos
a-Rí
o Br
avo
Tul
aPi
edra
s N
egra
sC
órdo
baM
atam
oros
Nue
vo L
ared
oG
uaym
asPu
erto
Val
lart
aT
ijuan
aJu
árez
Coa
tzac
oalc
osT
oluc
aC
uern
avac
aC
ancú
nLa
Lag
una
Ver
acru
zG
uada
laja
raPu
ebla
-Tla
xcal
aT
ampi
coM
orel
iaM
exic
ali
Agu
asca
lient
esX
alap
aT
uxtl
a G
utié
rrez
Mon
clov
a-Fr
onte
raT
laxc
ala-
Api
zaco
Mér
ida
Val
le d
e M
éxic
oC
olim
a-V
illa
de Á
lvar
ezQ
ueré
taro
Oax
aca
Salt
illo
San
Luis
Pot
osí
Mon
terre
yPa
chuc
aT
epic
Vill
aher
mos
aC
hihu
ahua
Zaca
teca
s-G
uada
lupe
Year
s of
sch
oolin
g
129

POPULATION BETWEEN THE AGES OF 3 AND 14 THAT ATTENDS SCHOOL
AND WOMEN WHO STUDY20
• The percentage of women who study closely corresponds to the pop-ulation that attends school, indicating that the country is approaching gender parity in terms of access to education.
20 INEGI.
Ocotlán
Zamora-Jacona
60
65
70
75
80
85
90
95
100
60 65 70 75 80 85 90 95 100
Wom
en w
ho s
tudy
Population between the ages of 3 and 14 that attends school
San Francisco del Rincón
Coatzacoalcos
CelayaTulancingo
León
La Piedad-Pénjamo
QuerétaroMatamoros
Cancún
CautlaPoza Rica
Veracruz
Tecomán
Nuevo Laredo Ríoverde-Ciudad Fernández
Villahermosa
Tehuantepec
OaxacaTampico
PachucaColima-Villa de Álvarez Zacatecas-Guadalupe
Mérida
Reynosa-Río Bravo
130

SDG 5 – GENDER EQUALITY
State Indicators
PREVALENCE OF PARTNER VIOLENCE AGAINST WOMEN AGE 15 AND ABOVE
DURING THE LAST 12 MONTHS21
PREVALENCE OF VIOLENCE AGAINST WOMEN AGE 15 AND ABOVE AT SOME
POINT IN THEIR LIFE22
21 INEGI, “Encuesta Nacional sobre la Dinámica de las Relaciones en los Hogares 2016, Tabulados”, 2016, http://www.beta.inegi.org.mx/proyectos/enchogares/especia-les/endireh/2016/default.html.
22 INEGI.
0
5
10
15
20
25
30
35
Perc
enta
ge o
f wom
en w
ho re
port
ed a
n in
cide
ntof
par
tner
vio
lenc
e w
ithin
the
last
12
mon
ths
Percentage of women National average
0.0
10.0
20.0
30.0
40.0
50.0
60.0
70.0
80.0
90.0
Perc
enta
ge o
f wom
en w
ho re
port
ed b
eing
the
vic
tim
of v
iole
nce
at s
ome
poin
t in
the
ir lif
e
Percentage of women National average
131

LABOR FORCE PARTICIPATION RATE OF WOMEN23
• Despite expectations, there is no correlation between participation in the labor force and experiences of violence, whether partner vio-lence or any other form of violence.
PROPORTION OF WOMEN OCCUPYING MAYORALTIES24
• The proportion of women occupying mayoralties shows the role of women in decision-making and policy-making at the level closest to the citizenry.
• Only one state has, on average, gender parity at the mayoral level. In nine of Mexico’s 32 states, over 40% of mayoralties are occupied by women, and over 30% are occupied by women in the remaining 26. Although women participate in making decisions at this level of gov-ernment, there is still a gap. This is especially true in municipal govern-ments, where much still needs to be done to achieve gender parity.
23 Inmujeres, “Sistema de Indicadores de Género, Tasa de participación económica”, 2015, http://estadistica.inmujeres.gob.mx/formas/fichas.php?pag=2.
24 INEGI, “Censo Nacional de Gobiernos Municipales y Delegacionales 2015”, 2015, http://www.beta.inegi.org.mx/proyectos/censosgobierno/municipal/cngmd/ 2015/.
Perc
enta
ge o
f wom
en w
ho p
artic
ipat
e in
the
labo
r fo
rce
0
10
20
30
40
50
60
Percentage of women National average
Verac
ruz d
e Ignac
io de la L
lave
132

PROPORTION OF WOMEN IN MUNICIPAL GOVERNMENTS
State Indicators
Metropolitan Area Indicators
WOMEN IN MUNICIPAL GOVERNMENTS25
25 INEGI, “Censo Nacional de Gobiernos Municipales y Delegacionales 2015”.
Perc
enta
ge o
f dep
artm
enta
l dire
ctor
ship
s oc
cupi
ed b
y w
omen
in
mun
icip
al g
over
nmen
ts
0
5
10
15
20
25
30
35
40
Can
cún
San
Fran
cisc
o de
l Rin
cón
Zaca
teca
s-G
uada
lupe
Mér
ida
Aca
yuca
n
Ver
acru
z
Min
atitl
án
Poza
Ric
aC
órdo
ba
Oriz
aba
Coa
tzac
oalc
os
Xal
apa
Tam
pico
Nue
vo L
ared
o
Reyn
osa-
Río
Brav
o
Mat
amor
os
Vill
aher
mos
a
Gua
ymas
San
Luis
Pot
osí
Ríov
erde
- Ciu
dad
Fern
ánde
z
Que
réta
ro
Pueb
la-T
laxc
ala
Tez
iutlá
n
Teh
uacá
n
Oax
aca
Teh
uant
epec
Mon
terr
ey
Tep
ic
Cua
utla
Cue
rnav
aca
Mor
elia
Zam
ora-
Jaco
na
Tia
ngui
sten
co
Tol
uca
Puer
to V
alla
rta
Oco
tlán
Gua
dala
jara
Tul
a
Tul
anci
ngo
Pach
uca
Aca
pulc
o
La P
ieda
d-Pé
njam
o
León
Mor
oleó
n-U
riang
ato
Cel
aya
Tec
omán
Col
ima-
Vill
a de
Álv
arez
La L
agun
a
Tla
xcal
aA
piza
co-
Mon
clov
a-Fr
onte
ra
Salti
llo
Pied
ras
Neg
ras
Val
le d
e M
éxic
o
Juár
ez
Chi
huah
ua
Tux
tla G
utié
rrez
Mex
ical
i
Tiju
ana
Agu
asca
lient
es
50%
12%
133

UNREMUNERATED WORK PERFORMED BY WOMEN AND MEN26
State Indicators
• Women dedicate considerably more time to unremunerated work. Men dedicate approximately 9-14% of their time to unremunerated work, while women dedicate 22-36%. When the total time dedicat-ed to unremunerated work increases, both men and women dedicate more hours to it each week.
26 INEGI, “Encuesta Intercensal 2015, Tabulados”.
Percentage of hours per week dedicated to unremunerated work
20%
25%
30%
35%
40%
5% 10% 15% 20% 25%
Wom
en
Men
Aguascalientes
ZacatecasCoahuila de Zaragoza
ChihuahuaJalisco
Sinaloa Baja California Sur
ColimaGuanajuatoTlaxcala
Morelos
Ciudad de México
CampecheYucatán
QuerétaroNuevo León
NayaritMIchoacán de Ocampo
San Luis Potosí
HidalgoMéxico
TabascoOaxaca
Guerrero
Chiapas
PueblaTamaulipas
Veracruz
134

Metropolitan Area Indicators
LABOR EQUALITY AND WAGE EQUALITY27
• In metropolitan areas, there is no clear relationship between labor equality and wage equality.
TEENAGE PREGNANCY RATE28
27 INEGI, “Encuesta Nacional de Ocupación y Empleo 2016, Tabulados”, 2016, http://www.beta.inegi.org.mx/proyectos/enchogares/regulares/enoe/.
28 INEGI, “Encuesta Intercensal 2015, Tabulados”.
0
0.1
0.2
0.3
0.4
0.5
0.6
0.3 0.4 0.5 0.6 0.7 0.8 0.9
Ratio
of w
omen
’s w
ages
to m
en’s
wag
es
Ratio of women employed to men employed
Orizaba
Monclova-FronteraGuaymas
Ríoverde-Ciudad FernándezTula Tampico
Reynosa-Río Bravo
TehuantepecCórdoba
Zamora-Jacona
Puebla-TlaxcalaSan Francisco del RincónLeón
Tecomán
Nuevo Laredo
Saltillo
Poza Rica
Toluca
Cancún
Valle de MéxicoMérida
Querétaro
MoreliaZacatecas-Guadalupe
Acapulco
La Piedad-Pénjamo
Villahermosa
Puerto Vallarta
Xalapa
Tehuacán
Pachuca
Oaxaca
Cuernavaca
Colima-Villa de ÁlvarezTepic
ChihuahuaGuadalajara
Monterrey
San Luis Potosí
Celaya
Piedras Negras
La Laguna
0
20
40
60
80
100
120
140
160
180Sa
n Fr
anci
sco
del R
incó
nT
ampi
c oC
olim
a-V
illa
de Á
lvar
ezC
uern
avac
aV
alle
de
Méx
ico
Mat
amor
osC
ancú
nM
onte
rrey
Tiju
ana
Aca
pulc
oM
exic
ali
Gua
dala
jara
Gua
ymas
Oco
tlán
Tia
ngui
sten
coPo
za R
ica
Que
réta
roC
hihu
ahua
Teh
uant
epec
Cel
aya
Ver
acru
zT
uxtl
a G
utié
rrez
Agu
asca
lient
esPu
erto
Val
lart
aLe
ónO
axac
aC
oatz
acoa
lcos
Pueb
la-T
laxc
ala
Nue
vo L
ared
oM
orel
iaJu
árez
Mér
ida
Tol
uca
Reyn
osa-
Río
Brav
oM
orol
eón-
Uri
anga
toA
cayu
can
San
Luis
Pot
osí
Ori
zaba
Xal
apa
Tec
omán
Cua
utla
Tul
aM
inat
itlá
nPa
chuc
aSa
ltill
oRí
over
de-C
iuda
d Fe
rnán
dez
Mon
clov
a-F
ront
era
Tep
icLa
Pie
dad-
Pénj
amo
Cór
doba
Tul
anci
ngo
Tla
xcal
a-A
piza
coLa
Lag
una
Pied
ras
Neg
ras
Zam
ora-
Jaco
naV
illah
erm
osa
Zac
atec
as-G
uada
lupe
Teh
uacá
nT
eziu
tlán
Num
ber o
f bi
rths
per
eve
ry 1
,00
0 w
omen
bet
wee
n th
e ag
es o
f 1
5 a
nd 1
9
135
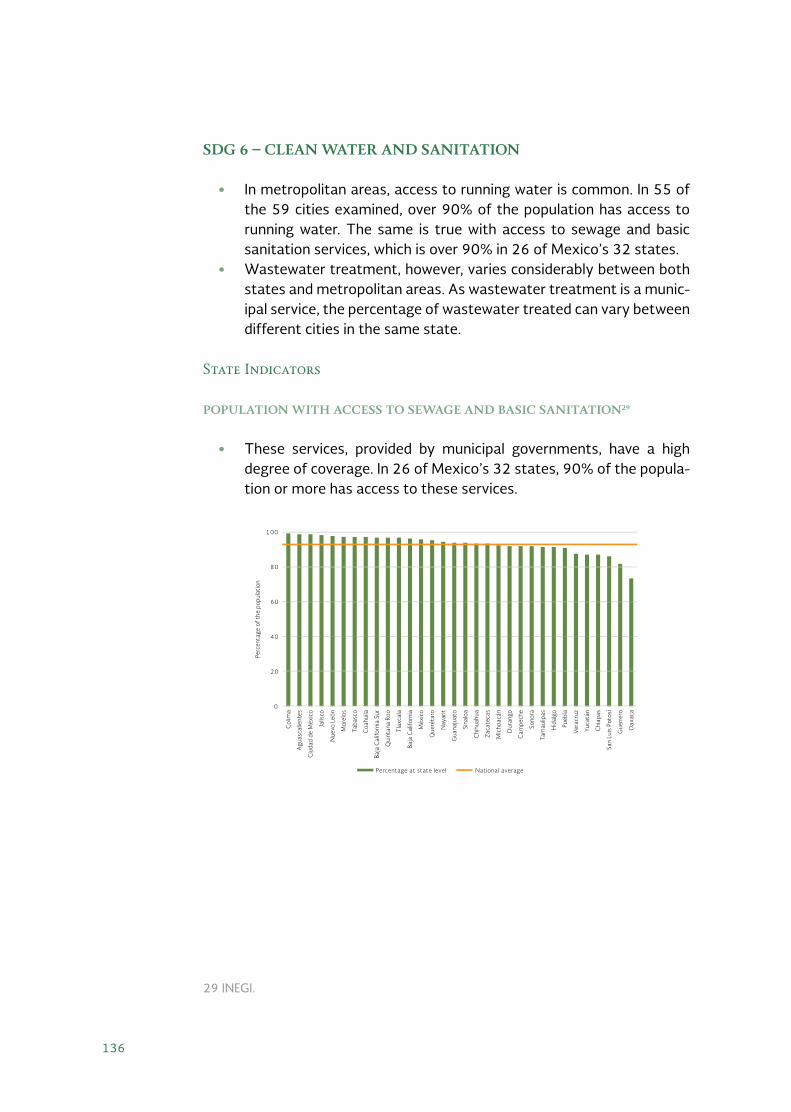
SDG 6 – CLEAN WATER AND SANITATION
• In metropolitan areas, access to running water is common. In 55 of the 59 cities examined, over 90% of the population has access to running water. The same is true with access to sewage and basic sanitation services, which is over 90% in 26 of Mexico’s 32 states.
• Wastewater treatment, however, varies considerably between both states and metropolitan areas. As wastewater treatment is a munic-ipal service, the percentage of wastewater treated can vary between different cities in the same state.
State Indicators
POPULATION WITH ACCESS TO SEWAGE AND BASIC SANITATION29
• These services, provided by municipal governments, have a high degree of coverage. In 26 of Mexico’s 32 states, 90% of the popula-tion or more has access to these services.
29 INEGI.
0
20
40
60
80
100
Percentage at state level National average
Perc
enta
ge o
f th
e po
pula
tion
Col
ima
Agu
asca
lient
es
Ciu
dad
de M
éxic
o
Jalis
co
Nue
vo L
eón
Mor
elos
Taba
sco
Coa
huila
Baja
Cal
iforn
ia S
ur
Qui
ntan
a Ro
o
Tla
xcal
a
Baja
Cal
iforn
ia
Méx
ico
Que
réta
ro
Nay
arit
Gua
naju
ato
Sina
loa
Chi
huah
ua
Zac
atec
as
Mic
hoac
án
Dur
ango
Cam
pech
e
Sono
ra
Tam
aulip
as
Hid
algo
Pueb
la
Vera
cruz
Yuca
tán
Chi
apas
San
Luis
Pot
osí
Gue
rrer
o
Oax
aca
136
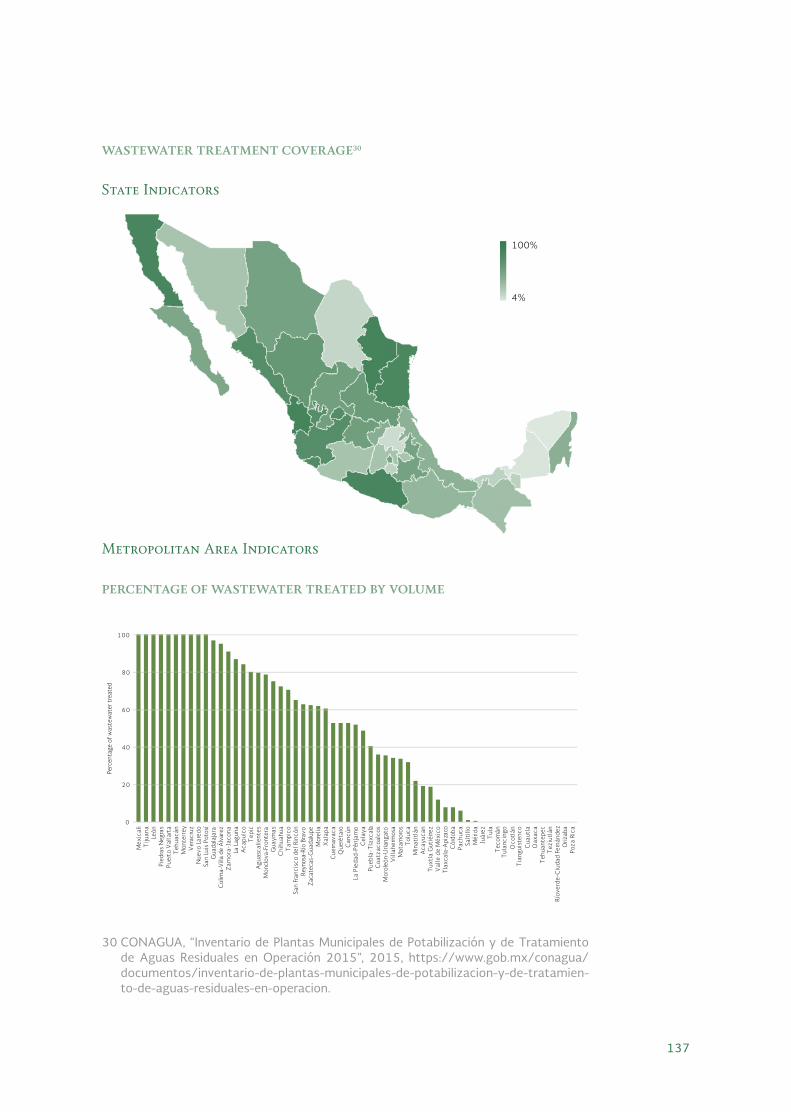
WASTEWATER TREATMENT COVERAGE30
State Indicators
Metropolitan Area Indicators
PERCENTAGE OF WASTEWATER TREATED BY VOLUME
30 CONAGUA, “Inventario de Plantas Municipales de Potabilización y de Tratamiento de Aguas Residuales en Operación 2015”, 2015, https://www.gob.mx/conagua/documentos/inventario-de-plantas-municipales-de-potabilizacion-y-de-tratamien-to-de-aguas-residuales-en-operacion.
100%
4%
0
20
40
60
80
100
Zac
atec
as-G
uada
lupe
Mér
ida
Ver
acru
z
Xal
apa
Coa
tzac
oalc
os
Min
atit
lán
Aca
yuca
n
Cór
doba
Poza
Ric
aO
rizab
a
Tla
xcal
a-A
piza
co
Tam
pico
Nue
vo L
ared
o
Reyn
osa-
Río
Brav
o
Mat
amor
osV
illah
erm
osa
Gua
ymas
San
Luis
Pot
osí
Río
verd
e-C
iuda
d Fe
rnán
dez
Can
cún
Que
réta
ro
Pueb
la-T
laxc
ala
Teh
uacá
n
Tez
iutl
ánT
ehua
ntep
ecO
axac
a
Mon
terr
ey
Tep
ic
Cue
rnav
aca
Cua
utla
Zam
ora-
Jaco
na
Mor
elia
Tol
uca
Tia
ngui
sten
co
Puer
to V
alla
rta
Gua
dala
jara
Oco
tlán
Pach
uca
Tul
a
Tul
anci
ngo
Aca
pulc
o
La P
ieda
d-Pé
njam
o
León
San
Fran
cisc
o de
l Rin
cón
Cel
aya
Mor
oleó
n-U
riang
ato
Col
ima-
Vill
a de
Álv
arez
Tec
omán
La L
agun
a
Pied
ras
Neg
ras
Mon
clov
a-Fr
onte
ra
Salt
illo
Val
le d
e M
éxic
o
Chi
huah
ua
Juár
ez
Tux
tla
Gut
iérre
z
Tiju
ana
Mex
ical
i
Agu
asca
lient
es
Per
cent
age
of w
aste
wat
er t
reat
ed
137
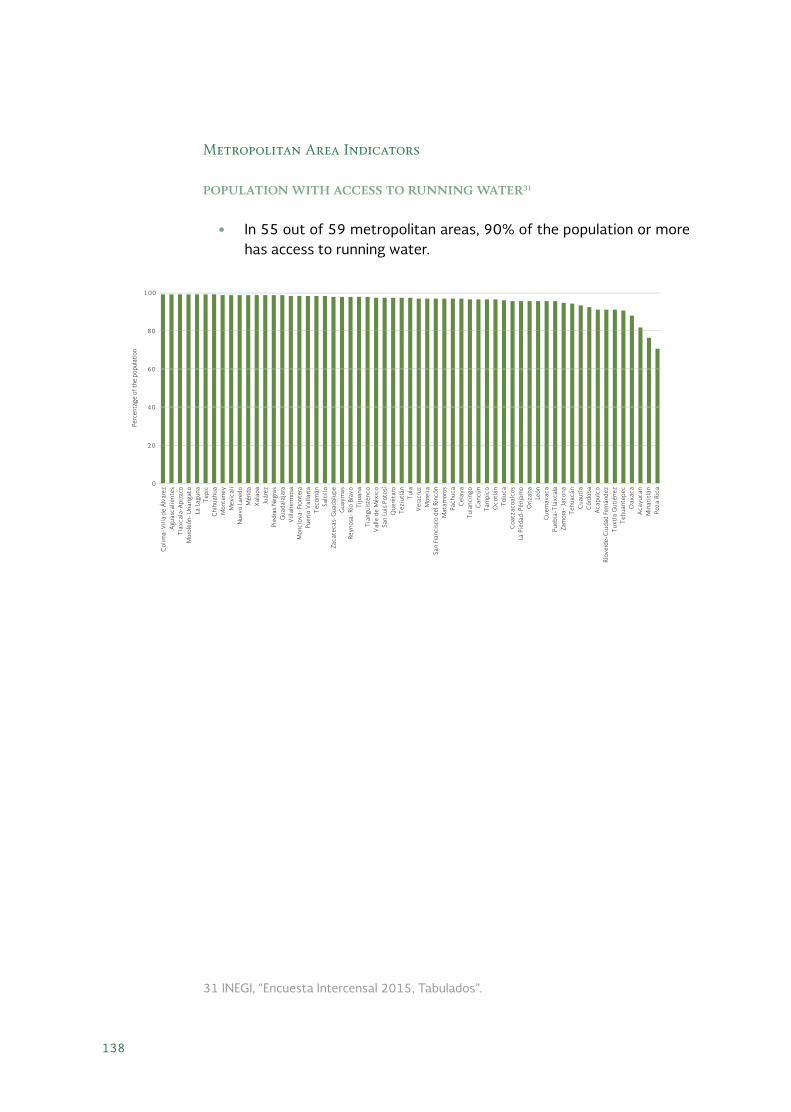
Metropolitan Area Indicators
POPULATION WITH ACCESS TO RUNNING WATER31
• In 55 out of 59 metropolitan areas, 90% of the population or more has access to running water.
31 INEGI, “Encuesta Intercensal 2015, Tabulados”.
0
20
40
60
80
100
Poza
Ric
aM
inat
itlá
nA
cayu
can
Oax
aca
Teh
uant
epec
Tux
tla
Gut
iérre
zRí
over
de-C
iuda
d Fe
rnán
dez
Aca
pulc
oC
órdo
baC
uaut
laT
ehua
cán
Zam
ora-
Jaco
naPu
ebla
-Tla
xcal
aC
uern
avac
aLe
ónO
rizab
aLa
Pie
dad-
Pénj
amo
Coa
tzac
oalc
osT
oluc
aO
cotl
ánT
ampi
coC
ancú
nT
ulan
cing
oC
elay
aPa
chuc
aM
atam
oros
San
Fran
cisc
o de
l Rin
cón
Mor
elia
Ver
acru
zT
ula
Tez
iutl
ánQ
ueré
taro
San
Luis
Pot
osí
Val
le d
e M
éxic
oT
iang
uist
enco
Tiju
ana
Reyn
osa-
Río
Brav
oG
uaym
asZa
cate
cas-
Gua
dalu
peSa
ltill
oT
ecom
ánPu
erto
Val
lart
aM
oncl
ova-
Fron
tera
Vill
aher
mos
aG
uada
laja
raPi
edra
s N
egra
sJu
árez
Xal
apa
Mér
ida
Nue
vo L
ared
oM
exic
ali
Mon
terre
yC
hihu
ahua
Tep
icLa
Lag
una
Mor
oleó
n-U
riang
ato
Tla
xcal
a-A
piza
coA
guas
calie
ntes
Col
ima-
Vill
a de
Álv
arez
Perc
enta
ge o
f th
e po
pula
tion
138

SDG 7 – AFFORDABLE AND CLEAN ENERGY
State Indicators
PROPORTION OF THE POPULATION WITH ACCESS TO ELECTRICITY32
• Of the basic services examined in this report, electricity is the one with the highest degree of coverage across the country. In every state, over 95% of the population has access to electricity.
Metropolitan Area Indicators
ENERGY INTENSITY33
32 INEGI.33 Indicator calculated by the Mario Molina Center based on information from INAI’s
National Transparency Platform.
92
93
94
95
96
97
98
99
100
Percentage of the population National average
Ciudad de M
éxico
Nuevo Le
ón
Méx
ico
Baja C
alifo
rnia
Queréta
ro
Mich
oacán
Yucatá
n
San Lu
is Po
tosí
Perc
enta
ge o
f th
e po
pula
tion
0
5
10
15
20
Teh
uant
epec
Oax
aca
Poza
Ric
aX
alap
aV
alle
de
Méx
ico
Vill
aher
mos
aT
epic
Tux
tla
Gut
iérre
zM
orel
iaPa
chuc
aM
inat
itlá
nRí
over
de-C
iuda
d Fe
rnán
dez
Cór
doba
Zam
ora-
Jaco
naZa
cate
cas-
Gua
dalu
peM
orol
eón-
Uria
ngat
oA
cayu
can
Gua
dala
jara
La P
ieda
d-Pé
njam
oC
uern
avac
aM
érid
aT
iang
uist
enco
Agu
asca
lient
esLa
Lag
una
Tol
uca
Tul
anci
ngo
Tul
aA
capu
lco
Col
ima-
Vill
a de
Álv
arez
Oco
tlán
León
Que
réta
roV
erac
ruz
Pueb
la-T
laxc
ala
Gua
ymas
Cel
aya
Mon
terre
yT
ampi
coT
ijuan
aT
ecom
ánSa
n Fr
anci
sco
del R
incó
nC
ancú
nT
ehua
cán
Coa
tzac
oalc
osSa
ltill
oT
eziu
tlán
Puer
to V
alla
rta
Chi
huah
uaN
uevo
Lar
edo
Oriz
aba
Cua
utla
Juár
ezRe
ynos
a-Rí
o Br
avo
San
Luis
Pot
osí
Mex
ical
iT
laxc
ala-
Api
zaco
Pied
ras
Neg
ras
Mon
clov
a-Fr
onte
raM
atam
oros
Wat
t-ho
urs
per u
nit
of t
he G
DP
139

HOUSEHOLDS UTILIZING SOLAR ENERGY34
State Indicators
Metropolitan Area Indicators35
34 INEGI.35 INEGI, “Encuesta Intercensal 2015, Tabulados”.
0
2
4
6
8
10
12
14
16
18
20
Tez
iutl
ánT
iang
uist
enco
Aca
yuca
nT
ecom
ánT
ehua
ntep
ecA
capu
lco
Min
atit
lán
Poza
Ric
aPi
edra
s N
egra
sT
ampi
coV
erac
ruz
Vill
aher
mos
aC
ancú
nT
uxtl
a G
utié
rrez
Mat
amor
osC
oatz
acoa
lcos
Mér
ida
Gua
ymas
Mex
ical
iRe
ynos
a-Rí
o Br
avo
Xal
apa
Mon
clov
a-Fr
onte
raPu
erto
Val
lart
aM
onte
rrey
La L
agun
aJu
árez
Ríov
erde
-Ciu
dad
Fern
ánde
zO
axac
aO
rizab
aC
uern
avac
aC
uaut
laC
órdo
baC
hihu
ahua
Salt
illo
Val
le d
e M
éxic
oN
uevo
Lar
edo
Teh
uacá
nT
epic
Tol
uca
Tiju
ana
Pueb
la-T
laxc
ala
Col
ima-
Vill
a de
Álv
arez
Tul
anci
ngo
Tla
xcal
a-A
piza
coSa
n Lu
is P
otos
íQ
ueré
taro
Pach
uca
Cel
aya
Gua
dala
jara
León
Mor
oleó
n-U
riang
ato
Tul
aZa
mor
a-Ja
cona
La P
ieda
d-Pé
njam
oSa
n Fr
anci
sco
del R
incó
nM
orel
iaO
cotl
ánA
guas
calie
ntes
Zaca
teca
s-G
uada
lupe
Perc
enta
ge o
f ho
useh
olds
util
izin
g so
lar e
nerg
y
17%
1%
140

SDG 8 – DECENT WORK AND ECONOMIC GROWTH
• This is one of the SDGs where we can best see the interactions between different goals. While it focuses on economic growth, when formulating policies to reach this goal, it is essential to ensure that they are consistent with responsible production and consumption (SDG 12), that they do not contribute to climate change (SDG 13) and that they conserve marine and terrestrial ecosystems (SDGs 14 and 15).
• In the indicators for metropolitan areas, there is a strong positive correlation between a city’s economic diversification and the per-centage of the population employed in the formal economy.
State Indicators
REAL GDP GROWTH36
36 INEGI, “PIB y Cuentas nacionales de México”, 2015, http://www.inegi.org.mx/est/contenidos/proyectos/cn/.
-7%
0%
8%
141

State Indicators
INFORMAL SECTOR EMPLOYMENT RATE, AGE 15 AND ABOVE37
Metropolitan Area Indicators
ACCESS TO FINANCIAL SERVICES38
37 INEGI, “Encuesta Nacional de Ocupación y Empleo 2016, Tabulados”.38 CNBV, “Bases de Datos de Inclusión Financiera”, 2013, http://www.cnbv.gob.mx/
Inclusi%C3%B3n/Paginas/Bases-de-Datos.aspx.
Percentage National average
0
10
20
30
40
50
60
Oax
aca
Gue
rrero
Tla
xcal
a
Mic
hoac
án
Pueb
la
Chi
apas
Hid
algo
Mor
elos
Tab
asco
Yuca
tán
Méx
ico
Ver
acru
z
Cam
pech
e
Nay
arit
Zaca
teca
s
San
Luis
Pot
osí
Gua
naju
ato
Dur
ango
Ciu
dad
de M
éxic
o
Sina
loa
Jalis
co
Tam
aulip
as
Sono
ra
Agu
asca
lient
es
Qui
ntan
a Ro
o
Coa
huila
Nue
vo L
eón
Col
ima
Baja
Cal
iforn
ia
Que
réta
ro
Baja
Cal
ifor
nia
Sur
Chi
huah
ua
Perc
enta
ge o
f the
wor
king
pop
ulat
ion
0
2
4
6
8
10
12
14T
eziu
tlán
Tia
ngui
sten
coA
cayu
can
Xal
apa
Oriz
aba
Ríov
erde
-Ciu
dad
Fern
ánde
zT
ehua
cán
Poza
Ric
aT
laxc
ala-
Api
zaco
Tul
anci
ngo
Val
le d
e M
éxic
oO
cotl
ánC
uaut
laO
axac
aT
oluc
aLa
Pie
dad-
Pénj
amo
Teh
uant
epec
Pueb
la-T
laxc
ala
Min
atit
lán
Mor
oleó
n-U
riang
ato
San
Fran
cisc
o de
l Rin
cón
Tec
omán
Tul
aT
uxtl
a G
utié
rrez
Juár
ezPa
chuc
aC
uern
avac
aA
capu
lco
Tep
icM
orel
iaC
órdo
baC
elay
aC
olim
a-V
illa
de Á
lvar
ezLe
ónLa
Lag
una
San
Luis
Pot
osí
Agu
asca
lient
esV
illah
erm
osa
Tiju
ana
Mér
ida
Coa
tzac
oalc
osT
ampi
coG
uada
laja
raZa
mor
a-Ja
cona
Chi
huah
uaV
erac
ruz
Can
cún
Que
réta
roM
oncl
ova-
Fron
tera
Gua
ymas
Zaca
teca
s-G
uada
lupe
Mex
ical
iSa
ltill
oN
uevo
Lar
edo
Puer
to V
alla
rta
Mat
amor
osM
onte
rrey
Pied
ras
Neg
ras
Reyn
osa-
Río
Brav
o
Num
ber o
f br
anch
es a
nd c
orre
spon
dent
ban
ks p
er 1
0,0
00
adu
lts
142
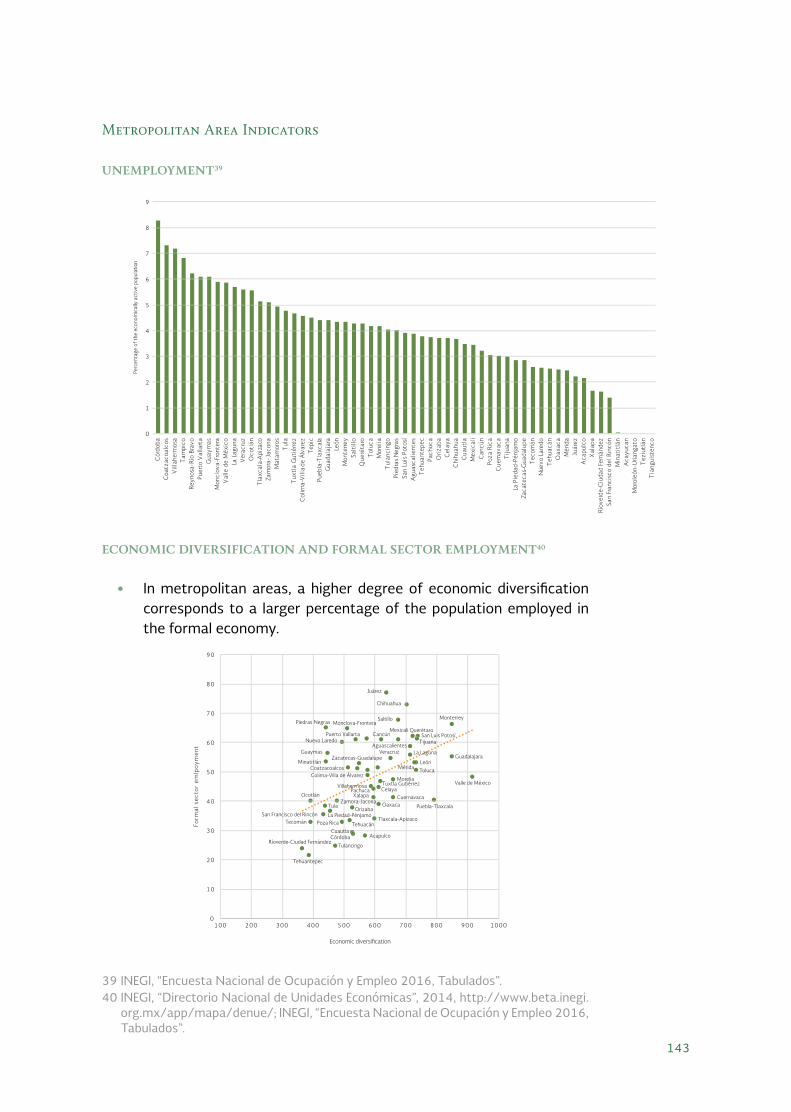
Metropolitan Area Indicators
UNEMPLOYMENT39
ECONOMIC DIVERSIFICATION AND FORMAL SECTOR EMPLOYMENT40
• In metropolitan areas, a higher degree of economic diversification corresponds to a larger percentage of the population employed in the formal economy.
39 INEGI, “Encuesta Nacional de Ocupación y Empleo 2016, Tabulados”.40 INEGI, “Directorio Nacional de Unidades Económicas”, 2014, http://www.beta.inegi.
org.mx/app/mapa/denue/; INEGI, “Encuesta Nacional de Ocupación y Empleo 2016, Tabulados”.
Perc
enta
ge o
f the
eco
nom
ical
ly a
ctiv
e po
pula
tion
0
1
2
3
4
5
6
7
8
9
Tia
ngui
sten
coT
eziu
tlán
Mor
oleó
n-U
riang
ato
Aca
yuca
nM
inat
itlá
nSa
n Fr
anci
sco
del R
incó
nRí
over
de-C
iuda
d Fe
rnán
dez
Xal
apa
Aca
pulc
oJu
árez
Mér
ida
Oax
aca
Teh
uacá
nN
uevo
Lar
edo
Tec
omán
Zaca
teca
s-G
uada
lupe
La P
ieda
d-Pé
njam
oT
ijuan
aC
uern
avac
aPo
za R
ica
Can
cún
Mex
ical
iC
uaut
laC
hihu
ahua
Cel
aya
Oriz
aba
Pach
uca
Teh
uant
epec
Agu
asca
lient
esSa
n Lu
is P
otos
íPi
edra
s N
egra
sT
ulan
cing
oM
orel
iaT
oluc
aQ
ueré
taro
Salt
illo
Mon
terre
yLe
ónG
uada
laja
raPu
ebla
-Tla
xcal
aT
epic
Col
ima-
Vill
a de
Álv
arez
Tux
tla
Gut
iérre
zT
ula
Mat
amor
osZa
mor
a-Ja
cona
Tla
xcal
a-A
piza
coO
cotl
ánV
erac
ruz
La L
agun
aV
alle
de
Méx
ico
Mon
clov
a-Fr
onte
raG
uaym
asPu
erto
Val
lart
aRe
ynos
a-Rí
o Br
avo
Tam
pico
Vill
aher
mos
aC
oatz
acoa
lcos
Cór
doba
0
10
20
30
40
50
60
70
80
90
100 200 300 400 500 600 700 800 900 1000
Form
al s
ecto
r em
lpo
ymen
t
Economic diversi�cation
Juárez
Chihuahua
Saltillo MonterreyPiedras Negras Monclova-Frontera
Nuevo Laredo
Guaymas
MinatitlánCoatzacoalcos
Zacatecas-GuadalupeVeracruz
Aguascalientes
Puerto Vallarta CancúnMexicali Querétaro
San Luis PotosíTijuana
GuadalajaraLeón
La Laguna
Mérida Toluca
MoreliaTuxtla GutiérrezCelaya
CuernavacaOaxaca
Valle de México
Puebla-Tlaxcala
Tlaxcala-Apizaco
Acapulco
Tulancingo
Tehuantepec
Ríoverde-Ciudad FernándezCórdobaCuautla
Poza Rica Tehuacán
Orizaba
TecománSan Francisco del Rincón La Piedad-Pénjamo
Tula
OcotlánZamora-Jacona
XalapaPachuca
Villahermosa
Colima-Villa de Álvarez
143

SDG 9 – INDUSTRY, INNOVATION AND INFRASTRUCTURE
• The share of the industrial sector in the GDP shows considerable regional variations, as there are states with a clear industrial vocation.
State Indicators
MEMBERS OF THE NATIONAL SYSTEM OF RESEARCHERS (SNI) PER 1,000
ECONOMICALLY ACTIVE INHABITANTS41
THE INDUSTRIAL SECTOR’S SHARE OF THE GDP, PER STATE (AT CONSTANT
2008 PRICES)42
41 CONACYT, “Informe General del estado de la ciencia, la tecnología y la innovación 2015”, 2015, http://www.siicyt.gob.mx/index.php/estadisticas/informe-general/informe-general-2015; CONAPO, “Estimaciones y proyecciones de la población por entidad federativa”.
42 INEGI, “Sistema de Cuentas Nacionales de México”, 2015, http://www.inegi.org.mx/est/contenidos/proyectos/scn/.
Num
ber
of
SNI m
embe
rs p
er 1
,00
0 e
cono
mic
ally
act
ive
acti
ve in
habi
tant
s
0
0.2
0.4
0.6
0.8
1
1.2
1.4
1.6
1.8
2
Ciudad de M
éxico
Yucatá
n
San Lu
is Po
tosí
Nuevo Le
ón
Mich
oacán
Méx
ico
Queréta
ro
SNI members per 1,000 economically active inhabitants National average
The
indu
stri
al s
ecto
r’s
shar
e o
f th
e G
DP
per
stat
e
0
10
20
30
40
50
60
70
80
90
100
Percentage of GDP National average
Cam
pech
e
Taba
sco
Coa
huila
Agu
asca
lient
es
Que
réta
ro
San
Luis
Pot
osí
Sono
ra
Zac
atec
as
Gua
naju
ato
Hid
algo
Nue
vo L
eón
Vera
cruz
Tam
aulip
as
Tla
xcal
a
Baja
Cal
iforn
ia
Chi
huah
ua
Dur
ango
Pueb
la
Oax
aca
Yuca
tán
Méx
ico
Jalis
co
Mor
elos
Col
ima
Chi
apas
Mic
hoac
án
Baja
Cal
iforn
ia S
ur
Sina
loa
Gue
rrer
o
Nay
arit
Qui
ntan
a Ro
o
Ciu
dad
de M
éxic
o
144
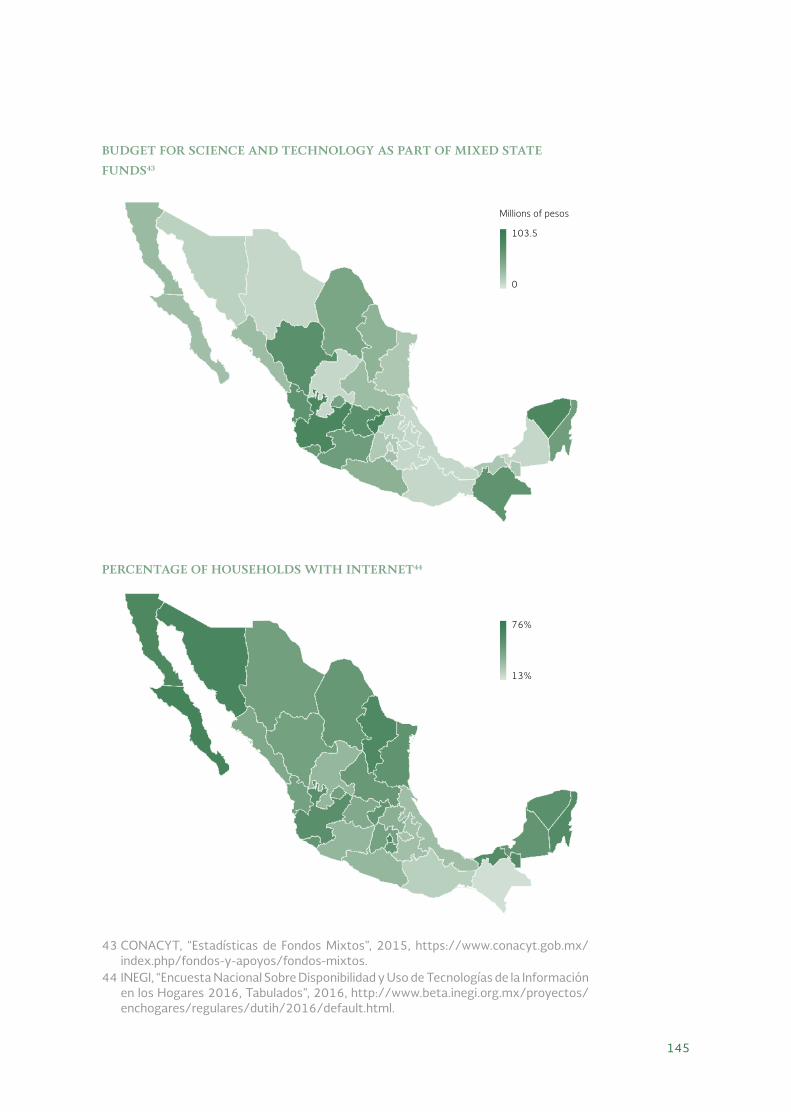
BUDGET FOR SCIENCE AND TECHNOLOGY AS PART OF MIXED STATE
FUNDS43
PERCENTAGE OF HOUSEHOLDS WITH INTERNET44
43 CONACYT, “Estadísticas de Fondos Mixtos”, 2015, https://www.conacyt.gob.mx/index.php/fondos-y-apoyos/fondos-mixtos.
44 INEGI, “Encuesta Nacional Sobre Disponibilidad y Uso de Tecnologías de la Información en los Hogares 2016, Tabulados”, 2016, http://www.beta.inegi.org.mx/proyectos/enchogares/regulares/dutih/2016/default.html.
103.5
76%
0
13%
Millions of pesos
145

Metropolitan Area Indicators
CELLULAR SERVICE ACCESS45
45 INEGI, “Encuesta Intercensal 2015, Tabulados”.
Perc
enta
ge o
f ho
useh
old
s
0
10
20
30
40
50
60
70
80
90
100
Tia
ngui
sten
coLa
Pie
dad-
Pénj
amo
Mor
oleó
n-U
riang
ato
Ríov
erde
-Ciu
dad
Fern
ánde
zZa
mor
a-Ja
cona
Oriz
aba
San
Fran
cisc
o de
l Rin
cón
Poza
Ric
aT
ecom
ánA
cayu
can
Tez
iutl
ánC
elay
aT
oluc
aA
capu
lco
Teh
uacá
nM
inat
itlá
nT
ehua
ntep
ecO
cotl
ánC
uaut
laT
ulan
cing
oC
órdo
baT
laxc
ala-
Api
zaco
Nue
vo L
ared
oPu
ebla
-Tla
xcal
aLe
ónT
ula
Cue
rnav
aca
Val
le d
e M
éxic
oLa
Lag
una
Mat
amor
osSa
ltill
oSa
n Lu
is P
otos
íX
alap
aM
orel
iaM
oncl
ova-
Fron
tera
Oax
aca
Gua
ymas
Col
ima-
Vill
a de
Álv
arez
Pied
ras
Neg
ras
Tam
pico
Reyn
osa-
Río
Brav
oM
onte
rrey
Coa
tzac
oalc
osZa
cate
cas-
Gua
dalu
pePa
chuc
aA
guas
calie
ntes
Vill
aher
mos
aT
uxtl
a G
utié
rrez
Juár
ezT
epic
Gua
dala
jara
Ver
acru
zQ
ueré
taro
Tiju
ana
Mex
ical
iM
érid
aPu
erto
Val
lart
aC
hihu
ahua
Can
cún
146

SDG 10 – REDUCED INEQUALITIES
Mexico is consistently listed as one of the OECD countries with the highest degree of inequality. In 2016, Mexico had a Gini coefficient of 0.498.46
• Mexico’s metropolitan areas have a lower level of inequality than the national average. In 2010, Mexico had a Gini coefficient of 0.509. That same year, its metropolitan areas had a lower coeffi-cient, that is, less inequality. According to these figures, the coun-try’s least unequal cities are comparable to the least unequal OECD countries.47
State Indicators
PER CAPITA GDP, ADJUSTED FOR THE GINI COEFFICIENT48
46 CONEVAL, “CONEVAL informa la evolución de la pobreza 2010-2016”, Press release 2017, https://www.coneval.org.mx/SalaPrensa/Comunicadosprensa/Documents/Comunicado-09-Medicion-pobreza-2016.pdf.
47 “Compare Your Country - Income Distribution and Poverty”, retrieved May 22, 2018 //www.compareyourcountry.org/inequality?lg=en.
48 CONEVAL, “Mapas y cifras de pobreza State, Indicadores de desigualdad”, 2015, https://www.coneval.org.mx/coordinacion/entidades/Paginas/inicioent.aspx; INEGI, “Sistema de Cuentas Nacionales de México”.
Per
capi
ta G
DP,
adj
uste
d fo
r th
e G
ini c
oef
fici
ent
0
50000
100000
150000
200000
250000
300000
350000
400000
GDP per capita National average
Ciudad de M
éxico
Nuevo Le
ón
Queréta
ro
Baja C
alifo
rnia
Sur
San Lu
is Po
tosí
Yucatá
n
Méx
ico
Mich
oacán
Verac
ruz
Baja C
alifo
rnia
147

Metropolitan Area Indicators
WAGE INEQUALITY49
Gini COEFFICIENT50
49 INEGI, “Encuesta Nacional de Ocupación y Empleo 2016, Tabulados”.50 CONEVAL, “Evolución y determinantes de la pobreza de las principales ciudades
de México 1990-2010”, 2014, https://www.coneval.org.mx/Informes/Pobreza/Pobreza%20urbana/Evolucion_determinantes_de_la_pobreza_urbana.pdf.
0
0.05
0.1
0.15
0.2
0.25
0.3
0.35
0.4
0.45
0.5
Mor
oleó
n-U
riang
ato
Tia
ngui
sten
coT
eziu
tlán
Aca
yuca
nN
uevo
Lar
edo
Col
ima-
Vill
a de
Álv
arez
Cua
utla
Tam
pico
Tol
uca
Teh
uacá
nPa
chuc
aC
uern
avac
aG
uada
laja
raV
alle
de
Méx
ico
Pueb
la-T
laxc
ala
San
Fran
cisc
o de
l Rin
cón
Que
réta
roM
atam
oros
Mon
clov
a-Fr
onte
raC
órdo
baC
ancú
nG
uaym
asA
guas
calie
ntes
Xal
apa
Reyn
osa-
Río
Brav
oPu
erto
Val
lart
aC
oatz
acoa
lcos
Ver
acru
zC
elay
aV
illah
erm
osa
Aca
pulc
oSa
n Lu
is P
otos
íJu
árez
Tiju
ana
Tep
icLa
Lag
una
Mér
ida
Pied
ras
Neg
ras
Chi
huah
uaT
uxtl
a G
utié
rrez
Oax
aca
Oriz
aba
La P
ieda
d-Pé
njam
oLe
ónM
orel
iaT
laxc
ala-
Api
zaco
Salt
illo
Zam
ora-
Jaco
naT
ulan
cing
oO
cotl
ánM
exic
ali
Zaca
teca
s-G
uada
lupe
Poza
Ric
aT
ehua
ntep
ecRí
over
de-C
iuda
d Fe
rnán
dez
Mon
terre
yT
ecom
ánT
ula
Min
atit
lán
Wag
e in
equa
lity
0
0.1
0.2
0.3
0.4
0.5
0.6
Vill
aher
mos
aM
orel
iaC
elay
aT
uxtl
a G
utié
rrez
Oax
aca
Min
atit
lán
Tia
ngui
sten
coX
alap
aQ
ueré
taro
Zaca
teca
s-G
uada
lupe
Ver
acru
zT
oluc
aT
ula
Cór
doba
Oco
tlán
Tep
icO
rizab
aPa
chuc
aPo
za R
ica
Cue
rnav
aca
Zam
ora-
Jaco
naA
guas
calie
ntes
Pueb
la-T
laxc
ala
Col
ima-
Vill
a de
Álv
arez
Cua
utla
León
Tla
xcal
a-A
piza
coSa
n Lu
is P
otos
íT
eziu
tlán
Gua
dala
jara
La P
ieda
d-Pé
njam
oPu
erto
Val
lart
aT
ulan
cing
oT
ehua
cán
Salt
illo
Ríov
erde
-Ciu
dad
Fern
ánde
zC
ancú
nM
érid
aA
capu
lco
Gua
ymas
Val
le d
e M
éxic
oLa
Lag
una
Coa
tzac
oalc
osT
ampi
coT
ecom
ánT
ijuan
aSa
n Fr
anci
sco
del R
incó
nC
hihu
ahua
Mat
amor
osM
orol
eón-
Uria
ngat
oM
oncl
ova-
Fron
tera
Teh
uant
epec
Mon
terre
yA
cayu
can
Mex
ical
iN
uevo
Lar
edo
Reyn
osa-
Río
Brav
oJu
árez
Pied
ras
Neg
ras
Gin
i Coe
f�ci
ent
148

SDG 11 – SUSTAINABLE CITIES AND COMMUNITIES
State Indicators
PERCENTAGE OF THE POPULATION LACKING BASIC HOUSING SERVICES
AND WITHOUT ACCESS TO QUALITY AND SUFFICIENT LIVING SPACE51
• Despite a high degree of coverage for running water, sewage, sanita-tion and power services, as shown by the indicators for SDGs 6 and 7, some states have major deficiencies of basic housing services, which is considered to be a lack of running water on site, a lack of a connection to a sewer system or septic tank, a lack of electricity or the presence of a wood or charcoal stove without a chimney.
• Although the intensity of deficiencies in terms of quality and suffi-cient living space is lower, the states with a high percentage of the population lacking access to basic housing services also have a high-er percentage of the population lacking access to quality and suffi-cient living space, which is considered to be housing with walls and ceilings made of non-resistant materials, housing with dirt floors or the presence of more than 2.5 people per room.
51 CONEVAL, “Anexo Estadístico pobreza 2016”.
0
10
20
30
40
50
60
70
Percentage of the population lacking access to basic housing services
Percentage of the population lacking quality and sufficient living space
Perc
enta
ge o
f the
pop
ulat
ion
Oax
aca
Chi
apas
Gue
rrer
o
Taba
sco
Vera
cruz
Yuca
tán
Cam
pech
e
Hid
algo
Pueb
la
San
Luis
Pot
osí
Mic
hoac
án
Qui
ntan
a Ro
o
Nay
arit
Mor
elos
Gua
naju
ato
Sina
loa
Que
réta
ro
Baja
Cal
iforn
ia S
ur
Méx
ico
Tla
xcal
a
Zac
atec
as
Sono
ra
Tam
aulip
as
Col
ima
Dur
ango
Baja
Cal
iforn
ia
Chi
huah
ua
Coa
huila
Jalis
co
Nue
vo L
eón
Agu
asca
lient
es
Ciu
dad
de M
éxic
o
National average
National average
149

State Indicators
EMISSIONS OF SUSPENDED PARTICLES WITH DIAMETERS SMALLER THAN
2.5 MICROMETERS AND SMALLER THAN 10 MICROMETERS52
• Monterrey, Toluca, Salamanca, León, Irapuato and Silao are among the 25 most polluted cities in the Americas53, according to the con-centration of particulate matter with a diameter of 10 micrometers or less in the air, which the WHO considers to be the atmospheric pollutant with the greatest effect on human health.54
52 INEGI, “Catálogo Nacional de Indicadores, Emisión nacional de contaminantes por partículas suspendidas con diámetros menores de 2.5 micrómetros y menores de 10 micrómetros por fuente.”, 2011, http://www3.inegi.org.mx/sistemas/cni/escenario.aspx?idOrden=1.1&ind=6200011962&gen=751&d=n.
53 World Health Organization, “WHO Global Urban Ambient Air Pollution Database (update 2016),” WHO, 2016, http://www.who.int/phe/health_topics/outdoorair/databases/cities/en/.
54 World Health Organization, “Contaminación del Aire Ambiental,” WHO, January 24, 2017, https://www.paho.org/hq/index.php?option=com_content&view=arti-cle&id=12918%3A2017-ambient-air-pollution&catid=2619%3Aenvironmental-health&Itemid=42246&lang=es.
Wei
ghte
d to
ns
0
50000
100000
150000
200000
250000
PM 10 PM 2.5
México
San Lu
is Po
tosí
Michoac
án
Nuevo Le
ón
Yucatá
n
Ciudad de M
éxico
Queréta
ro
150

Metropolitan Area Indicators
AIR QUALITY55
MODAL SHARE56
• Modal share was calculated by evaluating commutes, broken down by mode of transportation, to determine if sustainable modes predomi-nated. The modes analyzed were private cars, public transportation, bicycles and walking. The highest scores correspond to cities where non-motorized and collective modes of transportation prevail.
55 INECC, “Informe Nacional de Calidad del Aire 2015” (Instituto Nacional de Ecología y Cambio Climático, 2016), http://www.gob.mx/inecc/articulos/nuevo-informe-nacional-de-calidad-del-aire-2015-mexico.
56 INEGI, “Encuesta Intercensal 2015, Tabulados”; BID, “Guía Metodológica Programa de Ciudades Emergentes y Sostenibles: Tercera edición”, October 1, 2016, http://publications.iadb.org/handle/11319/8119.
0
10
20
30
40
50
60
70
80
90
100
Tul
a
Cua
utla
Gua
dala
jara
Cue
rnav
aca
Tiju
ana
León
Chi
huah
ua
Mon
terre
y
Val
le d
e M
éxic
o
Pach
uca
Mex
ical
i
Tol
uca
Mor
elia
Mér
ida
Cel
aya
Pueb
la-T
laxc
ala
Tep
ic
Que
réta
ro
Scor
e
0
1
2
3
4
5
6
7
Chi
huah
uaM
exic
ali
Juár
ezN
uevo
Lar
edo
Mon
terre
ySa
ltill
oT
ijuan
aM
oncl
ova-
Fron
tera
Zaca
teca
s-G
uada
lupe
Que
réta
roT
epic
Tux
tla
Gut
iérre
zC
oatz
acoa
lcos
Pach
uca
Tam
pico
Tez
iutl
ánC
ancú
nV
illah
erm
osa
Puer
to V
alla
rta
Reyn
osa-
Río
Brav
oG
uada
laja
raM
orel
iaX
alap
aM
érid
aM
atam
oros
Col
ima-
Vill
a de
Álv
arez
Pueb
la-T
laxc
ala
León
Ver
acru
zPi
edra
s N
egra
sG
uaym
asSa
n Lu
is P
otos
íM
inat
itlá
nLa
Lag
una
Poza
Ric
aC
uern
avac
aC
órdo
baT
oluc
aT
iang
uist
enco
Oriz
aba
Oax
aca
Cel
aya
Val
le d
e M
éxic
oA
capu
lco
Agu
asca
lient
esT
ula
Teh
uant
epec
Tla
xcal
a-A
piza
coLa
Pie
dad-
Pénj
amo
Aca
yuca
nO
cotl
ánT
ecom
ánT
ulan
cing
oRí
over
de-C
iuda
d Fe
rnán
dez
Cua
utla
Mor
oleó
n-U
riang
ato
San
Fran
cisc
o de
l Rin
cón
Teh
uacá
nZa
mor
a-Ja
cona
Mod
al s
hare
151

GREEN SPACE PER CAPITA57
• None of the 59 metropolitan areas analyzed meets the standard of 9 m2 of green space per person, as recommended by the WHO.58
GROWTH OF URBAN SPRAWL59
57 Indicator calculated by the Mario Molina Center with information from INEGI, “Mar-co Geoestadístico Nacional”, 2015, http://www.inegi.org.mx/geo/contenidos/geo-estadistica/m_g_0.aspx.
58 Fuente: United Nations Conference on Housing and Sustainable Urban Devel-opment, “Habitat III Issue Paper 11. Public Space”, 2016, http://habitat3.org/the-new-urban-agenda/documents/issue-papers/.
59 INEGI, “Censo de Población y Vivienda 2010”, 2010, http://www.beta.inegi.org.mx/proyectos/ccpv/2010/; INEGI, “Encuesta Intercensal 2015, Tabulados”.
0
1
2
3
4
5
6
Teh
uant
epec
Gua
ymas
Cua
utla
Tia
ngui
sten
coT
eziu
tlán
Aca
yuca
nPo
za R
ica
Coa
tzac
oalc
osO
axac
aM
orol
eón-
Uria
ngat
oV
illah
erm
osa
Teh
uacá
nC
órdo
baO
rizab
aT
ula
Tla
xcal
a-A
piza
coRí
over
de-C
iuda
d Fe
rnán
dez
Tec
omán
Zam
ora-
Jaco
naV
erac
ruz
La P
ieda
d-Pé
njam
oM
inat
itlá
nPu
ebla
-Tla
xcal
aA
capu
lco
Cel
aya
Cue
rnav
aca
Tul
anci
ngo
Xal
apa
Tam
pico
Puer
to V
alla
rta
Oco
tlán
San
Fran
cisc
o de
l Rin
cón
Mat
amor
osN
uevo
Lar
edo
Tiju
ana
Tux
tla
Gut
iérre
zRe
ynos
a-Rí
o Br
avo
Tol
uca
Gua
dala
jara
Que
réta
roLe
ónV
alle
de
Méx
ico
Juár
ezZa
cate
cas-
Gua
dalu
peC
ancú
nM
orel
iaM
exic
ali
Pied
ras
Neg
ras
Tep
icM
oncl
ova-
Fron
tera
Col
ima-
Vill
a de
Álv
arez
San
Luis
Pot
osí
La L
agun
aM
onte
rrey
Pach
uca
Chi
huah
uaSa
ltill
oA
guas
calie
ntes
Mér
ida
m2 o
f gre
en s
pace
per
per
son
-0.2
0
0.2
0.4
0.6
0.8
1
1.2
Ríov
erde
-Ciu
dad
Fern
ánde
zC
uaut
laT
ula
Pueb
la-T
laxc
ala
Tla
xcal
a-A
piza
coO
rizab
aT
ehua
cán
Tam
pico
Salt
illo
Xal
apa
Mon
clov
a-Fr
onte
raV
illah
erm
osa
Agu
asca
lient
esV
alle
de
Méx
ico
Tux
tla
Gut
iérre
zO
cotl
ánC
uern
avac
aQ
ueré
taro
Tul
anci
ngo
Juár
ezC
órdo
baPi
edra
s N
egra
sT
ehua
ntep
ecM
orel
iaO
axac
aPa
chuc
aC
ancú
nT
epic
Puer
to V
alla
rta
Coa
tzac
oalc
osSa
n Fr
anci
sco
del R
incó
nT
oluc
aLa
Lag
una
Tiju
ana
San
Luis
Pot
osí
Tec
omán
Mat
amor
osM
inat
itlá
nZa
mor
a-Ja
cona
La P
ieda
d-Pé
njam
oM
onte
rrey
Nue
vo L
ared
oM
érid
aPo
za R
ica
Chi
huah
uaC
elay
aA
capu
lco
Zaca
teca
s-G
uada
lupe
León
Gua
dala
jara
Col
ima-
Vill
a de
Álv
arez
Ver
acru
zM
exic
ali
Reyn
osa-
Río
Brav
oG
uaym
asM
orol
eón-
Uria
ngat
oT
iang
uist
enco
Tez
iutl
ánA
cayu
can
Gro
wth
of
urba
n sp
raw
l
152
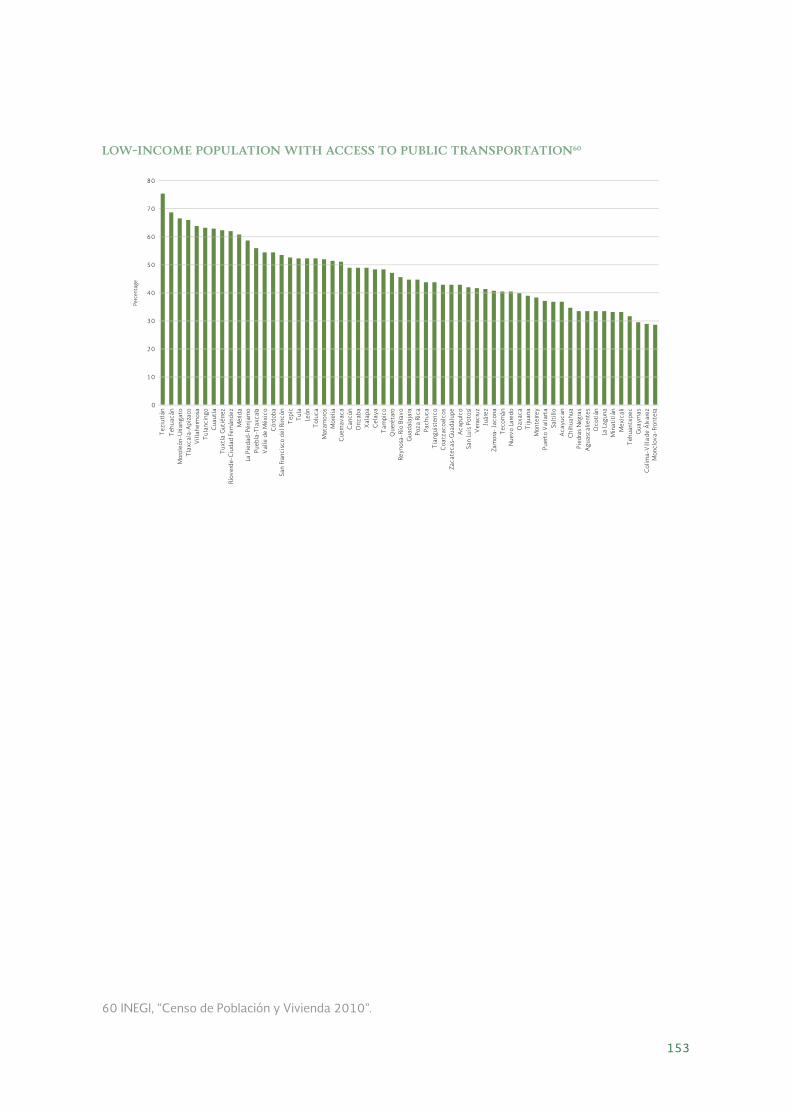
LOW-INCOME POPULATION WITH ACCESS TO PUBLIC TRANSPORTATION60
60 INEGI, “Censo de Población y Vivienda 2010”.
0
10
20
30
40
50
60
70
80
Mon
clov
a-Fr
onte
raC
olim
a-V
illa
de Á
lvar
ezG
uaym
asT
ehua
ntep
ecM
exic
ali
Min
atit
lán
La L
agun
aO
cotl
ánA
guas
calie
ntes
Pied
ras
Neg
ras
Chi
huah
uaA
cayu
can
Salt
illo
Puer
to V
alla
rta
Mon
terre
yT
ijuan
aO
axac
aN
uevo
Lar
edo
Tec
omán
Zam
ora-
Jaco
naJu
árez
Ver
acru
zSa
n Lu
is P
otos
íA
capu
lco
Zaca
teca
s-G
uada
lupe
Coa
tzac
oalc
osT
iang
uist
enco
Pach
uca
Poza
Ric
aG
uada
laja
raRe
ynos
a-Rí
o Br
avo
Que
réta
roT
ampi
coC
elay
aX
alap
aO
rizab
aC
ancú
nC
uern
avac
aM
orel
iaM
atam
oros
Tol
uca
León
Tul
aT
epic
San
Fran
cisc
o de
l Rin
cón
Cór
doba
Val
le d
e M
éxic
oPu
ebla
-Tla
xcal
aLa
Pie
dad-
Pénj
amo
Mér
ida
Ríov
erde
-Ciu
dad
Fern
ánde
zT
uxtl
a G
utié
rrez
Cua
utla
Tul
anci
ngo
Vill
aher
mos
aT
laxc
ala-
Api
zaco
Mor
oleó
n-U
riang
ato
Teh
uacá
n
Tez
iutl
án
Perc
enta
ge
153

SDG 12 – RESPONSIBLE CONSUMPTION AND PRODUCTION
State Indicators
PER CAPITA COLLECTION OF SOLID WASTE AND HOUSEHOLDS THAT
SEPARATE THEIR WASTE61
• The states that have a higher percentage of households that sepa-rate their waste are those that have lower quantities of waste col-lected per person.
61 INEGI, “Encuesta Intercensal 2015, Tabulados”.
Perc
enta
ge o
f hou
seho
lds
Kg.
of
solid
was
te p
er d
ay
0
0.2
0.4
0.6
0.8
1
1.2
1.4
1.6
1.8
2
0
10
20
30
40
50
60
70
80
Percentage of households that separate their waste Kg. of solid waste per person per day
154

Metropolitan Area Indicators
PER CAPITA GENERATION OF SOLID WASTE
REGULATORY FRAMEWORK FOR THE COMPREHENSIVE MANAGEMENT OF
SOLID WASTE
• This indicator was calculated based on information available on the websites of municipal governments regarding their waste manage-ment regulations. Points were calculated based on an evaluation that determines if municipal waste management regulations incor-porate the three principles established in the General Law on Waste Reduction and Comprehensive Waste Management (LGPGIR, for its acronym in Spanish).
0
0.5
1
1.5
2
2.5
3
Oriz
aba
San
Fran
cisc
o de
l Rin
cón
Tez
iutl
ánG
uaym
asT
oluc
aC
elay
aC
uaut
laLe
ónA
guas
calie
ntes
Teh
uacá
nT
ulan
cing
oSa
ltill
oM
atam
oros
Zaca
teca
s-G
uada
lupe
La L
agun
aC
órdo
baT
iang
uist
enco
Mex
ical
iT
laxc
ala-
Api
zaco
La P
ieda
d-Pé
njam
oM
onte
rrey
Zam
ora-
Jaco
naX
alap
aG
uada
laja
raV
illah
erm
osa
Tux
tla
Gut
iérre
zM
orol
eón-
Uria
ngat
oM
érid
aPo
za R
ica
Aca
yuca
nT
ehua
ntep
ecC
olim
a-V
illa
de Á
lvar
ezC
uern
avac
aT
ijuan
aJu
árez
Nue
vo L
ared
oRe
ynos
a-Rí
o Br
avo
Ríov
erde
-Ciu
dad
Fern
ánde
zPa
chuc
aPi
edra
s N
egra
sT
ampi
coM
oncl
ova-
Fron
tera
Pueb
la-T
laxc
ala
Min
atit
lán
Que
réta
roT
ula
Oco
tlán
San
Luis
Pot
osí
Aca
pulc
oO
axac
aT
ecom
ánC
hihu
ahua
Val
le d
e M
éxic
oC
ancú
nT
epic
Ver
acru
zC
oatz
acoa
lcos
Mor
elia
Puer
to V
alla
rta
Kilo
gram
s pe
r per
son
per d
ay
0
2
4
6
8
10
12
14
16
Tia
ngui
sten
coT
ulan
cing
oT
ula
Tez
iutl
ánO
axac
aC
órdo
baT
ehua
ntep
ecLa
Lag
una
Mex
ical
iV
erac
ruz
Mon
terre
yT
ijuan
aM
orel
iaT
ampi
coA
capu
lco
Juár
ezC
uern
avac
aPa
chuc
aSa
n Lu
is P
otos
íLa
Pie
dad-
Pénj
amo
Salt
illo
Chi
huah
uaT
ecom
ánN
uevo
Lar
edo
Que
réta
roC
olim
a-V
illa
de Á
lvar
ezM
atam
oros
Cua
utla
San
Fran
cisc
o de
l Rin
cón
Poza
Ric
aM
orol
eón-
Uria
ngat
oT
uxtl
a G
utié
rrez
Tla
xcal
a-A
piza
coC
elay
aM
inat
itlá
nO
rizab
aM
érid
aPu
erto
Val
lart
aT
ehua
cán
Mon
clov
a-Fr
onte
raRe
ynos
a-Rí
o Br
avo
Pueb
la-T
laxc
ala
Coa
tzac
oalc
osG
uada
laja
raLe
ónPi
edra
s N
egra
sX
alap
aA
cayu
can
Val
le d
e M
éxic
oZa
cate
cas-
Gua
dalu
peZa
mor
a-Ja
cona
Agu
asca
lient
esRí
over
de-C
iuda
d Fe
rnán
dez
Gua
ymas
Tol
uca
Vill
aher
mos
aT
epic
Oco
tlán
Can
cún
Scor
e fo
r the
regu
lato
ry f
ram
ewor
k fo
r the
com
preh
ensi
ve m
anag
emen
t (t
he h
ighe
r sco
re, t
he g
reat
er t
he c
ompl
ianc
e w
ith t
he G
ener
al L
aw
on W
aste
Red
uctio
n an
d C
ompr
ehen
sive
Was
te M
anag
emen
t)
155

SDG 13 – CLIMATE ACTION
State Indicators
SHARE OF NATIONAL CARBON MONOXIDE EMISSIONS62
62 INEGI, “Catálogo Nacional de Indicadores, Emisión nacional de contaminantes por monóxido de carbono por fuente.”, 2011, http://www3.inegi.org.mx/sistemas/cni/escenario.aspx?ind=6200011964&gen=748&d=n&idOrden=1.1.
10.5%
0.6%
156
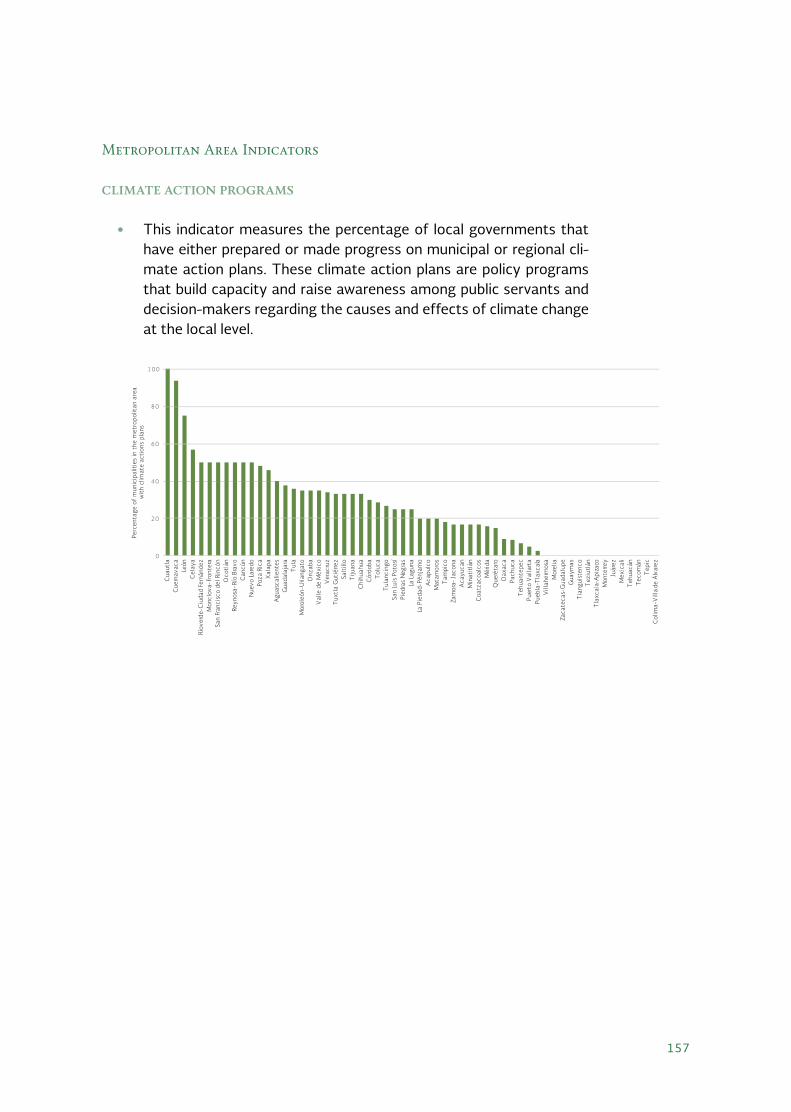
Metropolitan Area Indicators
CLIMATE ACTION PROGRAMS
• This indicator measures the percentage of local governments that have either prepared or made progress on municipal or regional cli-mate action plans. These climate action plans are policy programs that build capacity and raise awareness among public servants and decision-makers regarding the causes and effects of climate change at the local level.
0
20
40
60
80
100
Col
ima-
Vill
a de
Álv
arez
Tep
icT
ecom
ánT
ehua
cán
Mex
ical
iJu
árez
Mon
terre
yT
laxc
ala-
Api
zaco
Tez
iutl
ánT
iang
uist
enco
Gua
ymas
Zaca
teca
s-G
uada
lupe
Mor
elia
Vill
aher
mos
aPu
ebla
-Tla
xcal
aPu
erto
Val
lart
aT
ehua
ntep
ecPa
chuc
aO
axac
aQ
ueré
taro
Mér
ida
Coa
tzac
oalc
osM
inat
itlá
nA
cayu
can
Zam
ora-
Jaco
naT
ampi
coM
atam
oros
Aca
pulc
oLa
Pie
dad-
Pénj
amo
La L
agun
aPi
edra
s N
egra
sSa
n Lu
is P
otos
íT
ulan
cing
oT
oluc
aC
órdo
baC
hihu
ahua
Tiju
ana
Salt
illo
Tux
tla
Gut
iérre
zV
erac
ruz
Val
le d
e M
éxic
oO
rizab
aM
orol
eón-
Uria
ngat
oT
ula
Gua
dala
jara
Agu
asca
lient
esX
alap
aPo
za R
ica
Nue
vo L
ared
oC
ancú
nRe
ynos
a-Rí
o Br
avo
Oco
tlán
San
Fran
cisc
o de
l Rin
cón
Mon
clov
a-Fr
onte
raRí
over
de-C
iuda
d Fe
rnán
dez
Cel
aya
León
Cue
rnav
aca
Cua
utla
Perc
enta
ge o
f m
unic
ipal
itie
s in
the
met
ropo
litan
are
a w
ith
clim
ate
acti
ons
plan
s
157

SDG 14 – LIFE BELOW WATER
• Part of Mexico’s Federal Maritime Zone administered by the Nation-al Commission on Natural Protected Areas. These federal zones are strategic areas that are protected to guarantee the sustainable management of marine and coastal ecosystems.
State Indicators
PERCENTAGE OF THE FEDERAL MARITIME ZONE SET ASIDE FOR
CONSERVATION63
63 CONANP, “Prontuario Estadístico y Geográfico de las Áreas Naturales Protegidas de México”, 2016, http://entorno.conanp.gob.mx/docs/PRONTUARIO-ANP-2015.pdf.
0
5
10
15
20
25
30
35
40
45
Perc
enta
ge o
f the
Fed
eral
Mar
itim
e Z
one
Baja California and Northern Paci�c
Northwest and Upper Gulf of
California
Southern Border, Isthmus and
Southern Paci�c
Yucatán Peninsula and Mexican
Caribbean
Coastal Plain and Gulf of Mexico
West and Central Paci�c
158

SDG 15 – LIFE ON LAND
State Indicators
PERCENTAGE OF THE STATE’S SURFACE AREA SET ASIDE FOR FEDERAL
NATURAL PROTECTED AREAS64
EXISTENCE OF FORESTS AND JUNGLES65
64 Environmental and Natural Resources Secretariat, “Superficie estimada de Áreas Naturales Protegidas federales por entidad federativa,” 2016, http://dgeiawf.semarnat.gob.mx:8080/ibi_apps/WFServlet?IBIF_ex=D3_BIODIV04_20&IBIC_user=dgeia_mce&IBIC_pass=dgeia_mce&NOMBREENTIDAD=*.
65 INEGI, “Uso de suelo y vegetación, serie V”, 2011, http://www.beta.inegi.org.mx/temas/mapas/usosuelo/.
42.2%
0.2%
79%
2%
159

LOSS OF VIRGIN FORESTS AND JUNGLES IN THE PERIOD 1976-2008
16%
0%
-80%
160

SDG 16 – PEACE, JUSTICE AND STRONG INSTITUTIONS
HOMICIDE RATE PER 100,000 INHABITANTS66
State Indicators
Metropolitan Area Indicators67
66 SEGOB, “Secretariado Ejecutivo del Sistema Nacional de Seguridad Pública, Indicen-cia delictiva del fuero común”, 2017, http://secretariadoejecutivo.gob.mx/inciden-cia-delictiva/incidencia-delictiva-fuero-comun.php.
67 INEGI, “Mortalidad, Tabulados”.
60.44
1.75
0
20
40
60
80
100
120
140
160
Tia
ngui
sten
coO
rizab
aA
guas
calie
ntes
Mér
ida
Salt
illo
Tez
iutl
ánT
laxc
ala-
Api
zaco
Que
réta
roV
erac
ruz
Mon
clov
a-Fr
onte
raT
oluc
aRí
over
de-C
iuda
d Fe
rnán
dez
Tux
tla
Gut
iérre
zPa
chuc
aPu
ebla
-Tla
xcal
aT
epic
Tam
pico
Tul
aM
exic
ali
La L
agun
aM
onte
rrey
Teh
uacá
nT
ulan
cing
oPu
erto
Val
lart
aRe
ynos
a-Rí
o Br
avo
Mor
oleó
n-U
riang
ato
Pied
ras
Neg
ras
Can
cún
San
Luis
Pot
osí
Xal
apa
Mat
amor
osM
orel
iaG
uaym
asLe
ónV
alle
de
Méx
ico
Oco
tlán
San
Fran
cisc
o de
l Rin
cón
Oax
aca
Gua
dala
jara
Teh
uant
epec
Cór
doba
Vill
aher
mos
aN
uevo
Lar
edo
Min
atit
lán
Coa
tzac
oalc
osC
elay
aC
uern
avac
aA
cayu
can
Cua
utla
Poza
Ric
aC
hihu
ahua
Juár
ezT
ijuan
aZa
cate
cas-
Gua
dalu
peLa
Pie
dad-
Pénj
amo
Col
ima-
Vill
a de
Álv
are z
Zam
ora-
Jaco
naA
capu
lco
Tec
omán
Hom
icid
e ra
te p
er 1
00
,00
0 in
habi
tant
s
161
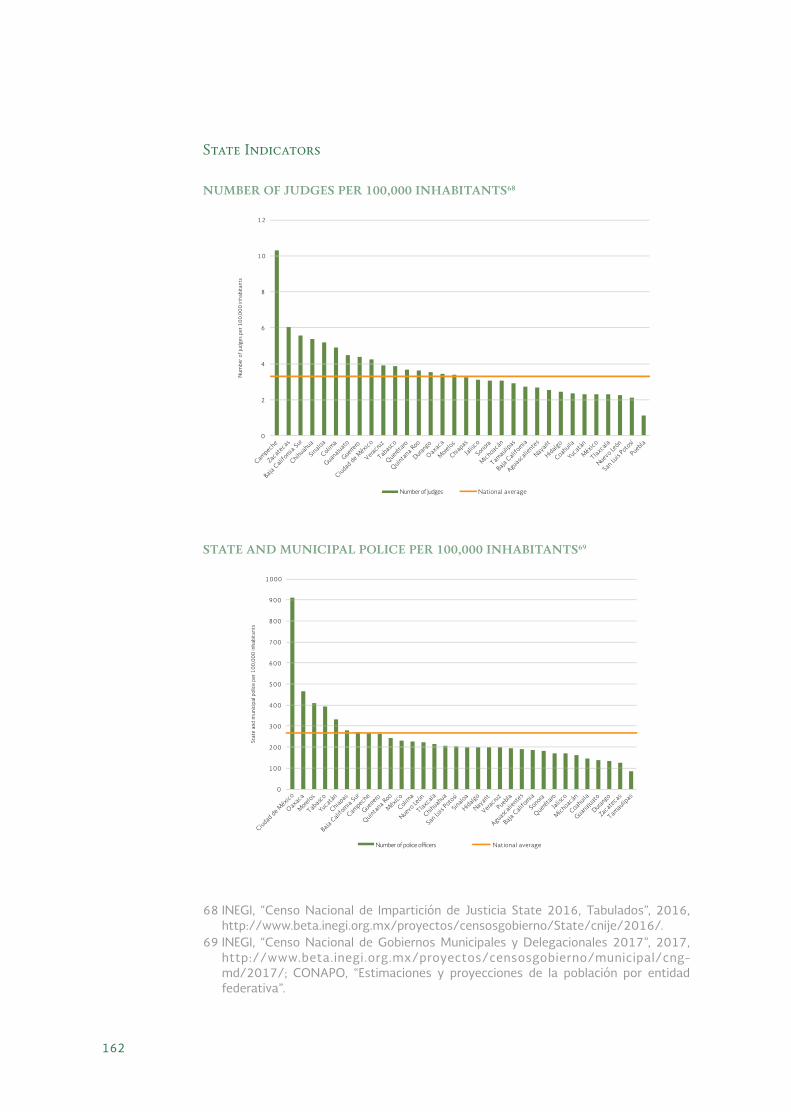
State Indicators
NUMBER OF JUDGES PER 100,000 INHABITANTS68
STATE AND MUNICIPAL POLICE PER 100,000 INHABITANTS69
68 INEGI, “Censo Nacional de Impartición de Justicia State 2016, Tabulados”, 2016, http://www.beta.inegi.org.mx/proyectos/censosgobierno/State/cnije/2016/.
69 INEGI, “Censo Nacional de Gobiernos Municipales y Delegacionales 2017”, 2017, http://www.beta.inegi.org.mx/proyectos/censosgobierno/municipal/cng-md/2017/; CONAPO, “Estimaciones y proyecciones de la población por entidad federativa”.
0
2
4
6
8
10
12
Number of judges National average
Num
ber o
f ju
dges
per
10
0,0
00
inha
bita
nts
0
100
200
300
400
500
600
700
800
900
1000
Number of police of�cers National average
Stat
e an
d m
unic
ipal
pol
ice
per 1
00
,00
0 in
habi
tant
s
162

State Indicators
OPEN GOVERNMENT INDEX AND TRANSPARENCY METRIC70
70 CIDE, “Métrica de Gobierno Abierto, Reporte de Resultados 2017” (Centro de Investigación y Docencia Económicas, 2017), http://rendiciondecuentas.org.mx/metrica-de-gobierno-abierto/; CIDE, “Métrica de la Transparencia” (Centro de Investigación y Docencia Económicas, 2014), http://www.metricadetransparencia.cide.edu/?section=Documentos.
0
0.1
0.2
0.3
0.4
0.5
0.6
0.7
0.8
0.9
Open government index Transparency index
Perf
orm
ance
(hi
gher
num
bers
are
bet
ter)
Ciu
dad
de M
éxic
o
Coa
huila
San
Luis
Pot
osí
Chi
huah
ua
Vera
cruz
Taba
sco
Nue
vo L
eón
Méx
ico
Dur
ango
Mor
elos
Cam
pech
e
Sono
ra
Zac
atec
as
Sina
loa
Jalis
co
Agu
asca
lient
es
Pueb
la
Col
ima
Chi
apas
Tla
xcal
a
Nay
arit
Gua
naju
ato
Yuca
tán
Baja
Cal
iforn
ia
Tam
aulip
as
Hid
algo
Oax
aca
Qui
ntan
a Ro
o
Que
réta
ro
Gue
rrer
o
Mic
hoac
án
Baja
Cal
iforn
ia S
ur
163

State Indicators
RATE OF PEOPLE AGE 18 AND ABOVE WHO FEEL THEIR NEIGHBORHOOD OR
TOWN IS UNSAFE, PER 100,000 INHABITANTS AGE 18 AND ABOVE
The perception of insecurity is not always connected to the homicide rate. The State of Mexico has the highest perception of insecurity, but it comes in 22nd in terms of its homicide rate, while Colima has the highest homicide rate, but comes in 8th in terms of perception of insecurity.
Metropolitan Area Indicators
MUNICIPAL BUDGET TRANSPARENCY INDEX
0
10000
20000
30000
40000
50000
60000
70000
80000
Rate National average
Rate
of
peop
le a
ge 1
8 a
nd a
bove
who
feel
the
ir ne
ighb
orho
od o
r tow
n is
uns
afe,
pe
r 10
0,0
00
inha
bita
nts
age
18
and
abo
ve
Méx
ico
Ciudad de M
éxico
Queréta
ro
Nuevo Le
ón
San Lu
is Po
tosí
Yucatá
n
Mich
oacán
0
10
20
30
40
50
60
70
Tia
ngui
sten
coT
eziu
tlán
Aca
yuca
nT
ulan
cing
oM
oncl
ova-
Fron
tera
Juár
ezM
onte
rrey
Pach
uca
Teh
uant
epec
Que
réta
roPu
ebla
-Tla
xcal
aT
ecom
ánT
ehua
cán
Can
cún
Cel
aya
Tul
aO
axac
aT
ampi
coM
érid
aA
capu
lco
Gua
ymas
Zam
ora-
Jaco
naZa
cate
cas-
Gua
dalu
peT
uxtl
a G
utié
rrez
Tol
uca
San
Luis
Pot
osí
Tla
xcal
a-A
piza
coPu
erto
Val
lart
aC
olim
a-V
illa
de Á
lvar
ezN
uevo
Lar
edo
Mex
ical
iSa
n Fr
anci
sco
del R
incó
nV
illah
erm
osa
Chi
huah
uaO
cotl
ánM
inat
itlá
nM
atam
oros
Ver
acru
zLe
ónPi
edra
s N
egra
sLa
Pie
dad-
Pénj
amo
Mor
elia
Xal
apa
Poza
Ric
aC
uern
avac
aC
uaut
laC
órdo
baO
rizab
aV
alle
de
Méx
ico
La L
agun
aSa
ltill
oC
oatz
acoa
lcos
Gua
dala
jara
Ríov
erde
-Ciu
dad
Fern
ánde
zA
guas
calie
ntes
Tep
icRe
ynos
a-Rí
o Br
avo
Mor
oleó
n-U
riang
ato
Tiju
ana
Mun
icip
al B
udge
t Tr
ansp
aren
cy In
dex
perf
orm
ance
(a
hig
her r
atin
g m
eans
tha
t m
ore
info
rmat
ion
on t
he m
unic
ipal
bud
get
is a
vaila
ble)
164

SDG 17 – PARTNERSHIPS FOR THE GOALS
• Measuring this goal at the subnational level proved to be particularly challenging. The national indicators defined by the CTEODS are not disaggregated at the subnational level, while the global indicators take the country as a whole as the basic unit or have a supranational perspective.
State Indicators
NUMBER OF INTERNATIONAL DEVELOPMENT COOPERATION PROJECTS PER
STATE71
This mapping of international development cooperation projects and ac-tions by subnational governments was jointly conducted by AMEXCID and the UNDP. The results of this project will be published in 2018 in the report Mapping of International Development Cooperation Projects and Actions by Subnational Governments in Mexico.
71 AMEXCID and UNDP, “Mapeo de proyectos y acciones de cooperación internacional de gobiernos subnacionales en México,” August, 2018
18
Number of projects
0
165

FINANCIAL DEPENDENCE72
State Indicators
Metropolitan Area Indicators
72 INEGI, “Finanzas públicas Statees y municipales”, 2016, http://www.beta.inegi.org.mx/proyectos/registros/economicas/finanzas/.
0
5
10
15
20
25
30
35
40
45
50
Perc
enta
ge o
f the
sta
te b
udge
t th
at is
dep
ende
nt o
n th
e fe
dera
l tax
es
0
10
20
30
40
50
60
70
80
90
Tez
iutl
ánPu
erto
Val
lart
aC
ancú
nQ
ueré
taro
Cua
utla
Teh
uant
epec
La L
agun
aC
uern
avac
aJu
árez
Tul
aA
capu
lco
Poza
Ric
aLa
Pie
dad-
Pénj
amo
Mor
elia
Pach
uca
Cel
aya
Tul
anci
ngo
Mér
ida
Teh
uacá
nG
uaym
asM
onte
rrey
Xal
apa
Aca
yuca
nC
hihu
ahua
Min
atit
lán
Zam
ora-
Jaco
naM
exic
ali
Gua
dala
jara
Oax
aca
Pied
ras
Neg
ras
Salt
illo
San
Fran
cisc
o de
l Rin
cón
Pueb
la-T
laxc
ala
Tec
omán
Oco
tlán
Val
le d
e M
éxic
oA
guas
calie
ntes
Tol
uca
Cór
doba
León
San
Luis
Pot
osí
Tep
icC
olim
a-V
illa
de Á
lvar
ezZa
cate
cas-
Gua
dalu
peT
laxc
ala-
Api
zaco
Ver
acru
zT
uxtl
a G
utié
rrez
Oriz
aba
Mon
clov
a-Fr
onte
raRí
over
de-C
iuda
d Fe
rnán
dez
Tia
ngui
sten
coT
ampi
coM
orol
eón-
Uria
ngat
oT
ijuan
aRe
ynos
a-Rí
o Br
avo
Mat
amor
osV
illah
erm
osa
Coa
tzac
oalc
osN
uevo
Lar
edo
Perc
enta
ge o
f the
bud
get
that
is d
epen
dent
on
the
othe
r lev
els
of g
over
nmen
t
166

SHARE OF TOTAL EXPORTS, BY STATE73
CONCLUSION
The indicators presented in this appendix show major differences between states, between metropolitan areas and even between metropolitan areas and the states in which they are located. This highlights the importance of the local implementation of the 2030 Agenda. State and municipal govern-ments should have the capacity to detect areas of opportunity and focus policies to address them in accordance with the priorities and programs defined at the federal level.
The central axis of this Agenda is “leaving no one behind”. To achieve this, and ensure that development benefits the entire country, it is essential to have a subnational vision. Progress towards the Sustainable Development Goals will be measured not only with national averages, but also with dis-aggregated data.
73 INEGI, “Exportaciones por Entidad Federativa”, 2015, http://www.inegi.org.mx/est/contenidos/proyectos/registros/economicas/exporta_ef/default.aspx.
12%
Less than 1%
167

Special thanks for providing the photographic material used in this National Voluntary Review goes to:
Page 9: Archive of the Presidency of the Republic / General Coordination of Social Communication and Spokesperson of the Government of the Republic
Page 11: Archive of the Presidency of the Republic / General Coordination of Social Communication and Spokesperson of the Government of the Republic
Page 12: Archive of the Presidency of the Republic / General Coordination of Social Communication and Spokesperson of the Government of the Republic
Page 18: Santiago Arau
Page 22: Stephan Visser
Page 24: Archive of the Presidency of the Republic / General Coordination of Social Communication and Spokesperson of the Government of the Republic
Page 26: “Young look” UNFPA Mexico
Page 30: Government of the state of Hidalgo ®
Page 31: Government of the State of Mexico
Page 34: Santiago Arau
Page 39: Santiago Arau
Page 40: Santiago Arau
Page 44: Stephan Visser
Page 46: Archive of the Presidency of the Republic / General Coordination of Social Communication and Spokesperson of the Government of the Republic
Page 49: Luz Ramírez González
Page 50: Archive of the Presidency of the Republic / General Coordination of Social Communication and Spokesperson of the Government of the Republic
Page 53: Santiago Arau
Page 56: Sim Visser
Page 58: Santiago Arau
Page 60: Santiago Arau
Page 65: Archive of the Presidency of the Republic / General Coordination of Social Communication and Spokesperson of the Government of the Republic
Page 66: Archive of the Presidency of the Republic / General Coordination of Social Communication and Spokesperson of the Government of the Republic
Page 69: Archive of the Presidency of the Republic / General Coordination of Social Communication and Spokesperson of the Government of the Republic
Page 72: Santiago Arau
Page 74: Archive of the Presidency of the Republic / General Coordination of Social Communication and Spokesperson of the Government of the Republic
Page 76: Santiago Arau
Page 77: Santiago Arau
Page 79: Archive of the Presidency of the Republic / General Coordination of Social Communication and Spokesperson of the Government of the Republic
Page 80: Santiago Arau
Page 82: Archive of the Presidency of the Republic / General Coordination of Social Communication and Spokesperson of the Government of the Republic
Page 83: Santiago Arau
Page 84: Archive of the Presidency of the Republic / General Coordination of Social Communication and Spokesperson of the Government of the Republic
Page 87: Santiago Arau
Page 88: Archive of the Presidency of the Republic / General Coordination of Social Communication and Spokesperson of the Government of the Republic
Page 90: Archive of the Presidency of the Republic / General Coordination of Social Communication and Spokesperson of the Government of the Republic
Page 97: CONAGO
Page 98: top - Archive of the Presidency of the Republic / General Coordination of Social Communication and Spokesperson of the Government of the Republic
Page 98: Middle and bottom - INDESOL
PORTADA INFORME NACIONAL VOLUNTARIO OK.indd 4 7/5/18 9:00 PM

VOLUNTARY NATIONAL REVIEWFOR THE HIGH-LEVEL POLITICAL FORUM
ON SUSTAINABLE DEVELOPMENTBasIS FOR A LONG-TERM SUSTAINABLE
DEVELOPMENT VISION IN MEXICO
progress on the implementation of the 2030 Agenda
2018VOLU
NTAR
Y NA
TION
AL R
EVIE
W F
OR T
HE H
IGH-
LEVE
L POL
ITIC
AL F
ORUM
ON
SUST
AINA
BLE
DEVE
LOPM
ENT
2018
PORTADA INFORME NACIONAL VOLUNTARIO OK.indd 3 7/5/18 9:00 PM