volvo car group results presentation second …/media/files/v/... · volvo cars or any security,...
TRANSCRIPT

VOLVO CAR GROUP RESULTS PRESENTATION SECOND QUARTER 2019
HANS OSCARSSON
CHIEF FINACIAL OFFICER
PER ANSGAR
VP GROUP REPORTING
THERESE JANDÉR
HEAD OF INVESTOR RELATIONS
By accepting this document, the person to whom it is provided (the “Recipient”) agrees to be bound by the following obligations and limitations.
This document has been prepared and issued by Volvo Car AB (together with its subsidiaries, “Volvo Cars”).
The information contained in this document is derived from sources that have not been independently verified. Except in the case of fraudulent misrepresentation, no responsibility or liability is accepted by Volvo Cars or by any of its respective officers, employees, affiliates or agents in relation to the accuracy, completeness or sufficiency of any information contained herein or any other written or oral information made available by Volvo Cars in connection therewith or any data which any such information generates, or for any loss whatsoever arising from or in connection with the use of or reliance on this document and any such liability is expressly disclaimed. Analyses and opinions contained herein may be based on assumptions that, if altered, can change the analyses or opinions expressed. This document speaks as of the date hereof and in providing this document, Volvo Cars gives no undertaking and is under no obligation to provide the Recipient with access to any additional information or to update this document or to correct any inaccuracies in it which may become apparent. Volvo Cars’ past performance is not necessarily indicative of future results and nothing contained herein shall constitute any representation or warranty as to future performance of Volvo Cars or any security, credit, currency, rate or other market or economic measure. Nor does this document constitute a recommendation with respect to any securities.
DISCLAIMER
Volvo Car Group Results Presentation January- June 2019 2

XC40 in Luqiao
• Capacity increase and benefit from local production
• High demand has exceeded our expectations
• Three car models on a single production line (CMA)
Battery deal with Asian suppliers
• Battery supply for future cars secured with CATL and LG Chem
• Major step towards realizing 2025 electrification ambition
Uber car
• First production ready car, capable of autonomous drive
• Developed together with Uber
• Part of Volvo Cars’ ambition to be the partner of choice for ride-hailing companies
Volvo Car Group Results Presentation January- June 2019 3
OPERATIONAL HIGHLIGHTS Q2 2019
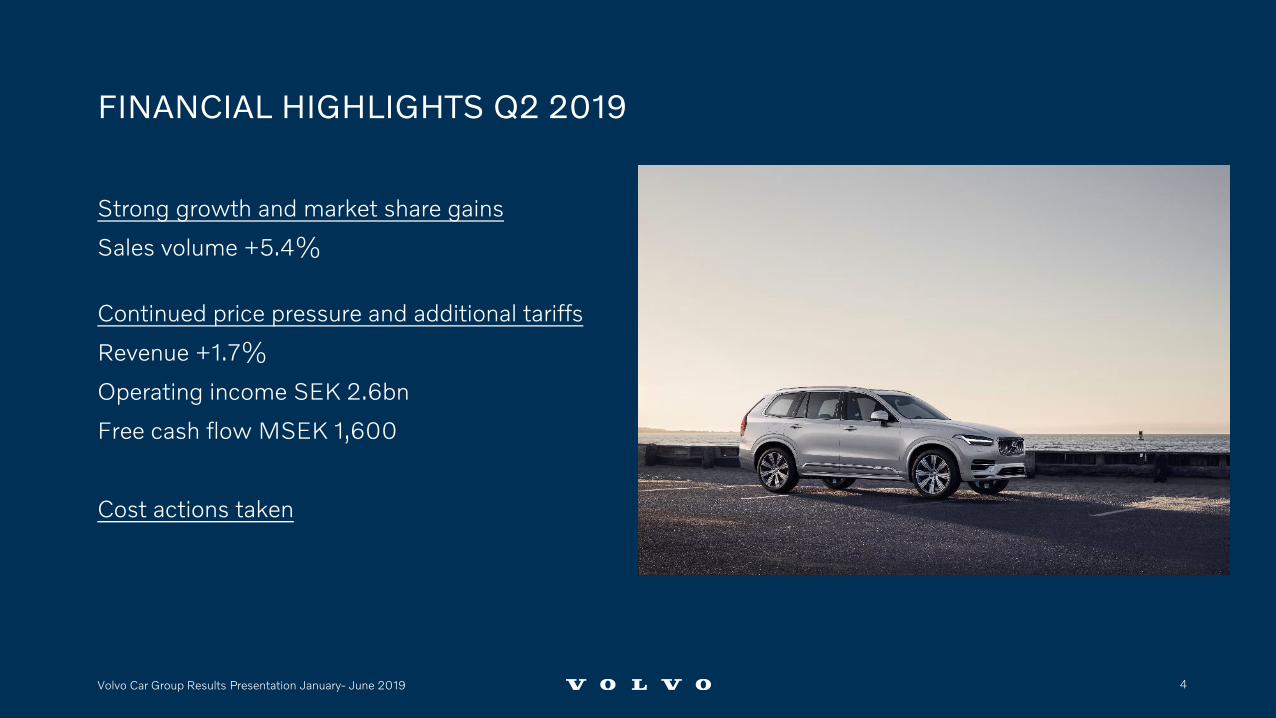
Strong growth and market share gains
Sales volume +5.4%
Continued price pressure and additional tariffs
Revenue +1.7%
Operating income SEK 2.6bn
Free cash flow MSEK 1,600
Cost actions taken
Volvo Car Group Results Presentation January- June 2019 4
FINANCIAL HIGHLIGHTS Q2 2019

CHINA+15.7%37,855 Units
EUROPE+3.5%88,029 Units
US+1.9%
28,062 Units
GLOBAL +5.4%179,506 Units
GLOBAL SALES DEVELOPMENT Q2 2019
Comparable period: Apr – Jun 2018Europe is defined as EU28 + EFTA
OTHER +2.5%25,560Units
Volvo Car Group Results Presentation January- June 2019
5

Retail sales by carline
61%
13%
29%
16%
55%
26%
Q2 2018 Q2 2019
170,232179,506
+5%
S V XC
Retail sales by market
Q2 2018
21%
15%14%
16%
50%
16%
19%
170,232
49%
Q2 2019
179,506+5%
USOther China Europe
Q2 2019 SALES DISTRIBUTION
Volvo Car Group Results Presentation January- June 2019 6

FINANCIALS
Volvo Car Group Results Presentation January- June 2019 7

Net revenue (MSEK)Retail sales (units)
EBIT (MSEK)
Q219Q218 H118 H119
340,800
170,200 179,500
317,600+5%
+7%
Q219Q218 H119H118
66,000 67,200
122,900 130,100+2%
+6%
4,200
Q218 Q219 H119H118
7,800
2,600
5,500-38%
-29%
6.4%3.9%
Net income (MSEK)
Q218 Q219 H118 H119
3,0001,400
5,600
3,400
-53%
-39%
Capex (MSEK)
Free cash flow (MSEK)
850
Q218 Q219
-2,800
1,600
H118 H119
3,600
5,500
Q218 H119
5,700
Q219 H118
11,200 11,100-4%
-1%
6.4% 4.2%
KEY FINANCIAL DEVELOPMENTS Q2 AND H1 2019
Volvo Car Group Results Presentation January- June 2019 8
Net revenue (MSEK)
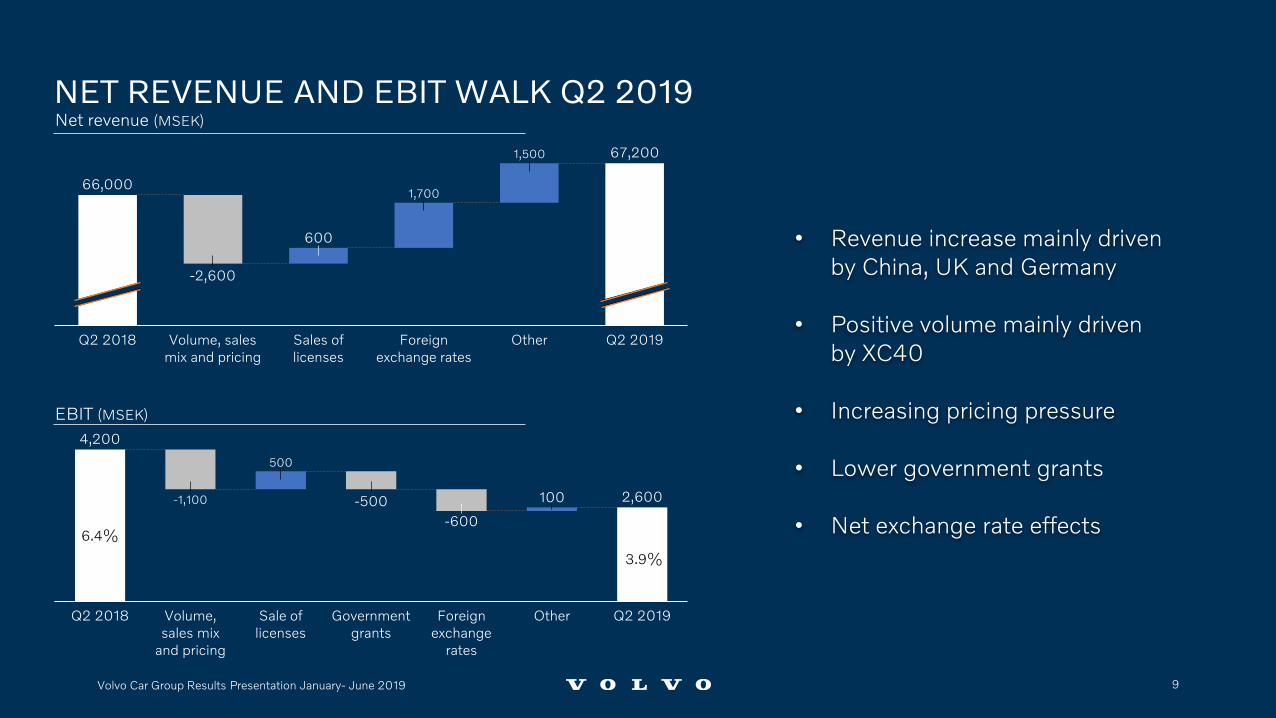
600
Volume, sales mix and pricing
-2,600
Q2 2018 Sales of licenses
1,700
Foreign exchange rates
Q2 2019
1,500
66,000
Other
67,200
NET REVENUE AND EBIT WALK Q2 2019
500
100
Q2 2018 Q2 2019Sale of licenses
-500-1,100
Volume, sales mix
and pricing
Government grants
-600
Foreign exchange
rates
Other
4,200
2,600
EBIT (MSEK)
• Revenue increase mainly driven by China, UK and Germany
• Positive volume mainly driven by XC40
• Increasing pricing pressure
• Lower government grants
• Net exchange rate effects6.4%
3.9%
Volvo Car Group Results Presentation January- June 2019 9

Net revenue (MSEK)
300 900
Volume, sales mix and pricing
H1 2018 Sales of licences
4,000
Foreign exchange rates
2,000
Other H1 2019
122,900
130,100
NET REVENUE AND EBIT WALK H1 2019
500
Volume, sales mix
and pricing
-500
H1 2018
-500
Sale of licenses
-1,400
Government grants
OtherForeign exchange
rates
-400
H1 2019
7,800
5,500
EBIT (MSEK)
• Revenue increase mainly driven by China, UK and Germany
• Positive volume and sales mix mainly driven by XC40
• Increasing pricing pressure
• Increase in license sales YoY
• Lower government grants
• Net exchange rate effects6.4%
4.2%
Volvo Car Group Results Presentation January- June 2019 10

35,100
13,500
2019 Q1 Liquidity
2,700
6,500
EBITDA
3,600
Other**
-2,900
Working capital*
3,500
-5,500
Investments Financing***
13,700
4,200
40,300
2019 Q2 Liquidity
51,300
58,200
CashUndrawn credit facilities Marketable securities
MSEK
Free cash flow MSEK 1,600
CASH FLOW MOVEMENTS Q2 2019
Volvo Car Group Results Presentation January- June 2019 11
* Change in inventories, accounts receivable and accounts payable, ** Interest, tax and changes in other items, *** Adjusted for exchange on cash
• Seasonal working capital changes, including:• Higher inventory due to
sales growth and expanding business
• Higher receivables on the back of sold licenses
• Investments mainly relates to capacity increase, new car models and technology
• Financing net of new bondsand repayment of maturing debt

EBITDA
13,300
13,300
1,600
40,200
Financing***2018 Q4 Liquidity
-7,500
Working capital*
Other** Investments
2,900
13,700
4,200
40,300
2019 Q2 Liquidity
55,10058,200
2,500
-11,100
Undrawn credit facilities Marketable securities Cash
MSEK Free cash flow MSEK -2,800
CASH FLOW MOVEMENTS H1 2019
Volvo Car Group Results Presentation January- June 2019 12
* Change in inventories, accounts receivable and accounts payable, ** Interest, tax and changes in other items, *** Adjusted for exchange on cash
• Seasonal working capital changes, including:• Higher inventory due to
sales growth, expanding business and change in logistics flow
• Higher receivables on the back of sold licenses
• Investments mainly related to capacity increase, new car models and technology
• Financing net of new bonds, repayment and dividend during Q1

R&D Expenses (SEKbn)
2018
5.2%
2014
5.9%
20172015 2016
5.7%4.9%
LTM H1 2019
4.8% 5.2%
10.2
7.2
9.510.2
12.1
13.5
% of Revenue R&D expenses
Capex (SEKbn)
10.1%
8.6
5.2 4.7
8.5%
9.2
10.8%
6.4
13.1
2016
8.5%
12.8%
9.7
17.0
2017
22.1
LTM H1 2019
2015
8.7%
8.5
26.7
13.6
2014 2018
9.4
12.7
13.913.8
19.5
22.1
% of Revenue
Intangible investments
Tangible investments
CAPEX AND R&D
Volvo Car Group Results Presentation January- June 2019 13

29,400
2,600
Liquidity
4,200
40,300
13,700
Debt
58,200
32,00012,500
26,200
Undrawn Credit Facilities
Long-term Debt
Marketable Securities
Short-term Debt
Cash & Cash Equivalents
MSEK
Net cash position of SEK 12.5bn(Q1 2019 SEK 11.9bn)
LIQUIDITY & DEBT
Volvo Car Group Results Presentation January- June 2019 14

200
5,700
2020 2021
400
3,000
2022
400
2,000
2023
1,100
6,4002,400
2025
400
5,300
2026
58,200
1,200
4,000
7,800
3,400
7,500
2019 June 30
5,300
2,500
2019 2024
MSEK
68%
32%
Bonds
Loans
Funding by type
AMORTIZATION SCHEDULE
Liquidity BondsLoans
Volvo Car Group Results Presentation January- June 2019 15

COST REDUCTIONS
Staff reduced by 750 people
Cost reduction in bought services
Planned actions to lower cost run rate by SEK 2bn
Further actions will reduce costs into 2020
Volvo Car Group Results Presentation January- June 2019 16
H1 2019 H2 2019 H1 2020
SEK 1bn
SEK 1bn

2019 H2 - OUTLOOK
Continued growth in sales
Continued pressure on margins
Additional cost reductions of 1 + 1 billion SEK
Strengthened profit vs H2 2018
Volvo Car Group Results Presentation January- June 2019 17

Volvo Car Group Results Presentation January- June 2019 18
Q&A

Longer Term Ambitions
Direct consumer relationships >5 million
Subscription with recurring revenue 50%
Pure electric cars 50%
Autonomous cars 30%
Naturally hedged global production
Superior growth
Premium OEM profitability
Volvo Car Group Results Presentation January- June 2019 19

Capturing new mass market consumer group
(30%)
A market leading AD/ADAS software
developer
(50%)
Spearheading electrification
Solutions and services for smarted mobility
My car sometimes
Strong brand with the premium segment
Robotaxi
Wholesale business (50%)
Subscription services
My car always
Care by VOLVO
A NEW STRUCTURE FOR THE FUTURE
Strategic affiliatesThe Volvo Car Group
Direct consumer business Direct consumer business
Volvo Car Group Results Presentation January- June 2019 20

Volvo Car Group Results Presentation January- June 2019 21