vulnerability analysis of urban rail transit networks: … analysis of urban rail transit networks:...
TRANSCRIPT

Sustainability 2015, 7, 6919-6936; doi:10.3390/su7066919
sustainability ISSN 2071-1050
www.mdpi.com/journal/sustainability
Article
Vulnerability Analysis of Urban Rail Transit Networks: A Case Study of Shanghai, China
Daniel (Jian) Sun 1,2, Yuhan Zhao 2,3,* and Qing-Chang Lu 1
1 State Key Laboratory of Ocean Engineering, School of Naval Architecture,
Ocean & Civil Engineering, Shanghai Jiao Tong University, Shanghai 200240, China;
E-Mails: [email protected] (D.J.S.); [email protected] (Q.-C.L.) 2 Transportation Research Center, School of Naval Architecture, Ocean and Civil Engineering,
Shanghai Jiao Tong University, Shanghai 200240, China 3 Department of Management, Technology and Economics, ETH Zurich, CH-8093 Zurich,
Switzerland
* Author to whom correspondence should be addressed; E-Mail: [email protected];
Tel.: +86-21-3420-6674; Fax: +86-21-3420-6197.
Academic Editor: Marc A. Rosen
Received: 29 March 2015 / Accepted: 30 April 2015 / Published: 28 May 2015
Abstract: Rail transit is developing rapidly in major cities of China and has become a key
component of urban transport. Nevertheless, the security and reliability in operation are
significant issues that cannot be neglected. In this paper, the network and station
vulnerabilities of the urban rail transit system were analyzed based on complex network and
graph theories. A vulnerability evaluation model was proposed by accounting metro
interchange and passenger flow and further validated by a case study of Shanghai Metro with
full-scale network and real-world traffic data. It is identified that the urban rail transit
network is rather robust to random attacks, but is vulnerable to the largest degree node-based
attacks and the highest betweenness node-based attacks. Metro stations with a large node
degree are more important in maintaining the network size, while stations with a high node
betweenness are critical to network efficiency and origin-destination (OD) connectivity. The
most crucial stations in maintaining network serviceability do not necessarily have the
highest passenger throughput or the largest structural connectivity. A comprehensive
evaluation model as proposed is therefore essential to assess station vulnerability, so that
attention can be placed on appropriate nodes within the metro system. The findings of this
research are of both theoretical and practical significance for urban rail transit network
design and performance evaluation.
OPEN ACCESS

Sustainability 2015, 7 6920
Keywords: vulnerability analysis; urban rail transit networks; complex network theory;
metro interchange; passenger flow
1. Introduction
In recent years, rapid urbanization and motorization in the major cities of China have resulted in a
huge population explosion and private vehicle ownership, which consequently bring serious problems
to traditional road transport, such as urban congestions and pollution, etc. Compared with road transport,
urban rail transit, such as metro, light rail and regional railways, provide a variety of economic, social
and environmental benefits [1]. Nevertheless, their security and stability in operation have become
significant issues that cannot be neglected. In particular, network failures, outbursts of passenger flows,
natural disasters and terrorist activities may cause the breakdown of stations or lines, affecting the overall
efficiency of the rail networks [2]. In Shanghai, for example, on 27 October 2007, an electricity power
failure led to the breakdown of Metro Line 1, Line 2 and Line 4 for more than one hour; on 22 December
2009, a power blackout of Metro Line 1 directly resulted in a two-train crash; on 27 September 2011, a
rear-end accident on Metro Line 10 occurred between Yuyuan Garden and Laoximen stations. Moreover,
on 14 September 2013, water intrusion caused signal failures for Metro Line 2 and Line 6, leading to a
large number of passengers stranded at the stations for more than four hours. Compared with road
network accidents, rail accidents not only cause traffic delays of the direct line(s), but also have a wider
impact on passengers in other stations along the line(s) or even potential passengers, which generally
generate a larger social impact.
With a history of more than 150 years, urban rail transit has attracted comparable more attention in
the prevention of network failures and system disruptions [3–7]. In the recent ten years, graph and
complex network theories have been introduced for analyzing the reliability and safety of urban rail
transit networks. However, studies on this specific approach remain relatively limited. Del Río et al. [8]
analyzed the resilience capabilities of underground systems and calculated the amount of backup
capacity required to recover from system failures. Derrible and Kennedy [9] introduced robustness
indicators corresponding to the characteristics of transit systems by investigating 33 metro systems
throughout the world. Recommendations for improving the robustness of differently-sized metro
networks were provided accordingly. De-Los-Santos et al. [10] proposed passenger robustness measures
for rail transit networks under with and without bridging interruptions and verified the measures on the
Madrid commuter system. Cadarso et al. [11] studied the disruption management problem of rapid transit
rail networks and designed a two-step approach that combined an integrated optimization for the
timetable and rolling stock by considering the passenger behavior.
It is worth mentioning that although the concepts of reliability, resilience and robustness are closely
related to the general subject of vulnerability [12], these terms are different in research scopes.
Transport vulnerability is largely a fundamental feature of the urban system and concerns the
consequences and probabilities of system failures [13]. Therefore, the above-mentioned literature tried
to provide various tools in addressing vulnerability-related problems, but did not look into the issue of
vulnerability directly.

Sustainability 2015, 7 6921
Currently, vulnerability analysis of urban rail transit networks mainly refers to the research
achievements in road network systems [13–16]. Gao and Shi [17] proposed an evaluation model of metro
system invulnerability based on network topology and calculated the evaluation indices with matrix
logic. Wang [18] constructed the topological model of the Beijing transit network and simulated the
network efficiency under various attacks. Zhang et al. [19] measured the topological characteristics and
functional properties of the Shanghai metro system. Nevertheless, these studies simplified the urban rail
transit networks with graph theory and, therefore, lacked consideration of the significant properties of
rail transit systems, such as the ability to transfer, etc.
Other approaches to vulnerability analysis were employed. Quan et al. [20] established an index
system to assess the vulnerability of rainstorm water-logging in Shanghai Metro. Han et al. [21] analyzed
urban mass transit accidents from three aspects, including interference, exposure and vulnerability. They
regarded vulnerability as inherent defects of the system and established a theoretical safety insurance
mechanism. Yuan et al. [22] studied the statistical data of metro network accidents and proposed the
concepts of physical, structural and social vulnerabilities of metro system. These studies, unfortunately,
lacked systematical analyses of urban rail transit networks, which may hinder accurate the definition,
design and performance evaluation of the system, while these are particularly useful for the public
transportation planners and practitioners.
To provide theoretical support to the planning and operation of urban rail transit networks, this study
conducts a comprehensive analysis of the vulnerability of urban rail transit networks. The paper is
organized as follows. In Section 2, urban rail transit networks were modeled with the proposed
topological parameters, so that a systematical vulnerability evaluation model can be built up. In Section 3,
vulnerability analyses of Shanghai Metro were carried out, with a case study based on the proposed
evaluation model. Finally, the paper closes with conclusions and possible research directions in Section 4.
2. Model Descriptions
2.1. Construction of Urban Rail Transit Networks
A complex network model generally defines elements of the system as vertices, whose edges represent
the interactions between vertices [23]. According to Angeloudis and Fisk’s study on the 20 largest
subways throughout the world [24], urban rail transit networks can be depicted as complex networks,
which possess the characteristics of high connectivity, but low maximum vertex degree and have typical
features of both small-world and scale-free categories.
Stations and metro lines are the basic components of the urban rail transit system. Based on complex
network theory, stations can be virtualized into nodes of complex networks, while metro lines can be
virtualized into edges to connect the nodes. As urban metros generally have two-way traffic, the rail transit network is viewed as an undirected graph ,G V E= , in which { }| 1, 2,3iV v i N= = is the set
of network nodes and { }| ,ij i jE e v v V= ∈ is the set of network edges. ij N NA a
× = is the network
adjacency matrix, where ija is defined as:
( )( )
1, ,
0, ,
i j
ij
i j
v v Ea
v v E
∈= ∉
(1)
Sustainability 2015, 7 6922
In urban rail transit networks, degree (Di) is defined as the number of edges connecting with node vi,
and betweenness (Bi) is defined as the number of shortest paths between any two nodes in the network
passing node vi. The two topological parameters depict the connectivity and the pressure of a given
network, respectively.
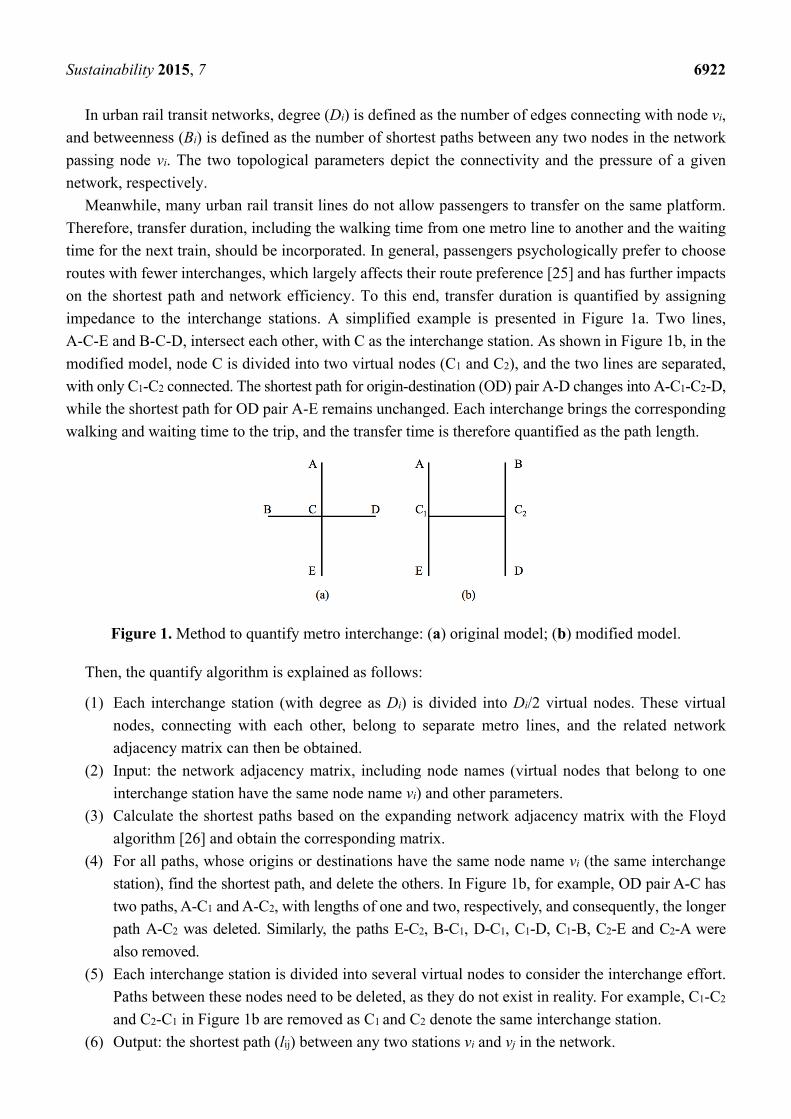
Meanwhile, many urban rail transit lines do not allow passengers to transfer on the same platform.
Therefore, transfer duration, including the walking time from one metro line to another and the waiting
time for the next train, should be incorporated. In general, passengers psychologically prefer to choose
routes with fewer interchanges, which largely affects their route preference [25] and has further impacts
on the shortest path and network efficiency. To this end, transfer duration is quantified by assigning
impedance to the interchange stations. A simplified example is presented in Figure 1a. Two lines,
A-C-E and B-C-D, intersect each other, with C as the interchange station. As shown in Figure 1b, in the
modified model, node C is divided into two virtual nodes (C1 and C2), and the two lines are separated,
with only C1-C2 connected. The shortest path for origin-destination (OD) pair A-D changes into A-C1-C2-D,
while the shortest path for OD pair A-E remains unchanged. Each interchange brings the corresponding
walking and waiting time to the trip, and the transfer time is therefore quantified as the path length.
Figure 1. Method to quantify metro interchange: (a) original model; (b) modified model.
Then, the quantify algorithm is explained as follows:
(1) Each interchange station (with degree as Di) is divided into Di/2 virtual nodes. These virtual
nodes, connecting with each other, belong to separate metro lines, and the related network
adjacency matrix can then be obtained.
(2) Input: the network adjacency matrix, including node names (virtual nodes that belong to one
interchange station have the same node name vi) and other parameters.
(3) Calculate the shortest paths based on the expanding network adjacency matrix with the Floyd
algorithm [26] and obtain the corresponding matrix.
(4) For all paths, whose origins or destinations have the same node name vi (the same interchange
station), find the shortest path, and delete the others. In Figure 1b, for example, OD pair A-C has
two paths, A-C1 and A-C2, with lengths of one and two, respectively, and consequently, the longer
path A-C2 was deleted. Similarly, the paths E-C2, B-C1, D-C1, C1-D, C1-B, C2-E and C2-A were
also removed.
(5) Each interchange station is divided into several virtual nodes to consider the interchange effort.
Paths between these nodes need to be deleted, as they do not exist in reality. For example, C1-C2
and C2-C1 in Figure 1b are removed as C1 and C2 denote the same interchange station.
(6) Output: the shortest path (lij) between any two stations vi and vj in the network.

Sustainability 2015, 7 6923
2.2. Vulnerability Evaluation Model
Vulnerability in traffic engineering is generally defined as “a susceptibility to incidents that may
result in considerable reductions in network serviceability” [12], involving two components: (1) the
probability that an event would happen and cause negative impacts; and (2) the negative consequences
once the event has taken place. In this paper, urban rail transit networks were investigated from two
aspects: network vulnerability and station vulnerability. Network vulnerability analysis consists of
topological structure and functional ability and is carried out with attacking experiments. Node-based
malicious attacks, generally considered as the most significant issue in network malfunctions, were
studied and grouped into three types, namely the largest degree node-based attacks, the highest
betweenness node-based attacks and random attacks.
2.2.1. Topological Vulnerability
Topological vulnerability is defined as network susceptibility to incidents, which may result in the
reduction of structure connectivity. To this end, topological efficiency (E), calculated as the mean of the
reciprocal of each shortest path within the network, is used to evaluate network topological vulnerability
as follows:
( ) ,
1 1
1i jv v V ij
EN N l∈
=− (2)
where N is the number of nodes in the network and lij is the shortest path between stations vi and vj. The
index depicts the overall connectivity of the network, and a higher value of E indicates that the network
is more efficient in OD transferring.
2.2.2. Functional Vulnerability
Functional vulnerability is defined as network susceptibility to incidents that may result in a reduction
in transport ability. Each node in the network is supposed to possess an initial functional ability of one.
If a node is removed from the network (attacked or isolated), the functional ability reduces to zero. Based
on this definition, network size was defined and used to evaluate network functional vulnerability. When
a network is attacked, the dysfunctional nodes have to be removed from the network, which may induce
some isolated nodes within the network. Consequently, network size is therefore defined as the total
number of nodes remaining connected within the network.
To better analyze network transport ability, the concept of OD is introduced. When node vi is attacked,
network efficiency generally decreases due to the increased system travel time; worst of all, some OD
pairs would become unconnected, which indicates a dramatic reduction in transport ability. The
connected OD ratio is therefore defined as the percentage of OD pairs remaining connected in the
network, revealing the system robustness in maintaining network functional properties.
Previous literature [19,27] used the largest connected cluster (LCC) to evaluate the functional
vulnerability of urban rail transit networks, which was defined as the size of the largest sub-network
after being attacked. However, this parameter is not suitable to be applied to urban rail transit networks,

Sustainability 2015, 7 6924
as trains may still be in operation on each sub-network, even if the network is divided into multiple
isolated sub-networks.
2.2.3. Station Vulnerability
Based on these concepts, station vulnerability is further defined to evaluate the vulnerability of each
station. When a station vi is attacked and removed from the network, the value of E decreases, and the
topological efficiency [e(vi)] is defined as:
( ) ( ) ( )'i ie v e O e v= − (3)
where E(O) is the original topological efficiency of the network and e(v’i) is the network topological
efficiency after vi being attacked. A higher value of e(vi) indicates the greater impact of vi on the network
efficiency. In another words, vi is more crucial to topological reliability.
With passenger flow considered, the station vulnerability [S(vi)] is defined as:
( ) ( ) ( )i i iS v R v p v= × (4)
where R(vi) is the reductions in network serviceability caused by the malfunction of vi and p(vi) is the
probability that station vi is attacked and removed from the network. In this equation, R(vi) is relevant to
e(vi) and passenger flow influence (Ii), as defined in Section 3.4.2:
( ) ( )i i iR v e v I= × (5)
The index reveals the reduction in network topological efficiency and the number of travelers
suffering such a reduction when station vi is attacked.
3. Case Study of Shanghai Metro
3.1. Basic Network Information
In this section, the network and station vulnerabilities of Shanghai Metro were studied based on the
proposed vulnerability model. By June 2014, Shanghai Metro had 287 nodes and 317 links, with an
average degree of 2.2, which is at the middle level among urban rail transit networks in major cities
throughout the world. Approximately 80% of the total number of nodes has a degree of two or above,
while the nodes with a degree of four or above are approximately 9%. Only one node has a degree of
eight, and two other nodes have degrees and six and five, respectively, indicating that the nodes in
Shanghai Metro seldom have a large degree. A detailed map of Shanghai Metro can be found in [28]
Table 1 presents the top ten important stations of Shanghai Metro based on node degree and
betweenness, respectively. Century Avenue (No. 1) is the node with the largest degree of eight, which
means that the station connects with the other eight stations within the network. Caoyang Road possesses
the largest node betweenness of 19,114, indicating that overall, 19,114 shortest paths within the network
pass the station. It is also worth noticing that the two rankings are quite different. Some stations, such as
Caoyang Road and Zhenping Road, both with node degrees of four, possess higher node betweenness
than Century Avenue and People’s Square (with node degrees of eight and six, respectively).
Sustainability 2015, 7 6925
Table 1. Top ten important stations of Shanghai Metro.
Station Ranking Based on Node Degree (Di) Station Ranking Based on Node Betweenness (Bi)
No. Di Station Name No. Bi Station Name
1 8 Century Avenue 1 19,114 Caoyang Road
2 6 Xujiahui 2 18,738 Xujiahui
3 6 People’s Square 3 18,566 Century Avenue
4 5 Oriental Sports Center 4 18,180 Zhenping Road
5 5 Yishan Road 5 17,848 People’s Square
6 4 South Shaanxi Road 6 17,574 Shanghai Railway Station
7 4 Changshu Road 7 14,206 Baoshan Road
8 4 Shanghai Railway Station 8 13,556 Oriental Sports Center
9 4 Shanghai Indoor Stadium 9 12,868 Hailun Road
10 4 Zhaojiabang Road 10 12,560 Zhongtan Road
3.2. Topological Vulnerability Analysis
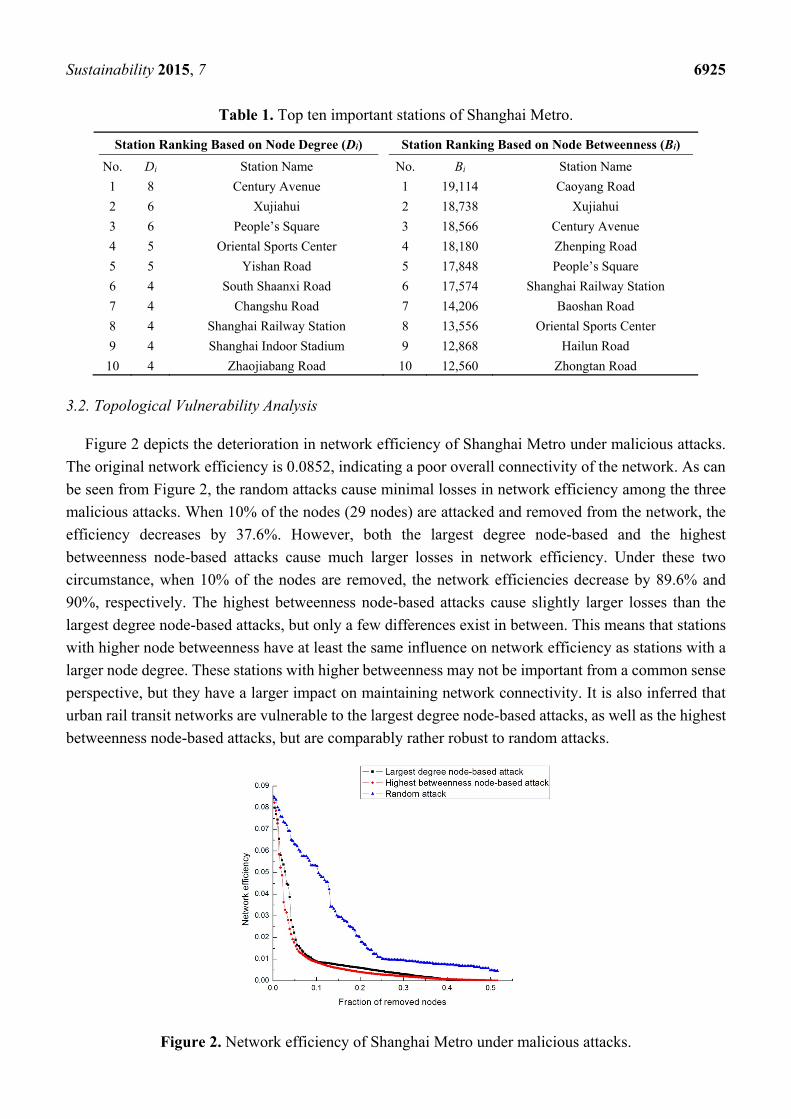
Figure 2 depicts the deterioration in network efficiency of Shanghai Metro under malicious attacks.
The original network efficiency is 0.0852, indicating a poor overall connectivity of the network. As can
be seen from Figure 2, the random attacks cause minimal losses in network efficiency among the three
malicious attacks. When 10% of the nodes (29 nodes) are attacked and removed from the network, the
efficiency decreases by 37.6%. However, both the largest degree node-based and the highest
betweenness node-based attacks cause much larger losses in network efficiency. Under these two
circumstance, when 10% of the nodes are removed, the network efficiencies decrease by 89.6% and
90%, respectively. The highest betweenness node-based attacks cause slightly larger losses than the
largest degree node-based attacks, but only a few differences exist in between. This means that stations
with higher node betweenness have at least the same influence on network efficiency as stations with a
larger node degree. These stations with higher betweenness may not be important from a common sense
perspective, but they have a larger impact on maintaining network connectivity. It is also inferred that
urban rail transit networks are vulnerable to the largest degree node-based attacks, as well as the highest
betweenness node-based attacks, but are comparably rather robust to random attacks.
Figure 2. Network efficiency of Shanghai Metro under malicious attacks.

Sustainability 2015, 7 6926
3.3. Functional Vulnerability Analysis
Figure 3 depicts the changes in the network size of Shanghai Metro under malicious attacks. The
largest degree node-based attack causes the maximum losses in the network size among the three
malicious attacks. When 20% of the nodes (58 nodes) were attacked and removed from the network, the
network size decreases by 39%. Apart from the 58 attacked nodes, this also results in 54 isolated nodes
in the network, indicating that the stations with a large node degree are generally important in
maintaining network transport ability.
Figure 3. Network size of Shanghai Metro under malicious attacks.
Figure 4 depicts the changes in the connected OD ratio of Shanghai Metro under malicious attacks.
As can be seen, malicious attacks have larger impacts on OD connectivity. When the top seven stations
with the highest betweenness were attacked, the connected OD ratio decreases to only 29%. Moreover,
when 10% of the nodes (29 nodes) were attacked and removed from the network, the connected OD ratio
decreases to approximately 2% under both the largest degree node-based and the highest betweenness node-
based attacks. Only 760 OD pairs are still connected out of 41,041 original pairs, and the network is
almost paralyzed, demonstrating that OD connectivity is vulnerable to malicious attacks.
Figure 4. Connected origin-destination (OD) ratio of Shanghai Metro under malicious attacks.
Sustainability 2015, 7 6927
3.4. Station Vulnerability Analysis
3.4.1. Calculations of Station Topological Efficiency
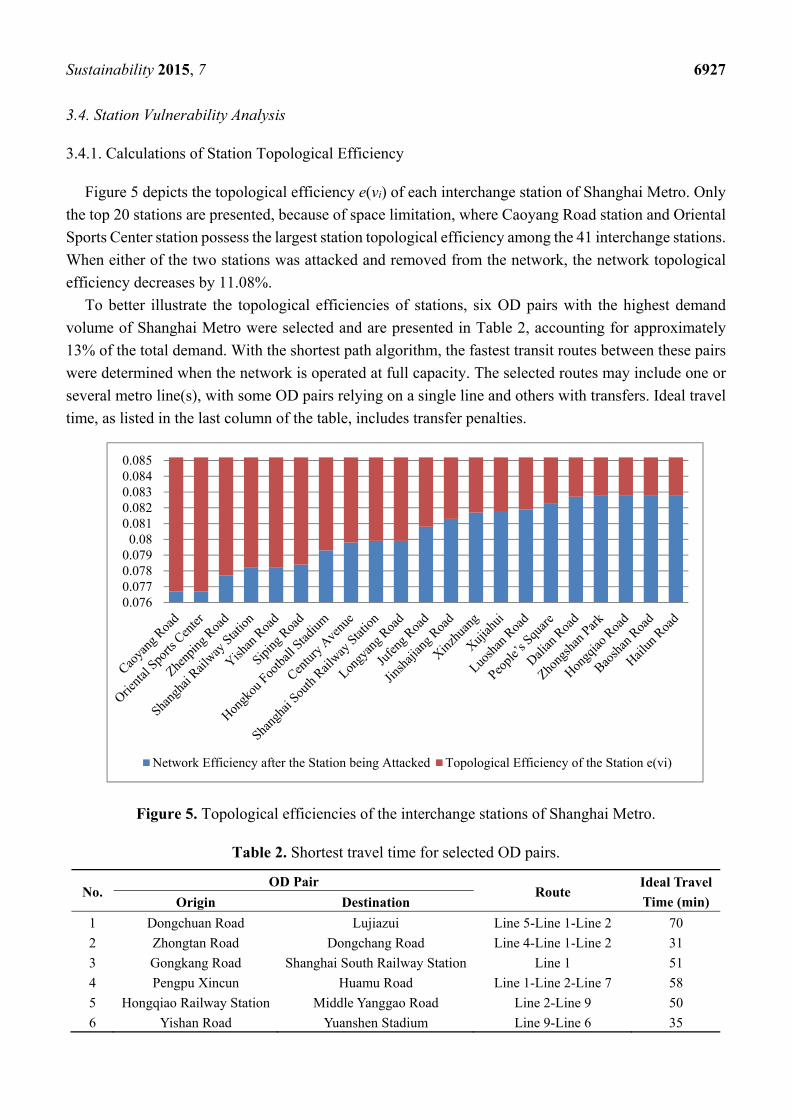
Figure 5 depicts the topological efficiency e(vi) of each interchange station of Shanghai Metro. Only
the top 20 stations are presented, because of space limitation, where Caoyang Road station and Oriental
Sports Center station possess the largest station topological efficiency among the 41 interchange stations.
When either of the two stations was attacked and removed from the network, the network topological
efficiency decreases by 11.08%.
To better illustrate the topological efficiencies of stations, six OD pairs with the highest demand
volume of Shanghai Metro were selected and are presented in Table 2, accounting for approximately
13% of the total demand. With the shortest path algorithm, the fastest transit routes between these pairs
were determined when the network is operated at full capacity. The selected routes may include one or
several metro line(s), with some OD pairs relying on a single line and others with transfers. Ideal travel
time, as listed in the last column of the table, includes transfer penalties.
Figure 5. Topological efficiencies of the interchange stations of Shanghai Metro.
Table 2. Shortest travel time for selected OD pairs.
No. OD Pair
Route Ideal Travel
Time (min) Origin Destination
1 Dongchuan Road Lujiazui Line 5-Line 1-Line 2 70
2 Zhongtan Road Dongchang Road Line 4-Line 1-Line 2 31
3 Gongkang Road Shanghai South Railway Station Line 1 51
4 Pengpu Xincun Huamu Road Line 1-Line 2-Line 7 58
5 Hongqiao Railway Station Middle Yanggao Road Line 2-Line 9 50
6 Yishan Road Yuanshen Stadium Line 9-Line 6 35
0.0760.0770.0780.079
0.080.0810.0820.0830.0840.085
Network Efficiency after the Station being Attacked Topological Efficiency of the Station e(vi)
Sustainability 2015, 7 6928
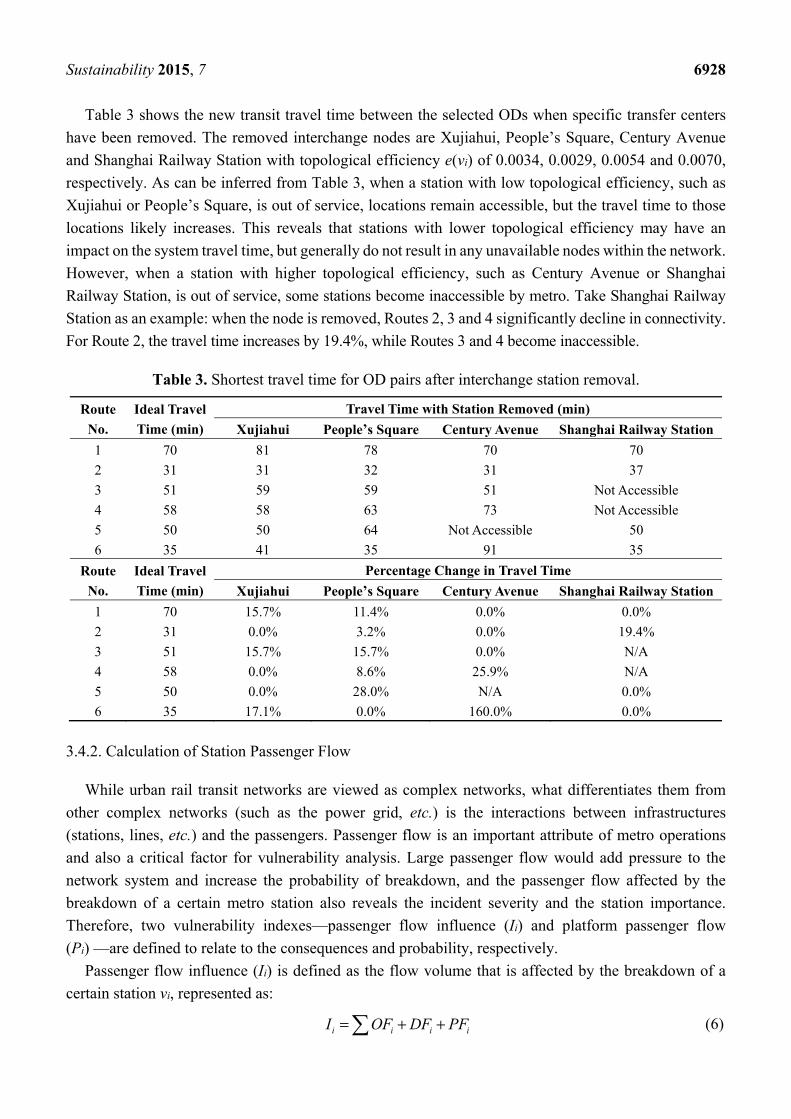
Table 3 shows the new transit travel time between the selected ODs when specific transfer centers
have been removed. The removed interchange nodes are Xujiahui, People’s Square, Century Avenue
and Shanghai Railway Station with topological efficiency e(vi) of 0.0034, 0.0029, 0.0054 and 0.0070,
respectively. As can be inferred from Table 3, when a station with low topological efficiency, such as
Xujiahui or People’s Square, is out of service, locations remain accessible, but the travel time to those
locations likely increases. This reveals that stations with lower topological efficiency may have an
impact on the system travel time, but generally do not result in any unavailable nodes within the network.
However, when a station with higher topological efficiency, such as Century Avenue or Shanghai
Railway Station, is out of service, some stations become inaccessible by metro. Take Shanghai Railway
Station as an example: when the node is removed, Routes 2, 3 and 4 significantly decline in connectivity.
For Route 2, the travel time increases by 19.4%, while Routes 3 and 4 become inaccessible.
Table 3. Shortest travel time for OD pairs after interchange station removal.
Route
No.
Ideal Travel
Time (min)
Travel Time with Station Removed (min)
Xujiahui People’s Square Century Avenue Shanghai Railway Station
1 70 81 78 70 70
2 31 31 32 31 37
3 51 59 59 51 Not Accessible
4 58 58 63 73 Not Accessible
5 50 50 64 Not Accessible 50
6 35 41 35 91 35
Route
No.
Ideal Travel
Time (min)
Percentage Change in Travel Time
Xujiahui People’s Square Century Avenue Shanghai Railway Station
1 70 15.7% 11.4% 0.0% 0.0%
2 31 0.0% 3.2% 0.0% 19.4%
3 51 15.7% 15.7% 0.0% N/A
4 58 0.0% 8.6% 25.9% N/A
5 50 0.0% 28.0% N/A 0.0%
6 35 17.1% 0.0% 160.0% 0.0%
3.4.2. Calculation of Station Passenger Flow
While urban rail transit networks are viewed as complex networks, what differentiates them from
other complex networks (such as the power grid, etc.) is the interactions between infrastructures
(stations, lines, etc.) and the passengers. Passenger flow is an important attribute of metro operations
and also a critical factor for vulnerability analysis. Large passenger flow would add pressure to the
network system and increase the probability of breakdown, and the passenger flow affected by the
breakdown of a certain metro station also reveals the incident severity and the station importance.
Therefore, two vulnerability indexes—passenger flow influence (Ii) and platform passenger flow
(Pi) —are defined to relate to the consequences and probability, respectively.
Passenger flow influence (Ii) is defined as the flow volume that is affected by the breakdown of a
certain station vi, represented as:
i i i iI OF DF PF= + + (6)

Sustainability 2015, 7 6929
where OFi is the passenger flow whose travel origins are vi, DFi is the passenger flow whose travel
destinations are vi and PFi is the passenger flow whose travel paths pass vi. The index not only reflects
the importance of the station vi in the urban rail transit network, but also reveals the consequences and
severity of the station breakdown.
Platform passenger flow (Pi) is defined as:
i i i iP OF DF TF= + + (7)
where TFi is the passenger flow that transfers at vi. Pi depicts the passenger volume at station vi during
a certain period of time. Large platform passenger flow, especially common in peak hours, would add
pressure to the platform operations and increase the probability of accidents.
While passengers may choose different routes for the same OD pair due to personal reasons, the
problem is simplified by using the path matrix {lij} obtained in Section 2.1 as the routes for given OD
pairs. The route choice model provides the shortest path (lij) between any two nodes vi and vj with metro
interchange taken into considerations. In this model, the passenger flow-related indexes are calculated as:
1
N
i ijj
OF F=
= (8)
1
N
i jij
DF F=
= (9)
{ }, ,i mn ij
i mnv l l m n i
PF F⊆ ∈ ≠
= (10)
{ }1 2, , ,i i mn ij
i mnv v l l m n i
TF F⊆ ∈ ≠
= (11)
where Fij is the passenger flow for the OD pair i to j, N is the number of stations in the network and vi1
and vi2 are any two virtual nodes within the node vi. When the shortest paths for any OD pairs pass both
vi1 and vi
2, this means that passengers have to make a transfer at station vi.
For validation purposes, field traffic data of Shanghai Metro were obtained from the Automatic Fare
Collection (AFC) of Shanghai Shentong Metro Group Co., Ltd. Information, including entry station ID,
exit station ID, passenger flow within a 5-min period and ticket types, was recorded, from which the OD
matrix can be approximated. Then, passenger flow indexes were calculated and analyzed based on the
OD matrix of 16 September 2013, from 7:30 a.m. to 8:30 a.m., the peak hour of Shanghai Metro for a
typical weekday. A total of 370,414 raw records were obtained, and the enter and exit passenger flows
at each station are supposed to be constant during peak hours.
Figure 6 presents the results of platform passenger flow (Pi) and passenger flow influence (Ii) of
Shanghai Metro during peak hours in descending order of Pi. With space limited, only the top 20 stations
were presented. As can be seen from Figure 6, the station with the largest platform passenger flow (Pi)
and passenger flow influence (Ii) is People’s Square. The platform passenger flow of this station is as
high as 67,664 per hour, which brings large challenges to the station management and increases the
difficulties in keeping order. Meanwhile, the passenger flow influence of People’s Square Station is
135,481 per hour, indicating that more than 135 thousand passengers would be affected by the

Sustainability 2015, 7 6930
breakdown of this station during one hour. They either have to change to the routes with longer lengths
on the metro or to choose other transport modes.
Figure 6. Top 20 heavy traffic stations of Shanghai Metro in peak hours.
3.4.3. Station Vulnerability Evaluations
Based on the field data, the station vulnerability of each station vi [S(vi)] is further studied. As interchange
stations are generally more important in maintaining network connectivity, the 41 interchange stations
of Shanghai Metro were studied for peak hours. Table 4 presents the malfunction severity of these
interchange stations. As shown in Table 4, Shanghai Railway Station ranks the first, which means the
malfunction of this station causes the largest reduction of network connectivity. The topological
efficiency of Shanghai Railway Station is 0.007, and the breakdown would affect almost 99 thousand
passengers within one hour. Both the reduction in network efficiency and the influence on passenger
flow have an enormous impact on the entire network.
On the other hand, although People’s Square Station has the largest passenger flow influence on the
network, the topological efficiency of the station is approximately only one-third that of Caoyang Road
Station. This means that while a large amount of passengers have to re-route due to the breakdown of
People’s Square Station, the alternative route choices do not decrease their travel efficiencies too much,
and most can still arrive at their destinations within a certain duration with other alternative routes.
Oppositely, Oriental Sports Center Station ranks the first in station topological efficiency e(vi), but
has a relatively small passenger flow influence (Ii). This indicates that passengers generally have no
other choices but to take much longer routes to their destinations during the breakdown of this station
or, even worse, to switch to other transport modes. However, as the station is located in the suburbs of
Shanghai, the passenger flow of the station is only about 20% that of People’s Square. Consequently, not
many passengers would be influenced by the breakdown of the station, and therefore, the overall reduction
in network serviceability of this station ranks only 12th among the 41 interchange stations of Shanghai Metro.
0
20000
40000
60000
80000
100000
120000
140000
Platform Passenger Flow (Pi) per Hour Passenger Flow Influence (Ii) per Hour

Sustainability 2015, 7 6931
Table 4. Malfunction severities of 41 interchange stations of Shanghai Metro.
Station Name Degree
(Di)
Topological Efficiency of Station e(vi)
Passenger Flow Influence (Ii)
per Hour
Reductions in Network
Serviceability R(vi)
e(vi) No. (Ii) No. R(vi) No.
Shanghai Railway Station 4 0.007 4 98,963 3 692.74 1
Caoyang Road 4 0.0085 1 77,687 9 660.34 2
Zhenping Road 4 0.0075 3 81,264 6 609.48 3
Century Avenue 8 0.0054 8 107,152 2 578.62 4
Yishan Road 5 0.007 4 75,087 11 525.61 5
People’s Square 6 0.0029 16 135,481 1 392.89 6
Hongkou Football Stadium 4 0.0059 7 56,562 16 333.72 7
Xujiahui 6 0.0034 14 98,013 4 333.24 8
Shanghai South Railway Station 3 0.0053 9 59,934 14 317.65 9
Longyang Road 4 0.0053 9 54,452 17 288.60 10
Siping Road 4 0.0068 6 37,863 27 257.47 11
Oriental Sports Center 5 0.0085 1 26,549 34 225.67 12
Zhongshan Park 4 0.0024 18 89,514 5 214.83 13
Jinshajiang Road 3 0.0039 12 52,750 20 205.73 14
East Nanjing Road 4 0.0021 22 78,957 8 165.81 15
Jing’an Temple 4 0.0019 26 78,968 7 150.04 16
Shanghai Indoor Stadium 4 0.0019 26 76,716 10 145.76 17
Jiangsu Road 4 0.002 24 65,339 13 130.68 18
Hongqiao Road 4 0.0024 18 53,710 18 128.90 19
Baoshan Road 3 0.0024 18 53,407 19 128.18 20
Xinzhuang 2 0.0035 13 32,862 31 115.02 21
Zhongtan Road 2 0.0021 22 51,724 21 108.62 22
Hailun Road 4 0.0024 18 44,931 23 107.83 23
Changshu Road 4 0.0015 34 70,721 12 106.08 24
Lujiabang Road 4 0.002 24 48,090 22 96.18 25
South Shaanxi Road 4 0.0014 37 59,742 15 83.64 26
Zhaojiabang Road 4 0.0017 31 44,621 24 75.86 27
South Xizang Road 4 0.0019 26 39,224 26 74.53 28
Dalian Road 4 0.0025 17 29,277 32 73.19 29
Yaohua Road 4 0.0019 26 37,044 28 70.38 30
Dongan Road 4 0.0017 31 35,465 29 60.29 31
Laoximen 4 0.0017 31 32,975 30 56.06 32
Jiaotong University 4 0.0018 30 29,017 33 52.23 33
Jufeng Road 4 0.0044 11 11,105 40 48.86 34
West Yan’an Road 2 0.0011 40 41,791 25 45.97 35
Lancun Road 4 0.0013 38 24,707 35 32.12 36
West Gaoke Road 4 0.0015 34 21,295 36 31.94 37
Hongqiao Airport T2 3 0.0015 34 19,667 37 29.50 38
Tiantong Road 3 0.0012 39 13,359 39 16.03 39
Hongqiao Railway Station 2 0.0009 41 15,798 38 14.22 40
Luoshan Road 2 0.0033 15 619 41 2.04 41

Sustainability 2015, 7 6932
As shown in Table 4, the malfunction severities of interchange stations differ greatly. Some stations
may not be as important as others. For example, stations, such as Lancun Road or West Gaoke Road,
have an R(vi) of only 4% that of Shanghai Railway Station. To this end, it is concluded that
the vulnerability model assists with distinguishing critical stations within the network from a
systematic perspective.
The consequences of station malfunctions were analyzed, as shown in Table 5. Platform passenger
flow (Pi) refers to taking the probability of breakdown into consideration. While it is generally difficult
to predict the probabilities of certain events, such as terrorist actions and extreme weather, etc., the
probability of a station breakdown p(vi) was found positively correlated with Pi [4,22]. Although the two
parameters do not have strictly linear correlations, a large Pi, especially common in peak hours, would
add pressure to the platform operations and increase the probability of station breakdown.
Table 5. Station vulnerabilities of critical stations of Shanghai Metro.
No. Station Name
Reductions in Network
Serviceability R(vi)
Platform Passenger Flow (Pi) per Hour
Estimated Breakdown
Probability due to Large Flow p(vi)
Station Vulnerability
S(vi)
1 Century Avenue 578.62 56,461 5.2% 30.2
2 People’s Square 392.89 67,664 6.3% 24.6
3 Shanghai Railway Station 692.74 34,148 3.2% 21.9
4 Caoyang Road 660.34 24,170 2.2% 14.8
5 Yishan Road 525.61 28,302 2.6% 13.8
6 Zhenping Road 609.48 23,354 2.2% 13.2
7 Xujiahui 333.24 33,960 3.1% 10.5
8 Hongkou Football Stadium 333.72 17,211 1.6% 5.3
9 Longyang Road 288.6 19,891 1.8% 5.3
10 Shanghai South Railway Station 317.65 14,760 1.4% 4.3
Table 5 presents the top 10 critical interchange stations of Shanghai Metro with the largest station
vulnerability. As can be seen, the platform passenger flows of stations, such as People’s Square, Century
Avenue, Shanghai Railway Station and Xujiahui, are extremely enormous during peak hours. Such
pressures on the station operation and management caused by huge passenger flows are turned into
increases in the probabilities of sudden events and station breakdown. Estimated breakdown
probabilities are therefore calculated as the ratio of Pi to the overall passenger flow of Shanghai Metro
during a.m. peak hours (1,081,218 passengers per hour). An overall consideration of the consequences
and probabilities of station breakdown brings the conclusion that Century Avenue, People’s Square and
Shanghai Railway Station are the three most critical stations of Shanghai Metro in maintaining network
serviceability. These stations are vulnerable to attacks due to large passenger flow, and the consequences
of breakdown are severe and, therefore, need to be better protected.
The results of the calculations are summarized and illustrated in Figure 7. The locations of the top ten
stations in terms of topological efficiency (e(vi)), platform passenger flow (Pi) and station vulnerability
(S(vi)) (with specific data provided in Figures 5 and 6 and Table 5, respectively) are simultaneously
marked on the Shanghai Metro map. As shown, the most critical stations in maintaining system
serviceability are not necessarily the locations with the highest passenger throughput or the largest

Sustainability 2015, 7 6933
structural connectivity. It may be misleading or not appropriate if the greatest attention were paid to the
busiest stations or the topologically important stations. Therefore, the evaluation model proposed in this
paper proves to be a useful tool to assist traffic administrators with figuring out any neglected, but
important stations in urban rail transit networks, so that priorities in funding and other resources could
be allocated to the appropriate nodes efficiently.
Figure 7. Locations of critical stations of Shanghai Metro.
4. Conclusions
This paper proposes a systematic framework to investigate the network and station vulnerabilities of
urban rail transit networks. A vulnerability evaluation model is developed, optimized and verified.
Special characteristics of urban rail transit networks, such as metro interchange and traveler route-choice
habits, were taken into consideration. Field passenger flow was introduced and quantified in the
vulnerability analyses. The probabilities of network malfunctions were then evaluated, and the incident
severity and station importance were calculated.
Results from the case study of Shanghai Metro indicate that urban rail transit networks are generally
vulnerable to the largest degree node-based attacks and the highest betweenness node-based attacks.
Disruptions to a single station, especially intended terrorism attacks, would have severe impacts on the
entire network. Furthermore, stations with the most significant effects on system connectivity are not
necessarily locations with the largest passenger flow. A comprehensive evaluation model, as proposed
in this paper, is therefore needed to accurately assess station vulnerability, so that attention could be
provided to the most critical stations.
Sustainability 2015, 7 6934
The systematic framework of this paper is useful for transit system planners in terms of urban rail
transit network design. Vulnerabilities of different urban rail transit networks could be analyzed and
compared based on the model, and a reliable network geometry could then be obtained. Such a tool can
provide theoretical support to the design and optimization of network layout and be used to explore
possible improvements to network reliability when new lines are built [29].
Moreover, the case study has demonstrated the utility of the proposed vulnerability evaluation model
in a real-world rail transit network. Crucial stations were identified based on the analyses, so that
measurements to reduce incident possibilities or action plans to better respond to emergencies at these
stations can be explored beforehand. The vulnerability model provides a proactive approach that assists
with identifying network weaknesses and prepares for extreme events beforehand, rather than reacting
afterward [30].
Further studies on the probabilities of network malfunctions may be conducted with additional factors
considered. The interdependence of metro network with other transport modes can be investigated, so as to
incorporate a wider range of travel behaviors into the vulnerability analysis. Alternative solutions to
disruptions of urban rail transit networks may also be explored.
Acknowledgments
The authors would like to express their appreciation to Dr. Wei Zhu from School of Transportation
Engineering, Tongji University for his valuable suggestions and assistance in this study. The research
was sponsored in part by the National Natural Science Foundation of China (No. 71101109),
the Key Project of Shanghai Soft Science Research Program (No. 14692106400), and the Chuntsung
Project of Shanghai Jiao Tong University (No. 2013-3-01). Any opinions, findings and conclusions or
recommendations expressed in this paper are those of the authors and do not necessarily reflect the views
of the sponsors.
Author Contributions
Daniel (Jian) Sun and Yuhan Zhao conceived the project and wrote the manuscript together.
Daniel (Jian) Sun mainly obtained the traveler IC card data, proposed the data analysis method, and
suggested to introduce the passenger IC card data into the study. Yuhan Zhao analyzed the network data
and passenger IC card data, carried out the vulnerability evaluation model, and performed the station
vulnerability analysis using Shanghai Metro data. Qing-Chang Lu provided critical suggestions and
inputs for the case study and helped with writing the manuscript. All authors have read and approved
the final manuscript.
Conflicts of Interest
The authors declare that there is no conflict of interests regarding the publication of this paper.
References
1. Litman, T. Impacts of rail transit on the performance of a transportation system. Transp. Res. Record
2005, 1930, 21–29.

Sustainability 2015, 7 6935
2. Nguyen, T.P.K.; Beugin, J.; Marais, J. Method for evaluating an extended Fault Tree to analyze the
dependability of complex systems: Application to a satellite-based railway system. Reliab. Eng.
Syst. Saf. 2015, 133, 300–313.
3. Vuchic, V.R. Urban Transit: Operations, Planning, and Economics; Wiley: Hoboken, NJ, USA, 2005.
4. Beroggi, G.E. Integrated safety planning for underground systems. J. Hazard. Mater. 2000, 71, 17–34.
5. Canós, J.H.; de Zulueta, F. Using hypermedia to improve safety in underground metropolitan
transportation. Multimedia Tools Appl. 2004, 22, 75–87.
6. Gabay, D. Fire safety: A short history in the Paris subway. Tunnel. Undergr. Space Technol. 2002,
17, 139–143.
7. Liao, F.; Arentze, T.; Timmermans, H. Multi-state supernetworks: Recent progress and prospects.
J. Traffic Transp. Eng. (Engl. Ed.) 2014, 1, 13–27. 8. Del Río, P.M.S.; Hernández, J.A.; Aracil, J.; de Vergara, J.E.L.; Domżał, J.; Wójcik, R.; Duque, R.
A reliability analysis of double-ring topologies with dual attachment using p-cycles for optical
metro networks. Comput. Netw. 2010, 54, 1328–1341.
9. Derrible, S.; Kennedy, C. The complexity and robustness of metro networks. Physica A 2010, 389,
3678–3691.
10. De-Los-Santos, A.; Laporte, G.; Mesa, J.A.; Perea, F. Evaluating passenger robustness in a rail
transit network. Transp. Res. Part C 2012, 20, 34–46.
11. Cadarso, L.; Marín, Á.; Maróti, G. Recovery of disruptions in rapid transit networks. Transp. Res.
Part E 2013, 53, 15–33.
12. Berdica, K. An introduction to road vulnerability: What has been done, is done and should be done.
Transp. Policy 2002, 9, 117–127.
13. Jenelius, E.; Petersen, T.; Mattsson, L.G. Importance and exposure in road network vulnerability
analysis. Transp. Res. Part A 2006, 40, 537–560.
14. Bell, M.G.; Kanturska, U.; Schmöcker, J.D.; Fonzone, A. Attacker-defender models and road
network vulnerability. Philos. Trans. R. Soc. A 2008, 366, 1893–1906.
15. Taylor, M.A.; Sekhar, S.V.; D’Este, G.M. Application of accessibility based methods for
vulnerability analysis of strategic road networks. Netw. Spat. Econ. 2006, 6, 267–291.
16. Jenelius, E. Network structure and travel patterns: Explaining the geographical disparities of road
network vulnerability. J. Transp. Geogr. 2009, 17, 234–244.
17. Gao, J.; Shi, Q. Definition and evaluation modeling of metro network invulnerability. J. China
Railw. Soc. 2007, 29, 29–33. (In Chinese)
18. Wang, Y. Research on Connectivity Reliability of Urban Transit Network Based on Theory of
Complex Network. Master’s Thesis, Beijing Jiao Tong University, Beijing, 2008.
19. Zhang, J.; Xu, X.; Hong, L.; Wang, S.; Fei, Q. Networked analysis of the Shanghai subway network,
in China. Physica A 2011, 390, 4562–4570.
20. Quan, R.; Liu, M.; Zhang, L. Vulnerability assessment of rainstorm water-logging in subway of
Shanghai. Yangtze River 2011, 42, 13–17.
21. Han, Y.; Cheng, H.; Zhao, X.; Xue, X. Theoretic structure of urban mass transit operation safety
based on vulnerability. Urban Mass Transit 2012, 15, 15–19.
22. Yuan, J.; Li, Q.; Jia, R.; Wang, Z. Analysis of operation vulnerabilities of urban metro network
system. China Saf. Sci. J. 2012, 22, 92–98.

Sustainability 2015, 7 6936
23. Barabási, A.L.; Albert, R. Emergence of scaling in random networks. Science 1999, 286, 509–512.
24. Angeloudis, P.; Fisk, D. Large subway systems as complex networks. Physica A 2006, 367, 553–558.
25. Raveau, S.; Muñoz, J.C.; de Grange, L. A topological route choice model for metro. Transp. Res.
Part A 2011, 45, 138–147.
26. Floyd, R.W. Algorithm 97: Shortest path. Commun. ACM 1962, 5, doi:10.1145/367766.368168.
27. Zhang, J.; Zhao, M.; Liu, H.; Xu, X. Networked characteristics of the urban rail transit networks.
Physica A 2013, 392, 1538–1546.
28. Shanghai Metro Group Co., Ltd., Shanghai Metro Network Map. Available online:
http://service.shmetro.com/yxxlt/index.htm (accessed on 2 January 2014).
29. Sun, D.J.; Zhang, C.; Zhang, L.; Chen, F.; Peng, Z.-R. Urban travel behavior analysis and travel
time predicting based on floating car data. Transp. Lett. Int. J. Transp. Res. 2014, 6, 118–125.
30. Sun, D.J.; Ni, X.-Y.; Peng, Z.-R. An improved incremental assignment model for parking variable
message sign location problem. J. Adv. Transp. 2015, doi:10.1002/atr.1305.
© 2015 by the authors; licensee MDPI, Basel, Switzerland. This article is an open access article
distributed under the terms and conditions of the Creative Commons Attribution license
(http://creativecommons.org/licenses/by/4.0/).