vulnerability of northwestern pennsylvania forests to … · we are grateful to wendell wallace,...
TRANSCRIPT

Vulnerability ofNorthwesternPennsylvania Foreststo Major Windstorms
Alexander M. Evans, Mary L. Tyrrell,Ann E. Camp, and Christopher C. Riely
Global Institute ofSustainable Forestry
GISF Research Paper 004
Program on Forest Health
Yale University School of Forestry & Environmental StudiesGlobal Institute of Sustainable Forestry

Vulnerability of NorthwesternPennsylvania Forests toMajor Windstorms
Alexander M. Evans, Mary L. Tyrrell, Ann E. Camp, and Christopher C. Riely
August 2005
Yale University Global Institute of Sustainable Forestry
School of Forestry and Environmental Studies360 Prospect Street, New Haven, Connecticut USAwww.yale.edu/gisf
This project was supported by a grant from the USDA Forest Service NortheastResearch Station

Table of Contents
Abstract 3
Introduction 4
Methods 10
Results 15
Discussion 18
Conclusion 20
References 21
Appendices 23
Acknowledgements
This project was made possible by the contributions of many people and organizations of northwesternPennsylvania. Susan Stout, USDA Forest Service Warren Lab, provided funding, inspiration, and a steadyreview of our analysis. Land owners were very generous with their time and data, in some cases doing extrawork to provide us with geospatial data on their forest stands. We are grateful to Wendell Wallace, LauraDrake, Andrea Hille, Ed Doane, and Jeanne Hickey at the Allegheny National Forest; Matt Sampson at TheForestland Group; Nancy McCloskey at FORECON; Mike McEntire at Forestland Investment Associates; MikeHancharick and Ned Karger at Kane Hardwoods; Dave Haubrick, John Wambaugh, Jim McGarvey, GregMcPherson, and Gary Loudermil at the Pennsylvania DCNR Division of Forestry; Howard Wurzbacher, ScottWolbert, Tony Ross, and Frank Chubon at the Pennsylvania Game Commission; and Dave Ondrejik at theState College National Weather Service Forecasting Center.

Yale University’s Global Institute of Sustainable Forestry 3
Abstract
Forests in northwestern Pennsylvania were subjected to a severe windstorm in July 2003. As high winds andthunderstorms are fairly frequent in this area, such events have major repercussions for landowners regardlessof their management goals. Some forests within the storm swath were more severely impacted than others andthis disparate effect on different forest stands raised questions about whether there are underlying causalfactors of stand vulnerability to windthrow. We hypothesized that windthrow severity is a function of stand andsite conditions. To assess vulnerability at the stand level to similar wind events we used a non-parametricmethod of statistical analysis called Classification and Regression Tree analysis (CART®) on data aboutwindthrow severity, stand characteristics, and site variables collected from the three largest landownersaffected by the storm.
According to our data, which include just about half of the lands in the storm swath, about 5,000 hectares(12,500 acres) experienced moderate or severe blowdown. This represents about 2% of the 258,000hectares (645,000 acres) of forest on the ownerships in our study. We first modeled stands as moderate,severe, or unaffected (3-level model) and then combined the moderate and severe damage categories to createa more general category of affected stands (binary model). The 3-level model predicted the level of blowdowncorrectly 86% of the time while the binary model was correct 89% of the time.
The most predictive biotic variables were stand structure and stand age. Predictive abiotic variables weremean elevation, the range of elevations across the stand (which translates to either slope steepness or variability),and topographic position relative to neighboring stands. Results show that windthrow was more likely to occurin older stands, at the highest elevations, and in flatter areas at lower elevations. Except for red maple standson wet sites, forest type was not a useful predictor of the storm’s impact.

Vulnerability of Northwestern Pennsylvania Forests to Major Windstorms 4
Introduction
Forests in northwestern Pennsylvania were subjected to a severe windstorm in July 2003. Such events havemajor repercussions for landowners regardless of their management goals. Wind is a common small-scaledisturbance, and occasionally a stand-replacing event, in these forest ecosystems. High winds and thunderstormsare fairly frequent in northwestern Pennsylvania and tornadoes occur about once a year (National ClimateData Center 2005b).
Some forests within the storm swath were more severely affected than others and this disparate impact ondifferent forest stands raised questions about whether there are underlying causal factors of stand vulnerabilityto windthrow. This windstorm provided an opportunity to relate stand characteristics (i.e., composition andstructure), management history, and site variables (soil type, topographic setting) to the amount of damagesustained by different stands. Knowledge about the relationships among stand characteristics, managementhistory, site variables, and susceptibility to windthrow can be used in developing models of risk.
We hypothesized that windthrow severity is a function of stand and site conditions. This hypothesis impliesthat at least some abiotic and biotic variables influence windthrow severity at the stand level. Topographicvariables such as slope and elevation are relatively fixed on the landscape and not likely to change over time.However, land management history may influence other variables, such as mean diameter (DBH) or density.Insight into how these variables influence windstorm damage could be useful to forest management planning.
To assess vulnerability at the stand level to similar wind events we collected and analyzed data aboutwindthrow severity, stand characteristics, and site variables from the three largest landowners in the areaaffected by the storm. The landowners—the USDA Forest Service (Allegheny National Forest), State ofPennsylvania (state game lands and state forests), and Kane Hardwoods, a private commercial timbercompany—represent a diverse range of management objectives and land management practices for thegeneral northern hardwoods/Allegheny hardwoods forest types. A fourth landowner, the Forestland Group, aTimber Investment Management Organization (TIMO), provided maps of their lands and areas affected by thestorm. While their stands are shown on the blowdown and ownership maps in this document, their geo-spatialdata on stand characteristics were insufficient for us to include their lands in statistical analyses.
We created a geographical information system (GIS) database using data on windthrow severity, standcharacteristics, and site conditions, from which we developed predictive models relating windthrow severity tostand and site conditions. We used a non-parametric method of statistical analysis called Classification andRegression Tree analysis (CART®), or recursive partitioning, since many of the variables are spatially correlatedand not normally distributed (Breiman et al. 1984). An advantage of classification tree analysis is that it canbe tailored to fit interactions not efficiently handled with regression or discriminant analyses, especially whendata contain both categorical and continuous variables. Researchers have used classification tree modeling fornumerous forestry questions: root disease locations (Byler et al. 1990), disease hazard rating (Baker et al.1993), fire refugia (Camp et al. 1997), individual tree mortality (Dobbertin and Biging 1998), species distribution(Brown and Timms 2002), ungulate damage (Caudullo et al. 2003), bark beetle damage (Lawrence andLabus 2003), tree cavity abundance (Fan et al. 2003), and forest invasion by exotic insects (Evans 2004).

Yale University’s Global Institute of Sustainable Forestry 5
2003 Windstorm
A severe windstorm struck northern and central Pennsylvania during the afternoon of July 21, 2003, with asecond day of severe weather on the 22nd (figure 1). This was an unusual Mesoscale Convection System, agroup of storms often dominated by a vigorous squall line and a number of weaker multi-cell clusters of stormsin its interior. These systems often bring severe weather and heavy rain at the squall line with additional heavyrainfall in interior storms (USDA Forest Service 2004).
Precipitation for the two days of July 21 and 22 ranged from 8.1 to 11.9 centimeters (3.2 to 4.7 inches) acrossWarren, McKean and Potter counties (NOAA 2005). Most of the rainfall occurred on the 22nd. In comparison,30-year mean precipitation amounts in this area for the entire month of July were 8.9 to 11.4 centimeters(3.5 to 4.5 inches) (National Climate Data Center 2002). Storm damage was exacerbated by the exceptionallywet conditions at the time. The months of May through July 2003 were extremely moist (National ClimateData Center 2005a), leaving soils saturated and making shallow rooted trees such as red maple (Acer rubrum)and black cherry (Prunus serotina) more susceptible to blowdown. The storm moved in a northeasterly direction,with the worst damage occurring over the northern Pennsylvania counties of McKean and Potter, wheretornadoes were confirmed southwest of Ellisburg, and at the Kinzua Viaduct Bridge near Kane (USDA ForestService 2004; NOAA 2005).
Damage to forests ranged from light (scattered toppling or snapping of single trees) to moderate (small clustersof downed trees) to severe (large areas of trees completely uprooted or snapped off). The areas most affectedwere on the Allegheny National Forest, Pennsylvania State Game Lands, the Susquehannock State Forest,and four large private commercial forests. Numerous small private forestlands in the path of the storm wereundoubtedly affected, but damage went largely unreported. The most spectacular damage was the collapseof the historic Kinzua Viaduct Bridge (see star on the map in figure 2).
According to our data, which include just about half of the lands in the storm swath, about 5,000 hectares(12,500 acres) experienced moderate or severe blowdown. This represents about 2% of the 258,000 hectares(645,000 acres) of forest on the four ownerships in our study (figure 2).
Figure 1. Radar reflectivity of the storm as it swept across Warren, Forest, Elk and McKean counties at 2:00 p.m. on July21, 2003. Source: National Weather Service Forecast Office 2003

Vulnerability of Northwestern Pennsylvania Forests to Major Windstorms 6
Figu
re 2
. D
amag
e fr
om t
he 2
00
3 w
inds
torm
in
nort
hwes
tern
Pen
nsyl
vani
a.
War
ren
Fore
st
McK
ean
Elk
Pot
ter

Yale University’s Global Institute of Sustainable Forestry 7
Allegheny Forest
This study includes the area severely impacted by the 2003 storm, which is most of McKean county, and largesections of Potter, Warren, Forest and Elk counties in northwestern Pennsylvania (figure 2) in the unglaciatednorthern Allegheny Plateau Province. Forests are classified as predominantly northern hardwoods/Appalachianhardwoods, Appalachian oak, American beech-sugar maple (Fagus grandifolia - Acer saccharum), and someremaining old growth Hemlock (Tsuga canadensis) (McNab and Avers 1994). Elevations range from 334 to 780meters (1,096 to 2,559 feet) (USGS 2004). Black cherry, sugar maple, and red maple are the predominantspecies and usually represent 65-95% of stand basal area, with associated species being American beech,eastern hemlock, yellow birch (Betula alleghaniensis), black birch (Betula lenta), white ash (Fraxinusamericana), yellow poplar (Liriodendron tulipifera) and cucumber tree (Magnolia acuminata) (Marquis 1975).
Our data, from forests managed by three different landowners, indicate that nearly 40% of the area in ouranalysis is comprised of northern hardwoods, and 32% Allegheny hardwoods. Dominant trees in thenorthern hardwoods type usually include American beech, red maple, sugar maple, black cherry (at lessthan 40% relative cover), black birch, yellow birch, paper birch (Betula papyrifera), northern red oak (Quercusrubra), and white ash. The Allegheny hardwoods type is characterized by at least 40% black cherry withcommon associates being red maple, sugar maple, black birch, yellow birch, American beech, and oak(Pennsylvania Division of Forest Advisory Services 1999).
In the pre-European settlement forests of this region, hemlock-beech was by far the most common forest type.Beech-sugar maple stands and scattered stands of pure white pine (Pinus strobus) were also prevalent, withbeech being the most ubiquitous hardwood in nearly all ages and sizes (Hough and Forbes 1943). In originalland surveys, beech and hemlock are the most commonly mentioned species (30% and 27% respectively),with the next most frequently mentioned being sugar maple at 8%. Cherry is infrequent at 3% (Lutz 1930b).The Allegheny Plateau was not settled by Europeans until 1796 and remained a heavily forested inaccessiblefrontier until about 1860. Early logging for pine and hemlock resulted in a mosaic of old growth with scatteredsecond growth patches in accessible areas. With the advent of logging railroads, the demand for chemicalwood, and to a lesser extent, charcoal for iron works operations further south, most of the forests on theAllegheny Plateau were completely clearcut between 1890 and 1920 (Marquis 1975).
Today’s forests are either second or third growth, mostly even-aged stands dominated by black cherry. This isa legacy of intensive fires and clearcut logging, conditions which favor the regeneration of shade intolerant,fast growing cherry (Marquis 1992, Hough and Forbes 1943, Collins and Picket 1982). Beech, sugar maple,and red maple are also common. However, it is hard to overestimate the importance and prevalence of blackcherry in these forests. In stands on the Kane Experimental Forest that were clearcut in 1937, black cherrywas 100% of the dominant and co-dominant crown strata by age 35, and 75% of the basal area by age 50(Marquis 1992). Thirty-two percent of the area analyzed for this study is in the cherry-dominated Alleghenyhardwoods forest type. Black cherry is a valuable commercial timber tree with stumpage prices in northwesternPennsylvania ranging from $844 to $2,436 per thousand board feet. This compares to the next most valuabletimber, northern red oak at $330 to $704 per thousand board feet (Pennsylvania Woodlands 2005).

Vulnerability of Northwestern Pennsylvania Forests to Major Windstorms 8
Land ownership in northwestern Pennsylvania is a patchwork of public and private lands, dominated by theAllegheny National Forest (ANF) in the western half of the study area (figure 3). Inholdings in the ANF aremostly state game lands and land owned by Kane Hardwoods, a division of Collins Pine, which also ownslands scattered throughout the entire study area. The eastern half of the study area has a more diverseownership, with private commercial owners (Kane Hardwoods, The Forestland Group, Forestland InvestmentAssociates, Seneca Resources, and Ram Forest Products), state forests, state game lands, and small privatelandowners. Management practices vary across the landscape, from intensive commercial harvesting towilderness areas.
Role of Disturbance
Historically, wind and drought were the major natural disturbances affecting the forests of the Allegheny Plateau(Lutz 1930a; Bjorksborn and Larson 1977). With European settlement in the early 19th century, logging andfire became the dominant disturbance, with complete stand replacing harvests and post-harvest fire occurringacross much of the landscape (Marquis 1975). Wind has historically been the most significant naturaldisturbance, and today, with a policy of fire suppression, wind and logging are the predominant landscape scaledisturbances. Collins and Pickett (1982), in their study of conditions in 1.2 hectares (3 acres) of secondgrowth hardwoods on the Kane Experimental Forest, found that pits and mounds occupied 42% of the studysite, occurring uniformly throughout the area. Pits and mounds are legacies of large tree falls, usually from
Figure 3. Forestland ownership map of northwestern Pennsylvania.
WarrenMcKean Potter
Forest Elk

Yale University’s Global Institute of Sustainable Forestry 9
wind (Stephens 1956). Tornadoes were recorded in 1805, 1808 and 1870, causing large areas of blowdown(Bjorksborn and Larson 1977). Two of these occurred in the Tionesta Scenic and Research Area (1808 and1870), which also experienced a severe windthrow event in 1950, a tornado in 1985, and was again affectedby the 2003 storm (Hough 1953, Peterson and Pickett 1995).
During the last 10 years the study area experienced an average of 11 high wind events per year. Tornadoeswere historically infrequent, with nineteen days of tornado activity in the last fifty years. However, in the lastten years, there have been 10 tornado events, an average of once a year. Either tornado activity has increasedor reporting has improved. There have been a few “tornado events” in the past twenty years where severaltornadoes hit on the same day, the most spectacular being on May 31, 1985 when twelve tornadoes wererecorded across four counties (figure 4) (National Climate Data Center 2005b).
Figure 4. Tornado events (days with tornado activity) and number of tornadoes in Potter,McKean, Elk, Forest, and Warren counties Pennsylvania 1950 - 2004. (National ClimateData Center 2005b)

Vulnerability of Northwestern Pennsylvania Forests to Major Windstorms 10
Methods
Our ability to use stand level variables to analyze windthrow susceptibility over the 525,000 hectare(1,312,500 acre) storm swath is only possible because of the widespread use of geographic information systems.We were able to assemble 19 attributes from over 4,500 stands from the geographic databases of threemajor landowners in the Allegheny region. The stand databases are part of the standard mapping for the threelandowners and were generously provided for use in this study. Two other landowners provided information onblowdown locations, but could not supply the stand attributes needed for the model. We used their maps ofblowdown locations to help map the storm’s path and describe the area affected by blowdowns.
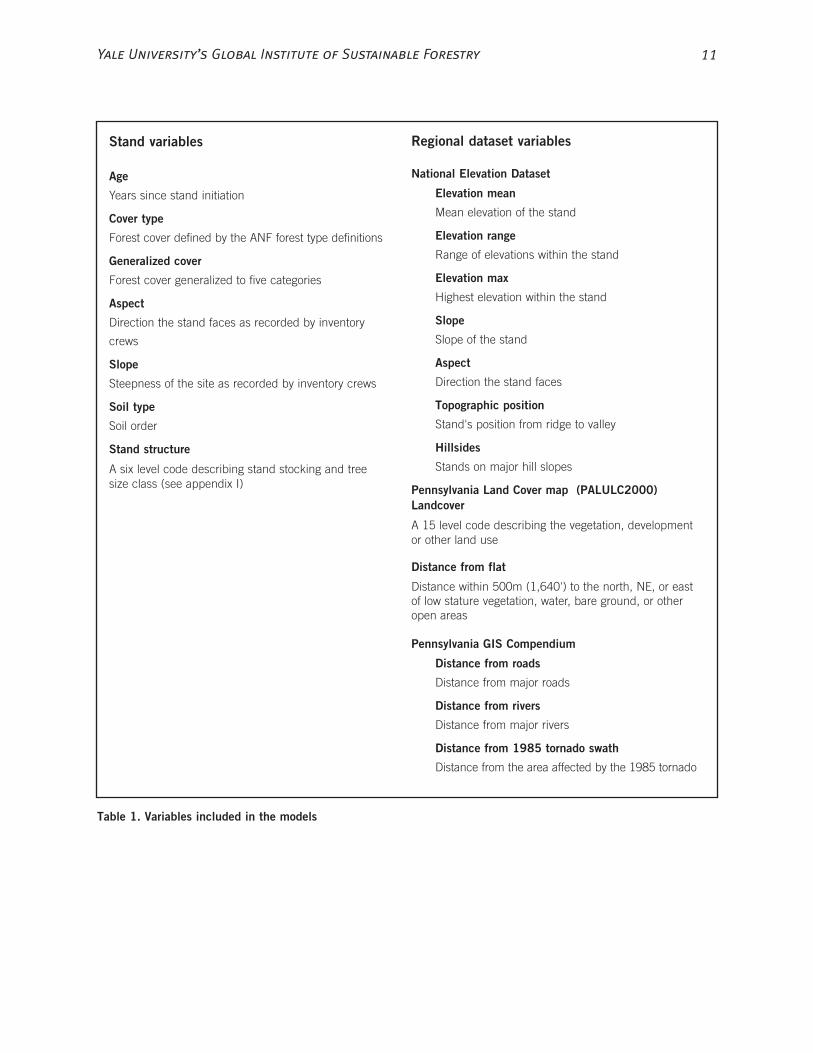
In addition to the databases of stand-level attributes, we used four regional datasets in order to includegeographic variables in the model (table 1). The national elevation dataset (NED) provides the best availableelevation data in 1-arc second resolution for the coterminous U.S. (U.S. Geological Survey 2004). We usedthe NED to generate a map of mean and maximum elevation as well as slope, aspect, topographic positionand hillsides (a variable identifying stands on major hill slopes). Topographic position was determined bycomparing each cell to a neighborhood average elevation and recording if it was higher (ridge) or lower(valleys). We used the Pennsylvania Land Cover map, with 15 landcover classifications, for exploring regionalland use patterns (Warner 2002). This enabled us to identify low stature vegetation, water, bare ground, andother open areas. We created a map where each cell within 500 meters (1,640 feet) to the north, NE, or east(downwind) of an open area was coded with the distance from that open area. Our goal was to capture theeffect of increased wind impact that might occur for forest stands downwind of an open area. We also usedmaps of roads and rivers to investigate their importance with respect to stand vulnerability to wind(Pennsylvania Department of Environmental Protection 1996). We digitized a map of the path of the 1985tornado to study the influence of distance from that disturbance (Eastern National Forest InterpretiveAssociation and U.S. Forest Service 1999).
We also collected data in the field to ensure that the model was not biased towards lands that are activelymanaged. Sampling sites on the ANF were located in wilderness areas and the Tionesta Scenic ResearchNatural Area where the Forest Service had not ground-truthed the aerial survey storm damage maps. StateGame Lands were included in the field survey because far less GIS (“digitized”) data is presently available onthese lands. The field crew measured 46 plots purposefully chosen to include both affected and unaffectedareas within the wilderness areas and game lands.
A great deal of work went into reconciling stand attributes as recorded by each organization in their databases.Each landowner uses slightly different stand attributes, classification systems, and codes. We created compatiblecodes for stand attributes based on conversations with local experts and written descriptions of eachlandowner’s classification system. Geographic attributes had to be reconciled because landowners mappedsome variables using stand boundaries and other data with different boundaries. We assigned soil attributesto a stand based on the majority soil type within that stand. Similarly, the impact of the windstorm did notnecessarily follow stand boundaries. Where blowdown polygons crossed stand polygon boundaries weassigned the majority stand type to the blowdown polygon.
We first modeled stands as moderate, severe, or unaffected (3-level model) and then combined the moderateand severe damage categories to create a more general category of affected stands (binary model). The privatelandowner used a category called light blowdown (only a few scattered trees toppled or broken) in addition to
Yale University’s Global Institute of Sustainable Forestry 11
Stand variables
Age
Years since stand initiation
Cover type
Forest cover defined by the ANF forest type definitions
Generalized cover
Forest cover generalized to five categories
Aspect
Direction the stand faces as recorded by inventory
crews
Slope
Steepness of the site as recorded by inventory crews
Soil type
Soil order
Stand structure
A six level code describing stand stocking and treesize class (see appendix I)
Regional dataset variables
National Elevation Dataset
Elevation mean
Mean elevation of the stand
Elevation range
Range of elevations within the stand
Elevation max
Highest elevation within the stand
Slope
Slope of the stand
Aspect
Direction the stand faces
Topographic position
Stand's position from ridge to valley
Hillsides
Stands on major hill slopes
Pennsylvania Land Cover map (PALULC2000)Landcover
A 15 level code describing the vegetation, developmentor other land use
Distance from flat
Distance within 500m (1,640') to the north, NE, or eastof low stature vegetation, water, bare ground, or otheropen areas
Pennsylvania GIS Compendium
Distance from roads
Distance from major roads
Distance from rivers
Distance from major rivers
Distance from 1985 tornado swath
Distance from the area affected by the 1985 tornado
Table 1. Variables included in the models

Vulnerability of Northwestern Pennsylvania Forests to Major Windstorms 12
moderate and severe. Because the other landowners did not make this distinction, we were unable to includelight blowdown in the model. For consistency, the few patches classified as light were included in the modelas unaffected, conforming to how the other landowners classified this minimal damage. We selected unaffectedpolygons from the path of the windstorm by identifying stand polygons within 200 meters (660 feet) of affectedstands. We chose not to include all unaffected stands within the storm swath because such a large numberof unaffected stands would mask patterns of stand and site variables for the affected stands. We analyzed asubset of the data using all the unaffected stands to test our inclusion method for unaffected stands. Theclassification tree model produced from this subset of data was very similar to our overall model for both variablesincluded and percent accuracy. The results of the subset analysis indicated our selection of unaffectedstands did not bias the model.
In addition to the full model we used subsets of the data to create specific classification trees and to examinethe affect of the windstorm more closely. The six models we investigated are listed in table 2. We developedindividual models based on data and variables from each of the three landowners. The ANF databaseincluded more detailed stand attributes such as stand basal area and DBH, and we incorporated these in theANF classification tree. In order to examine the affect of forest type on windthrow, we developed a fifthmodel using only the 1,500 Allegheny hardwood stands in the dataset. For the last model we only usedstands likely to be intensively managed in order to focus on the management implications of this research.This commercial timber model included the sawtimber stands on the ANF classified as Allegheny hardwoods,northern hardwoods, or mixed upland hardwoods. In all six models we considered both 3-level and binaryclassification of windstorm impact.
Model Name Data Included in Model
Full Model All 4,542 stands (all ownerships)
ANF Model Only stands owned by the U.S. Forest Service on the ANF
DCNR Model Only stands owned by Pennsylvania DCNR
Private Landowner Model Only stands owned by one private landowner
Allegheny hardwood model All Allegheny hardwood stand types across all ownerships
Commercial timber model Allegheny hardwood, northern hardwood, and mixed upland
stands of sawtimber size on the ANF
Table 2. Description of stands included in each model. All models were examined as both binary (unaffected,affected) and 3-level (unaffected, moderate, severe).

Yale University’s Global Institute of Sustainable Forestry 13
Analysis
We used the rpart package in the statistical language R to build a model to predict windthrow severity as afunction of stand and site variables. The rpart package implements a recursive partitioning algorithm, whichclosely follows the classification tree methodology of Breiman et al. (Breiman et al. 1984, R DevelopmentCore Team 2004). Recursive partitioning searches through the data to find the most effective method forsplitting the data into predefined groups, in this case affected and unaffected stands. Results of recursivepartitioning can be visualized as a decision tree. A complexity parameter measures how well different variablesand splits separate the data. To avoid over-fitting the model, limits are set on the minimum number of standsthat can be split at each node. Allowing smaller splits encourages the rpart to tailor the model exactly to thetraining data, which limits the model’s applicability to data not included in the study. Pruning the decisiontree corrects over-fitting. We pruned our models based on a 10-fold cross validation. We determined the bestmodel size by selecting the tree that was within one standard deviation of the minimum misclassificationerror. It is important to note that classification tree models are able to classify elements with missing values.In other words, a stand may be missing a value for a given split and still be included in the model. The rpartfunction uses surrogate variables to assign an element with a missing value to a category.
We used 19 variables from stand and regional level data to classify 4,542 stands. Six of the explanatory variableswere stand level attributes provided by the landowners and 13 were derived from regional datasets. All modelswere examined two ways: binary (affected/unaffected) and 3-level (severe/moderate/unaffected). Each modelused the same dataset, explanatory variables, and splitting decision rules. We used both the misclassificationpercentage and the Kappa statistic to compare models. The Kappa statistic is a measure of the differencebetween correct classification and random coincidence of model and test data (Lillesand and Kiefer 1994 p.616). The Kappa statistic is more resistant to the weight of a large number of correctly classified unaffectedstands than the misclassification percentage.

Vulnerability of Northwestern Pennsylvania Forests to Major Windstorms 14
Figure 5. Histogram of blowdown patch size.
Figure 6: Number of stands by forest type.NB: The y axis of the plot is logarithmic, de-emphasizing the differences in counts of stands by forest type.
Figure 7. Histogram of stand age. Dark columns are all stands; lighter columns stands that blew down.
Yale University’s Global Institute of Sustainable Forestry 15
Results
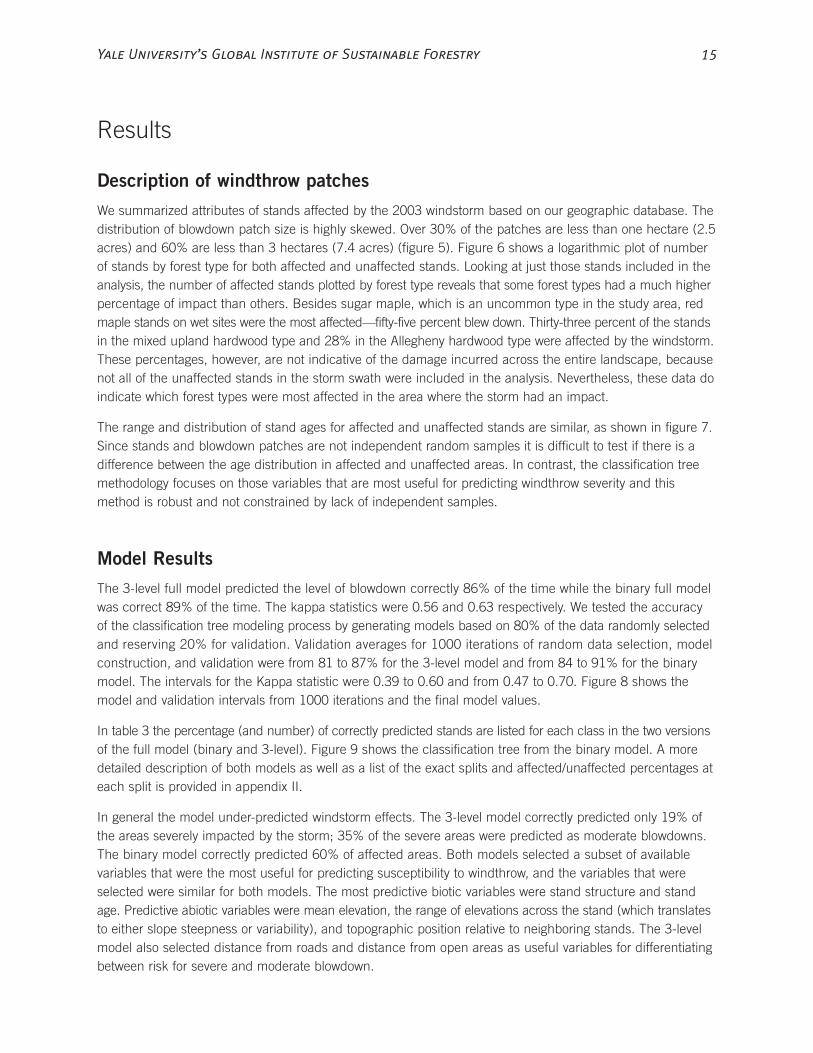
Description of windthrow patches
We summarized attributes of stands affected by the 2003 windstorm based on our geographic database. Thedistribution of blowdown patch size is highly skewed. Over 30% of the patches are less than one hectare (2.5acres) and 60% are less than 3 hectares (7.4 acres) (figure 5). Figure 6 shows a logarithmic plot of numberof stands by forest type for both affected and unaffected stands. Looking at just those stands included in theanalysis, the number of affected stands plotted by forest type reveals that some forest types had a much higherpercentage of impact than others. Besides sugar maple, which is an uncommon type in the study area, redmaple stands on wet sites were the most affected—fifty-five percent blew down. Thirty-three percent of the standsin the mixed upland hardwood type and 28% in the Allegheny hardwood type were affected by the windstorm.These percentages, however, are not indicative of the damage incurred across the entire landscape, becausenot all of the unaffected stands in the storm swath were included in the analysis. Nevertheless, these data doindicate which forest types were most affected in the area where the storm had an impact.
The range and distribution of stand ages for affected and unaffected stands are similar, as shown in figure 7.Since stands and blowdown patches are not independent random samples it is difficult to test if there is adifference between the age distribution in affected and unaffected areas. In contrast, the classification treemethodology focuses on those variables that are most useful for predicting windthrow severity and thismethod is robust and not constrained by lack of independent samples.
Model Results
The 3-level full model predicted the level of blowdown correctly 86% of the time while the binary full modelwas correct 89% of the time. The kappa statistics were 0.56 and 0.63 respectively. We tested the accuracyof the classification tree modeling process by generating models based on 80% of the data randomly selectedand reserving 20% for validation. Validation averages for 1000 iterations of random data selection, modelconstruction, and validation were from 81 to 87% for the 3-level model and from 84 to 91% for the binarymodel. The intervals for the Kappa statistic were 0.39 to 0.60 and from 0.47 to 0.70. Figure 8 shows themodel and validation intervals from 1000 iterations and the final model values.
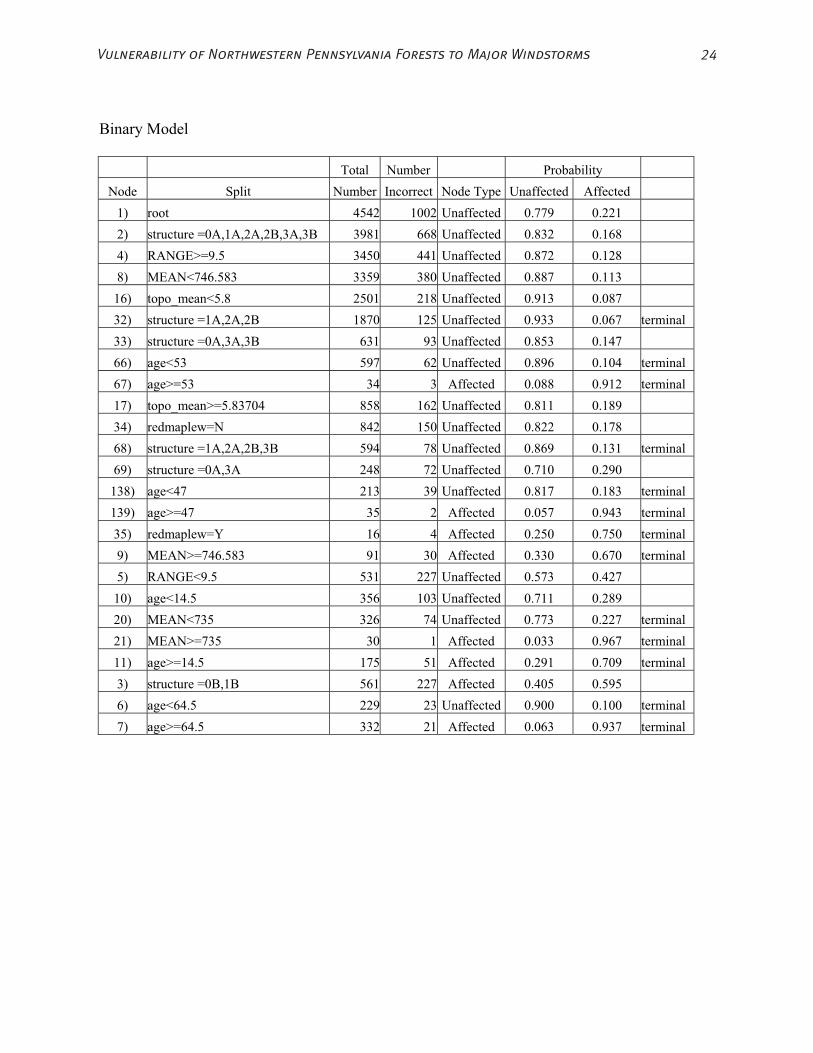
In table 3 the percentage (and number) of correctly predicted stands are listed for each class in the two versionsof the full model (binary and 3-level). Figure 9 shows the classification tree from the binary model. A moredetailed description of both models as well as a list of the exact splits and affected/unaffected percentages ateach split is provided in appendix II.
In general the model under-predicted windstorm effects. The 3-level model correctly predicted only 19% ofthe areas severely impacted by the storm; 35% of the severe areas were predicted as moderate blowdowns.The binary model correctly predicted 60% of affected areas. Both models selected a subset of availablevariables that were the most useful for predicting susceptibility to windthrow, and the variables that wereselected were similar for both models. The most predictive biotic variables were stand structure and standage. Predictive abiotic variables were mean elevation, the range of elevations across the stand (which translatesto either slope steepness or variability), and topographic position relative to neighboring stands. The 3-levelmodel also selected distance from roads and distance from open areas as useful variables for differentiatingbetween risk for severe and moderate blowdown.

Vulnerability of Northwestern Pennsylvania Forests to Major Windstorms 16
Because each of the ownerships used somewhat different variables, we also developed some specific modelsfor each ownership using only their data and classification system (see table 2).The ANF model data was themost effective, both with respect to the overall accuracy of prediction and the correct classification of thesevere and moderate blowdown classes; the binary version correctly classified 95% of all stands and 89% ofaffected stands (kappa .87). The DCNR model was similar to, although slightly less accurate than the fullmodel (kappa .62). The private landowner model was the least accurate and incorporated a different set ofsplitting variables (kappa .27). We also developed models based on forest type across the various ownerships.Results from the Allegheny hardwood model were similar to the full model; it used many of the same splittingvariables and predicted nearly 60% of affected areas correctly (kappa .62). The commercial timber modelused fewer stand variables since we only included a small set of stand types. Again its accuracy was similarto the full model (kappa .60).
0.3
0.4
0.5
0.6
0.7
0.8
0.9
1.0
kapp
a st
atis
tic
●
●
3 Level Binaryintervals are from 1000 model runs
stars are final model estimates
3040
5060
7080
9010
0
perc
ent c
orre
ct
●
●
3 Level Binary
Table 3: Full model results.
Figure 8: Test of full model accuracy. Intervals are from 1,000 model runs; stars are final model estimates.
3-Level Model Percent Correct Binary Model Percent Correct
Predicted Severe 19% (76 stands) Predicted Affected 60% (601 stands)
Predicted Moderate 65% (385 stands) Predicted Unaffected 97% (3,428 stands)
Predicted Unaffected 97% (3,432 stands)

Yale University’s Global Institute of Sustainable Forestry 17
Elev
atio
nRa
nge
(m)
Elev
atio
nM
ean
(m)
Elev
atio
nM
ean
(m)
Age
(yr
s)
Topo
grap
hic
Posi
tion
Red
Map
leW
etS
ite
0B
,1B
0A
,1A
,2A
,2B
,3A
,3B
<64
.5>=
64
.5
6
10
2120
4
9
3534
6766
139
138
1617 69
68
33
32
85
11
23
7
Blo
wn
Dow
n
Not
Blo
wn
Dow
n
22
91
75
30
18
70
5
97
34
59
4
21
33
51
69
13
26
33
2
xxx
>= 1
4.5
< 1
4.5
< 7
35
valle
yri
dge
< 7
46
.6
< 9
.5 >= 7
35
>= 4
7
>= 5
3
< 4
7
< 5
3
>= 9
.5
>= 7
46
.6
yes
no
Num
ber
of s
tand
s at
thi
s no
de —
out
ofa
tota
l of
4,5
42
sta
nds
in t
he a
naly
sis
Nod
e nu
mbe
r -
refe
r to
App
endi
x fo
r de
tails
1A
,2A
,2B
0A
,3A
,3B
1A
,2A
,2B
,3B
0A
,3A
Age
(yr
s)
Age
(yr
s)
Age
(yr
s)
Sta
ndS
truc
ture
Sta
ndS
truc
ture
Sta
ndS
truc
ture
Sta
nd S
truc
ture
Cod
es
0A
<
6”
dbh
and
>50
% s
tock
ed0
B
<6
” db
h an
d <5
0%
sto
cked
1A
6
-12
” db
h an
d >5
0%
sto
cked
1B
6
-12
” db
h an
d <5
0%
sto
cked
2A
1
2-1
8”
dbh
and
>50
% s
tock
ed2
B
12
-18
” db
h an
d <5
0%
sto
cked
3A
>
18
” db
h an
d >5
0%
sto
cked
3B
>
18
” db
h an
d <5
0%
sto
cked
Figu
re 9
. C
lass
ific
atio
n tr
ee f
or b
inar
y m
odel
.

Vulnerability of Northwestern Pennsylvania Forests to Major Windstorms 18
Discussion
Wind is a natural disturbance agent that affects forests throughout the world at both stand- and landscape-levels. Our hypothesis that windthrow severity is a function of biotic stand and abiotic site variables is supportedby previous work on windstorm impacts in temperate forests. Models have used similar variables to thoseincluded in this study to predict windthrow. EXPOS used topography (Foster and Boose 1992, Boose et al.1994) and ForestGALES used height, DBH, spacing, canopy width, stand edges, and topographic exposureto predict windthrow (Gardiner and Quine 2000). Studies have shown that a variety of related metrics can beused to differentiate stands affected by wind events from unaffected stands: vegetation height, speciescomposition, aspect and slope (Foster and Boose 1992); forest composition and structure without topographiceffects (Peterson and Rebertus 1997); topographic position, aspect, age, and fire history (Kulakowski andVeblen 2002); species (Canham et al. 2001); slope, elevation, soil type, and exposure to prevailing stormwinds (Kramer et al. 2001); and size and species for within-stand variation (Peterson 2004).
Our misclassification rate of 11% (binary model) is similar to other windthrow models and to other classifictiontree models of forest disturbance. For example, Kramer et al.’s (2001) logistic regression model of windthrowmisclassified 28% of the stands. Other misclassification rates for predicting forest disturbances usingclassification tree models range from 18% to 35% (Baker et al. 1993, Camp et al. 1997, Lawrence andWright 2001, Evans 2004), reflecting the inherent stochasticity of disturbance events as well as the difficultyof reducing ecological processes to numeric models. Our misclassification rate is particularly low because it ismuch easier to predict a common occurrence than a rare one and so the model classified the vast majority ofthe unaffected stands correctly.
The landscape pattern of blowdown in Northwestern Pennsylvania is similar to a study in Colorado that alsoreported a predominance of small patches of windthrow intermingled with intact forest (Lindemann andBaker 2001). This addition of forest openings increases the randomness, or complexity, of the landscape asdescribed by Boutet and Weishampel for a southern coniferous forest (2003).
Our modeling identified a number of characteristics that increase or decrease the probability of windthrowfrom such a storm. Older stands were disproportionately impacted by the storm, as were those growing athigher elevations. Just over one third (37%) of stands over 75 years old blew down. These stands accountedfor half of all the stands that blew down. Stands younger than 75 years were most vulnerable on the veryhighest elevations, above 746 meters (2,447 feet). Most of the terrain in the study area can be described aslocally hilly or steep, with a range of elevation throughout the stand greater than 9.5 meters (31 feet). About athird of the stands in this category blew down. Affected stands on this type of terrain tended to be on thehighest elevations, older, or have high basal area (either dense small trees or large diameter trees). In contrast,although there is much less flat terrain in the study area, about half of the stands on the flatter terrain blewdown. These flat areas within a hilly landscape would tend to have wetter soils and shallow rooted trees,making them vulnerable to wind.
The least vulnerable stands were those with at least 9.5 meters (31 feet) of elevation change within thestand, below about 746 meters (2,447 feet) in elevation and located in valleys or at midslope positions.These results are similar to what Hough (1953) reported—stands below about 600 meters (2,000 feet) wereless likely to be affected by storms. Stands that were least vulnerable were at lower elevation valleys and wereeither in the lower dbh classes or in higher dbh classes, but younger than 53 years (figure 9, nodes 32 and 66).

Yale University’s Global Institute of Sustainable Forestry 19
Besides these topographic features, it is also important that managers have information about the bioticcharacteristics of stands that are vulnerable to windthrow. While our models strongly suggest that bioticcharacteristics are important, our ability to report on the stand structure variables that reliably predict theeffects of windstorms on stands is limited. The size/density information for many of the affected stands on theANF is out of date by several decades and thus does not represent the structural conditions of the standwhen it blew down. However, we are confident that the basal area, age, and other variables for these stands areaccurate (personal communication, ANF). The stands that were at one time characterized as understocked,with small diameter trees, are now older than 64 years, and were disproportionately affected by the storm.These could be older stands on poor sites, or consist of scattered older trees with a dense understory cohort.We anticipate further fieldwork to better our understanding of the conditions these stands were in at the timethey were destroyed.
Because of this problem with the stand structure variable in the ANF data, we ran a model without standstructure to see if the results would point to different predictive variables. Essentially, they did not. Thisalternative model was much less predictive than the full model, with a Kappa value of .39 and an 83% percentcorrect classification. Nevertheless, this alternative model shows that, disregarding stand structure, age is avery strong predictor. In particular, stands over 75 years old are highly vulnerable.
Our data shed light on one structural variable that did not seem to play an important role: stand composition.Following the windstorm, there was speculation among forest owners, land managers, and the environmentalcommunity that stands comprised of a high number of black cherry were disproportionately impacted.Because of its commercial value much attention was directed on private and state lands towards salvagingblack cherry downed or weakened by the windstorm. Our research does not support this assumption thatcherry stands, which are a major component of the Allegheny hardwoods forest type, were disproportionatelyimpacted. Even when individual ownerships were modeled separately, forest type was not a useful predictorof the storm’s impact. The similarity of the full model to the Allegheny hardwood model further supports theidea that forest type does not influence windstorm impact, at least as forest type is currently recorded.
Downed trees in the Kane Experimental Forest.

Vulnerability of Northwestern Pennsylvania Forests to Major Windstorms 20
Perhaps data that more completely characterize stand structure and composition (such as species importancevalues) would better assist in predicting damage. Alternatively, stand composition may play a much lessimportant role than purely structural attributes such as dbh or density.
Risk of windthrow can have dramatic management implications. Despite being a natural agent of disturbance,the windstorms that periodically impact forests on the Allegheny Plateau considerably constrain landowner’sabilities to meet their management goals. We used the commercial timber model to explore the managementimplications of our research. Of the many combinations of variables incorporated into the model, four werefound to be useful to predict risk of windthrow. Windthrow was more likely to occur in: stands with 60 -79%relative density with open areas (defined as low vegetation, water, and bare ground) to the southwest; standson or just below ridges; stands on the upper-mid slope where the average slope was greater than 14%; andstands on slopes of large topographic features (mountainsides as opposed to smaller ridges).
ConclusionThe widespread use of GIS to manage both detailed stand-level and regional data provides new opportunitiesto investigate disturbances such as the 2003 windstorm in Northwestern Pennsylvania. Differences betweenownerships in classifications and codes impede regional analysis, but can be overcome with careful integrationand local knowledge. Classification and regression tree analysis is a powerful tool to study this kind of databecause it is robust in the face of missing data values, lack of independence between observations, andnon-Gaussian distributions. Our classification tree model was able to predict affected versus unaffectedstands with 89% accuracy, and severe, moderate, or unaffected stands with 86% accuracy. Forest type didnot prove to be a useful predictor of vulnerability to wind, with the exception of red maple stands on wetsites. The most important variables for determining the storm’s impact across the landscape were stand level,biotic factors including stand structure and age. Stand structure information that was out of date limited ourability to correlate blowdown risk with current structures in some of the most affected stands. Abiotic,landscape variables, such as elevation and topographic position, proved useful for estimating windthrow riskwithin a stand structure class or in the absence of stand structure data.

Yale University’s Global Institute of Sustainable Forestry 21
References
Baker, F. A., D. L. Verbyla, C. S. Hodges, Jr., and E. W. Ross. 1993. Classification and regression tree analysis forassessing hazard of pine mortality caused by Heterobasidion annosum. Plant Disease 77:136-139.
Bjorkborn, J. C., and R. G. Larson. 1977. The Tionesta Scenic and Research Natural Areas. General TechnicalReport NE-31, USDA Forest Service Northeastern Forest Experiment Station, Upper Darby, PA.
Boose, E. R., D. R. Foster, and M. Fluet. 1994. Hurricane impacts to tropical and temperate forest landscapes.Ecological Monographs 64:369-400.
Boutet, J. C., Jr., and J. F. Weishampel. 2003. Spatial pattern analysis of pre- and post-hurricane forest canopystructure in North Carolina, USA. Landscape Ecology 18:553-559.
Breiman, L., J. H. Friedman, R. A. Olshen, and C. J. Stone. 1984. Classification and Regression Trees. Chapmanand Hall / CRC, Boca Raton, FL.
Brown, K., and B. Timms. 2002. The distribution of Austrocrangonyx new species (Crustacea: Amphipoda) on theeastern New England plateau, Australia, with reference to riparian clearing. Journal of Aquatic Ecosystem Stressand Recovery 9:249-258.
Byler, J. W., M. A. Marsden, and S. K. Hagle. 1990. The probability of root disease on the Lolo National Forest,Montana. Canadian Journal of Forest Research 20:987-994.
Camp, A., C. Oliver, P. Hessburg, and R. Everett. 1997. Predicting late-successional fire refugia pre-datingEuropean settlement in the Wenatchee mountains. Forest Ecology and Management 95:63-77.
Canham, C. D., M. J. Papaik, and E. F. Latty. 2001. Interspecific variation in susceptibility to windthrow as a functionof tree size and storm severity for northern temperate tree species. Canadian Journal of Forest Research 31:1-10.
Caudullo, G., R. De-Battisti, C. Colpi, C. Vazzola, and F. Da-Ronch. 2003. Ungulate damage and silviculture in theCansiglio Forest (Veneto Prealps, NE Italy). Journal for Nature Conservation (Jena) 10:233-241.
Collins, B. S., and S. T. A. Pickett. 1982. Vegetation Composition and Relation to Environment in an AlleghenyHardwoods Forest. American Midland Naturalist 108:117-123.
Dobbertin, M., and G. Biging. 1998. Using the non-parametric classifier CART to model forest tree mortality. ForestScience 44:507-516.
Eastern National Forest Interpretive Association and US Forest Service. 1999. Hunting and recreation in the theAlleghenies. US Forest Service, Warren, PA
Evans, A. 2004. An Anisotropic Model of HWA Spread. in K. Gottschalk, editor. Proceedings of the 15th USDAInteragency Research Forum on Gypsy Moth and Other Invasive Species. USDA Forest Service, Annapolis, MD, USA.
Fan, Z., D. R. Larsen, S. R. Shifley, and F. R. Thompson. 2003. Estimating cavity tree abundance by stand age andbasal area, Missouri, USA. Forest Ecology and Management 179:231-242.
Foster, D. R., and E. R. Boose. 1992. Patterns of Forest Damage Resulting from Catastrophic Wind in Central NewEngland USA. Journal of Ecology 80:79-98.
Gardiner, B. A., and C. P. Quine. 2000. Management of forests to reduce the risk of abiotic damage: A review withparticular reference to the effects of strong winds. Forest Ecology and Management 135:261-277.
Hough, A. F., and R. D. Forbes. 1943. The ecology and silvics of forests in the high plateau of Pennsylvania.Ecological Monographs 13:299-320.
Hough, A. F. 1953. Preliminary recommendations for the management of black cherry on the northern AlleghenyPlateau. Journal of Forestry 51: 184-188.
Hough, A. F. 1959. Zoning for the management of black cherry on the Allegheny Plateau. Journal of Forestry 57:353-357.
Kramer, M. G., A. J. Hansen, M. L. Taper, and E. J. Kissinger. 2001. Abiotic controls on long-term windthrowdisturbance and temperate rain forest dynamics in southeast Alaska. Ecology 82:2749-2768.
Kulakowski, D., and T. T. Veblen. 2002. Influences of fire history and topography on the pattern of a severe windblowdown in a Colorado subalpine forest. Journal of Ecology 90:806-819.
Larson, B. C. 1986. Development and growth of even-aged stands of Douglas-Fir (Pseudotsuga-Menziesii) andGrand Fir (Abies-Grandis). Canadian Journal of Forest Research 16:367-372.

Vulnerability of Northwestern Pennsylvania Forests to Major Windstorms 22
Lawrence, R., and M. Labus. 2003. Early detection of Douglas-fir beetle infestation with subcanopy resolutionhyperspectral imagery. Western Journal of Applied Forestry 18:202-206.
Lawrence, R., and A. Wright. 2001. Rule-based classification systems using classification and regression tree(CART) analysis. Photogrammetric Engineering and Remote Sensing 67:1137-1142.
Lillesand, T., and R. Kiefer. 1994. Remote Sensing and Image Interpretation, 3rd edition. John Wiley & Sons, Inc,New York, NY.
Lindemann, J. D., and W. L. Baker. 2001. Attributes of blowdown patches from a severe wind event in theSouthern Rocky Mountains, USA. Landscape Ecology 16:313-325.
Lutz, H. J. 1930a. The vegetation of Heart’s Content, a virgin forest in northwestern Pennsylvania. Ecology 11:1-29.
Lutz, H. J. 1930b. Original composition in northeastern Pennsylvania as indicated by early land survey notes.Journal of Forestry 28:1098-1103.
Marquis, D. A. 1975. The Allegheny Hardwood Forests of Pennsylvania. General Technical Report NE-15, USDAForest Service Northeastern Forest Experiment Station, Broomall, PA.
Marquis, D. A. 1992. Stand development patterns in Allegheny hardwood forests, and their influence on silvicultureand management practices. Pages 165-181 in M. J. Kelty, editor. The Ecology and Silviculture of Mixed-SpeciesForests. Kluwer Academic Publishers, The Netherlands.
McNab, H. W., and P. E. Avers. 1994. Ecological Subregions of the United States. WO-WSA-5, USDA Forest Service.
National Climate Data Center. 2002. State, Regional, and National Monthly Precipitation Weighted by Area 1971 -2000. NOAA Historical Climatography Series No. 4-2., National Oceanic and Atmospheric Administration, Ashville, NC.
National Climate Data Center. 2005a. Climate Monitoring: US Temperatures and Precipitation.http://www.ncdc.noaa.gov/oa/climate/research/monitoring.html. Accessed 2/18/05
National Climate Data Center. 2005b. Storm event database. http://www4.ncdc.noaa.gov/cgi-win/wwcgi.dll?wwEvent~Storms. Accessed 2/18/05
National Oceanic and Atmospheric Administration. 2005. Precipitation Maps. National Weather Service ForecastOffice. www.erh.noaa.gov/ctp/precip.php. Accessed 2/15/05
National Weather Service Forecast Office. 2003. Radar reflectivity July 21, 2003. State College, PA.http://www.erh.noaa.gov/ctp/features/2003/Severe721.php. Accessed 2/18/05
Pennsylvania Department of Environmental Protection. 1996. Pennsylvania GIS Compendium. State ofPennsylvania, Harrisburg, PA. http://www.pasda.psu.edu/access/compendium.shtml. Accessed 2/18/05
Pennsylvania Division of Forest Advisory Services. 1999. Inventory Manual of Procedure for the Fourth State ForestManagement Plan. Pennsylvania Department of Conservation and Natural Resources, Harrisburg, PA.
Pennsylvania Woodlands. 2005. Timber Market Report July-September 2004. PennState School of ForestResources. http://www.sfr.cas.psu.edu/TMR/. Accessed 2/18/05
Peterson, C. J. 2004. Within-stand variation in windthrow in southern boreal forests of Minnesota: Is it predictable?Canadian Journal of Forest Research 34:365-375.
Peterson, C. J., and S. T. A. Pickett. 1995. Forest reorganization: A case study in an old-growth forest catastrophicblowdown. Ecology 76:763-774.
Peterson, C. J., and A. J. Rebertus. 1997. Tornado damage and initial recovery in three adjacent, lowland temperateforests in Missouri. Journal of Vegetation Science 8:559-564.
R Development Core Team. 2004. R: A language and environment for statistical computing. R Foundation forStatistical Computing, Vienna, Austria. http://www.R-project.org. Accessed 2/8/05
Stephens, E.P. 1956. The uprooting of trees: A forest process. Soil Science Society of America Proceedings 20:113-116
US Geological Survey. 2004. National Elevation Dataset. US Geological Survey, Souix Falls, SD.http://gisdata.usgs.net/ned/. Accessed 2/20/05
USDA Forest Service. 2004. 2003 Storm Assessment Addendum. Allegheny National Forest. Warren, PA.
Warner, E. D. 2002. Pennsylvania Land Cover, 2000. Office for Remote Sensing of Earth Resources, Penn StateUniversity, State College, PA. http://www.pasda.psu.edu/documents.cgi/orser/psu-palulc_2000.xml. Accesssed2/2005

Yale University’s Global Institute of Sustainable Forestry 23
Appendix I - Stand Structure
Stand structure code Size / Stocking
3A > 18" Dbh and > 50% stocked
3B > 18" Dbh and < 50% stocked
2A 12-18" Dbh and > 50% stocked
2B 12-18" Dbh and < 50% stocked
1A 6-12" Dbh and > 50% stocked
1B 6-12" Dbh and < 50% stocked
0A < 6" Dbh and > 50% stocked
0B < 6" Dbh and < 50% stocked
Appendix II - Model Outputs
3-level model
Total Number Probability
Node Split Number Incorrect Node Type Unaffected Moderate Severe
1) root 4542 1002 Unaffected 0.779 0.131 0.090
2) structure =0B,1B 499 272 Moderate 0.349 0.455 0.196
4) age>=64.5 332 115 Moderate 0.063 0.654 0.283 terminal
5) age<64.5 167 14 Unaffected 0.916 0.060 0.024 terminal
3)
structure
=0A,1A,2A,2B,3A,3B 4043 677 Unaffected 0.833 0.091 0.076
6) MEAN<746.2455 3916 583 Unaffected 0.851 0.085 0.064
12) RANGE<9.5 531 201 Unaffected 0.621 0.241 0.137
24) age>=14.5 175 71 Moderate 0.291 0.594 0.114
48) nearriver<7691.5 158 55 Moderate 0.241 0.652 0.108 terminal
49) nearriver>=7691.5 17 4 Unaffected 0.765 0.059 0.176 terminal
25) age<14.5 356 77 Unaffected 0.784 0.067 0.149 terminal
13) RANGE>=9.5 3385 382 Unaffected 0.887 0.061 0.052
26) redmaplew=N 3323 355 Unaffected 0.893 0.062 0.045
52) z_dev_code=0A,3A 862 164 Unaffected 0.810 0.121 0.070
104) age>=50.5 68 31 Moderate 0.059 0.544 0.397 terminal
105) age<50.5 794 100 Unaffected 0.874 0.084 0.042 terminal
53) structure =1A,2A,2B,3B 2461 191 Unaffected 0.922 0.041 0.037 terminal
27) redmaplew=Y 62 27 Unaffected 0.565 0.000 0.435
54) RANGE>=41.5 26 3 Unaffected 0.885 0.000 0.115 terminal
55) RANGE<41.5 36 12 Severe 0.333 0.000 0.667 terminal
7) MEAN>=746.2455 127 68 Severe 0.260 0.276 0.465
14) nearroad<2086 82 47 Moderate 0.207 0.427 0.366
28) DIST_FLAT>=174.5 39 11 Moderate 0.103 0.718 0.179 terminal
29) DIST_FLAT<174.5 43 20 Severe 0.302 0.163 0.535 terminal
15) nearroad>=2086 45 16 Severe 0.356 0.000 0.644 terminal
Vulnerability of Northwestern Pennsylvania Forests to Major Windstorms 24
Binary Model
Total Number Probability
Node Split Number Incorrect Node Type Unaffected Affected
1) root 4542 1002 Unaffected 0.779 0.221
2) structure =0A,1A,2A,2B,3A,3B 3981 668 Unaffected 0.832 0.168
4) RANGE>=9.5 3450 441 Unaffected 0.872 0.128
8) MEAN<746.583 3359 380 Unaffected 0.887 0.113
16) topo_mean<5.8 2501 218 Unaffected 0.913 0.087
32) structure =1A,2A,2B 1870 125 Unaffected 0.933 0.067 terminal
33) structure =0A,3A,3B 631 93 Unaffected 0.853 0.147
66) age<53 597 62 Unaffected 0.896 0.104 terminal
67) age>=53 34 3 Affected 0.088 0.912 terminal
17) topo_mean>=5.83704 858 162 Unaffected 0.811 0.189
34) redmaplew=N 842 150 Unaffected 0.822 0.178
68) structure =1A,2A,2B,3B 594 78 Unaffected 0.869 0.131 terminal
69) structure =0A,3A 248 72 Unaffected 0.710 0.290
138) age<47 213 39 Unaffected 0.817 0.183 terminal
139) age>=47 35 2 Affected 0.057 0.943 terminal
35) redmaplew=Y 16 4 Affected 0.250 0.750 terminal
9) MEAN>=746.583 91 30 Affected 0.330 0.670 terminal
5) RANGE<9.5 531 227 Unaffected 0.573 0.427
10) age<14.5 356 103 Unaffected 0.711 0.289
20) MEAN<735 326 74 Unaffected 0.773 0.227 terminal
21) MEAN>=735 30 1 Affected 0.033 0.967 terminal
11) age>=14.5 175 51 Affected 0.291 0.709 terminal
3) structure =0B,1B 561 227 Affected 0.405 0.595
6) age<64.5 229 23 Unaffected 0.900 0.100 terminal
7) age>=64.5 332 21 Affected 0.063 0.937 terminal