,vvxh 6hs ss - utah state university
TRANSCRIPT

http://www.jstor.org/stable/25046799
Your use of the JSTOR archive indicates your acceptance of JSTOR's Terms and Conditions of Use, available athttp://www.jstor.org/page/info/about/policies/terms.jsp. JSTOR's Terms and Conditions of Use provides, in part, that unlessyou have obtained prior permission, you may not download an entire issue of a journal or multiple copies of articles, and youmay use content in the JSTOR archive only for your personal, non-commercial use.
Please contact the publisher regarding any further use of this work. Publisher contact information may be obtained athttp://www.jstor.org/action/showPublisher?publisherCode=wef.
Each copy of any part of a JSTOR transmission must contain the same copyright notice that appears on the screen or printedpage of such transmission.
JSTOR is a not-for-profit service that helps scholars, researchers, and students discover, use, and build upon a wide range ofcontent in a trusted digital archive. We use information technology and tools to increase productivity and facilitate new formsof scholarship. For more information about JSTOR, please contact [email protected].
Water Environment Federation is collaborating with JSTOR to digitize, preserve and extend access to Journal(Water Pollution Control Federation).
http://www.jstor.org
Fate and transport of organics in soil:
model predictions and
experimental results Brian D. Symons, Ronald C. Sims, William J. Grenney
ABSTRACT: Laboratory batch reactors were used to generate quantitative information about the fate of polynuclear aromatic
hydrocarbon (PNA) compounds in soil systems. First-order deg radation rates and equilibrium partition coefficients determined in laboratory studies were used in the Vadose Zone Interactive
Processes (VIP) mathematical model to predict the fate and be havior of the PNA compounds as a function of time and soil
depth. Predicted model results were compared with independent laboratory soil column studies for model validation. The VIP
model provided a good approximation of the degradation and
transport of the seven PNA compounds evaluated after 6 months of incubation in soil. Sensitive parameters in the VIP model in cluded degradation rates and initial soil concentrations. /. Water Pollut. Control Fed., 60, 1684 (1988).
KEYWORDS: leachate, soil, organic chemicals, (polynuclear aromatic hydrocarbons), mathematical model, fate, (transport process), degradation, (vadose zone).
A validated mathematical model provides a tool for integrating and interpreting the complex physical, chem ical, and biological factors affecting degradation, immo
bilization, and transformation of organic compounds in soils. A validated unsaturated zone model is important for predicting the potential for groundwater contamination from organic compounds applied to soils in the vadose zone.
The Regulatory and Investigative Treatment Zone model (RITZ) was presented for use in banning specific hazardous wastes from land treatment.1 The model is based on an approach for simulating the fate of pesticides in soils.2 An expanded RITZ model has incorporated fea tures that increase its utility for evaluating the soil treat ability of a waste.3 A description of the Vadose Zone In teractive Processes (VIP) model (the expanded RITZ
model, RITZE) and experimental results using three polynuclear aromatic (PNA) compounds was presented.4 Results indicated that the VIP model closely simulated fate and behavior of three PNA compounds?anthracene,
fluoranthene, and naphthalene?in soil columns. Other
work provided a basis for the laboratory model validation examination using a complex environmental waste mix
ture.4
Laboratory validation for the complex waste was based on an approach described elsewhere.5 This paper describes
the usefulness of the VIP model and the model construct. Implementation of the laboratory validation is reviewed and model performance is compared with acceptance cri teria. Laboratory validation is a precursor to a currently conducted field validation of the model.6 Laboratory evaluation in a more controlled environment provided a
link between verification of model algorithms and field validation.
The acceptance criteria used in this laboratory valida tion were presented7 for use in validating the Pesticide
Root Zone Model (PRZM). It was indicated that, for screening applications, a model should replicate field data (concentration profile, total mass, flux past root zone, soil
water content, and storage) within an order of magnitude and site specific applications within a factor of two. Opti
mally, under controlled conditions in the laboratory, the VIP model should replicate laboratory data with much less variability than would be expected in a field validation.
Model Description The VIP model is a mechanistic model developed as a
predictive tool for numerically integrating and describing the physical, chemical, and biological processes in the soil unsaturated zone. It integrates degradation and immo
bilization processes of organic compounds in the vadose zone. The U. S. Environmental Protection Agency3 (EPA) is using the VIP (formerly RITZE) model as a predictive tool for land treatment demonstrations.
Model input. An organic constituent applied to the soil is acted on by degradation and immobilization mecha
nisms, which are in turn affected by soil, waste, site, and
operational factors. Table 1 presents factors and specific input information related to degradation and immobili zation required by the VIP model.
Model output. The model output predicts constituent concentration at incremental depths in the soil profile at different times during the waste application period. Spe cific outputs include
mass balance describing the mass of constituent re
maining, degraded, leached, and volatilized; constituent concentration profiles for the water, oil,
air, and soil phases;
1684 Journal WPCF, Volume 60, Number 9

Svmons et al.
Table 1?Design/operational variables required for use in the VIP Model.3
Soil properties
Porosity Bulk density, g/cm3 Moisture coefficient Saturated hydraulic conductivity,
m/d Initial constituent concentration,
water, air, and soil, g/m3
Operational factors
Plow zone depth, m
Treatment zone depth, m Waste application rate, g waste/
100 g soil Application period, days Application frequency, days
Environmental properties
Constituent concentration, ppm Weight fraction of oil, kg/kg Weight fraction of water, kg/kg Waste density, g/cm3 Oil density, g/cm3 Constituent detection limit, g/m3
Biodegradation information
Constituent decay rate, d~1 Oil decay rate, d~1
Waste properties
Van't Hoff-Arrhenius temperature coefficient
Site temperature, ?C Mean daily recharge rate, m3/m2 d
Immobilization information
Kq =
partitioning of constituent be tween water and oil (waste) phases
Kd =
partitioning of constituent be tween water and soil phases
Kh = partitioning of constituent be tween water and air phases
fractional proportion of air, water, and oil in the soil
pore space; and
constituent concentration in the groundwater.
Model assumptions. Model assumptions were required to determine input parameters for soil, site, waste, and
operational factors, and for inputs related to degradation and immobilization processes. Some of these assumptions were made to simplify soil system and numerical equation complexity. The soil is assumed to be a homogeneous system with constant porosity, bulk density, and chemical characteristics. Waste is a mixture of oil, water, specific
organic constituents, and inert matter. The applied waste
has constant characteristics of density and composition throughout the application period. Steady-state conditions are assumed during any month or season (for example, constant recharge rate and site temperature). Waste is
applied periodically to the soil system in which only four phases exist: soil, water, air, and oil. The oil is completely
mixed in and does not penetrate below the zone of waste
application.
Biodegradation is the primary decay mechanism. Pho todegradation and other abiotic decay mechanisms are insignificant. Biodegradation of waste constituents and oil follows first order kinetics as expressed by a decay coef ficient. Immobilization reactions are governed by constant
soil pore velocity, diffusion, and dispersion with depth. Mass transfer rates between the soil, oil, air, and water
phases are virtually instantaneous.
Detailed description and listings of the VIP model can be found elsewhere.3'4'6'7
Laboratory Validation of the Model A specific design scenario was developed for a laboratory
validation of the model. It is based on current design and management practices in the petroleum refining industry for land treatment of petroleum refinery wastes that are known to contain hazardous organic constituents. Vali
dation using land treatment of petroleum refinery wastes was selected because the 1984 amendments to the Re source Conservation and Recovery Act (RCRA) prohibit
land disposal of hazardous wastes beyond specific dates unless EPA determines that a land disposal method pro tects human health and the environment. Laboratory ex
periments were designed to test the hypothesis that mi gration of hazardous constituents from the application zone would not occur for as long as the petroleum wastes
remained hazardous.8 The American Petroleum Institute9 (API) has sponsored
studies to determine the range of site, waste, and operating conditions found at petroleum refinery land treatment facilities. Based on these studies, waste, site, and operating conditions were determined.
Waste description. The hazardous waste was a com
posite of three types of petroleum refinery wastes, includ
ing API separator sludge, dissolved air flotation float, and slop oil emulsion solids. Equal volumes of each type of
waste were mixed before soil application. The composite waste was analyzed for total oil and grease, total solids, volatile organic constituents, base neutral/acid extractable
organic constituents, and metals. The average oil and
grease content of the composite waste was 18.9% by
weight, the average solids content was 14.5% by weight, and thus, the water content was 66.6%. Waste density was
1.02 g/cm3. Polynuclear aromatic hydrocarbon (PNA) compounds were selected for this validation because they occur in petroleum and other industrial wastes, and rep resent a class of compounds with toxic and mutagenic
potential. These compounds were identified and quantified in the composite petroleum waste using EPA Method 8310, high performance liquid chromatography (HPLC ). Table 2 lists the concentrations of PNA compounds de tected in the composite waste.
Soil characterization. Two different soil types were used, Kidman sandy loam and Nunn clay loam. Soils were ob
tained from uncontaminated agricultural land located near Kaysville, Utah, and Fort Collins, Colo. To preserve the
in-situ soil profile for soil column studies, soils were col
lected in 15-cm increments to a depth of 1.5 m. Each 15 cm soil increment was sieved separately through a 2 mm
(#10) sieve before use in batch degradation or soil column
September 1988 1685

Symons et al._
Table 2?Average initial PNA constituent concen
trations in the waste.
Stan- Coefficient Number
Average dard de- of varia- ofsam
Compound ?ig/g viation tion pies
PNA:
Naphthalene 161 44.3 0.276 9
Acenaphthylene < 100
Acenaphthene 203 85.5 0.421 18 Fluorene 65.5 14.2 0.217 18 Phenanthrene 605 110 0.182 18 Anthracene 80.3 17.5 0.218 18 Fluoranthene 3 590 674 0.188 18
Pyrene 5 390 1230 0.228 18
Benzo(a)anthracene 1 087 301 0.277 18
Chrysene 303 96.2 0.318 18 Benzo
(b)fluoranthene ?
Benzo
(k)fluoranthene 86.9 25.5 0.294 18
Benzo(a)pyrene ?
Dibenzo
(a.h)anthracene ?
Benzo(g,h,i)perylene 18.5 2.22 0.120 3
lndeno(1,2,3, cd)pyrene 39.8 16.0 0.403 18
Oil and grease 209 000 26 600 0.142 36
studies. Table 3 presents measured physical, chemical, and biological characteristics of the upper 15 cm for the two soils.
Analytical procedures for PNA compounds. Soil samples collected for PNA analysis were frozen until extraction was begun. An aliquot was weighed out and extracted in m?thyl?ne chloride, using sonication. The m?thyl?ne chloride solvent extract was back-extracted with water at
a basic pH to remove phenolic interferences. The base neutral fraction was concentrated and passed through alumina gel to remove additional interfering substances. The resulting extract was then analyzed for the compounds of interest. Leachate samples did not require sonication.
Extracted samples were analyzed for PNA compounds using HPLC and following EPA method 8310.10 The compounds were separated using a watenacetonitrile sol
vent gradient. Detection was achieved using a fixed wave length (254 nm) UV detector.
Batch degradation studies. Batch reactors containing soil from the waste incorporation zone (the top 15 cm of soil) were used to establish the rate and extent of degra dation for the complex waste /soil mixture. Each reactor
consisted of a 600-mL glass beaker containing 200-g dry weight of non-acclimated soil and 2 g of waste acclimated soil from an active petroleum land treatment facility. The
moisture content of the Kidman sandy loam and Nunn clay loam was maintained at 11.1 and 23.9% by weight (one-third bar matric potential), respectively. The beakers
were covered with polyethylene film to retard evaporation but allow gas transfer. The beakers were incubated in the dark at 20?C ? 2?G
The waste mixture was applied to Kidman sandy loam and Nunn clay loam at concentrations of 2,4, and 8% by oil and grease (O & G) content. Waste-soil mixtures were
incubated at 20?C and extracted and analyzed in triplicate for PNA compounds and O & G concentrations to de termine changes in concentration over time of incubation in soil. One control reactor (soil without waste addition)
was also evaluated at each sampling event. Waste appli cation occurred only at the beginning of the study. Every 2 weeks beakers were aerated with a glass stirring rod, and
moisture was added. Triplicate reactors of each waste
loading rate/soil type combination were sacrificed each month of the 8-month study.
Data from the batch degradation studies were used to determine first order degradation constants for PNA compounds and for O & G. Table 4 presents first order degradation rate constants for each soil type and waste
loading rate evaluated. The 95% confidence limits were determined for compounds with sufficient data. Concen trations of naphthalene, acenaphthylene, acenaphthene,
fluorene, phenanthrene, and anthracene were below the
detection limit after 1 month, which yielded insufficient data for determination of degradation constants.
Partition coefficient studies. Laboratory studies were conducted to evaluate the partitioning of PNA compounds between waste and water followed by partitioning of a constituent present in the aqueous phase between the soil and the aqueous phase. This study was based on proce dures described elsewhere.3
The procedure required spiking the waste with the con stituents of interest so that they would partition in suffi cient quantities to be detected in all phases. Spiked waste
was mixed with distilled water in a reactor for 24 hours
Table 3?Physical, chemical, and biological char
acteristics of the upper 15 cm of soil.
Kidman
sandy Nunn clay Characteristics loam loam
Physical Percent sand Percent silt Percent clay Texture Moisture retention,
percent water Obar .33 bar 15 bar
Porosity Bulk density, g/cm3 Soil moisture coefficient11
Chemical
pH EC, mhos/cm Organic carbon, percent CEC, meq/L
Biological Bacteria, cfua/g Actinimycetes, cfu/g Fungi, cfu/g
56 29 15
sandy loam 24.5
13.0 5.0 0.39 1.61
4.90
8.1 0.5 0.51
11.7
2.3 X 10⁴ 3 X 10⁵ 4.3 X 10²
35 31 34
clay loam 39.0
23.6 11.2 0.38 1.51
8.52
8.1 0.4 1.1
18.8
2.2 X 10⁷ 3.1 X 10³ 3.1 X 10³
a Colony forming units.
1686 Journal WPCF, Volume 60, Number 9

Symons et al.
Table 4?Experimentally determined PNA compound first order degradation constants.
Kidman sandy loam, k (per day) Nunn clay loam, k (per day)
2% 4% 8% 2% 4% 8% Compound O&G O&G O&G O&G O&G O&G
Naphthalene >0.014 >0.019 >0.013 ? ? >0.016 Acenaphthylene >0.014 >0.014 ? ? ? ?
Acenaphthene >0.019 >0.056 >0.054 >0.007 >0.021 >0.043 Fluorene >0.045 >0.068 0.007 >0.023 >0.045 0.015
Phenanthrene >0.117 >0.118 0.016 >0.099 >0.120 >0.023 Anthracene >0.052 >0.075 0.013 >0.027 >0.051 >0.073
Fluoranthene 0.037 0.027 0.021 0.045 0.047 0.041 Pyrene 0.016 0.014 0.014 0.022 0.021 0.020
Benzo(a)anthracene 0.009 0.011 0.008 0.005 0.004 0.003 Chrysene 0.017 0.012 0.009 0.009 0.007 0.006
Benzo(k)fluoranthene 0.003 ? ? 0.005 0.005 0.003 Benzoig.h.Operylene 0.003 0.005 0.004 0.0004 0.003 ?
lndeno(1,2,3-cd)pyrene 0.007 0.011 0.005 0.010 0.011 0.012 Oil and grease 0.004 0.003 0.004 0.004 0.004 0.004
and subsequently centrifuged. The aqueous phase was an
alyzed to determine the waste to water partition coefficient (K0). A portion of the aqueous phase was retained and
mixed with both types of soil?Kidman sandy loam and Nunn clay loam. The aqueous and solid phases of this second mixture were then analyzed to determine the soil to water partition coefficient (Kd). The partition coefficient studies were completed by using various ratios of waste
to water (K0) and soil to water (Kd). Partition coefficients were determined for each individual set of data points, and an average partition coefficient was computed. If the
constituents were below detection limits in any of the me dia tested, the coefficient was not calculated. Table 5 sum
marizes the average K0, Kdi and Kh values.
Table 5?Summary of PNA partition coefficients determined experimentally.
Log K0, Kidman, Nunn, Compound 9/m3/g/m3 mL/g mL/g
Naphthalene 3.00 22.8 32.3
Acenaphthylene BDL8 BDL BDL
Acenaphthene 3.6 103.0 150.0 Fluorene 3.29 62.5 87.9 Phenanthrene 3.29 160.0 163.0 Anthracene 3.21 125.0 215.0 Fluoranthene BDL BDL BDL
Pyrene 3.32 59.6 183.0
Benzo(a)anthracene 3.34 199.0 189.0
Chrysene 3.30 175.0 212.0 Benzo(b)fluoranthene BDL 49.1 BDL
Benzo(k)fluoranthene BDL 86.8 271.0
Benzo(a)pyrene BDL 18.2 69.0
Benzo(g,h,i)perylene BDL 18.9 77.2
lndeno(1,2,3-cd)pyrene BDL BDL BDL
a Below detection limit.
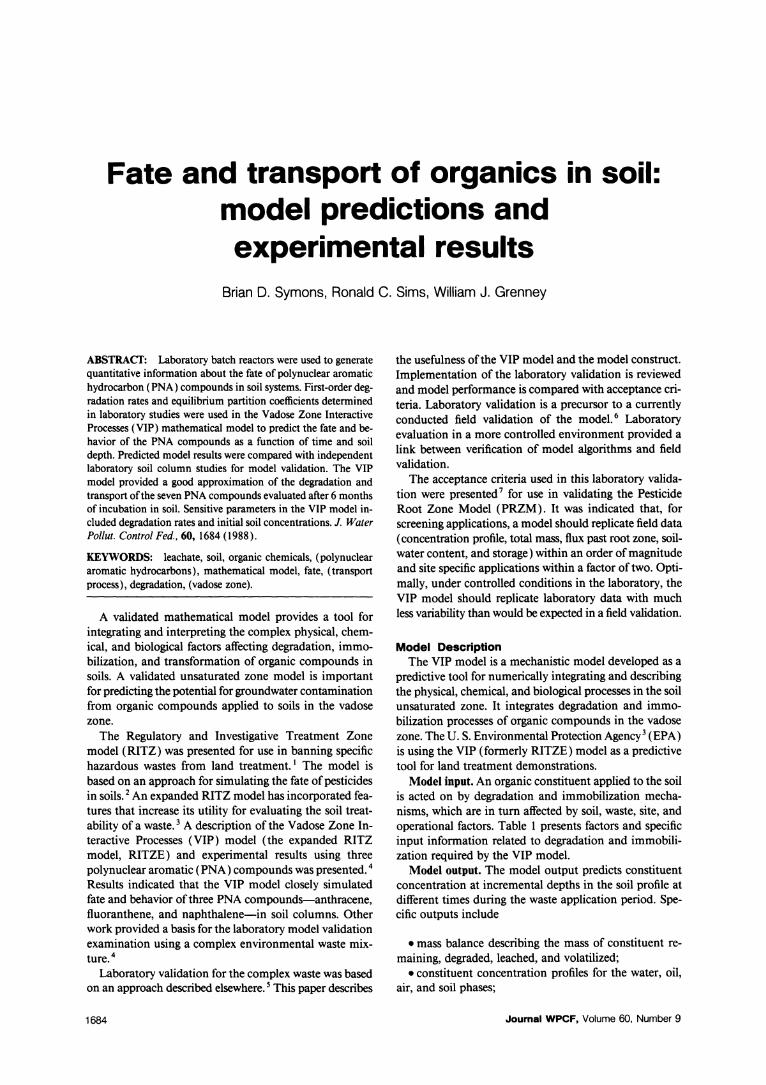
Soil column studies. Soil columns containing the upper 150 cm of soil were used to evaluate PNA compound
mobility. Twenty borosilicate glass columns, 150 cm long by 5 cm diameter, contained the 150-cm soil profile. A steel coupling with a polytetrafluoroethylene seal coupled a glass cap fitted with a polytetrafluoroethylene stopcock to the bottom of the glass pipe. Figure 1 shows the soil column construction. Ten grams of clean glass wool were
packed into the bowl of the glass cap to prevent soil from washing out the bottom of the column.
Sieved soil was packed in the glass columns in 7.5-cm
sections to a height of 137 cm. Following placement of the soil, columns were saturated with deionized water and
allowed to drain. Fifteen centimeters of contaminated
150 cm
15 cm CONTAMINATED SOIL
10 cm I.D. GLASS PIPE
STEEL COUPLING WITH RUBBER AND TEFLON INNER SEALS
10 cm BOTTOM FITTING WITH TEFLON STOPCOCK
3mmO.D. TEFLON TUBING
6mmO.D. GLASS TUBING
125 mL VACUUM FLASK
SAMPLE REFRIGERATOR
Figure 1?Soil column construction.
September 1988 1687

Symons et al.
waste/soil mixture were placed over the clean soil profile. The contaminated soil was a mixture of clean soil, 1% waste acclimated soil, and sufficient waste to result in loading rates of 2, 4, and 8% oil and grease. Two control columns were packed with 15 cm of 1% acclimated soil
mixed with clean soil. Triplicate soil columns for each soil type and application rate were constructed.
The soil columns were located in an enclosed, dark, ventilated room with an average temperature of 20?C ? 2. The average pan evaporation rate was 0.152 cm/d. The
upper 15 cm of the soil column was aerated by tilling, and moisture was adjusted every 2 weeks by water appli cation to 11.1% and 23.9% by weight for the Kidman sandy loam and the Nunn clay loam, respectively.
The equivalent of 4 cm of water was applied to each soil column every month, excluding water applied to compensate for evaporation. As water was applied, leach
ate from each column was collected in a 125-mL flask.
Samples were refrigerated at 4?C until analyzed. Soil columns were operated and sampled for 6 months,
after which they were destructively sampled. Samples were taken at depths of 30, 60, 90, and 120 cm and in the zone of incorporation (the upper 15 cm of soil). Only soil from the zone of incorporation was composited and subsam
pled. A soil sample from each depth was analyzed for PNA compounds, beginning at the zone of waste incor
poration and proceeding downward through each column
until no PNA compounds were detected in the sample, at which time analyses for that column were discontinued.
Extracted samples were analyzed for PNA compounds using HPLC and following EPA method 8310. Com pounds were separated using a watenacetonitrile solvent
gradient. Detection was achieved using a fixed wavelength (254 nm)UV detector.
Comparison of Model Predictions with Observed Laboratory Results
Data from soil and waste analyses and degradation and partitioning studies were used as input data for VIP model validation. Results from the VIP model were compared
with observed laboratory data to determine whether pre dictions met acceptance criteria.
Model input data. The initial PNA compound concen trations in the composite petroleum refinery waste were
calculated based on initial concentrations measured in
waste/soil mixtures (Table 2). Environmental properties selections were based on air
temperature and mean daily recharge rates measured in
the soil column studies. The average daily air temperature measured in the soil column studies from October 14,
1985 to August 26, 1986 was 22.3?C with a maximum of 26.0?C and a minimum of 18.5?C. An average air tem
perature of 20 ?C was selected for the model predictions.
Table 6?Predicted and measured PNA concentrations (/?9/g): Kidman sandy loam.
Measured Predicted
Depth, 2% 4% 8% 2% 4% 8% Compound cm O&G O&G O&G O&G O&G O&G
Fluoranthene 7.5 0.61 1.22 4.98 0.334 4.632 27.685 15 ? ? ? 0.343 4.819 27.960
22.5 ? ? ? 0.009 0.189 0.275
30 <0.6 <0.6 1.57 0 0.005 0 60 <0.6 <0.6 <0.6 0 0 0
150 <0.6 <0.6 <0.6 0 0 0
Pyrene 7.5 13.25 55.47 263.67 25.989 77.999 154.990 15 ? ? ? 26.638 80.494 156.040
22.5 ? ? ? 0.652 2.490 1.050
30 <1.0 <1.0 38.56 0.011 0.081 0.010 60 <1.0 <1.0 <1.0 0 0 0
150 <1.0 <1.0 <1.0 0 0 0
Benzo(a)anthracene 7.5 6.34 52.95 195.95 19.830 27.884 96.587
15 ? ? ? 20.027 28.313 96.969
22.5 ? ? ? 0.197 0.431 0.381
30 <0.5 <0.5 <0.5 0 0 0 150 <0.5 <0.5 <0.5 0 0 0
Benzo(k)flouranthene 7.5 2.84 10.37 28.18 4.848 16.907 34.541
15 ? ? ? 4.944 17.374 34.759
22.5 ? ? ? 0.097 0.469 0.218
150 <0.5 <0.5 0.5 0 0 0
ldeno(1,2,3-cd)pyrene 7.5 1.55 3.47 6.49 1.067 1.036 6.231 15 ? ? ? 1.068 1.037 6.232
22.5 ? ? ? 0 0 0 150 <0.5 <0.5 <0.5 0 0 0
1688 Journal WPCF, Volume 60, Number 9

Symons et al.
Because saturated and unsaturated hydraulic conductiv
ities were not measured, mean daily recharge rates were
estimated from soil column leaching data. Mean daily recharge rates for Kidman soil at 2, 4, and 8% O & G
were 0.0016, 0.0029 and 0.0010 m3/m2-d, respectively. Van't Hoff-Arrhenius temperature coefficients were nei
ther measured nor available in the literature, and thus were assumed to be 1.0.
Predicted model results and observed laboratory results.
Tables 6 and 7 present the observed laboratory and pre dicted model results after 6 months of soil treatment.
Model predictions for only 7 of the 16 PNA compounds evaluated were compared because of incomplete data for
degradation constants and constituent concentrations in
the soil. Target detection limits for base /neutral organic compounds3 were used as detection limits for model pre dictions. Detection limits for laboratory results were de termined by an analytical laboratory that conducted all
HPLC analyses for PNA compounds.
Discussion The acceptability of the VIP model was evaluated by
comparing measured and predicted concentration as a
function of depth as presented in Tables 6 and 7. Model ability to predict mobility and degradation was evaluated.
Mobility was defined as the depth a constituent would penetrate into the soil profile. Degradation was defined as
constituent concentration in the zone of waste incorpo ration after 6 months. Concentration versus depth data from the soil column analyses were insufficient to compare constituent concentrations of PNA compounds at depths other than in the zone of waste incorporation.
Mobility. None of the PNA compounds measured in soil samples removed from the soil columns were present above detectable limits at a depth greater than 30 cm below the soil surface. The VIP model predicted that none of the PNA constituents would be measured in concentra
tions greater than 0.005 /?g/g below 30 cm from the soil surface. The model predicted higher mobility of constit uents applied to Kidman sandy loams at the 4% O & G loading because of the significantly higher recharge rate used for the Kidman soil. Analysis of concentration versus depth data from the soil column study indicated that no constituents penetrated more than 15 cm below the zone of incorporation, 30 cm below the soil surface.
The VIP model predicted PNA compound mobility within the analytical limits of the soil column study. Be cause the laboratory columns were sampled at the zone
of waste incorporation and depths of 30, 60, 90, 120, and 150 cm, the degree of accuracy was ? 15 cm. Concentra
tions predicted by the model were in 7.5-cm increments with an incremental accuracy of ?3.8 cm. Detection limits for model predictions were within detection limits attained in the soil column study analyses. Detection limits for
Table 7?Predicted and measured PNA concentrations (m9/9): Nunn clay loam.
Measured Predicted
Depth, 2% 4% 8% 2% 4% 8% Compound cm O&G O&G O&G O&G O&G O&G
Fluoranthene 7.5 <0.6 0.81 30.06 0.103 0.131 0.535 15 ? ? ? 0.105 0.132 0.541
22.5 ? ? ? 0 0 0.006 30 <0.6 <0.6 <0.6 0 0 0
150 <0.6 <0.6 <0.6 0 0 0
Pyrene 7.5 6.67 57.26 226.28 9.972 22.897 45.684 15 ? ? ? 10.082 23.133 46.068
22.5 ? ? ? 0.111 0.237 0.385 30 <1.2 <1.2 3.30 0 0 0
150 <1.2 <1.2 <1.2 0 0 0
Benz(a)anthracene 7.5 5.87 56.66 251.92 43.547 103.570 242.210
15 ? ? ? 44.003 104.580 244.140
22.5 _____ 0.457 1.012 1.931
30 <0.6 <0.6 <0.6 0 0.006 0.011
60 <0.6 <0.6 <0.6 0 0 0
150 <0.6 <0.6 <0.6 0 0 0
Benzo(k)fluoranthene 7.5 3.30 9.48 34.17 3.491 6.910 19.419
15 _ ? ? 3.518 6.963 19.545
22.5 ? ? ? 0.027 0.053 0.126
150 <0.5 <0.5 <0.5 0 0 0
ldeno(1,2,3-cd)pyrene 7.5 1.43 2.85 8.11 0.652 1.064 1.585
15 _ ? ? 0.652 1.064 1.585
22.5 _____ 0 0 0
150 <0.6 <0.6 <0.6 0 0 0
September 1988 1689

Symons et al.
Table 8?Comparison of measured and predicted concentrations in the ZOI: Kidman sandy loam.
Concentration, pg/g
Compound Loading,
percent O & G Measured
(M) Predicted
(P) Ratio
(P):(M)
Fluoranthene
Pyrene Benzo(a)anthracenea Chrysene Benzo(k)fluoranthene
Benzo(g,h,i)perylenea lndeno(1,2,3-cd)Pyrene
Fluoranthene8
Pyrene Benzo(a)anthracene Chrysene Benzo(k)fluoranthene
Benzo(g, h, i)peryleneb lndeno(1,2,3-cd)Pyrenea
Fluoranthene8
Pyrene Benzo(a)anthracenea Chrysene Benzo(k)fluoranthene Benzo(g, h, i)pery lenea
ldeno(1,2,3-cd)pyrene
0.61 13.25 6.34 0.98 2.84 7.50 1.55
1.22 55.47 52.95
9.21 10.37 15.80 3.47
4.98 263.67 195.95 35.89 28.18 22.65
6.49
0.334 25.989 19.830
1.228 4.848 0.985 1.067
4.632 77.999 27.884
6.447 16.907
1.355 1.036
27.685 154.990
96.587 22.310 34.541
3.441 6.231
0.55 1.96
3.13 1.25 1.71
0.13 0.69
3.80 1.41
0.53 0.70 1.63
0.09 0.30
5.56 0.59
0.49 0.62 1.23
0.15 0.96
a Differs by greater than a factor of 2. b Differs by greater than a factor of 10.
Table 9?Comparison of measured and predicted concentrations in the ZOI: Nunn clay loam.
Concentration jig/g
Compound Loading,
percent O & G Measured
(M) Predicted
(P) Ratio
(P):(M)
Fluoranthene8
Pyrene Benzo(a)anthracenea Chrysene8 Benzo(k)fluoranthene
Benzo(g,h,i)perylenea lndeno(1,2,3-cd)pyrene8
Fluoranthene8
Pyrene8 Benzo(a)anthracene Chrysene Benzo(k)fluoranthene
Benzo(g,h,i)perylenea lndeno(1,2,3-cd)pyrenea
Fluorantheneb
Pyrene8 Benzo(a)anthracene Chrysene Benzo(k)fluoranthene Benzo(g,h,i)perylenea ldeno(1,2,3-cd)pyrenea
0.60 6.67 5.87 0.96 3.30 7.26 1.43
0.81 57.26 56.66 10.72 9.48
16.11 2.85
30.06 226.28 251.92
39.92 34.17 29.54
8.11
0.103 9.972
43.547 5.893 3.491 1.678
0.652
0.131 22.897
103.570 16.685 6.910 2.088 1.064
0.535 45.684
242.210 37.939 19.419 7.273 1.585
0.17 1.49
7.42
6.14 1.06
0.23 0.46
0.16 0.40 1.83 1.56
0.73 0.13 0.37
0.02 0.20 0.96 0.95 0.57 0.25 0.20
8 Differs by greater than a factor of 2. b Differs by greater than a factor of 10.
1690 Journal WPCF, Volume 60, Number 9

Symons et al.
PNA compounds in soils in the soil column study were between 0.5 /?g/g and 1.2 ?ug/g. The detection limit used for all phases in the model was 0.005 /ug/g
Degradation. Concentrations of constituents in the zone
of incorporation were used to evaluate model ability to
predict constituent degradation and persistence. This evaluation was possible because of the low volatility of PNA compounds and low mobility of the same com
pounds as indicated by soil column results and model predictions. The PNA compounds, once applied to the soil, primarily remain in the zone of waste incorporation
where biological processes can degrade them.
Tables 8 and 9 summarize the measured and predicted concentrations of constituents in the zone of incorporation
(ZOI) after 6 months. Ratios (the last column in Tables 8 and 9) less than 2 and greater than 0.5 indicate that the predicted concentration is within a factor of 2 of the ob served concentration. Ratios greater than 1.0 indicate that
the model over-predicted the final concentration in the zone of waste incorporation. Ratios less than 1.0 indicate
that the model under-predicted the final concentration.
The model did not consistently over- or under-predict the constituent concentrations after 6 months for all com
pounds (Figure 2). In 27 of 42 cases (64%), the model under-predicted the constituent concentration after 6
months. In 21 of 42 cases (50%), the model over- or under
predicted the final concentration by more than a factor of two, but in two of these cases the concentration was
Nunn clay loam
2% O&G 4% O&G 8% O&G
Ratio (Predicted/Measured)
Kidman sandy loam
2% O&G 4% O&G 8 % O&G
Ratio (Predicted/Measured)
Figure 2?Ratio of PNA concentrations predicted by the VIP model to PNA concentrations observed in laboratory columns.
y = .584x + 5.015, R-squared: .701
Figure 3?Linear regression of predicted versus measured concentrations in the ZOI 6 months after waste application.
under-predicted by a factor greater than 10. The model
consistently under predicted the constituent concentration
of benzo(g,h,i)perylene and indeno( 1,2,3-cd) pyrene. Figure 3 is a plot of the predicted concentrations in the
zone of incorporation after 6 months as a function of the
concentrations measured in the soil column studies. Figure 3 also gives the 95% confidence interval and the equation of the best fit line through the data by the least-squares
method. Ideally, the slope of the line should be 1.0, the y-intercept should be 0.0, and the coefficient of correlation should be 1.0. The slope of the line, 0.584, indicates a tendency for the model to under-predict observed results
as indicated previously. The coefficient of determination, R-squared, was 0.701, which is well above 0.0924, the
lower limit required to show a correlation for approxi
mately 40 points. Although the y-intercept is 5.015, this is only 1.9% of the maximum value. The data is statistically
within acceptable limits, but the results indicate a tendency to underestimate the observed concentration.
Sources of error. Sensitivity analyses of the VIP model indicated that the accuracy of the degradation rates and
initial waste concentrations used as inputs in model pre dictions can have a significant effect on the difference be tween measured and predicted results.
Tables 10 and 11 present a comparison of the differences between the degradation rates calculated from batch deg radation studies and used as inputs in the VIP model and the degradation rates observed in the soil columns. An error of only 5% in a degradation rate of 0.020/d will yield errors in the final concentration greater than 16%, after 180 days, assuming first order kinetics. Differences calculated in Tables 10 and 11 are highly variable, between -0.0116 and +0.0191 d"1. This can account for much of
the variability observed between measured and predicted results.
Initial and final concentrations measured in the soil can also vary significantly. The initial soil concentrations in batch degradation studies differed by 7.2 to 252% from initial soil concentrations measured in the soil columns.
This variability may be caused by non-representative sampling, incomplete mixing, or variability in the applied
waste itself. The accuracy of the HPLC analyses used to detect the PNA compound is also affected by interferences
September 1988 1691

Symons et al.
Table 10?Observed degradation rates from batch degradation and soil column studies: Kidman sandy loam.
Compound
Degradation rate, d
Loading rate,
percent O & Ga
Degradation study average
(1)
Column study average
(2) Difference
(1) - (2)
Fluoranthene
Pyrene Benzo(a)anthracene
Chrysene Benzo(k)fluoranthene Benzo(g, h, i)perylene lndeno(1,2,3-cd)pyrene
Fluoranthene
Pyrene Benzo(a)anthracene Chrysene Benzo(k)fluoranthene Benzo(g,h,i)perylene lndeno(1,2,3-cd)pyrene
Fluoranthene
Pyrene Benzo(a)anthracene
Chrysene Benzo(k)fluoranthene Benzo(g,h,i)perylene ldeno(1,2,3-cd)pyrene
0.0370 0.0160 0.0090 0.0170 0.0030 0.0030 0.0070
0.0270 0.0140 0.0110 0.0120 0.0000 0.0050 0.0110
0.0210 0.0140 0.0080
0.0090 0.0000 0.0040 0.0050
0.0378 0.0234 0.0188 0.0226
0.0107 -0.0012
0.0027
0.0366 0.0179 0.0087 0.0127 0.0096
-0.0054 0.0055
0.0326 0.0132 0.0056
0.0078 0.0004 0.0008 0.0086
-0.0008 -0.0074 -0.0098 -0.0056 -0.0077 0.0042 0.0043
-0.0096 -0.0039
0.0023 -0.0007 -0.0096
0.0104 0.0055
-0.0116 0.0008 0.0024
0.0012 -0.0004
0.0032 -0.0036
1 % O & G = initial percent oil and grease in the waste/soil mixture, waste wet weight/soil dry weight.
Table 11?Observed degradation rates from batch degradation and soil column studies: Nunn clay loam.
Degradation rate, d~1
Compound Loading rate,
% O & G
Degradation study average
(1)
Column study average
(2) Difference
(1) - (2)
Fluoranthene
Pyrene Benzo(a)anthracene Chrysene Benzo(k)fluoranthene Benzo(g, h, i)pery lene
lndeno(1,2,3-cd)pyrene
Fluoranthene
Pyrene Benzo(a)anthracene
Chrysene Benzo(k)fluoranthene Benzo(g, h, i)perylene lndeno(1,2,3-cd)pyrene
Fluoranthene
Pyrene Benzo(a)anthracene Chrysene Benzo(k)fluoranthene Benzo(g,h,i)perylene lndeno(1,2,3-cd)pyrene
2 2 2 2 2 2 2
4 4
4 4 4 4 4
8 8 8 8 8 8 8
0.0450 0.0220 0.0050 0.0090 0.0050 0.0004 0.0100
0.0470 0.0210 0.0040 0.0070 0.0050 0.0030 0.0110
0.0410 0.0200 0.0030 0.0060 0.0030 0.0000 0.0120
0.0335 0.0211 0.0137 0.0149 0.0041
-0.0011 0.0041
0.0369 0.0142 0.0059 0.0104 0.0025
-0.0055 0.0003
0.0219 0.0134 0.0043 0.0066
-0.0015 -0.0032 0.0047
0.0115 0.0009
-0.0087 -0.0059
0.0009 0.0015 0.0059
0.0101 0.0068
-0.0019 0.0034
0.0025 0.0085 0.0107
0.0191 0.0066
-0.0013 -0.0006
0.0045 0.0032 0.0073
1692 Journal WPCF, Volume 60, Number 9

Symons et al.
from other organic compounds present in the complex waste mixture.
Conclusions and Recommendations A laboratory validation of the VIP model demonstrated
the following:
A laboratory soil column study is a feasible method for validation of a fate and transport model before field validation.
The VIP model predicted the depth of penetration of seven PNA compounds within the limits of acceptance.
The VIP model provided a good approximation of the concentration of a constituent after 6 months, within a factor of two in half of the cases.
Variability in degradation rates and initial soil con centrations significantly affected the final concentrations of PNA compounds after 6 months.
The laboratory validation provided a basis for assessing the model in a field situation. Because many of the spatially and temporally variable factors such as soil characteristics, temperature, and recharge rate were constant in this study, even greater variability should be expected in field exper iments and even greater care must be taken to accurately determine the input values used in a field validation study.
Acknowledgments Credits. The Department of Civil and Environmental
Engineering, Utah State University, Logan, Utah and ERT: A Resource Engineering Company, Fort Collins, Colo., jointly conducted a research study, part of which is reported here, under the sponsorship of the American
Petroleum Institute (API). Craig Caupp, Utah State Uni versity, assisted Grenney in the development of the VIP
mathematical model evaluated in this paper. William Doucette, Utah State University, led in the laboratory an alytical analysis phase of the study, and Dave Erickson, ERT, led in the supervision and conduct of laboratory analyses.
Authors. Brian D. Symons, Ronald C. Sims, and Wil liam J. Grenney are research assistant, associate professor,
and professor, respectively, Civil Engineering Department, Utah State University, Logan. Correspondence should be addressed to Ronald C. Sims, Associate Professor, Civil and Environmental Engineering Department, Utah State
University, Logan, UT 84322-4110.
References 1. Short, T. E., "Modeling of processes in the unsaturated zone."
In "Land Treatment: A Hazardous Waste Management Al ternative." R. C. Loehr and J. F. Malina Jr. (Eds.), Water
Resources Symposium No. 13, Center for Research in Water
Resources, The University of Texas, Austin (1986). 2. Jury, W. A., et al, "Behavior Assessment Model for Trace
Organics in Soil: I. Model Description." J. Environ. Quality, 12,558(1983).
3. "Permit Guidance Manual on Hazardous Waste Land Treatment Demonstrations, Final Draft." EPA-530/SW-86 032, U. S. EPA, Washington, D. C. (1986).
4. Grenney, W. J., et al, "A mathematical model for the fate of hazardous substances in soil: Model description and ex
perimental results." Haz. Wastes Haz. Mat., 4, 4 (1987). 5. Hern, S. C, et al, "Generic Steps in Field Validation of
Vadose Zone Fate and Transport Models." In "Vadose Zone
Modeling of Organic Pollutants." S. C. Hern and S. M. Me lancom (Eds.), Lewis Publishers, Inc., Chelsea, Mich. (1986).
6. Grenney, W. J., et al, "Support Studies for Land Treatment Model Development/Verification." Cooperative Agreement No. CR-813211, U. S. EPA, Robert S. Kerr Environmental Research Laboratory, Ada, Okla. (1987).
7. Hedden, K. F., "Example field testing of soil fate and transport model, PRZM, Dougherty Plain, Georgia." In "Vadose Zone
Modeling of Organic Pollutants." S. C. Hern and S. M. Mel ancom (Eds.), Lewis Publishers, Inc., Chelsea, Mich. (1986).
8. American Petroleum Institute, "The Land Treatability of
Appendix VII Constituents Present in Petroleum Refinery Wastes: Laboratory and Modeling Studies." American Pe
troleum Institute, Washington, D. C. (1987). 9. American Petroleum Institute, "Land Treatment Practices
in the Petroleum Industry." American Petroleum Institute,
Washington, D. C. (1983). 10. U. S. Environ. Protect. Agency, "Test Methods for Evaluating
Solid Waste." SW-846, U. S. EPA, Washington, D. C. (1982). 11. Clapp, R. B., and Hornberger, G., "Empirical Equations for
Some Soil Hydraulic Properties." Water Resour. Res., 14, 601 (1978).
September 1988 1693