w12a annual report 2017 waste generation projections ... · 4.8 other municipal operations ... 15...
TRANSCRIPT
W12A Annual Report 2017
Waste Generation Projections & Landfill Capacity Assessment
Prepared by
City of London 300 Dufferin Avenue
P.O. Box 5035 London, Ontario
N6A 4L9
March 2018

This page has been left blank intentionally.

Waste Generation Projections and Landfill Capacity Assessment W12A Landfill Annual Report
Page i
Table of Contents
1.0 Introduction ................................................................................................................ 1
2.0 Population Projections ............................................................................................... 2
3.0 W12A Landfill Service Area Expansion ..................................................................... 3
4.0 Waste Types ............................................................................................................. 5
4.1 General .................................................................................................................. 5
4.2 Residential ............................................................................................................. 5
4.3 Industrial, Commercial and Institutional (IC&I) Waste ............................................ 8
4.4 Construction, Renovation and Demolition (CR&D) Waste ................................... 10
4.5 Sewage Sludge Ash ............................................................................................. 12
4.6 Sewage Sludge/ Biosolids .................................................................................... 13
4.7 Street Sweepings/ Road Works ........................................................................... 14
4.8 Other Municipal Operations.................................................................................. 15
4.9 Water Treatment Plant Process Residuals .......................................................... 15
4.10 Contaminated Soil ................................................................................................ 17
5.0 Waste Generation Projections ................................................................................. 18
6.0 Landfill Capacity Assessment .................................................................................... 1

Waste Generation Projections and Landfill Capacity Assessment W12A Landfill Annual Report
Page ii
List of Tables
Table 1 – Population Projections Table 2 – Proposed New Sources of Waste for W12A Landfill Table 3 – Waste Types Table 4 – Estimated 2017 CR&D Quantities Table 5 – Waste Generation Projections
List of Figures
Figure 1 – Locations of Potential New Sources of Waste for the W12A Landfill Figure 2 – Composition of Residential Garbage Figure 3 – CR&D Recycling Process Residuals Figure 4 – Sewage Sludge Ash Figure 5 – Water Treatment Plant Process Residuals Figure 6 – Waste Generation Projections Running Total (2017 to 2050) Figure 7 – Remaining Site Life
List of Appendices
Appendix A – Population Projections Appendix B – Historical Data on Waste Generation, Disposal & Diversion Rates Appendix C – Waste Generation Projections

Waste Generation Projections and Landfill Capacity Assessment W12A Landfill Annual Report
Page 1
1.0 Introduction This Waste Generation Projections and Landfill Capacity Report provides a review of historical waste quantities, projects future waste quantities and estimates the remaining life of the W12A Landfill. Historical information is provided on waste generation, diversion and disposal rates for the various types of waste that are being deposited at the W12A Landfill. This data is used to develop waste quantity projections for the next 33 years for a variety of scenarios that take into account: • Population growth estimates • Provincial waste diversion target of 60% for residential; industrial, commercial and
institutional (IC&I); and construction, renovation and demolition (CR&D) waste • The 2016 Provincial legislation (Waste-Free Ontario Act, Bill 151) which could result in
significant changes to how recyclables, organics and garbage would be managed in both the municipal (residential) sector and private (IC&I) sector in Ontario
• Existing waste audit data • Potential waste management options for materials not under municipal control should
tipping fee rates for the W12A Landfill or nearby private landfills be changed
The waste quantity projections are then used to estimate the site life of the W12A Landfill. The waste quantity projections suggest that the W12A Landfill has between 6 and 10 years of capacity remaining (2021 to 2028) depending on how residential, IC&I and CR&D waste is managed in the future. With no changes in the existing waste management practices it is estimated that the W12A Landfill has 6 years of capacity remaining (2024).

Waste Generation Projections and Landfill Capacity Assessment W12A Landfill Annual Report
Page 2
2.0 Population Projections For many types of waste, the quantity generated is directly proportional to an area’s population. As the population increases the quantity of waste increases and if the population decreases the quantity of waste decreases. For this reason population projections were developed for the 34 year study period. The most recent population projections for the City of London are contained in the report Employment, Population, Housing and Non-Residential Construction Projections, City of London, Ontario, 2011 Update prepared by the Altus Group in 2012 for the City of London. The update report provides population estimates for the years 2016, 2021, 2026, 2031, 2036 and 2041. These population estimates were used to develop permanent population projections for the period 2017 to 2050. For the period 2016 to 2041, the report’s estimates were used for the years that a population estimate existed. For other years between 2016 and 2041, the population was estimated by interpolation. For the period 2042 to 2050, it was assumed the rate of population growth would be the same as the period 2036 to 2041. Seasonal population projections were developed to account for the large number of out of town students living off campus and attending Western University and Fanshawe College. It was assumed that each student living off campus would generate two thirds of the garbage of a permanent resident since they typically attend school for 8 months of the year. The growth in the number of students was assumed to match the growth in permanent population. The population projections for City of London for the period 2017 to 2050 are summarized in Table 1. More detailed tables and information on the population projections is presented in Appendix A.
Table 1 - Population Projections
Year Permanent Population
Equivalent Seasonal
Population
Total Average Growth
2018 377,700 21,600 399,300 1.3%
2020 382,700 21,800 404,500 4.76%
2025 401,800 22,900 424,700 4.00%
2030 418,500 23,900 442,400 4.08%
2035 436,300 24,900 461,200 3.94%
2040 454,200 25,900 480,100 7.69%
2050 492,100 28,100 520,200

Waste Generation Projections and Landfill Capacity Assessment W12A Landfill Annual Report
Page 3
3.0 W12A Landfill Service Area Expansion The City of London applied to the Ministry of Environment and Climate Change (MOCEE) for an amendment to the Environmental Compliance Approval (ECA) for the W12A Landfill to accept waste from five locations that are outside W12A Landfill’s current approved service area. These locations are shown on Figure 1 (next page) and the types of waste to be accepted are listed in Table 2.
Table 2 –Proposed New Sources of Waste for W12A Landfill
Source Waste Type Estimated Average Annual Quantity
(tonnes/year)
Comments
Lake Huron Water Treatment Plant (located north of Grand Bend)
Water treatment plant process
residuals 9,000
Majority of waste generated from the drinking water treatment processes; the system supplies water to London
Elgin Area Water Treatment Plant (located east of Port Stanley)
Water treatment plant process
residuals 11,000
Majority of waste generated from the drinking water treatment processes; the system supplies water to London
TRY Recycling (Clarke Road, abutting London’s north municipal boundary)
Construction, renovation and
demolition recycling process residuals
and residential garbage from the
City’s EnviroDepot
20,000 (CR&D)
500 (Residential)
Majority of waste generated (80% to 90%) from processing material from London
Thames Centre Curbside collected residential waste generated in the winter months
800 Lowers cost for Thames Centre and City of London
Elgin County MHSW 40
Provides convenient location for Elgin residents and lowers cost for City of London
No changes to the landfill are proposed in order to increase the service area to accept waste from the five locations listed above. There will be no changes to the landfill’s approved rate of fill (amount of waste the landfill can receive in a year), types of waste that can be accepted, size or capacity of the landfill or engineering controls to protect the environment and mitigate nuisance impacts.

Waste Generation Projections and Landfill Capacity Assessment W12A Landfill Annual Report
Page 4
The City has applied to expand the service area of the landfill because:
• Lowers cost – Cost for London to operate the landfill is lowered due to “economies of scale”. Tipping fees for the municipalities and organizations using the W12A Landfill are lower than alternative disposal locations.
• Managing own waste – Over 80% of the waste from the new areas is generated as a result of organizations providing services to residents of London (e.g., providing safe drinking water, construction, renovation and demolition waste recycling).
• Regional coordination – London and several nearby municipalities already work together on recycling and MHSW programs. Accepting MHSW from Elgin County and municipally collected garbage from Thames Centre is a continuation of the regional approach to finding solutions for managing waste. For example, accepting MHSW from Elgin County will provide a convenient location for its residents to take their MHSW which will reduce the amount of material ending up in the garbage.
This application has been approved. It should be noted that Municipal Council remains in full control on where materials can come from that will be accepted at the W12A Landfill (provided that the areas are listed in the approved service area for the landfill and the materials are permitted under the ECA). An expanded service area does not commit Council to accepting material from these areas.
Figure 1- Locations of Potential New Sources of Waste for the W12A Landfill

Waste Generation Projections and Landfill Capacity Assessment W12A Landfill Annual Report
Page 5
4.0 Waste Types
4.1 General This section of the report looks at the different types of waste that the City is responsible for as well as waste not controlled by the City but accepts at its landfill for disposal. Current and future generation, diversion and disposal rates are developed for each waste type. The waste has been broken into nine types based on their characteristics as outlined in Table 3 below.
Table 3 - Waste Types
Type Characteristic
Composition1 Density (kg/m3)
Putrescible2
Residential Mixture 800 Yes IC&I Mixture 800 Yes CR&D Mixture 800 Yes Sewage Sludge Ash Uniform 1,200 No Biosolids Uniform 1,200 Yes Street Sweepings/Road Works Uniform 1,800 No Other Municipal Operations Mixture 800 Yes Water Treatment Plant Process Residuals Uniform 1,800 No Contaminated Soil Uniform 1,800 No Notes 1. Mixture refers to waste that is heterogeneous (contains a variety of different materials). Uniform
refers to waste that is homogeneous (contains same material).
2. Putrescible refers to waste that is solid waste that contains organic matter capable of being decomposed by microorganisms and of such a character and proportion as to cause obnoxious odours
Therefore historical data on the waste generation, disposal and diversion rates… are presented in Appendix B
4.2 Residential General Residential waste refers to waste generated from all single family, multi-family, high-rise and low-rise buildings. This category also includes some commercial and institutional waste collected on residential garbage routes but excludes residuals generated from recycling or composting residentially collected materials. The W12A Landfill receives residential waste from the City of London and from the Municipality of Thames Centre. City of London Historical data on the residential waste generation, disposal and diversion rates for London are presented in Appendix B. In general the last 25 years there has been a small

Waste Generation Projections and Landfill Capacity Assessment W12A Landfill Annual Report
Page 6
downward trend in residential waste generation, increasing waste diversion and decreasing waste disposal. Currently Londoners generate approximately 420 kilograms/year per capita of residential waste with 45% being diverted through various programs. The breakdown of the 55% that is disposed of in the W12A Landfill is presented in Figure 2.
The residential diversion rate in the future will depend on a number of factors many of which are outside the control of the municipality (e.g., changing public attitudes, improvements in technology for processing material, changes in packaging, changes in provincial legislation). One key factor is new legislation that would dramatically overhaul the province’s recycling regime. The legislation passed in 2016, entitled the Waste-Free Ontario Act, Bill 151 proposes to transition Ontario to be a more robust producer responsibility regime. One of the key changes that result from this new legislation is a shift in responsibility for the diversion of Blue Box recyclables from municipalities to industry. In fact, industry would be responsible for almost all residential waste diversion programs except for organics programs (e.g., leaf and yard waste, source separated organics). The province would establish diversion targets for each material and establish an independent oversight body to ensure compliance by industry. The potential lack of control or responsibility for a number of factors/programs that will determine the overall residential diversion rate makes it difficult to project future residential diversion rates. Items that should be considered when looking at future residential diversion rates include:
Organics 45%
Blue Box Recyclables
10%Blue Box Plus 5%
Depot Materials
10%
Garbage 30%
Organics 35%
Blue Box Recyclables
20%Blue Box Plus 5%
Depot Materials
10%
Garbage 30%
Figure 2 – Composition of Residential Garbage
Multi-res Curbside

Waste Generation Projections and Landfill Capacity Assessment W12A Landfill Annual Report
Page 7
• The Province announced a provincial waste diversion target of 60% for all waste sectors (residential, IC&I and CR&D) in 2004.
• London currently has a diversion rate of 45% which is better than most municipalities that do not have a Green Bin program.
• Diversion rates for the large municipalities that have Green Bin programs varied from 45% to 60% with an average between 50.5% and 55% (WDO Datacall, 2013).
• In December 2013, Road Map 2.0 – The Road to Increased Resource Recovery and Zero Waste (Road Map 2.0) was released which looked at numerous initiatives, including the Green Bin program, to increase waste diversion. These initiatives have the potential to reach 60% waste diversion and would take at least five years to fully implement.
• Multi-residential units have much lower diversion rates compared to single family homes. In London the average diversion rate for single family homes is 50% compared to 20% for multi-residential units.
• London has a higher percentage of multi-residential units (i.e., apartments buildings) compared to many other large municipalities. Approximately one in three housing units in London multi-residential. The percentage of multi-residential units in expected to increase in the future due to intensification (as per The London Plan) which will make it more difficult to increase diversion.
Considering the above, the assumptions used in determining the amount of residential waste from London that will need disposal capacity in the future include: • Residential waste generation will be 430 kilograms/year per capita in 2018 • There will be no change in the generation rate in future years • The residential diversion rate will be 45% (or 180 kilograms) in 2018 • The residential diversion rate could increase to 60% (or 240 kilograms/year per capita)
in future if appropriate waste diversion programs are implemented
Thames Centre The City has an agreement with Thames Centre to accept municipally collected residential garbage during winter months (so that the Thames Centre Landfill can close in the winter months and reduce operating costs) and in return the City can dispose of an equivalent amount of residential garbage in the Thames Centre Landfill in the summer. Thames Centre disposes of approximately 800 tonnes of waste at the W12A Landfill during the winter months. The City of London applied for an amendment to the ECA for the W12A Landfill to accept waste in the winter from Thames Centre without sending a corresponding amount of garbage back to Thames Centre in the summer. This application has been approved. For the purposes of this study it is assumed that the W12A Landfill will receive 800 tonnes of garbage from Thames Centre without sending a corresponding amount back beginning in 2017 and continuing as such in 2018. It is assumed that this amount will increase at the same rate as residential waste in London increases.
Waste Generation Projections and Landfill Capacity Assessment W12A Landfill Annual Report
Page 8
4.3 Industrial, Commercial and Institutional (IC&I) Waste Industrial, Commercial and Institutional (IC&I) waste consists of: • Industrial waste, which is generated by manufacturing and primary and secondary
industries and is managed off-site from the manufacturing operation; • Commercial waste generated by commercial operations such as shopping malls,
offices, etc.; and • Institutional waste generated by institutional facilities such as schools, hospitals,
government facilities, universities, etc.
The majority of IC&I waste is managed by the private sector although a small amount of commercial and institutional waste is managed by the City primarily limited to small businesses and offices on residential garbage routes and City facilities. This makes getting information and the calculation of waste generation, disposal and diversion rates difficult to determine. Available information on historical IC&I waste generation, diversion and disposal rates are presented in Appendix B and summarized below: • Estimates of IC&I waste generation for London from 1997 (480 kilograms/year per
capita) and more recent estimates for the province as a whole (530 kilograms/year per capita) are similar;
• Most IC&I waste is currently exported from London or diverted. Estimates for the province as a whole suggest that only 10% to 15% of IC&I waste is diverted from disposal;
• IC&I disposal volumes at W12A are highly variable depending on commercial tipping rates and available capacity at other facilities. As such, it is difficult to predict or trend volumes year to year;
• Average disposal rates at W12A Landfill over the past five years prior to 2017 have shown a decline due to commercial customers taking advantage of attractive tipping fees at other facilities;
• In 2017 a significant commercial customer returned to W12A depositing approximately 51,000 tonnes of IC&I at W12A causing an increase in IC&I disposal rates at W12A. Due to the variable nature of IC&I disposal as a result of market rates and capacity, it is not clear whether or not this customer will continue disposal operations at W12A in 2018;
• Approximately 57,000 tonnes of IC&I waste was disposed of at W12A in 2017 or 143 kilograms/year per capita; this represents about 27% of the IC&I waste generated. A significant portion of the IC&I waste received paid no or preferential tipping fees (e.g., waste from charities that divert waste like Goodwill, residuals from the City’s Material Recovery Facility, etc.)
The IC&I disposal rate in the future will depend on a number of factors of which are outside the control of the municipality and have the potential to result in dramatically different amounts of waste that will have to be managed by the City.
Waste Generation Projections and Landfill Capacity Assessment W12A Landfill Annual Report
Page 9
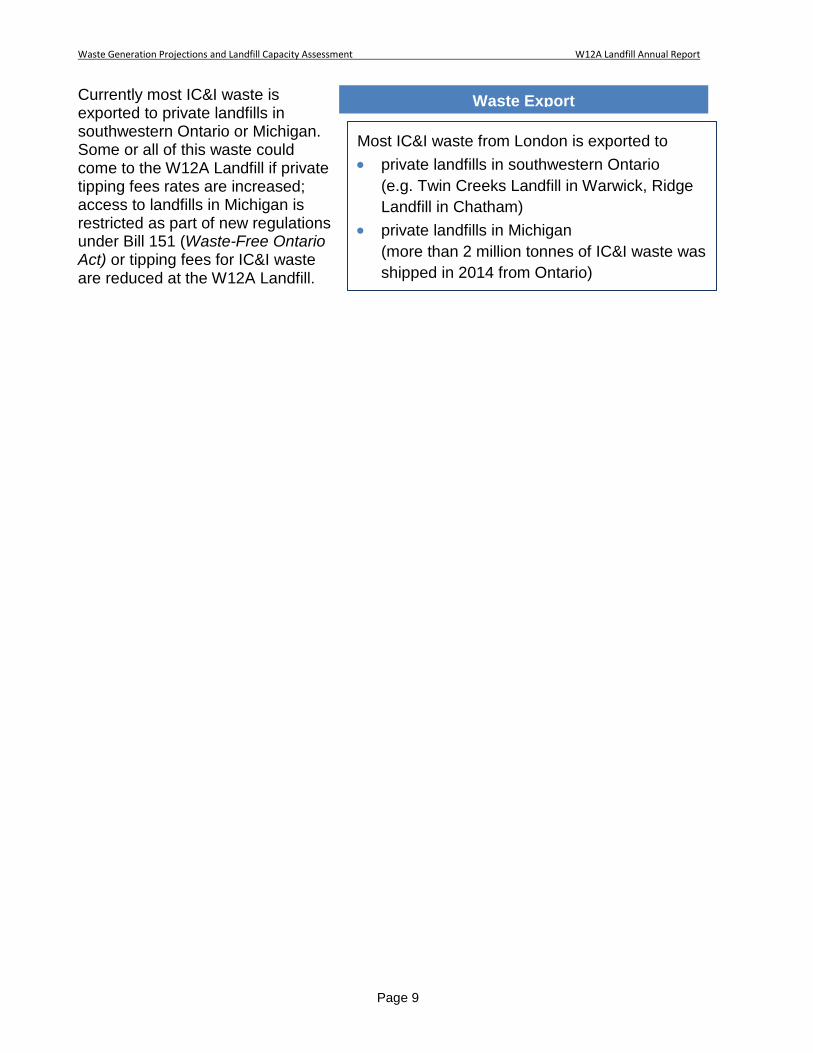
Currently most IC&I waste is exported to private landfills in southwestern Ontario or Michigan. Some or all of this waste could come to the W12A Landfill if private tipping fees rates are increased; access to landfills in Michigan is restricted as part of new regulations under Bill 151 (Waste-Free Ontario Act) or tipping fees for IC&I waste are reduced at the W12A Landfill.
Waste Export
Most IC&I waste from London is exported to • private landfills in southwestern Ontario
(e.g. Twin Creeks Landfill in Warwick, Ridge Landfill in Chatham)
• private landfills in Michigan (more than 2 million tonnes of IC&I waste was shipped in 2014 from Ontario)

Waste Generation Projections and Landfill Capacity Assessment W12A Landfill Annual Report
Page 10
Alternatively regulations under Bill 151 have the potential to reduce the amount of waste going to the W12A Landfill by increasing the amount of IC&I waste that is required to be diverted. The province currently has a diversion target of 60% for IC&I waste but only 10 to 15% of IC&I waste is actually diverted. Higher tipping fees at the landfill could also reduce the amount of IC&I waste received at the landfill. Considering the information in Appendix B, the assumptions used in determining the amount of IC&I waste from London that will affect disposal capacity in the future include: • IC&I waste generation will be 420 kilograms per capita in 2018 • There will be no change in the generation rate in future years • The IC&I disposal rate will be 110 kilograms per capita in 2018 • The amount of IC&I waste that will require disposal at City facilities could vary from a
low of 42 kilograms/year per capita (about 90% of the current generation rate) to 250 kilograms/ year per capita (60% current generation rate with all residual waste going to City facilities)
4.4 Construction, Renovation and Demolition (CR&D) Waste CR&D waste refers to waste generated by construction, renovation and demolition activities and generally includes brick, wood, drywall, metal, asphalt singles, insulation, doors, windows, etc. For the purposes of this report it excludes materials like asphalt and concrete that can be diverted from landfill for reuse at no or minimal cost. CR&D waste comes from a diverse range of sources and like IC&I waste is not under municipal control. This makes getting information about CR&D waste and the calculation of waste generation, disposal and diversion rates difficult. The majority of CR&D waste goes to one of three local CR&D recycling facilities with a small amount exported for disposal. It is estimated that approximately 100,000 tonnes of CR&D waste was generated in London in 2017 (see Table 4) which translates to a generation rate of approximately 250 kilograms/ year per capita. Approximately 50% of the material going to construction and demolition waste recycling facilities is diverted to beneficial uses while the remaining 50% becomes process residual waste that is sent for disposal. The process residual waste is solid non-hazardous waste consisting of film plastic, insulation, flat roofing, and other materials that cannot be recycled (see Figure 3, next page).
Table 4 - Estimated 2018 CR&D Quantities
Facility Processed (tonnes)
Green Valley Recycling 35,000 Try Recycling – Dingman 38,000 Try Recycling – Clarke Road 17,000 Export1 10,000 Total 100,000 Notes 1. It is estimated only a small percentage (10%) of CR&D
waste is exported based on conversations with industry members.

Waste Generation Projections and Landfill Capacity Assessment W12A Landfill Annual Report
Page 11
CR&D waste is banned from the W12A Landfill because there are local recycling options however CR&D recycling process residuals are accepted for disposal. The W12A Landfill could get up to 120 kilograms/year per capita if all CR&D waste went to CR&D recycling facilities and all the process residuals came to the W12A Landfill. In 2017 the W12A Landfill received 44,000 tonnes of CR&D process residuals. It should be noted that one of the facilities that recycles CR&D waste from London (Try Recycling – Clarke Road) is located just outside London and is outside the service are of the W12A Landfill. The City applied to the MOECC to amend the ECA for the W12A Landfill to accept CR&D process residuals from the Try Recycling – Clarke Road facility. The City made this application because the majority of process residuals are generated from processing material from London. The application has been approved. The amount of CR&D waste generated each year will varying based on the strength of the economy and the housing market. For the purpose of this study, it is assumed: • 2017 represents an average year for CR&D waste generation (250 kilograms/year per
capita) • The amount of CR&D waste generated per capita is not expected to increase or
decrease in the future • The maximum CR&D recycling process residuals is 125 kilograms per capita (50% of
CR&D waste) • The amount of CR&D process residuals that will require disposal at the W12A Landfill
could vary from a low of 0 kilograms/year per capita (lower tipping fees elsewhere) to 88 kilograms/year per capita (2017 rate) to 125 kilograms/year per capita (100% CR&D of all process residuals including residuals from Try Recycling – Clarke Road)
Figure 3 - CR&D Recycling Process

Waste Generation Projections and Landfill Capacity Assessment W12A Landfill Annual Report
Page 12
4.5 Sewage Sludge Ash Sewage sludge is a nutrient-rich organic material that is a by-product from wastewater treatment plants. The City operates six wastewater treatment plants of which the Greenway Pollution Control Centre (Greenway) is the largest. Greenway receives all of the residual sewage sludge produced in the City where it is dewatered. Until 1988 all sewage sludge was landfilled. Beginning in 1988, sewage sludge was incinerated at Greenway and landfilled when the incinerator was down for repairs or maintenance. Incineration of the sewage sludge destroys all organic matter resulting in an inorganic ash that is a non-hazardous solid waste. The ash is red in colour and consists of silt/clay size particles (See Figure 4, next page) Historical data on the amount of sewage sludge ash generated and how it was managed is presented Appendix B. The average amount of sewage sludge ash generated over the last decade is approximately 4,501 tonnes per year or 11 kilograms per capita per year. Until 2008, sewage sludge ash was taken to the W12A Landfill for disposal. Between 2008 and 2014, some or all of the ash each year was taken to St. Mary’s Cement where the ash was incorporated into the cement making process. Recently, St. Mary’s Cement stopped taking the ash and has advised the City that it is “very unlikely that we will resume use of this ash in the foreseeable future” because the variation in ash makes it difficult to incorporate into the cement making process. The report Greenway PCP Solids Options Study (R.V. Anderson, 2011) considered sewage sludge projections and the capacity of the incinerator. The report found that the incinerator would reach capacity sometime after 2028 if growth in sewage sludge production was equal to the growth in population. Based on historical growth of approximately 0.2%, the incinerator would have capacity lasting beyond 2070. Considering the above, the assumptions used in determining the amount of sewage ash to be managed in the future include: • Sewage sludge ash generation will be 4,300 tonnes in 2018 • Sewage sludge ash generation would increase 0.2% per year • The Greenway incinerator will have sufficient capacity until at least 2070 • No sewage sludge ash would be managed by St. Mary’s Cement
Figure 4 – Sewage Sludge Ash
Dewatered Sewage Sludge
• Approximately 25% solids and 75% water • 60,000 to 65,000 tonnes generated per year • 90% to 95% incinerated • 90% to 95% weight reduction when incinerated
Waste Generation Projections and Landfill Capacity Assessment W12A Landfill Annual Report
Page 13
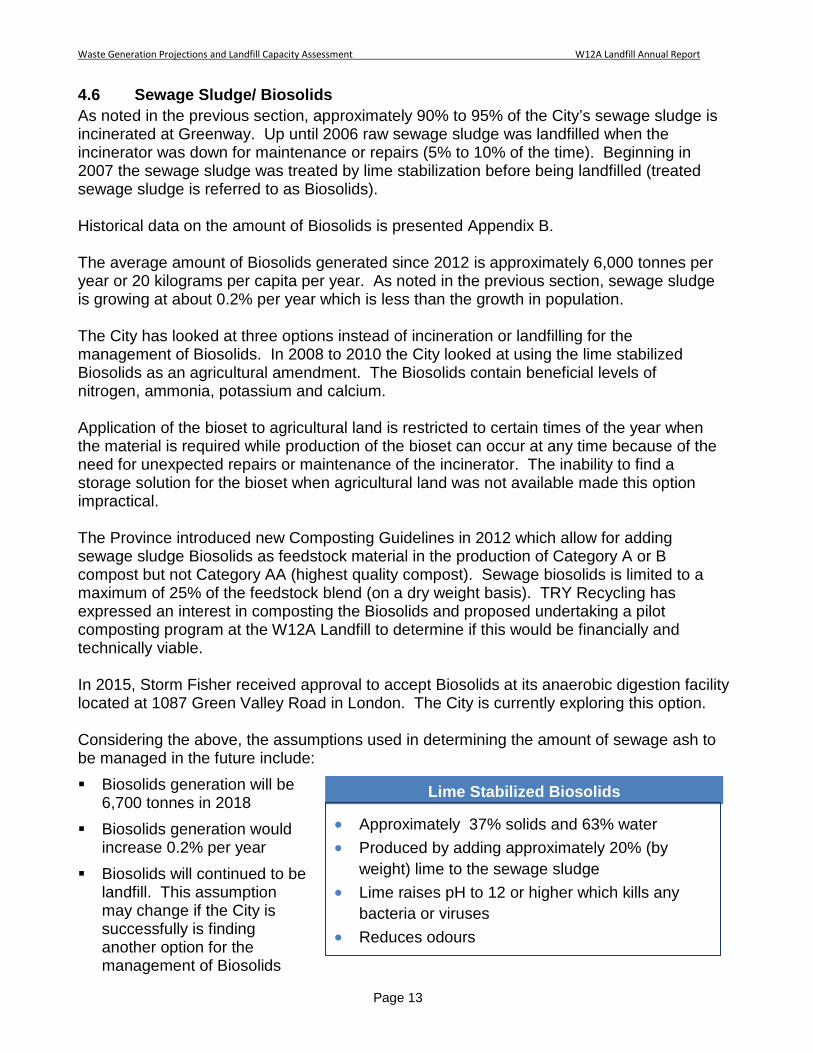
4.6 Sewage Sludge/ Biosolids As noted in the previous section, approximately 90% to 95% of the City’s sewage sludge is incinerated at Greenway. Up until 2006 raw sewage sludge was landfilled when the incinerator was down for maintenance or repairs (5% to 10% of the time). Beginning in 2007 the sewage sludge was treated by lime stabilization before being landfilled (treated sewage sludge is referred to as Biosolids). Historical data on the amount of Biosolids is presented Appendix B. The average amount of Biosolids generated since 2012 is approximately 6,000 tonnes per year or 20 kilograms per capita per year. As noted in the previous section, sewage sludge is growing at about 0.2% per year which is less than the growth in population. The City has looked at three options instead of incineration or landfilling for the management of Biosolids. In 2008 to 2010 the City looked at using the lime stabilized Biosolids as an agricultural amendment. The Biosolids contain beneficial levels of nitrogen, ammonia, potassium and calcium. Application of the bioset to agricultural land is restricted to certain times of the year when the material is required while production of the bioset can occur at any time because of the need for unexpected repairs or maintenance of the incinerator. The inability to find a storage solution for the bioset when agricultural land was not available made this option impractical. The Province introduced new Composting Guidelines in 2012 which allow for adding sewage sludge Biosolids as feedstock material in the production of Category A or B compost but not Category AA (highest quality compost). Sewage biosolids is limited to a maximum of 25% of the feedstock blend (on a dry weight basis). TRY Recycling has expressed an interest in composting the Biosolids and proposed undertaking a pilot composting program at the W12A Landfill to determine if this would be financially and technically viable. In 2015, Storm Fisher received approval to accept Biosolids at its anaerobic digestion facility located at 1087 Green Valley Road in London. The City is currently exploring this option. Considering the above, the assumptions used in determining the amount of sewage ash to be managed in the future include: Biosolids generation will be
6,700 tonnes in 2018 Biosolids generation would
increase 0.2% per year Biosolids will continued to be
landfill. This assumption may change if the City is successfully is finding another option for the management of Biosolids
Lime Stabilized Biosolids
• Approximately 37% solids and 63% water • Produced by adding approximately 20% (by
weight) lime to the sewage sludge • Lime raises pH to 12 or higher which kills any
bacteria or viruses • Reduces odours
Waste Generation Projections and Landfill Capacity Assessment W12A Landfill Annual Report
Page 14
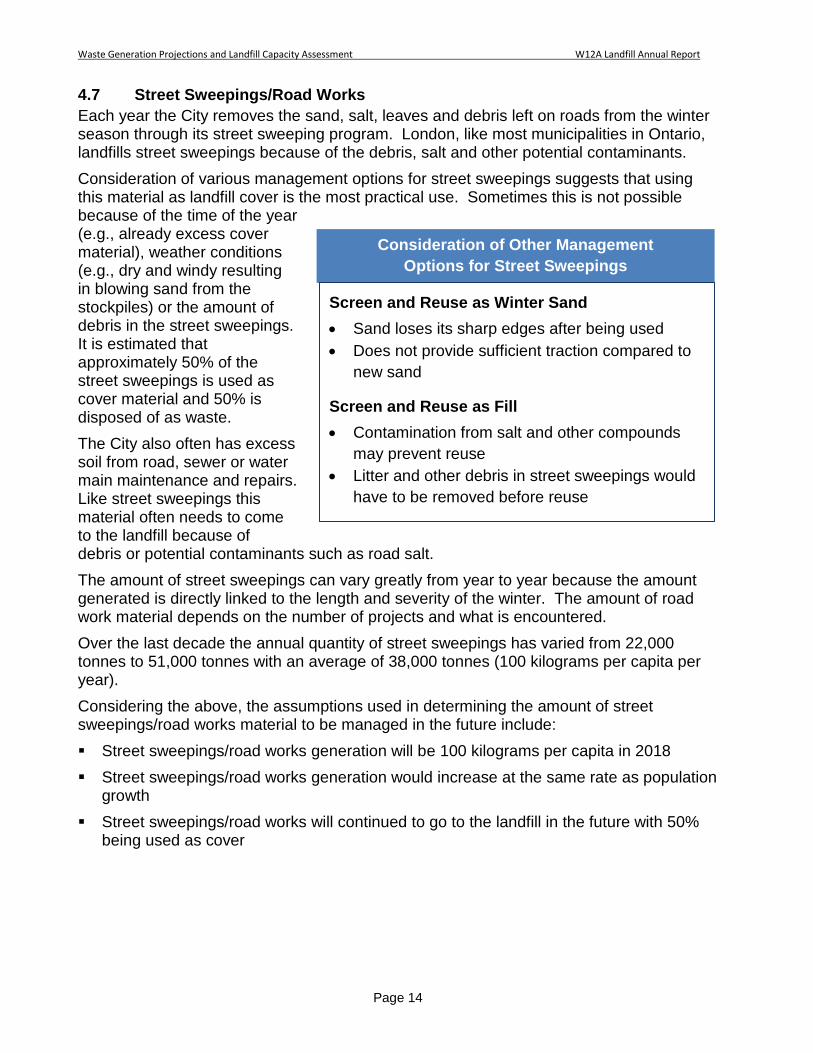
4.7 Street Sweepings/Road Works Each year the City removes the sand, salt, leaves and debris left on roads from the winter season through its street sweeping program. London, like most municipalities in Ontario, landfills street sweepings because of the debris, salt and other potential contaminants. Consideration of various management options for street sweepings suggests that using this material as landfill cover is the most practical use. Sometimes this is not possible because of the time of the year (e.g., already excess cover material), weather conditions (e.g., dry and windy resulting in blowing sand from the stockpiles) or the amount of debris in the street sweepings. It is estimated that approximately 50% of the street sweepings is used as cover material and 50% is disposed of as waste. The City also often has excess soil from road, sewer or water main maintenance and repairs. Like street sweepings this material often needs to come to the landfill because of debris or potential contaminants such as road salt. The amount of street sweepings can vary greatly from year to year because the amount generated is directly linked to the length and severity of the winter. The amount of road work material depends on the number of projects and what is encountered. Over the last decade the annual quantity of street sweepings has varied from 22,000 tonnes to 51,000 tonnes with an average of 38,000 tonnes (100 kilograms per capita per year). Considering the above, the assumptions used in determining the amount of street sweepings/road works material to be managed in the future include: Street sweepings/road works generation will be 100 kilograms per capita in 2018 Street sweepings/road works generation would increase at the same rate as population
growth Street sweepings/road works will continued to go to the landfill in the future with 50%
being used as cover
Consideration of Other Management Options for Street Sweepings
Screen and Reuse as Winter Sand • Sand loses its sharp edges after being used • Does not provide sufficient traction compared to
new sand
Screen and Reuse as Fill • Contamination from salt and other compounds
may prevent reuse • Litter and other debris in street sweepings would
have to be removed before reuse
Waste Generation Projections and Landfill Capacity Assessment W12A Landfill Annual Report
Page 15
4.8 Other Municipal Operations Other Municipal Operations consists of waste generated by City operations excluding street sweepings, Biosolids and sewage sludge ash. This includes street non-recyclable waste from waste from City parks, residuals from the City’s material recovery facility and grit from pollution control plants. Over the last five years the annual quantity of waste from Other Municipal Operations has varied from 5,600 tonnes to 9,600 tonnes with an average of 8,900 tonnes (20 kilograms per capita per year). There is limited opportunities to divert this material. Considering the above, the assumptions used in determining the amount of Other Municipal Ops waste to be managed in the future include: Other Municipal Operations waste generation will be 20 kilograms per capita in 2018 Other Municipal Operations waste generation would increase at the same rate as
population growth Other Municipal Operations waste will continued to go to the landfill in the future
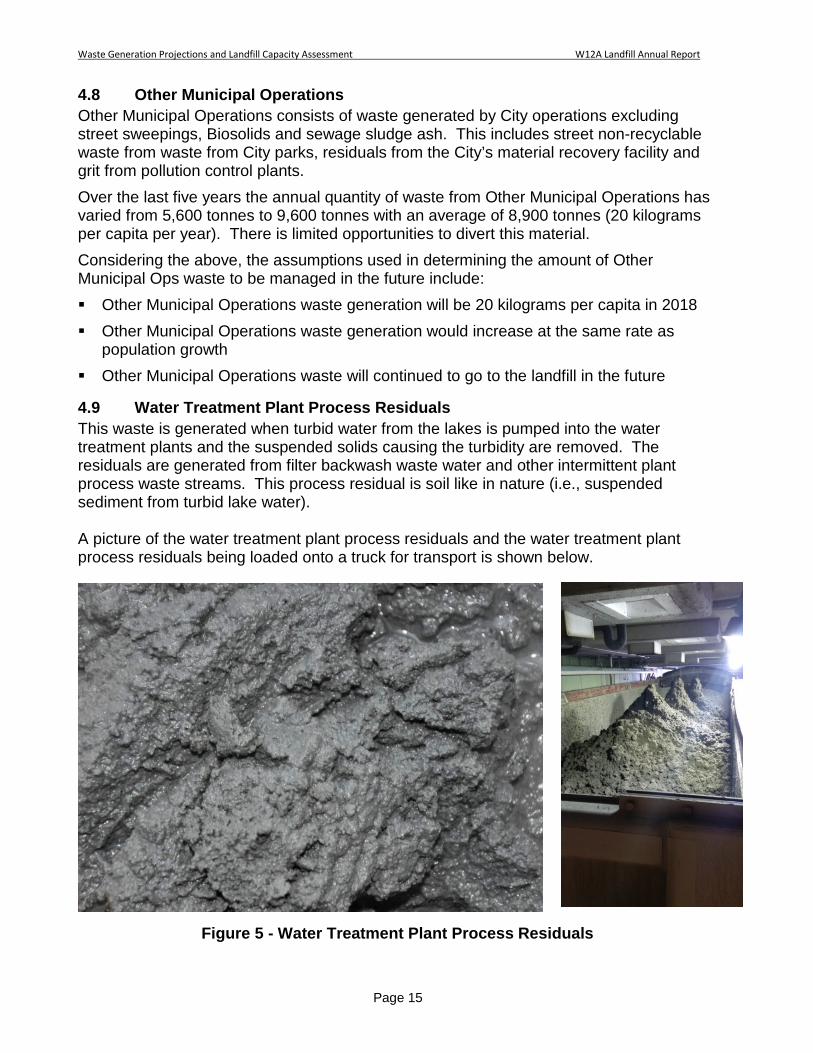
4.9 Water Treatment Plant Process Residuals This waste is generated when turbid water from the lakes is pumped into the water treatment plants and the suspended solids causing the turbidity are removed. The residuals are generated from filter backwash waste water and other intermittent plant process waste streams. This process residual is soil like in nature (i.e., suspended sediment from turbid lake water). A picture of the water treatment plant process residuals and the water treatment plant process residuals being loaded onto a truck for transport is shown below.
Figure 5 - Water Treatment Plant Process Residuals

Waste Generation Projections and Landfill Capacity Assessment W12A Landfill Annual Report
Page 16
The City applied to the MOECC to amend the ECA for the W12A Landfill to accept water treatment plant process residuals from the Lake Huron and Elgin Area water treatment plants. The City made this application because: • The process residuals from the Lake Huron plant are currently being sent to a closed
landfill in the Municipality of South Huron and being used as fill. It is expected that this option will no longer be available in the near future.
• The process residuals from the Elgin Area plant are currently being discharged back into Lake Erie however a residuals management facility is under construction and once completed will capture the residuals.
• The majority of process residuals are generated as a result of providing drinking water to London.
The City’s application to the MOECC has been approved. It was estimated for the purposes of the application that the W12A Landfill will receive approximately 20,000 tonnes per year of process residuals. The City will also look at the potential for the process residuals to be used as cover material and thereby not consume any landfill space. The City is considering this because the material has few to no odours and chemical testing of the material shows that it generally meets soil quality standards for agricultural land use. The high moisture content and fine uniform nature of the sediment may make it difficult to spread over the waste and limit its effectiveness as cover material. It may be also be more difficult to use in the winter because of freezing. Considering the above, the assumptions used in determining the amount of water treatment plant process residuals to be managed in the future include: The W12A Landfill began
accepting water treatment plant process residuals in 2017 and will continue in 2018.
Water treatment plant process residuals generation will be 10,000 tonnes (0.03 tonnes per capita per year) in 2018.
Water treatment plant process residuals will increase at the same rate as population growth.
50% of the material will be used as cover material and 50% of the material will be buried as waste.
Rules for Using Contaminated Soil as Cover Material
• No offensive odours • Can be spread in 150 mm layers • Chemical testing demonstrates it meets soil
quality standards for industrial land use (does not have to meet residential or agricultural land use standards)

Waste Generation Projections and Landfill Capacity Assessment W12A Landfill Annual Report
Page 17
4.10 Contaminated Soil The W12A Landfill is licensed to accept contaminated soil. Depending on the level of contamination the soil is either buried as waste or used as cover material. The quantity of material being received at the W12A Landfill has changed over time. Beginning 2002 the landfill started to receive more contaminated soil when it lowered the tipping fee for this material. Prior to this most contaminated soil was exported to other landfills in Southern Ontario or Michigan. More recently the amount of contaminated soil being accepted at the W12A Landfill has dropped with the opening of a nearby contaminated soil processing facility by GFL in Dorchester in 2013. On average the landfill received approximately 8,000 tonnes per year over the last three years but received 10,400 tonnes per year in the seven years prior to that. It is believed prior to the opening of the GFL facility the W12A Landfill received the majority of contaminated soil generated in the City but an unknown amount continued to be exported to nearby landfills. Considering the above, the assumptions used in determining the amount of contaminated soil to be managed in the future include: The contaminated soil generation rate will be 0.02 tonnes per capita per year (7,500
tonnes) in 2018. If there is no change in the tipping fee structure, the majority of this contaminated soil
will be exported for disposal/treatment. Conversely, a lower tipping fee may result in more contaminated soil being received.
If there is no change in the tipping fee, the W12A Landfill will receive 7,500 tonnes of contaminated soil (0.02 tonnes per capita) in 2017.

Waste Generation Projections and Landfill Capacity Assessment W12A Landfill Annual Report
Page 18
5.0 Waste Disposal Projections Waste disposal projections for the City of London for the next 34 years were developed for three different scenarios. These waste quantity projections represent the likely range of waste quantities that can be expected taking into account: • Population growth • Provincial waste diversion target of 60% for residential, IC&I and CR&D waste • Possible changes to the management of IC&I and CR&D waste because changes to
the tipping fee structures at the W12A Landfill and alternative disposal locations The three scenarios were: Scenario A – No Change In this scenario it is assumed there are no changes to the quantities or types of waste or have they are managed except for approval to expand the W12A Landfill’s service area. It is assumed that the waste services areas approved for W12A Landfill will remain the same at the beginning in 2018. This includes water treatment plant process residuals from the Lake Huron and Erie Area water treatment plants and CR&D recycling residuals from TRY Recycling’s Clarke Road facility. Scenario B – Decrease in Residential Waste Quantities
• Diversion of residential waste will increase from 45% to 60% by 2022 Scenario C – Decrease in Residential, IC&I and CR&D Waste Quantities
• Diversion of residential waste will increase from 45% to 60% by 2022 • No change in disposal rate from City operations • IC&I disposal rate decreases (10% at W12A) • No CR&D waste; 50% of the CR&D recycling process residues goes to the W12A • No CR&D process residue at W12A after 2022
Scenario D – Increase in IC&I quantities and Status Quo for the Residential Waste
• Residential Diversion rate of 45% • No change in waste from City operations • IC&I disposal rate increases (limited export, 60% landfilled at the W12A coupled
with 40% diversion of IC&I waste) • No unprocessed CR&D waste • 100% of the CR&D recycling process residuals goes to the W12A

Waste Generation Projections and Landfill Capacity Assessment W12A Landfill Annual Report
Page 19
The amount of waste for each scenario is presented in Appendix C and summarized in Table 5 and Figure 7 (next page). Table 5 - W12A Waste Disposal Projection
Year Running Total (m3) Scenario A Scenario B Scenario C Scenario D
2018 262,200 262,200 192,300 313,100 2020 937,400 873,500 669,900 1,353,700 2025 2,153,200 1,922,600 1,401,100 3,109,600 2030 3,424,300 3,021,200 2,163,700 4,945,900 2035 4,746,500 4,163,300 2,954,800 6,856,100 2040 6,122,400 5,352,000 3,777,000 8,843,900 2045 7,552,300 6,587,300 4,630,200 10,910,500 2050 9,039,200 7,871,100 5,515,500 13,060,100

Waste Generation Projections and Landfill Capacity Assessment W12A Landfill Annual Report
Page 1
Figure 6 – Waste Disposal Projections Running Total (2018 to 2050)
Waste Generation Projections and Landfill Capacity Assessment W12A Landfill Annual Report
Page 1
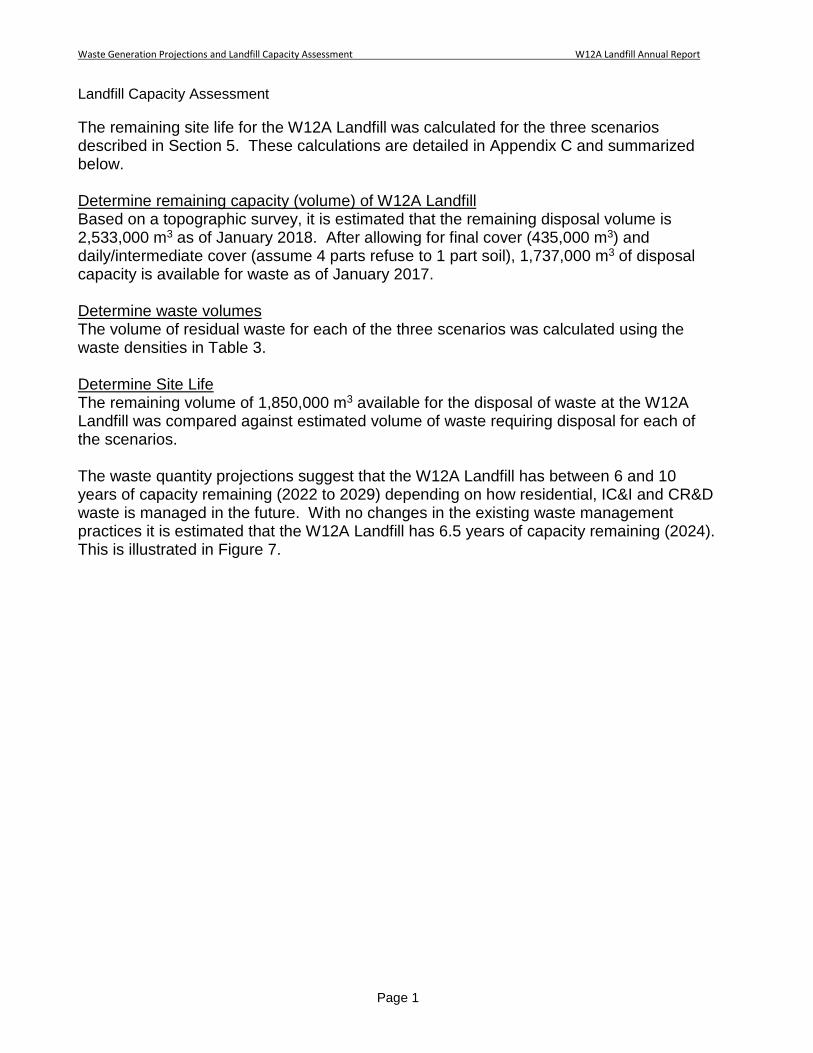
Landfill Capacity Assessment
The remaining site life for the W12A Landfill was calculated for the three scenarios described in Section 5. These calculations are detailed in Appendix C and summarized below. Determine remaining capacity (volume) of W12A Landfill Based on a topographic survey, it is estimated that the remaining disposal volume is 2,533,000 m3 as of January 2018. After allowing for final cover (435,000 m3) and daily/intermediate cover (assume 4 parts refuse to 1 part soil), 1,737,000 m3 of disposal capacity is available for waste as of January 2017. Determine waste volumes The volume of residual waste for each of the three scenarios was calculated using the waste densities in Table 3. Determine Site Life The remaining volume of 1,850,000 m3 available for the disposal of waste at the W12A Landfill was compared against estimated volume of waste requiring disposal for each of the scenarios. The waste quantity projections suggest that the W12A Landfill has between 6 and 10 years of capacity remaining (2022 to 2029) depending on how residential, IC&I and CR&D waste is managed in the future. With no changes in the existing waste management practices it is estimated that the W12A Landfill has 6.5 years of capacity remaining (2024). This is illustrated in Figure 7.
Waste Generation Projections and Landfill Capacity Assessment W12A Landfill Annual Report
Page 2

Waste Generation Projections and Landfill Capacity Assessment W12A Landfill Annual Report
Page 3
Figure 7 – W12A Landfill Remaining Site Life

Page I
Appendix A Population Projections
Table A-1 Seasonal Student Population
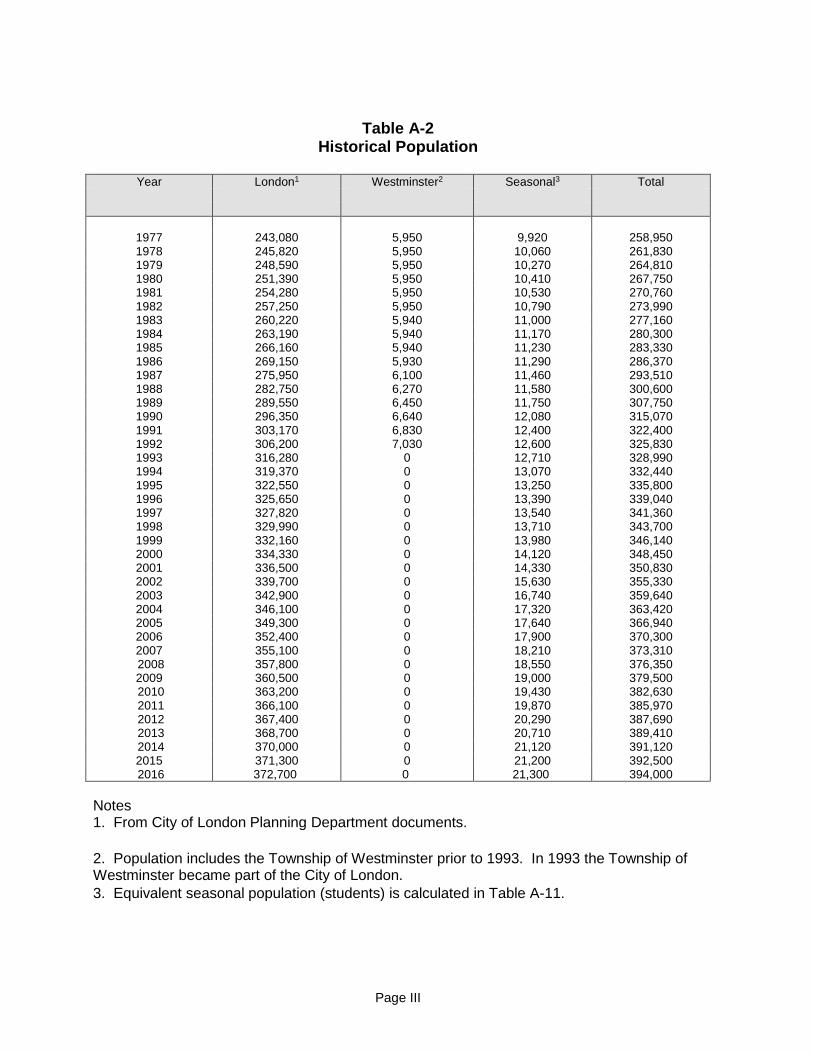
Table A-2 Historical Population
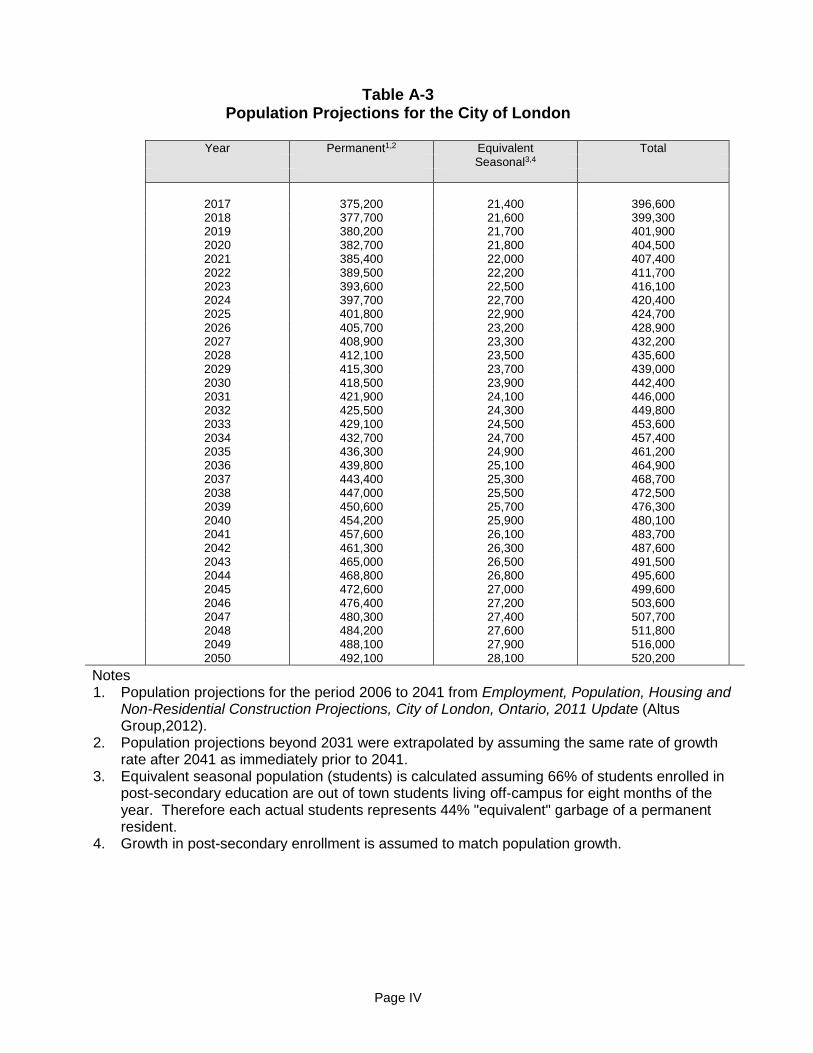
Table A-3 Population Projections for the City of London

Page II
Table A-1 Seasonal Student Population
Year Enrollment1 Equivalent Population Total
Equivalent UWO Fanshawe UWO Fanshawe Population2
1977 18,000 5,400 8,320 1,600 9,920 1978 18,250 5,500 8,430 1,630 10,060 1979 18,500 5,800 8,550 1,720 10,270 1980 18,750 5,900 8,660 1,750 10,410 1981 19,000 5,900 8,780 1,750 10,530 1982 19,250 6,400 8,890 1,900 10,790 1983 19,500 6,700 9,010 1,990 11,000 1984 19,750 6,900 9,120 2,050 11,170 1985 20,000 6,700 9,240 1,990 11,230 1986 20,250 6,500 9,360 1,930 11,290 1987 20,500 6,700 9,470 1,990 11,460 1988 20,750 6,700 9,590 1,990 11,580 1989 21,000 6,900 9,700 2,050 11,750 1990 21,250 7,600 9,820 2,260 12,080 1991 21,500 8,300 9,930 2,470 12,400 1992 21,750 8,600 10,050 2,550 12,600 1993 22,000 8,600 10,160 2,550 12,710 1994 22,250 9,400 10,280 2,790 13,070 1995 22,500 9,600 10,400 2,850 13,250 1996 22,750 9,700 10,510 2,880 13,390 1997 23,000 9,800 10,630 2,910 13,540 1998 23,250 10,000 10,740 2,970 13,710 1999 23,500 10,500 10,860 3,120 13,980 2000 23,750 10,600 10,970 3,150 14,120 2001 24,000 10,900 11,090 3,240 14,330 2002 26,000 12,200 12,010 3,620 15,630 2003 28,000 12,800 12,940 3,800 16,740 2004 29,000 13,200 13,400 3,920 17,320 2005 29,300 13,800 13,540 4,100 17,640 2006 29,600 14,200 13,680 4,220 17,900 2007 29,900 14,800 13,810 4,400 18,210 2008 30,200 15,500 13,950 4,600 18,550 2009 30,900 15,880 14,280 4,720 19,000 2010 31,600 16,260 14,600 4,830 19,430 2011 32,300 16,650 14,920 4,950 19,870 2012 33,000 16,970 15,250 5,040 20,290 2013 33,700 17,290 15,570 5,140 20,710 2014 34,400 17,610 15,890 5,230 21,120 2015 35,100 17,930 16,220 5,330 21,550 2016 35,800 18,250 16,540 5,420 21,960
Notes 1. Enrollment from UWO and Fanshawe registry up to 2008. Assumed to grow at same
rate of population growth after 2008. 2. The equivalent population was calculated using the following assumptions: a) 70% of
UWO students are from out of town and live off campus; b) 45% of Fanshawe students are from out of town and lived off campus and d) they lived in London for 8 months or 66% of the year. Estimates of percentage of students living off campus are based on information provided by the UWO Housing Office and are considered to increase at approximately the same rate each year.
Page III
Table A-2 Historical Population
Year London1 Westminster2 Seasonal3 Total
1977 243,080 5,950 9,920 258,950 1978 245,820 5,950 10,060 261,830 1979 248,590 5,950 10,270 264,810 1980 251,390 5,950 10,410 267,750 1981 254,280 5,950 10,530 270,760 1982 257,250 5,950 10,790 273,990 1983 260,220 5,940 11,000 277,160 1984 263,190 5,940 11,170 280,300 1985 266,160 5,940 11,230 283,330 1986 269,150 5,930 11,290 286,370 1987 275,950 6,100 11,460 293,510 1988 282,750 6,270 11,580 300,600 1989 289,550 6,450 11,750 307,750 1990 296,350 6,640 12,080 315,070 1991 303,170 6,830 12,400 322,400 1992 306,200 7,030 12,600 325,830 1993 316,280 0 12,710 328,990 1994 319,370 0 13,070 332,440 1995 322,550 0 13,250 335,800 1996 325,650 0 13,390 339,040 1997 327,820 0 13,540 341,360 1998 329,990 0 13,710 343,700 1999 332,160 0 13,980 346,140 2000 334,330 0 14,120 348,450 2001 336,500 0 14,330 350,830 2002 339,700 0 15,630 355,330 2003 342,900 0 16,740 359,640 2004 346,100 0 17,320 363,420 2005 349,300 0 17,640 366,940 2006 352,400 0 17,900 370,300 2007 355,100 0 18,210 373,310 2008 357,800 0 18,550 376,350 2009 360,500 0 19,000 379,500 2010 363,200 0 19,430 382,630 2011 366,100 0 19,870 385,970 2012 367,400 0 20,290 387,690 2013 368,700 0 20,710 389,410 2014 370,000 0 21,120 391,120 2015 371,300 0 21,200 392,500 2016 372,700 0 21,300 394,000
Notes 1. From City of London Planning Department documents.
2. Population includes the Township of Westminster prior to 1993. In 1993 the Township of Westminster became part of the City of London. 3. Equivalent seasonal population (students) is calculated in Table A-11.
Page IV
Table A-3 Population Projections for the City of London
Year Permanent1,2 Equivalent Total Seasonal3,4 2017 375,200 21,400 396,600 2018 377,700 21,600 399,300 2019 380,200 21,700 401,900 2020 382,700 21,800 404,500 2021 385,400 22,000 407,400 2022 389,500 22,200 411,700 2023 393,600 22,500 416,100 2024 397,700 22,700 420,400 2025 401,800 22,900 424,700 2026 405,700 23,200 428,900 2027 408,900 23,300 432,200 2028 412,100 23,500 435,600 2029 415,300 23,700 439,000 2030 418,500 23,900 442,400 2031 421,900 24,100 446,000 2032 425,500 24,300 449,800 2033 429,100 24,500 453,600 2034 432,700 24,700 457,400 2035 436,300 24,900 461,200 2036 439,800 25,100 464,900 2037 443,400 25,300 468,700 2038 447,000 25,500 472,500 2039 450,600 25,700 476,300 2040 454,200 25,900 480,100 2041 457,600 26,100 483,700 2042 461,300 26,300 487,600 2043 465,000 26,500 491,500 2044 468,800 26,800 495,600 2045 472,600 27,000 499,600 2046 476,400 27,200 503,600 2047 480,300 27,400 507,700 2048 484,200 27,600 511,800 2049 488,100 27,900 516,000 2050 492,100 28,100 520,200 Notes 1. Population projections for the period 2006 to 2041 from Employment, Population, Housing and
Non-Residential Construction Projections, City of London, Ontario, 2011 Update (Altus Group,2012).
2. Population projections beyond 2031 were extrapolated by assuming the same rate of growth rate after 2041 as immediately prior to 2041.
3. Equivalent seasonal population (students) is calculated assuming 66% of students enrolled in post-secondary education are out of town students living off-campus for eight months of the year. Therefore each actual students represents 44% "equivalent" garbage of a permanent resident.
4. Growth in post-secondary enrollment is assumed to match population growth.

Page V
Appendix B Historical Data on Waste Generation,
Disposal and Diversion Rates
Table B-1 City of London Historical Residential Waste Diversion Quantities
Table B-2 City of London Historical Residential Waste Quantities Disposed of at Private Facilities
Table B-3 City of London Historical Sewage Sludge Ash Quantities Disposed of at St. Mary’s Cement
Table B-4 City of London Waste Quantities Disposed of at W12A Landfill
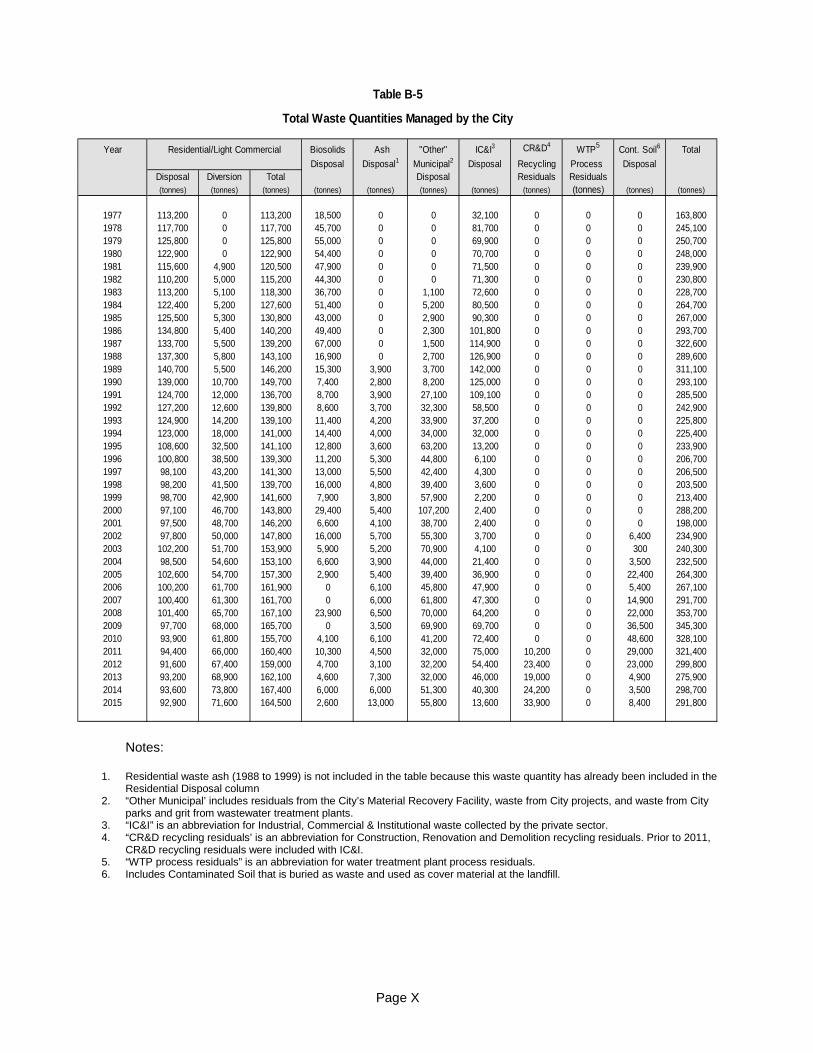
Table B-5 Total Waste Quantities Managed by the City
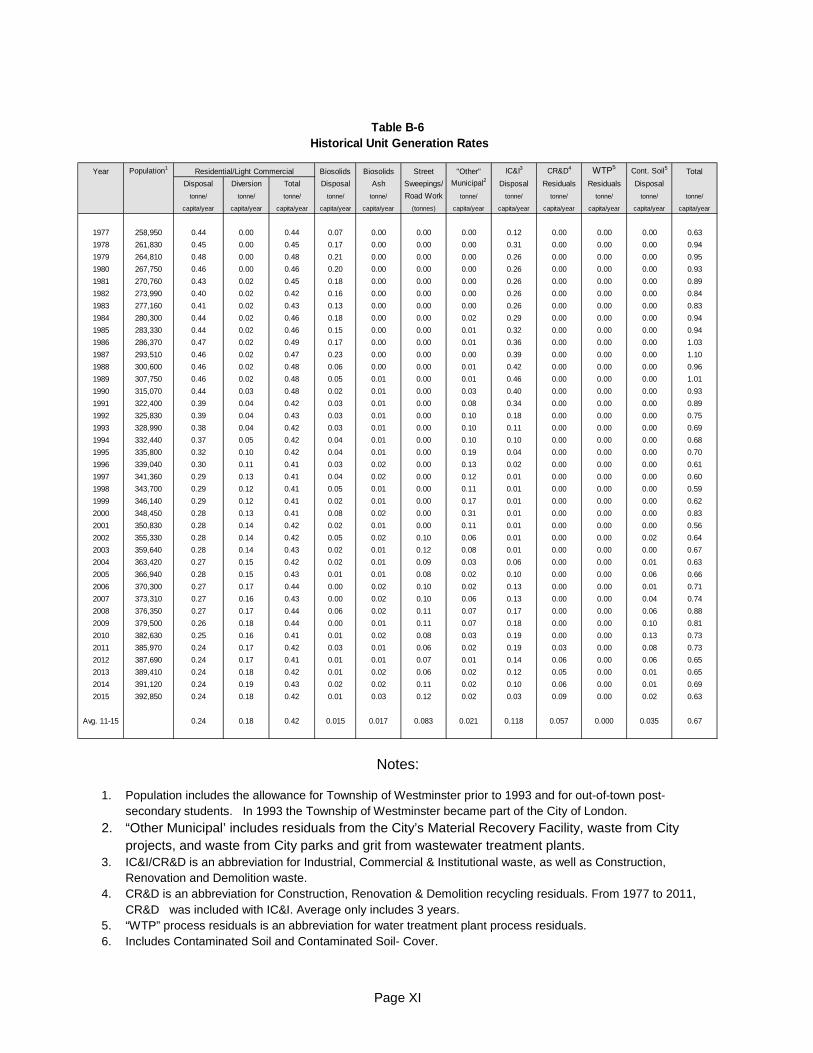
Table B-6 Historical Unit Generation Rates
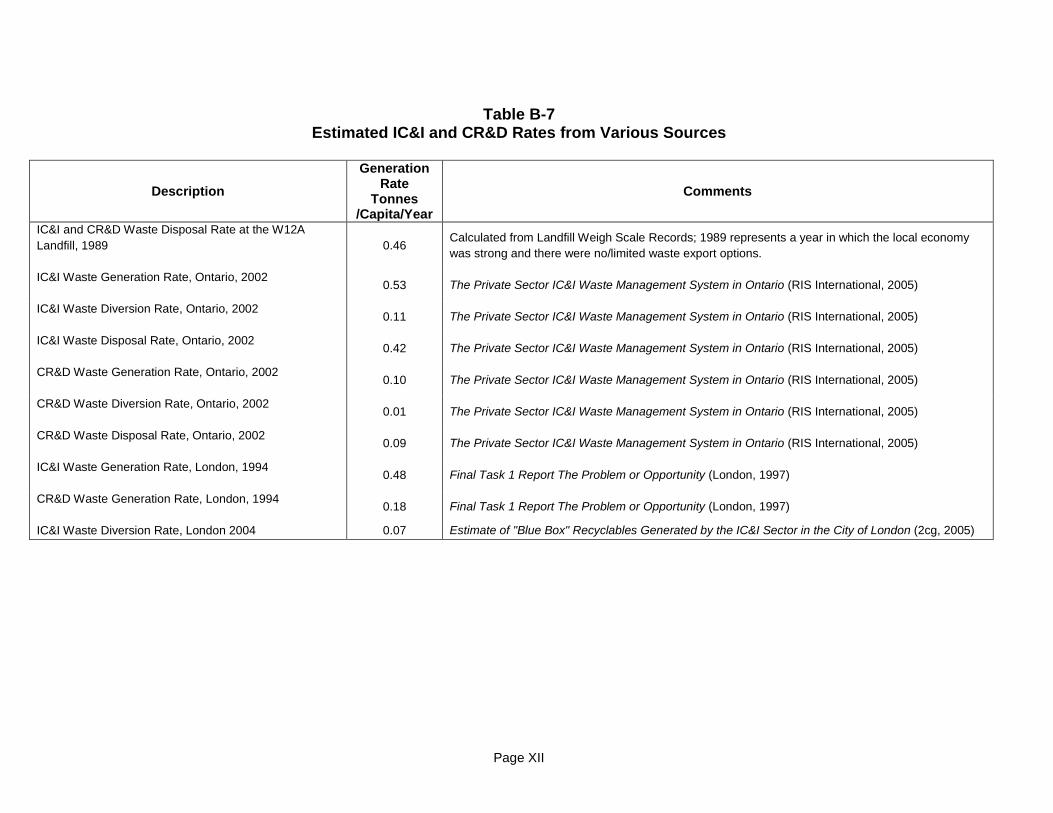
Table B-7 Estimated IC&I and CR&D Rates from Various Sources

Page VI
Notes and Assumptions:1. Weighed quantities.2. City EnviroDepots (Clarke Road & Oxford Street) and Municipal Household Special Waste depot at the W12A Landfill.3. Estimate based on number of units sold through City program. From 1993 to 1999, it is assumed that 80% of the units are being used and these units divert 135 kg per unit. Beginning in 2000 it is assumed each composter diverts 100 kg/year (GAP guidelines).4. Estimate assumes curbside grass ban introduced in 1995 reduces grass generation by 50%. Beginning in 2013, grass diverted by ban estimated using WDO "GAP" guidelines.5. Includes year materials, fall leaves, fall pumpkins and pay per bag grass clippings 6. Estimate based on the actual number of trees to fill a truck x # of trucks filled x 8 kg per tree.7. Estimate based on generation rate of 12 kg per hhld per year. Curbside collection ban of white goods/large metal items in effect as of 1995. Starting 2010, amount diverted by Ban reduced by quantities collected at Depots. Staring 2014 as per WDO "Gap" guidelines.8. Estimate based on one tire/capita/year and 110 tires per tonne. It was assumed the recovery rate was 75% from 1995 to 1996 and 60% after 1997 (local tire recycler closed in 1997). Beginning in 2012, as WDO Datacall "GAP guidelines (7.1 kilograms diverted/capita).9. Estimate based on 80% of weighted materials to City depots (assume 20% process residuals) plus 50% of available material not taken to City depots. Generation rate of scrap metal is estimated to be 2.4 kg/capita/yr. Generation rate of wood/C&D waste is estimated to be 15 kg/capita/yr.10. Estimates from up to 1999 based on 1.5 kg/litre collected, 3 kg/compressed cylinder collected at the HSW Depot. Estimates from 2000 to 2010 use various conversion factors (GAP guidelines). Estimates from 2011 onwards from Stewardship Ontario DataCall for MHSW.11. Brewers Retail deposit return reported effective 2001 as per WDO "GAP" process.

Page VII
Table B-2 City of London
Historical Residential Waste Quantities Disposed of at Private Facilities
Year EFW1 Transfer Landfill3,4 Total Station2 (tonnes) (tonnes) (tonnes) (tonnes)
1977 0 0 0 0 1978 0 0 0 0 1979 0 0 0 0 1980 0 0 0 0 1981 0 0 0 0 1982 0 0 0 0 1983 0 0 0 0 1984 0 0 0 0 1985 0 0 0 0 1986 0 0 0 0 1987 10,534 0 0 10,534 1988 61,670 0 0 61,670 1989 59,250 0 0 59,250 1990 65,197 0 0 65,197 1991 27,573 0 0 27,573 1992 29,508 0 0 29,508 1993 31,473 0 0 31,473 1994 36,717 0 0 36,717 1995 38,554 0 0 38,554 1996 49,702 0 0 49,702 1997 49,002 0 0 49,002 1998 54,162 0 0 54,162 1999 47,229 1,895 0 49,124 2000 0 5,777 0 5,777 2001 0 0 4,626 4,626 2002 0 0 0 0 2003 0 0 0 0 2004 0 0 0 0 2005 0 0 0 0 2006 0 0 0 0 2007 0 0 0 0 2008 0 0 0 0 2009 0 0 0 0 2010 0 0 0 0 2011 0 0 0 0 2012 0 0 0 0 2013 0 0 0 0 2014 0 0 0 0 2015 0 0 1,608 1,608 Total 560,570 7,672 6,234 574,476
Notes and Assumptions:
1. EFW refers to the London Health Sciences Centre Energy for Waste facility. This facility closed in October 1999. 2. From 1999 to 2001, following closure of the EFW, waste collected at night was taken to the Waste Management
Transfer Station on Exeter Road and shipped to private landfills for disposal. Night garbage collection was discontinued in 2001.
3. A work stoppage by City of London outside workers in July/August 2001 resulted in the City collecting 3,726 tonnes of garbage at numerous drop-off locations. This waste was taken to several different disposal facilities. In addition, some multi-residential building owners contracted garbage collection to private firms during the work stoppage (estimated to be 900 tonnes).
4. A work stoppage by City of London inside workers in May-June 2015 resulted in London shipping some waste to the Thames Centre Landfill and the Waste Management Twin Creeks Landfill for disposal.

Page VIII
Table B-3 City of London
Historical Sewage Sludge Ash Quantities Disposed of at St. Mary’s Cement
Year St. Mary’s Cement
(tonnes) 1977 0 1978 0 1979 0 1980 0 1981 0 1982 0 1983 0 1984 0 1985 0 1986 0 1987 0 1988 0 1989 0 1990 0 1991 0 1992 0 1993 0 1994 0 1995 0 1996 0 1997 0 1998 0 1999 0 2000 0 2001 0 2002 0 2003 0 2004 0 2005 0 2006 0 2007 0 2008 3,527 2009 3,521 2010 0 2011 4,474 2012 3,105 2013 5,378 2014 1,874 2015 0
Total 21,879

Page IX
Notes:
1. "Residential" waste includes curbside, bulk bin and depot garbage collected by the City from residential and light commercial sources.
2. "IC&I" is an abbreviation for Industrial, Commercial & Institutional waste collected by the private sector. 3. "CR&D recycling residuals" is an abbreviation for Construction and Demolition recycling residuals. Prior
to 2011, CR&D recycling residuals were included with IC&I. 4. "Ash" includes sewage sludge ash (since 1998) and residential waste ash (1988 to 1999). 5. “Other Municipal’ includes residuals from the City’s Material Recovery Facility, waste from City projects,
and waste from City parks and grit from wastewater treatment plants. 6. "WTP process residuals" is an abbreviation for water treatment plant process residuals.
Table B-4 City of London
Waste Quantities Disposed of at W12A Landfill Year Residential1 IC&I2 CR&D3 Ash4 Biosolids Street "Other" WTP6 Contaminated Soil Total Recycling Sweepings/ Municipal5 Process Waste Cover Waste Residuals Road Work Residuals Landfilled (tonnes) (tonnes) (tonnes) (tonnes) (tonnes) (tonnes) (tonnes) (tonnes) (tonnes) (tonnes) (tonnes)
1977 20,123 32,093 0 0 3,806 0 0 0 0 0 56,022 1978 58,722 81,687 0 0 26,516 0 0 0 0 0 166,925 1979 71,955 69,874 0 0 30,861 0 0 0 0 0 172,690 1980 89,995 70,721 0 0 52,083 0 0 0 0 0 212,799 1981 100,810 71,451 0 0 47,888 0 0 0 0 0 220,150 1982 110,249 71,267 0 0 44,273 0 0 0 0 0 225,788 1983 113,247 72,616 0 0 36,745 0 1,096 0 0 0 223,705 1984 122,438 80,522 0 0 51,445 0 5,247 0 0 0 259,653 1985 125,460 90,263 0 0 43,000 0 2,935 0 0 0 261,657 1986 134,801 101,816 0 0 49,386 0 2,275 0 0 0 288,278 1987 123,205 114,928 0 0 67,046 0 1,465 0 0 0 306,644 1988 75,674 126,943 0 33,349 16,886 0 2,711 0 0 0 255,564 1989 81,410 141,954 0 33,752 15,272 0 3,677 0 0 0 276,065 1990 73,790 125,027 0 30,142 7,366 0 8,161 0 0 0 244,485 1991 97,133 109,099 0 14,180 8,745 0 27,110 0 0 0 256,266 1992 97,708 58,516 0 15,386 8,643 0 32,318 0 0 0 212,571 1993 93,397 37,191 0 14,404 11,389 0 33,923 0 0 0 190,303 1994 86,300 32,007 0 15,875 14,359 0 34,015 0 0 0 182,556 1995 70,041 13,154 0 16,422 12,840 0 63,243 0 0 0 175,700 1996 51,096 6,118 0 22,194 11,190 0 44,756 0 0 0 135,354 1997 49,063 4,294 0 21,677 12,973 0 42,404 0 0 0 130,410 1998 44,034 3,588 0 21,548 16,042 0 39,367 0 0 0 124,579 1999 49,622 2,192 0 19,373 7,861 0 57,925 0 0 0 136,973 2000 91,306 2,355 0 5,394 29,402 0 107,177 0 0 0 235,635 2001 92,856 2,436 0 4,093 6,620 0 38,716 0 0 0 144,721 2002 97,771 3,732 0 5,746 15,993 35,529 19,736 0 5,556 851 184,914 2003 102,194 4,120 0 5,176 5,861 42,491 28,374 0 263 0 188,479 2004 98,477 21,378 0 3,867 6,601 34,073 9,912 0 468 3,019 177,795 2005 102,559 36,947 0 5,351 2,913 30,674 8,727 0 10,054 12,355 209,580 2006 100,206 47,921 0 6,069 6 37,034 8,808 0 5,423 23 205,490 2007 100,404 47,346 0 6,001 0 37,769 23,984 0 9,925 5,004 230,433 2008 101,437 64,178 0 2,956 23,851 43,040 26,941 0 4,689 17,300 284,392 2009 97,720 69,742 0 0 0 43,000 26,907 0 17,626 18,883 273,878 2010 93,898 72,436 0 6,067 4,121 29,697 11,551 0 6,185 42,410 266,365 2011 94,435 75,008 10,236 0 10,317 22,371 9,595 0 15,800 13,187 250,949 2012 91,638 54,445 23,403 0 4,747 26,554 5,623 0 18,528 4,511 229,449 2013 93,172 45,954 18,991 1,904 4,633 23,062 8,946 0 3,590 1,269 201,521 2014 93,569 40,314 24,155 4,163 5,994 42,748 8,511 0 2,473 1,073 223,000 2015 91,339 13,614 33,936 12,953 2,577 47,181 8,594 0 4,757 3,656 218,606 2016 93,151 24,245 35,332 4,166 14,268 51,512 7,762 0 6,954 21,137 258,528 2017 94,438 56,992 44,317 6,551 3,639 49,273 10,600 0 5,756 5,851 277,417 Total 3,670,842 2,200,484 190,370 338,757 738,159 596,009 773,093 0 118,047 150,529 8,776,290
Percent 42% 25% 2% 4% 8% 7% 9% 0% 1% 2%
Page X
Notes:
1. Residential waste ash (1988 to 1999) is not included in the table because this waste quantity has already been included in the Residential Disposal column
2. “Other Municipal’ includes residuals from the City’s Material Recovery Facility, waste from City projects, and waste from City parks and grit from wastewater treatment plants.
3. “IC&I” is an abbreviation for Industrial, Commercial & Institutional waste collected by the private sector. 4. “CR&D recycling residuals’ is an abbreviation for Construction, Renovation and Demolition recycling residuals. Prior to 2011,
CR&D recycling residuals were included with IC&I. 5. “WTP process residuals” is an abbreviation for water treatment plant process residuals. 6. Includes Contaminated Soil that is buried as waste and used as cover material at the landfill.
Residential/Light Commercial Biosolids Ash "Other" IC&I3 CR&D4 WTP5 Cont. Soil6 TotalDisposal Disposal1 Municipal2 Disposal Recycling Process Disposal
Disposal Diversion Total Disposal Residuals Residuals (tonnes) (tonnes) (tonnes) (tonnes) (tonnes) (tonnes) (tonnes) (tonnes) (tonnes) (tonnes) (tonnes)
113,200 0 113,200 18,500 0 0 32,100 0 0 0 163,800117,700 0 117,700 45,700 0 0 81,700 0 0 0 245,100125,800 0 125,800 55,000 0 0 69,900 0 0 0 250,700122,900 0 122,900 54,400 0 0 70,700 0 0 0 248,000115,600 4,900 120,500 47,900 0 0 71,500 0 0 0 239,900110,200 5,000 115,200 44,300 0 0 71,300 0 0 0 230,800113,200 5,100 118,300 36,700 0 1,100 72,600 0 0 0 228,700122,400 5,200 127,600 51,400 0 5,200 80,500 0 0 0 264,700125,500 5,300 130,800 43,000 0 2,900 90,300 0 0 0 267,000134,800 5,400 140,200 49,400 0 2,300 101,800 0 0 0 293,700133,700 5,500 139,200 67,000 0 1,500 114,900 0 0 0 322,600137,300 5,800 143,100 16,900 0 2,700 126,900 0 0 0 289,600140,700 5,500 146,200 15,300 3,900 3,700 142,000 0 0 0 311,100139,000 10,700 149,700 7,400 2,800 8,200 125,000 0 0 0 293,100124,700 12,000 136,700 8,700 3,900 27,100 109,100 0 0 0 285,500127,200 12,600 139,800 8,600 3,700 32,300 58,500 0 0 0 242,900124,900 14,200 139,100 11,400 4,200 33,900 37,200 0 0 0 225,800123,000 18,000 141,000 14,400 4,000 34,000 32,000 0 0 0 225,400108,600 32,500 141,100 12,800 3,600 63,200 13,200 0 0 0 233,900100,800 38,500 139,300 11,200 5,300 44,800 6,100 0 0 0 206,70098,100 43,200 141,300 13,000 5,500 42,400 4,300 0 0 0 206,50098,200 41,500 139,700 16,000 4,800 39,400 3,600 0 0 0 203,50098,700 42,900 141,600 7,900 3,800 57,900 2,200 0 0 0 213,40097,100 46,700 143,800 29,400 5,400 107,200 2,400 0 0 0 288,20097,500 48,700 146,200 6,600 4,100 38,700 2,400 0 0 0 198,00097,800 50,000 147,800 16,000 5,700 55,300 3,700 0 0 6,400 234,900
102,200 51,700 153,900 5,900 5,200 70,900 4,100 0 0 300 240,30098,500 54,600 153,100 6,600 3,900 44,000 21,400 0 0 3,500 232,500
102,600 54,700 157,300 2,900 5,400 39,400 36,900 0 0 22,400 264,300100,200 61,700 161,900 0 6,100 45,800 47,900 0 0 5,400 267,100100,400 61,300 161,700 0 6,000 61,800 47,300 0 0 14,900 291,700101,400 65,700 167,100 23,900 6,500 70,000 64,200 0 0 22,000 353,70097,700 68,000 165,700 0 3,500 69,900 69,700 0 0 36,500 345,30093,900 61,800 155,700 4,100 6,100 41,200 72,400 0 0 48,600 328,10094,400 66,000 160,400 10,300 4,500 32,000 75,000 10,200 0 29,000 321,40091,600 67,400 159,000 4,700 3,100 32,200 54,400 23,400 0 23,000 299,80093,200 68,900 162,100 4,600 7,300 32,000 46,000 19,000 0 4,900 275,90093,600 73,800 167,400 6,000 6,000 51,300 40,300 24,200 0 3,500 298,70092,900 71,600 164,500 2,600 13,000 55,800 13,600 33,900 0 8,400 291,800
1980
1993
20052006
1996199719981999200020012002
1994
198819891990
20102009
1995
2008
198119821983
1992
1987
1991
198419851986
20032004
2007
Table B-5
Total Waste Quantities Managed by the City
1979
Year
19771978
2011
2015201420132012
Page XI
Notes:
1. Population includes the allowance for Township of Westminster prior to 1993 and for out-of-town post-secondary students. In 1993 the Township of Westminster became part of the City of London.
2. “Other Municipal’ includes residuals from the City’s Material Recovery Facility, waste from City projects, and waste from City parks and grit from wastewater treatment plants.
3. IC&I/CR&D is an abbreviation for Industrial, Commercial & Institutional waste, as well as Construction, Renovation and Demolition waste.
4. CR&D is an abbreviation for Construction, Renovation & Demolition recycling residuals. From 1977 to 2011, CR&D was included with IC&I. Average only includes 3 years.
5. “WTP” process residuals is an abbreviation for water treatment plant process residuals. 6. Includes Contaminated Soil and Contaminated Soil- Cover.
Population1 Residential/Light Commercial Biosolids Biosolids Street "Other" IC&I3 CR&D4 WTP5 Cont. Soil5 TotalDisposal Diversion Total Disposal Ash Sweepings/ Municipal2 Disposal Residuals Residuals Disposal
tonne/ tonne/ tonne/ tonne/ tonne/ Road Work tonne/ tonne/ tonne/ tonne/ tonne/ tonne/
capita/year capita/year capita/year capita/year capita/year (tonnes) capita/year capita/year capita/year capita/year capita/year capita/year
258,950 0.44 0.00 0.44 0.07 0.00 0.00 0.00 0.12 0.00 0.00 0.00 0.63261,830 0.45 0.00 0.45 0.17 0.00 0.00 0.00 0.31 0.00 0.00 0.00 0.94264,810 0.48 0.00 0.48 0.21 0.00 0.00 0.00 0.26 0.00 0.00 0.00 0.95267,750 0.46 0.00 0.46 0.20 0.00 0.00 0.00 0.26 0.00 0.00 0.00 0.93270,760 0.43 0.02 0.45 0.18 0.00 0.00 0.00 0.26 0.00 0.00 0.00 0.89273,990 0.40 0.02 0.42 0.16 0.00 0.00 0.00 0.26 0.00 0.00 0.00 0.84277,160 0.41 0.02 0.43 0.13 0.00 0.00 0.00 0.26 0.00 0.00 0.00 0.83280,300 0.44 0.02 0.46 0.18 0.00 0.00 0.02 0.29 0.00 0.00 0.00 0.94283,330 0.44 0.02 0.46 0.15 0.00 0.00 0.01 0.32 0.00 0.00 0.00 0.94286,370 0.47 0.02 0.49 0.17 0.00 0.00 0.01 0.36 0.00 0.00 0.00 1.03293,510 0.46 0.02 0.47 0.23 0.00 0.00 0.00 0.39 0.00 0.00 0.00 1.10300,600 0.46 0.02 0.48 0.06 0.00 0.00 0.01 0.42 0.00 0.00 0.00 0.96307,750 0.46 0.02 0.48 0.05 0.01 0.00 0.01 0.46 0.00 0.00 0.00 1.01315,070 0.44 0.03 0.48 0.02 0.01 0.00 0.03 0.40 0.00 0.00 0.00 0.93322,400 0.39 0.04 0.42 0.03 0.01 0.00 0.08 0.34 0.00 0.00 0.00 0.89325,830 0.39 0.04 0.43 0.03 0.01 0.00 0.10 0.18 0.00 0.00 0.00 0.75328,990 0.38 0.04 0.42 0.03 0.01 0.00 0.10 0.11 0.00 0.00 0.00 0.69332,440 0.37 0.05 0.42 0.04 0.01 0.00 0.10 0.10 0.00 0.00 0.00 0.68335,800 0.32 0.10 0.42 0.04 0.01 0.00 0.19 0.04 0.00 0.00 0.00 0.70339,040 0.30 0.11 0.41 0.03 0.02 0.00 0.13 0.02 0.00 0.00 0.00 0.61341,360 0.29 0.13 0.41 0.04 0.02 0.00 0.12 0.01 0.00 0.00 0.00 0.60343,700 0.29 0.12 0.41 0.05 0.01 0.00 0.11 0.01 0.00 0.00 0.00 0.59346,140 0.29 0.12 0.41 0.02 0.01 0.00 0.17 0.01 0.00 0.00 0.00 0.62348,450 0.28 0.13 0.41 0.08 0.02 0.00 0.31 0.01 0.00 0.00 0.00 0.83350,830 0.28 0.14 0.42 0.02 0.01 0.00 0.11 0.01 0.00 0.00 0.00 0.56355,330 0.28 0.14 0.42 0.05 0.02 0.10 0.06 0.01 0.00 0.00 0.02 0.64359,640 0.28 0.14 0.43 0.02 0.01 0.12 0.08 0.01 0.00 0.00 0.00 0.67363,420 0.27 0.15 0.42 0.02 0.01 0.09 0.03 0.06 0.00 0.00 0.01 0.63366,940 0.28 0.15 0.43 0.01 0.01 0.08 0.02 0.10 0.00 0.00 0.06 0.66370,300 0.27 0.17 0.44 0.00 0.02 0.10 0.02 0.13 0.00 0.00 0.01 0.71373,310 0.27 0.16 0.43 0.00 0.02 0.10 0.06 0.13 0.00 0.00 0.04 0.74376,350 0.27 0.17 0.44 0.06 0.02 0.11 0.07 0.17 0.00 0.00 0.06 0.88379,500 0.26 0.18 0.44 0.00 0.01 0.11 0.07 0.18 0.00 0.00 0.10 0.81382,630 0.25 0.16 0.41 0.01 0.02 0.08 0.03 0.19 0.00 0.00 0.13 0.73385,970 0.24 0.17 0.42 0.03 0.01 0.06 0.02 0.19 0.03 0.00 0.08 0.73387,690 0.24 0.17 0.41 0.01 0.01 0.07 0.01 0.14 0.06 0.00 0.06 0.65389,410 0.24 0.18 0.42 0.01 0.02 0.06 0.02 0.12 0.05 0.00 0.01 0.65391,120 0.24 0.19 0.43 0.02 0.02 0.11 0.02 0.10 0.06 0.00 0.01 0.69392,850 0.24 0.18 0.42 0.01 0.03 0.12 0.02 0.03 0.09 0.00 0.02 0.63
0.24 0.18 0.42 0.015 0.017 0.083 0.021 0.118 0.057 0.000 0.035 0.67
1997
20102009
2000
2004
200120022003
Avg. 11-15
2005
2013
2015
1982
2012
Table B-6 Historical Unit Generation Rates
2008
1983
2011
19851986
2007
1999
1987198819891990
19771978197919801981
Year
2006
2014
1994
1984
1996
1998
1995
199319921991
Page XII
Table B-7 Estimated IC&I and CR&D Rates from Various Sources
Description Generation
Rate Tonnes
/Capita/Year Comments
IC&I and CR&D Waste Disposal Rate at the W12A Landfill, 1989
0.46 Calculated from Landfill Weigh Scale Records; 1989 represents a year in which the local economy was strong and there were no/limited waste export options.
IC&I Waste Generation Rate, Ontario, 2002 0.53 The Private Sector IC&I Waste Management System in Ontario (RIS International, 2005)
IC&I Waste Diversion Rate, Ontario, 2002 0.11 The Private Sector IC&I Waste Management System in Ontario (RIS International, 2005)
IC&I Waste Disposal Rate, Ontario, 2002 0.42 The Private Sector IC&I Waste Management System in Ontario (RIS International, 2005)
CR&D Waste Generation Rate, Ontario, 2002 0.10 The Private Sector IC&I Waste Management System in Ontario (RIS International, 2005)
CR&D Waste Diversion Rate, Ontario, 2002 0.01 The Private Sector IC&I Waste Management System in Ontario (RIS International, 2005)
CR&D Waste Disposal Rate, Ontario, 2002 0.09 The Private Sector IC&I Waste Management System in Ontario (RIS International, 2005)
IC&I Waste Generation Rate, London, 1994 0.48 Final Task 1 Report The Problem or Opportunity (London, 1997)
CR&D Waste Generation Rate, London, 1994 0.18 Final Task 1 Report The Problem or Opportunity (London, 1997)
IC&I Waste Diversion Rate, London 2004 0.07 Estimate of "Blue Box" Recyclables Generated by the IC&I Sector in the City of London (2cg, 2005)

Page XIII
Appendix C Waste Generation Projections
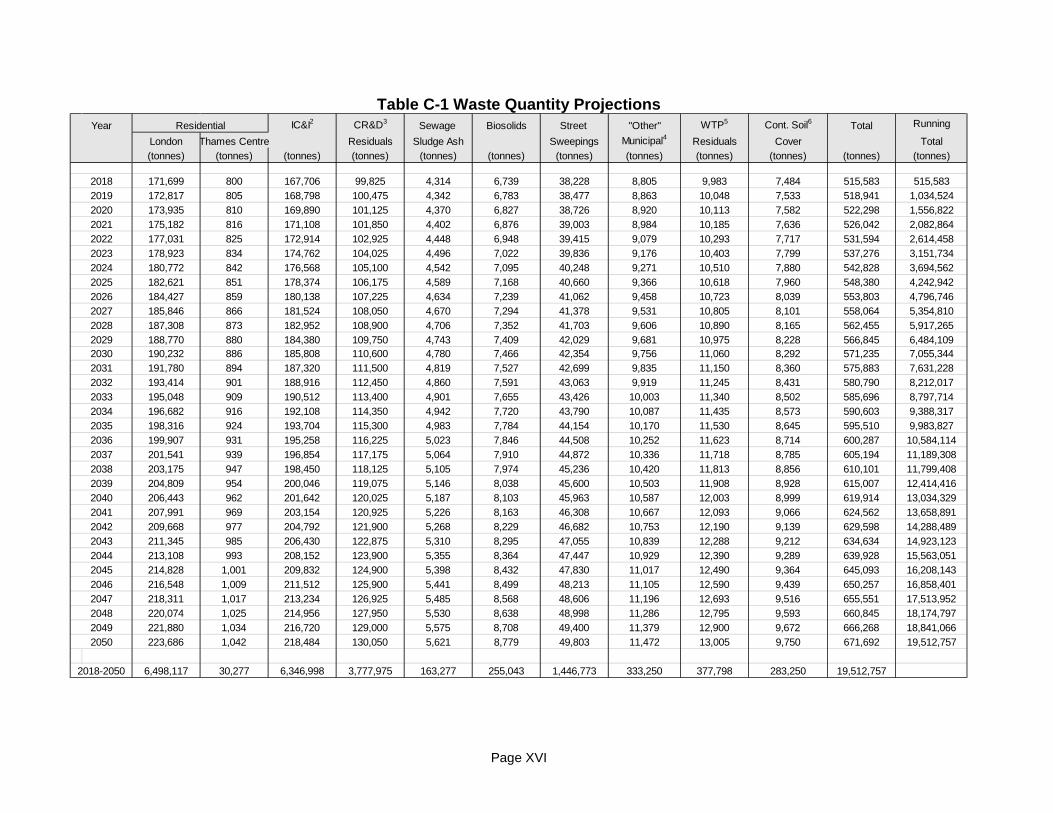
Table C-1 Waste Quantity Projections
Table C-2 Waste Diversion Projections: Scenario A (Status Quo)
Table C-3 Waste Diversion Projections: Scenario B (Decrease in Residential Waste)
Table C-4 Waste Diversion Projections: Scenario C (Decrease in Residential, IC&I and CR&D Waste) Table C-5 Waste Diversion Projections: Scenario D (Increase in IC&I and Status Quo for residential waste)
Table C-6 Waste Diversion Projections: Scenario E (Status Quo, except for Increase in service area)
Table C-7 Future Waste Disposal Requirements by Weight: Scenario A (Status Quo)
Table C-8 Future Waste Disposal Requirements by Weight: Scenario B (Decrease in Residential Waste)
Table C-9 Future Waste Disposal Requirements by Weight: Scenario C (Decrease in Residential, IC&I and CR&D Waste) Table C-10 Future Waste Disposal Requirements by Weight: Scenario D (Increase in IC&I and Status Quo for residential
waste) Table C-11 Future Waste Disposal Requirements by Weight: Scenario E (Status Quo, except for Increase in service area)
Table C- 12 Future Waste Disposal Requirements by Volume: Scenario A (Status Quo)
Table C-13 Future Waste Disposal Requirements by Volume: Scenario B (Decrease in Residential Waste)
Table C-14 Future Waste Disposal Requirements by Volume: Scenario C (Decrease in Residential, IC&I and CR&D Waste)
Table C-15 Future Waste Disposal Requirements by Volume: Scenario D (Increase in IC&I and Status Quo for residential waste)
Table C-16 Future Waste Disposal Requirements by Volume: Scenario E (Status Quo, except for Increase in service area)
Page XIV
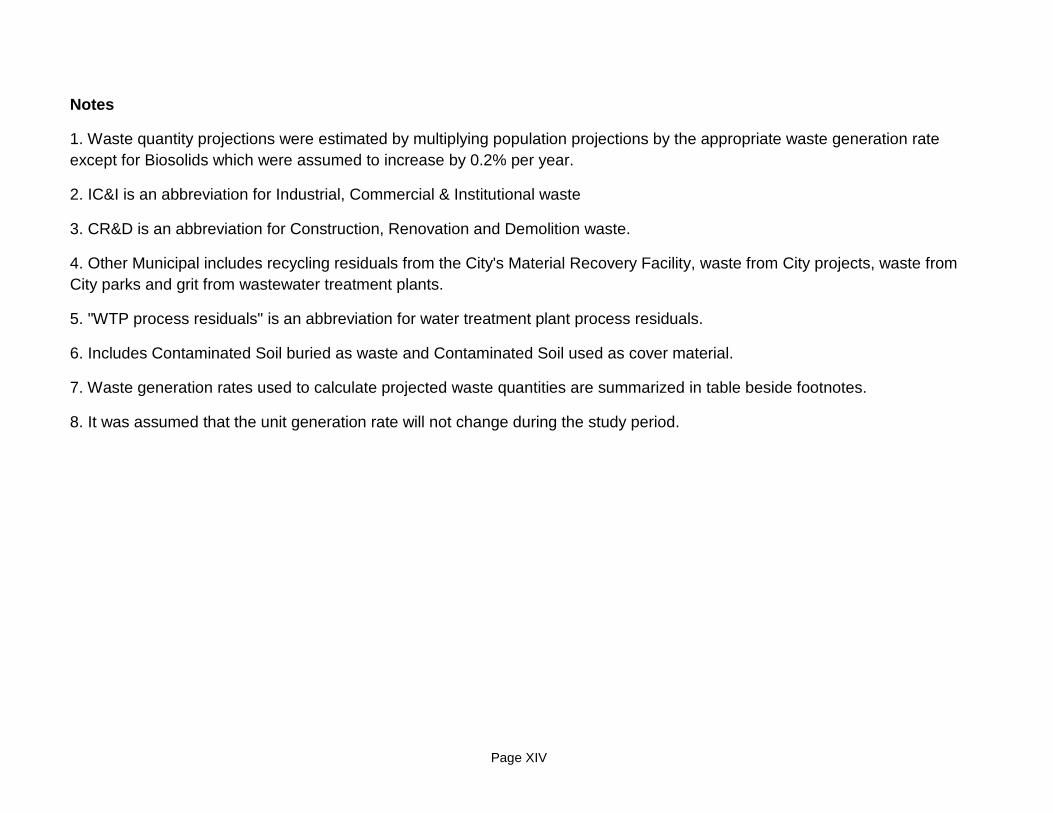
Notes
1. Waste quantity projections were estimated by multiplying population projections by the appropriate waste generation rate except for Biosolids which were assumed to increase by 0.2% per year.
2. IC&I is an abbreviation for Industrial, Commercial & Institutional waste
3. CR&D is an abbreviation for Construction, Renovation and Demolition waste.
4. Other Municipal includes recycling residuals from the City's Material Recovery Facility, waste from City projects, waste from City parks and grit from wastewater treatment plants.
5. "WTP process residuals" is an abbreviation for water treatment plant process residuals.
6. Includes Contaminated Soil buried as waste and Contaminated Soil used as cover material.
7. Waste generation rates used to calculate projected waste quantities are summarized in table beside footnotes.
8. It was assumed that the unit generation rate will not change during the study period.

Page XV
Waste Generation Rates
Waste Type Density6
Residential, IC&I, C&D Residual 800
Other Municipal 800 Biosolids, Ash 1,200
WTP residuals 1,800
Street sweep, Contaminated Soil 1,800
Waste Densities Category Rate 7,8Residential Waste Generation Rate 0.43 tonne/capita/year
IC&I Waste Generation Rate 0.42 tonne/capita/yearC,R&D3 0.25 tonne/capita/year
Ash4 0.0108 tonne/capita/yearBiosolids 0.017 tonne/capita/year
Street 0.096 tonne/capita/year"Other" 0.022 tonne/capita/yearWTP6 0.025 tonne/capita/year
Contaminated Soil - cover 0.0187 tonne/capita/year
Page XVI
Table C-1 Waste Quantity Projections
IC&I2 CR&D3 Sewage Biosolids Street "Other" WTP5 Cont. Soil6 Total Running
London Thames Centre Residuals Sludge Ash Sweepings Municipal4 Residuals Cover Total(tonnes) (tonnes) (tonnes) (tonnes) (tonnes) (tonnes) (tonnes) (tonnes) (tonnes) (tonnes) (tonnes) (tonnes)
171,699 800 167,706 99,825 4,314 6,739 38,228 8,805 9,983 7,484 515,583 515,583172,817 805 168,798 100,475 4,342 6,783 38,477 8,863 10,048 7,533 518,941 1,034,524173,935 810 169,890 101,125 4,370 6,827 38,726 8,920 10,113 7,582 522,298 1,556,822175,182 816 171,108 101,850 4,402 6,876 39,003 8,984 10,185 7,636 526,042 2,082,864177,031 825 172,914 102,925 4,448 6,948 39,415 9,079 10,293 7,717 531,594 2,614,458178,923 834 174,762 104,025 4,496 7,022 39,836 9,176 10,403 7,799 537,276 3,151,734180,772 842 176,568 105,100 4,542 7,095 40,248 9,271 10,510 7,880 542,828 3,694,562182,621 851 178,374 106,175 4,589 7,168 40,660 9,366 10,618 7,960 548,380 4,242,942184,427 859 180,138 107,225 4,634 7,239 41,062 9,458 10,723 8,039 553,803 4,796,746185,846 866 181,524 108,050 4,670 7,294 41,378 9,531 10,805 8,101 558,064 5,354,810187,308 873 182,952 108,900 4,706 7,352 41,703 9,606 10,890 8,165 562,455 5,917,265188,770 880 184,380 109,750 4,743 7,409 42,029 9,681 10,975 8,228 566,845 6,484,109190,232 886 185,808 110,600 4,780 7,466 42,354 9,756 11,060 8,292 571,235 7,055,344191,780 894 187,320 111,500 4,819 7,527 42,699 9,835 11,150 8,360 575,883 7,631,228193,414 901 188,916 112,450 4,860 7,591 43,063 9,919 11,245 8,431 580,790 8,212,017195,048 909 190,512 113,400 4,901 7,655 43,426 10,003 11,340 8,502 585,696 8,797,714196,682 916 192,108 114,350 4,942 7,720 43,790 10,087 11,435 8,573 590,603 9,388,317198,316 924 193,704 115,300 4,983 7,784 44,154 10,170 11,530 8,645 595,510 9,983,827199,907 931 195,258 116,225 5,023 7,846 44,508 10,252 11,623 8,714 600,287 10,584,114201,541 939 196,854 117,175 5,064 7,910 44,872 10,336 11,718 8,785 605,194 11,189,308203,175 947 198,450 118,125 5,105 7,974 45,236 10,420 11,813 8,856 610,101 11,799,408204,809 954 200,046 119,075 5,146 8,038 45,600 10,503 11,908 8,928 615,007 12,414,416206,443 962 201,642 120,025 5,187 8,103 45,963 10,587 12,003 8,999 619,914 13,034,329207,991 969 203,154 120,925 5,226 8,163 46,308 10,667 12,093 9,066 624,562 13,658,891209,668 977 204,792 121,900 5,268 8,229 46,682 10,753 12,190 9,139 629,598 14,288,489211,345 985 206,430 122,875 5,310 8,295 47,055 10,839 12,288 9,212 634,634 14,923,123213,108 993 208,152 123,900 5,355 8,364 47,447 10,929 12,390 9,289 639,928 15,563,051214,828 1,001 209,832 124,900 5,398 8,432 47,830 11,017 12,490 9,364 645,093 16,208,143216,548 1,009 211,512 125,900 5,441 8,499 48,213 11,105 12,590 9,439 650,257 16,858,401218,311 1,017 213,234 126,925 5,485 8,568 48,606 11,196 12,693 9,516 655,551 17,513,952220,074 1,025 214,956 127,950 5,530 8,638 48,998 11,286 12,795 9,593 660,845 18,174,797221,880 1,034 216,720 129,000 5,575 8,708 49,400 11,379 12,900 9,672 666,268 18,841,066223,686 1,042 218,484 130,050 5,621 8,779 49,803 11,472 13,005 9,750 671,692 19,512,757
6,498,117 30,277 6,346,998 3,777,975 163,277 255,043 1,446,773 333,250 377,798 283,250 19,512,757
Year Residential
2023
20182019202020212022
2035
20242025202620272028202920302031203220332034
2047
20362037203820392040204120422043204420452046
204820492050
2018-2050

Page XVII
Table C-2 Waste Diversion Projections: Scenario A (Status Quo)
Year Residential IC&I CR&D
Residuals Total Running Diverted Diverted Exported Exported Total (tonnes) (tonnes) (tonnes) (tonnes) (tonnes)
2018 76,621 122,317 0 72,142 271,080 271,080 2019 77,120 123,113 0 72,611 272,845 543,924 2020 77,619 123,910 0 73,081 274,610 818,534 2021 78,176 124,798 0 73,605 276,579 1,095,113 2022 79,001 126,115 0 74,382 279,498 1,374,611 2023 79,845 127,463 0 75,177 282,485 1,657,096 2024 80,670 128,780 0 75,954 285,404 1,942,500 2025 81,495 130,097 0 76,731 288,323 2,230,824 2026 82,301 131,384 0 77,489 291,175 2,521,998 2027 82,934 132,395 0 78,086 293,415 2,815,413 2028 83,587 133,436 0 78,700 295,723 3,111,137 2029 84,239 134,478 0 79,314 298,032 3,409,168 2030 84,892 135,519 0 79,929 300,340 3,709,508 2031 85,583 136,622 0 80,579 302,784 4,012,292 2032 86,312 137,786 0 81,266 305,363 4,317,655 2033 87,041 138,950 0 81,952 307,943 4,625,598 2034 87,770 140,114 0 82,639 310,523 4,936,122 2035 88,499 141,278 0 83,325 313,103 5,249,224 2036 89,209 142,412 0 83,994 315,615 5,564,839 2037 89,938 143,576 0 84,680 318,194 5,883,034 2038 90,668 144,740 0 85,367 320,774 6,203,808 2039 91,397 145,904 0 86,053 323,354 6,527,162 2040 92,126 147,068 0 86,740 325,934 6,853,096 2041 92,817 148,171 0 87,390 328,378 7,181,473 2042 93,565 149,365 0 88,095 331,025 7,512,499 2043 94,313 150,560 0 88,799 333,673 7,846,172 2044 95,100 151,816 0 89,540 336,457 8,182,628 2045 95,868 153,041 0 90,263 339,172 8,521,800 2046 96,635 154,267 0 90,986 341,888 8,863,688 2047 97,422 155,523 0 91,726 344,671 9,208,359 2048 98,209 156,779 0 92,467 347,455 9,555,814 2049 99,015 158,065 0 93,226 350,306 9,906,120 2050 99,821 159,352 0 93,985 353,157 10,259,277

Page XVIII
Table C-3 Waste Diversion Projections: Scenario B (Decrease in Residential Waste)
Year Residential IC&I CR&D
Residuals Total Running Diverted Exported Diverted Diverted Total (tonnes) (tonnes) (tonnes) (tonnes) (tonnes) (tonnes)
2018 76,621 0 122,317 72,142 271,080 271,080 2019 84,832 0 123,113 72,611 280,557 551,637 2020 93,919 0 123,910 73,081 290,910 842,546 2021 104,052 0 124,798 73,605 302,455 1,145,001 2022 106,219 0 126,115 74,382 306,716 1,451,717 2023 107,354 0 127,463 75,177 309,994 1,761,711 2024 108,463 0 128,780 75,954 313,197 2,074,908 2025 109,573 0 130,097 76,731 316,401 2,391,309 2026 110,656 0 131,384 77,489 319,530 2,710,839 2027 111,508 0 132,395 78,086 321,988 3,032,827 2028 112,385 0 133,436 78,700 324,521 3,357,348 2029 113,262 0 134,478 79,314 327,054 3,684,402 2030 114,139 0 135,519 79,929 329,587 4,013,989 2031 115,068 0 136,622 80,579 332,269 4,346,259 2032 116,048 0 137,786 81,266 335,100 4,681,359 2033 117,029 0 138,950 81,952 337,931 5,019,290 2034 118,009 0 140,114 82,639 340,762 5,360,052 2035 118,990 0 141,278 83,325 343,593 5,703,645 2036 119,944 0 142,412 83,994 346,350 6,049,995 2037 120,925 0 143,576 84,680 349,181 6,399,176 2038 121,905 0 144,740 85,367 352,012 6,751,187 2039 122,885 0 145,904 86,053 354,843 7,106,030 2040 123,866 0 147,068 86,740 357,674 7,463,704 2041 124,795 0 148,171 87,390 360,356 7,824,059 2042 125,801 0 149,365 88,095 363,261 8,187,321 2043 126,807 0 150,560 88,799 366,167 8,553,487 2044 127,865 0 151,816 89,540 369,221 8,922,708 2045 128,897 0 153,041 90,263 372,201 9,294,909 2046 129,929 0 154,267 90,986 375,181 9,670,091 2047 130,987 0 155,523 91,726 378,236 10,048,326 2048 132,044 0 156,779 92,467 381,290 10,429,616 2049 133,128 0 158,065 93,226 384,419 10,814,035 2050 134,212 0 159,352 93,985 387,548 11,201,583
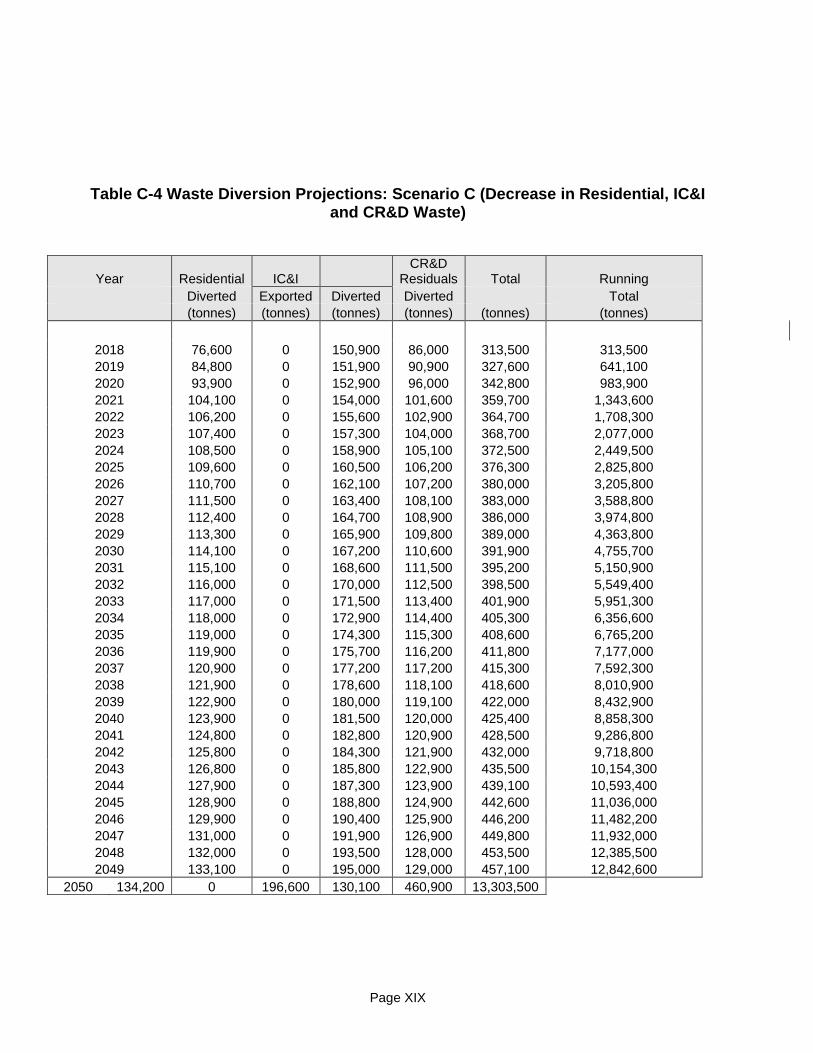
Page XIX
Table C-4 Waste Diversion Projections: Scenario C (Decrease in Residential, IC&I
and CR&D Waste)
Year Residential IC&I CR&D
Residuals Total Running Diverted Exported Diverted Diverted Total (tonnes) (tonnes) (tonnes) (tonnes) (tonnes) (tonnes)
2018 76,600 0 150,900 86,000 313,500 313,500 2019 84,800 0 151,900 90,900 327,600 641,100 2020 93,900 0 152,900 96,000 342,800 983,900 2021 104,100 0 154,000 101,600 359,700 1,343,600 2022 106,200 0 155,600 102,900 364,700 1,708,300 2023 107,400 0 157,300 104,000 368,700 2,077,000 2024 108,500 0 158,900 105,100 372,500 2,449,500 2025 109,600 0 160,500 106,200 376,300 2,825,800 2026 110,700 0 162,100 107,200 380,000 3,205,800 2027 111,500 0 163,400 108,100 383,000 3,588,800 2028 112,400 0 164,700 108,900 386,000 3,974,800 2029 113,300 0 165,900 109,800 389,000 4,363,800 2030 114,100 0 167,200 110,600 391,900 4,755,700 2031 115,100 0 168,600 111,500 395,200 5,150,900 2032 116,000 0 170,000 112,500 398,500 5,549,400 2033 117,000 0 171,500 113,400 401,900 5,951,300 2034 118,000 0 172,900 114,400 405,300 6,356,600 2035 119,000 0 174,300 115,300 408,600 6,765,200 2036 119,900 0 175,700 116,200 411,800 7,177,000 2037 120,900 0 177,200 117,200 415,300 7,592,300 2038 121,900 0 178,600 118,100 418,600 8,010,900 2039 122,900 0 180,000 119,100 422,000 8,432,900 2040 123,900 0 181,500 120,000 425,400 8,858,300 2041 124,800 0 182,800 120,900 428,500 9,286,800 2042 125,800 0 184,300 121,900 432,000 9,718,800 2043 126,800 0 185,800 122,900 435,500 10,154,300 2044 127,900 0 187,300 123,900 439,100 10,593,400 2045 128,900 0 188,800 124,900 442,600 11,036,000 2046 129,900 0 190,400 125,900 446,200 11,482,200 2047 131,000 0 191,900 126,900 449,800 11,932,000 2048 132,000 0 193,500 128,000 453,500 12,385,500 2049 133,100 0 195,000 129,000 457,100 12,842,600
2050 134,200 0 196,600 130,100 460,900 13,303,500
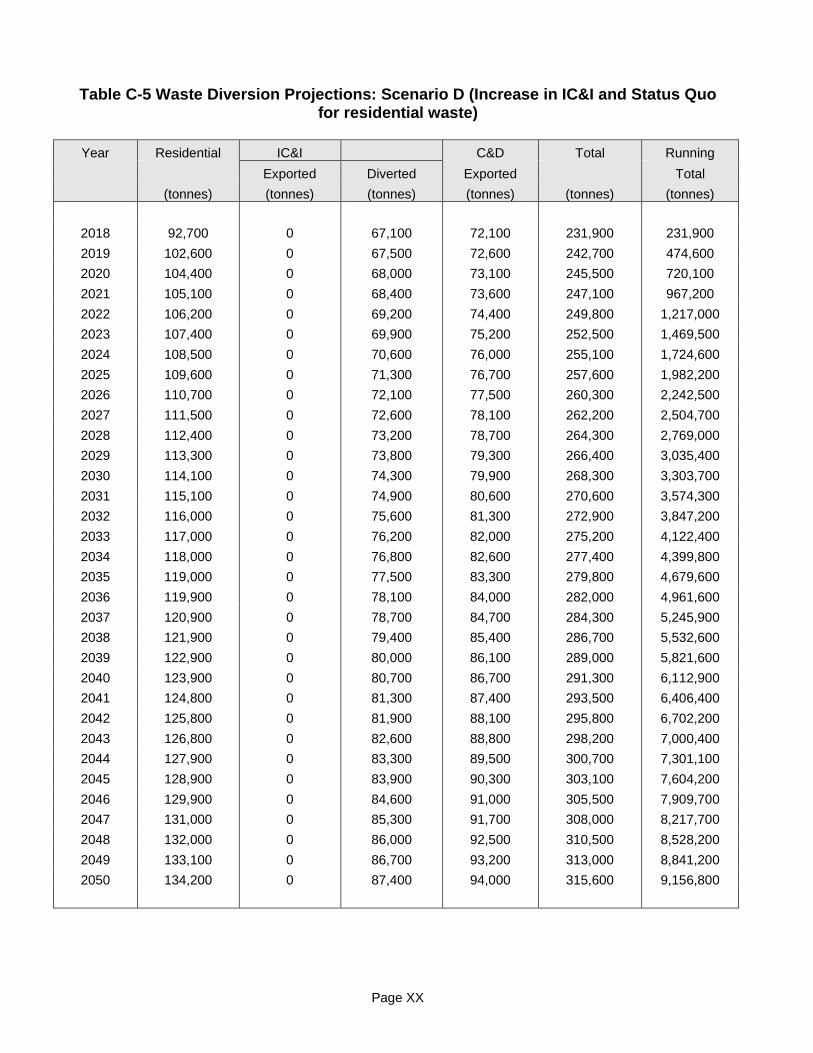
Page XX
Table C-5 Waste Diversion Projections: Scenario D (Increase in IC&I and Status Quo for residential waste)
Year Residential IC&I C&D Total Running
Exported Diverted Exported Total (tonnes) (tonnes) (tonnes) (tonnes) (tonnes) (tonnes)
2018 92,700 0 67,100 72,100 231,900 231,900 2019 102,600 0 67,500 72,600 242,700 474,600 2020 104,400 0 68,000 73,100 245,500 720,100 2021 105,100 0 68,400 73,600 247,100 967,200 2022 106,200 0 69,200 74,400 249,800 1,217,000 2023 107,400 0 69,900 75,200 252,500 1,469,500 2024 108,500 0 70,600 76,000 255,100 1,724,600 2025 109,600 0 71,300 76,700 257,600 1,982,200 2026 110,700 0 72,100 77,500 260,300 2,242,500 2027 111,500 0 72,600 78,100 262,200 2,504,700 2028 112,400 0 73,200 78,700 264,300 2,769,000 2029 113,300 0 73,800 79,300 266,400 3,035,400 2030 114,100 0 74,300 79,900 268,300 3,303,700 2031 115,100 0 74,900 80,600 270,600 3,574,300 2032 116,000 0 75,600 81,300 272,900 3,847,200 2033 117,000 0 76,200 82,000 275,200 4,122,400 2034 118,000 0 76,800 82,600 277,400 4,399,800 2035 119,000 0 77,500 83,300 279,800 4,679,600 2036 119,900 0 78,100 84,000 282,000 4,961,600 2037 120,900 0 78,700 84,700 284,300 5,245,900 2038 121,900 0 79,400 85,400 286,700 5,532,600 2039 122,900 0 80,000 86,100 289,000 5,821,600 2040 123,900 0 80,700 86,700 291,300 6,112,900 2041 124,800 0 81,300 87,400 293,500 6,406,400 2042 125,800 0 81,900 88,100 295,800 6,702,200 2043 126,800 0 82,600 88,800 298,200 7,000,400 2044 127,900 0 83,300 89,500 300,700 7,301,100 2045 128,900 0 83,900 90,300 303,100 7,604,200 2046 129,900 0 84,600 91,000 305,500 7,909,700 2047 131,000 0 85,300 91,700 308,000 8,217,700 2048 132,000 0 86,000 92,500 310,500 8,528,200 2049 133,100 0 86,700 93,200 313,000 8,841,200 2050 134,200 0 87,400 94,000 315,600 9,156,800

Page XXI
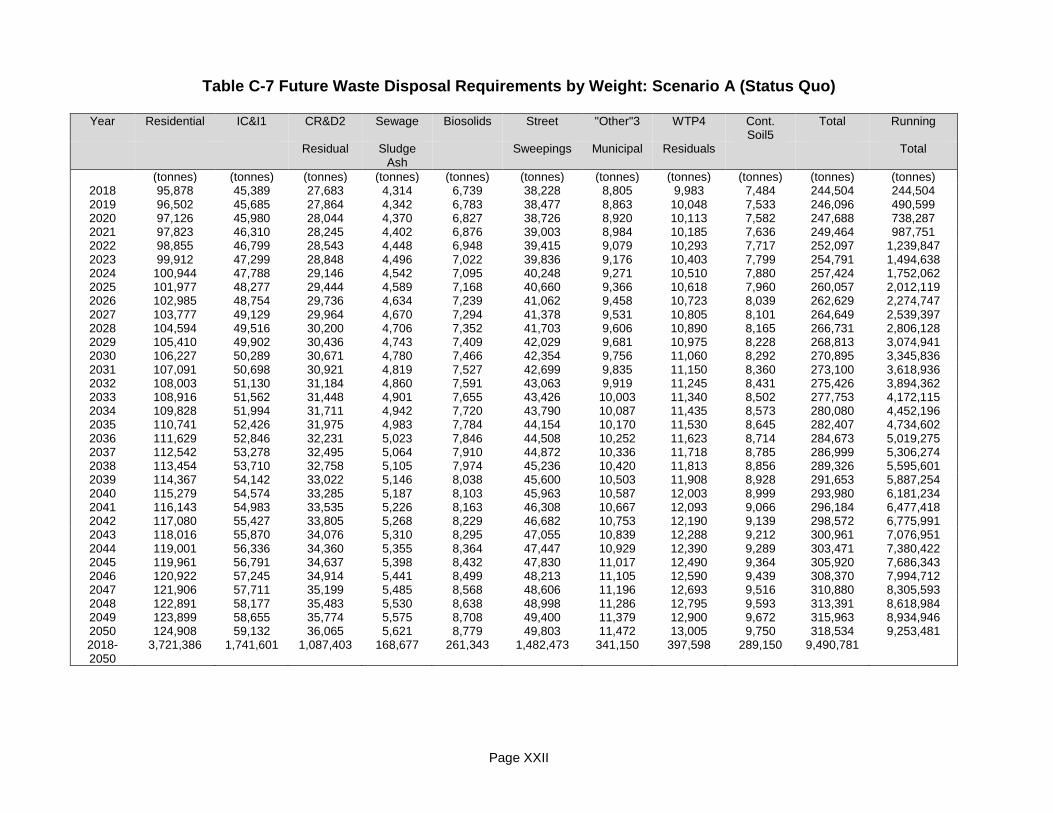
Page XXII
Table C-7 Future Waste Disposal Requirements by Weight: Scenario A (Status Quo)
Year Residential IC&I1 CR&D2 Sewage Biosolids Street "Other"3 WTP4 Cont. Soil5
Total Running
Residual Sludge Ash
Sweepings Municipal Residuals Total
(tonnes) (tonnes) (tonnes) (tonnes) (tonnes) (tonnes) (tonnes) (tonnes) (tonnes) (tonnes) (tonnes) 2018 95,878 45,389 27,683 4,314 6,739 38,228 8,805 9,983 7,484 244,504 244,504 2019 96,502 45,685 27,864 4,342 6,783 38,477 8,863 10,048 7,533 246,096 490,599 2020 97,126 45,980 28,044 4,370 6,827 38,726 8,920 10,113 7,582 247,688 738,287 2021 97,823 46,310 28,245 4,402 6,876 39,003 8,984 10,185 7,636 249,464 987,751 2022 98,855 46,799 28,543 4,448 6,948 39,415 9,079 10,293 7,717 252,097 1,239,847 2023 99,912 47,299 28,848 4,496 7,022 39,836 9,176 10,403 7,799 254,791 1,494,638 2024 100,944 47,788 29,146 4,542 7,095 40,248 9,271 10,510 7,880 257,424 1,752,062 2025 101,977 48,277 29,444 4,589 7,168 40,660 9,366 10,618 7,960 260,057 2,012,119 2026 102,985 48,754 29,736 4,634 7,239 41,062 9,458 10,723 8,039 262,629 2,274,747 2027 103,777 49,129 29,964 4,670 7,294 41,378 9,531 10,805 8,101 264,649 2,539,397 2028 104,594 49,516 30,200 4,706 7,352 41,703 9,606 10,890 8,165 266,731 2,806,128 2029 105,410 49,902 30,436 4,743 7,409 42,029 9,681 10,975 8,228 268,813 3,074,941 2030 106,227 50,289 30,671 4,780 7,466 42,354 9,756 11,060 8,292 270,895 3,345,836 2031 107,091 50,698 30,921 4,819 7,527 42,699 9,835 11,150 8,360 273,100 3,618,936 2032 108,003 51,130 31,184 4,860 7,591 43,063 9,919 11,245 8,431 275,426 3,894,362 2033 108,916 51,562 31,448 4,901 7,655 43,426 10,003 11,340 8,502 277,753 4,172,115 2034 109,828 51,994 31,711 4,942 7,720 43,790 10,087 11,435 8,573 280,080 4,452,196 2035 110,741 52,426 31,975 4,983 7,784 44,154 10,170 11,530 8,645 282,407 4,734,602 2036 111,629 52,846 32,231 5,023 7,846 44,508 10,252 11,623 8,714 284,673 5,019,275 2037 112,542 53,278 32,495 5,064 7,910 44,872 10,336 11,718 8,785 286,999 5,306,274 2038 113,454 53,710 32,758 5,105 7,974 45,236 10,420 11,813 8,856 289,326 5,595,601 2039 114,367 54,142 33,022 5,146 8,038 45,600 10,503 11,908 8,928 291,653 5,887,254 2040 115,279 54,574 33,285 5,187 8,103 45,963 10,587 12,003 8,999 293,980 6,181,234 2041 116,143 54,983 33,535 5,226 8,163 46,308 10,667 12,093 9,066 296,184 6,477,418 2042 117,080 55,427 33,805 5,268 8,229 46,682 10,753 12,190 9,139 298,572 6,775,991 2043 118,016 55,870 34,076 5,310 8,295 47,055 10,839 12,288 9,212 300,961 7,076,951 2044 119,001 56,336 34,360 5,355 8,364 47,447 10,929 12,390 9,289 303,471 7,380,422 2045 119,961 56,791 34,637 5,398 8,432 47,830 11,017 12,490 9,364 305,920 7,686,343 2046 120,922 57,245 34,914 5,441 8,499 48,213 11,105 12,590 9,439 308,370 7,994,712 2047 121,906 57,711 35,199 5,485 8,568 48,606 11,196 12,693 9,516 310,880 8,305,593 2048 122,891 58,177 35,483 5,530 8,638 48,998 11,286 12,795 9,593 313,391 8,618,984 2049 123,899 58,655 35,774 5,575 8,708 49,400 11,379 12,900 9,672 315,963 8,934,946 2050 124,908 59,132 36,065 5,621 8,779 49,803 11,472 13,005 9,750 318,534 9,253,481 2018-2050
3,721,386 1,741,601 1,087,403 168,677 261,343 1,482,473 341,150 397,598 289,150 9,490,781

Page XXIII
Table C-8 Future Waste Disposal Requirements by Weight: Scenario B (Decrease in Residential Waste)
Year Residential IC&I1 CR&D2 Sewage Biosolids Street "Other"3 WTP4 Cont. Soil5 Total Running
Residual Sludge
Ash Sweepings Municipal Residuals Total (tonnes) (tonnes) (tonnes) (tonnes) (tonnes) (tonnes) (tonnes) (tonnes) (tonnes) (tonnes) (tonnes)
2018 95,878 45,389 27,683 4,314 6,739 38,228 8,805 9,983 7,484 244,504 244,504 2019 88,790 45,685 27,864 5,400 6,783 38,477 8,863 10,048 7,533 239,441 483,945 2020 80,826 45,980 28,044 5,400 6,827 38,726 8,920 10,113 7,582 232,417 716,362 2021 71,947 46,310 28,245 5,400 6,876 39,003 8,984 10,185 7,636 224,586 940,948 2022 71,637 46,799 28,543 5,500 6,948 39,415 9,079 10,293 7,717 225,930 1,166,878 2023 72,403 47,299 28,848 5,500 7,022 39,836 9,176 10,403 7,799 228,286 1,395,165 2024 73,151 47,788 29,146 5,500 7,095 40,248 9,271 10,510 7,880 230,589 1,625,753 2025 73,899 48,277 29,444 5,500 7,168 40,660 9,366 10,618 7,960 232,891 1,858,644 2026 74,630 48,754 29,736 5,500 7,239 41,062 9,458 10,723 8,039 235,140 2,093,784 2027 75,204 49,129 29,964 5,500 7,294 41,378 9,531 10,805 8,101 236,906 2,330,690 2028 75,796 49,516 30,200 5,500 7,352 41,703 9,606 10,890 8,165 238,727 2,569,417 2029 76,388 49,902 30,436 5,500 7,409 42,029 9,681 10,975 8,228 240,547 2,809,964 2030 76,979 50,289 30,671 5,500 7,466 42,354 9,756 11,060 8,292 242,368 3,052,332 2031 77,606 50,698 30,921 5,600 7,527 42,699 9,835 11,150 8,360 244,395 3,296,727 2032 78,267 51,130 31,184 5,600 7,591 43,063 9,919 11,245 8,431 246,430 3,543,157 2033 78,928 51,562 31,448 5,600 7,655 43,426 10,003 11,340 8,502 248,464 3,791,621 2034 79,589 51,994 31,711 5,600 7,720 43,790 10,087 11,435 8,573 250,499 4,042,120 2035 80,250 52,426 31,975 5,600 7,784 44,154 10,170 11,530 8,645 252,533 4,294,654 2036 80,894 52,846 32,231 5,600 7,846 44,508 10,252 11,623 8,714 254,515 4,549,168 2037 81,555 53,278 32,495 5,600 7,910 44,872 10,336 11,718 8,785 256,549 4,805,717 2038 82,217 53,710 32,758 5,600 7,974 45,236 10,420 11,813 8,856 258,584 5,064,301 2039 82,878 54,142 33,022 5,600 8,038 45,600 10,503 11,908 8,928 260,618 5,324,919 2040 83,539 54,574 33,285 5,700 8,103 45,963 10,587 12,003 8,999 262,753 5,587,672 2041 84,165 54,983 33,535 5,700 8,163 46,308 10,667 12,093 9,066 264,680 5,852,352 2042 84,844 55,427 33,805 5,700 8,229 46,682 10,753 12,190 9,139 266,768 6,119,121 2043 85,523 55,870 34,076 5,700 8,295 47,055 10,839 12,288 9,212 268,857 6,387,977 2044 86,236 56,336 34,360 5,700 8,364 47,447 10,929 12,390 9,289 271,052 6,659,029 2045 86,932 56,791 34,637 5,700 8,432 47,830 11,017 12,490 9,364 273,193 6,932,223 2046 87,628 57,245 34,914 5,700 8,499 48,213 11,105 12,590 9,439 275,335 7,207,558 2047 88,342 57,711 35,199 5,700 8,568 48,606 11,196 12,693 9,516 277,530 7,485,088 2048 89,055 58,177 35,483 5,700 8,638 48,998 11,286 12,795 9,593 279,726 7,764,814 2049 89,786 58,655 35,774 5,800 8,708 49,400 11,379 12,900 9,672 282,074 8,046,888 2050 90,517 59,132 36,065 5,800 8,779 49,803 11,472 13,005 9,750 284,323 8,331,211 2018-2050 2,686,279 1,717,801 1,047,703 183,314 255,043 1,446,773 333,250 377,798 283,250 8,331,211
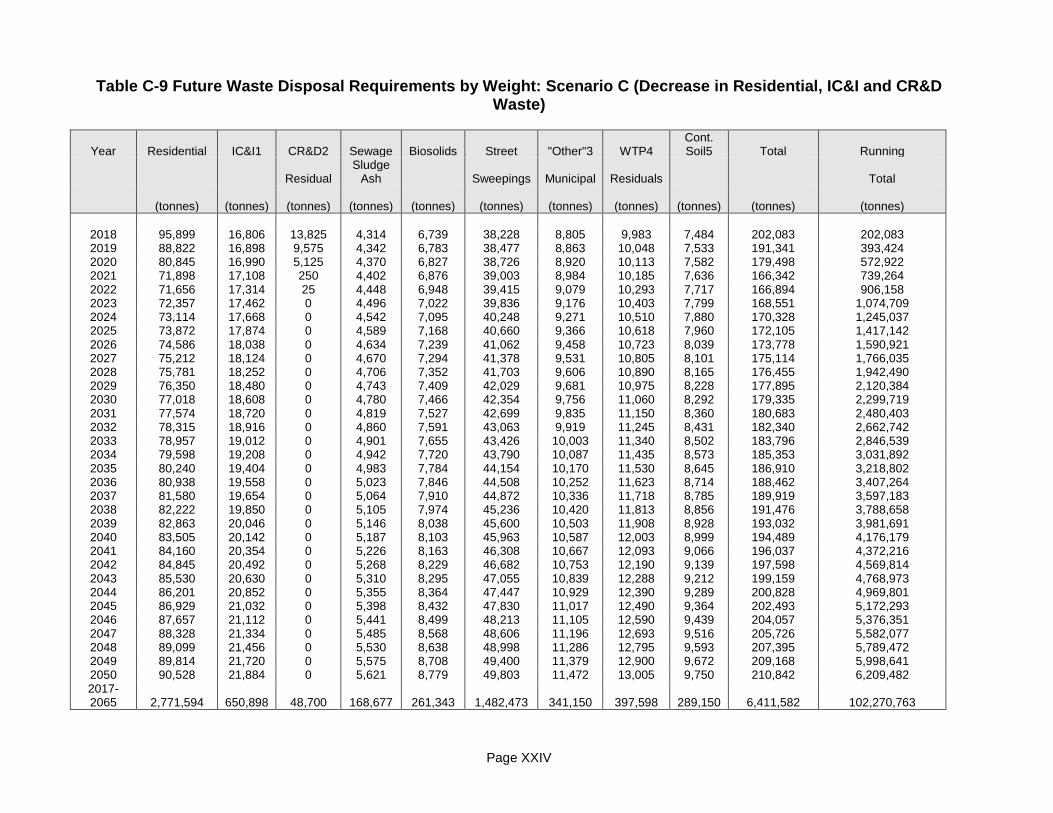
Page XXIV
Table C-9 Future Waste Disposal Requirements by Weight: Scenario C (Decrease in Residential, IC&I and CR&D Waste)
Year Residential IC&I1 CR&D2 Sewage Biosolids Street "Other"3 WTP4 Cont. Soil5 Total Running
Residual Sludge
Ash Sweepings Municipal Residuals Total (tonnes) (tonnes) (tonnes) (tonnes) (tonnes) (tonnes) (tonnes) (tonnes) (tonnes) (tonnes) (tonnes)
2018 95,899 16,806 13,825 4,314 6,739 38,228 8,805 9,983 7,484 202,083 202,083 2019 88,822 16,898 9,575 4,342 6,783 38,477 8,863 10,048 7,533 191,341 393,424 2020 80,845 16,990 5,125 4,370 6,827 38,726 8,920 10,113 7,582 179,498 572,922 2021 71,898 17,108 250 4,402 6,876 39,003 8,984 10,185 7,636 166,342 739,264 2022 71,656 17,314 25 4,448 6,948 39,415 9,079 10,293 7,717 166,894 906,158 2023 72,357 17,462 0 4,496 7,022 39,836 9,176 10,403 7,799 168,551 1,074,709 2024 73,114 17,668 0 4,542 7,095 40,248 9,271 10,510 7,880 170,328 1,245,037 2025 73,872 17,874 0 4,589 7,168 40,660 9,366 10,618 7,960 172,105 1,417,142 2026 74,586 18,038 0 4,634 7,239 41,062 9,458 10,723 8,039 173,778 1,590,921 2027 75,212 18,124 0 4,670 7,294 41,378 9,531 10,805 8,101 175,114 1,766,035 2028 75,781 18,252 0 4,706 7,352 41,703 9,606 10,890 8,165 176,455 1,942,490 2029 76,350 18,480 0 4,743 7,409 42,029 9,681 10,975 8,228 177,895 2,120,384 2030 77,018 18,608 0 4,780 7,466 42,354 9,756 11,060 8,292 179,335 2,299,719 2031 77,574 18,720 0 4,819 7,527 42,699 9,835 11,150 8,360 180,683 2,480,403 2032 78,315 18,916 0 4,860 7,591 43,063 9,919 11,245 8,431 182,340 2,662,742 2033 78,957 19,012 0 4,901 7,655 43,426 10,003 11,340 8,502 183,796 2,846,539 2034 79,598 19,208 0 4,942 7,720 43,790 10,087 11,435 8,573 185,353 3,031,892 2035 80,240 19,404 0 4,983 7,784 44,154 10,170 11,530 8,645 186,910 3,218,802 2036 80,938 19,558 0 5,023 7,846 44,508 10,252 11,623 8,714 188,462 3,407,264 2037 81,580 19,654 0 5,064 7,910 44,872 10,336 11,718 8,785 189,919 3,597,183 2038 82,222 19,850 0 5,105 7,974 45,236 10,420 11,813 8,856 191,476 3,788,658 2039 82,863 20,046 0 5,146 8,038 45,600 10,503 11,908 8,928 193,032 3,981,691 2040 83,505 20,142 0 5,187 8,103 45,963 10,587 12,003 8,999 194,489 4,176,179 2041 84,160 20,354 0 5,226 8,163 46,308 10,667 12,093 9,066 196,037 4,372,216 2042 84,845 20,492 0 5,268 8,229 46,682 10,753 12,190 9,139 197,598 4,569,814 2043 85,530 20,630 0 5,310 8,295 47,055 10,839 12,288 9,212 199,159 4,768,973 2044 86,201 20,852 0 5,355 8,364 47,447 10,929 12,390 9,289 200,828 4,969,801 2045 86,929 21,032 0 5,398 8,432 47,830 11,017 12,490 9,364 202,493 5,172,293 2046 87,657 21,112 0 5,441 8,499 48,213 11,105 12,590 9,439 204,057 5,376,351 2047 88,328 21,334 0 5,485 8,568 48,606 11,196 12,693 9,516 205,726 5,582,077 2048 89,099 21,456 0 5,530 8,638 48,998 11,286 12,795 9,593 207,395 5,789,472 2049 89,814 21,720 0 5,575 8,708 49,400 11,379 12,900 9,672 209,168 5,998,641 2050 90,528 21,884 0 5,621 8,779 49,803 11,472 13,005 9,750 210,842 6,209,482 2017-2065 2,771,594 650,898 48,700 168,677 261,343 1,482,473 341,150 397,598 289,150 6,411,582 102,270,763

Page XXV
Table C-10 Future Waste Disposal Requirements by Weight: Scenario D (Increase in IC&I and Status Quo for residential waste)
Year Residential IC&I1 CR&D2 Sewage Biosolids Street "Other"3 WTP4 Cont. Soil5 Total Running Residual Sludge Ash Sweepings Municipal Residuals Total (tonnes) (tonnes) (tonnes) (tonnes) (tonnes) (tonnes) (tonnes) (tonnes) (tonnes) (tonnes) (tonnes)
2018 79,799 100,606 27,725 4,314 6,739 38,228 8,805 9,983 7,484 283,683 283,683 2019 71,022 101,298 27,875 4,342 6,783 38,477 8,863 10,048 7,533 276,241 559,924 2020 70,345 101,890 28,025 4,370 6,827 38,726 8,920 10,113 7,582 276,798 836,722 2021 70,898 102,708 28,250 4,402 6,876 39,003 8,984 10,185 7,636 278,942 1,115,664 2022 71,656 103,714 28,525 4,448 6,948 39,415 9,079 10,293 7,717 281,794 1,397,458 2023 72,357 104,862 28,825 4,496 7,022 39,836 9,176 10,403 7,799 284,776 1,682,234 2024 73,114 105,968 29,100 4,542 7,095 40,248 9,271 10,510 7,880 287,728 1,969,962 2025 73,872 107,074 29,475 4,589 7,168 40,660 9,366 10,618 7,960 290,780 2,260,742 2026 74,586 108,038 29,725 4,634 7,239 41,062 9,458 10,723 8,039 293,503 2,554,246 2027 75,212 108,924 29,950 4,670 7,294 41,378 9,531 10,805 8,101 295,864 2,850,110 2028 75,781 109,752 30,200 4,706 7,352 41,703 9,606 10,890 8,165 298,155 3,148,265 2029 76,350 110,580 30,450 4,743 7,409 42,029 9,681 10,975 8,228 300,445 3,448,709 2030 77,018 111,508 30,700 4,780 7,466 42,354 9,756 11,060 8,292 302,935 3,751,644 2031 77,574 112,420 30,900 4,819 7,527 42,699 9,835 11,150 8,360 305,283 4,056,928 2032 78,315 113,316 31,150 4,860 7,591 43,063 9,919 11,245 8,431 307,890 4,364,817 2033 78,957 114,312 31,400 4,901 7,655 43,426 10,003 11,340 8,502 310,496 4,675,314 2034 79,598 115,308 31,750 4,942 7,720 43,790 10,087 11,435 8,573 313,203 4,988,517 2035 80,240 116,204 32,000 4,983 7,784 44,154 10,170 11,530 8,645 315,710 5,304,227 2036 80,938 117,158 32,225 5,023 7,846 44,508 10,252 11,623 8,714 318,287 5,622,514 2037 81,580 118,154 32,475 5,064 7,910 44,872 10,336 11,718 8,785 320,894 5,943,408 2038 82,222 119,050 32,725 5,105 7,974 45,236 10,420 11,813 8,856 323,401 6,266,808 2039 82,863 120,046 32,975 5,146 8,038 45,600 10,503 11,908 8,928 326,007 6,592,816 2040 83,505 120,942 33,325 5,187 8,103 45,963 10,587 12,003 8,999 328,614 6,921,429 2041 84,160 121,854 33,525 5,226 8,163 46,308 10,667 12,093 9,066 331,062 7,252,491 2042 84,845 122,892 33,800 5,268 8,229 46,682 10,753 12,190 9,139 333,798 7,586,289 2043 85,530 123,830 34,075 5,310 8,295 47,055 10,839 12,288 9,212 336,434 7,922,723 2044 86,201 124,852 34,400 5,355 8,364 47,447 10,929 12,390 9,289 339,228 8,261,951 2045 86,929 125,932 34,600 5,398 8,432 47,830 11,017 12,490 9,364 341,993 8,603,943 2046 87,657 126,912 34,900 5,441 8,499 48,213 11,105 12,590 9,439 344,757 8,948,701 2047 88,328 127,934 35,225 5,485 8,568 48,606 11,196 12,693 9,516 347,551 9,296,252 2048 89,099 128,956 35,450 5,530 8,638 48,998 11,286 12,795 9,593 350,345 9,646,597 2049 89,814 130,020 35,800 5,575 8,708 49,400 11,379 12,900 9,672 353,268 9,999,866 2050 90,528 131,084 36,050 5,621 8,779 49,803 11,472 13,005 9,750 356,092 10,355,957
2017-2065 2,733,694 3,903,298 1,087,275 168,677 261,343 1,482,473 341,150 397,598 289,150 10,664,657
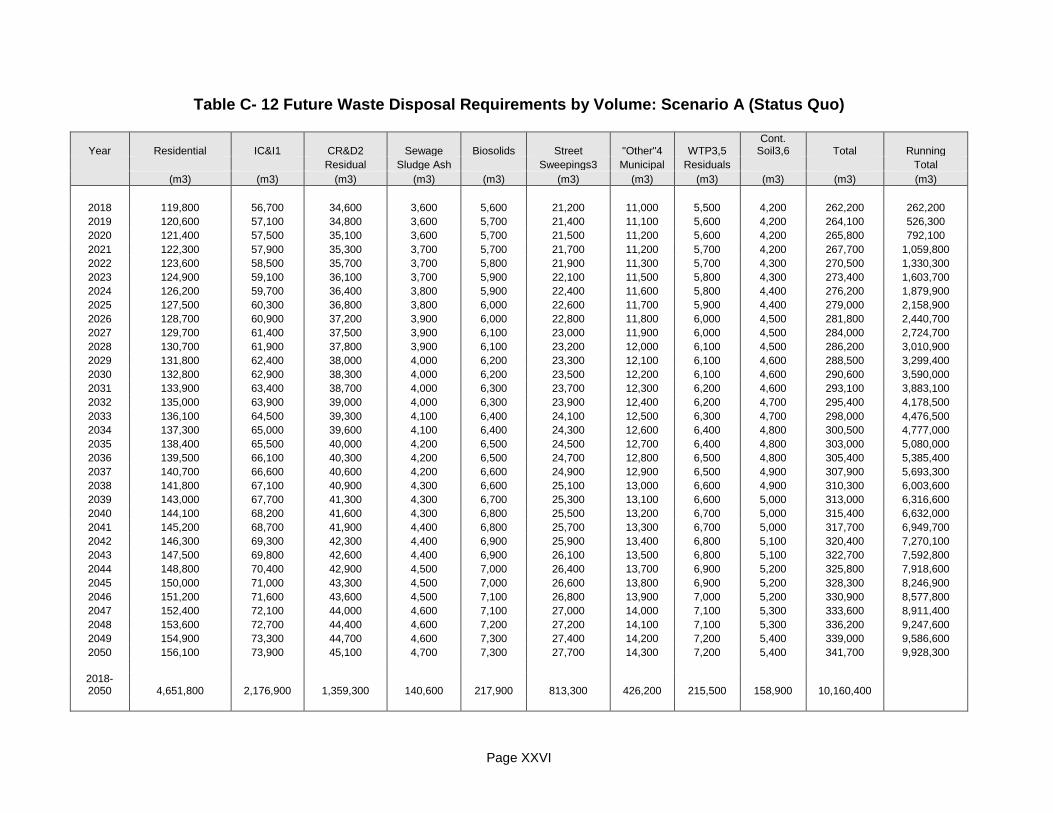
Page XXVI
Table C- 12 Future Waste Disposal Requirements by Volume: Scenario A (Status Quo)
Year Residential IC&I1 CR&D2 Sewage Biosolids Street "Other"4 WTP3,5
Cont. Soil3,6 Total Running
Residual Sludge Ash Sweepings3 Municipal Residuals Total
(m3) (m3) (m3) (m3) (m3) (m3) (m3) (m3) (m3) (m3) (m3)
2018 119,800 56,700 34,600 3,600 5,600 21,200 11,000 5,500 4,200 262,200 262,200 2019 120,600 57,100 34,800 3,600 5,700 21,400 11,100 5,600 4,200 264,100 526,300 2020 121,400 57,500 35,100 3,600 5,700 21,500 11,200 5,600 4,200 265,800 792,100 2021 122,300 57,900 35,300 3,700 5,700 21,700 11,200 5,700 4,200 267,700 1,059,800 2022 123,600 58,500 35,700 3,700 5,800 21,900 11,300 5,700 4,300 270,500 1,330,300 2023 124,900 59,100 36,100 3,700 5,900 22,100 11,500 5,800 4,300 273,400 1,603,700 2024 126,200 59,700 36,400 3,800 5,900 22,400 11,600 5,800 4,400 276,200 1,879,900 2025 127,500 60,300 36,800 3,800 6,000 22,600 11,700 5,900 4,400 279,000 2,158,900 2026 128,700 60,900 37,200 3,900 6,000 22,800 11,800 6,000 4,500 281,800 2,440,700 2027 129,700 61,400 37,500 3,900 6,100 23,000 11,900 6,000 4,500 284,000 2,724,700 2028 130,700 61,900 37,800 3,900 6,100 23,200 12,000 6,100 4,500 286,200 3,010,900 2029 131,800 62,400 38,000 4,000 6,200 23,300 12,100 6,100 4,600 288,500 3,299,400 2030 132,800 62,900 38,300 4,000 6,200 23,500 12,200 6,100 4,600 290,600 3,590,000 2031 133,900 63,400 38,700 4,000 6,300 23,700 12,300 6,200 4,600 293,100 3,883,100 2032 135,000 63,900 39,000 4,000 6,300 23,900 12,400 6,200 4,700 295,400 4,178,500 2033 136,100 64,500 39,300 4,100 6,400 24,100 12,500 6,300 4,700 298,000 4,476,500 2034 137,300 65,000 39,600 4,100 6,400 24,300 12,600 6,400 4,800 300,500 4,777,000 2035 138,400 65,500 40,000 4,200 6,500 24,500 12,700 6,400 4,800 303,000 5,080,000 2036 139,500 66,100 40,300 4,200 6,500 24,700 12,800 6,500 4,800 305,400 5,385,400 2037 140,700 66,600 40,600 4,200 6,600 24,900 12,900 6,500 4,900 307,900 5,693,300 2038 141,800 67,100 40,900 4,300 6,600 25,100 13,000 6,600 4,900 310,300 6,003,600 2039 143,000 67,700 41,300 4,300 6,700 25,300 13,100 6,600 5,000 313,000 6,316,600 2040 144,100 68,200 41,600 4,300 6,800 25,500 13,200 6,700 5,000 315,400 6,632,000 2041 145,200 68,700 41,900 4,400 6,800 25,700 13,300 6,700 5,000 317,700 6,949,700 2042 146,300 69,300 42,300 4,400 6,900 25,900 13,400 6,800 5,100 320,400 7,270,100 2043 147,500 69,800 42,600 4,400 6,900 26,100 13,500 6,800 5,100 322,700 7,592,800 2044 148,800 70,400 42,900 4,500 7,000 26,400 13,700 6,900 5,200 325,800 7,918,600 2045 150,000 71,000 43,300 4,500 7,000 26,600 13,800 6,900 5,200 328,300 8,246,900 2046 151,200 71,600 43,600 4,500 7,100 26,800 13,900 7,000 5,200 330,900 8,577,800 2047 152,400 72,100 44,000 4,600 7,100 27,000 14,000 7,100 5,300 333,600 8,911,400 2048 153,600 72,700 44,400 4,600 7,200 27,200 14,100 7,100 5,300 336,200 9,247,600 2049 154,900 73,300 44,700 4,600 7,300 27,400 14,200 7,200 5,400 339,000 9,586,600 2050 156,100 73,900 45,100 4,700 7,300 27,700 14,300 7,200 5,400 341,700 9,928,300
2018-2050 4,651,800 2,176,900 1,359,300 140,600 217,900 813,300 426,200 215,500 158,900 10,160,400

Page XXVII
Table C-13 Future Waste Disposal Requirements by Volume: Scenario B (Decrease in Residential Waste)
Year Residential IC&I1 CR&D2 Sewage Biosolids Street "Other"4 WTP5 Cont.
Soil3,6 Total Running
Residual Sludge Ash Sweepings3 Municipal Residuals Total
(m3) (m3) (m3) (m3) (m3) (m3) (m3) (m3) (m3) (m3) (m3)
2018 119,800 56,700 34,600 3,600 5,600 21,200 11,000 5,500 4,200 262,200 262,200 2019 111,000 57,100 34,800 4,500 5,700 21,400 11,100 5,600 4,200 255,400 517,600 2020 101,000 57,500 35,100 4,500 5,700 21,500 11,200 5,600 4,200 246,300 763,900 2021 89,900 57,900 35,300 4,500 5,700 21,700 11,200 5,700 4,200 236,100 1,000,000 2022 89,500 58,500 35,700 4,600 5,800 21,900 11,300 5,700 4,300 237,300 1,237,300 2023 90,500 59,100 36,100 4,600 5,900 22,100 11,500 5,800 4,300 239,900 1,477,200 2024 91,400 59,700 36,400 4,600 5,900 22,400 11,600 5,800 4,400 242,200 1,719,400 2025 92,400 60,300 36,800 4,600 6,000 22,600 11,700 5,900 4,400 244,700 1,964,100 2026 93,300 60,900 37,200 4,600 6,000 22,800 11,800 6,000 4,500 247,100 2,211,200 2027 94,000 61,400 37,500 4,600 6,100 23,000 11,900 6,000 4,500 249,000 2,460,200 2028 94,700 61,900 37,800 4,600 6,100 23,200 12,000 6,100 4,500 250,900 2,711,100 2029 95,500 62,400 38,000 4,600 6,200 23,300 12,100 6,100 4,600 252,800 2,963,900 2030 96,200 62,900 38,300 4,600 6,200 23,500 12,200 6,100 4,600 254,600 3,218,500 2031 97,000 63,400 38,700 4,700 6,300 23,700 12,300 6,200 4,600 256,900 3,475,400 2032 97,800 63,900 39,000 4,700 6,300 23,900 12,400 6,200 4,700 258,900 3,734,300 2033 98,700 64,500 39,300 4,700 6,400 24,100 12,500 6,300 4,700 261,200 3,995,500 2034 99,500 65,000 39,600 4,700 6,400 24,300 12,600 6,400 4,800 263,300 4,258,800 2035 100,300 65,500 40,000 4,700 6,500 24,500 12,700 6,400 4,800 265,400 4,524,200 2036 101,100 66,100 40,300 4,700 6,500 24,700 12,800 6,500 4,800 267,500 4,791,700 2037 101,900 66,600 40,600 4,700 6,600 24,900 12,900 6,500 4,900 269,600 5,061,300 2038 102,800 67,100 40,900 4,700 6,600 25,100 13,000 6,600 4,900 271,700 5,333,000 2039 103,600 67,700 41,300 4,700 6,700 25,300 13,100 6,600 5,000 274,000 5,607,000 2040 104,400 68,200 41,600 4,800 6,800 25,500 13,200 6,700 5,000 276,200 5,883,200 2041 105,200 68,700 41,900 4,800 6,800 25,700 13,300 6,700 5,000 278,100 6,161,300 2042 106,100 69,300 42,300 4,800 6,900 25,900 13,400 6,800 5,100 280,600 6,441,900 2043 106,900 69,800 42,600 4,800 6,900 26,100 13,500 6,800 5,100 282,500 6,724,400 2044 107,800 70,400 42,900 4,800 7,000 26,400 13,700 6,900 5,200 285,100 7,009,500 2045 108,700 71,000 43,300 4,800 7,000 26,600 13,800 6,900 5,200 287,300 7,296,800 2046 109,500 71,600 43,600 4,800 7,100 26,800 13,900 7,000 5,200 289,500 7,586,300 2047 110,400 72,100 44,000 4,800 7,100 27,000 14,000 7,100 5,300 291,800 7,878,100 2048 111,300 72,700 44,400 4,800 7,200 27,200 14,100 7,100 5,300 294,100 8,172,200 2049 112,200 73,300 44,700 4,800 7,300 27,400 14,200 7,200 5,400 296,500 8,468,700 2050 113,100 73,900 45,100 4,800 7,300 27,700 14,300 7,200 5,400 298,800 8,767,500
2017-2065 3,473,500 2,176,900 1,359,300 158,100 217,900 813,300 426,200 215,500 158,900 8,999,600

Page XXVIII
Table C-14 Future Waste Disposal Requirements by Volume: Scenario C (Decrease in Residential, IC&I and CR&D
Waste)
Year Residential IC&I1 CR&D2 Sewage Biosolids Street "Other"4 WTP5 Cont.
Soil3,6 Total Running
Residual Sludge Ash Sweepings3 Municipal Residuals Total
(m3) (m3) (m3) (m3) (m3) (m3) (m3) (m3) (m3) (m3) (m3)
2018 119,900 21,000 17,300 5,400 5,600 2,400 11,000 5,500 4,200 192,300 192,300 2019 111,000 21,100 12,000 5,400 5,700 2,400 11,100 5,600 4,200 178,500 370,800 2020 101,100 21,200 6,400 5,500 5,700 2,400 11,200 5,600 4,200 163,300 534,100 2021 89,900 21,400 300 5,500 5,700 2,400 11,200 5,700 4,200 146,300 680,400 2022 89,600 21,600 0 5,600 5,800 2,500 11,300 5,700 4,300 146,400 826,800 2023 90,400 21,800 0 5,600 5,900 2,500 11,500 5,800 4,300 147,800 974,600 2024 91,400 22,100 0 5,700 5,900 2,500 11,600 5,800 4,400 149,400 1,124,000 2025 92,300 22,300 0 5,700 6,000 2,500 11,700 5,900 4,400 150,800 1,274,800 2026 93,200 22,500 0 5,800 6,000 2,600 11,800 6,000 4,500 152,400 1,427,200 2027 94,000 22,700 0 5,800 6,100 2,600 11,900 6,000 4,500 153,600 1,580,800 2028 94,700 22,800 0 5,900 6,100 2,600 12,000 6,100 4,500 154,700 1,735,500 2029 95,400 23,100 0 5,900 6,200 2,600 12,100 6,100 4,600 156,000 1,891,500 2030 96,300 23,300 0 6,000 6,200 2,700 12,200 6,100 4,600 157,400 2,048,900 2031 97,000 23,400 0 6,000 6,300 2,700 12,300 6,200 4,600 158,500 2,207,400 2032 97,900 23,600 0 6,100 6,300 2,700 12,400 6,200 4,700 159,900 2,367,300 2033 98,700 23,800 0 6,100 6,400 2,700 12,500 6,300 4,700 161,200 2,528,500 2034 99,500 24,000 0 6,200 6,400 2,700 12,600 6,400 4,800 162,600 2,691,100 2035 100,300 24,300 0 6,200 6,500 2,800 12,700 6,400 4,800 164,000 2,855,100 2036 101,200 24,400 0 6,300 6,500 2,800 12,800 6,500 4,800 165,300 3,020,400 2037 102,000 24,600 0 6,300 6,600 2,800 12,900 6,500 4,900 166,600 3,187,000 2038 102,800 24,800 0 6,400 6,600 2,800 13,000 6,600 4,900 167,900 3,354,900 2039 103,600 25,100 0 6,400 6,700 2,900 13,100 6,600 5,000 169,400 3,524,300 2040 104,400 25,200 0 6,500 6,800 2,900 13,200 6,700 5,000 170,700 3,695,000 2041 105,200 25,400 0 6,500 6,800 2,900 13,300 6,700 5,000 171,800 3,866,800 2042 106,100 25,600 0 6,600 6,900 2,900 13,400 6,800 5,100 173,400 4,040,200 2043 106,900 25,800 0 6,600 6,900 3,000 13,500 6,800 5,100 174,600 4,214,800 2044 107,800 26,100 0 6,700 7,000 3,000 13,700 6,900 5,200 176,400 4,391,200 2045 108,700 26,300 0 6,700 7,000 3,000 13,800 6,900 5,200 177,600 4,568,800 2046 109,600 26,400 0 6,800 7,100 3,000 13,900 7,000 5,200 179,000 4,747,800 2047 110,400 26,700 0 6,900 7,100 3,000 14,000 7,100 5,300 180,500 4,928,300 2048 111,400 26,800 0 6,900 7,200 3,100 14,100 7,100 5,300 181,900 5,110,200 2049 112,300 27,200 0 7,000 7,300 3,100 14,200 7,200 5,400 183,700 5,293,900 2050 113,200 27,400 0 7,000 7,300 3,100 14,300 7,200 5,400 184,900 5,478,800
2017-2065 3,464,800 813,700 60,900 210,800 217,900 93,600 426,200 215,500 160,600 5,664,000

Page XXIX
Table C-15 Future Waste Disposal Requirements by Volume: Scenario D (Increase in IC&I and Status Quo for residential waste)
Year Residential IC&I1 CR&D2 Sewage Biosolids Street "Other"4 WTP5 Cont. Total Running
Residual Sludge Ash Sweepings3 Municipal Residuals Soil3,6 Total
(m3) (m3) (m3) (m3) (m3) (m3) (m3) (m3) (m3) (m3) (m3)
2018 99,700 125,800 34,700 5,400 5,600 21,200 11,000 5,500 4,200 313,100 313,100 2019 88,800 126,600 34,800 5,400 5,700 21,400 11,100 5,600 4,200 303,600 616,700 2020 87,900 127,400 35,000 5,500 5,700 21,500 11,200 5,600 4,200 304,000 920,700 2021 88,600 128,400 35,300 5,500 5,700 21,700 11,200 5,700 4,200 306,300 1,227,000 2022 89,600 129,600 35,700 5,600 5,800 21,900 11,300 5,700 4,300 309,500 1,536,500 2023 90,400 131,100 36,000 5,600 5,900 22,100 11,500 5,800 4,300 312,700 1,849,200 2024 91,400 132,500 36,400 5,700 5,900 22,400 11,600 5,800 4,400 316,100 2,165,300 2025 92,300 133,800 36,800 5,700 6,000 22,600 11,700 5,900 4,400 319,200 2,484,500 2026 93,200 135,000 37,200 5,800 6,000 22,800 11,800 6,000 4,500 322,300 2,806,800 2027 94,000 136,200 37,400 5,800 6,100 23,000 11,900 6,000 4,500 324,900 3,131,700 2028 94,700 137,200 37,800 5,900 6,100 23,200 12,000 6,100 4,500 327,500 3,459,200 2029 95,400 138,200 38,100 5,900 6,200 23,300 12,100 6,100 4,600 329,900 3,789,100 2030 96,300 139,400 38,400 6,000 6,200 23,500 12,200 6,100 4,600 332,700 4,121,800 2031 97,000 140,500 38,600 6,000 6,300 23,700 12,300 6,200 4,600 335,200 4,457,000 2032 97,900 141,600 38,900 6,100 6,300 23,900 12,400 6,200 4,700 338,000 4,795,000 2033 98,700 142,900 39,300 6,100 6,400 24,100 12,500 6,300 4,700 341,000 5,136,000 2034 99,500 144,100 39,700 6,200 6,400 24,300 12,600 6,400 4,800 344,000 5,480,000 2035 100,300 145,300 40,000 6,200 6,500 24,500 12,700 6,400 4,800 346,700 5,826,700 2036 101,200 146,400 40,300 6,300 6,500 24,700 12,800 6,500 4,800 349,500 6,176,200 2037 102,000 147,700 40,600 6,300 6,600 24,900 12,900 6,500 4,900 352,400 6,528,600 2038 102,800 148,800 40,900 6,400 6,600 25,100 13,000 6,600 4,900 355,100 6,883,700 2039 103,600 150,100 41,200 6,400 6,700 25,300 13,100 6,600 5,000 358,000 7,241,700 2040 104,400 151,200 41,700 6,500 6,800 25,500 13,200 6,700 5,000 361,000 7,602,700 2041 105,200 152,300 41,900 6,500 6,800 25,700 13,300 6,700 5,000 363,400 7,966,100 2042 106,100 153,600 42,300 6,600 6,900 25,900 13,400 6,800 5,100 366,700 8,332,800 2043 106,900 154,800 42,600 6,600 6,900 26,100 13,500 6,800 5,100 369,300 8,702,100 2044 107,800 156,100 43,000 6,700 7,000 26,400 13,700 6,900 5,200 372,800 9,074,900 2045 108,700 157,400 43,300 6,700 7,000 26,600 13,800 6,900 5,200 375,600 9,450,500 2046 109,600 158,600 43,600 6,800 7,100 26,800 13,900 7,000 5,200 378,600 9,829,100 2047 110,400 159,900 44,000 6,900 7,100 27,000 14,000 7,100 5,300 381,700 10,210,800 2048 111,400 161,200 44,300 6,900 7,200 27,200 14,100 7,100 5,300 384,700 10,595,500 2049 112,300 162,500 44,800 7,000 7,300 27,400 14,200 7,200 5,400 388,100 10,983,600 2050 113,200 163,900 45,100 7,000 7,300 27,700 14,300 7,200 5,400 391,100 11,374,700
2017-2065 3,417,300 4,879,100 1,359,300 210,800 217,900 823,200 426,200 215,500 160,600 11,709,900