w17 cafe final deliverables
TRANSCRIPT

MAAN & Associate
sDirection. Innovation. Solution.

Who We Are
Mohammad MalikRising Junior at UVA
B.A. Economics
Alvaro PerezRising Junior at UMich
B.S. Industrial Operations Engineering
Ahmed SyedRising Junior at Yale
B.A. Economics
Michael NguyenRising Senior at Queen’s
B.S. Life Science
2
AgendaIntroductionCurrent StrategyRecommendationsConclusionAppendix
3
Methodology
4
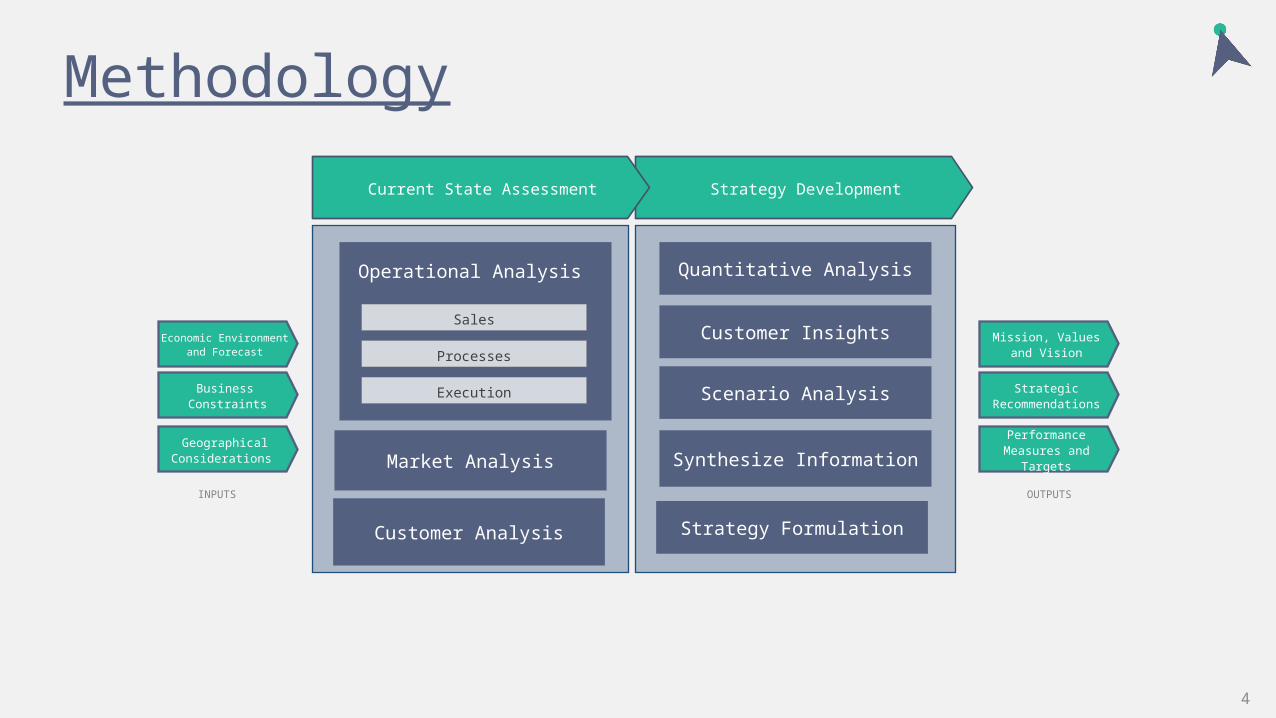
Strategy DevelopmentCurrent State Assessment
Mission, Values and Vision
Strategic Recommendations
Performance Measures and
Targets
Scenario Analysis
Customer Insights
Strategy FormulationCustomer Analysis
Market Analysis
Operational Analysis
Processes
Sales
Execution
OUTPUTS
Quantitative Analysis
Synthesize Information
Economic Environment and Forecast
Business Constraints
Geographical Considerations
INPUTS
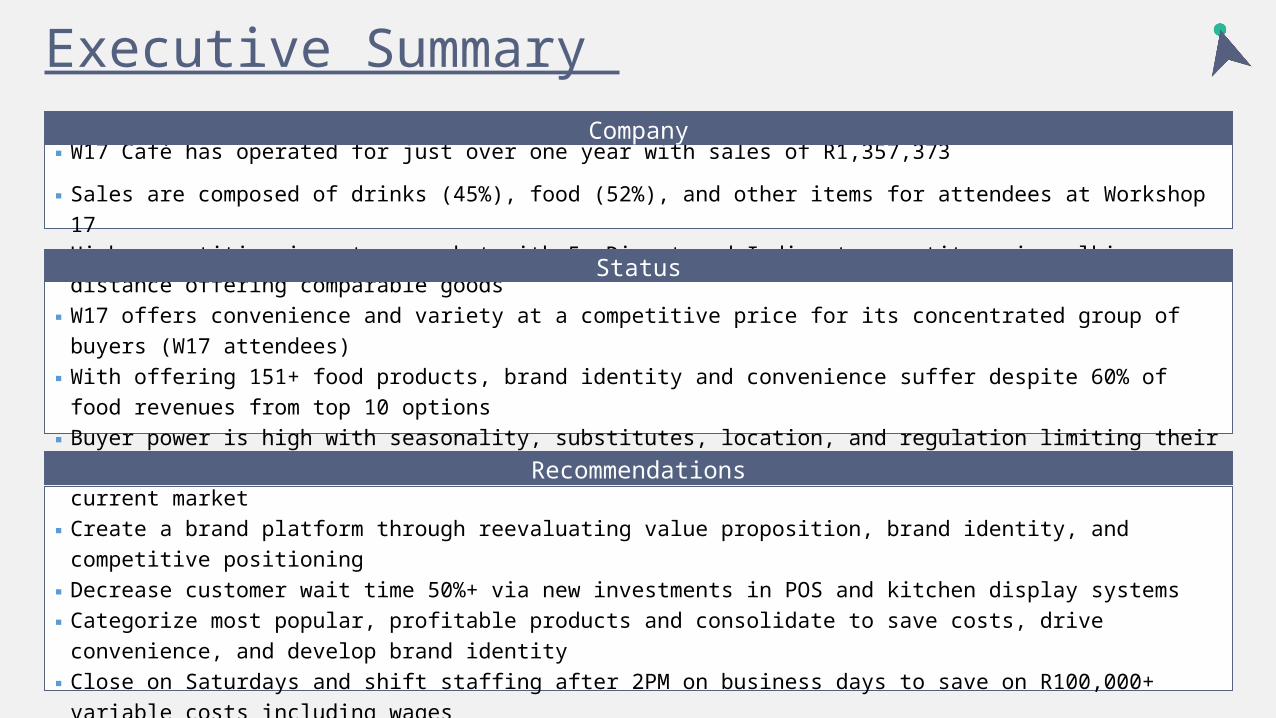
Executive Summary
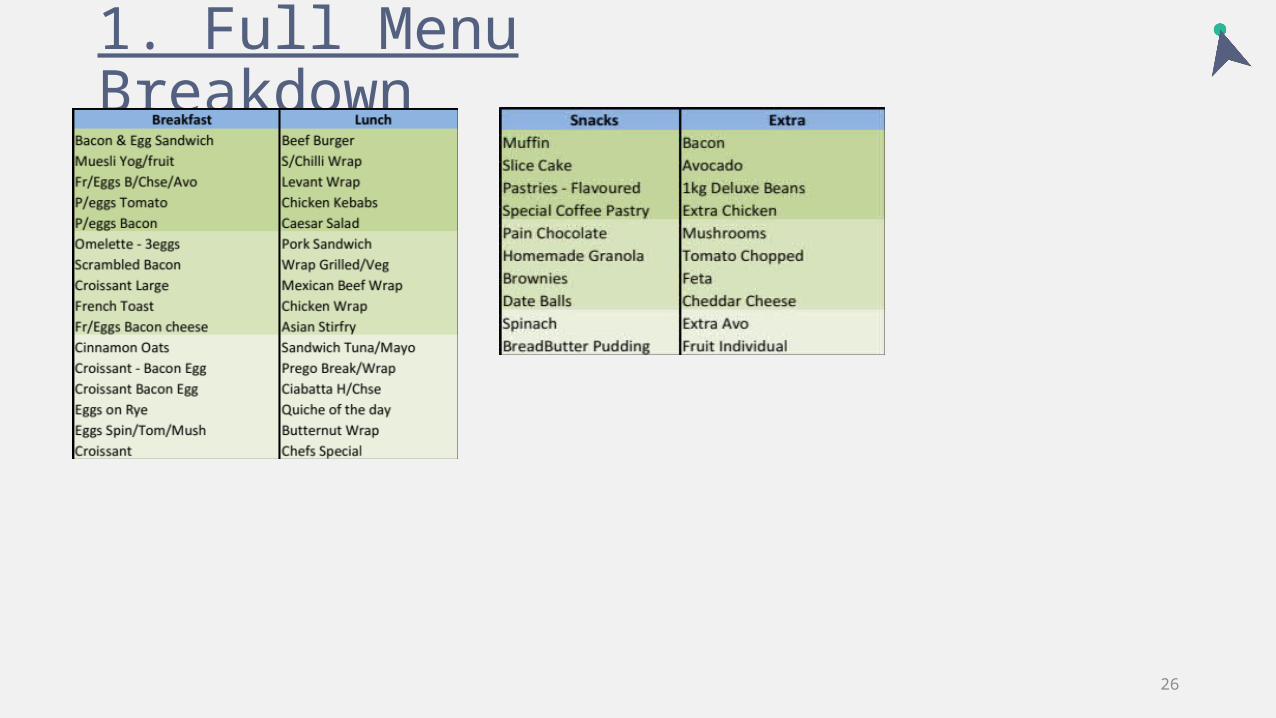
▪High competition in mature market with 5+ Direct and Indirect competitors in walking distance offering comparable goods ▪W17 offers convenience and variety at a competitive price for its concentrated group of buyers (W17 attendees)▪With offering 151+ food products, brand identity and convenience suffer despite 60% of food revenues from top 10
options▪Buyer power is high with seasonality, substitutes, location, and regulation limiting their ability to capture a larger market
▪W17 Café has operated for just over one year with sales of R1,357,373
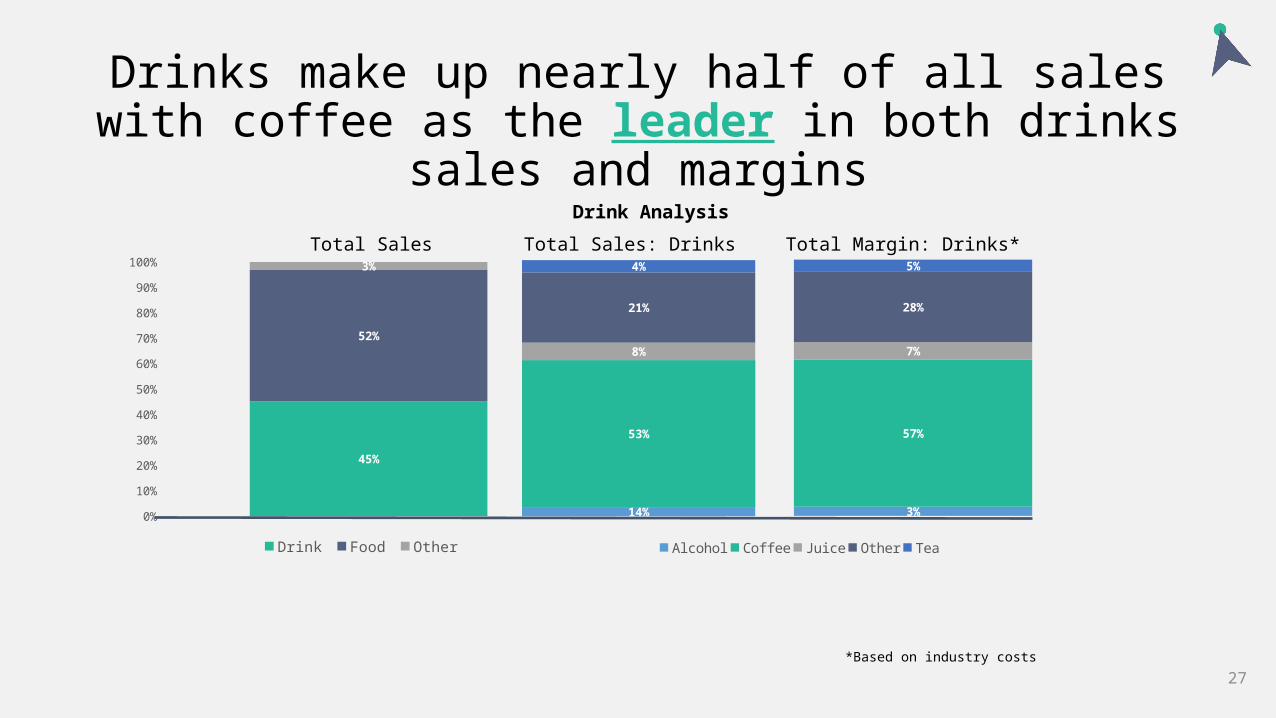
▪Sales are composed of drinks (45%), food (52%), and other items for attendees at Workshop 17
Status
Company
5
▪Grow organically through delivering a better customer experience and capturing more of current market▪Create a brand platform through reevaluating value proposition, brand identity, and competitive positioning ▪Decrease customer wait time 50%+ via new investments in POS and kitchen display systems▪Categorize most popular, profitable products and consolidate to save costs, drive convenience, and develop brand
identity▪Close on Saturdays and shift staffing after 2PM on business days to save on R100,000+ variable costs including wages
Recommendations
Café
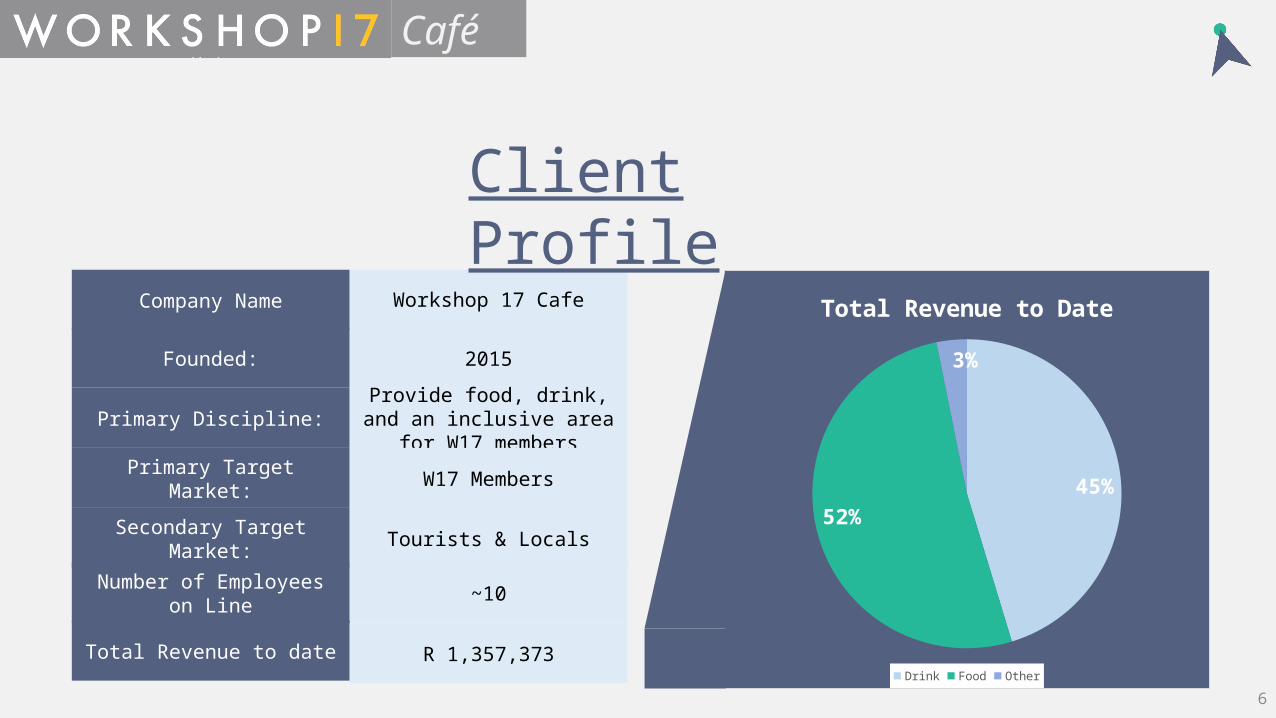
Company Name Workshop 17 Cafe
Founded: 2015
Primary Discipline:Provide food, drink, and
an inclusive area for W17 members
Primary Target Market: W17 Members
Secondary Target Market: Tourists & Locals
Number of Employees on Line ~10
Total Revenue to date R 1,357,373
Client Profile
45%
52%
3%
Total Revenue to Date
Drink Food Other
6
Variety
Uniformity
Che
ap E
xpensive
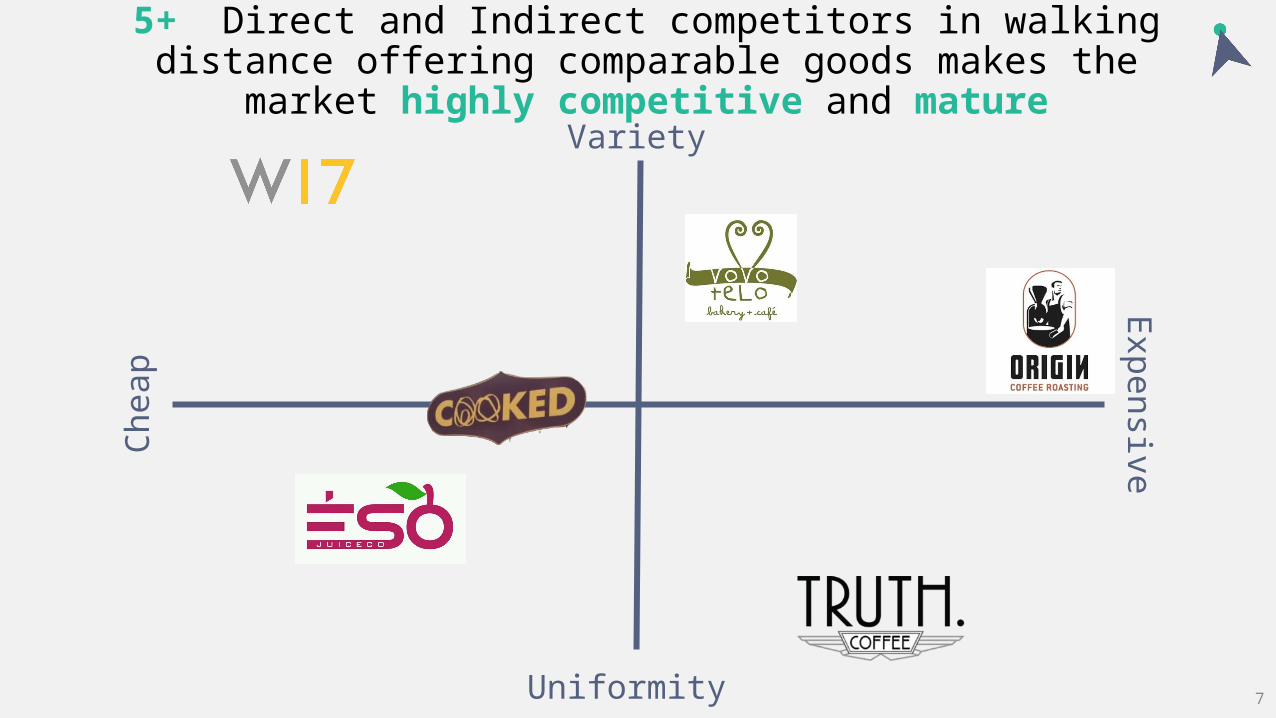
5+ Direct and Indirect competitors in walking distance offering comparable goods makes the market highly
competitive and mature
7
Workshop 17 Café Current Strategy
8
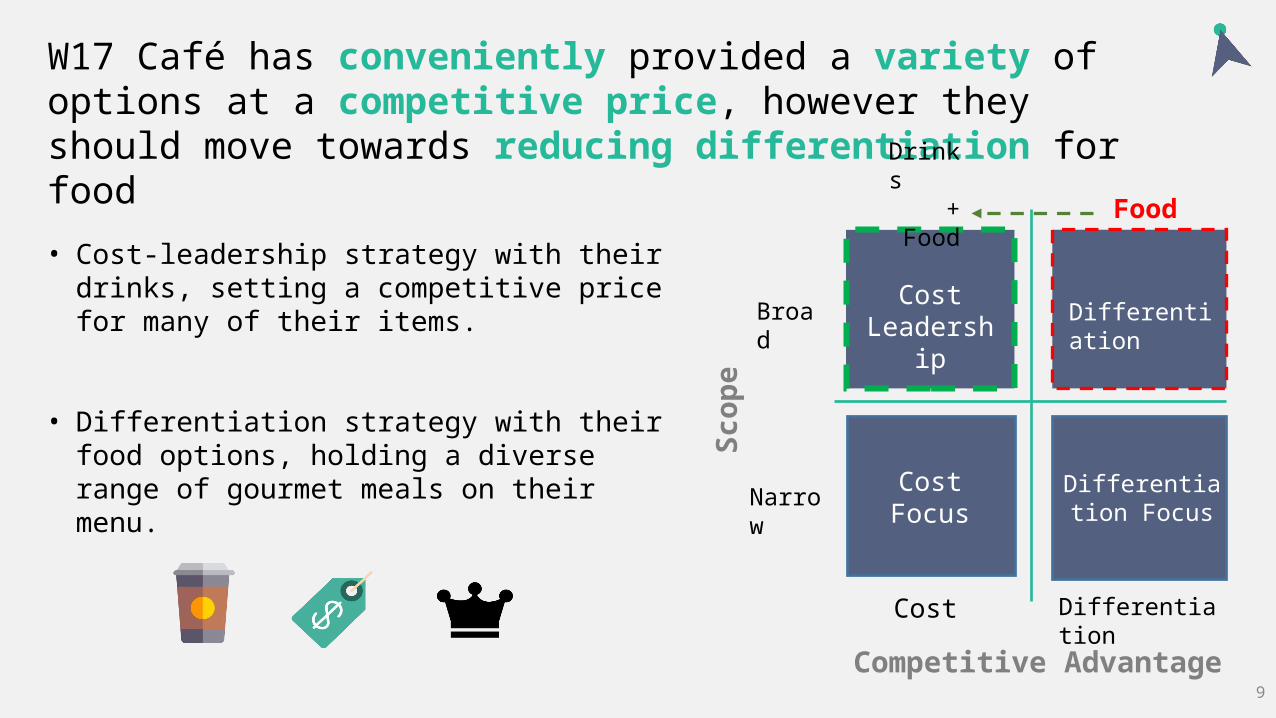
W17 Café has conveniently provided a variety of options at a competitive price, however they should move towards reducing differentiation for food
9
• Cost-leadership strategy with their drinks, setting a competitive price for many of their items.
• Differentiation strategy with their food options, holding a diverse range of gourmet meals on their menu.
Scop
e
Competitive AdvantageCost Differentiation
Narrow
BroadCost
Leadership
Cost Focus
Differentiation
Differentiation Focus
Drinks + Food Food
1 2 30%
10%
20%
30%
40%
50%
60%
70%
80%
90%
100%
26%15%
22%
11%
1%
2%
52%
77% 65%
11% 7% 11%
Breakfast Extra Lunch Snack
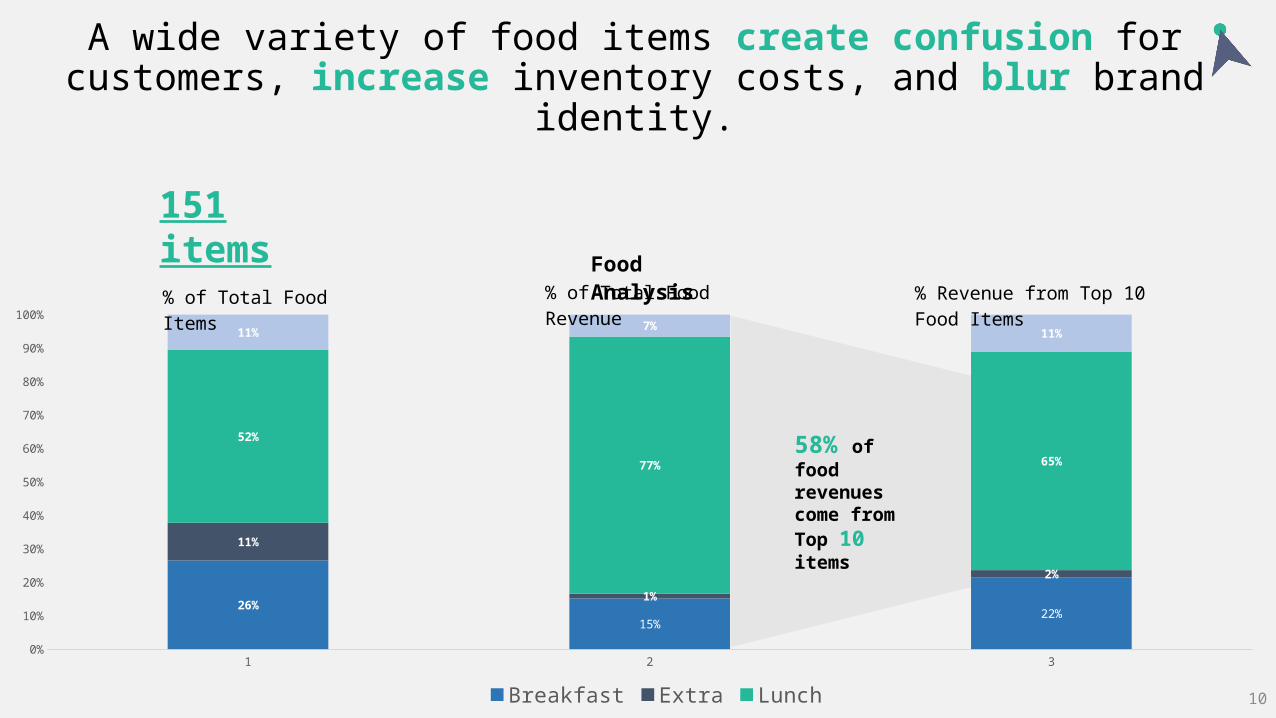
% of Total Food Revenue % Revenue from Top 10 Food ItemsFood Analysis
% of Total Food Items
58% of food revenues come from Top 10 items
A wide variety of food items create confusion for customers, increase inventory costs, and blur brand
identity.
151 items
10
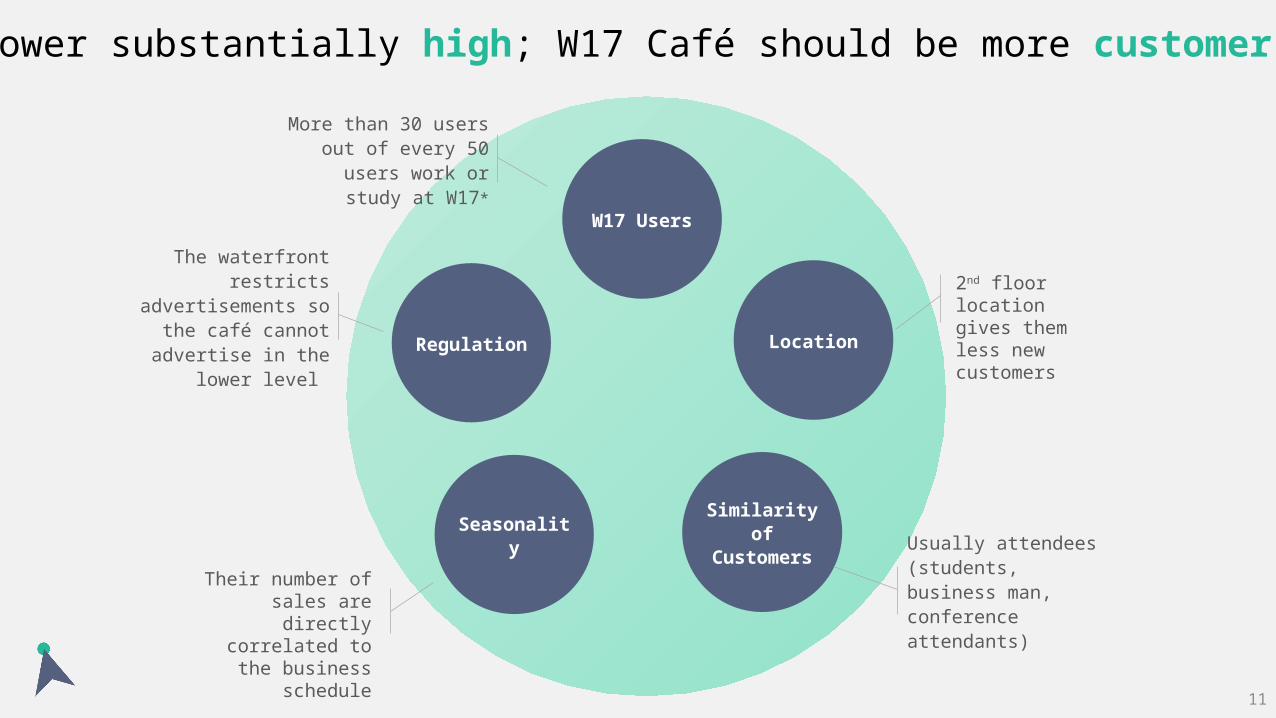
Buyer power substantially high; W17 Café should be more customer-centric
Location
Similarity of
CustomersSeasonalit
y
The waterfront restricts
advertisements so the café cannot advertise
in the lower level
Usually attendees (students, business man, conference attendants)
Regulation
W17 Users
More than 30 users out of every 50 users
work or study at W17*
2nd floor location gives them less new customers
Their number of sales are directly correlated to the
business schedule
11
Recommendations - Agenda1. Brand Management2. Operational Efficiencies3. Loyalty Program
12
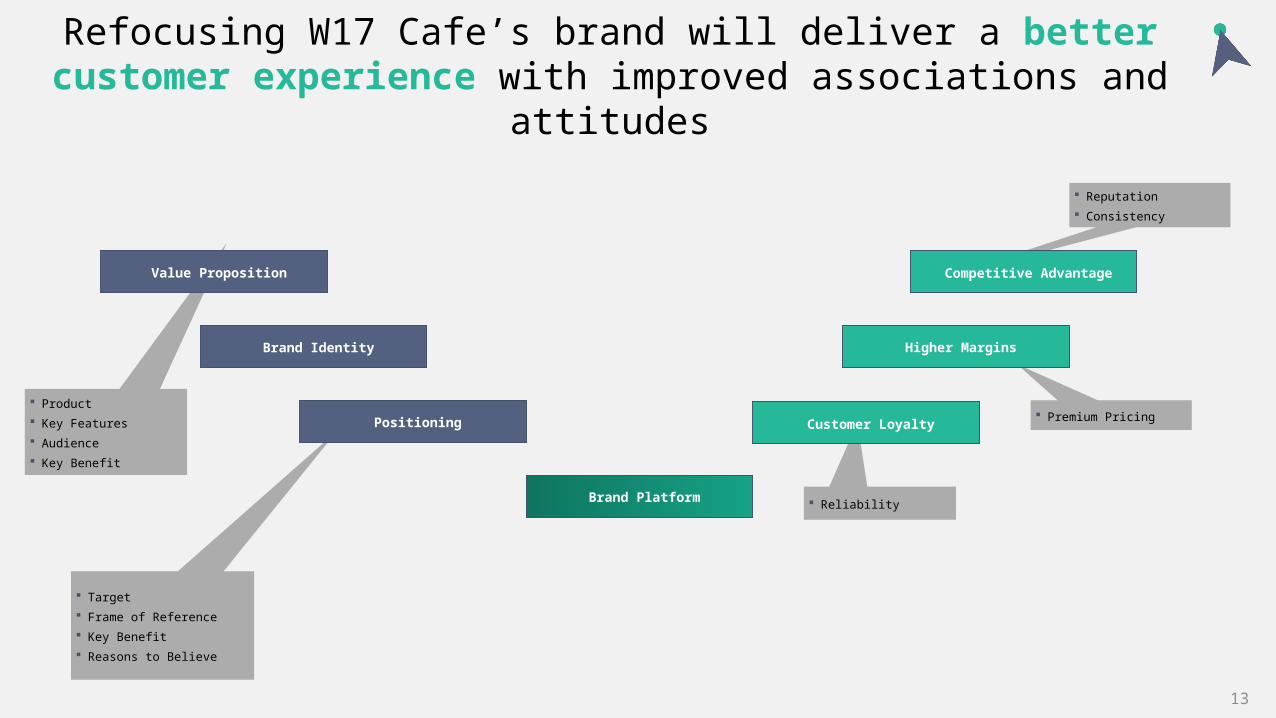
Reliability
Reputation Consistency
Premium Pricing
Target Frame of Reference Key Benefit Reasons to Believe
Product Key Features Audience Key Benefit
Refocusing W17 Cafe’s brand will deliver a better customer experience with improved associations and attitudes
Brand Identity
Positioning
Value Proposition
Brand Platform
Customer Loyalty
Higher Margins
Competitive Advantage
13
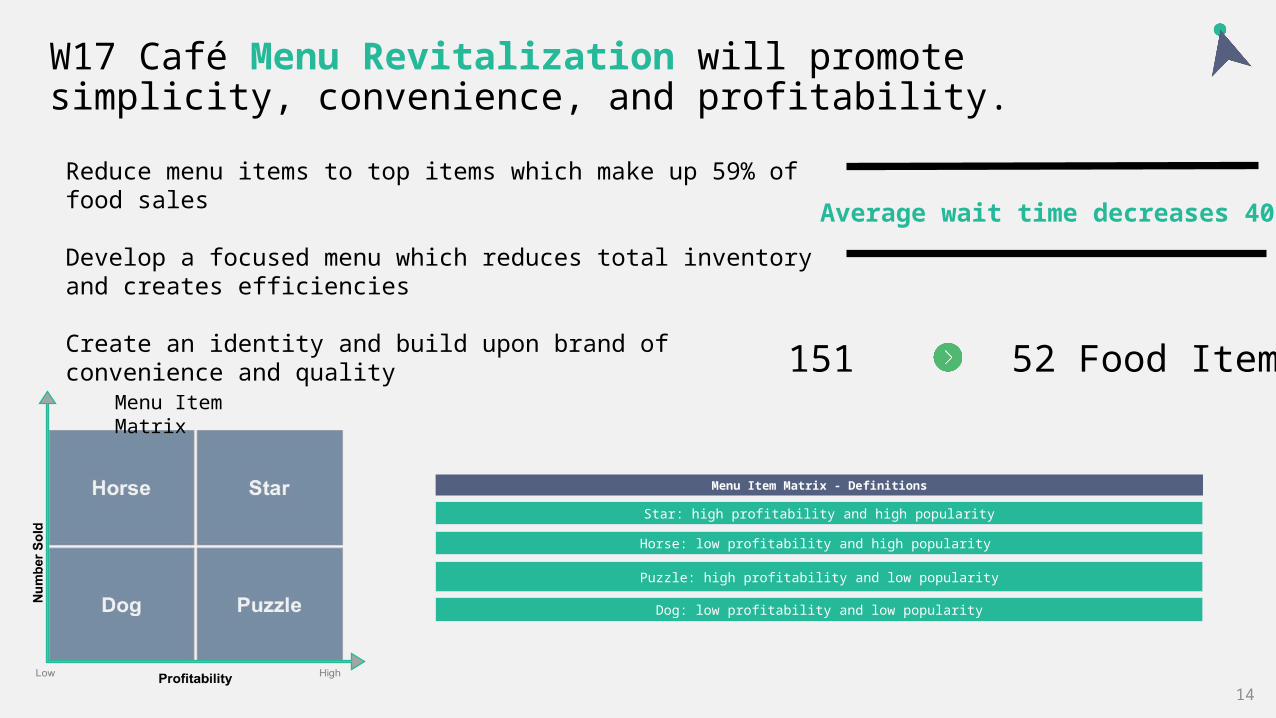
W17 Café Menu Revitalization will promote simplicity, convenience, and profitability.
Reduce menu items to top items which make up 59% of food sales
Develop a focused menu which reduces total inventory and creates efficiencies
Create an identity and build upon brand of convenience and quality
14
Menu Item Matrix
Horse: low profitability and high popularity
Star: high profitability and high popularity
Dog: low profitability and low popularity
Puzzle: high profitability and low popularity
Menu Item Matrix - Definitions
151 52 Food Items
Average wait time decreases 400%
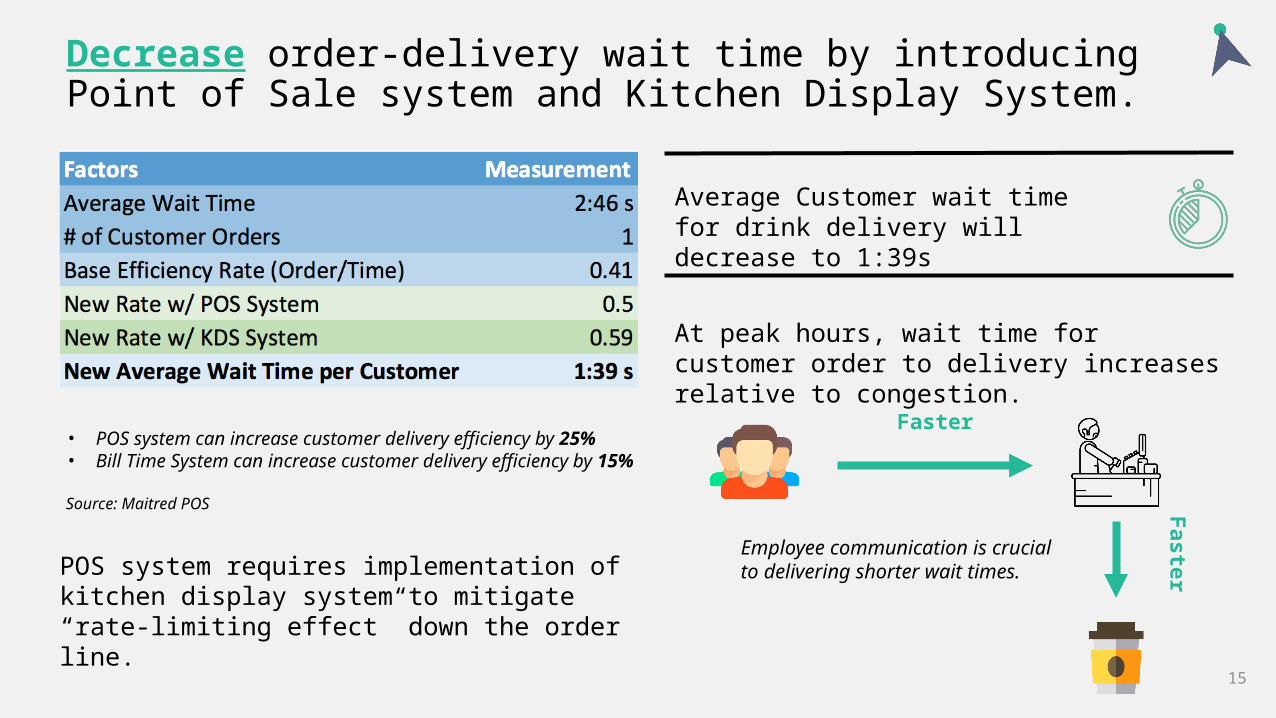
Decrease order-delivery wait time by introducing Point of Sale system and Kitchen Display System.
• POS system can increase customer delivery efficiency by 25%• Bill Time System can increase customer delivery efficiency by 15%
Source: Maitred POS
Average Customer wait time for drink delivery will decrease to 1:39s
At peak hours, wait time for customer order to delivery increases relative to congestion.
POS system requires implementation of kitchen display system to mitigate “rate-limiting effect” down the order line.
Faster
Faster
Employee communication is crucial to delivering shorter wait times.
15
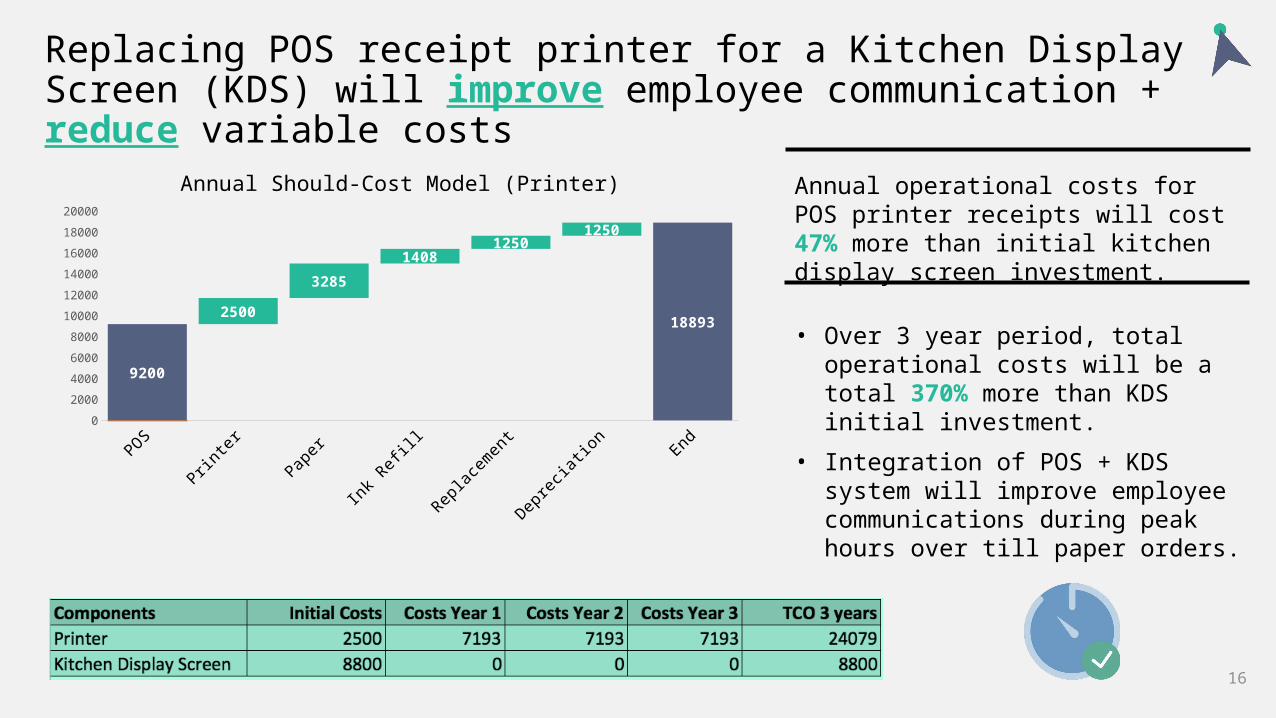
Replacing POS receipt printer for a Kitchen Display Screen (KDS) will improve employee communication + reduce variable costs
Annual operational costs for POS printer receipts will cost 47% more than initial kitchen display screen investment.
• Over 3 year period, total operational costs will be a total 370% more than KDS initial investment.
• Integration of POS + KDS system will improve employee communications during peak hours over till paper orders.
16
POS Printer Paper Ink Refill Replacement Depreciation End0
2000
4000
6000
8000
10000
12000
14000
16000
18000
20000
9200
2500
3285
14081250
1250
18893
Annual Should-Cost Model (Printer)

W17 Café should close on Saturday + scale back staff after 2pm to reduce variable costs.
Shifting from 9 - 5 waiters/cooks
Closing on Saturday
Both Scaling back and closing
We would have saved in the last 10 months
R 80,888.89
R 104,333.93
R 49,578.38
R 70,030.94
Savings per yearAction
17
4am6am
8am10am
12pm2pm
4pm6pm
8pm10pm
0200400600800
100012001400160018002000
Sales per hour
Time of the Day
Num
ber o
f Sal
es
42217 42227 42235 42243 42251 42259 42268 42277 42285 42293 42301 42310 42318 42326 42334 42342 42350 42374 42382 42390 42398 42406 42413 42422 42431 42439 42447 42459 42467 42475 42483 42493 42501 42509 425170
50
100
150
200
250
300
350 2015-2016 YTD Trends
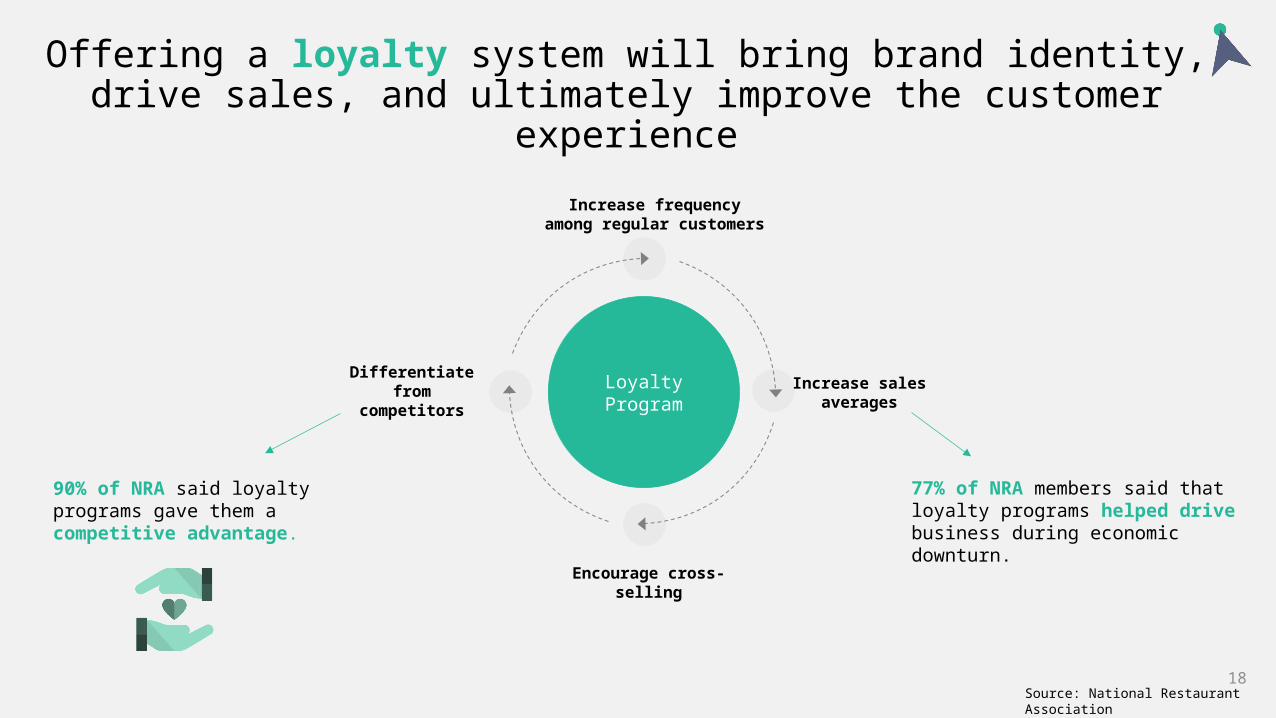
Offering a loyalty system will bring brand identity, drive sales, and ultimately improve the customer experience
Source: National Restaurant Association 18
Loyalty Program
Differentiate from competitors
Increase sales averages
Increase frequency among regular customers
Encourage cross-selling
77% of NRA members said that loyalty programs helped drive business during economic downturn.
90% of NRA said loyalty programs gave them a competitive advantage.
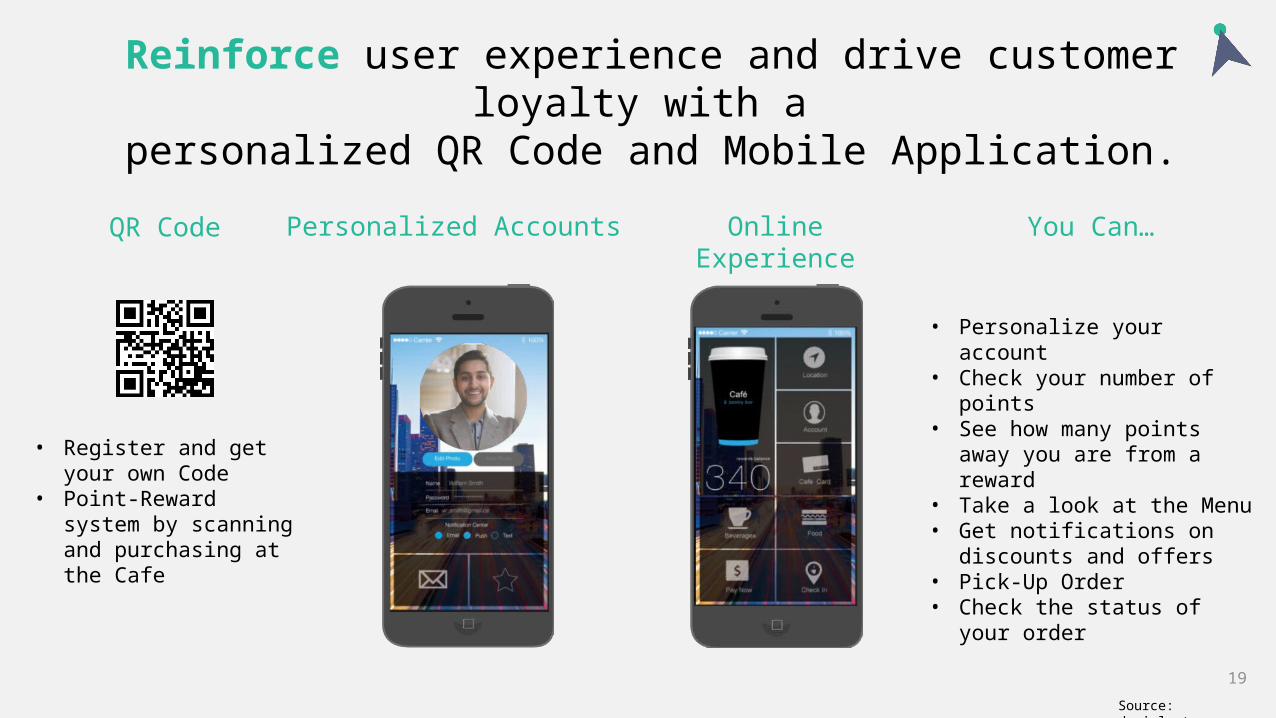
Personalized Accounts Online Experience
Source: danielortega.com
You Can…
• Personalize your account• Check your number of points• See how many points away
you are from a reward• Take a look at the Menu• Get notifications on discounts
and offers• Pick-Up Order• Check the status of your order
Reinforce user experience and drive customer loyalty with a
personalized QR Code and Mobile Application.QR Code
• Register and get your own Code
• Point-Reward system by scanning and purchasing at the Cafe
19
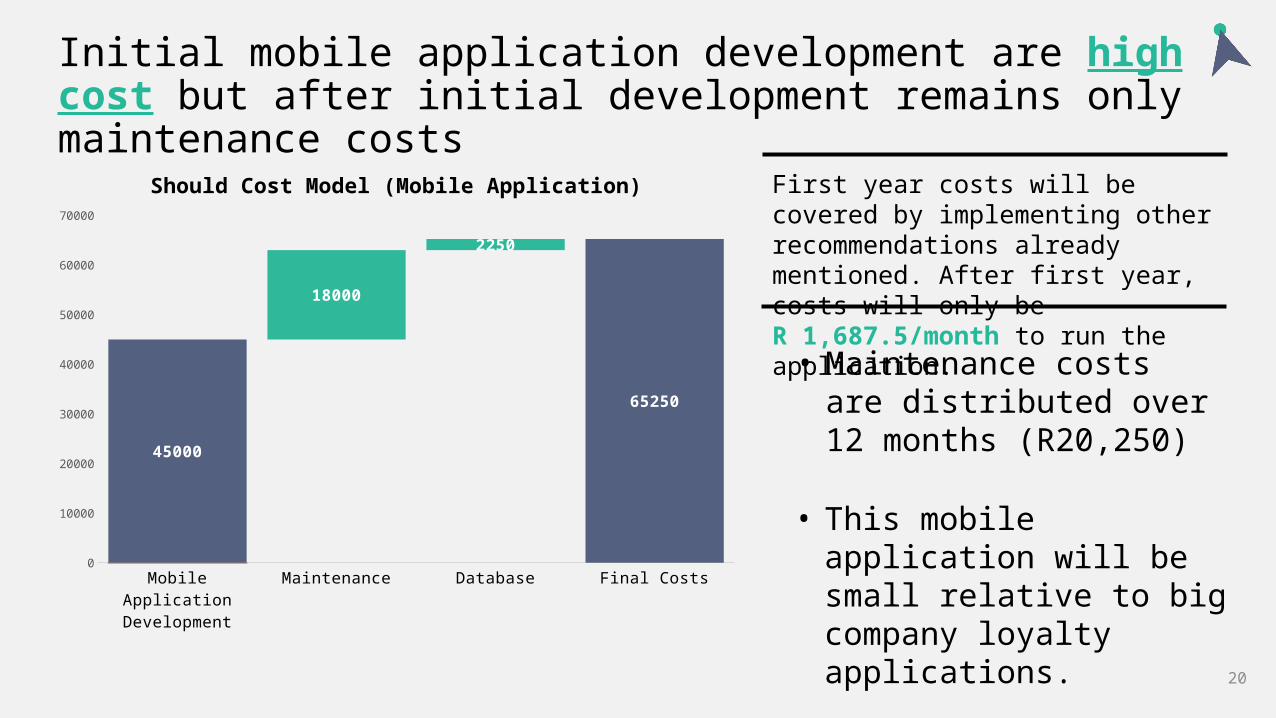
Initial mobile application development are high cost but after initial development remains only maintenance costs
First year costs will be covered by implementing other recommendations already mentioned. After first year, costs will only be R 1,687.5/month to run the application.• Maintenance costs are
distributed over 12 months (R20,250)
• This mobile application will be small relative to big company loyalty applications.
20
Mobile Application Development
Maintenance Database Final Costs0
10000
20000
30000
40000
50000
60000
70000
45000
18000
2250
65250
Should Cost Model (Mobile Application)
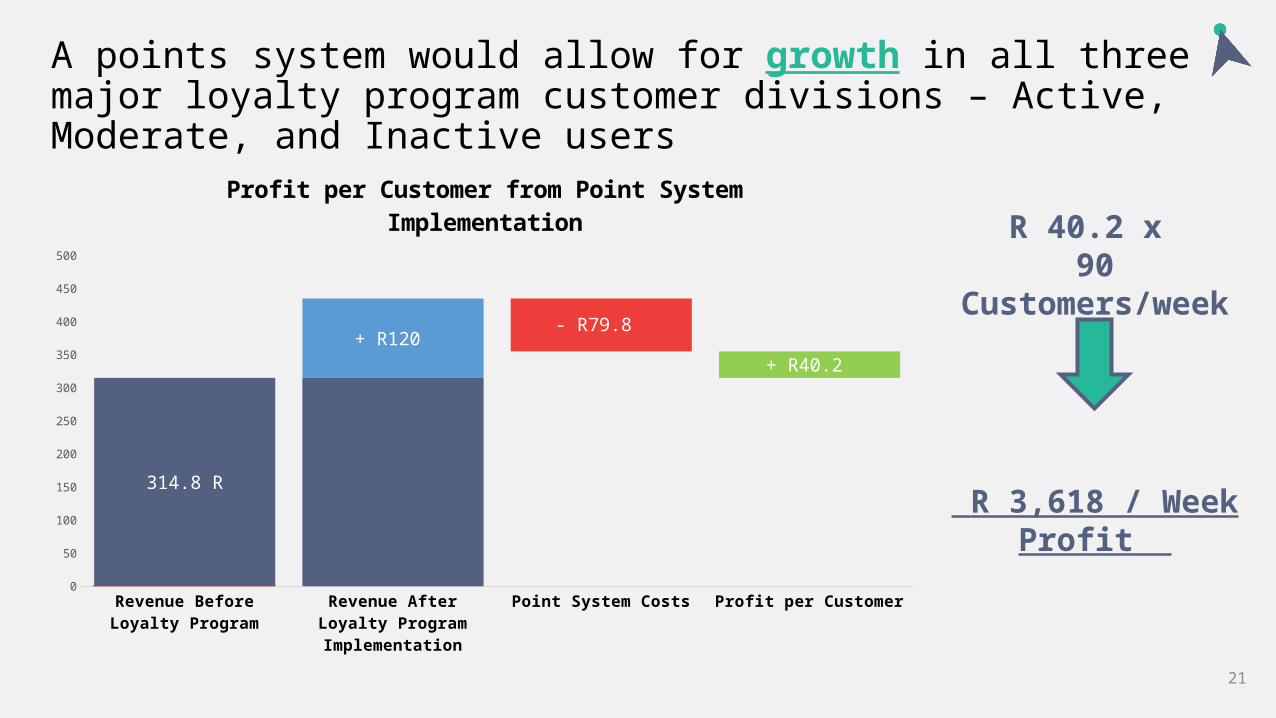
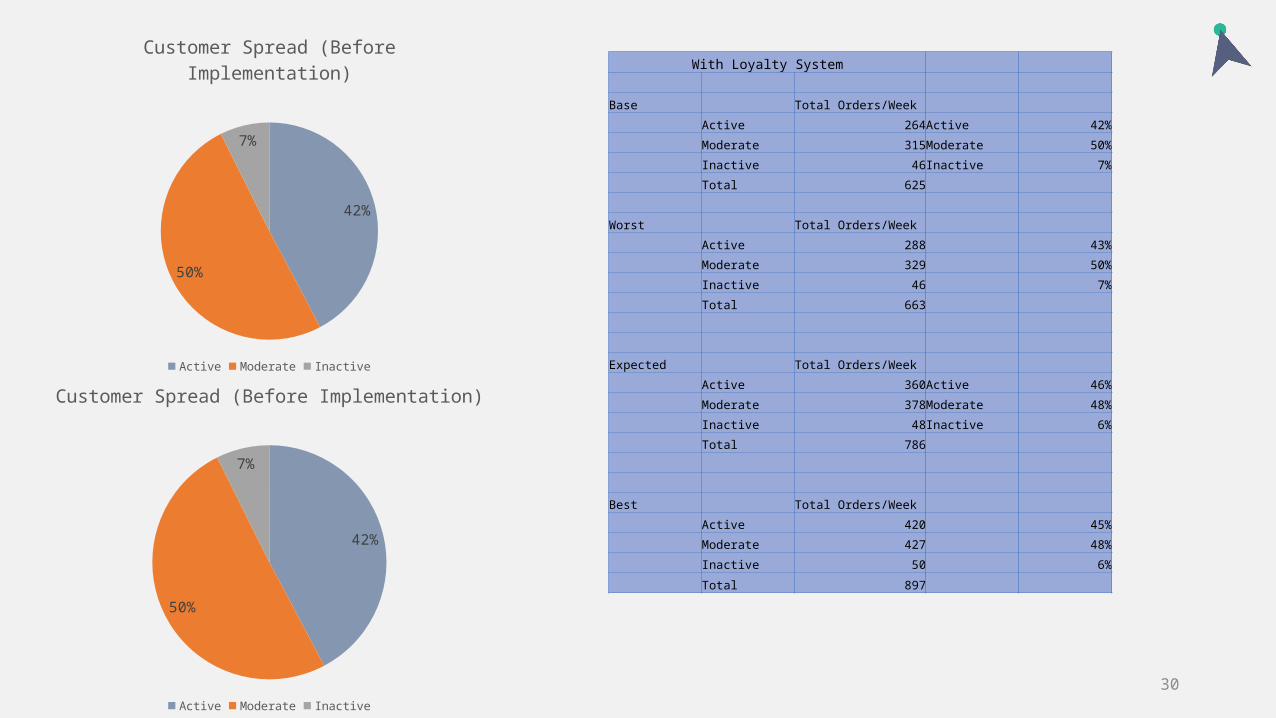
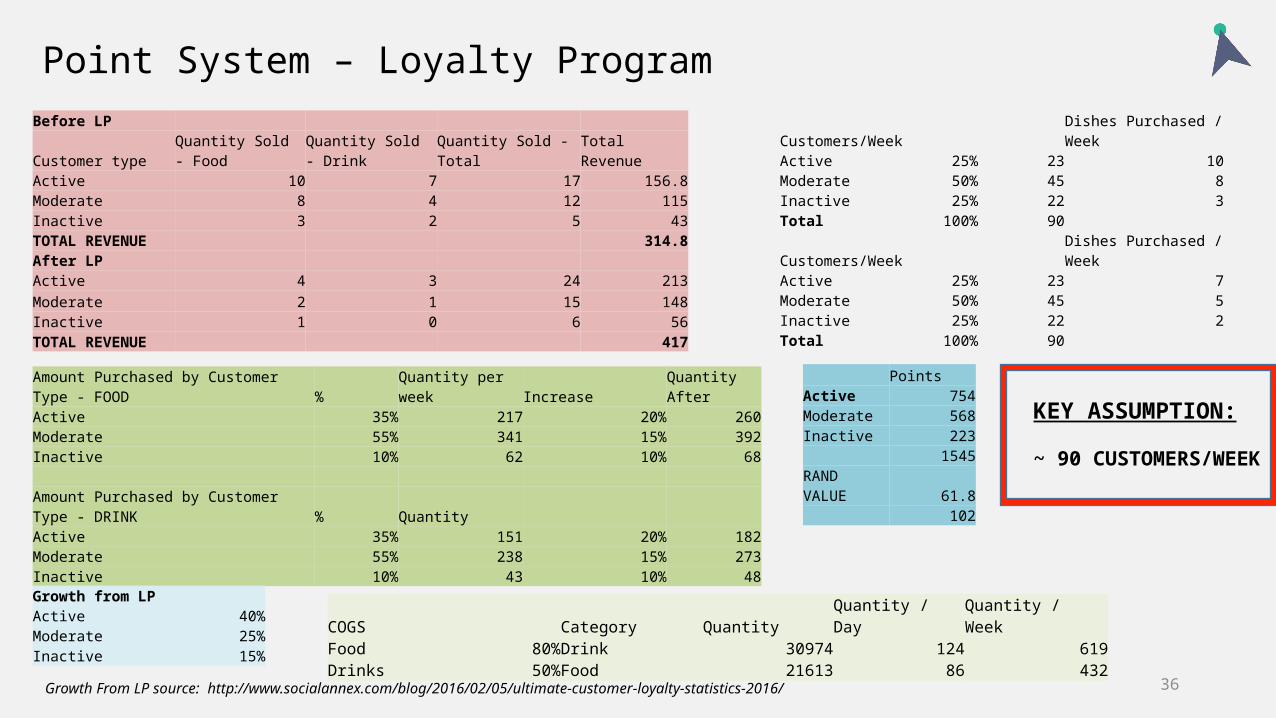
A points system would allow for growth in all three major loyalty program customer divisions – Active, Moderate, and Inactive users
21
Revenue Before Loyalty Program
Revenue After Loyalty Program Implementation
Point System Costs Profit per Customer0
50
100
150
200
250
300
350
400
450
500
314.8 R
+ R120 - R79.8
+ R40.2
Profit per Customer from Point System Implementation
R 40.2 x 90 Customers/week
R 3,618 / Week Profit
Conclusions
22
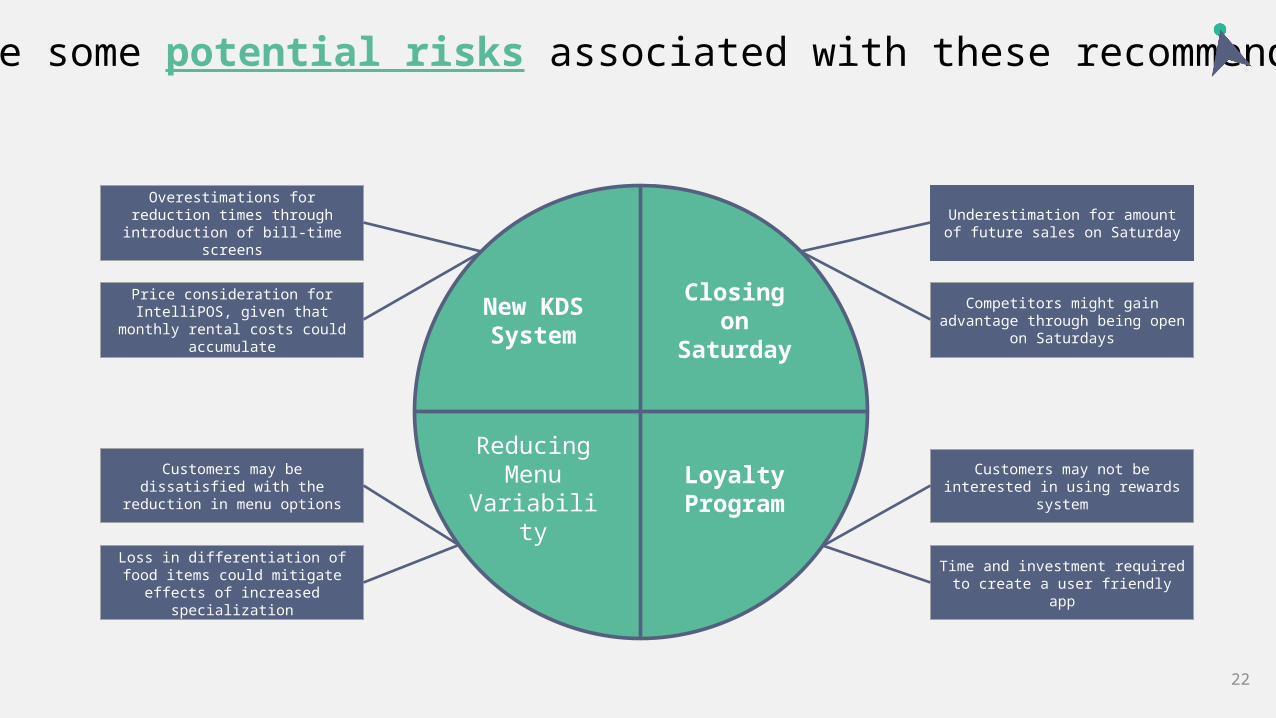
Reducing Menu
Variability
Overestimations for reduction times through introduction of bill-time
screens
Price consideration for IntelliPOS, given that monthly rental costs could
accumulate
Underestimation for amount of future sales on Saturday
Competitors might gain advantage through being open on Saturdays
Customers may be dissatisfied with the reduction in menu options
Loss in differentiation of food items could mitigate effects of increased
specialization
Customers may not be interested in using rewards system
Time and investment required to create a user friendly app
Here are some potential risks associated with these recommendations
New KDS System
Loyalty Program
Closing on Saturday
22

Creating efficiencies and focusing on regulars will deliver a better customer experience and drive sales
24
Create brand platform
Grow Organically by cost-cutting and
refocusing
Decrease wait times via efficiency investments
Menu Engineering Close on Saturdays and scale back after
2PM
Customer Loyalty Program
2
4
6
5
3
1
Customer Experience

Appendix
25
26
1. Full Menu Breakdown
0%
10%
20%
30%
40%
50%
60%
70%
80%
90%
100%
45%
52%
3%
Drink Food Other
3%
57%
7%
28%
5%
Alcohol Coffee Juice Other Tea
14%
53%
8%
21%
4%Total Sales Total Sales: Drinks Total Margin: Drinks*
Drinks make up nearly half of all sales with coffee as the leader in both drinks sales and margins
Drink Analysis
*Based on industry costs
27
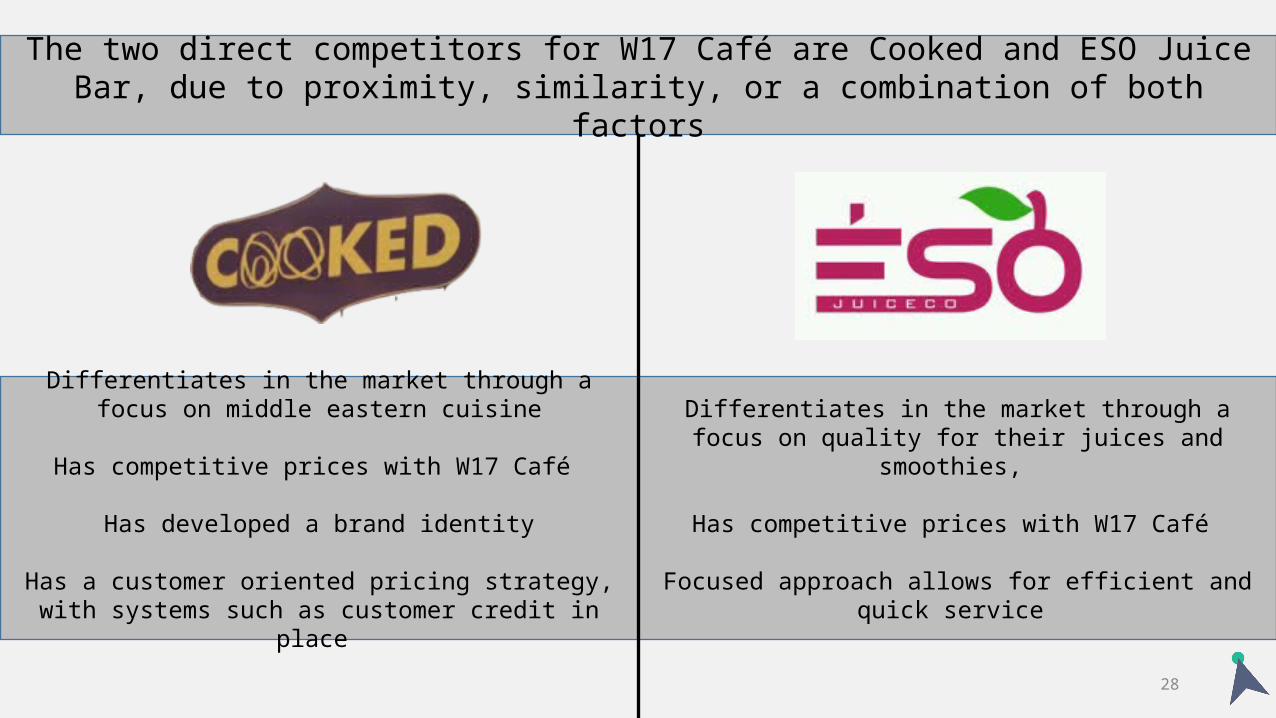
Differentiates in the market through a focus on quality for their juices and smoothies,
Has competitive prices with W17 Café
Focused approach allows for efficient and quick service
Differentiates in the market through a focus on middle eastern cuisine
Has competitive prices with W17 Café
Has developed a brand identity
Has a customer oriented pricing strategy, with systems such as customer credit in place
The two direct competitors for W17 Café are Cooked and ESO Juice Bar, due to proximity, similarity, or a combination of both factors
28
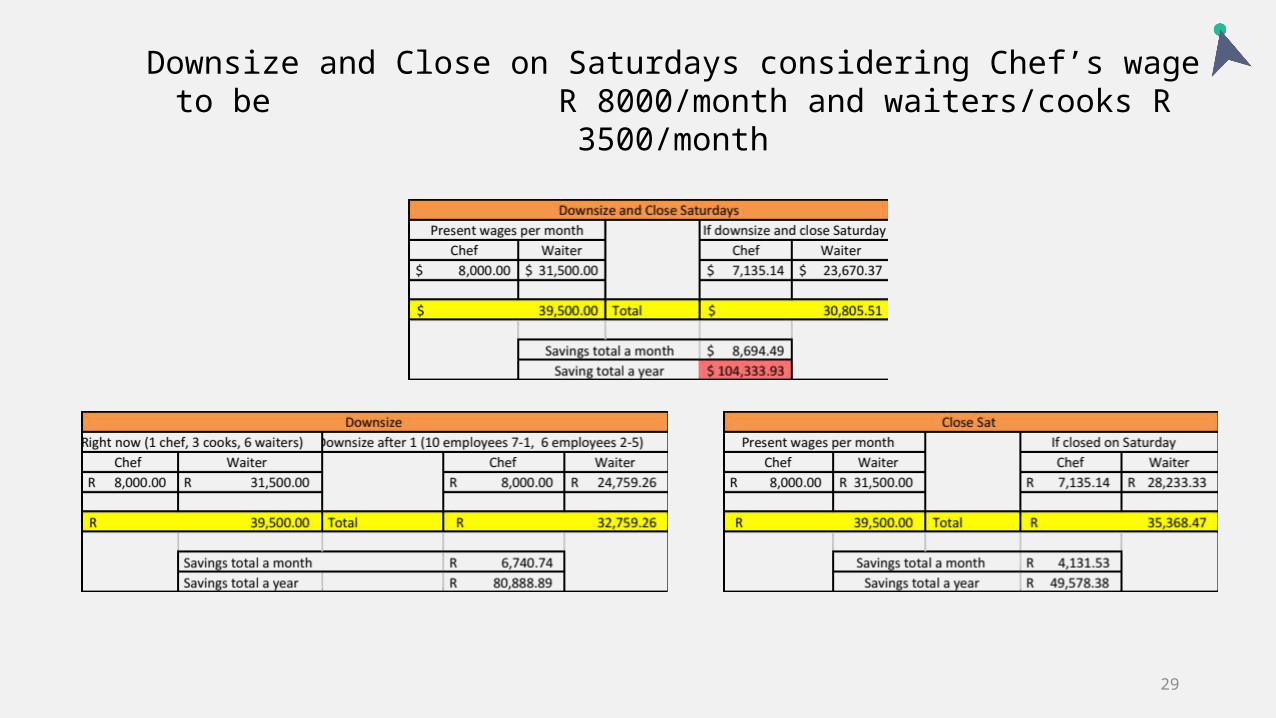
Downsize and Close on Saturdays considering Chef’s wage to be R 8000/month and waiters/cooks R 3500/month
29
42%
50%
7%
Customer Spread (Before Implementation)
Active Moderate Inactive
42%
50%
7%
Customer Spread (Before Implementation)
Active Moderate Inactive
With Loyalty System
Base Total Orders/Week
Active 264Active 42%
Moderate 315Moderate 50%
Inactive 46Inactive 7%
Total 625
Worst Total Orders/Week
Active 288 43%
Moderate 329 50%
Inactive 46 7%
Total 663
Expected Total Orders/Week
Active 360Active 46%
Moderate 378Moderate 48%
Inactive 48Inactive 6%
Total 786
Best Total Orders/Week
Active 420 45%
Moderate 427 48%
Inactive 50 6%
Total 897
30

W17 should use menu-engineering to cut variety and focus on most profitable options.
Drivers:Simplicity, convenience, and
profitability in items
2. Categorize
3. Design and Test Prioritize enhancement opportunities based
on benefit.
3. Design & Test
1. Cost the menu
1. Cost the menuDetermine the costs of every component for
every item
2. CategorizeChoose items based on profit and popularity,
then organize into four quadrants
High
Horse: low profitability and high popularity
Star: high profitability and high popularity
Dog: low profitability and low popularity
Puzzle: high profitability and low popularity
Menu Item Matrix - Definitions
31
Menu Item Matrix
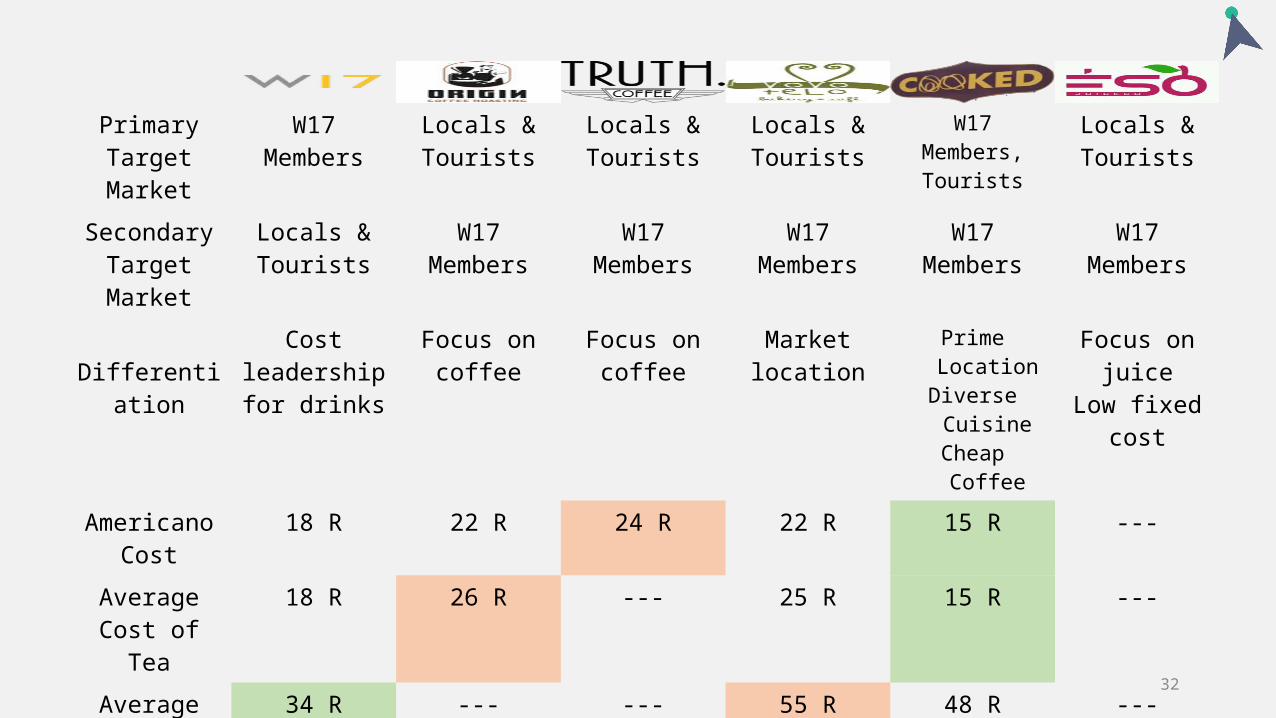
Primary Target Market
W17 Members Locals & Tourists
Locals & Tourists
Locals & Tourists
W17 Members, Tourists
Locals & Tourists
Secondary Target Market
Locals & Tourists
W17 Members W17 Members W17 Members W17 Members W17 Members
DifferentiationCost
leadership for drinks
Focus on coffee
Focus on coffee
Market location
Prime LocationDiverse CuisineCheap Coffee
Focus on juiceLow fixed cost
Americano Cost
18 R 22 R 24 R 22 R 15 R ---
Average Cost of Tea
18 R 26 R --- 25 R 15 R ---
Average Cost of Breakfast
34 R --- --- 55 R 48 R ---
Average Cost of Lunch
36 R --- --- 68 R 55 R ---
32
33
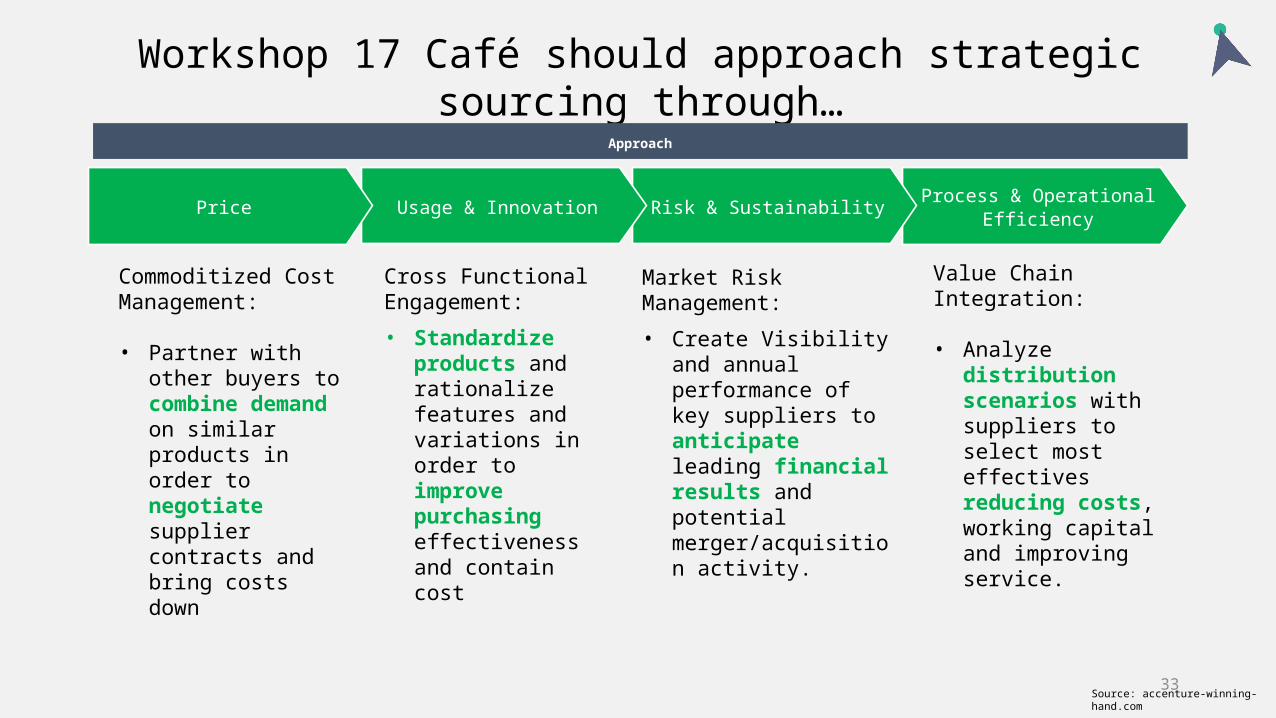
Workshop 17 Café should approach strategic sourcing through…
Market Risk Management:• Create Visibility and
annual performance of key suppliers to anticipate leading financial results and potential merger/acquisition activity.
Value Chain Integration:
• Analyze distribution scenarios with suppliers to select most effectives reducing costs, working capital and improving service.
Commoditized Cost Management:
• Partner with other buyers to combine demand on similar products in order to negotiate supplier contracts and bring costs down
Cross Functional Engagement:• Standardize
products and rationalize features and variations in order to improve purchasing effectiveness and contain cost
Process & Operational EfficiencyRisk & SustainabilityUsage & InnovationPrice
Approach
Source: accenture-winning-hand.com
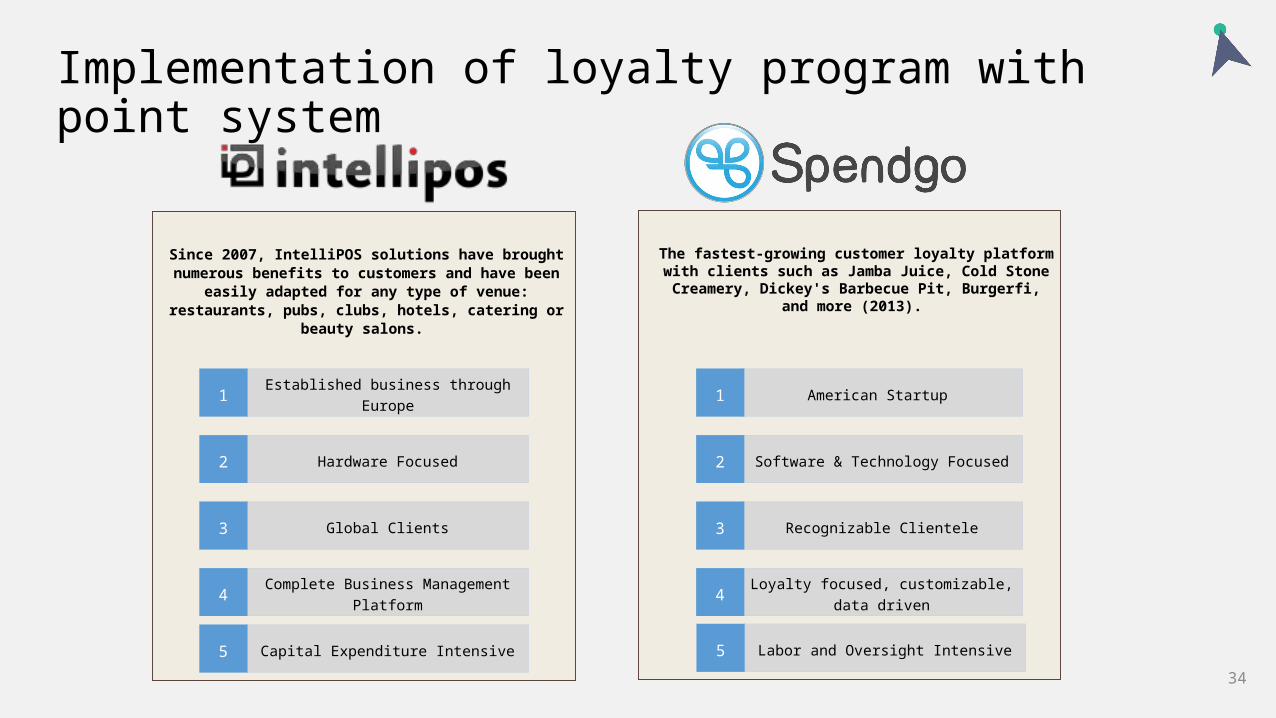
Implementation of loyalty program with point system
Since 2007, IntelliPOS solutions have brought numerous benefits to customers and have been easily adapted for
any type of venue: restaurants, pubs, clubs, hotels, catering or beauty salons.
The fastest-growing customer loyalty platform with clients such as Jamba Juice, Cold Stone Creamery, Dickey's Barbecue Pit, Burgerfi, and more (2013).
American Startup
Software & Technology Focused
Recognizable Clientele
Loyalty focused, customizable, data driven
Established business through Europe
Hardware Focused
Global Clients
Complete Business Management Platform
4
2
3
1
4
2
3
1
Capital Expenditure Intensive5 Labor and Oversight Intensive5
34

35
Strengths Weaknesses
Opportunities Threats
• Location drives convenience for W17 attendees
• Variety of quality options at comparable prices
• Personalized delivery service
• Operational inefficiencies• Long customer wait times• Weak brand identity
Organic growth through:• Brand Identifiably• Operational Efficiencies• Loyalty Programs
• Direct and Indirect Competitors• Dependency on Workshop 17 • Increased regulation
Threat of New Entry
Buyer Power
Rivalry Among Competitors
Threat of Substitutes
Supplier Power Industry State:
Mature
Given the organizational opportunities, inefficiencies, and mature market, W17 café should pursue an organic growth strategy
Internal
External
36
Point System – Loyalty Program Before LP Customer type Quantity Sold - Food Quantity Sold - Drink Quantity Sold - Total Total RevenueActive 10 7 17 156.8Moderate 8 4 12 115Inactive 3 2 5 43TOTAL REVENUE 314.8After LP Active 4 3 24 213Moderate 2 1 15 148Inactive 1 0 6 56TOTAL REVENUE 417
Amount Purchased by Customer Type - FOOD % Quantity per week Increase Quantity AfterActive 35% 217 20% 260Moderate 55% 341 15% 392Inactive 10% 62 10% 68 Amount Purchased by Customer Type - DRINK % Quantity Active 35% 151 20% 182Moderate 55% 238 15% 273Inactive 10% 43 10% 48
Growth from LPActive 40%Moderate 25%Inactive 15%
Customers/Week Dishes Purchased / WeekActive 25% 23 10Moderate 50% 45 8Inactive 25% 22 3Total 100% 90Customers/Week Dishes Purchased / WeekActive 25% 23 7Moderate 50% 45 5Inactive 25% 22 2Total 100% 90
PointsActive 754Moderate 568Inactive 223 1545RAND VALUE 61.8 102
COGS Category Quantity Quantity / Day Quantity / WeekFood 80%Drink 30974 124 619Drinks 50%Food 21613 86 432
KEY ASSUMPTION:
~ 90 CUSTOMERS/WEEK
http://www.socialannex.com/blog/2016/02/05/ultimate-customer-loyalty-statistics-2016/Growth From LP source:
37
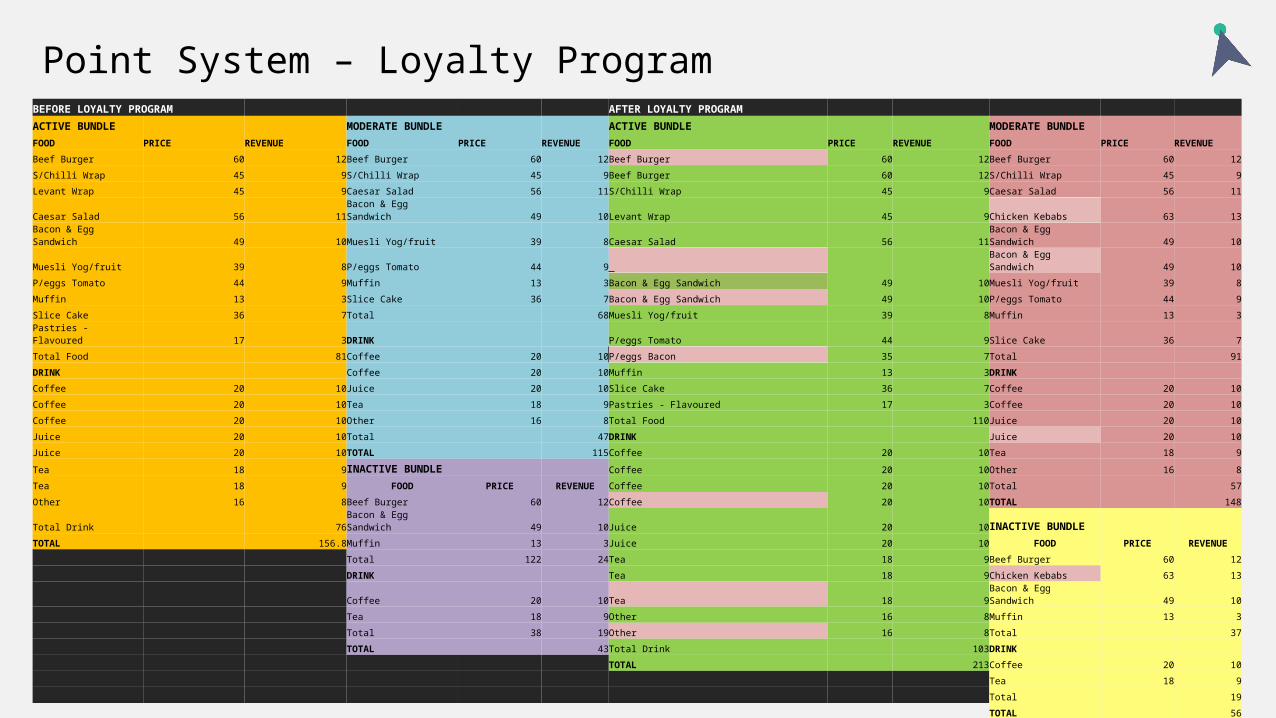
Point System – Loyalty Program BEFORE LOYALTY PROGRAM AFTER LOYALTY PROGRAM
ACTIVE BUNDLE MODERATE BUNDLE ACTIVE BUNDLE MODERATE BUNDLE
FOOD PRICE REVENUE FOOD PRICE REVENUE FOOD PRICE REVENUE FOOD PRICE REVENUE
Beef Burger 60 12Beef Burger 60 12Beef Burger 60 12Beef Burger 60 12
S/Chilli Wrap 45 9S/Chilli Wrap 45 9Beef Burger 60 12S/Chilli Wrap 45 9
Levant Wrap 45 9Caesar Salad 56 11S/Chilli Wrap 45 9Caesar Salad 56 11
Caesar Salad 56 11Bacon & Egg Sandwich 49 10Levant Wrap 45 9Chicken Kebabs 63 13
Bacon & Egg Sandwich 49 10Muesli Yog/fruit 39 8Caesar Salad 56 11Bacon & Egg Sandwich 49 10
Muesli Yog/fruit 39 8P/eggs Tomato 44 9 Bacon & Egg Sandwich 49 10
P/eggs Tomato 44 9Muffin 13 3Bacon & Egg Sandwich 49 10Muesli Yog/fruit 39 8
Muffin 13 3Slice Cake 36 7Bacon & Egg Sandwich 49 10P/eggs Tomato 44 9
Slice Cake 36 7Total 68Muesli Yog/fruit 39 8Muffin 13 3
Pastries - Flavoured 17 3DRINK P/eggs Tomato 44 9Slice Cake 36 7
Total Food 81Coffee 20 10P/eggs Bacon 35 7Total 91
DRINK Coffee 20 10Muffin 13 3DRINK
Coffee 20 10Juice 20 10Slice Cake 36 7Coffee 20 10
Coffee 20 10Tea 18 9Pastries - Flavoured 17 3Coffee 20 10
Coffee 20 10Other 16 8Total Food 110Juice 20 10
Juice 20 10Total 47DRINK Juice 20 10
Juice 20 10TOTAL 115Coffee 20 10Tea 18 9
Tea 18 9INACTIVE BUNDLE Coffee 20 10Other 16 8
Tea 18 9 FOOD PRICE REVENUE Coffee 20 10Total 57
Other 16 8Beef Burger 60 12Coffee 20 10TOTAL 148
Total Drink 76Bacon & Egg Sandwich 49 10Juice 20 10INACTIVE BUNDLE
TOTAL 156.8Muffin 13 3Juice 20 10 FOOD PRICE REVENUE
Total 122 24Tea 18 9Beef Burger 60 12
DRINK Tea 18 9Chicken Kebabs 63 13
Coffee 20 10Tea 18 9Bacon & Egg Sandwich 49 10
Tea 18 9Other 16 8Muffin 13 3
Total 38 19Other 16 8Total 37
TOTAL 43Total Drink 103DRINK
TOTAL 213Coffee 20 10
Tea 18 9
Total 19
TOTAL 56