walgett shire council 10 year financial plan for the years
TRANSCRIPT
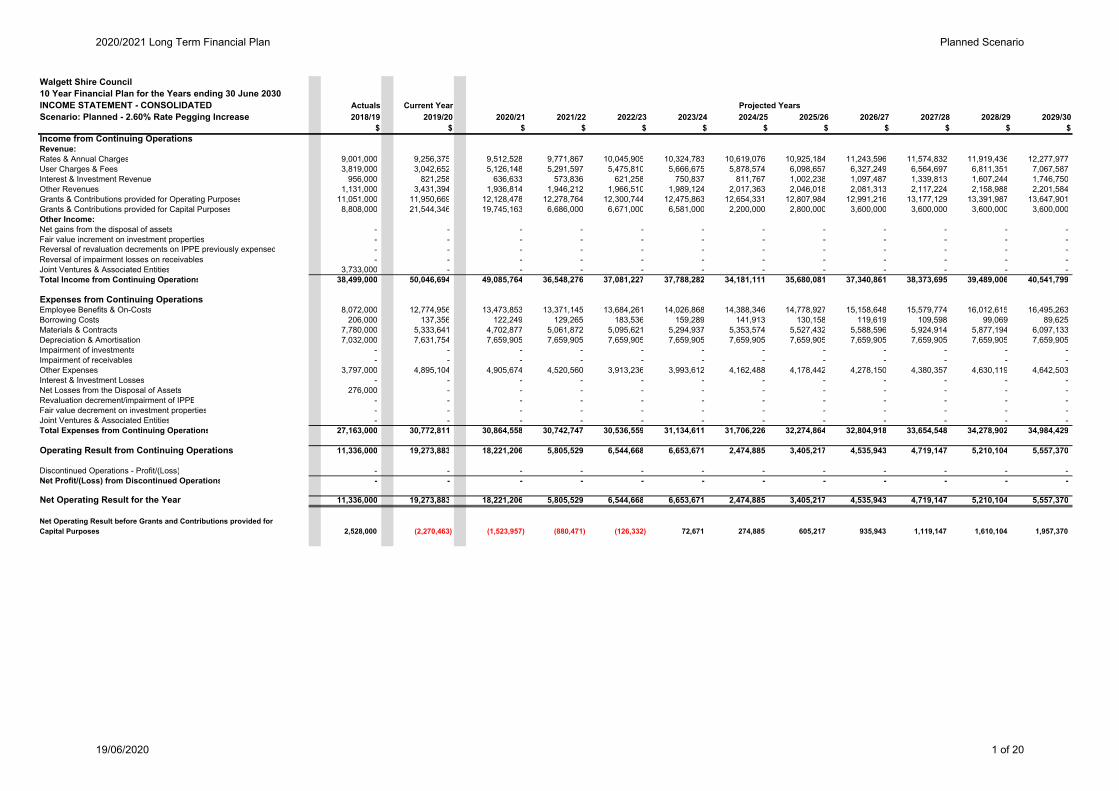
Walgett Shire Council10 Year Financial Plan for the Years ending 30 June 2030INCOME STATEMENT - CONSOLIDATED Actuals Current YearScenario: Planned - 2.60% Rate Pegging Increase 2018/19 2019/20 2020/21 2021/22 2022/23 2023/24 2024/25 2025/26 2026/27 2027/28 2028/29 2029/30
$ $ $ $ $ $ $ $ $ $ $ $Income from Continuing OperationsRevenue:Rates & Annual Charges 9,001,000 9,256,375 9,512,528 9,771,867 10,045,905 10,324,783 10,619,076 10,925,184 11,243,596 11,574,832 11,919,436 12,277,977 User Charges & Fees 3,819,000 3,042,652 5,126,148 5,291,597 5,475,810 5,666,675 5,878,574 6,098,657 6,327,249 6,564,697 6,811,351 7,067,587 Interest & Investment Revenue 956,000 821,258 636,633 573,836 621,258 750,837 811,767 1,002,238 1,097,487 1,339,813 1,607,244 1,746,750 Other Revenues 1,131,000 3,431,394 1,936,814 1,946,212 1,966,510 1,989,124 2,017,363 2,046,018 2,081,313 2,117,224 2,158,988 2,201,584 Grants & Contributions provided for Operating Purposes 11,051,000 11,950,669 12,128,478 12,278,764 12,300,744 12,475,863 12,654,331 12,807,984 12,991,216 13,177,129 13,391,987 13,647,901 Grants & Contributions provided for Capital Purposes 8,808,000 21,544,346 19,745,163 6,686,000 6,671,000 6,581,000 2,200,000 2,800,000 3,600,000 3,600,000 3,600,000 3,600,000 Other Income:Net gains from the disposal of assets - - - - - - - - - - - - Fair value increment on investment properties - - - - - - - - - - - - Reversal of revaluation decrements on IPPE previously expensed - - - - - - - - - - - - Reversal of impairment losses on receivables - - - - - - - - - - - - Joint Ventures & Associated Entities 3,733,000 - - - - - - - - - - - Total Income from Continuing Operations 38,499,000 50,046,694 49,085,764 36,548,276 37,081,227 37,788,282 34,181,111 35,680,081 37,340,861 38,373,695 39,489,006 40,541,799
Expenses from Continuing OperationsEmployee Benefits & On-Costs 8,072,000 12,774,956 13,473,853 13,371,145 13,684,261 14,026,868 14,388,346 14,778,927 15,158,648 15,579,774 16,012,615 16,495,263 Borrowing Costs 206,000 137,356 122,249 129,265 183,536 159,289 141,913 130,158 119,619 109,598 99,069 89,625 Materials & Contracts 7,780,000 5,333,641 4,702,877 5,061,872 5,095,621 5,294,937 5,353,574 5,527,432 5,588,596 5,924,914 5,877,194 6,097,133 Depreciation & Amortisation 7,032,000 7,631,754 7,659,905 7,659,905 7,659,905 7,659,905 7,659,905 7,659,905 7,659,905 7,659,905 7,659,905 7,659,905 Impairment of investments - - - - - - - - - - - - Impairment of receivables - - - - - - - - - - - - Other Expenses 3,797,000 4,895,104 4,905,674 4,520,560 3,913,236 3,993,612 4,162,488 4,178,442 4,278,150 4,380,357 4,630,119 4,642,503 Interest & Investment Losses - - - - - - - - - - - - Net Losses from the Disposal of Assets 276,000 - - - - - - - - - - - Revaluation decrement/impairment of IPPE - - - - - - - - - - - - Fair value decrement on investment properties - - - - - - - - - - - - Joint Ventures & Associated Entities - - - - - - - - - - - - Total Expenses from Continuing Operations 27,163,000 30,772,811 30,864,558 30,742,747 30,536,559 31,134,611 31,706,226 32,274,864 32,804,918 33,654,548 34,278,902 34,984,429
Operating Result from Continuing Operations 11,336,000 19,273,883 18,221,206 5,805,529 6,544,668 6,653,671 2,474,885 3,405,217 4,535,943 4,719,147 5,210,104 5,557,370
Discontinued Operations - Profit/(Loss) - - - - - - - - - - - - Net Profit/(Loss) from Discontinued Operations - - - - - - - - - - - -
Net Operating Result for the Year 11,336,000 19,273,883 18,221,206 5,805,529 6,544,668 6,653,671 2,474,885 3,405,217 4,535,943 4,719,147 5,210,104 5,557,370
Net Operating Result before Grants and Contributions provided for Capital Purposes 2,528,000 (2,270,463) (1,523,957) (880,471) (126,332) 72,671 274,885 605,217 935,943 1,119,147 1,610,104 1,957,370
Projected Years
2020/2021 Long Term Financial Plan Planned Scenario
19/06/2020 1 of 20
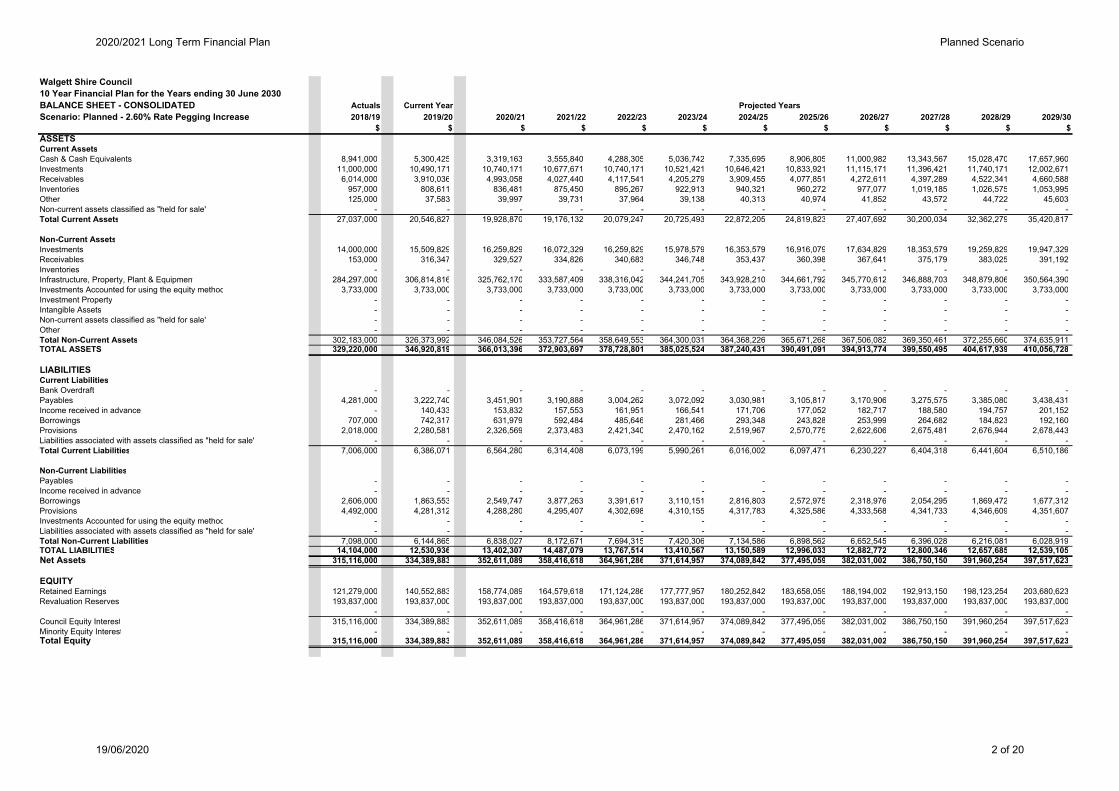
Walgett Shire Council10 Year Financial Plan for the Years ending 30 June 2030BALANCE SHEET - CONSOLIDATED Actuals Current YearScenario: Planned - 2.60% Rate Pegging Increase 2018/19 2019/20 2020/21 2021/22 2022/23 2023/24 2024/25 2025/26 2026/27 2027/28 2028/29 2029/30
$ $ $ $ $ $ $ $ $ $ $ $ASSETSCurrent AssetsCash & Cash Equivalents 8,941,000 5,300,425 3,319,163 3,555,840 4,288,305 5,036,742 7,335,695 8,906,805 11,000,982 13,343,567 15,028,470 17,657,960 Investments 11,000,000 10,490,171 10,740,171 10,677,671 10,740,171 10,521,421 10,646,421 10,833,921 11,115,171 11,396,421 11,740,171 12,002,671 Receivables 6,014,000 3,910,036 4,993,058 4,027,440 4,117,541 4,205,279 3,909,455 4,077,851 4,272,611 4,397,289 4,522,341 4,660,588 Inventories 957,000 808,611 836,481 875,450 895,267 922,913 940,321 960,272 977,077 1,019,185 1,026,575 1,053,995 Other 125,000 37,583 39,997 39,731 37,964 39,138 40,313 40,974 41,852 43,572 44,722 45,603 Non-current assets classified as "held for sale" - - - - - - - - - - - - Total Current Assets 27,037,000 20,546,827 19,928,870 19,176,132 20,079,247 20,725,493 22,872,205 24,819,823 27,407,692 30,200,034 32,362,279 35,420,817
Non-Current AssetsInvestments 14,000,000 15,509,829 16,259,829 16,072,329 16,259,829 15,978,579 16,353,579 16,916,079 17,634,829 18,353,579 19,259,829 19,947,329 Receivables 153,000 316,347 329,527 334,826 340,683 346,748 353,437 360,398 367,641 375,179 383,025 391,192 Inventories - - - - - - - - - - - - Infrastructure, Property, Plant & Equipment 284,297,000 306,814,816 325,762,170 333,587,409 338,316,042 344,241,705 343,928,210 344,661,792 345,770,612 346,888,703 348,879,806 350,564,390 Investments Accounted for using the equity method 3,733,000 3,733,000 3,733,000 3,733,000 3,733,000 3,733,000 3,733,000 3,733,000 3,733,000 3,733,000 3,733,000 3,733,000 Investment Property - - - - - - - - - - - - Intangible Assets - - - - - - - - - - - - Non-current assets classified as "held for sale" - - - - - - - - - - - - Other - - - - - - - - - - - - Total Non-Current Assets 302,183,000 326,373,992 346,084,526 353,727,564 358,649,553 364,300,031 364,368,226 365,671,268 367,506,082 369,350,461 372,255,660 374,635,911 TOTAL ASSETS 329,220,000 346,920,819 366,013,396 372,903,697 378,728,801 385,025,524 387,240,431 390,491,091 394,913,774 399,550,495 404,617,939 410,056,728
LIABILITIESCurrent LiabilitiesBank Overdraft - - - - - - - - - - - - Payables 4,281,000 3,222,740 3,451,901 3,190,888 3,004,262 3,072,092 3,030,981 3,105,817 3,170,906 3,275,575 3,385,080 3,438,431 Income received in advance - 140,433 153,832 157,553 161,951 166,541 171,706 177,052 182,717 188,580 194,757 201,152 Borrowings 707,000 742,317 631,979 592,484 485,646 281,466 293,348 243,828 253,999 264,682 184,823 192,160 Provisions 2,018,000 2,280,581 2,326,569 2,373,483 2,421,340 2,470,162 2,519,967 2,570,775 2,622,606 2,675,481 2,676,944 2,678,443 Liabilities associated with assets classified as "held for sale" - - - - - - - - - - - - Total Current Liabilities 7,006,000 6,386,071 6,564,280 6,314,408 6,073,199 5,990,261 6,016,002 6,097,471 6,230,227 6,404,318 6,441,604 6,510,186
Non-Current LiabilitiesPayables - - - - - - - - - - - - Income received in advance - - - - - - - - - - - - Borrowings 2,606,000 1,863,553 2,549,747 3,877,263 3,391,617 3,110,151 2,816,803 2,572,975 2,318,976 2,054,295 1,869,472 1,677,312 Provisions 4,492,000 4,281,312 4,288,280 4,295,407 4,302,698 4,310,155 4,317,783 4,325,586 4,333,568 4,341,733 4,346,609 4,351,607 Investments Accounted for using the equity method - - - - - - - - - - - - Liabilities associated with assets classified as "held for sale" - - - - - - - - - - - - Total Non-Current Liabilities 7,098,000 6,144,865 6,838,027 8,172,671 7,694,315 7,420,306 7,134,586 6,898,562 6,652,545 6,396,028 6,216,081 6,028,919 TOTAL LIABILITIES 14,104,000 12,530,936 13,402,307 14,487,079 13,767,514 13,410,567 13,150,589 12,996,033 12,882,772 12,800,346 12,657,685 12,539,105 Net Assets 315,116,000 334,389,883 352,611,089 358,416,618 364,961,286 371,614,957 374,089,842 377,495,059 382,031,002 386,750,150 391,960,254 397,517,623
EQUITYRetained Earnings 121,279,000 140,552,883 158,774,089 164,579,618 171,124,286 177,777,957 180,252,842 183,658,059 188,194,002 192,913,150 198,123,254 203,680,623 Revaluation Reserves 193,837,000 193,837,000 193,837,000 193,837,000 193,837,000 193,837,000 193,837,000 193,837,000 193,837,000 193,837,000 193,837,000 193,837,000
- - - - - - - - - - - - Council Equity Interest 315,116,000 334,389,883 352,611,089 358,416,618 364,961,286 371,614,957 374,089,842 377,495,059 382,031,002 386,750,150 391,960,254 397,517,623 Minority Equity Interest - - - - - - - - - - - - Total Equity 315,116,000 334,389,883 352,611,089 358,416,618 364,961,286 371,614,957 374,089,842 377,495,059 382,031,002 386,750,150 391,960,254 397,517,623
Projected Years
2020/2021 Long Term Financial Plan Planned Scenario
19/06/2020 2 of 20

Walgett Shire Council10 Year Financial Plan for the Years ending 30 June 2030CASH FLOW STATEMENT - CONSOLIDATED Actuals Current YearScenario: Planned - 2.60% Rate Pegging Increase 2018/19 2019/20 2020/21 2021/22 2022/23 2023/24 2024/25 2025/26 2026/27 2027/28 2028/29 2029/30
$ $ $ $ $ $ $ $ $ $ $ $Cash Flows from Operating ActivitiesReceipts:Rates & Annual Charges 9,148,000 9,037,767 9,484,765 9,743,598 10,015,476 10,293,660 10,585,617 10,890,444 11,207,525 11,537,376 11,880,540 12,237,584 User Charges & Fees 4,060,000 3,195,835 4,730,052 5,257,849 5,438,267 5,627,723 5,835,356 6,053,707 6,280,495 6,516,063 6,760,759 7,014,953 Interest & Investment Revenue Received 816,000 862,375 608,842 588,232 600,390 735,945 790,099 977,402 1,070,424 1,312,118 1,584,996 1,718,367 Grants & Contributions 16,818,000 35,201,645 31,274,033 19,908,079 18,966,022 19,049,573 15,217,765 15,542,881 16,506,274 16,761,129 16,973,496 17,225,862 Bonds & Deposits Received 19,000 - - - - - - - - - - - Other 2,579,000 3,830,122 1,905,271 2,014,557 1,969,513 1,992,168 2,046,573 2,045,636 2,079,805 2,120,655 2,162,494 2,205,015 Payments:Employee Benefits & On-Costs (8,563,000) (12,525,268) (13,419,728) (13,312,463) (13,624,381) (13,964,606) (14,324,780) (14,714,030) (15,091,144) (15,510,817) (15,998,126) (16,479,022) Materials & Contracts (7,818,000) (5,396,278) (4,673,369) (5,147,119) (5,237,822) (5,266,201) (5,303,883) (5,514,996) (5,555,184) (5,887,548) (5,807,597) (6,083,092) Borrowing Costs (177,000) (133,753) (117,684) (118,053) (180,504) (155,642) (137,217) (125,365) (114,453) (104,320) (93,676) (83,715) Bonds & Deposits Refunded (17,000) - - - - - - - - - - - Other (4,062,000) (4,883,258) (4,904,335) (4,520,707) (3,914,216) (3,992,961) (4,161,836) (4,178,075) (4,277,663) (4,379,403) (4,629,481) (4,642,014)
Net Cash provided (or used in) Operating Activities 12,803,000 29,189,186 24,887,845 14,413,973 14,032,744 14,319,659 10,547,694 10,977,605 12,106,078 12,365,254 12,833,403 13,113,938
Cash Flows from Investing ActivitiesReceipts:Sale of Investment Securities 71,500,000 1,000,000 - 250,000 - 750,000 - - - - - - Sale of Investment Property - - - - - - - - - - - - Sale of Real Estate Assets - - - - - - - - - - - - Sale of Infrastructure, Property, Plant & Equipment 194,000 437,000 1,595,614 650,500 388,000 481,400 448,500 638,500 298,002 675,004 507,006 614,511 Sale of non-current assets classified as "held for sale" - - - - - - - - - - - - Sale of Interests in Joint Ventures & Associates - - - - - - - - - - - - Sale of Intangible Assets - - - - - - - - - - - - Deferred Debtors Receipts 30,000 - - - - - - - - - - - Sale of Disposal Groups - - - - - - - - - - - - Distributions Received from Joint Ventures & Associates - - - - - - - - - - - - Other Investing Activity Receipts - - - - - - - - - - - - Payments:Purchase of Investment Securities (81,500,000) (2,000,000) (1,000,000) - (250,000) (250,000) (500,000) (750,000) (1,000,000) (1,000,000) (1,250,000) (950,000) Purchase of Investment Property - - - - - - - - - - - - Purchase of Infrastructure, Property, Plant & Equipment (12,845,000) (31,559,631) (28,040,577) (16,365,818) (12,845,796) (14,066,975) (7,915,775) (9,001,646) (9,066,076) (9,443,675) (10,140,825) (9,964,136) Purchase of Real Estate Assets - - - - - - - - - - - - Purchase of Intangible Assets - - - - - - - - - - - - Deferred Debtors & Advances Made - - - - - - - - - - - - Purchase of Interests in Joint Ventures & Associates - - - - - - - - - - - - Contributions Paid to Joint Ventures & Associates - - - - - - - - - - - - Other Investing Activity Payments - - - - - - - - - - - -
Net Cash provided (or used in) Investing Activities (22,621,000) (32,122,631) (27,444,963) (15,465,318) (12,707,796) (13,085,575) (7,967,275) (9,113,146) (9,768,074) (9,768,671) (10,883,819) (10,299,625)
Cash Flows from Financing ActivitiesReceipts:Proceeds from Borrowings & Advances - - 1,348,228 1,920,000 - - - - - - - - Proceeds from Finance Leases - - - - - - - - - - - - Other Financing Activity Receipts - - - - - - - - - - - - Payments:Repayment of Borrowings & Advances (683,000) (707,130) (772,372) (631,979) (592,484) (485,646) (281,466) (293,348) (243,828) (253,999) (264,682) (184,823) Repayment of Finance Lease Liabilities - - - - - - - - - - - - Distributions to Minority Interests - - - - - - - - - - - - Other Financing Activity Payments - - - - - - - - - - - -
Net Cash Flow provided (used in) Financing Activities (683,000) (707,130) 575,856 1,288,021 (592,484) (485,646) (281,466) (293,348) (243,828) (253,999) (264,682) (184,823)
Net Increase/(Decrease) in Cash & Cash Equivalents (10,501,000) (3,640,575) (1,981,262) 236,677 732,464 748,437 2,298,953 1,571,110 2,094,177 2,342,585 1,684,903 2,629,490
plus: Cash, Cash Equivalents & Investments - beginning of year 19,442,000 8,941,000 5,300,425 3,319,163 3,555,840 4,288,305 5,036,742 7,335,695 8,906,805 11,000,982 13,343,567 15,028,470
Cash & Cash Equivalents - end of the year 8,941,000 5,300,425 3,319,163 3,555,840 4,288,305 5,036,742 7,335,695 8,906,805 11,000,982 13,343,567 15,028,470 17,657,960
Cash & Cash Equivalents - end of the year 8,941,000 5,300,425 3,319,163 3,555,840 4,288,305 5,036,742 7,335,695 8,906,805 11,000,982 13,343,567 15,028,470 17,657,960 Investments - end of the year 25,000,000 26,000,000 27,000,000 26,750,000 27,000,000 26,500,000 27,000,000 27,750,000 28,750,000 29,750,000 31,000,000 31,950,000 Cash, Cash Equivalents & Investments - end of the year 33,941,000 31,300,425 30,319,163 30,305,840 31,288,305 31,536,742 34,335,695 36,656,805 39,750,982 43,093,567 46,028,470 49,607,960
Representing:- External Restrictions 27,487,773 24,313,364 23,076,796 22,729,948 23,032,417 22,387,582 22,985,808 23,665,391 24,462,674 25,371,977 26,474,710 27,659,176 - Internal Restrictions 12,429,144 12,101,675 12,294,189 10,591,911 10,353,595 10,192,895 10,596,016 11,434,362 11,860,940 12,224,254 11,692,570 11,453,891 - Unrestricted (5,975,917) (5,114,615) (5,051,822) (3,016,019) (2,097,708) (1,043,735) 753,870 1,557,052 3,427,368 5,497,335 7,861,190 10,494,893
33,941,000 31,300,425 30,319,163 30,305,840 31,288,305 31,536,742 34,335,695 36,656,805 39,750,982 43,093,567 46,028,470 49,607,960
Projected Years
2020/2021 Long Term Financial Plan Planned Scenario
19/06/2020 3 of 20

Walgett Shire Council10 Year Financial Plan for the Years ending 30 June 2030EQUITY STATEMENT - CONSOLIDATED Actuals Current YearScenario: Planned - 2.60% Rate Pegging Increase 2018/19 2019/20 2020/21 2021/22 2022/23 2023/24 2024/25 2025/26 2026/27 2027/28 2028/29 2029/30
$ $ $ $ $ $ $ $ $ $ $ $
Opening Balance 300,313,000 315,116,000 334,389,883 352,611,089 358,416,618 364,961,286 371,614,957 374,089,842 377,495,059 382,031,002 386,750,150 391,960,254 Adjustments to opening balance - - Restated Opening Balance 300,313,000 315,116,000 334,389,883 352,611,089 358,416,618 364,961,286 371,614,957 374,089,842 377,495,059 382,031,002 386,750,150 391,960,254
Net Operating Result for the Year 11,336,000 19,273,883 18,221,206 5,805,529 6,544,668 6,653,671 2,474,885 3,405,217 4,535,943 4,719,147 5,210,104 5,557,370 Adjustments to net operating result - - - - - - - - - - - - Restated Net Operating Result for the Year 11,336,000 19,273,883 18,221,206 5,805,529 6,544,668 6,653,671 2,474,885 3,405,217 4,535,943 4,719,147 5,210,104 5,557,370
Current Year Income & Expenses Recognised direct to Equity- Transfers to/(from) Asset Revaluation Reserve 3,467,000 - - - - - - - - - - - - Transfers to/(from) Other Reserves - - - - - - - - - - - - - Other Income/Expenses recognised - - - - - - - - - - - - - Other Adjustments - - - - - - - - - - - - Net Income Recognised Directly in Equity 3,467,000 - - - - - - - - - - -
Total Recognised Income & Expenses 14,803,000 19,273,883 18,221,206 5,805,529 6,544,668 6,653,671 2,474,885 3,405,217 4,535,943 4,719,147 5,210,104 5,557,370
Distributions to/(Contributions from) Minority Interests - - - - - - - - - - - - Transfers between Equity - - - - - - - - - - - -
Equity - Balance at end of the reporting period 315,116,000 334,389,883 352,611,089 358,416,618 364,961,286 371,614,957 374,089,842 377,495,059 382,031,002 386,750,150 391,960,254 397,517,623
Projected Years
2020/2021 Long Term Financial Plan Planned Scenario
19/06/2020 4 of 20
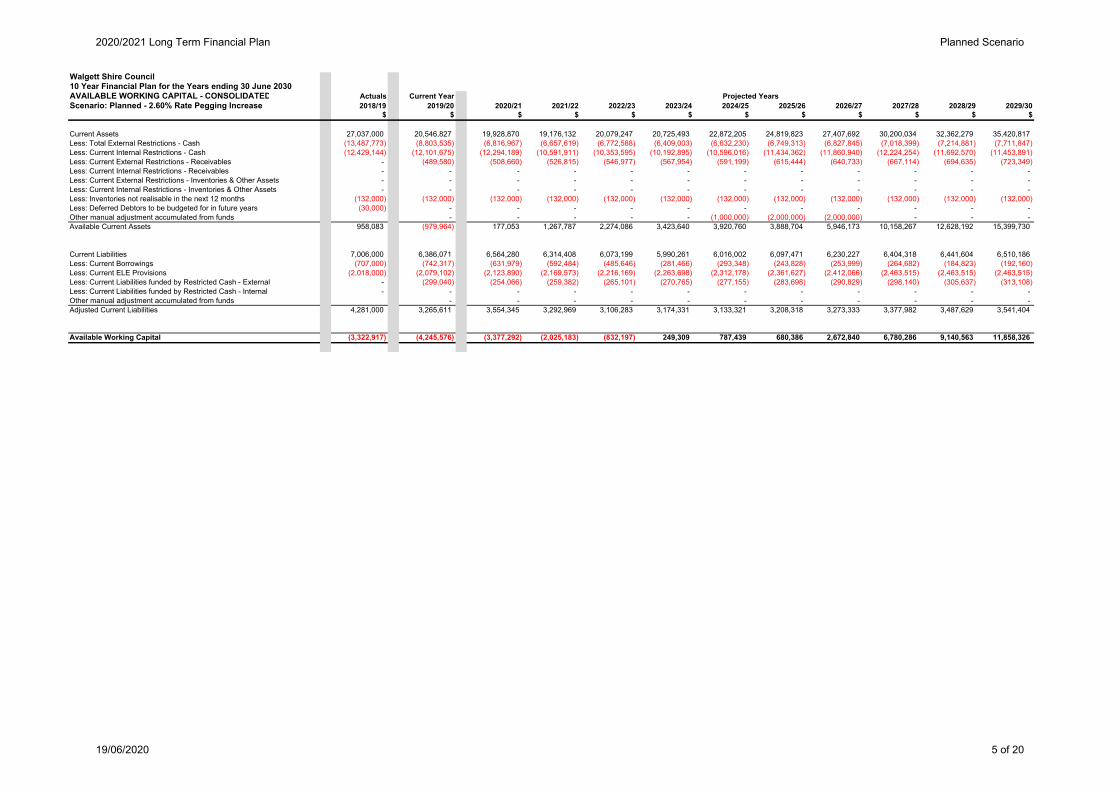
Walgett Shire Council10 Year Financial Plan for the Years ending 30 June 2030AVAILABLE WORKING CAPITAL - CONSOLIDATED Actuals Current YearScenario: Planned - 2.60% Rate Pegging Increase 2018/19 2019/20 2020/21 2021/22 2022/23 2023/24 2024/25 2025/26 2026/27 2027/28 2028/29 2029/30
$ $ $ $ $ $ $ $ $ $ $ $
Current Assets 27,037,000 20,546,827 19,928,870 19,176,132 20,079,247 20,725,493 22,872,205 24,819,823 27,407,692 30,200,034 32,362,279 35,420,817 Less: Total External Restrictions - Cash (13,487,773) (8,803,535) (6,816,967) (6,657,619) (6,772,588) (6,409,003) (6,632,230) (6,749,313) (6,827,845) (7,018,399) (7,214,881) (7,711,847) Less: Current Internal Restrictions - Cash (12,429,144) (12,101,675) (12,294,189) (10,591,911) (10,353,595) (10,192,895) (10,596,016) (11,434,362) (11,860,940) (12,224,254) (11,692,570) (11,453,891) Less: Current External Restrictions - Receivables - (489,580) (508,660) (526,815) (546,977) (567,954) (591,199) (615,444) (640,733) (667,114) (694,635) (723,349) Less: Current Internal Restrictions - Receivables - - - - - - - - - - - - Less: Current External Restrictions - Inventories & Other Assets - - - - - - - - - - - - Less: Current Internal Restrictions - Inventories & Other Assets - - - - - - - - - - - - Less: Inventories not realisable in the next 12 months (132,000) (132,000) (132,000) (132,000) (132,000) (132,000) (132,000) (132,000) (132,000) (132,000) (132,000) (132,000) Less: Deferred Debtors to be budgeted for in future years (30,000) - - - - - - - - - - - Other manual adjustment accumulated from funds - - - - - (1,000,000) (2,000,000) (2,000,000) - - - Available Current Assets 958,083 (979,964) 177,053 1,267,787 2,274,086 3,423,640 3,920,760 3,888,704 5,946,173 10,158,267 12,628,192 15,399,730
Current Liabilities 7,006,000 6,386,071 6,564,280 6,314,408 6,073,199 5,990,261 6,016,002 6,097,471 6,230,227 6,404,318 6,441,604 6,510,186 Less: Current Borrowings (707,000) (742,317) (631,979) (592,484) (485,646) (281,466) (293,348) (243,828) (253,999) (264,682) (184,823) (192,160) Less: Current ELE Provisions (2,018,000) (2,079,102) (2,123,890) (2,169,573) (2,216,169) (2,263,698) (2,312,178) (2,361,627) (2,412,066) (2,463,515) (2,463,515) (2,463,515) Less: Current Liabilities funded by Restricted Cash - External - (299,040) (254,066) (259,382) (265,101) (270,765) (277,155) (283,698) (290,829) (298,140) (305,637) (313,108) Less: Current Liabilities funded by Restricted Cash - Internal - - - - - - - - - - - - Other manual adjustment accumulated from funds - - - - - - - - - - - Adjusted Current Liabilities 4,281,000 3,265,611 3,554,345 3,292,969 3,106,283 3,174,331 3,133,321 3,208,318 3,273,333 3,377,982 3,487,629 3,541,404
Available Working Capital (3,322,917) (4,245,576) (3,377,292) (2,025,183) (832,197) 249,309 787,439 680,386 2,672,840 6,780,286 9,140,563 11,858,326
Projected Years
2020/2021 Long Term Financial Plan Planned Scenario
19/06/2020 5 of 20
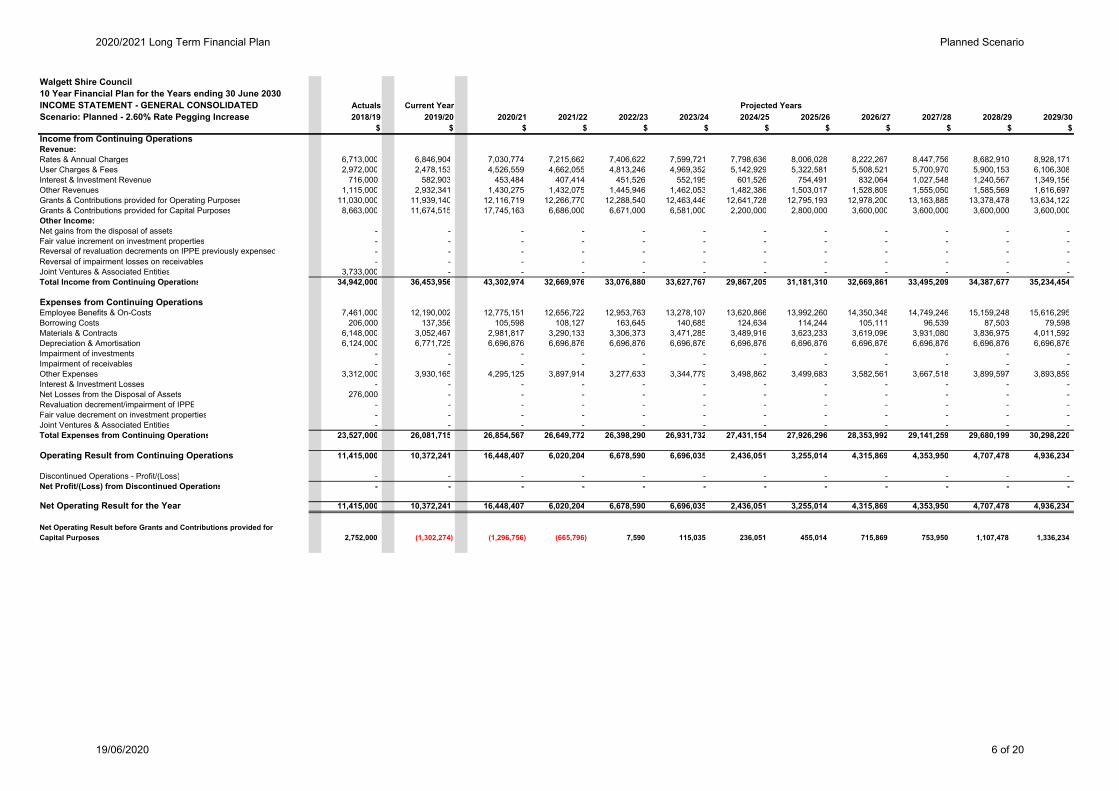
Walgett Shire Council10 Year Financial Plan for the Years ending 30 June 2030INCOME STATEMENT - GENERAL CONSOLIDATED Actuals Current YearScenario: Planned - 2.60% Rate Pegging Increase 2018/19 2019/20 2020/21 2021/22 2022/23 2023/24 2024/25 2025/26 2026/27 2027/28 2028/29 2029/30
$ $ $ $ $ $ $ $ $ $ $ $Income from Continuing OperationsRevenue:Rates & Annual Charges 6,713,000 6,846,904 7,030,774 7,215,662 7,406,622 7,599,721 7,798,636 8,006,028 8,222,267 8,447,756 8,682,910 8,928,171 User Charges & Fees 2,972,000 2,478,153 4,526,559 4,662,055 4,813,246 4,969,352 5,142,929 5,322,581 5,508,521 5,700,970 5,900,153 6,106,308 Interest & Investment Revenue 716,000 582,903 453,484 407,414 451,526 552,195 601,526 754,491 832,064 1,027,548 1,240,567 1,349,156 Other Revenues 1,115,000 2,932,341 1,430,275 1,432,075 1,445,946 1,462,053 1,482,386 1,503,017 1,528,809 1,555,050 1,585,569 1,616,697 Grants & Contributions provided for Operating Purposes 11,030,000 11,939,140 12,116,719 12,266,770 12,288,540 12,463,446 12,641,728 12,795,193 12,978,200 13,163,885 13,378,478 13,634,122 Grants & Contributions provided for Capital Purposes 8,663,000 11,674,515 17,745,163 6,686,000 6,671,000 6,581,000 2,200,000 2,800,000 3,600,000 3,600,000 3,600,000 3,600,000 Other Income:Net gains from the disposal of assets - - - - - - - - - - - - Fair value increment on investment properties - - - - - - - - - - - - Reversal of revaluation decrements on IPPE previously expensed - - - - - - - - - - - - Reversal of impairment losses on receivables - - - - - - - - - - - - Joint Ventures & Associated Entities 3,733,000 - - - - - - - - - - - Total Income from Continuing Operations 34,942,000 36,453,956 43,302,974 32,669,976 33,076,880 33,627,767 29,867,205 31,181,310 32,669,861 33,495,209 34,387,677 35,234,454
Expenses from Continuing OperationsEmployee Benefits & On-Costs 7,461,000 12,190,002 12,775,151 12,656,722 12,953,763 13,278,107 13,620,866 13,992,260 14,350,348 14,749,246 15,159,248 15,616,295 Borrowing Costs 206,000 137,356 105,598 108,127 163,645 140,685 124,634 114,244 105,111 96,539 87,503 79,598 Materials & Contracts 6,148,000 3,052,467 2,981,817 3,290,133 3,306,373 3,471,285 3,489,916 3,623,233 3,619,096 3,931,080 3,836,975 4,011,592 Depreciation & Amortisation 6,124,000 6,771,725 6,696,876 6,696,876 6,696,876 6,696,876 6,696,876 6,696,876 6,696,876 6,696,876 6,696,876 6,696,876 Impairment of investments - - - - - - - - - - - - Impairment of receivables - - - - - - - - - - - - Other Expenses 3,312,000 3,930,165 4,295,125 3,897,914 3,277,633 3,344,779 3,498,862 3,499,683 3,582,561 3,667,518 3,899,597 3,893,859 Interest & Investment Losses - - - - - - - - - - - - Net Losses from the Disposal of Assets 276,000 - - - - - - - - - - - Revaluation decrement/impairment of IPPE - - - - - - - - - - - - Fair value decrement on investment properties - - - - - - - - - - - - Joint Ventures & Associated Entities - - - - - - - - - - - - Total Expenses from Continuing Operations 23,527,000 26,081,715 26,854,567 26,649,772 26,398,290 26,931,732 27,431,154 27,926,296 28,353,992 29,141,259 29,680,199 30,298,220
Operating Result from Continuing Operations 11,415,000 10,372,241 16,448,407 6,020,204 6,678,590 6,696,035 2,436,051 3,255,014 4,315,869 4,353,950 4,707,478 4,936,234
Discontinued Operations - Profit/(Loss) - - - - - - - - - - - - Net Profit/(Loss) from Discontinued Operations - - - - - - - - - - - -
Net Operating Result for the Year 11,415,000 10,372,241 16,448,407 6,020,204 6,678,590 6,696,035 2,436,051 3,255,014 4,315,869 4,353,950 4,707,478 4,936,234
Net Operating Result before Grants and Contributions provided for Capital Purposes 2,752,000 (1,302,274) (1,296,756) (665,796) 7,590 115,035 236,051 455,014 715,869 753,950 1,107,478 1,336,234
Projected Years
2020/2021 Long Term Financial Plan Planned Scenario
19/06/2020 6 of 20
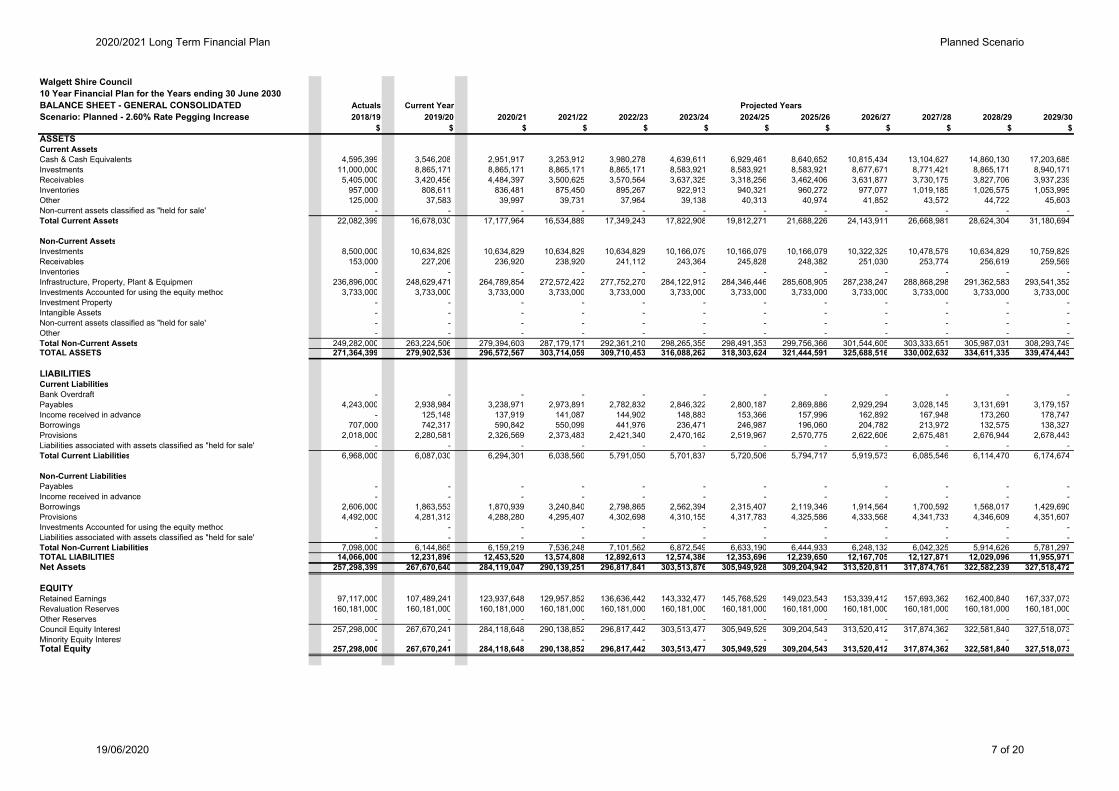
Walgett Shire Council10 Year Financial Plan for the Years ending 30 June 2030BALANCE SHEET - GENERAL CONSOLIDATED Actuals Current YearScenario: Planned - 2.60% Rate Pegging Increase 2018/19 2019/20 2020/21 2021/22 2022/23 2023/24 2024/25 2025/26 2026/27 2027/28 2028/29 2029/30
$ $ $ $ $ $ $ $ $ $ $ $ASSETSCurrent AssetsCash & Cash Equivalents 4,595,399 3,546,208 2,951,917 3,253,912 3,980,278 4,639,611 6,929,461 8,640,652 10,815,434 13,104,627 14,860,130 17,203,685 Investments 11,000,000 8,865,171 8,865,171 8,865,171 8,865,171 8,583,921 8,583,921 8,583,921 8,677,671 8,771,421 8,865,171 8,940,171 Receivables 5,405,000 3,420,456 4,484,397 3,500,625 3,570,564 3,637,325 3,318,256 3,462,406 3,631,877 3,730,175 3,827,706 3,937,239 Inventories 957,000 808,611 836,481 875,450 895,267 922,913 940,321 960,272 977,077 1,019,185 1,026,575 1,053,995 Other 125,000 37,583 39,997 39,731 37,964 39,138 40,313 40,974 41,852 43,572 44,722 45,603 Non-current assets classified as "held for sale" - - - - - - - - - - - - Total Current Assets 22,082,399 16,678,030 17,177,964 16,534,889 17,349,243 17,822,908 19,812,271 21,688,226 24,143,911 26,668,981 28,624,304 31,180,694
Non-Current AssetsInvestments 8,500,000 10,634,829 10,634,829 10,634,829 10,634,829 10,166,079 10,166,079 10,166,079 10,322,329 10,478,579 10,634,829 10,759,829 Receivables 153,000 227,206 236,920 238,920 241,112 243,364 245,828 248,382 251,030 253,774 256,619 259,569 Inventories - - - - - - - - - - - - Infrastructure, Property, Plant & Equipment 236,896,000 248,629,471 264,789,854 272,572,422 277,752,270 284,122,912 284,346,446 285,608,905 287,238,247 288,868,298 291,362,583 293,541,352 Investments Accounted for using the equity method 3,733,000 3,733,000 3,733,000 3,733,000 3,733,000 3,733,000 3,733,000 3,733,000 3,733,000 3,733,000 3,733,000 3,733,000 Investment Property - - - - - - - - - - - - Intangible Assets - - - - - - - - - - - - Non-current assets classified as "held for sale" - - - - - - - - - - - - Other - - - - - - - - - - - - Total Non-Current Assets 249,282,000 263,224,506 279,394,603 287,179,171 292,361,210 298,265,355 298,491,353 299,756,366 301,544,605 303,333,651 305,987,031 308,293,749 TOTAL ASSETS 271,364,399 279,902,536 296,572,567 303,714,059 309,710,453 316,088,262 318,303,624 321,444,591 325,688,516 330,002,632 334,611,335 339,474,443
LIABILITIESCurrent LiabilitiesBank Overdraft - - - - - - - - - - - - Payables 4,243,000 2,938,984 3,238,971 2,973,891 2,782,832 2,846,322 2,800,187 2,869,886 2,929,294 3,028,145 3,131,691 3,179,157 Income received in advance - 125,148 137,919 141,087 144,902 148,883 153,366 157,996 162,892 167,948 173,260 178,747 Borrowings 707,000 742,317 590,842 550,099 441,976 236,471 246,987 196,060 204,782 213,972 132,575 138,327 Provisions 2,018,000 2,280,581 2,326,569 2,373,483 2,421,340 2,470,162 2,519,967 2,570,775 2,622,606 2,675,481 2,676,944 2,678,443 Liabilities associated with assets classified as "held for sale" - - - - - - - - - - - - Total Current Liabilities 6,968,000 6,087,030 6,294,301 6,038,560 5,791,050 5,701,837 5,720,506 5,794,717 5,919,573 6,085,546 6,114,470 6,174,674
Non-Current LiabilitiesPayables - - - - - - - - - - - - Income received in advance - - - - - - - - - - - - Borrowings 2,606,000 1,863,553 1,870,939 3,240,840 2,798,865 2,562,394 2,315,407 2,119,346 1,914,564 1,700,592 1,568,017 1,429,690 Provisions 4,492,000 4,281,312 4,288,280 4,295,407 4,302,698 4,310,155 4,317,783 4,325,586 4,333,568 4,341,733 4,346,609 4,351,607 Investments Accounted for using the equity method - - - - - - - - - - - - Liabilities associated with assets classified as "held for sale" - - - - - - - - - - - - Total Non-Current Liabilities 7,098,000 6,144,865 6,159,219 7,536,248 7,101,562 6,872,549 6,633,190 6,444,933 6,248,132 6,042,325 5,914,626 5,781,297 TOTAL LIABILITIES 14,066,000 12,231,896 12,453,520 13,574,808 12,892,613 12,574,386 12,353,696 12,239,650 12,167,705 12,127,871 12,029,096 11,955,971 Net Assets 257,298,399 267,670,640 284,119,047 290,139,251 296,817,841 303,513,876 305,949,928 309,204,942 313,520,811 317,874,761 322,582,239 327,518,472
EQUITYRetained Earnings 97,117,000 107,489,241 123,937,648 129,957,852 136,636,442 143,332,477 145,768,529 149,023,543 153,339,412 157,693,362 162,400,840 167,337,073 Revaluation Reserves 160,181,000 160,181,000 160,181,000 160,181,000 160,181,000 160,181,000 160,181,000 160,181,000 160,181,000 160,181,000 160,181,000 160,181,000 Other Reserves - - - - - - - - - - - - Council Equity Interest 257,298,000 267,670,241 284,118,648 290,138,852 296,817,442 303,513,477 305,949,529 309,204,543 313,520,412 317,874,362 322,581,840 327,518,073 Minority Equity Interest - - - - - - - - - - - - Total Equity 257,298,000 267,670,241 284,118,648 290,138,852 296,817,442 303,513,477 305,949,529 309,204,543 313,520,412 317,874,362 322,581,840 327,518,073
Projected Years
2020/2021 Long Term Financial Plan Planned Scenario
19/06/2020 7 of 20
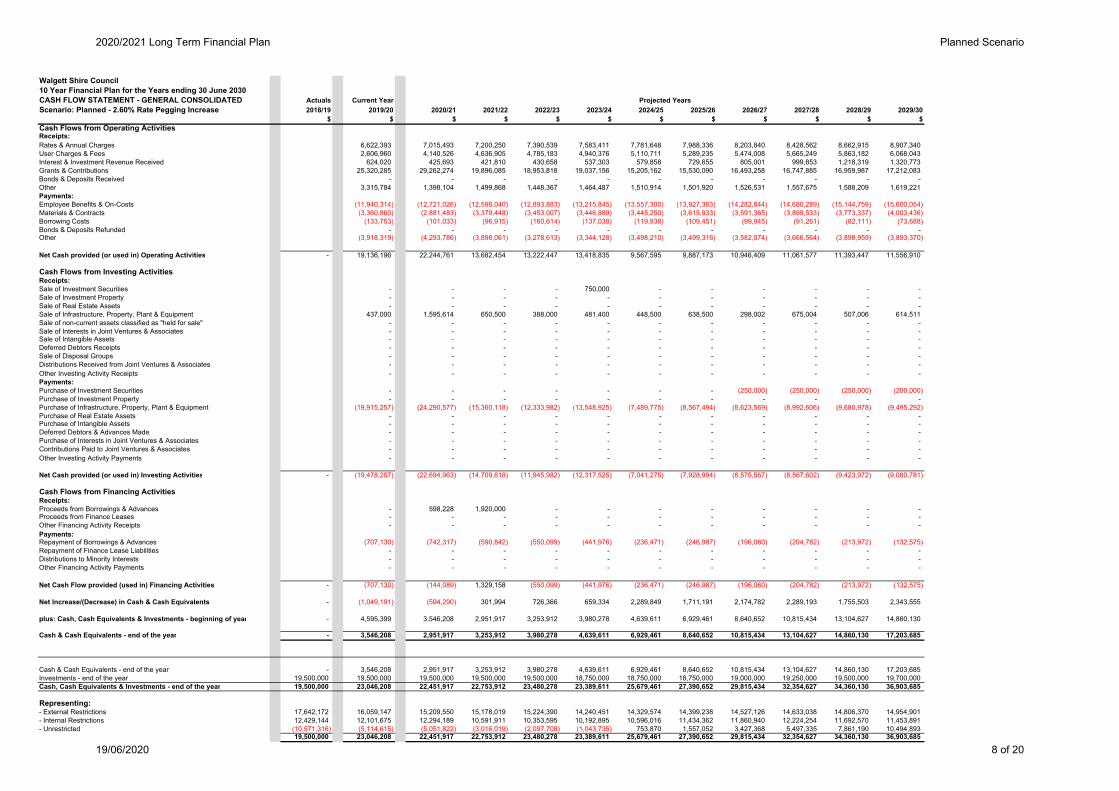
Walgett Shire Council10 Year Financial Plan for the Years ending 30 June 2030CASH FLOW STATEMENT - GENERAL CONSOLIDATED Actuals Current YearScenario: Planned - 2.60% Rate Pegging Increase 2018/19 2019/20 2020/21 2021/22 2022/23 2023/24 2024/25 2025/26 2026/27 2027/28 2028/29 2029/30
$ $ $ $ $ $ $ $ $ $ $ $Cash Flows from Operating ActivitiesReceipts:Rates & Annual Charges 6,622,393 7,015,493 7,200,250 7,390,539 7,583,411 7,781,648 7,988,336 8,203,840 8,428,562 8,662,915 8,907,340 User Charges & Fees 2,606,960 4,140,526 4,636,905 4,785,183 4,940,376 5,110,711 5,289,235 5,474,008 5,665,249 5,863,182 6,068,043 Interest & Investment Revenue Received 624,020 425,693 421,810 430,658 537,303 579,858 729,655 805,001 999,853 1,218,319 1,320,773 Grants & Contributions 25,320,285 29,262,274 19,896,085 18,953,818 19,037,156 15,205,162 15,530,090 16,493,258 16,747,885 16,959,987 17,212,083 Bonds & Deposits Received - - - - - - - - - - - Other 3,315,784 1,398,104 1,499,868 1,448,367 1,464,487 1,510,914 1,501,920 1,526,531 1,557,675 1,588,209 1,619,221 Payments:Employee Benefits & On-Costs (11,940,314) (12,721,026) (12,598,040) (12,893,883) (13,215,845) (13,557,300) (13,927,363) (14,282,844) (14,680,289) (15,144,759) (15,600,054) Materials & Contracts (3,360,860) (2,881,483) (3,379,448) (3,453,007) (3,446,889) (3,445,250) (3,615,933) (3,591,365) (3,899,533) (3,773,337) (4,003,436) Borrowing Costs (133,753) (101,033) (96,915) (160,614) (137,038) (119,938) (109,451) (99,945) (91,261) (82,111) (73,688) Bonds & Deposits Refunded - - - - - - - - - - - Other (3,918,319) (4,293,786) (3,898,061) (3,278,613) (3,344,128) (3,498,210) (3,499,316) (3,582,074) (3,666,564) (3,898,959) (3,893,370)
Net Cash provided (or used in) Operating Activities - 19,136,196 22,244,761 13,682,454 13,222,447 13,418,835 9,567,595 9,887,173 10,946,409 11,061,577 11,393,447 11,556,910
Cash Flows from Investing ActivitiesReceipts:Sale of Investment Securities - - - - 750,000 - - - - - - Sale of Investment Property - - - - - - - - - - - Sale of Real Estate Assets - - - - - - - - - - - Sale of Infrastructure, Property, Plant & Equipment 437,000 1,595,614 650,500 388,000 481,400 448,500 638,500 298,002 675,004 507,006 614,511 Sale of non-current assets classified as "held for sale" - - - - - - - - - - - Sale of Interests in Joint Ventures & Associates - - - - - - - - - - - Sale of Intangible Assets - - - - - - - - - - - Deferred Debtors Receipts - - - - - - - - - - - Sale of Disposal Groups - - - - - - - - - - - Distributions Received from Joint Ventures & Associates - - - - - - - - - - - Other Investing Activity Receipts - - - - - - - - - - - Payments:Purchase of Investment Securities - - - - - - - (250,000) (250,000) (250,000) (200,000) Purchase of Investment Property - - - - - - - - - - - Purchase of Infrastructure, Property, Plant & Equipment (19,915,257) (24,290,577) (15,360,118) (12,333,982) (13,548,925) (7,489,775) (8,567,494) (8,623,569) (8,992,606) (9,680,978) (9,495,292) Purchase of Real Estate Assets - - - - - - - - - - - Purchase of Intangible Assets - - - - - - - - - - - Deferred Debtors & Advances Made - - - - - - - - - - - Purchase of Interests in Joint Ventures & Associates - - - - - - - - - - - Contributions Paid to Joint Ventures & Associates - - - - - - - - - - - Other Investing Activity Payments - - - - - - - - - - -
Net Cash provided (or used in) Investing Activities - (19,478,257) (22,694,963) (14,709,618) (11,945,982) (12,317,525) (7,041,275) (7,928,994) (8,575,567) (8,567,602) (9,423,972) (9,080,781)
Cash Flows from Financing ActivitiesReceipts:Proceeds from Borrowings & Advances - 598,228 1,920,000 - - - - - - - - Proceeds from Finance Leases - - - - - - - - - - - Other Financing Activity Receipts - - - - - - - - - - - Payments:Repayment of Borrowings & Advances (707,130) (742,317) (590,842) (550,099) (441,976) (236,471) (246,987) (196,060) (204,782) (213,972) (132,575) Repayment of Finance Lease Liabilities - - - - - - - - - - - Distributions to Minority Interests - - - - - - - - - - - Other Financing Activity Payments - - - - - - - - - - -
Net Cash Flow provided (used in) Financing Activities - (707,130) (144,089) 1,329,158 (550,099) (441,976) (236,471) (246,987) (196,060) (204,782) (213,972) (132,575)
Net Increase/(Decrease) in Cash & Cash Equivalents - (1,049,191) (594,290) 301,994 726,366 659,334 2,289,849 1,711,191 2,174,782 2,289,193 1,755,503 2,343,555
plus: Cash, Cash Equivalents & Investments - beginning of year - 4,595,399 3,546,208 2,951,917 3,253,912 3,980,278 4,639,611 6,929,461 8,640,652 10,815,434 13,104,627 14,860,130
Cash & Cash Equivalents - end of the year - 3,546,208 2,951,917 3,253,912 3,980,278 4,639,611 6,929,461 8,640,652 10,815,434 13,104,627 14,860,130 17,203,685
Cash & Cash Equivalents - end of the year - 3,546,208 2,951,917 3,253,912 3,980,278 4,639,611 6,929,461 8,640,652 10,815,434 13,104,627 14,860,130 17,203,685 Investments - end of the year 19,500,000 19,500,000 19,500,000 19,500,000 19,500,000 18,750,000 18,750,000 18,750,000 19,000,000 19,250,000 19,500,000 19,700,000 Cash, Cash Equivalents & Investments - end of the year 19,500,000 23,046,208 22,451,917 22,753,912 23,480,278 23,389,611 25,679,461 27,390,652 29,815,434 32,354,627 34,360,130 36,903,685
Representing:- External Restrictions 17,642,172 16,059,147 15,209,550 15,178,019 15,224,390 14,240,451 14,329,574 14,399,238 14,527,126 14,633,038 14,806,370 14,954,901 - Internal Restrictions 12,429,144 12,101,675 12,294,189 10,591,911 10,353,595 10,192,895 10,596,016 11,434,362 11,860,940 12,224,254 11,692,570 11,453,891 - Unrestricted (10,571,316) (5,114,615) (5,051,822) (3,016,019) (2,097,708) (1,043,735) 753,870 1,557,052 3,427,368 5,497,335 7,861,190 10,494,893
19,500,000 23,046,208 22,451,917 22,753,912 23,480,278 23,389,611 25,679,461 27,390,652 29,815,434 32,354,627 34,360,130 36,903,685
Projected Years
2020/2021 Long Term Financial Plan Planned Scenario
19/06/2020 8 of 20
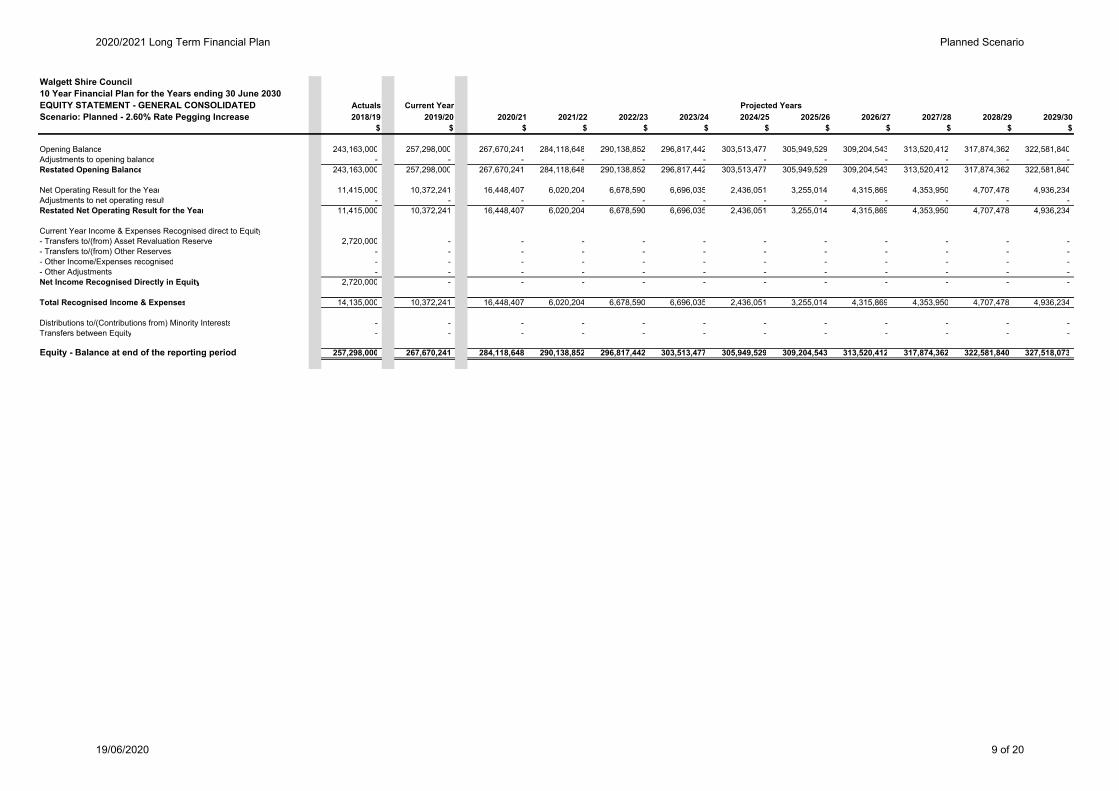
Walgett Shire Council10 Year Financial Plan for the Years ending 30 June 2030EQUITY STATEMENT - GENERAL CONSOLIDATED Actuals Current YearScenario: Planned - 2.60% Rate Pegging Increase 2018/19 2019/20 2020/21 2021/22 2022/23 2023/24 2024/25 2025/26 2026/27 2027/28 2028/29 2029/30
$ $ $ $ $ $ $ $ $ $ $ $
Opening Balance 243,163,000 257,298,000 267,670,241 284,118,648 290,138,852 296,817,442 303,513,477 305,949,529 309,204,543 313,520,412 317,874,362 322,581,840 Adjustments to opening balance - - - - - - - - - - - - Restated Opening Balance 243,163,000 257,298,000 267,670,241 284,118,648 290,138,852 296,817,442 303,513,477 305,949,529 309,204,543 313,520,412 317,874,362 322,581,840
Net Operating Result for the Year 11,415,000 10,372,241 16,448,407 6,020,204 6,678,590 6,696,035 2,436,051 3,255,014 4,315,869 4,353,950 4,707,478 4,936,234 Adjustments to net operating result - - - - - - - - - - - - Restated Net Operating Result for the Year 11,415,000 10,372,241 16,448,407 6,020,204 6,678,590 6,696,035 2,436,051 3,255,014 4,315,869 4,353,950 4,707,478 4,936,234
Current Year Income & Expenses Recognised direct to Equity- Transfers to/(from) Asset Revaluation Reserve 2,720,000 - - - - - - - - - - - - Transfers to/(from) Other Reserves - - - - - - - - - - - - - Other Income/Expenses recognised - - - - - - - - - - - - - Other Adjustments - - - - - - - - - - - - Net Income Recognised Directly in Equity 2,720,000 - - - - - - - - - - -
Total Recognised Income & Expenses 14,135,000 10,372,241 16,448,407 6,020,204 6,678,590 6,696,035 2,436,051 3,255,014 4,315,869 4,353,950 4,707,478 4,936,234
Distributions to/(Contributions from) Minority Interests - - - - - - - - - - - - Transfers between Equity - - - - - - - - - - - -
Equity - Balance at end of the reporting period 257,298,000 267,670,241 284,118,648 290,138,852 296,817,442 303,513,477 305,949,529 309,204,543 313,520,412 317,874,362 322,581,840 327,518,073
Projected Years
2020/2021 Long Term Financial Plan Planned Scenario
19/06/2020 9 of 20
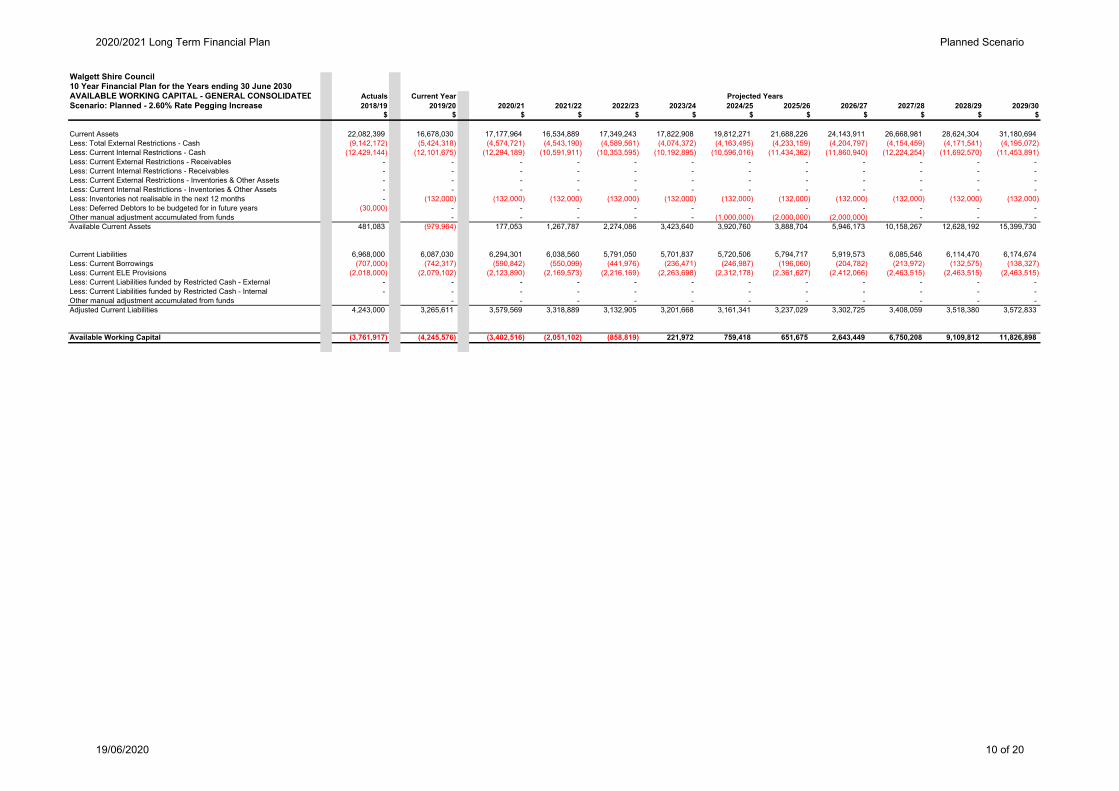
Walgett Shire Council10 Year Financial Plan for the Years ending 30 June 2030AVAILABLE WORKING CAPITAL - GENERAL CONSOLIDATED Actuals Current YearScenario: Planned - 2.60% Rate Pegging Increase 2018/19 2019/20 2020/21 2021/22 2022/23 2023/24 2024/25 2025/26 2026/27 2027/28 2028/29 2029/30
$ $ $ $ $ $ $ $ $ $ $ $
Current Assets 22,082,399 16,678,030 17,177,964 16,534,889 17,349,243 17,822,908 19,812,271 21,688,226 24,143,911 26,668,981 28,624,304 31,180,694 Less: Total External Restrictions - Cash (9,142,172) (5,424,318) (4,574,721) (4,543,190) (4,589,561) (4,074,372) (4,163,495) (4,233,159) (4,204,797) (4,154,459) (4,171,541) (4,195,072) Less: Current Internal Restrictions - Cash (12,429,144) (12,101,675) (12,294,189) (10,591,911) (10,353,595) (10,192,895) (10,596,016) (11,434,362) (11,860,940) (12,224,254) (11,692,570) (11,453,891) Less: Current External Restrictions - Receivables - - - - - - - - - - - - Less: Current Internal Restrictions - Receivables - - - - - - - - - - - - Less: Current External Restrictions - Inventories & Other Assets - - - - - - - - - - - - Less: Current Internal Restrictions - Inventories & Other Assets - - - - - - - - - - - - Less: Inventories not realisable in the next 12 months - (132,000) (132,000) (132,000) (132,000) (132,000) (132,000) (132,000) (132,000) (132,000) (132,000) (132,000) Less: Deferred Debtors to be budgeted for in future years (30,000) - - - - - - - - - - - Other manual adjustment accumulated from funds - - - - - (1,000,000) (2,000,000) (2,000,000) - - - Available Current Assets 481,083 (979,964) 177,053 1,267,787 2,274,086 3,423,640 3,920,760 3,888,704 5,946,173 10,158,267 12,628,192 15,399,730
Current Liabilities 6,968,000 6,087,030 6,294,301 6,038,560 5,791,050 5,701,837 5,720,506 5,794,717 5,919,573 6,085,546 6,114,470 6,174,674 Less: Current Borrowings (707,000) (742,317) (590,842) (550,099) (441,976) (236,471) (246,987) (196,060) (204,782) (213,972) (132,575) (138,327) Less: Current ELE Provisions (2,018,000) (2,079,102) (2,123,890) (2,169,573) (2,216,169) (2,263,698) (2,312,178) (2,361,627) (2,412,066) (2,463,515) (2,463,515) (2,463,515) Less: Current Liabilities funded by Restricted Cash - External - - - - - - - - - - - - Less: Current Liabilities funded by Restricted Cash - Internal - - - - - - - - - - - - Other manual adjustment accumulated from funds - - - - - - - - - - - Adjusted Current Liabilities 4,243,000 3,265,611 3,579,569 3,318,889 3,132,905 3,201,668 3,161,341 3,237,029 3,302,725 3,408,059 3,518,380 3,572,833
Available Working Capital (3,761,917) (4,245,576) (3,402,516) (2,051,102) (858,819) 221,972 759,418 651,675 2,643,449 6,750,208 9,109,812 11,826,898
Projected Years
2020/2021 Long Term Financial Plan Planned Scenario
19/06/2020 10 of 20
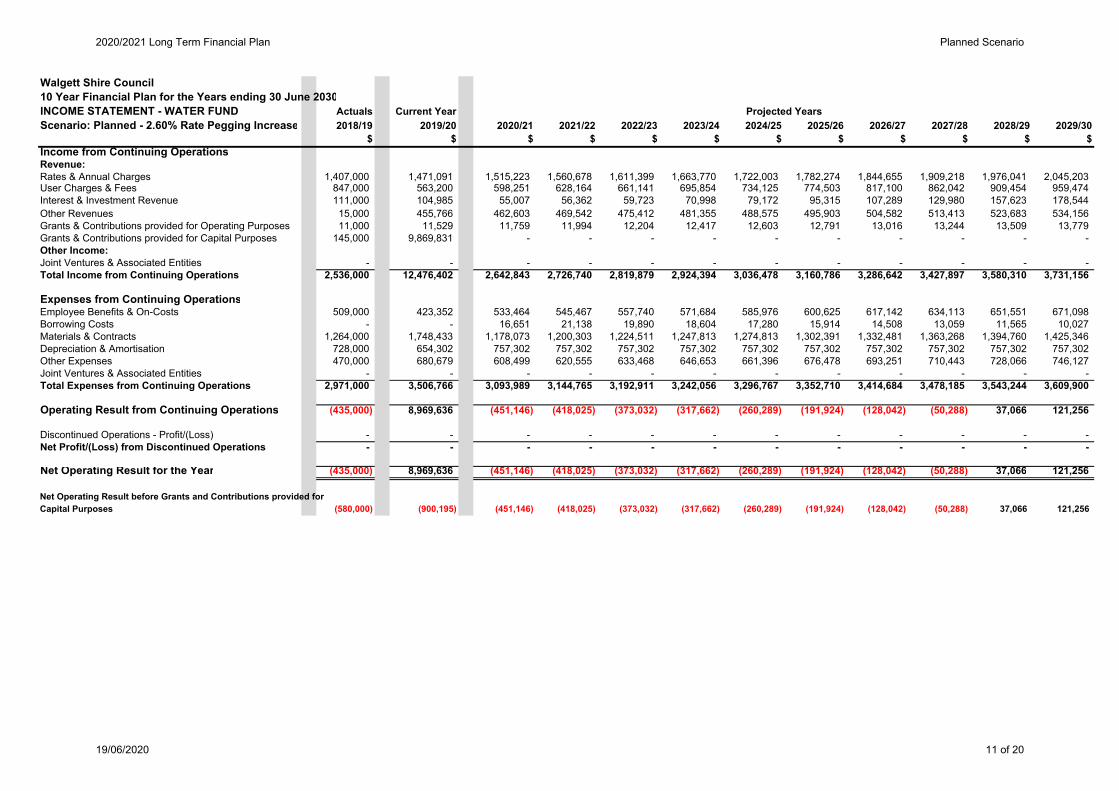
Walgett Shire Council10 Year Financial Plan for the Years ending 30 June 2030INCOME STATEMENT - WATER FUND Actuals Current YearScenario: Planned - 2.60% Rate Pegging Increase 2018/19 2019/20 2020/21 2021/22 2022/23 2023/24 2024/25 2025/26 2026/27 2027/28 2028/29 2029/30
$ $ $ $ $ $ $ $ $ $ $ $Income from Continuing OperationsRevenue:Rates & Annual Charges 1,407,000 1,471,091 1,515,223 1,560,678 1,611,399 1,663,770 1,722,003 1,782,274 1,844,655 1,909,218 1,976,041 2,045,203 User Charges & Fees 847,000 563,200 598,251 628,164 661,141 695,854 734,125 774,503 817,100 862,042 909,454 959,474 Interest & Investment Revenue 111,000 104,985 55,007 56,362 59,723 70,998 79,172 95,315 107,289 129,980 157,623 178,544 Other Revenues 15,000 455,766 462,603 469,542 475,412 481,355 488,575 495,903 504,582 513,413 523,683 534,156 Grants & Contributions provided for Operating Purposes 11,000 11,529 11,759 11,994 12,204 12,417 12,603 12,791 13,016 13,244 13,509 13,779 Grants & Contributions provided for Capital Purposes 145,000 9,869,831 - - - - - - - - - - Other Income:Joint Ventures & Associated Entities - - - - - - - - - - - - Total Income from Continuing Operations 2,536,000 12,476,402 2,642,843 2,726,740 2,819,879 2,924,394 3,036,478 3,160,786 3,286,642 3,427,897 3,580,310 3,731,156
Expenses from Continuing OperationsEmployee Benefits & On-Costs 509,000 423,352 533,464 545,467 557,740 571,684 585,976 600,625 617,142 634,113 651,551 671,098 Borrowing Costs - - 16,651 21,138 19,890 18,604 17,280 15,914 14,508 13,059 11,565 10,027 Materials & Contracts 1,264,000 1,748,433 1,178,073 1,200,303 1,224,511 1,247,813 1,274,813 1,302,391 1,332,481 1,363,268 1,394,760 1,425,346 Depreciation & Amortisation 728,000 654,302 757,302 757,302 757,302 757,302 757,302 757,302 757,302 757,302 757,302 757,302 Other Expenses 470,000 680,679 608,499 620,555 633,468 646,653 661,396 676,478 693,251 710,443 728,066 746,127 Joint Ventures & Associated Entities - - - - - - - - - - - - Total Expenses from Continuing Operations 2,971,000 3,506,766 3,093,989 3,144,765 3,192,911 3,242,056 3,296,767 3,352,710 3,414,684 3,478,185 3,543,244 3,609,900
Operating Result from Continuing Operations (435,000) 8,969,636 (451,146) (418,025) (373,032) (317,662) (260,289) (191,924) (128,042) (50,288) 37,066 121,256
Discontinued Operations - Profit/(Loss) - - - - - - - - - - - - Net Profit/(Loss) from Discontinued Operations - - - - - - - - - - - -
Net Operating Result for the Year (435,000) 8,969,636 (451,146) (418,025) (373,032) (317,662) (260,289) (191,924) (128,042) (50,288) 37,066 121,256
Net Operating Result before Grants and Contributions provided for Capital Purposes (580,000) (900,195) (451,146) (418,025) (373,032) (317,662) (260,289) (191,924) (128,042) (50,288) 37,066 121,256
Projected Years
2020/2021 Long Term Financial Plan Planned Scenario
19/06/2020 11 of 20
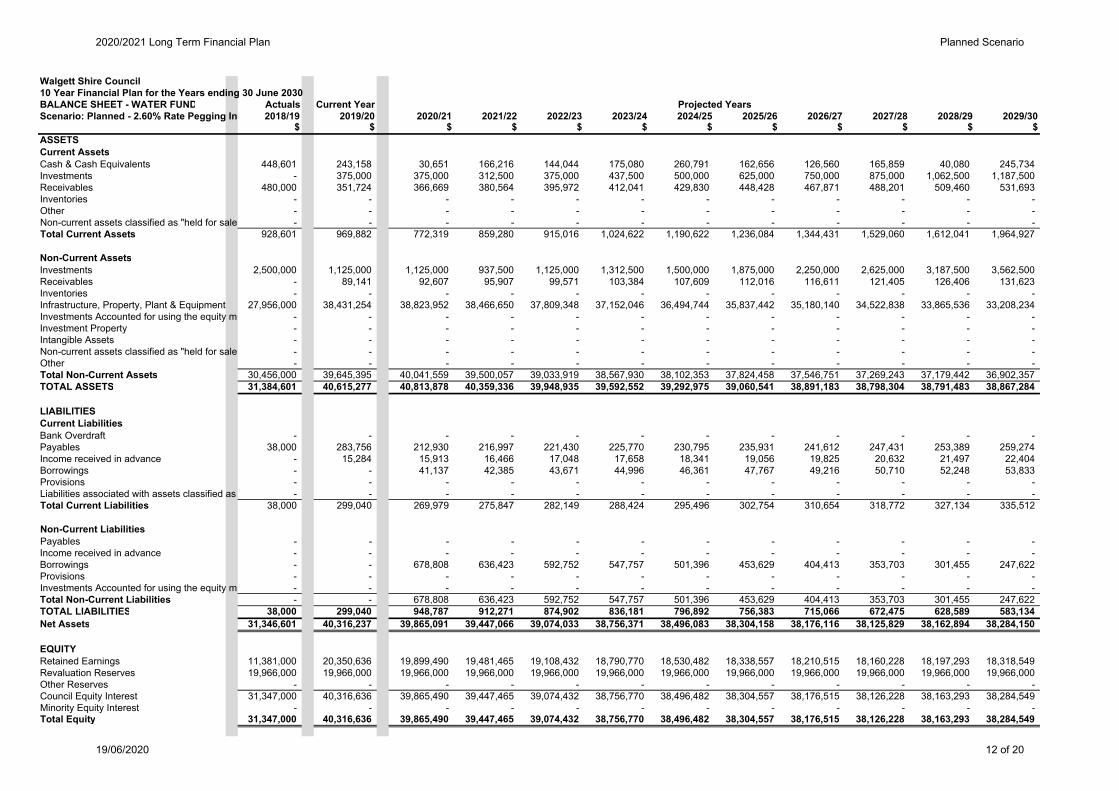
Walgett Shire Council10 Year Financial Plan for the Years ending 30 June 2030BALANCE SHEET - WATER FUND Actuals Current YearScenario: Planned - 2.60% Rate Pegging In 2018/19 2019/20 2020/21 2021/22 2022/23 2023/24 2024/25 2025/26 2026/27 2027/28 2028/29 2029/30
$ $ $ $ $ $ $ $ $ $ $ $ASSETSCurrent AssetsCash & Cash Equivalents 448,601 243,158 30,651 166,216 144,044 175,080 260,791 162,656 126,560 165,859 40,080 245,734 Investments - 375,000 375,000 312,500 375,000 437,500 500,000 625,000 750,000 875,000 1,062,500 1,187,500 Receivables 480,000 351,724 366,669 380,564 395,972 412,041 429,830 448,428 467,871 488,201 509,460 531,693 Inventories - - - - - - - - - - - - Other - - - - - - - - - - - - Non-current assets classified as "held for sale - - - - - - - - - - - - Total Current Assets 928,601 969,882 772,319 859,280 915,016 1,024,622 1,190,622 1,236,084 1,344,431 1,529,060 1,612,041 1,964,927
Non-Current AssetsInvestments 2,500,000 1,125,000 1,125,000 937,500 1,125,000 1,312,500 1,500,000 1,875,000 2,250,000 2,625,000 3,187,500 3,562,500 Receivables - 89,141 92,607 95,907 99,571 103,384 107,609 112,016 116,611 121,405 126,406 131,623 Inventories - - - - - - - - - - - - Infrastructure, Property, Plant & Equipment 27,956,000 38,431,254 38,823,952 38,466,650 37,809,348 37,152,046 36,494,744 35,837,442 35,180,140 34,522,838 33,865,536 33,208,234 Investments Accounted for using the equity me - - - - - - - - - - - - Investment Property - - - - - - - - - - - - Intangible Assets - - - - - - - - - - - - Non-current assets classified as "held for sale - - - - - - - - - - - - Other - - - - - - - - - - - - Total Non-Current Assets 30,456,000 39,645,395 40,041,559 39,500,057 39,033,919 38,567,930 38,102,353 37,824,458 37,546,751 37,269,243 37,179,442 36,902,357 TOTAL ASSETS 31,384,601 40,615,277 40,813,878 40,359,336 39,948,935 39,592,552 39,292,975 39,060,541 38,891,183 38,798,304 38,791,483 38,867,284
LIABILITIESCurrent LiabilitiesBank Overdraft - - - - - - - - - - - - Payables 38,000 283,756 212,930 216,997 221,430 225,770 230,795 235,931 241,612 247,431 253,389 259,274 Income received in advance - 15,284 15,913 16,466 17,048 17,658 18,341 19,056 19,825 20,632 21,497 22,404 Borrowings - - 41,137 42,385 43,671 44,996 46,361 47,767 49,216 50,710 52,248 53,833 Provisions - - - - - - - - - - - - Liabilities associated with assets classified as - - - - - - - - - - - - Total Current Liabilities 38,000 299,040 269,979 275,847 282,149 288,424 295,496 302,754 310,654 318,772 327,134 335,512
Non-Current LiabilitiesPayables - - - - - - - - - - - - Income received in advance - - - - - - - - - - - - Borrowings - - 678,808 636,423 592,752 547,757 501,396 453,629 404,413 353,703 301,455 247,622 Provisions - - - - - - - - - - - - Investments Accounted for using the equity me - - - - - - - - - - - - Total Non-Current Liabilities - - 678,808 636,423 592,752 547,757 501,396 453,629 404,413 353,703 301,455 247,622 TOTAL LIABILITIES 38,000 299,040 948,787 912,271 874,902 836,181 796,892 756,383 715,066 672,475 628,589 583,134 Net Assets 31,346,601 40,316,237 39,865,091 39,447,066 39,074,033 38,756,371 38,496,083 38,304,158 38,176,116 38,125,829 38,162,894 38,284,150
EQUITYRetained Earnings 11,381,000 20,350,636 19,899,490 19,481,465 19,108,432 18,790,770 18,530,482 18,338,557 18,210,515 18,160,228 18,197,293 18,318,549 Revaluation Reserves 19,966,000 19,966,000 19,966,000 19,966,000 19,966,000 19,966,000 19,966,000 19,966,000 19,966,000 19,966,000 19,966,000 19,966,000 Other Reserves - - - - - - - - - - - - Council Equity Interest 31,347,000 40,316,636 39,865,490 39,447,465 39,074,432 38,756,770 38,496,482 38,304,557 38,176,515 38,126,228 38,163,293 38,284,549 Minority Equity Interest - - - - - - - - - - - - Total Equity 31,347,000 40,316,636 39,865,490 39,447,465 39,074,432 38,756,770 38,496,482 38,304,557 38,176,515 38,126,228 38,163,293 38,284,549
Projected Years
2020/2021 Long Term Financial Plan Planned Scenario
19/06/2020 12 of 20
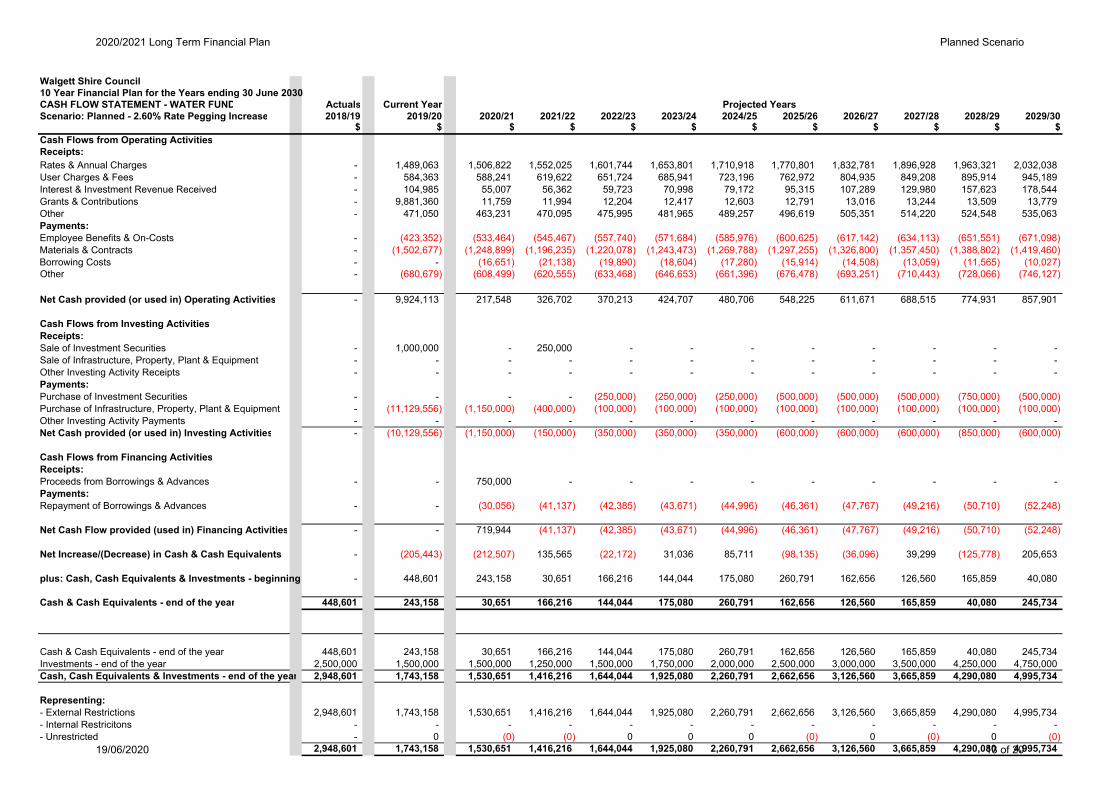
Walgett Shire Council10 Year Financial Plan for the Years ending 30 June 2030CASH FLOW STATEMENT - WATER FUND Actuals Current YearScenario: Planned - 2.60% Rate Pegging Increase 2018/19 2019/20 2020/21 2021/22 2022/23 2023/24 2024/25 2025/26 2026/27 2027/28 2028/29 2029/30
$ $ $ $ $ $ $ $ $ $ $ $Cash Flows from Operating ActivitiesReceipts:Rates & Annual Charges - 1,489,063 1,506,822 1,552,025 1,601,744 1,653,801 1,710,918 1,770,801 1,832,781 1,896,928 1,963,321 2,032,038 User Charges & Fees - 584,363 588,241 619,622 651,724 685,941 723,196 762,972 804,935 849,208 895,914 945,189 Interest & Investment Revenue Received - 104,985 55,007 56,362 59,723 70,998 79,172 95,315 107,289 129,980 157,623 178,544 Grants & Contributions - 9,881,360 11,759 11,994 12,204 12,417 12,603 12,791 13,016 13,244 13,509 13,779 Other - 471,050 463,231 470,095 475,995 481,965 489,257 496,619 505,351 514,220 524,548 535,063 Payments:Employee Benefits & On-Costs - (423,352) (533,464) (545,467) (557,740) (571,684) (585,976) (600,625) (617,142) (634,113) (651,551) (671,098) Materials & Contracts - (1,502,677) (1,248,899) (1,196,235) (1,220,078) (1,243,473) (1,269,788) (1,297,255) (1,326,800) (1,357,450) (1,388,802) (1,419,460) Borrowing Costs - - (16,651) (21,138) (19,890) (18,604) (17,280) (15,914) (14,508) (13,059) (11,565) (10,027) Other - (680,679) (608,499) (620,555) (633,468) (646,653) (661,396) (676,478) (693,251) (710,443) (728,066) (746,127)
Net Cash provided (or used in) Operating Activities - 9,924,113 217,548 326,702 370,213 424,707 480,706 548,225 611,671 688,515 774,931 857,901
Cash Flows from Investing ActivitiesReceipts:Sale of Investment Securities - 1,000,000 - 250,000 - - - - - - - - Sale of Infrastructure, Property, Plant & Equipment - - - - - - - - - - - - Other Investing Activity Receipts - - - - - - - - - - - - Payments:Purchase of Investment Securities - - - - (250,000) (250,000) (250,000) (500,000) (500,000) (500,000) (750,000) (500,000) Purchase of Infrastructure, Property, Plant & Equipment - (11,129,556) (1,150,000) (400,000) (100,000) (100,000) (100,000) (100,000) (100,000) (100,000) (100,000) (100,000) Other Investing Activity Payments - - - - - - - - - - - - Net Cash provided (or used in) Investing Activities - (10,129,556) (1,150,000) (150,000) (350,000) (350,000) (350,000) (600,000) (600,000) (600,000) (850,000) (600,000)
Cash Flows from Financing ActivitiesReceipts:Proceeds from Borrowings & Advances - - 750,000 - - - - - - - - - Payments:Repayment of Borrowings & Advances - - (30,056) (41,137) (42,385) (43,671) (44,996) (46,361) (47,767) (49,216) (50,710) (52,248)
Net Cash Flow provided (used in) Financing Activities - - 719,944 (41,137) (42,385) (43,671) (44,996) (46,361) (47,767) (49,216) (50,710) (52,248)
Net Increase/(Decrease) in Cash & Cash Equivalents - (205,443) (212,507) 135,565 (22,172) 31,036 85,711 (98,135) (36,096) 39,299 (125,778) 205,653
plus: Cash, Cash Equivalents & Investments - beginning - 448,601 243,158 30,651 166,216 144,044 175,080 260,791 162,656 126,560 165,859 40,080
Cash & Cash Equivalents - end of the year 448,601 243,158 30,651 166,216 144,044 175,080 260,791 162,656 126,560 165,859 40,080 245,734
Cash & Cash Equivalents - end of the year 448,601 243,158 30,651 166,216 144,044 175,080 260,791 162,656 126,560 165,859 40,080 245,734 Investments - end of the year 2,500,000 1,500,000 1,500,000 1,250,000 1,500,000 1,750,000 2,000,000 2,500,000 3,000,000 3,500,000 4,250,000 4,750,000 Cash, Cash Equivalents & Investments - end of the year 2,948,601 1,743,158 1,530,651 1,416,216 1,644,044 1,925,080 2,260,791 2,662,656 3,126,560 3,665,859 4,290,080 4,995,734
Representing:- External Restrictions 2,948,601 1,743,158 1,530,651 1,416,216 1,644,044 1,925,080 2,260,791 2,662,656 3,126,560 3,665,859 4,290,080 4,995,734 - Internal Restricitons - - - - - - - - - - - - - Unrestricted - 0 (0) (0) 0 0 0 (0) 0 (0) 0 (0)
2,948,601 1,743,158 1,530,651 1,416,216 1,644,044 1,925,080 2,260,791 2,662,656 3,126,560 3,665,859 4,290,080 4,995,734
Projected Years
2020/2021 Long Term Financial Plan Planned Scenario
19/06/2020 13 of 20
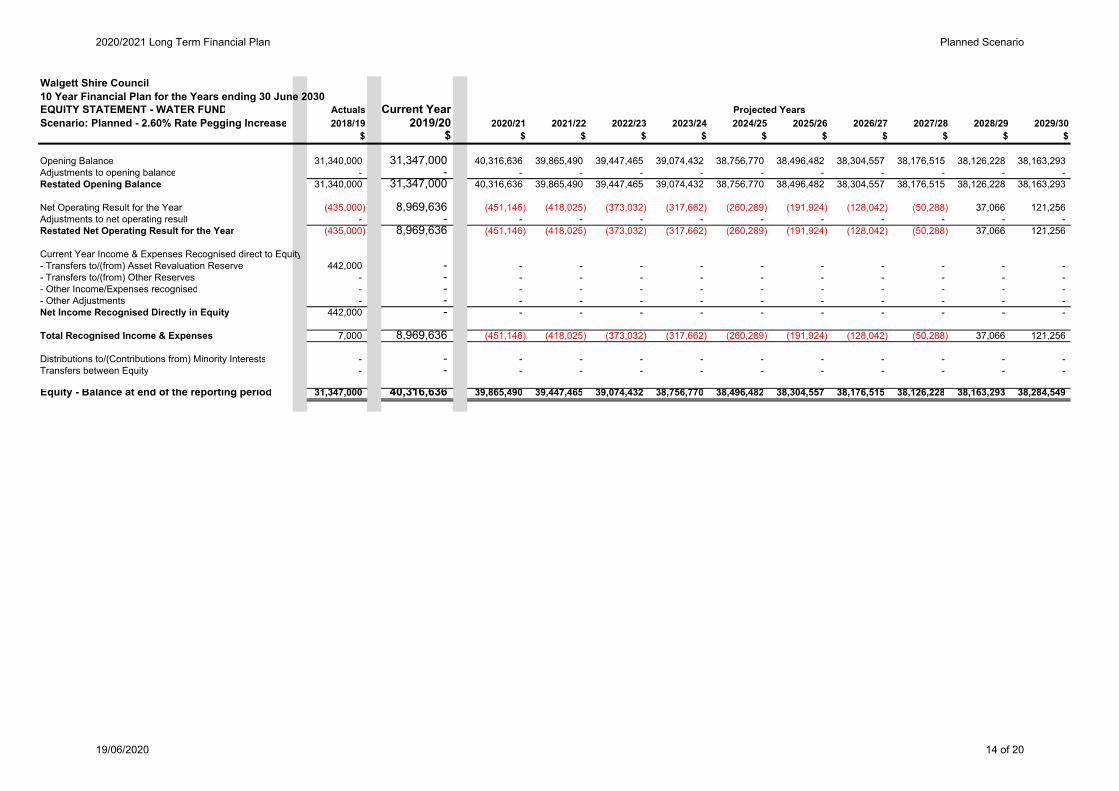
Walgett Shire Council10 Year Financial Plan for the Years ending 30 June 2030EQUITY STATEMENT - WATER FUND Actuals Current YearScenario: Planned - 2.60% Rate Pegging Increase 2018/19 2019/20 2020/21 2021/22 2022/23 2023/24 2024/25 2025/26 2026/27 2027/28 2028/29 2029/30
$ $ $ $ $ $ $ $ $ $ $ $
Opening Balance 31,340,000 31,347,000 40,316,636 39,865,490 39,447,465 39,074,432 38,756,770 38,496,482 38,304,557 38,176,515 38,126,228 38,163,293 Adjustments to opening balance - - - - - - - - - - - - Restated Opening Balance 31,340,000 31,347,000 40,316,636 39,865,490 39,447,465 39,074,432 38,756,770 38,496,482 38,304,557 38,176,515 38,126,228 38,163,293
Net Operating Result for the Year (435,000) 8,969,636 (451,146) (418,025) (373,032) (317,662) (260,289) (191,924) (128,042) (50,288) 37,066 121,256 Adjustments to net operating result - - - - - - - - - - - - Restated Net Operating Result for the Year (435,000) 8,969,636 (451,146) (418,025) (373,032) (317,662) (260,289) (191,924) (128,042) (50,288) 37,066 121,256
Current Year Income & Expenses Recognised direct to Equity- Transfers to/(from) Asset Revaluation Reserve 442,000 - - - - - - - - - - - - Transfers to/(from) Other Reserves - - - - - - - - - - - - - Other Income/Expenses recognised - - - - - - - - - - - - - Other Adjustments - - - - - - - - - - - - Net Income Recognised Directly in Equity 442,000 - - - - - - - - - - -
Total Recognised Income & Expenses 7,000 8,969,636 (451,146) (418,025) (373,032) (317,662) (260,289) (191,924) (128,042) (50,288) 37,066 121,256
Distributions to/(Contributions from) Minority Interests - - - - - - - - - - - - Transfers between Equity - - - - - - - - - - - -
Equity - Balance at end of the reporting period 31,347,000 40,316,636 39,865,490 39,447,465 39,074,432 38,756,770 38,496,482 38,304,557 38,176,515 38,126,228 38,163,293 38,284,549
Projected Years
2020/2021 Long Term Financial Plan Planned Scenario
19/06/2020 14 of 20
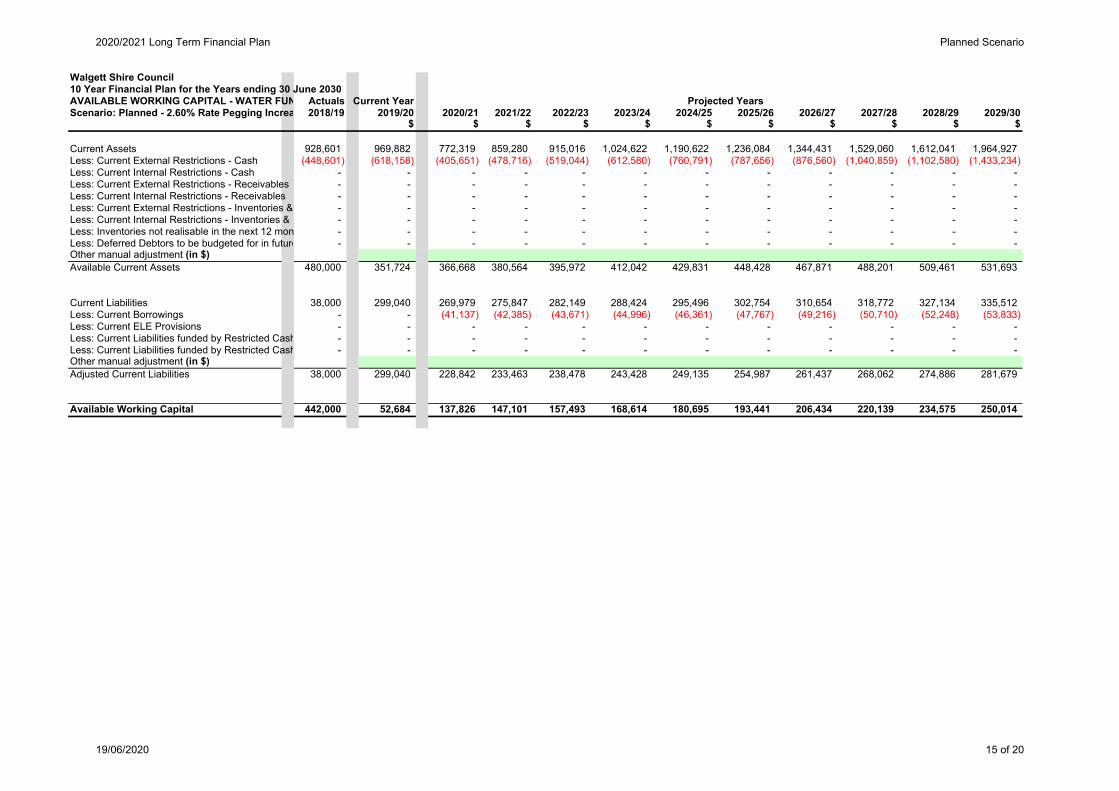
Walgett Shire Council10 Year Financial Plan for the Years ending 30 June 2030AVAILABLE WORKING CAPITAL - WATER FUN Actuals Current YearScenario: Planned - 2.60% Rate Pegging Increa 2018/19 2019/20 2020/21 2021/22 2022/23 2023/24 2024/25 2025/26 2026/27 2027/28 2028/29 2029/30
$ $ $ $ $ $ $ $ $ $ $
Current Assets 928,601 969,882 772,319 859,280 915,016 1,024,622 1,190,622 1,236,084 1,344,431 1,529,060 1,612,041 1,964,927 Less: Current External Restrictions - Cash (448,601) (618,158) (405,651) (478,716) (519,044) (612,580) (760,791) (787,656) (876,560) (1,040,859) (1,102,580) (1,433,234) Less: Current Internal Restrictions - Cash - - - - - - - - - - - - Less: Current External Restrictions - Receivables - - - - - - - - - - - - Less: Current Internal Restrictions - Receivables - - - - - - - - - - - - Less: Current External Restrictions - Inventories & - - - - - - - - - - - - Less: Current Internal Restrictions - Inventories & O - - - - - - - - - - - - Less: Inventories not realisable in the next 12 mon - - - - - - - - - - - - Less: Deferred Debtors to be budgeted for in future - - - - - - - - - - - - Other manual adjustment (in $)Available Current Assets 480,000 351,724 366,668 380,564 395,972 412,042 429,831 448,428 467,871 488,201 509,461 531,693
Current Liabilities 38,000 299,040 269,979 275,847 282,149 288,424 295,496 302,754 310,654 318,772 327,134 335,512 Less: Current Borrowings - - (41,137) (42,385) (43,671) (44,996) (46,361) (47,767) (49,216) (50,710) (52,248) (53,833) Less: Current ELE Provisions - - - - - - - - - - - - Less: Current Liabilities funded by Restricted Cash - - - - - - - - - - - - Less: Current Liabilities funded by Restricted Cash - - - - - - - - - - - - Other manual adjustment (in $)Adjusted Current Liabilities 38,000 299,040 228,842 233,463 238,478 243,428 249,135 254,987 261,437 268,062 274,886 281,679
Available Working Capital 442,000 52,684 137,826 147,101 157,493 168,614 180,695 193,441 206,434 220,139 234,575 250,014
Projected Years
2020/2021 Long Term Financial Plan Planned Scenario
19/06/2020 15 of 20
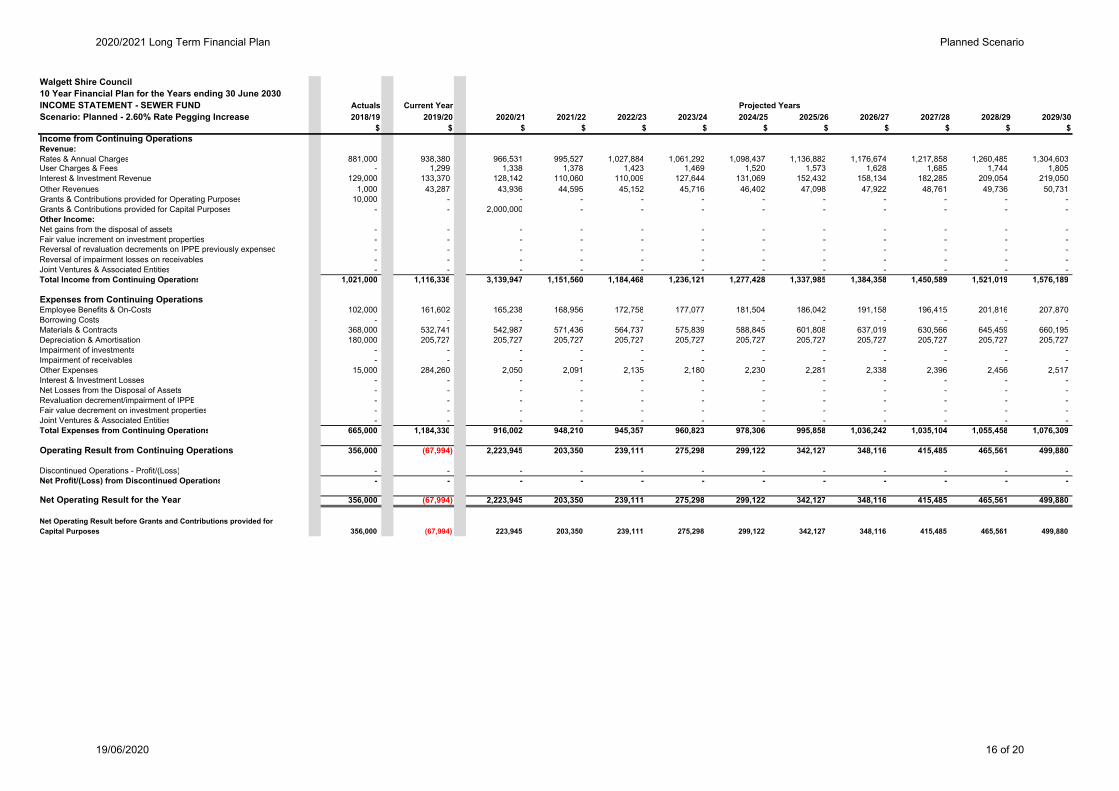
Walgett Shire Council10 Year Financial Plan for the Years ending 30 June 2030INCOME STATEMENT - SEWER FUND Actuals Current YearScenario: Planned - 2.60% Rate Pegging Increase 2018/19 2019/20 2020/21 2021/22 2022/23 2023/24 2024/25 2025/26 2026/27 2027/28 2028/29 2029/30
$ $ $ $ $ $ $ $ $ $ $ $Income from Continuing OperationsRevenue:Rates & Annual Charges 881,000 938,380 966,531 995,527 1,027,884 1,061,292 1,098,437 1,136,882 1,176,674 1,217,858 1,260,485 1,304,603 User Charges & Fees - 1,299 1,338 1,378 1,423 1,469 1,520 1,573 1,628 1,685 1,744 1,805 Interest & Investment Revenue 129,000 133,370 128,142 110,060 110,009 127,644 131,069 152,432 158,134 182,285 209,054 219,050 Other Revenues 1,000 43,287 43,936 44,595 45,152 45,716 46,402 47,098 47,922 48,761 49,736 50,731 Grants & Contributions provided for Operating Purposes 10,000 - - - - - - - - - - - Grants & Contributions provided for Capital Purposes - - 2,000,000 - - - - - - - - - Other Income:Net gains from the disposal of assets - - - - - - - - - - - - Fair value increment on investment properties - - - - - - - - - - - - Reversal of revaluation decrements on IPPE previously expensed - - - - - - - - - - - - Reversal of impairment losses on receivables - - - - - - - - - - - - Joint Ventures & Associated Entities - - - - - - - - - - - - Total Income from Continuing Operations 1,021,000 1,116,336 3,139,947 1,151,560 1,184,468 1,236,121 1,277,428 1,337,985 1,384,358 1,450,589 1,521,019 1,576,189
Expenses from Continuing OperationsEmployee Benefits & On-Costs 102,000 161,602 165,238 168,956 172,758 177,077 181,504 186,042 191,158 196,415 201,816 207,870 Borrowing Costs - - - - - - - - - - - - Materials & Contracts 368,000 532,741 542,987 571,436 564,737 575,839 588,845 601,808 637,019 630,566 645,459 660,195 Depreciation & Amortisation 180,000 205,727 205,727 205,727 205,727 205,727 205,727 205,727 205,727 205,727 205,727 205,727 Impairment of investments - - - - - - - - - - - - Impairment of receivables - - - - - - - - - - - - Other Expenses 15,000 284,260 2,050 2,091 2,135 2,180 2,230 2,281 2,338 2,396 2,456 2,517 Interest & Investment Losses - - - - - - - - - - - - Net Losses from the Disposal of Assets - - - - - - - - - - - - Revaluation decrement/impairment of IPPE - - - - - - - - - - - - Fair value decrement on investment properties - - - - - - - - - - - - Joint Ventures & Associated Entities - - - - - - - - - - - - Total Expenses from Continuing Operations 665,000 1,184,330 916,002 948,210 945,357 960,823 978,306 995,858 1,036,242 1,035,104 1,055,458 1,076,309
Operating Result from Continuing Operations 356,000 (67,994) 2,223,945 203,350 239,111 275,298 299,122 342,127 348,116 415,485 465,561 499,880
Discontinued Operations - Profit/(Loss) - - - - - - - - - - - - Net Profit/(Loss) from Discontinued Operations - - - - - - - - - - - -
Net Operating Result for the Year 356,000 (67,994) 2,223,945 203,350 239,111 275,298 299,122 342,127 348,116 415,485 465,561 499,880
Net Operating Result before Grants and Contributions provided for Capital Purposes 356,000 (67,994) 223,945 203,350 239,111 275,298 299,122 342,127 348,116 415,485 465,561 499,880
Projected Years
2020/2021 Long Term Financial Plan Planned Scenario
19/06/2020 16 of 20
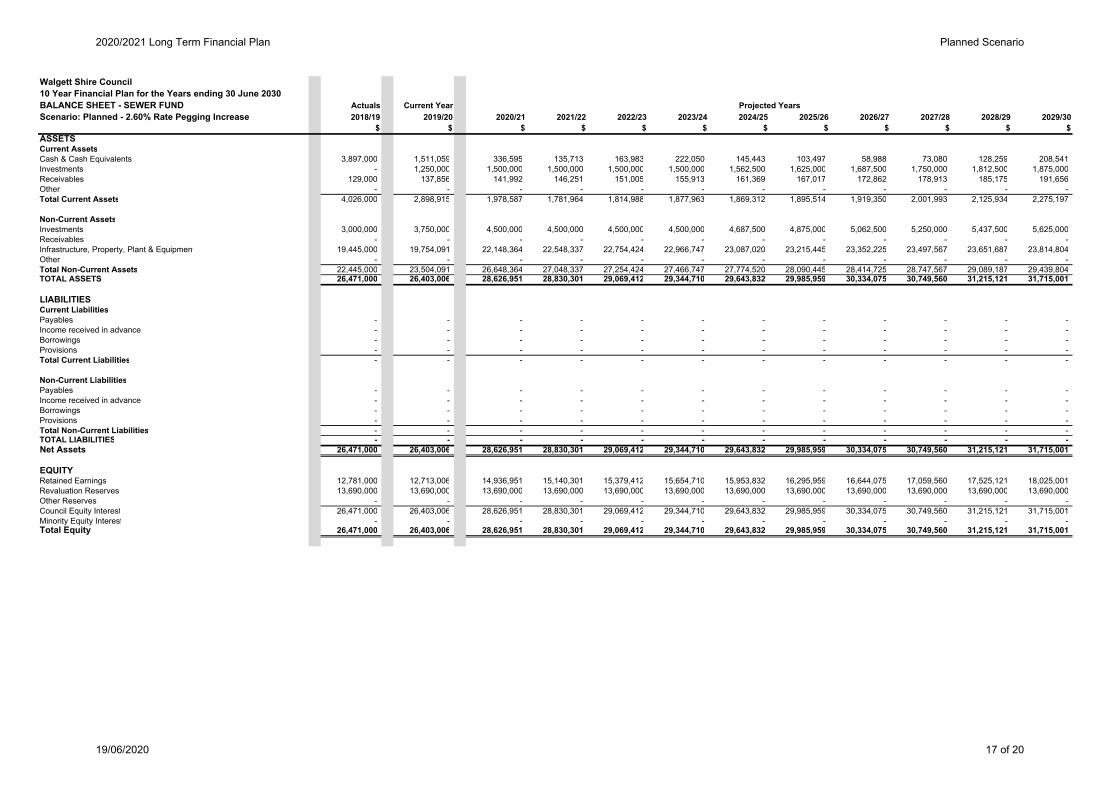
Walgett Shire Council10 Year Financial Plan for the Years ending 30 June 2030BALANCE SHEET - SEWER FUND Actuals Current YearScenario: Planned - 2.60% Rate Pegging Increase 2018/19 2019/20 2020/21 2021/22 2022/23 2023/24 2024/25 2025/26 2026/27 2027/28 2028/29 2029/30
$ $ $ $ $ $ $ $ $ $ $ $ASSETSCurrent AssetsCash & Cash Equivalents 3,897,000 1,511,059 336,595 135,713 163,983 222,050 145,443 103,497 58,988 73,080 128,259 208,541 Investments - 1,250,000 1,500,000 1,500,000 1,500,000 1,500,000 1,562,500 1,625,000 1,687,500 1,750,000 1,812,500 1,875,000 Receivables 129,000 137,856 141,992 146,251 151,005 155,913 161,369 167,017 172,862 178,913 185,175 191,656 Other - - - - - - - - - - - - Total Current Assets 4,026,000 2,898,915 1,978,587 1,781,964 1,814,988 1,877,963 1,869,312 1,895,514 1,919,350 2,001,993 2,125,934 2,275,197
Non-Current AssetsInvestments 3,000,000 3,750,000 4,500,000 4,500,000 4,500,000 4,500,000 4,687,500 4,875,000 5,062,500 5,250,000 5,437,500 5,625,000 Receivables - - - - - - - - - - - - Infrastructure, Property, Plant & Equipment 19,445,000 19,754,091 22,148,364 22,548,337 22,754,424 22,966,747 23,087,020 23,215,445 23,352,225 23,497,567 23,651,687 23,814,804 Other - - - - - - - - - - - - Total Non-Current Assets 22,445,000 23,504,091 26,648,364 27,048,337 27,254,424 27,466,747 27,774,520 28,090,445 28,414,725 28,747,567 29,089,187 29,439,804 TOTAL ASSETS 26,471,000 26,403,006 28,626,951 28,830,301 29,069,412 29,344,710 29,643,832 29,985,959 30,334,075 30,749,560 31,215,121 31,715,001
LIABILITIESCurrent LiabilitiesPayables - - - - - - - - - - - - Income received in advance - - - - - - - - - - - - Borrowings - - - - - - - - - - - - Provisions - - - - - - - - - - - - Total Current Liabilities - - - - - - - - - - - -
Non-Current LiabilitiesPayables - - - - - - - - - - - - Income received in advance - - - - - - - - - - - - Borrowings - - - - - - - - - - - - Provisions - - - - - - - - - - - - Total Non-Current Liabilities - - - - - - - - - - - - TOTAL LIABILITIES - - - - - - - - - - - - Net Assets 26,471,000 26,403,006 28,626,951 28,830,301 29,069,412 29,344,710 29,643,832 29,985,959 30,334,075 30,749,560 31,215,121 31,715,001
EQUITYRetained Earnings 12,781,000 12,713,006 14,936,951 15,140,301 15,379,412 15,654,710 15,953,832 16,295,959 16,644,075 17,059,560 17,525,121 18,025,001 Revaluation Reserves 13,690,000 13,690,000 13,690,000 13,690,000 13,690,000 13,690,000 13,690,000 13,690,000 13,690,000 13,690,000 13,690,000 13,690,000 Other Reserves - - - - - - - - - - - - Council Equity Interest 26,471,000 26,403,006 28,626,951 28,830,301 29,069,412 29,344,710 29,643,832 29,985,959 30,334,075 30,749,560 31,215,121 31,715,001 Minority Equity Interest - - - - - - - - - - - - Total Equity 26,471,000 26,403,006 28,626,951 28,830,301 29,069,412 29,344,710 29,643,832 29,985,959 30,334,075 30,749,560 31,215,121 31,715,001
Projected Years
2020/2021 Long Term Financial Plan Planned Scenario
19/06/2020 17 of 20

Walgett Shire Council10 Year Financial Plan for the Years ending 30 June 2030CASH FLOW STATEMENT - SEWER FUND Actuals Current YearScenario: Planned - 2.60% Rate Pegging Increase 2018/19 2019/20 2020/21 2021/22 2022/23 2023/24 2024/25 2025/26 2026/27 2027/28 2028/29 2029/30
$ $ $ $ $ $ $ $ $ $ $ $Cash Flows from Operating ActivitiesReceipts:Rates & Annual Charges - 926,310 962,449 991,322 1,023,192 1,056,448 1,093,051 1,131,307 1,170,904 1,211,886 1,254,304 1,298,206 User Charges & Fees - 4,513 1,284 1,323 1,361 1,406 1,450 1,500 1,552 1,607 1,663 1,721 Interest & Investment Revenue Received - 133,370 128,142 110,060 110,009 127,644 131,069 152,432 158,134 182,285 209,054 219,050 Grants & Contributions - - 2,000,000 - - - - - - - - - Bonds & Deposits Received - - - - - - - - - - - - Other - 43,287 43,936 44,595 45,152 45,716 46,402 47,098 47,922 48,761 49,736 50,731 Payments:Employee Benefits & On-Costs - (161,602) (165,238) (168,956) (172,758) (177,077) (181,504) (186,042) (191,158) (196,415) (201,816) (207,870) Materials & Contracts - (532,741) (542,987) (571,436) (564,737) (575,839) (588,845) (601,808) (637,019) (630,566) (645,459) (660,195) Borrowing Costs - - - - - - - - - - - - Bonds & Deposits Refunded - - - - - - - - - - - - Other - (284,260) (2,050) (2,091) (2,135) (2,180) (2,230) (2,281) (2,338) (2,396) (2,456) (2,517)
Net Cash provided (or used in) Operating Activities - 128,877 2,425,536 404,817 440,084 476,117 499,393 542,206 547,997 615,162 665,026 699,126
Cash Flows from Investing ActivitiesReceipts:Sale of Investment Securities - - - - - - - - - - - - Sale of Real Estate Assets - - - - - - - - - - - - Sale of Infrastructure, Property, Plant & Equipment - - - - - - - - - - - - Distributions Received from Joint Ventures & Associates - - - - - - - - - - - - Other Investing Activity Receipts - - - - - - - - - - - - Payments:Purchase of Investment Securities - (2,000,000) (1,000,000) - - - (250,000) (250,000) (250,000) (250,000) (250,000) (250,000) Purchase of Infrastructure, Property, Plant & Equipment - (514,818) (2,600,000) (605,700) (411,814) (418,050) (326,000) (334,152) (342,507) (351,069) (359,847) (368,844) Purchase of Real Estate Assets - - - - - - - - - - - - Contributions Paid to Joint Ventures & Associates - - - - - - - - - - - - Other Investing Activity Payments - - - - - - - - - - - -
Net Cash provided (or used in) Investing Activities - (2,514,818) (3,600,000) (605,700) (411,814) (418,050) (576,000) (584,152) (592,507) (601,069) (609,847) (618,844)
Cash Flows from Financing ActivitiesReceipts:Proceeds from Borrowings & Advances - - - - - - - - - - - - Proceeds from Finance Leases - - - - - - - - - - - - Other Financing Activity Receipts - - - - - - - - - - - - Payments:Repayment of Borrowings & Advances - - - - - - - - - - - - Repayment of Finance Lease Liabilities - - - - - - - - - - - - Other Financing Activity Payments - - - - - - - - - - - -
Net Cash Flow provided (used in) Financing Activities - - - - - - - - - - - -
Net Increase/(Decrease) in Cash & Cash Equivalents - (2,385,941) (1,174,464) (200,883) 28,270 58,067 (76,607) (41,946) (44,510) 14,093 55,179 80,282
plus: Cash, Cash Equivalents & Investments - beginning of yea - 3,897,000 1,511,059 336,595 135,713 163,983 222,050 145,443 103,497 58,988 73,080 128,259
Cash & Cash Equivalents - end of the year 3,897,000 1,511,059 336,595 135,713 163,983 222,050 145,443 103,497 58,988 73,080 128,259 208,541
Cash & Cash Equivalents - end of the year 3,897,000 1,511,059 336,595 135,713 163,983 222,050 145,443 103,497 58,988 73,080 128,259 208,541 Investments - end of the year 3,000,000 5,000,000 6,000,000 6,000,000 6,000,000 6,000,000 6,250,000 6,500,000 6,750,000 7,000,000 7,250,000 7,500,000 Cash, Cash Equivalents & Investments - end of the yea 6,897,000 6,511,059 6,336,595 6,135,713 6,163,983 6,222,050 6,395,443 6,603,497 6,808,988 7,073,080 7,378,259 7,708,541
Representing:- External Restrictions 6,897,301 6,511,059 6,336,595 6,135,713 6,163,983 6,222,050 6,395,443 6,603,497 6,808,988 7,073,080 7,378,259 7,708,541 - Internal Restricitons - - - - - - - - - - - - - Unrestricted (301) (0) 0 (0) (0) 0 (0) 0 (0) 0 0 (0)
6,897,000 6,511,059 6,336,595 6,135,713 6,163,983 6,222,050 6,395,443 6,603,497 6,808,988 7,073,080 7,378,259 7,708,541
Projected Years
2020/2021 Long Term Financial Plan Planned Scenario
19/06/2020 18 of 20
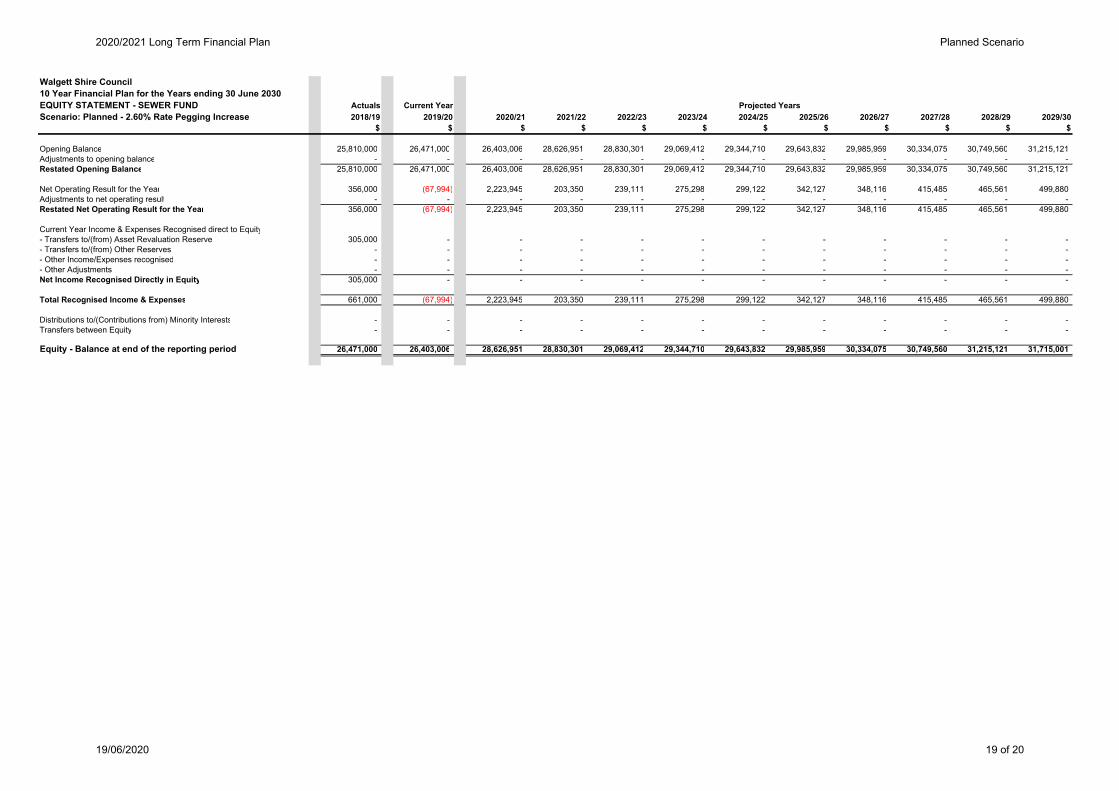
Walgett Shire Council10 Year Financial Plan for the Years ending 30 June 2030EQUITY STATEMENT - SEWER FUND Actuals Current YearScenario: Planned - 2.60% Rate Pegging Increase 2018/19 2019/20 2020/21 2021/22 2022/23 2023/24 2024/25 2025/26 2026/27 2027/28 2028/29 2029/30
$ $ $ $ $ $ $ $ $ $ $ $
Opening Balance 25,810,000 26,471,000 26,403,006 28,626,951 28,830,301 29,069,412 29,344,710 29,643,832 29,985,959 30,334,075 30,749,560 31,215,121 Adjustments to opening balance - - - - - - - - - - - - Restated Opening Balance 25,810,000 26,471,000 26,403,006 28,626,951 28,830,301 29,069,412 29,344,710 29,643,832 29,985,959 30,334,075 30,749,560 31,215,121
Net Operating Result for the Year 356,000 (67,994) 2,223,945 203,350 239,111 275,298 299,122 342,127 348,116 415,485 465,561 499,880 Adjustments to net operating result - - - - - - - - - - - - Restated Net Operating Result for the Year 356,000 (67,994) 2,223,945 203,350 239,111 275,298 299,122 342,127 348,116 415,485 465,561 499,880
Current Year Income & Expenses Recognised direct to Equity- Transfers to/(from) Asset Revaluation Reserve 305,000 - - - - - - - - - - - - Transfers to/(from) Other Reserves - - - - - - - - - - - - - Other Income/Expenses recognised - - - - - - - - - - - - - Other Adjustments - - - - - - - - - - - - Net Income Recognised Directly in Equity 305,000 - - - - - - - - - - -
Total Recognised Income & Expenses 661,000 (67,994) 2,223,945 203,350 239,111 275,298 299,122 342,127 348,116 415,485 465,561 499,880
Distributions to/(Contributions from) Minority Interests - - - - - - - - - - - - Transfers between Equity - - - - - - - - - - - -
Equity - Balance at end of the reporting period 26,471,000 26,403,006 28,626,951 28,830,301 29,069,412 29,344,710 29,643,832 29,985,959 30,334,075 30,749,560 31,215,121 31,715,001
Projected Years
2020/2021 Long Term Financial Plan Planned Scenario
19/06/2020 19 of 20
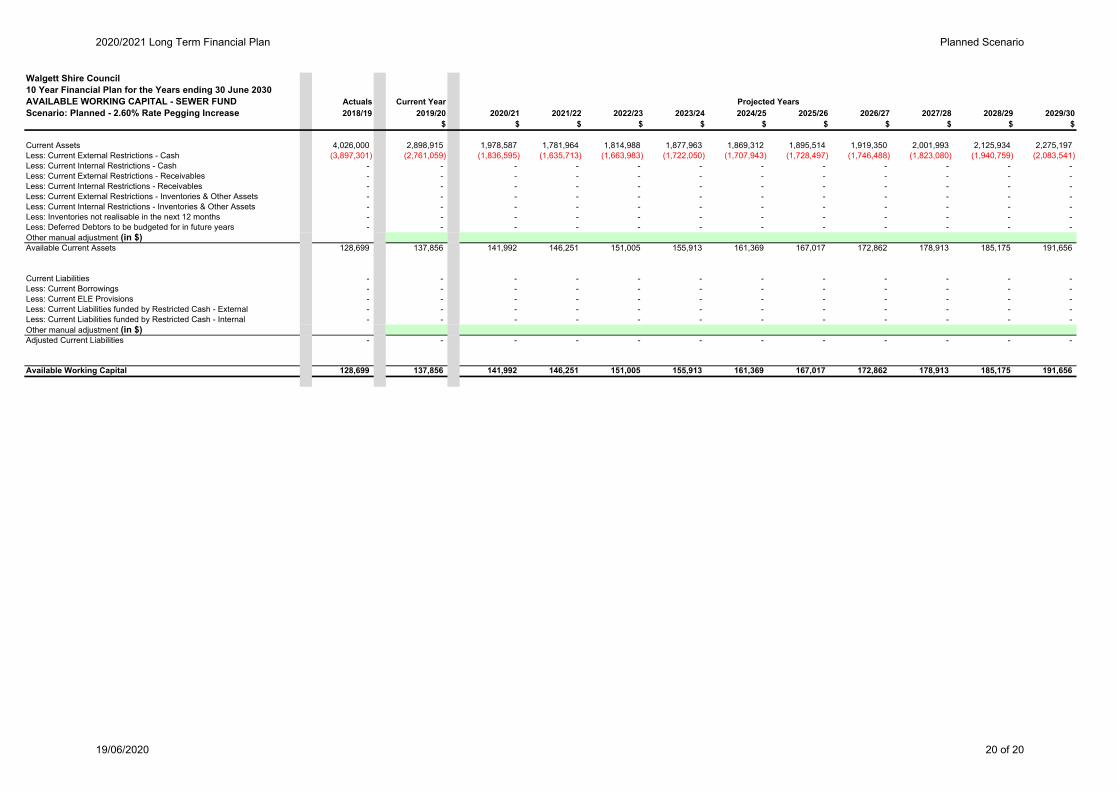
Walgett Shire Council10 Year Financial Plan for the Years ending 30 June 2030AVAILABLE WORKING CAPITAL - SEWER FUND Actuals Current YearScenario: Planned - 2.60% Rate Pegging Increase 2018/19 2019/20 2020/21 2021/22 2022/23 2023/24 2024/25 2025/26 2026/27 2027/28 2028/29 2029/30
$ $ $ $ $ $ $ $ $ $ $
Current Assets 4,026,000 2,898,915 1,978,587 1,781,964 1,814,988 1,877,963 1,869,312 1,895,514 1,919,350 2,001,993 2,125,934 2,275,197 Less: Current External Restrictions - Cash (3,897,301) (2,761,059) (1,836,595) (1,635,713) (1,663,983) (1,722,050) (1,707,943) (1,728,497) (1,746,488) (1,823,080) (1,940,759) (2,083,541) Less: Current Internal Restrictions - Cash - - - - - - - - - - - - Less: Current External Restrictions - Receivables - - - - - - - - - - - - Less: Current Internal Restrictions - Receivables - - - - - - - - - - - - Less: Current External Restrictions - Inventories & Other Assets - - - - - - - - - - - - Less: Current Internal Restrictions - Inventories & Other Assets - - - - - - - - - - - - Less: Inventories not realisable in the next 12 months - - - - - - - - - - - - Less: Deferred Debtors to be budgeted for in future years - - - - - - - - - - - - Other manual adjustment (in $)Available Current Assets 128,699 137,856 141,992 146,251 151,005 155,913 161,369 167,017 172,862 178,913 185,175 191,656
Current Liabilities - - - - - - - - - - - - Less: Current Borrowings - - - - - - - - - - - - Less: Current ELE Provisions - - - - - - - - - - - - Less: Current Liabilities funded by Restricted Cash - External - - - - - - - - - - - - Less: Current Liabilities funded by Restricted Cash - Internal - - - - - - - - - - - - Other manual adjustment (in $)Adjusted Current Liabilities - - - - - - - - - - - -
Available Working Capital 128,699 137,856 141,992 146,251 151,005 155,913 161,369 167,017 172,862 178,913 185,175 191,656
Projected Years
2020/2021 Long Term Financial Plan Planned Scenario
19/06/2020 20 of 20
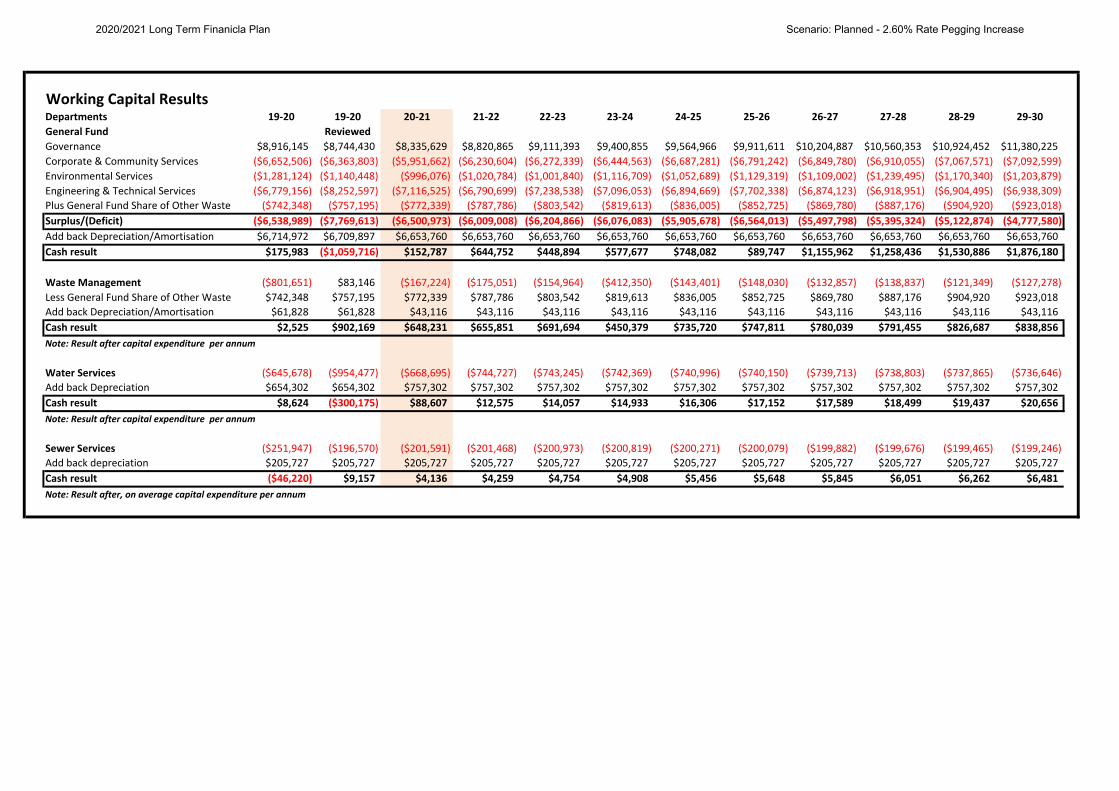
Working Capital ResultsDepartments 19‐20 19‐20 20‐21 21‐22 22‐23 23‐24 24‐25 25‐26 26‐27 27‐28 28‐29 29‐30General Fund ReviewedGovernance $8,916,145 $8,744,430 $8,335,629 $8,820,865 $9,111,393 $9,400,855 $9,564,966 $9,911,611 $10,204,887 $10,560,353 $10,924,452 $11,380,225
Corporate & Community Services ($6,652,506) ($6,363,803) ($5,951,662) ($6,230,604) ($6,272,339) ($6,444,563) ($6,687,281) ($6,791,242) ($6,849,780) ($6,910,055) ($7,067,571) ($7,092,599)
Environmental Services ($1,281,124) ($1,140,448) ($996,076) ($1,020,784) ($1,001,840) ($1,116,709) ($1,052,689) ($1,129,319) ($1,109,002) ($1,239,495) ($1,170,340) ($1,203,879)
Engineering & Technical Services ($6,779,156) ($8,252,597) ($7,116,525) ($6,790,699) ($7,238,538) ($7,096,053) ($6,894,669) ($7,702,338) ($6,874,123) ($6,918,951) ($6,904,495) ($6,938,309)
Plus General Fund Share of Other Waste ($742,348) ($757,195) ($772,339) ($787,786) ($803,542) ($819,613) ($836,005) ($852,725) ($869,780) ($887,176) ($904,920) ($923,018)
Surplus/(Deficit) ($6,538,989) ($7,769,613) ($6,500,973) ($6,009,008) ($6,204,866) ($6,076,083) ($5,905,678) ($6,564,013) ($5,497,798) ($5,395,324) ($5,122,874) ($4,777,580)Add back Depreciation/Amortisation $6,714,972 $6,709,897 $6,653,760 $6,653,760 $6,653,760 $6,653,760 $6,653,760 $6,653,760 $6,653,760 $6,653,760 $6,653,760 $6,653,760
Cash result $175,983 ($1,059,716) $152,787 $644,752 $448,894 $577,677 $748,082 $89,747 $1,155,962 $1,258,436 $1,530,886 $1,876,180
Waste Management ($801,651) $83,146 ($167,224) ($175,051) ($154,964) ($412,350) ($143,401) ($148,030) ($132,857) ($138,837) ($121,349) ($127,278)
Less General Fund Share of Other Waste $742,348 $757,195 $772,339 $787,786 $803,542 $819,613 $836,005 $852,725 $869,780 $887,176 $904,920 $923,018
Add back Depreciation/Amortisation $61,828 $61,828 $43,116 $43,116 $43,116 $43,116 $43,116 $43,116 $43,116 $43,116 $43,116 $43,116
Cash result $2,525 $902,169 $648,231 $655,851 $691,694 $450,379 $735,720 $747,811 $780,039 $791,455 $826,687 $838,856Note: Result after capital expenditure per annum
Water Services ($645,678) ($954,477) ($668,695) ($744,727) ($743,245) ($742,369) ($740,996) ($740,150) ($739,713) ($738,803) ($737,865) ($736,646)
Add back Depreciation $654,302 $654,302 $757,302 $757,302 $757,302 $757,302 $757,302 $757,302 $757,302 $757,302 $757,302 $757,302
Cash result $8,624 ($300,175) $88,607 $12,575 $14,057 $14,933 $16,306 $17,152 $17,589 $18,499 $19,437 $20,656Note: Result after capital expenditure per annum
Sewer Services ($251,947) ($196,570) ($201,591) ($201,468) ($200,973) ($200,819) ($200,271) ($200,079) ($199,882) ($199,676) ($199,465) ($199,246)
Add back depreciation $205,727 $205,727 $205,727 $205,727 $205,727 $205,727 $205,727 $205,727 $205,727 $205,727 $205,727 $205,727
Cash result ($46,220) $9,157 $4,136 $4,259 $4,754 $4,908 $5,456 $5,648 $5,845 $6,051 $6,262 $6,481Note: Result after, on average capital expenditure per annum
2020/2021 Long Term Finanicla Plan Scenario: Planned - 2.60% Rate Pegging Increase
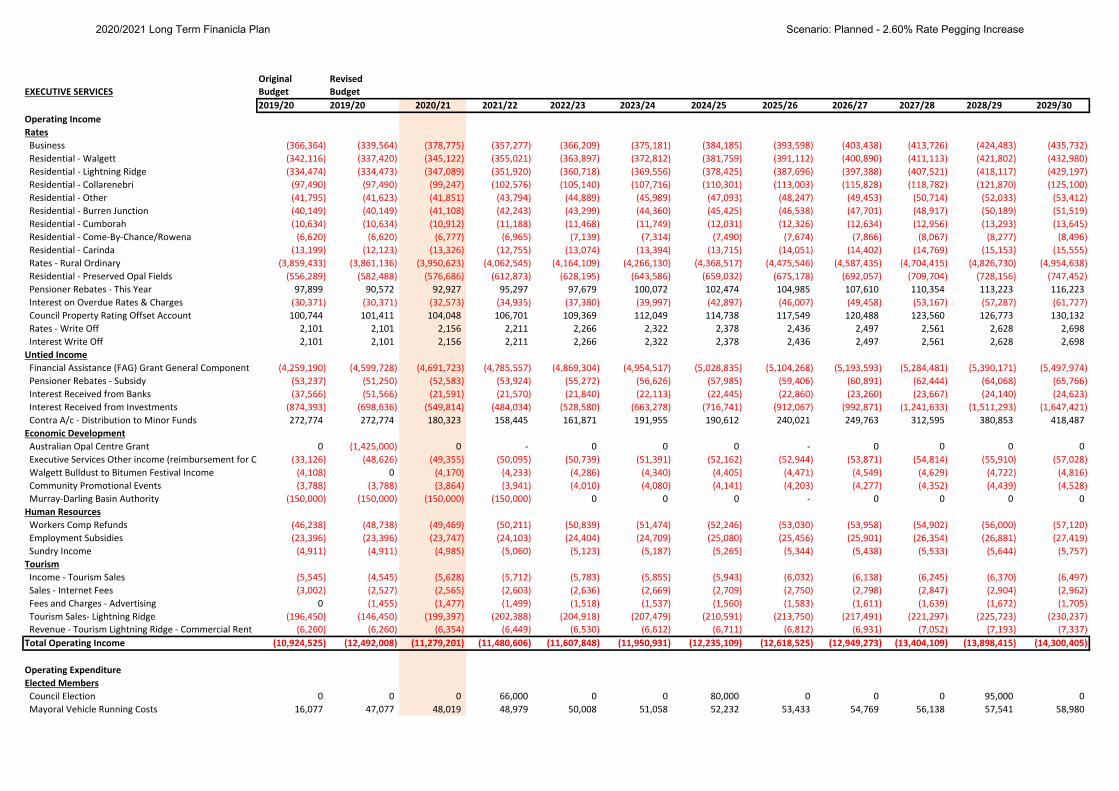
Original RevisedEXECUTIVE SERVICES Budget Budget
2019/20 2019/20 2020/21 2021/22 2022/23 2023/24 2024/25 2025/26 2026/27 2027/28 2028/29 2029/30Operating IncomeRates Business (366,364) (339,564) (378,775) (357,277) (366,209) (375,181) (384,185) (393,598) (403,438) (413,726) (424,483) (435,732)
Residential ‐ Walgett (342,116) (337,420) (345,122) (355,021) (363,897) (372,812) (381,759) (391,112) (400,890) (411,113) (421,802) (432,980)
Residential ‐ Lightning Ridge (334,474) (334,473) (347,089) (351,920) (360,718) (369,556) (378,425) (387,696) (397,388) (407,521) (418,117) (429,197)
Residential ‐ Collarenebri (97,490) (97,490) (99,247) (102,576) (105,140) (107,716) (110,301) (113,003) (115,828) (118,782) (121,870) (125,100)
Residential ‐ Other (41,795) (41,623) (41,851) (43,794) (44,889) (45,989) (47,093) (48,247) (49,453) (50,714) (52,033) (53,412)
Residential ‐ Burren Junction (40,149) (40,149) (41,108) (42,243) (43,299) (44,360) (45,425) (46,538) (47,701) (48,917) (50,189) (51,519)
Residential ‐ Cumborah (10,634) (10,634) (10,912) (11,188) (11,468) (11,749) (12,031) (12,326) (12,634) (12,956) (13,293) (13,645)
Residential ‐ Come‐By‐Chance/Rowena (6,620) (6,620) (6,777) (6,965) (7,139) (7,314) (7,490) (7,674) (7,866) (8,067) (8,277) (8,496)
Residential ‐ Carinda (13,199) (12,123) (13,326) (12,755) (13,074) (13,394) (13,715) (14,051) (14,402) (14,769) (15,153) (15,555)
Rates ‐ Rural Ordinary (3,859,433) (3,861,136) (3,950,623) (4,062,545) (4,164,109) (4,266,130) (4,368,517) (4,475,546) (4,587,435) (4,704,415) (4,826,730) (4,954,638)
Residential ‐ Preserved Opal Fields (556,289) (582,488) (576,686) (612,873) (628,195) (643,586) (659,032) (675,178) (692,057) (709,704) (728,156) (747,452)
Pensioner Rebates ‐ This Year 97,899 90,572 92,927 95,297 97,679 100,072 102,474 104,985 107,610 110,354 113,223 116,223
Interest on Overdue Rates & Charges (30,371) (30,371) (32,573) (34,935) (37,380) (39,997) (42,897) (46,007) (49,458) (53,167) (57,287) (61,727)
Council Property Rating Offset Account 100,744 101,411 104,048 106,701 109,369 112,049 114,738 117,549 120,488 123,560 126,773 130,132
Rates ‐ Write Off 2,101 2,101 2,156 2,211 2,266 2,322 2,378 2,436 2,497 2,561 2,628 2,698
Interest Write Off 2,101 2,101 2,156 2,211 2,266 2,322 2,378 2,436 2,497 2,561 2,628 2,698
Untied Income Financial Assistance (FAG) Grant General Component (4,259,190) (4,599,728) (4,691,723) (4,785,557) (4,869,304) (4,954,517) (5,028,835) (5,104,268) (5,193,593) (5,284,481) (5,390,171) (5,497,974)
Pensioner Rebates ‐ Subsidy (53,237) (51,250) (52,583) (53,924) (55,272) (56,626) (57,985) (59,406) (60,891) (62,444) (64,068) (65,766)
Interest Received from Banks (37,566) (51,566) (21,591) (21,570) (21,840) (22,113) (22,445) (22,860) (23,260) (23,667) (24,140) (24,623)
Interest Received from Investments (874,393) (698,636) (549,814) (484,034) (528,580) (663,278) (716,741) (912,067) (992,871) (1,241,633) (1,511,293) (1,647,421)
Contra A/c ‐ Distribution to Minor Funds 272,774 272,774 180,323 158,445 161,871 191,955 190,612 240,021 249,763 312,595 380,853 418,487
Economic Development Australian Opal Centre Grant 0 (1,425,000) 0 ‐ 0 0 0 ‐ 0 0 0 0
Executive Services Other income (reimbursement for C (33,126) (48,626) (49,355) (50,095) (50,739) (51,391) (52,162) (52,944) (53,871) (54,814) (55,910) (57,028)
Walgett Bulldust to Bitumen Festival Income (4,108) 0 (4,170) (4,233) (4,286) (4,340) (4,405) (4,471) (4,549) (4,629) (4,722) (4,816)
Community Promotional Events (3,788) (3,788) (3,864) (3,941) (4,010) (4,080) (4,141) (4,203) (4,277) (4,352) (4,439) (4,528)
Murray‐Darling Basin Authority (150,000) (150,000) (150,000) (150,000) 0 0 0 ‐ 0 0 0 0
Human Resources Workers Comp Refunds (46,238) (48,738) (49,469) (50,211) (50,839) (51,474) (52,246) (53,030) (53,958) (54,902) (56,000) (57,120)
Employment Subsidies (23,396) (23,396) (23,747) (24,103) (24,404) (24,709) (25,080) (25,456) (25,901) (26,354) (26,881) (27,419)
Sundry Income (4,911) (4,911) (4,985) (5,060) (5,123) (5,187) (5,265) (5,344) (5,438) (5,533) (5,644) (5,757)
Tourism Income ‐ Tourism Sales (5,545) (4,545) (5,628) (5,712) (5,783) (5,855) (5,943) (6,032) (6,138) (6,245) (6,370) (6,497)
Sales ‐ Internet Fees (3,002) (2,527) (2,565) (2,603) (2,636) (2,669) (2,709) (2,750) (2,798) (2,847) (2,904) (2,962)
Fees and Charges ‐ Advertising 0 (1,455) (1,477) (1,499) (1,518) (1,537) (1,560) (1,583) (1,611) (1,639) (1,672) (1,705)
Tourism Sales‐ Lightning Ridge (196,450) (146,450) (199,397) (202,388) (204,918) (207,479) (210,591) (213,750) (217,491) (221,297) (225,723) (230,237)
Revenue ‐ Tourism Lightning Ridge ‐ Commercial Rent (6,260) (6,260) (6,354) (6,449) (6,530) (6,612) (6,711) (6,812) (6,931) (7,052) (7,193) (7,337)
Total Operating Income (10,924,525) (12,492,008) (11,279,201) (11,480,606) (11,607,848) (11,950,931) (12,235,109) (12,618,525) (12,949,273) (13,404,109) (13,898,415) (14,300,405)
Operating ExpenditureElected Members Council Election 0 0 0 66,000 0 0 80,000 0 0 0 95,000 0
Mayoral Vehicle Running Costs 16,077 47,077 48,019 48,979 50,008 51,058 52,232 53,433 54,769 56,138 57,541 58,980
2020/2021 Long Term Finanicla Plan Scenario: Planned - 2.60% Rate Pegging Increase
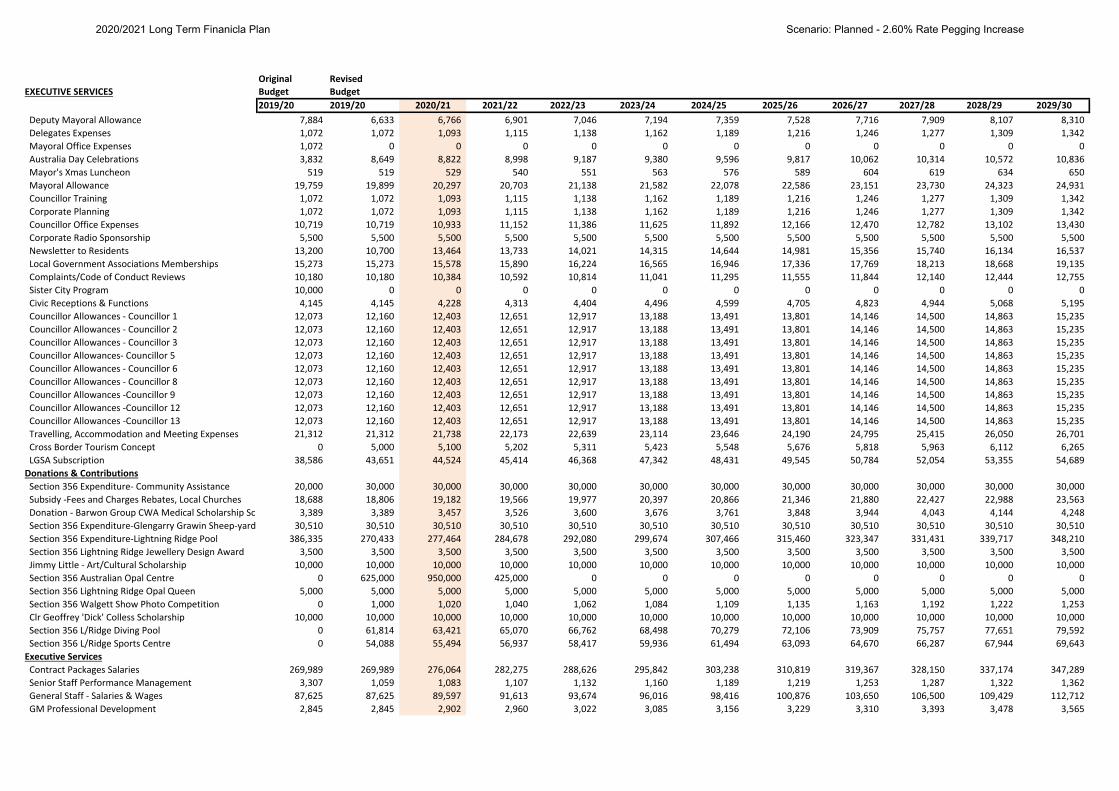
Original RevisedEXECUTIVE SERVICES Budget Budget
2019/20 2019/20 2020/21 2021/22 2022/23 2023/24 2024/25 2025/26 2026/27 2027/28 2028/29 2029/30 Deputy Mayoral Allowance 7,884 6,633 6,766 6,901 7,046 7,194 7,359 7,528 7,716 7,909 8,107 8,310
Delegates Expenses 1,072 1,072 1,093 1,115 1,138 1,162 1,189 1,216 1,246 1,277 1,309 1,342
Mayoral Office Expenses 1,072 0 0 0 0 0 0 0 0 0 0 0
Australia Day Celebrations 3,832 8,649 8,822 8,998 9,187 9,380 9,596 9,817 10,062 10,314 10,572 10,836
Mayor's Xmas Luncheon 519 519 529 540 551 563 576 589 604 619 634 650
Mayoral Allowance 19,759 19,899 20,297 20,703 21,138 21,582 22,078 22,586 23,151 23,730 24,323 24,931
Councillor Training 1,072 1,072 1,093 1,115 1,138 1,162 1,189 1,216 1,246 1,277 1,309 1,342
Corporate Planning 1,072 1,072 1,093 1,115 1,138 1,162 1,189 1,216 1,246 1,277 1,309 1,342
Councillor Office Expenses 10,719 10,719 10,933 11,152 11,386 11,625 11,892 12,166 12,470 12,782 13,102 13,430
Corporate Radio Sponsorship 5,500 5,500 5,500 5,500 5,500 5,500 5,500 5,500 5,500 5,500 5,500 5,500
Newsletter to Residents 13,200 10,700 13,464 13,733 14,021 14,315 14,644 14,981 15,356 15,740 16,134 16,537
Local Government Associations Memberships 15,273 15,273 15,578 15,890 16,224 16,565 16,946 17,336 17,769 18,213 18,668 19,135
Complaints/Code of Conduct Reviews 10,180 10,180 10,384 10,592 10,814 11,041 11,295 11,555 11,844 12,140 12,444 12,755
Sister City Program 10,000 0 0 0 0 0 0 0 0 0 0 0
Civic Receptions & Functions 4,145 4,145 4,228 4,313 4,404 4,496 4,599 4,705 4,823 4,944 5,068 5,195
Councillor Allowances ‐ Councillor 1 12,073 12,160 12,403 12,651 12,917 13,188 13,491 13,801 14,146 14,500 14,863 15,235
Councillor Allowances ‐ Councillor 2 12,073 12,160 12,403 12,651 12,917 13,188 13,491 13,801 14,146 14,500 14,863 15,235
Councillor Allowances ‐ Councillor 3 12,073 12,160 12,403 12,651 12,917 13,188 13,491 13,801 14,146 14,500 14,863 15,235
Councillor Allowances‐ Councillor 5 12,073 12,160 12,403 12,651 12,917 13,188 13,491 13,801 14,146 14,500 14,863 15,235
Councillor Allowances ‐ Councillor 6 12,073 12,160 12,403 12,651 12,917 13,188 13,491 13,801 14,146 14,500 14,863 15,235
Councillor Allowances ‐ Councillor 8 12,073 12,160 12,403 12,651 12,917 13,188 13,491 13,801 14,146 14,500 14,863 15,235
Councillor Allowances ‐Councillor 9 12,073 12,160 12,403 12,651 12,917 13,188 13,491 13,801 14,146 14,500 14,863 15,235
Councillor Allowances ‐Councillor 12 12,073 12,160 12,403 12,651 12,917 13,188 13,491 13,801 14,146 14,500 14,863 15,235
Councillor Allowances ‐Councillor 13 12,073 12,160 12,403 12,651 12,917 13,188 13,491 13,801 14,146 14,500 14,863 15,235
Travelling, Accommodation and Meeting Expenses 21,312 21,312 21,738 22,173 22,639 23,114 23,646 24,190 24,795 25,415 26,050 26,701
Cross Border Tourism Concept 0 5,000 5,100 5,202 5,311 5,423 5,548 5,676 5,818 5,963 6,112 6,265
LGSA Subscription 38,586 43,651 44,524 45,414 46,368 47,342 48,431 49,545 50,784 52,054 53,355 54,689
Donations & Contributions Section 356 Expenditure‐ Community Assistance 20,000 30,000 30,000 30,000 30,000 30,000 30,000 30,000 30,000 30,000 30,000 30,000
Subsidy ‐Fees and Charges Rebates, Local Churches 18,688 18,806 19,182 19,566 19,977 20,397 20,866 21,346 21,880 22,427 22,988 23,563
Donation ‐ Barwon Group CWA Medical Scholarship Sch 3,389 3,389 3,457 3,526 3,600 3,676 3,761 3,848 3,944 4,043 4,144 4,248
Section 356 Expenditure‐Glengarry Grawin Sheep‐yards 30,510 30,510 30,510 30,510 30,510 30,510 30,510 30,510 30,510 30,510 30,510 30,510
Section 356 Expenditure‐Lightning Ridge Pool 386,335 270,433 277,464 284,678 292,080 299,674 307,466 315,460 323,347 331,431 339,717 348,210
Section 356 Lightning Ridge Jewellery Design Award 3,500 3,500 3,500 3,500 3,500 3,500 3,500 3,500 3,500 3,500 3,500 3,500
Jimmy Little ‐ Art/Cultural Scholarship 10,000 10,000 10,000 10,000 10,000 10,000 10,000 10,000 10,000 10,000 10,000 10,000
Section 356 Australian Opal Centre 0 625,000 950,000 425,000 0 0 0 0 0 0 0 0
Section 356 Lightning Ridge Opal Queen 5,000 5,000 5,000 5,000 5,000 5,000 5,000 5,000 5,000 5,000 5,000 5,000
Section 356 Walgett Show Photo Competition 0 1,000 1,020 1,040 1,062 1,084 1,109 1,135 1,163 1,192 1,222 1,253
Clr Geoffrey 'Dick' Colless Scholarship 10,000 10,000 10,000 10,000 10,000 10,000 10,000 10,000 10,000 10,000 10,000 10,000
Section 356 L/Ridge Diving Pool 0 61,814 63,421 65,070 66,762 68,498 70,279 72,106 73,909 75,757 77,651 79,592
Section 356 L/Ridge Sports Centre 0 54,088 55,494 56,937 58,417 59,936 61,494 63,093 64,670 66,287 67,944 69,643
Executive Services Contract Packages Salaries 269,989 269,989 276,064 282,275 288,626 295,842 303,238 310,819 319,367 328,150 337,174 347,289
Senior Staff Performance Management 3,307 1,059 1,083 1,107 1,132 1,160 1,189 1,219 1,253 1,287 1,322 1,362
General Staff ‐ Salaries & Wages 87,625 87,625 89,597 91,613 93,674 96,016 98,416 100,876 103,650 106,500 109,429 112,712
GM Professional Development 2,845 2,845 2,902 2,960 3,022 3,085 3,156 3,229 3,310 3,393 3,478 3,565
2020/2021 Long Term Finanicla Plan Scenario: Planned - 2.60% Rate Pegging Increase
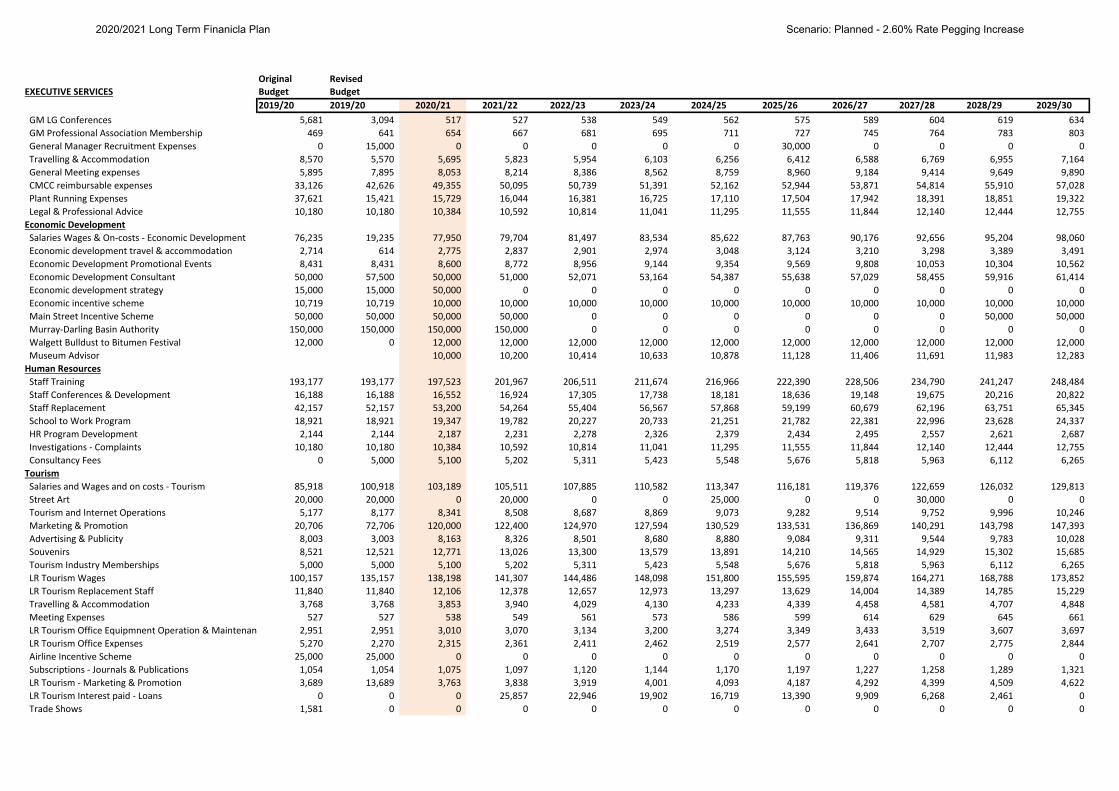
Original RevisedEXECUTIVE SERVICES Budget Budget
2019/20 2019/20 2020/21 2021/22 2022/23 2023/24 2024/25 2025/26 2026/27 2027/28 2028/29 2029/30 GM LG Conferences 5,681 3,094 517 527 538 549 562 575 589 604 619 634
GM Professional Association Membership 469 641 654 667 681 695 711 727 745 764 783 803
General Manager Recruitment Expenses 0 15,000 0 0 0 0 0 30,000 0 0 0 0
Travelling & Accommodation 8,570 5,570 5,695 5,823 5,954 6,103 6,256 6,412 6,588 6,769 6,955 7,164
General Meeting expenses 5,895 7,895 8,053 8,214 8,386 8,562 8,759 8,960 9,184 9,414 9,649 9,890
CMCC reimbursable expenses 33,126 42,626 49,355 50,095 50,739 51,391 52,162 52,944 53,871 54,814 55,910 57,028
Plant Running Expenses 37,621 15,421 15,729 16,044 16,381 16,725 17,110 17,504 17,942 18,391 18,851 19,322
Legal & Professional Advice 10,180 10,180 10,384 10,592 10,814 11,041 11,295 11,555 11,844 12,140 12,444 12,755
Economic Development Salaries Wages & On‐costs ‐ Economic Development 76,235 19,235 77,950 79,704 81,497 83,534 85,622 87,763 90,176 92,656 95,204 98,060
Economic development travel & accommodation 2,714 614 2,775 2,837 2,901 2,974 3,048 3,124 3,210 3,298 3,389 3,491
Economic Development Promotional Events 8,431 8,431 8,600 8,772 8,956 9,144 9,354 9,569 9,808 10,053 10,304 10,562
Economic Development Consultant 50,000 57,500 50,000 51,000 52,071 53,164 54,387 55,638 57,029 58,455 59,916 61,414
Economic development strategy 15,000 15,000 50,000 0 0 0 0 0 0 0 0 0
Economic incentive scheme 10,719 10,719 10,000 10,000 10,000 10,000 10,000 10,000 10,000 10,000 10,000 10,000
Main Street Incentive Scheme 50,000 50,000 50,000 50,000 0 0 0 0 0 0 50,000 50,000
Murray‐Darling Basin Authority 150,000 150,000 150,000 150,000 0 0 0 0 0 0 0 0
Walgett Bulldust to Bitumen Festival 12,000 0 12,000 12,000 12,000 12,000 12,000 12,000 12,000 12,000 12,000 12,000
Museum Advisor 10,000 10,200 10,414 10,633 10,878 11,128 11,406 11,691 11,983 12,283
Human Resources Staff Training 193,177 193,177 197,523 201,967 206,511 211,674 216,966 222,390 228,506 234,790 241,247 248,484
Staff Conferences & Development 16,188 16,188 16,552 16,924 17,305 17,738 18,181 18,636 19,148 19,675 20,216 20,822
Staff Replacement 42,157 52,157 53,200 54,264 55,404 56,567 57,868 59,199 60,679 62,196 63,751 65,345
School to Work Program 18,921 18,921 19,347 19,782 20,227 20,733 21,251 21,782 22,381 22,996 23,628 24,337
HR Program Development 2,144 2,144 2,187 2,231 2,278 2,326 2,379 2,434 2,495 2,557 2,621 2,687
Investigations ‐ Complaints 10,180 10,180 10,384 10,592 10,814 11,041 11,295 11,555 11,844 12,140 12,444 12,755
Consultancy Fees 0 5,000 5,100 5,202 5,311 5,423 5,548 5,676 5,818 5,963 6,112 6,265
Tourism Salaries and Wages and on costs ‐ Tourism 85,918 100,918 103,189 105,511 107,885 110,582 113,347 116,181 119,376 122,659 126,032 129,813
Street Art 20,000 20,000 0 20,000 0 0 25,000 0 0 30,000 0 0
Tourism and Internet Operations 5,177 8,177 8,341 8,508 8,687 8,869 9,073 9,282 9,514 9,752 9,996 10,246
Marketing & Promotion 20,706 72,706 120,000 122,400 124,970 127,594 130,529 133,531 136,869 140,291 143,798 147,393
Advertising & Publicity 8,003 3,003 8,163 8,326 8,501 8,680 8,880 9,084 9,311 9,544 9,783 10,028
Souvenirs 8,521 12,521 12,771 13,026 13,300 13,579 13,891 14,210 14,565 14,929 15,302 15,685
Tourism Industry Memberships 5,000 5,000 5,100 5,202 5,311 5,423 5,548 5,676 5,818 5,963 6,112 6,265
LR Tourism Wages 100,157 135,157 138,198 141,307 144,486 148,098 151,800 155,595 159,874 164,271 168,788 173,852
LR Tourism Replacement Staff 11,840 11,840 12,106 12,378 12,657 12,973 13,297 13,629 14,004 14,389 14,785 15,229
Travelling & Accommodation 3,768 3,768 3,853 3,940 4,029 4,130 4,233 4,339 4,458 4,581 4,707 4,848
Meeting Expenses 527 527 538 549 561 573 586 599 614 629 645 661
LR Tourism Office Equipmnent Operation & Maintenan 2,951 2,951 3,010 3,070 3,134 3,200 3,274 3,349 3,433 3,519 3,607 3,697
LR Tourism Office Expenses 5,270 2,270 2,315 2,361 2,411 2,462 2,519 2,577 2,641 2,707 2,775 2,844
Airline Incentive Scheme 25,000 25,000 0 0 0 0 0 0 0 0 0 0
Subscriptions ‐ Journals & Publications 1,054 1,054 1,075 1,097 1,120 1,144 1,170 1,197 1,227 1,258 1,289 1,321
LR Tourism ‐ Marketing & Promotion 3,689 13,689 3,763 3,838 3,919 4,001 4,093 4,187 4,292 4,399 4,509 4,622
LR Tourism Interest paid ‐ Loans 0 0 0 25,857 22,946 19,902 16,719 13,390 9,909 6,268 2,461 0
Trade Shows 1,581 0 0 0 0 0 0 0 0 0 0 0
2020/2021 Long Term Finanicla Plan Scenario: Planned - 2.60% Rate Pegging Increase
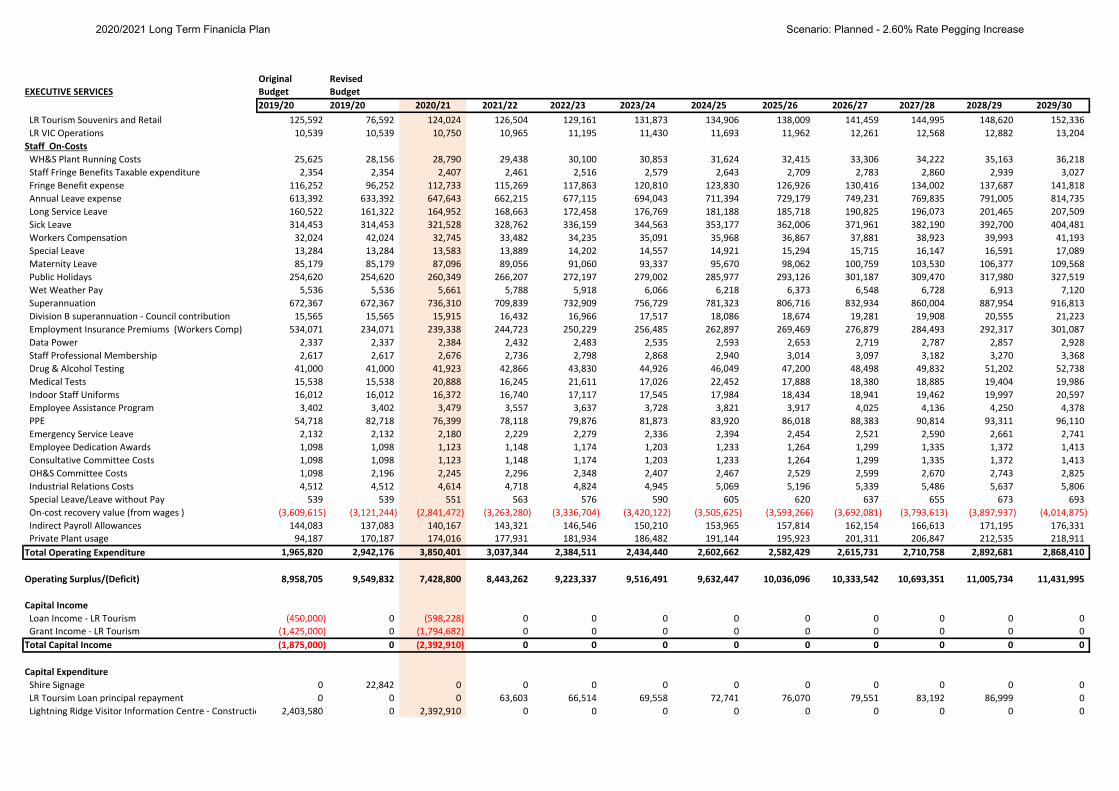
Original RevisedEXECUTIVE SERVICES Budget Budget
2019/20 2019/20 2020/21 2021/22 2022/23 2023/24 2024/25 2025/26 2026/27 2027/28 2028/29 2029/30 LR Tourism Souvenirs and Retail 125,592 76,592 124,024 126,504 129,161 131,873 134,906 138,009 141,459 144,995 148,620 152,336
LR VIC Operations 10,539 10,539 10,750 10,965 11,195 11,430 11,693 11,962 12,261 12,568 12,882 13,204
Staff On‐Costs WH&S Plant Running Costs 25,625 28,156 28,790 29,438 30,100 30,853 31,624 32,415 33,306 34,222 35,163 36,218
Staff Fringe Benefits Taxable expenditure 2,354 2,354 2,407 2,461 2,516 2,579 2,643 2,709 2,783 2,860 2,939 3,027
Fringe Benefit expense 116,252 96,252 112,733 115,269 117,863 120,810 123,830 126,926 130,416 134,002 137,687 141,818
Annual Leave expense 613,392 633,392 647,643 662,215 677,115 694,043 711,394 729,179 749,231 769,835 791,005 814,735
Long Service Leave 160,522 161,322 164,952 168,663 172,458 176,769 181,188 185,718 190,825 196,073 201,465 207,509
Sick Leave 314,453 314,453 321,528 328,762 336,159 344,563 353,177 362,006 371,961 382,190 392,700 404,481
Workers Compensation 32,024 42,024 32,745 33,482 34,235 35,091 35,968 36,867 37,881 38,923 39,993 41,193
Special Leave 13,284 13,284 13,583 13,889 14,202 14,557 14,921 15,294 15,715 16,147 16,591 17,089
Maternity Leave 85,179 85,179 87,096 89,056 91,060 93,337 95,670 98,062 100,759 103,530 106,377 109,568
Public Holidays 254,620 254,620 260,349 266,207 272,197 279,002 285,977 293,126 301,187 309,470 317,980 327,519
Wet Weather Pay 5,536 5,536 5,661 5,788 5,918 6,066 6,218 6,373 6,548 6,728 6,913 7,120
Superannuation 672,367 672,367 736,310 709,839 732,909 756,729 781,323 806,716 832,934 860,004 887,954 916,813
Division B superannuation ‐ Council contribution 15,565 15,565 15,915 16,432 16,966 17,517 18,086 18,674 19,281 19,908 20,555 21,223
Employment Insurance Premiums (Workers Comp) 534,071 234,071 239,338 244,723 250,229 256,485 262,897 269,469 276,879 284,493 292,317 301,087
Data Power 2,337 2,337 2,384 2,432 2,483 2,535 2,593 2,653 2,719 2,787 2,857 2,928
Staff Professional Membership 2,617 2,617 2,676 2,736 2,798 2,868 2,940 3,014 3,097 3,182 3,270 3,368
Drug & Alcohol Testing 41,000 41,000 41,923 42,866 43,830 44,926 46,049 47,200 48,498 49,832 51,202 52,738
Medical Tests 15,538 15,538 20,888 16,245 21,611 17,026 22,452 17,888 18,380 18,885 19,404 19,986
Indoor Staff Uniforms 16,012 16,012 16,372 16,740 17,117 17,545 17,984 18,434 18,941 19,462 19,997 20,597
Employee Assistance Program 3,402 3,402 3,479 3,557 3,637 3,728 3,821 3,917 4,025 4,136 4,250 4,378
PPE 54,718 82,718 76,399 78,118 79,876 81,873 83,920 86,018 88,383 90,814 93,311 96,110
Emergency Service Leave 2,132 2,132 2,180 2,229 2,279 2,336 2,394 2,454 2,521 2,590 2,661 2,741
Employee Dedication Awards 1,098 1,098 1,123 1,148 1,174 1,203 1,233 1,264 1,299 1,335 1,372 1,413
Consultative Committee Costs 1,098 1,098 1,123 1,148 1,174 1,203 1,233 1,264 1,299 1,335 1,372 1,413
OH&S Committee Costs 1,098 2,196 2,245 2,296 2,348 2,407 2,467 2,529 2,599 2,670 2,743 2,825
Industrial Relations Costs 4,512 4,512 4,614 4,718 4,824 4,945 5,069 5,196 5,339 5,486 5,637 5,806
Special Leave/Leave without Pay 539 539 551 563 576 590 605 620 637 655 673 693
On‐cost recovery value (from wages ) (3,609,615) (3,121,244) (2,841,472) (3,263,280) (3,336,704) (3,420,122) (3,505,625) (3,593,266) (3,692,081) (3,793,613) (3,897,937) (4,014,875)
Indirect Payroll Allowances 144,083 137,083 140,167 143,321 146,546 150,210 153,965 157,814 162,154 166,613 171,195 176,331
Private Plant usage 94,187 170,187 174,016 177,931 181,934 186,482 191,144 195,923 201,311 206,847 212,535 218,911
Total Operating Expenditure 1,965,820 2,942,176 3,850,401 3,037,344 2,384,511 2,434,440 2,602,662 2,582,429 2,615,731 2,710,758 2,892,681 2,868,410
Operating Surplus/(Deficit) 8,958,705 9,549,832 7,428,800 8,443,262 9,223,337 9,516,491 9,632,447 10,036,096 10,333,542 10,693,351 11,005,734 11,431,995
Capital Income Loan Income ‐ LR Tourism (450,000) 0 (598,228) 0 0 0 0 0 0 0 0 0
Grant Income ‐ LR Tourism (1,425,000) 0 (1,794,682) 0 0 0 0 0 0 0 0 0
Total Capital Income (1,875,000) 0 (2,392,910) 0 0 0 0 0 0 0 0 0
Capital Expenditure Shire Signage 0 22,842 0 0 0 0 0 0 0 0 0 0
LR Toursim Loan principal repayment 0 0 0 63,603 66,514 69,558 72,741 76,070 79,551 83,192 86,999 0
Lightning Ridge Visitor Information Centre ‐ Constructio 2,403,580 0 2,392,910 0 0 0 0 0 0 0 0 0
2020/2021 Long Term Finanicla Plan Scenario: Planned - 2.60% Rate Pegging Increase
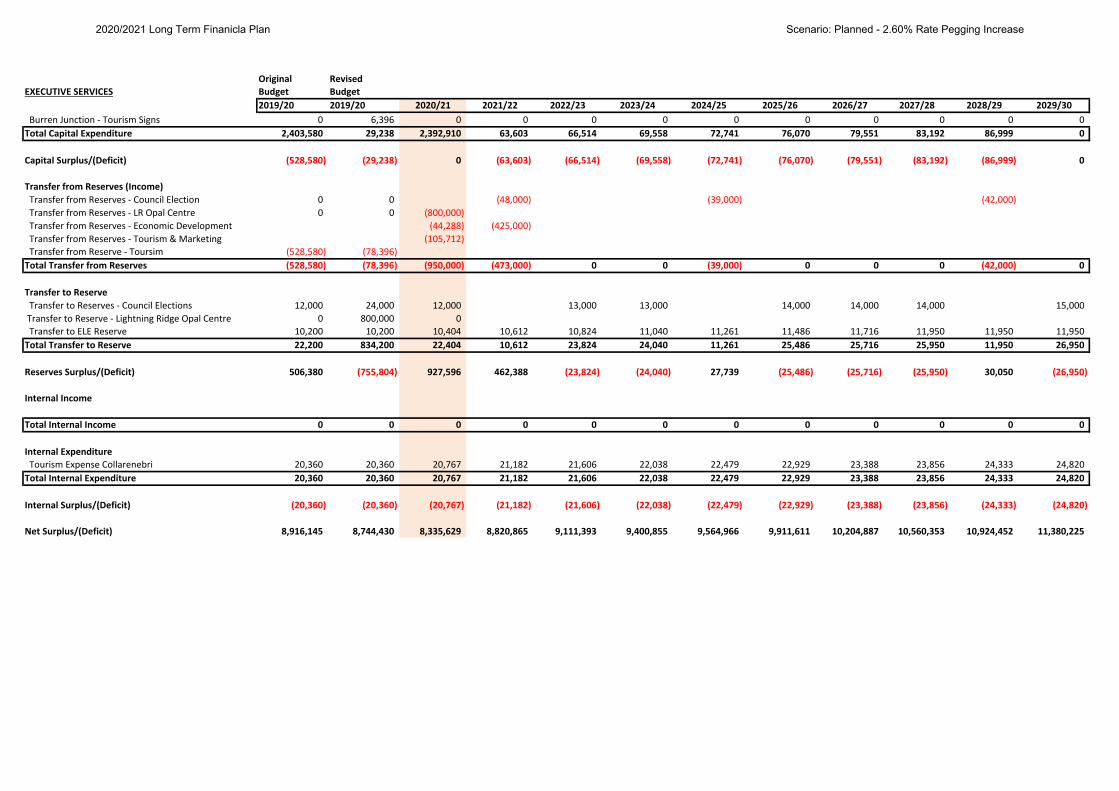
Original RevisedEXECUTIVE SERVICES Budget Budget
2019/20 2019/20 2020/21 2021/22 2022/23 2023/24 2024/25 2025/26 2026/27 2027/28 2028/29 2029/30 Burren Junction ‐ Tourism Signs 0 6,396 0 0 0 0 0 0 0 0 0 0
Total Capital Expenditure 2,403,580 29,238 2,392,910 63,603 66,514 69,558 72,741 76,070 79,551 83,192 86,999 0
Capital Surplus/(Deficit) (528,580) (29,238) 0 (63,603) (66,514) (69,558) (72,741) (76,070) (79,551) (83,192) (86,999) 0
Transfer from Reserves (Income) Transfer from Reserves ‐ Council Election 0 0 (48,000) (39,000) (42,000)
Transfer from Reserves ‐ LR Opal Centre 0 0 (800,000)
Transfer from Reserves ‐ Economic Development (44,288) (425,000)
Transfer from Reserves ‐ Tourism & Marketing (105,712)
Transfer from Reserve ‐ Toursim (528,580) (78,396)
Total Transfer from Reserves (528,580) (78,396) (950,000) (473,000) 0 0 (39,000) 0 0 0 (42,000) 0
Transfer to Reserve Transfer to Reserves ‐ Council Elections 12,000 24,000 12,000 13,000 13,000 14,000 14,000 14,000 15,000
Transfer to Reserve ‐ Lightning Ridge Opal Centre 0 800,000 0
Transfer to ELE Reserve 10,200 10,200 10,404 10,612 10,824 11,040 11,261 11,486 11,716 11,950 11,950 11,950
Total Transfer to Reserve 22,200 834,200 22,404 10,612 23,824 24,040 11,261 25,486 25,716 25,950 11,950 26,950
Reserves Surplus/(Deficit) 506,380 (755,804) 927,596 462,388 (23,824) (24,040) 27,739 (25,486) (25,716) (25,950) 30,050 (26,950)
Internal Income
Total Internal Income 0 0 0 0 0 0 0 0 0 0 0 0
Internal Expenditure Tourism Expense Collarenebri 20,360 20,360 20,767 21,182 21,606 22,038 22,479 22,929 23,388 23,856 24,333 24,820
Total Internal Expenditure 20,360 20,360 20,767 21,182 21,606 22,038 22,479 22,929 23,388 23,856 24,333 24,820
Internal Surplus/(Deficit) (20,360) (20,360) (20,767) (21,182) (21,606) (22,038) (22,479) (22,929) (23,388) (23,856) (24,333) (24,820)
Net Surplus/(Deficit) 8,916,145 8,744,430 8,335,629 8,820,865 9,111,393 9,400,855 9,564,966 9,911,611 10,204,887 10,560,353 10,924,452 11,380,225
2020/2021 Long Term Finanicla Plan Scenario: Planned - 2.60% Rate Pegging Increase
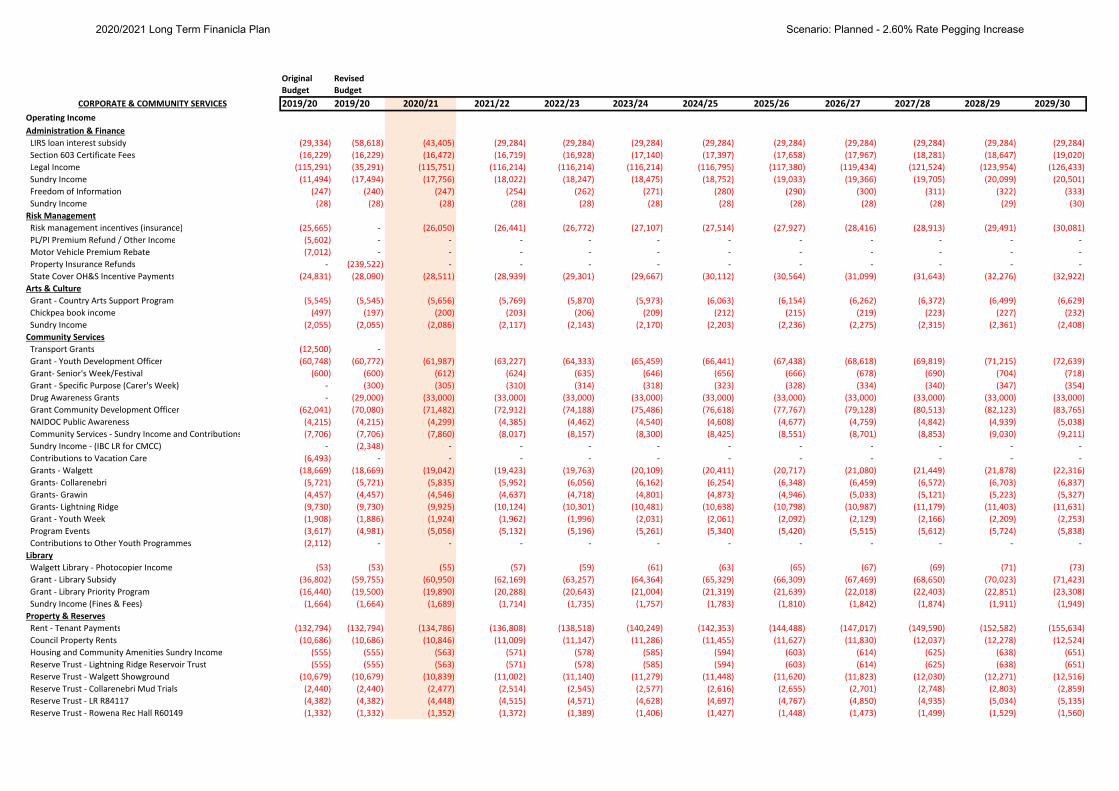
Original RevisedBudget Budget2019/20 2019/20 2020/21 2021/22 2022/23 2023/24 2024/25 2025/26 2026/27 2027/28 2028/29 2029/30
Operating IncomeAdministration & Finance LIRS loan interest subsidy (29,334) (58,618) (43,405) (29,284) (29,284) (29,284) (29,284) (29,284) (29,284) (29,284) (29,284) (29,284)
Section 603 Certificate Fees (16,229) (16,229) (16,472) (16,719) (16,928) (17,140) (17,397) (17,658) (17,967) (18,281) (18,647) (19,020)
Legal Income (115,291) (35,291) (115,751) (116,214) (116,214) (116,214) (116,795) (117,380) (119,434) (121,524) (123,954) (126,433)
Sundry Income (11,494) (17,494) (17,756) (18,022) (18,247) (18,475) (18,752) (19,033) (19,366) (19,705) (20,099) (20,501)
Freedom of Information (247) (240) (247) (254) (262) (271) (280) (290) (300) (311) (322) (333)
Sundry Income (28) (28) (28) (28) (28) (28) (28) (28) (28) (28) (29) (30)
Risk Management Risk management incentives (insurance) (25,665) ‐ (26,050) (26,441) (26,772) (27,107) (27,514) (27,927) (28,416) (28,913) (29,491) (30,081)
PL/PI Premium Refund / Other Income (5,602) ‐ ‐ ‐ ‐ ‐ ‐ ‐ ‐ ‐ ‐ ‐
Motor Vehicle Premium Rebate (7,012) ‐ ‐ ‐ ‐ ‐ ‐ ‐ ‐ ‐ ‐ ‐
Property Insurance Refunds ‐ (239,522) ‐ ‐ ‐ ‐ ‐ ‐ ‐ ‐ ‐ ‐
State Cover OH&S Incentive Payments (24,831) (28,090) (28,511) (28,939) (29,301) (29,667) (30,112) (30,564) (31,099) (31,643) (32,276) (32,922)
Arts & Culture Grant ‐ Country Arts Support Program (5,545) (5,545) (5,656) (5,769) (5,870) (5,973) (6,063) (6,154) (6,262) (6,372) (6,499) (6,629)
Chickpea book income (497) (197) (200) (203) (206) (209) (212) (215) (219) (223) (227) (232)
Sundry Income (2,055) (2,055) (2,086) (2,117) (2,143) (2,170) (2,203) (2,236) (2,275) (2,315) (2,361) (2,408)
Community Services Transport Grants (12,500) ‐
Grant ‐ Youth Development Officer (60,748) (60,772) (61,987) (63,227) (64,333) (65,459) (66,441) (67,438) (68,618) (69,819) (71,215) (72,639)
Grant‐ Senior's Week/Festival (600) (600) (612) (624) (635) (646) (656) (666) (678) (690) (704) (718)
Grant ‐ Specific Purpose (Carer's Week) ‐ (300) (305) (310) (314) (318) (323) (328) (334) (340) (347) (354)
Drug Awareness Grants ‐ (29,000) (33,000) (33,000) (33,000) (33,000) (33,000) (33,000) (33,000) (33,000) (33,000) (33,000)
Grant Community Development Officer (62,041) (70,080) (71,482) (72,912) (74,188) (75,486) (76,618) (77,767) (79,128) (80,513) (82,123) (83,765)
NAIDOC Public Awareness (4,215) (4,215) (4,299) (4,385) (4,462) (4,540) (4,608) (4,677) (4,759) (4,842) (4,939) (5,038)
Community Services ‐ Sundry Income and Contributions (7,706) (7,706) (7,860) (8,017) (8,157) (8,300) (8,425) (8,551) (8,701) (8,853) (9,030) (9,211)
Sundry Income ‐ (IBC LR for CMCC) ‐ (2,348) ‐ ‐ ‐ ‐ ‐ ‐ ‐ ‐ ‐ ‐
Contributions to Vacation Care (6,493) ‐ ‐ ‐ ‐ ‐ ‐ ‐ ‐ ‐ ‐ ‐
Grants ‐ Walgett (18,669) (18,669) (19,042) (19,423) (19,763) (20,109) (20,411) (20,717) (21,080) (21,449) (21,878) (22,316)
Grants‐ Collarenebri (5,721) (5,721) (5,835) (5,952) (6,056) (6,162) (6,254) (6,348) (6,459) (6,572) (6,703) (6,837)
Grants‐ Grawin (4,457) (4,457) (4,546) (4,637) (4,718) (4,801) (4,873) (4,946) (5,033) (5,121) (5,223) (5,327)
Grants‐ Lightning Ridge (9,730) (9,730) (9,925) (10,124) (10,301) (10,481) (10,638) (10,798) (10,987) (11,179) (11,403) (11,631)
Grant ‐ Youth Week (1,908) (1,886) (1,924) (1,962) (1,996) (2,031) (2,061) (2,092) (2,129) (2,166) (2,209) (2,253)
Program Events (3,617) (4,981) (5,056) (5,132) (5,196) (5,261) (5,340) (5,420) (5,515) (5,612) (5,724) (5,838)
Contributions to Other Youth Programmes (2,112) ‐ ‐ ‐ ‐ ‐ ‐ ‐ ‐ ‐ ‐ ‐
Library Walgett Library ‐ Photocopier Income (53) (53) (55) (57) (59) (61) (63) (65) (67) (69) (71) (73)
Grant ‐ Library Subsidy (36,802) (59,755) (60,950) (62,169) (63,257) (64,364) (65,329) (66,309) (67,469) (68,650) (70,023) (71,423)
Grant ‐ Library Priority Program (16,440) (19,500) (19,890) (20,288) (20,643) (21,004) (21,319) (21,639) (22,018) (22,403) (22,851) (23,308)
Sundry Income (Fines & Fees) (1,664) (1,664) (1,689) (1,714) (1,735) (1,757) (1,783) (1,810) (1,842) (1,874) (1,911) (1,949)
Property & Reserves Rent ‐ Tenant Payments (132,794) (132,794) (134,786) (136,808) (138,518) (140,249) (142,353) (144,488) (147,017) (149,590) (152,582) (155,634)
Council Property Rents (10,686) (10,686) (10,846) (11,009) (11,147) (11,286) (11,455) (11,627) (11,830) (12,037) (12,278) (12,524)
Housing and Community Amenities Sundry Income (555) (555) (563) (571) (578) (585) (594) (603) (614) (625) (638) (651)
Reserve Trust ‐ Lightning Ridge Reservoir Trust (555) (555) (563) (571) (578) (585) (594) (603) (614) (625) (638) (651)
Reserve Trust ‐ Walgett Showground (10,679) (10,679) (10,839) (11,002) (11,140) (11,279) (11,448) (11,620) (11,823) (12,030) (12,271) (12,516)
Reserve Trust ‐ Collarenebri Mud Trials (2,440) (2,440) (2,477) (2,514) (2,545) (2,577) (2,616) (2,655) (2,701) (2,748) (2,803) (2,859)
Reserve Trust ‐ LR R84117 (4,382) (4,382) (4,448) (4,515) (4,571) (4,628) (4,697) (4,767) (4,850) (4,935) (5,034) (5,135)
Reserve Trust ‐ Rowena Rec Hall R60149 (1,332) (1,332) (1,352) (1,372) (1,389) (1,406) (1,427) (1,448) (1,473) (1,499) (1,529) (1,560)
CORPORATE & COMMUNITY SERVICES
2020/2021 Long Term Finanicla Plan Scenario: Planned - 2.60% Rate Pegging Increase
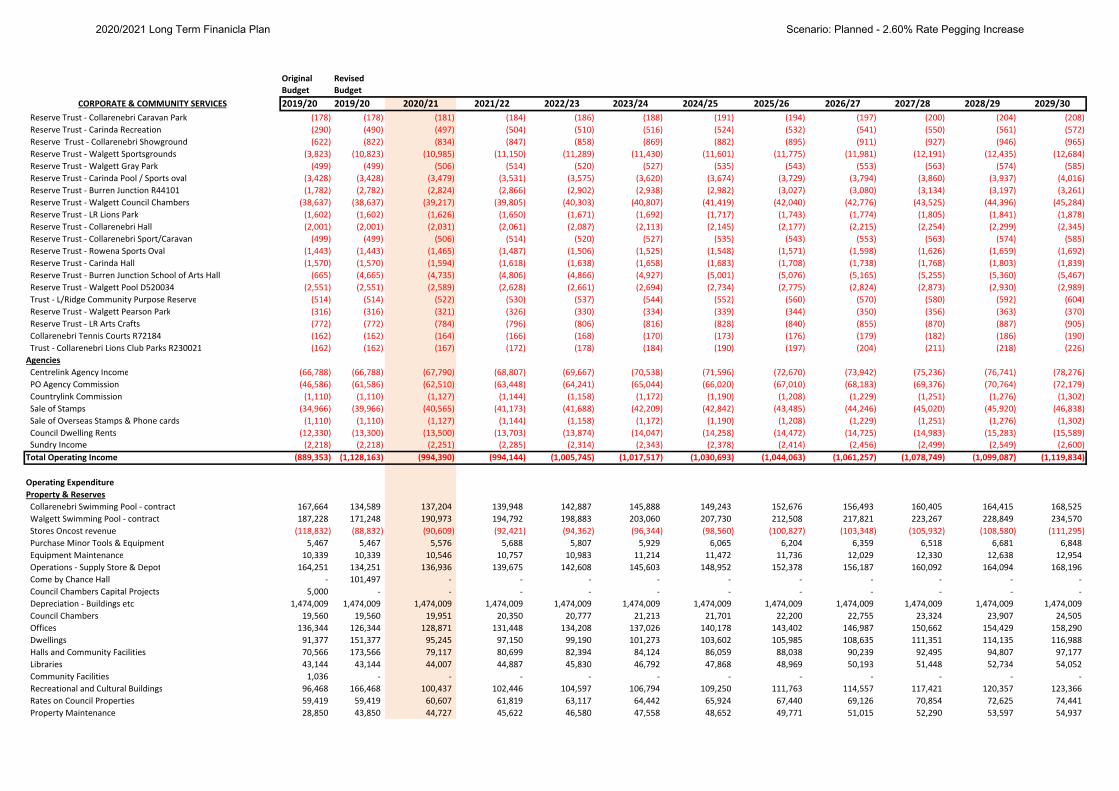
Original RevisedBudget Budget2019/20 2019/20 2020/21 2021/22 2022/23 2023/24 2024/25 2025/26 2026/27 2027/28 2028/29 2029/30CORPORATE & COMMUNITY SERVICES
Reserve Trust ‐ Collarenebri Caravan Park (178) (178) (181) (184) (186) (188) (191) (194) (197) (200) (204) (208)
Reserve Trust ‐ Carinda Recreation (290) (490) (497) (504) (510) (516) (524) (532) (541) (550) (561) (572)
Reserve Trust ‐ Collarenebri Showground (622) (822) (834) (847) (858) (869) (882) (895) (911) (927) (946) (965)
Reserve Trust ‐ Walgett Sportsgrounds (3,823) (10,823) (10,985) (11,150) (11,289) (11,430) (11,601) (11,775) (11,981) (12,191) (12,435) (12,684)
Reserve Trust ‐ Walgett Gray Park (499) (499) (506) (514) (520) (527) (535) (543) (553) (563) (574) (585)
Reserve Trust ‐ Carinda Pool / Sports oval (3,428) (3,428) (3,479) (3,531) (3,575) (3,620) (3,674) (3,729) (3,794) (3,860) (3,937) (4,016)
Reserve Trust ‐ Burren Junction R44101 (1,782) (2,782) (2,824) (2,866) (2,902) (2,938) (2,982) (3,027) (3,080) (3,134) (3,197) (3,261)
Reserve Trust ‐ Walgett Council Chambers (38,637) (38,637) (39,217) (39,805) (40,303) (40,807) (41,419) (42,040) (42,776) (43,525) (44,396) (45,284)
Reserve Trust ‐ LR Lions Park (1,602) (1,602) (1,626) (1,650) (1,671) (1,692) (1,717) (1,743) (1,774) (1,805) (1,841) (1,878)
Reserve Trust ‐ Collarenebri Hall (2,001) (2,001) (2,031) (2,061) (2,087) (2,113) (2,145) (2,177) (2,215) (2,254) (2,299) (2,345)
Reserve Trust ‐ Collarenebri Sport/Caravan (499) (499) (506) (514) (520) (527) (535) (543) (553) (563) (574) (585)
Reserve Trust ‐ Rowena Sports Oval (1,443) (1,443) (1,465) (1,487) (1,506) (1,525) (1,548) (1,571) (1,598) (1,626) (1,659) (1,692)
Reserve Trust ‐ Carinda Hall (1,570) (1,570) (1,594) (1,618) (1,638) (1,658) (1,683) (1,708) (1,738) (1,768) (1,803) (1,839)
Reserve Trust ‐ Burren Junction School of Arts Hall (665) (4,665) (4,735) (4,806) (4,866) (4,927) (5,001) (5,076) (5,165) (5,255) (5,360) (5,467)
Reserve Trust ‐ Walgett Pool D520034 (2,551) (2,551) (2,589) (2,628) (2,661) (2,694) (2,734) (2,775) (2,824) (2,873) (2,930) (2,989)
Trust ‐ L/Ridge Community Purpose Reserve (514) (514) (522) (530) (537) (544) (552) (560) (570) (580) (592) (604)
Reserve Trust ‐ Walgett Pearson Park (316) (316) (321) (326) (330) (334) (339) (344) (350) (356) (363) (370)
Reserve Trust ‐ LR Arts Crafts (772) (772) (784) (796) (806) (816) (828) (840) (855) (870) (887) (905)
Collarenebri Tennis Courts R72184 (162) (162) (164) (166) (168) (170) (173) (176) (179) (182) (186) (190)
Trust ‐ Collarenebri Lions Club Parks R230021 (162) (162) (167) (172) (178) (184) (190) (197) (204) (211) (218) (226)
Agencies Centrelink Agency Income (66,788) (66,788) (67,790) (68,807) (69,667) (70,538) (71,596) (72,670) (73,942) (75,236) (76,741) (78,276)
PO Agency Commission (46,586) (61,586) (62,510) (63,448) (64,241) (65,044) (66,020) (67,010) (68,183) (69,376) (70,764) (72,179)
Countrylink Commission (1,110) (1,110) (1,127) (1,144) (1,158) (1,172) (1,190) (1,208) (1,229) (1,251) (1,276) (1,302)
Sale of Stamps (34,966) (39,966) (40,565) (41,173) (41,688) (42,209) (42,842) (43,485) (44,246) (45,020) (45,920) (46,838)
Sale of Overseas Stamps & Phone cards (1,110) (1,110) (1,127) (1,144) (1,158) (1,172) (1,190) (1,208) (1,229) (1,251) (1,276) (1,302)
Council Dwelling Rents (12,330) (13,300) (13,500) (13,703) (13,874) (14,047) (14,258) (14,472) (14,725) (14,983) (15,283) (15,589)
Sundry Income (2,218) (2,218) (2,251) (2,285) (2,314) (2,343) (2,378) (2,414) (2,456) (2,499) (2,549) (2,600)
Total Operating Income (889,353) (1,128,163) (994,390) (994,144) (1,005,745) (1,017,517) (1,030,693) (1,044,063) (1,061,257) (1,078,749) (1,099,087) (1,119,834)
Operating ExpenditureProperty & Reserves Collarenebri Swimming Pool ‐ contract 167,664 134,589 137,204 139,948 142,887 145,888 149,243 152,676 156,493 160,405 164,415 168,525
Walgett Swimming Pool ‐ contract 187,228 171,248 190,973 194,792 198,883 203,060 207,730 212,508 217,821 223,267 228,849 234,570
Stores Oncost revenue (118,832) (88,832) (90,609) (92,421) (94,362) (96,344) (98,560) (100,827) (103,348) (105,932) (108,580) (111,295)
Purchase Minor Tools & Equipment 5,467 5,467 5,576 5,688 5,807 5,929 6,065 6,204 6,359 6,518 6,681 6,848
Equipment Maintenance 10,339 10,339 10,546 10,757 10,983 11,214 11,472 11,736 12,029 12,330 12,638 12,954
Operations ‐ Supply Store & Depot 164,251 134,251 136,936 139,675 142,608 145,603 148,952 152,378 156,187 160,092 164,094 168,196
Come by Chance Hall ‐ 101,497 ‐ ‐ ‐ ‐ ‐ ‐ ‐ ‐ ‐ ‐
Council Chambers Capital Projects 5,000 ‐ ‐ ‐ ‐ ‐ ‐ ‐ ‐ ‐ ‐ ‐
Depreciation ‐ Buildings etc 1,474,009 1,474,009 1,474,009 1,474,009 1,474,009 1,474,009 1,474,009 1,474,009 1,474,009 1,474,009 1,474,009 1,474,009
Council Chambers 19,560 19,560 19,951 20,350 20,777 21,213 21,701 22,200 22,755 23,324 23,907 24,505
Offices 136,344 126,344 128,871 131,448 134,208 137,026 140,178 143,402 146,987 150,662 154,429 158,290
Dwellings 91,377 151,377 95,245 97,150 99,190 101,273 103,602 105,985 108,635 111,351 114,135 116,988
Halls and Community Facilities 70,566 173,566 79,117 80,699 82,394 84,124 86,059 88,038 90,239 92,495 94,807 97,177
Libraries 43,144 43,144 44,007 44,887 45,830 46,792 47,868 48,969 50,193 51,448 52,734 54,052
Community Facilities 1,036 ‐ ‐ ‐ ‐ ‐ ‐ ‐ ‐ ‐ ‐ ‐
Recreational and Cultural Buildings 96,468 166,468 100,437 102,446 104,597 106,794 109,250 111,763 114,557 117,421 120,357 123,366
Rates on Council Properties 59,419 59,419 60,607 61,819 63,117 64,442 65,924 67,440 69,126 70,854 72,625 74,441
Property Maintenance 28,850 43,850 44,727 45,622 46,580 47,558 48,652 49,771 51,015 52,290 53,597 54,937
2020/2021 Long Term Finanicla Plan Scenario: Planned - 2.60% Rate Pegging Increase
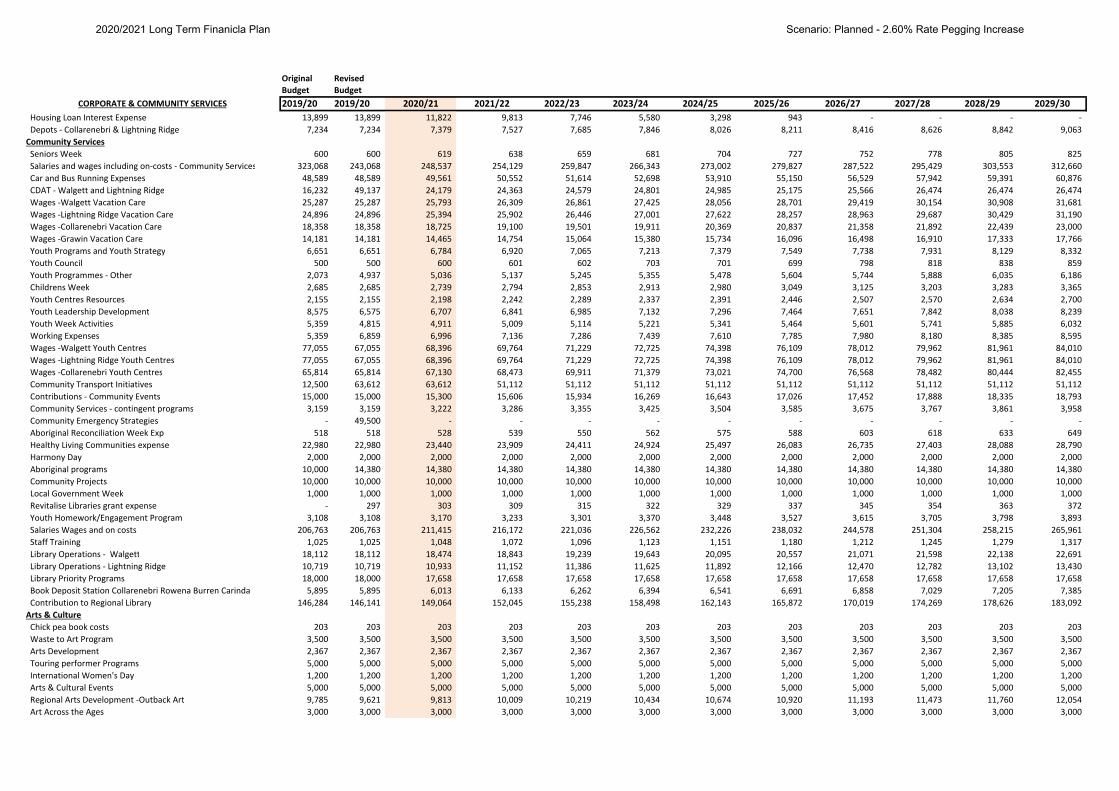
Original RevisedBudget Budget2019/20 2019/20 2020/21 2021/22 2022/23 2023/24 2024/25 2025/26 2026/27 2027/28 2028/29 2029/30CORPORATE & COMMUNITY SERVICES
Housing Loan Interest Expense 13,899 13,899 11,822 9,813 7,746 5,580 3,298 943 ‐ ‐ ‐ ‐
Depots ‐ Collarenebri & Lightning Ridge 7,234 7,234 7,379 7,527 7,685 7,846 8,026 8,211 8,416 8,626 8,842 9,063
Community Services Seniors Week 600 600 619 638 659 681 704 727 752 778 805 825
Salaries and wages including on‐costs ‐ Community Services 323,068 243,068 248,537 254,129 259,847 266,343 273,002 279,827 287,522 295,429 303,553 312,660
Car and Bus Running Expenses 48,589 48,589 49,561 50,552 51,614 52,698 53,910 55,150 56,529 57,942 59,391 60,876
CDAT ‐ Walgett and Lightning Ridge 16,232 49,137 24,179 24,363 24,579 24,801 24,985 25,175 25,566 26,474 26,474 26,474
Wages ‐Walgett Vacation Care 25,287 25,287 25,793 26,309 26,861 27,425 28,056 28,701 29,419 30,154 30,908 31,681
Wages ‐Lightning Ridge Vacation Care 24,896 24,896 25,394 25,902 26,446 27,001 27,622 28,257 28,963 29,687 30,429 31,190
Wages ‐Collarenebri Vacation Care 18,358 18,358 18,725 19,100 19,501 19,911 20,369 20,837 21,358 21,892 22,439 23,000
Wages ‐Grawin Vacation Care 14,181 14,181 14,465 14,754 15,064 15,380 15,734 16,096 16,498 16,910 17,333 17,766
Youth Programs and Youth Strategy 6,651 6,651 6,784 6,920 7,065 7,213 7,379 7,549 7,738 7,931 8,129 8,332
Youth Council 500 500 600 601 602 703 701 699 798 818 838 859
Youth Programmes ‐ Other 2,073 4,937 5,036 5,137 5,245 5,355 5,478 5,604 5,744 5,888 6,035 6,186
Childrens Week 2,685 2,685 2,739 2,794 2,853 2,913 2,980 3,049 3,125 3,203 3,283 3,365
Youth Centres Resources 2,155 2,155 2,198 2,242 2,289 2,337 2,391 2,446 2,507 2,570 2,634 2,700
Youth Leadership Development 8,575 6,575 6,707 6,841 6,985 7,132 7,296 7,464 7,651 7,842 8,038 8,239
Youth Week Activities 5,359 4,815 4,911 5,009 5,114 5,221 5,341 5,464 5,601 5,741 5,885 6,032
Working Expenses 5,359 6,859 6,996 7,136 7,286 7,439 7,610 7,785 7,980 8,180 8,385 8,595
Wages ‐Walgett Youth Centres 77,055 67,055 68,396 69,764 71,229 72,725 74,398 76,109 78,012 79,962 81,961 84,010
Wages ‐Lightning Ridge Youth Centres 77,055 67,055 68,396 69,764 71,229 72,725 74,398 76,109 78,012 79,962 81,961 84,010
Wages ‐Collarenebri Youth Centres 65,814 65,814 67,130 68,473 69,911 71,379 73,021 74,700 76,568 78,482 80,444 82,455
Community Transport Initiatives 12,500 63,612 63,612 51,112 51,112 51,112 51,112 51,112 51,112 51,112 51,112 51,112
Contributions ‐ Community Events 15,000 15,000 15,300 15,606 15,934 16,269 16,643 17,026 17,452 17,888 18,335 18,793
Community Services ‐ contingent programs 3,159 3,159 3,222 3,286 3,355 3,425 3,504 3,585 3,675 3,767 3,861 3,958
Community Emergency Strategies ‐ 49,500 ‐ ‐ ‐ ‐ ‐ ‐ ‐ ‐ ‐ ‐
Aboriginal Reconciliation Week Exp 518 518 528 539 550 562 575 588 603 618 633 649
Healthy Living Communities expense 22,980 22,980 23,440 23,909 24,411 24,924 25,497 26,083 26,735 27,403 28,088 28,790
Harmony Day 2,000 2,000 2,000 2,000 2,000 2,000 2,000 2,000 2,000 2,000 2,000 2,000
Aboriginal programs 10,000 14,380 14,380 14,380 14,380 14,380 14,380 14,380 14,380 14,380 14,380 14,380
Community Projects 10,000 10,000 10,000 10,000 10,000 10,000 10,000 10,000 10,000 10,000 10,000 10,000
Local Government Week 1,000 1,000 1,000 1,000 1,000 1,000 1,000 1,000 1,000 1,000 1,000 1,000
Revitalise Libraries grant expense ‐ 297 303 309 315 322 329 337 345 354 363 372
Youth Homework/Engagement Program 3,108 3,108 3,170 3,233 3,301 3,370 3,448 3,527 3,615 3,705 3,798 3,893
Salaries Wages and on costs 206,763 206,763 211,415 216,172 221,036 226,562 232,226 238,032 244,578 251,304 258,215 265,961
Staff Training 1,025 1,025 1,048 1,072 1,096 1,123 1,151 1,180 1,212 1,245 1,279 1,317
Library Operations ‐ Walgett 18,112 18,112 18,474 18,843 19,239 19,643 20,095 20,557 21,071 21,598 22,138 22,691
Library Operations ‐ Lightning Ridge 10,719 10,719 10,933 11,152 11,386 11,625 11,892 12,166 12,470 12,782 13,102 13,430
Library Priority Programs 18,000 18,000 17,658 17,658 17,658 17,658 17,658 17,658 17,658 17,658 17,658 17,658
Book Deposit Station Collarenebri Rowena Burren Carinda 5,895 5,895 6,013 6,133 6,262 6,394 6,541 6,691 6,858 7,029 7,205 7,385
Contribution to Regional Library 146,284 146,141 149,064 152,045 155,238 158,498 162,143 165,872 170,019 174,269 178,626 183,092
Arts & Culture Chick pea book costs 203 203 203 203 203 203 203 203 203 203 203 203
Waste to Art Program 3,500 3,500 3,500 3,500 3,500 3,500 3,500 3,500 3,500 3,500 3,500 3,500
Arts Development 2,367 2,367 2,367 2,367 2,367 2,367 2,367 2,367 2,367 2,367 2,367 2,367
Touring performer Programs 5,000 5,000 5,000 5,000 5,000 5,000 5,000 5,000 5,000 5,000 5,000 5,000
International Women's Day 1,200 1,200 1,200 1,200 1,200 1,200 1,200 1,200 1,200 1,200 1,200 1,200
Arts & Cultural Events 5,000 5,000 5,000 5,000 5,000 5,000 5,000 5,000 5,000 5,000 5,000 5,000
Regional Arts Development ‐Outback Art 9,785 9,621 9,813 10,009 10,219 10,434 10,674 10,920 11,193 11,473 11,760 12,054
Art Across the Ages 3,000 3,000 3,000 3,000 3,000 3,000 3,000 3,000 3,000 3,000 3,000 3,000
2020/2021 Long Term Finanicla Plan Scenario: Planned - 2.60% Rate Pegging Increase
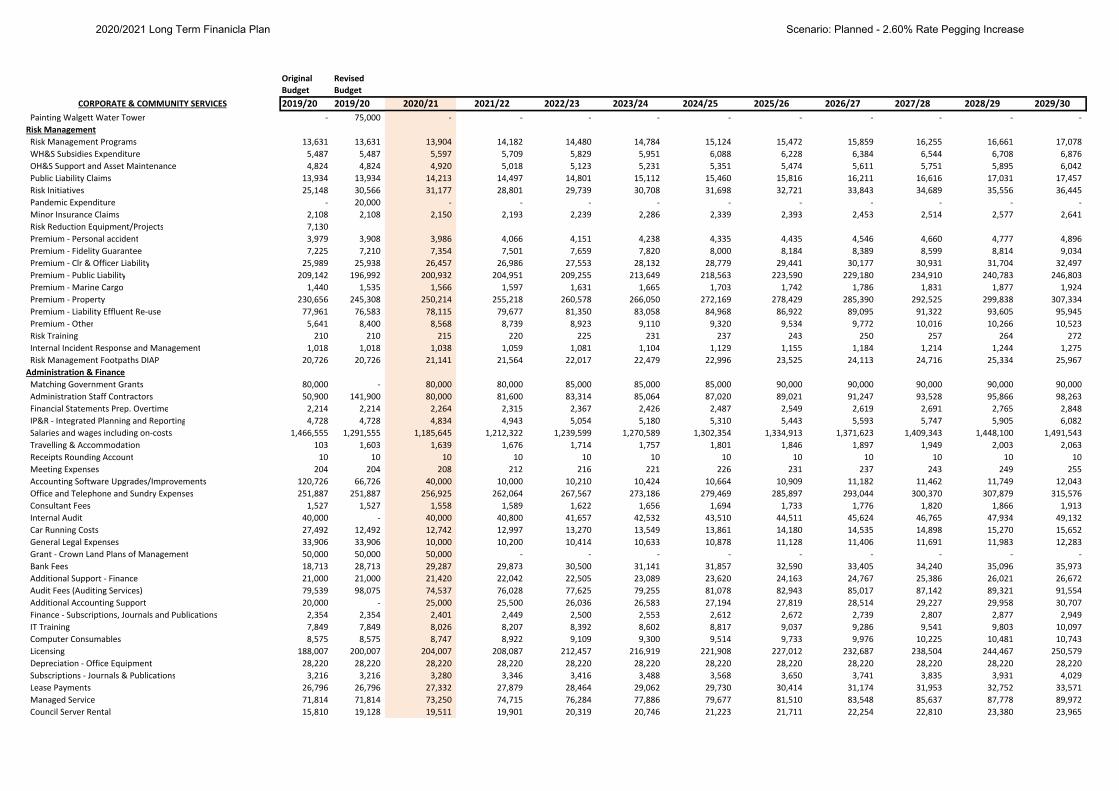
Original RevisedBudget Budget2019/20 2019/20 2020/21 2021/22 2022/23 2023/24 2024/25 2025/26 2026/27 2027/28 2028/29 2029/30CORPORATE & COMMUNITY SERVICES
Painting Walgett Water Tower ‐ 75,000 ‐ ‐ ‐ ‐ ‐ ‐ ‐ ‐ ‐ ‐
Risk Management Risk Management Programs 13,631 13,631 13,904 14,182 14,480 14,784 15,124 15,472 15,859 16,255 16,661 17,078
WH&S Subsidies Expenditure 5,487 5,487 5,597 5,709 5,829 5,951 6,088 6,228 6,384 6,544 6,708 6,876
OH&S Support and Asset Maintenance 4,824 4,824 4,920 5,018 5,123 5,231 5,351 5,474 5,611 5,751 5,895 6,042
Public Liability Claims 13,934 13,934 14,213 14,497 14,801 15,112 15,460 15,816 16,211 16,616 17,031 17,457
Risk Initiatives 25,148 30,566 31,177 28,801 29,739 30,708 31,698 32,721 33,843 34,689 35,556 36,445
Pandemic Expenditure ‐ 20,000 ‐ ‐ ‐ ‐ ‐ ‐ ‐ ‐ ‐ ‐
Minor Insurance Claims 2,108 2,108 2,150 2,193 2,239 2,286 2,339 2,393 2,453 2,514 2,577 2,641
Risk Reduction Equipment/Projects 7,130
Premium ‐ Personal accident 3,979 3,908 3,986 4,066 4,151 4,238 4,335 4,435 4,546 4,660 4,777 4,896
Premium ‐ Fidelity Guarantee 7,225 7,210 7,354 7,501 7,659 7,820 8,000 8,184 8,389 8,599 8,814 9,034
Premium ‐ Clr & Officer Liability 25,989 25,938 26,457 26,986 27,553 28,132 28,779 29,441 30,177 30,931 31,704 32,497
Premium ‐ Public Liability 209,142 196,992 200,932 204,951 209,255 213,649 218,563 223,590 229,180 234,910 240,783 246,803
Premium ‐ Marine Cargo 1,440 1,535 1,566 1,597 1,631 1,665 1,703 1,742 1,786 1,831 1,877 1,924
Premium ‐ Property 230,656 245,308 250,214 255,218 260,578 266,050 272,169 278,429 285,390 292,525 299,838 307,334
Premium ‐ Liability Effluent Re‐use 77,961 76,583 78,115 79,677 81,350 83,058 84,968 86,922 89,095 91,322 93,605 95,945
Premium ‐ Other 5,641 8,400 8,568 8,739 8,923 9,110 9,320 9,534 9,772 10,016 10,266 10,523
Risk Training 210 210 215 220 225 231 237 243 250 257 264 272
Internal Incident Response and Management 1,018 1,018 1,038 1,059 1,081 1,104 1,129 1,155 1,184 1,214 1,244 1,275
Risk Management Footpaths DIAP 20,726 20,726 21,141 21,564 22,017 22,479 22,996 23,525 24,113 24,716 25,334 25,967
Administration & Finance Matching Government Grants 80,000 ‐ 80,000 80,000 85,000 85,000 85,000 90,000 90,000 90,000 90,000 90,000
Administration Staff Contractors 50,900 141,900 80,000 81,600 83,314 85,064 87,020 89,021 91,247 93,528 95,866 98,263
Financial Statements Prep. Overtime 2,214 2,214 2,264 2,315 2,367 2,426 2,487 2,549 2,619 2,691 2,765 2,848
IP&R ‐ Integrated Planning and Reporting 4,728 4,728 4,834 4,943 5,054 5,180 5,310 5,443 5,593 5,747 5,905 6,082
Salaries and wages including on‐costs 1,466,555 1,291,555 1,185,645 1,212,322 1,239,599 1,270,589 1,302,354 1,334,913 1,371,623 1,409,343 1,448,100 1,491,543
Travelling & Accommodation 103 1,603 1,639 1,676 1,714 1,757 1,801 1,846 1,897 1,949 2,003 2,063
Receipts Rounding Account 10 10 10 10 10 10 10 10 10 10 10 10
Meeting Expenses 204 204 208 212 216 221 226 231 237 243 249 255
Accounting Software Upgrades/Improvements 120,726 66,726 40,000 10,000 10,210 10,424 10,664 10,909 11,182 11,462 11,749 12,043
Office and Telephone and Sundry Expenses 251,887 251,887 256,925 262,064 267,567 273,186 279,469 285,897 293,044 300,370 307,879 315,576
Consultant Fees 1,527 1,527 1,558 1,589 1,622 1,656 1,694 1,733 1,776 1,820 1,866 1,913
Internal Audit 40,000 ‐ 40,000 40,800 41,657 42,532 43,510 44,511 45,624 46,765 47,934 49,132
Car Running Costs 27,492 12,492 12,742 12,997 13,270 13,549 13,861 14,180 14,535 14,898 15,270 15,652
General Legal Expenses 33,906 33,906 10,000 10,200 10,414 10,633 10,878 11,128 11,406 11,691 11,983 12,283
Grant ‐ Crown Land Plans of Management 50,000 50,000 50,000 ‐ ‐ ‐ ‐ ‐ ‐ ‐ ‐ ‐
Bank Fees 18,713 28,713 29,287 29,873 30,500 31,141 31,857 32,590 33,405 34,240 35,096 35,973
Additional Support ‐ Finance 21,000 21,000 21,420 22,042 22,505 23,089 23,620 24,163 24,767 25,386 26,021 26,672
Audit Fees (Auditing Services) 79,539 98,075 74,537 76,028 77,625 79,255 81,078 82,943 85,017 87,142 89,321 91,554
Additional Accounting Support 20,000 ‐ 25,000 25,500 26,036 26,583 27,194 27,819 28,514 29,227 29,958 30,707
Finance ‐ Subscriptions, Journals and Publications 2,354 2,354 2,401 2,449 2,500 2,553 2,612 2,672 2,739 2,807 2,877 2,949
IT Training 7,849 7,849 8,026 8,207 8,392 8,602 8,817 9,037 9,286 9,541 9,803 10,097
Computer Consumables 8,575 8,575 8,747 8,922 9,109 9,300 9,514 9,733 9,976 10,225 10,481 10,743
Licensing 188,007 200,007 204,007 208,087 212,457 216,919 221,908 227,012 232,687 238,504 244,467 250,579
Depreciation ‐ Office Equipment 28,220 28,220 28,220 28,220 28,220 28,220 28,220 28,220 28,220 28,220 28,220 28,220
Subscriptions ‐ Journals & Publications 3,216 3,216 3,280 3,346 3,416 3,488 3,568 3,650 3,741 3,835 3,931 4,029
Lease Payments 26,796 26,796 27,332 27,879 28,464 29,062 29,730 30,414 31,174 31,953 32,752 33,571
Managed Service 71,814 71,814 73,250 74,715 76,284 77,886 79,677 81,510 83,548 85,637 87,778 89,972
Council Server Rental 15,810 19,128 19,511 19,901 20,319 20,746 21,223 21,711 22,254 22,810 23,380 23,965
2020/2021 Long Term Finanicla Plan Scenario: Planned - 2.60% Rate Pegging Increase
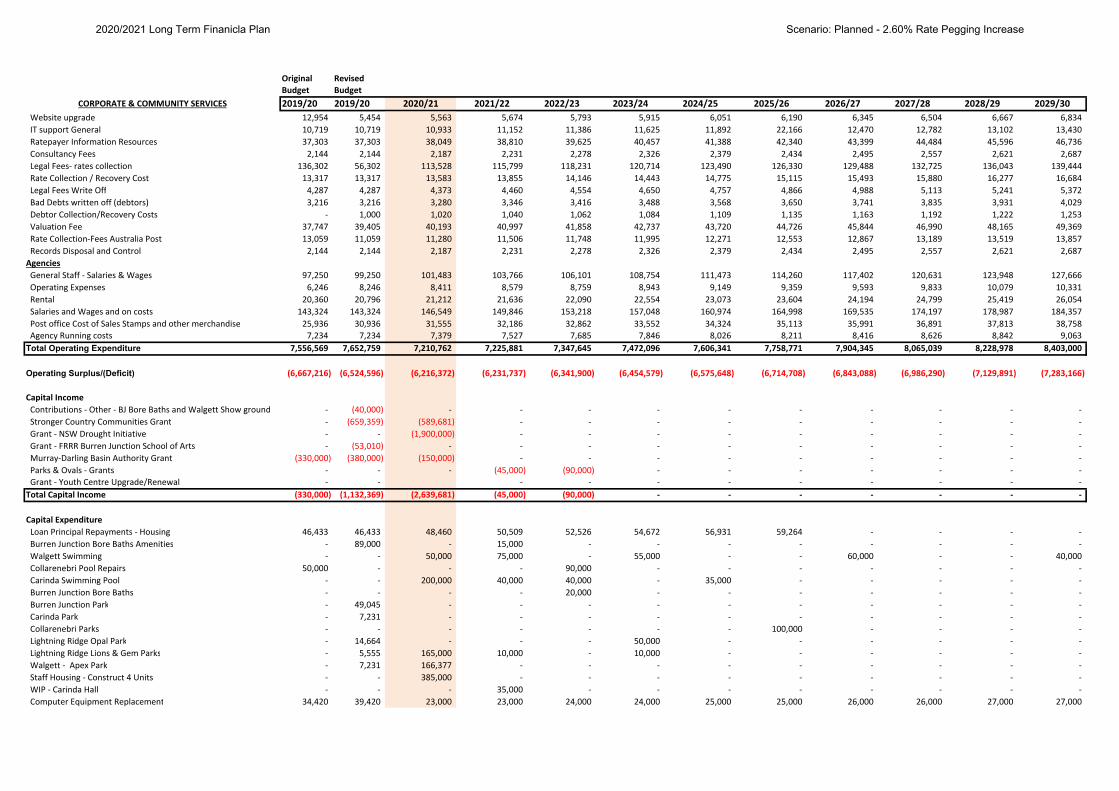
Original RevisedBudget Budget2019/20 2019/20 2020/21 2021/22 2022/23 2023/24 2024/25 2025/26 2026/27 2027/28 2028/29 2029/30CORPORATE & COMMUNITY SERVICES
Website upgrade 12,954 5,454 5,563 5,674 5,793 5,915 6,051 6,190 6,345 6,504 6,667 6,834
IT support General 10,719 10,719 10,933 11,152 11,386 11,625 11,892 22,166 12,470 12,782 13,102 13,430
Ratepayer Information Resources 37,303 37,303 38,049 38,810 39,625 40,457 41,388 42,340 43,399 44,484 45,596 46,736
Consultancy Fees 2,144 2,144 2,187 2,231 2,278 2,326 2,379 2,434 2,495 2,557 2,621 2,687
Legal Fees‐ rates collection 136,302 56,302 113,528 115,799 118,231 120,714 123,490 126,330 129,488 132,725 136,043 139,444
Rate Collection / Recovery Cost 13,317 13,317 13,583 13,855 14,146 14,443 14,775 15,115 15,493 15,880 16,277 16,684
Legal Fees Write Off 4,287 4,287 4,373 4,460 4,554 4,650 4,757 4,866 4,988 5,113 5,241 5,372
Bad Debts written off (debtors) 3,216 3,216 3,280 3,346 3,416 3,488 3,568 3,650 3,741 3,835 3,931 4,029
Debtor Collection/Recovery Costs ‐ 1,000 1,020 1,040 1,062 1,084 1,109 1,135 1,163 1,192 1,222 1,253
Valuation Fee 37,747 39,405 40,193 40,997 41,858 42,737 43,720 44,726 45,844 46,990 48,165 49,369
Rate Collection‐Fees Australia Post 13,059 11,059 11,280 11,506 11,748 11,995 12,271 12,553 12,867 13,189 13,519 13,857
Records Disposal and Control 2,144 2,144 2,187 2,231 2,278 2,326 2,379 2,434 2,495 2,557 2,621 2,687
Agencies General Staff ‐ Salaries & Wages 97,250 99,250 101,483 103,766 106,101 108,754 111,473 114,260 117,402 120,631 123,948 127,666
Operating Expenses 6,246 8,246 8,411 8,579 8,759 8,943 9,149 9,359 9,593 9,833 10,079 10,331
Rental 20,360 20,796 21,212 21,636 22,090 22,554 23,073 23,604 24,194 24,799 25,419 26,054
Salaries and Wages and on costs 143,324 143,324 146,549 149,846 153,218 157,048 160,974 164,998 169,535 174,197 178,987 184,357
Post office Cost of Sales Stamps and other merchandise 25,936 30,936 31,555 32,186 32,862 33,552 34,324 35,113 35,991 36,891 37,813 38,758
Agency Running costs 7,234 7,234 7,379 7,527 7,685 7,846 8,026 8,211 8,416 8,626 8,842 9,063
Total Operating Expenditure 7,556,569 7,652,759 7,210,762 7,225,881 7,347,645 7,472,096 7,606,341 7,758,771 7,904,345 8,065,039 8,228,978 8,403,000
Operating Surplus/(Deficit) (6,667,216) (6,524,596) (6,216,372) (6,231,737) (6,341,900) (6,454,579) (6,575,648) (6,714,708) (6,843,088) (6,986,290) (7,129,891) (7,283,166)
Capital Income Contributions ‐ Other ‐ BJ Bore Baths and Walgett Show ground ‐ (40,000) ‐ ‐ ‐ ‐ ‐ ‐ ‐ ‐ ‐ ‐
Stronger Country Communities Grant ‐ (659,359) (589,681) ‐ ‐ ‐ ‐ ‐ ‐ ‐ ‐ ‐
Grant ‐ NSW Drought Initiative ‐ ‐ (1,900,000) ‐ ‐ ‐ ‐ ‐ ‐ ‐ ‐ ‐
Grant ‐ FRRR Burren Junction School of Arts ‐ (53,010) ‐ ‐ ‐ ‐ ‐ ‐ ‐ ‐ ‐ ‐
Murray‐Darling Basin Authority Grant (330,000) (380,000) (150,000) ‐ ‐ ‐ ‐ ‐ ‐ ‐ ‐ ‐
Parks & Ovals ‐ Grants ‐ ‐ ‐ (45,000) (90,000) ‐ ‐ ‐ ‐ ‐ ‐ ‐
Grant ‐ Youth Centre Upgrade/Renewal ‐ ‐ ‐ ‐ ‐ ‐ ‐ ‐ ‐ ‐ ‐
Total Capital Income (330,000) (1,132,369) (2,639,681) (45,000) (90,000) ‐ ‐ ‐ ‐ ‐ ‐ ‐
Capital Expenditure Loan Principal Repayments ‐ Housing 46,433 46,433 48,460 50,509 52,526 54,672 56,931 59,264 ‐ ‐ ‐ ‐
Burren Junction Bore Baths Amenities ‐ 89,000 ‐ 15,000 ‐ ‐ ‐ ‐ ‐ ‐ ‐ ‐
Walgett Swimming ‐ ‐ 50,000 75,000 ‐ 55,000 ‐ ‐ 60,000 ‐ ‐ 40,000
Collarenebri Pool Repairs 50,000 ‐ ‐ ‐ 90,000 ‐ ‐ ‐ ‐ ‐ ‐ ‐
Carinda Swimming Pool ‐ ‐ 200,000 40,000 40,000 ‐ 35,000 ‐ ‐ ‐ ‐ ‐
Burren Junction Bore Baths ‐ ‐ ‐ ‐ 20,000 ‐ ‐ ‐ ‐ ‐ ‐ ‐
Burren Junction Park ‐ 49,045 ‐ ‐ ‐ ‐ ‐ ‐ ‐ ‐ ‐ ‐
Carinda Park ‐ 7,231 ‐ ‐ ‐ ‐ ‐ ‐ ‐ ‐ ‐ ‐
Collarenebri Parks ‐ ‐ ‐ ‐ ‐ ‐ ‐ 100,000 ‐ ‐ ‐ ‐
Lightning Ridge Opal Park ‐ 14,664 ‐ ‐ ‐ 50,000 ‐ ‐ ‐ ‐ ‐ ‐
Lightning Ridge Lions & Gem Parks ‐ 5,555 165,000 10,000 ‐ 10,000 ‐ ‐ ‐ ‐ ‐ ‐
Walgett ‐ Apex Park ‐ 7,231 166,377 ‐ ‐ ‐ ‐ ‐ ‐ ‐ ‐ ‐
Staff Housing ‐ Construct 4 Units ‐ ‐ 385,000 ‐ ‐ ‐ ‐ ‐ ‐ ‐ ‐ ‐
WIP ‐ Carinda Hall ‐ ‐ ‐ 35,000 ‐ ‐ ‐ ‐ ‐ ‐ ‐ ‐
Computer Equipment Replacement 34,420 39,420 23,000 23,000 24,000 24,000 25,000 25,000 26,000 26,000 27,000 27,000
2020/2021 Long Term Finanicla Plan Scenario: Planned - 2.60% Rate Pegging Increase
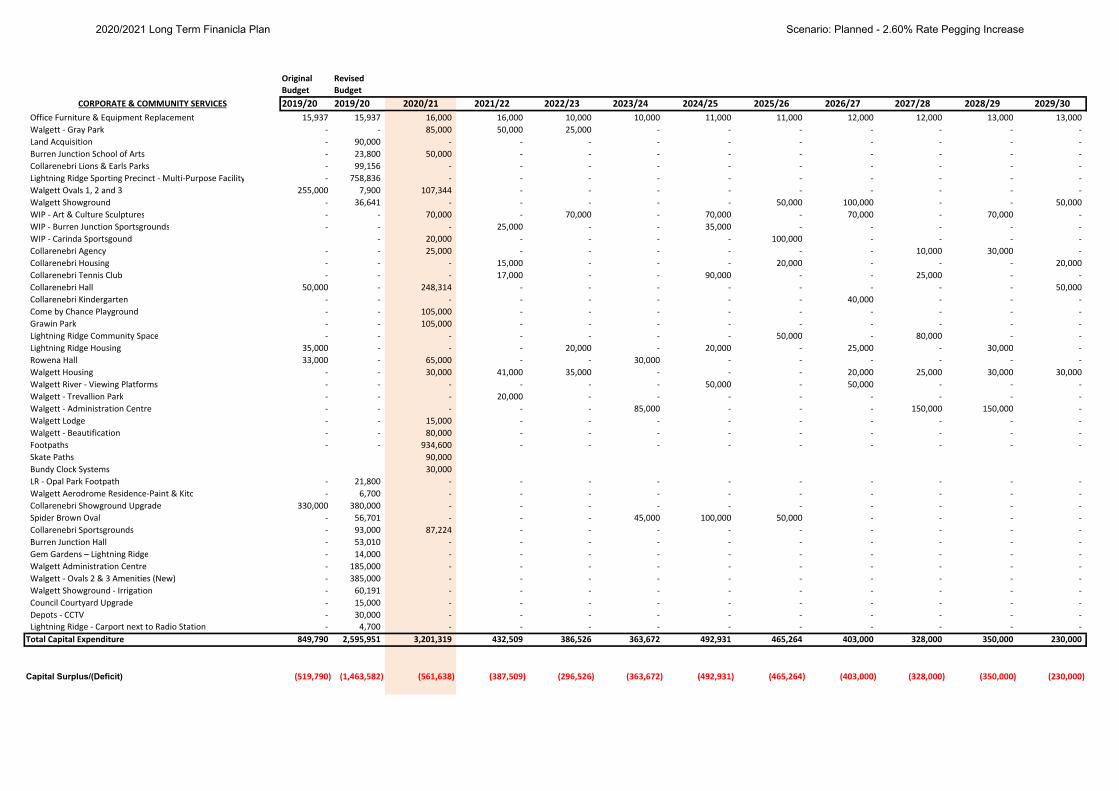
Original RevisedBudget Budget2019/20 2019/20 2020/21 2021/22 2022/23 2023/24 2024/25 2025/26 2026/27 2027/28 2028/29 2029/30CORPORATE & COMMUNITY SERVICES
Office Furniture & Equipment Replacement 15,937 15,937 16,000 16,000 10,000 10,000 11,000 11,000 12,000 12,000 13,000 13,000
Walgett ‐ Gray Park ‐ ‐ 85,000 50,000 25,000 ‐ ‐ ‐ ‐ ‐ ‐ ‐
Land Acquisition ‐ 90,000 ‐ ‐ ‐ ‐ ‐ ‐ ‐ ‐ ‐ ‐
Burren Junction School of Arts ‐ 23,800 50,000 ‐ ‐ ‐ ‐ ‐ ‐ ‐ ‐ ‐
Collarenebri Lions & Earls Parks ‐ 99,156 ‐ ‐ ‐ ‐ ‐ ‐ ‐ ‐ ‐ ‐
Lightning Ridge Sporting Precinct ‐ Multi‐Purpose Facility ‐ 758,836 ‐ ‐ ‐ ‐ ‐ ‐ ‐ ‐ ‐ ‐
Walgett Ovals 1, 2 and 3 255,000 7,900 107,344 ‐ ‐ ‐ ‐ ‐ ‐ ‐ ‐ ‐
Walgett Showground ‐ 36,641 ‐ ‐ ‐ ‐ ‐ 50,000 100,000 ‐ ‐ 50,000
WIP ‐ Art & Culture Sculptures ‐ ‐ 70,000 ‐ 70,000 ‐ 70,000 ‐ 70,000 ‐ 70,000 ‐
WIP ‐ Burren Junction Sportsgrounds ‐ ‐ ‐ 25,000 ‐ ‐ 35,000 ‐ ‐ ‐ ‐ ‐
WIP ‐ Carinda Sportsgound ‐ 20,000 ‐ ‐ ‐ ‐ 100,000 ‐ ‐ ‐ ‐
Collarenebri Agency ‐ ‐ 25,000 ‐ ‐ ‐ ‐ ‐ ‐ 10,000 30,000 ‐
Collarenebri Housing ‐ ‐ ‐ 15,000 ‐ ‐ ‐ 20,000 ‐ ‐ ‐ 20,000
Collarenebri Tennis Club ‐ ‐ ‐ 17,000 ‐ ‐ 90,000 ‐ ‐ 25,000 ‐ ‐
Collarenebri Hall 50,000 ‐ 248,314 ‐ ‐ ‐ ‐ ‐ ‐ ‐ ‐ 50,000
Collarenebri Kindergarten ‐ ‐ ‐ ‐ ‐ ‐ ‐ ‐ 40,000 ‐ ‐ ‐
Come by Chance Playground ‐ ‐ 105,000 ‐ ‐ ‐ ‐ ‐ ‐ ‐ ‐ ‐
Grawin Park ‐ ‐ 105,000 ‐ ‐ ‐ ‐ ‐ ‐ ‐ ‐ ‐
Lightning Ridge Community Space ‐ ‐ ‐ ‐ ‐ ‐ ‐ 50,000 ‐ 80,000 ‐ ‐
Lightning Ridge Housing 35,000 ‐ ‐ ‐ 20,000 ‐ 20,000 ‐ 25,000 ‐ 30,000 ‐
Rowena Hall 33,000 ‐ 65,000 ‐ ‐ 30,000 ‐ ‐ ‐ ‐ ‐ ‐
Walgett Housing ‐ ‐ 30,000 41,000 35,000 ‐ ‐ ‐ 20,000 25,000 30,000 30,000
Walgett River ‐ Viewing Platforms ‐ ‐ ‐ ‐ ‐ ‐ 50,000 ‐ 50,000 ‐ ‐ ‐
Walgett ‐ Trevallion Park ‐ ‐ ‐ 20,000 ‐ ‐ ‐ ‐ ‐ ‐ ‐ ‐
Walgett ‐ Administration Centre ‐ ‐ ‐ ‐ ‐ 85,000 ‐ ‐ ‐ 150,000 150,000 ‐
Walgett Lodge ‐ ‐ 15,000 ‐ ‐ ‐ ‐ ‐ ‐ ‐ ‐ ‐
Walgett ‐ Beautification ‐ ‐ 80,000 ‐ ‐ ‐ ‐ ‐ ‐ ‐ ‐ ‐
Footpaths ‐ ‐ 934,600 ‐ ‐ ‐ ‐ ‐ ‐ ‐ ‐ ‐
Skate Paths 90,000
Bundy Clock Systems 30,000
LR ‐ Opal Park Footpath ‐ 21,800 ‐ ‐ ‐ ‐ ‐ ‐ ‐ ‐ ‐ ‐
Walgett Aerodrome Residence‐Paint & Kitc ‐ 6,700 ‐ ‐ ‐ ‐ ‐ ‐ ‐ ‐ ‐ ‐
Collarenebri Showground Upgrade 330,000 380,000 ‐ ‐ ‐ ‐ ‐ ‐ ‐ ‐ ‐ ‐
Spider Brown Oval ‐ 56,701 ‐ ‐ ‐ 45,000 100,000 50,000 ‐ ‐ ‐ ‐
Collarenebri Sportsgrounds ‐ 93,000 87,224 ‐ ‐ ‐ ‐ ‐ ‐ ‐ ‐ ‐
Burren Junction Hall ‐ 53,010 ‐ ‐ ‐ ‐ ‐ ‐ ‐ ‐ ‐ ‐
Gem Gardens – Lightning Ridge ‐ 14,000 ‐ ‐ ‐ ‐ ‐ ‐ ‐ ‐ ‐ ‐
Walgett Administration Centre ‐ 185,000 ‐ ‐ ‐ ‐ ‐ ‐ ‐ ‐ ‐ ‐
Walgett ‐ Ovals 2 & 3 Amenities (New) ‐ 385,000 ‐ ‐ ‐ ‐ ‐ ‐ ‐ ‐ ‐ ‐
Walgett Showground ‐ Irrigation ‐ 60,191 ‐ ‐ ‐ ‐ ‐ ‐ ‐ ‐ ‐ ‐
Council Courtyard Upgrade ‐ 15,000 ‐ ‐ ‐ ‐ ‐ ‐ ‐ ‐ ‐ ‐
Depots ‐ CCTV ‐ 30,000 ‐ ‐ ‐ ‐ ‐ ‐ ‐ ‐ ‐ ‐
Lightning Ridge ‐ Carport next to Radio Station ‐ 4,700 ‐ ‐ ‐ ‐ ‐ ‐ ‐ ‐ ‐ ‐
Total Capital Expenditure 849,790 2,595,951 3,201,319 432,509 386,526 363,672 492,931 465,264 403,000 328,000 350,000 230,000
Capital Surplus/(Deficit) (519,790) (1,463,582) (561,638) (387,509) (296,526) (363,672) (492,931) (465,264) (403,000) (328,000) (350,000) (230,000)
2020/2021 Long Term Finanicla Plan Scenario: Planned - 2.60% Rate Pegging Increase
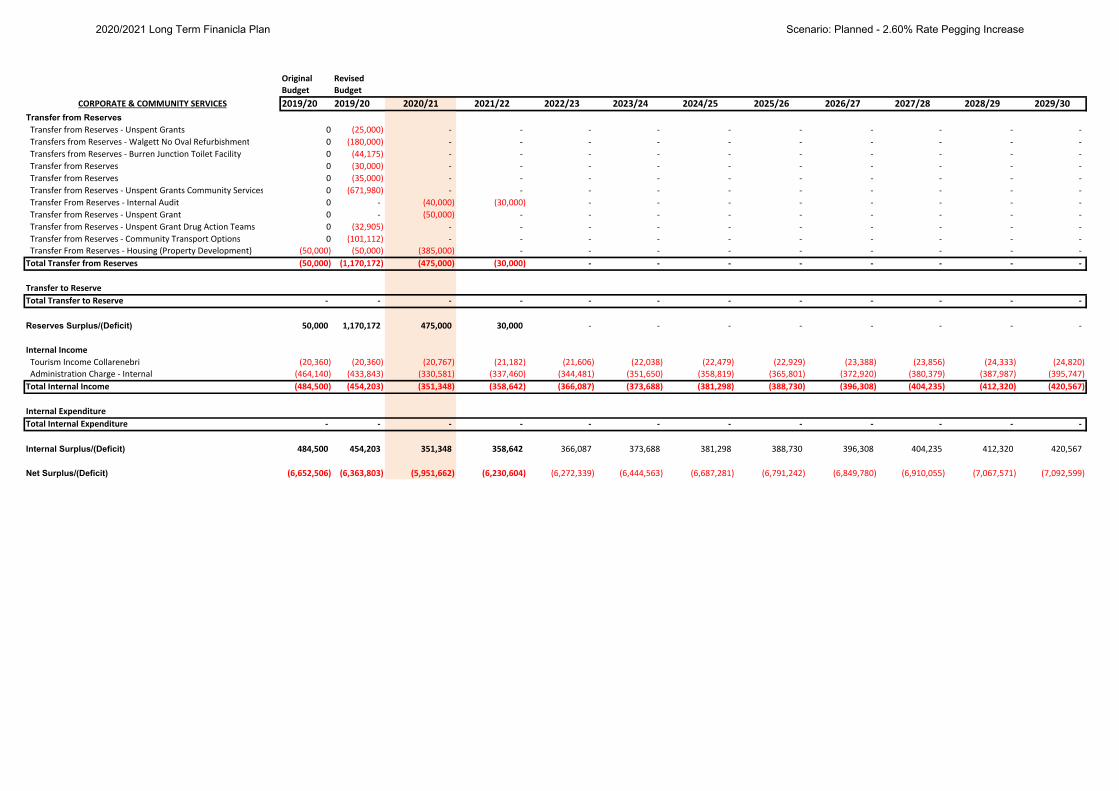
Original RevisedBudget Budget2019/20 2019/20 2020/21 2021/22 2022/23 2023/24 2024/25 2025/26 2026/27 2027/28 2028/29 2029/30CORPORATE & COMMUNITY SERVICES
Transfer from Reserves Transfer from Reserves ‐ Unspent Grants 0 (25,000) ‐ ‐ ‐ ‐ ‐ ‐ ‐ ‐ ‐ ‐
Transfers from Reserves ‐ Walgett No Oval Refurbishment 0 (180,000) ‐ ‐ ‐ ‐ ‐ ‐ ‐ ‐ ‐ ‐
Transfers from Reserves ‐ Burren Junction Toilet Facility 0 (44,175) ‐ ‐ ‐ ‐ ‐ ‐ ‐ ‐ ‐ ‐
Transfer from Reserves 0 (30,000) ‐ ‐ ‐ ‐ ‐ ‐ ‐ ‐ ‐ ‐
Transfer from Reserves 0 (35,000) ‐ ‐ ‐ ‐ ‐ ‐ ‐ ‐ ‐ ‐
Transfer from Reserves ‐ Unspent Grants Community Services 0 (671,980) ‐ ‐ ‐ ‐ ‐ ‐ ‐ ‐ ‐ ‐
Transfer From Reserves ‐ Internal Audit 0 ‐ (40,000) (30,000) ‐ ‐ ‐ ‐ ‐ ‐ ‐ ‐
Transfer from Reserves ‐ Unspent Grant 0 ‐ (50,000) ‐ ‐ ‐ ‐ ‐ ‐ ‐ ‐ ‐
Transfer from Reserves ‐ Unspent Grant Drug Action Teams 0 (32,905) ‐ ‐ ‐ ‐ ‐ ‐ ‐ ‐ ‐ ‐
Transfer from Reserves ‐ Community Transport Options 0 (101,112) ‐ ‐ ‐ ‐ ‐ ‐ ‐ ‐ ‐ ‐
Transfer From Reserves ‐ Housing (Property Development) (50,000) (50,000) (385,000) ‐ ‐ ‐ ‐ ‐ ‐ ‐ ‐ ‐
Total Transfer from Reserves (50,000) (1,170,172) (475,000) (30,000) ‐ ‐ ‐ ‐ ‐ ‐ ‐ ‐
Transfer to ReserveTotal Transfer to Reserve ‐ ‐ ‐ ‐ ‐ ‐ ‐ ‐ ‐ ‐ ‐ ‐
Reserves Surplus/(Deficit) 50,000 1,170,172 475,000 30,000 ‐ ‐ ‐ ‐ ‐ ‐ ‐ ‐
Internal Income Tourism Income Collarenebri (20,360) (20,360) (20,767) (21,182) (21,606) (22,038) (22,479) (22,929) (23,388) (23,856) (24,333) (24,820)
Administration Charge ‐ Internal (464,140) (433,843) (330,581) (337,460) (344,481) (351,650) (358,819) (365,801) (372,920) (380,379) (387,987) (395,747)
Total Internal Income (484,500) (454,203) (351,348) (358,642) (366,087) (373,688) (381,298) (388,730) (396,308) (404,235) (412,320) (420,567)
Internal ExpenditureTotal Internal Expenditure ‐ ‐ ‐ ‐ ‐ ‐ ‐ ‐ ‐ ‐ ‐ ‐
Internal Surplus/(Deficit) 484,500 454,203 351,348 358,642 366,087 373,688 381,298 388,730 396,308 404,235 412,320 420,567
Net Surplus/(Deficit) (6,652,506) (6,363,803) (5,951,662) (6,230,604) (6,272,339) (6,444,563) (6,687,281) (6,791,242) (6,849,780) (6,910,055) (7,067,571) (7,092,599)
2020/2021 Long Term Finanicla Plan Scenario: Planned - 2.60% Rate Pegging Increase
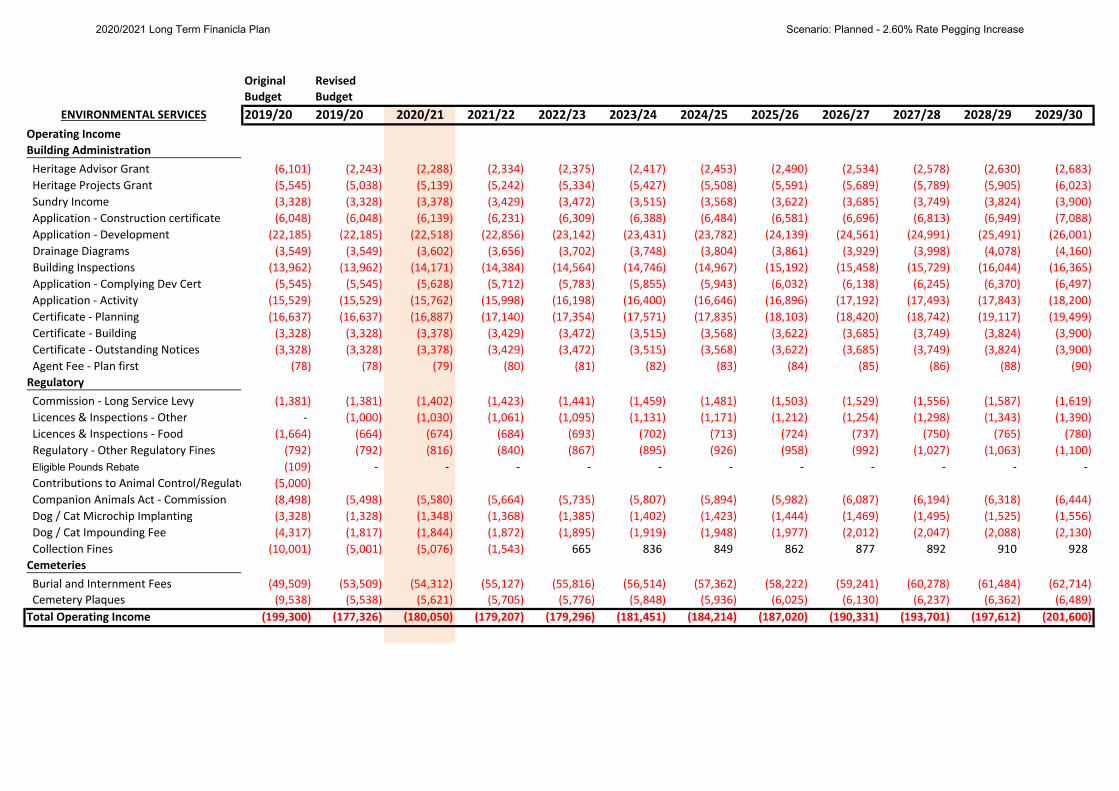
Original RevisedBudget Budget2019/20 2019/20 2020/21 2021/22 2022/23 2023/24 2024/25 2025/26 2026/27 2027/28 2028/29 2029/30
Operating IncomeBuilding Administration Heritage Advisor Grant (6,101) (2,243) (2,288) (2,334) (2,375) (2,417) (2,453) (2,490) (2,534) (2,578) (2,630) (2,683)
Heritage Projects Grant (5,545) (5,038) (5,139) (5,242) (5,334) (5,427) (5,508) (5,591) (5,689) (5,789) (5,905) (6,023)
Sundry Income (3,328) (3,328) (3,378) (3,429) (3,472) (3,515) (3,568) (3,622) (3,685) (3,749) (3,824) (3,900)
Application ‐ Construction certificate (6,048) (6,048) (6,139) (6,231) (6,309) (6,388) (6,484) (6,581) (6,696) (6,813) (6,949) (7,088)
Application ‐ Development (22,185) (22,185) (22,518) (22,856) (23,142) (23,431) (23,782) (24,139) (24,561) (24,991) (25,491) (26,001)
Drainage Diagrams (3,549) (3,549) (3,602) (3,656) (3,702) (3,748) (3,804) (3,861) (3,929) (3,998) (4,078) (4,160)
Building Inspections (13,962) (13,962) (14,171) (14,384) (14,564) (14,746) (14,967) (15,192) (15,458) (15,729) (16,044) (16,365)
Application ‐ Complying Dev Cert (5,545) (5,545) (5,628) (5,712) (5,783) (5,855) (5,943) (6,032) (6,138) (6,245) (6,370) (6,497)
Application ‐ Activity (15,529) (15,529) (15,762) (15,998) (16,198) (16,400) (16,646) (16,896) (17,192) (17,493) (17,843) (18,200)
Certificate ‐ Planning (16,637) (16,637) (16,887) (17,140) (17,354) (17,571) (17,835) (18,103) (18,420) (18,742) (19,117) (19,499)
Certificate ‐ Building (3,328) (3,328) (3,378) (3,429) (3,472) (3,515) (3,568) (3,622) (3,685) (3,749) (3,824) (3,900)
Certificate ‐ Outstanding Notices (3,328) (3,328) (3,378) (3,429) (3,472) (3,515) (3,568) (3,622) (3,685) (3,749) (3,824) (3,900)
Agent Fee ‐ Plan first (78) (78) (79) (80) (81) (82) (83) (84) (85) (86) (88) (90)
Regulatory Commission ‐ Long Service Levy (1,381) (1,381) (1,402) (1,423) (1,441) (1,459) (1,481) (1,503) (1,529) (1,556) (1,587) (1,619)
Licences & Inspections ‐ Other ‐ (1,000) (1,030) (1,061) (1,095) (1,131) (1,171) (1,212) (1,254) (1,298) (1,343) (1,390)
Licences & Inspections ‐ Food (1,664) (664) (674) (684) (693) (702) (713) (724) (737) (750) (765) (780)
Regulatory ‐ Other Regulatory Fines (792) (792) (816) (840) (867) (895) (926) (958) (992) (1,027) (1,063) (1,100)
Eligible Pounds Rebate (109) ‐ ‐ ‐ ‐ ‐ ‐ ‐ ‐ ‐ ‐ ‐
Contributions to Animal Control/Regulato (5,000)
Companion Animals Act ‐ Commission (8,498) (5,498) (5,580) (5,664) (5,735) (5,807) (5,894) (5,982) (6,087) (6,194) (6,318) (6,444)
Dog / Cat Microchip Implanting (3,328) (1,328) (1,348) (1,368) (1,385) (1,402) (1,423) (1,444) (1,469) (1,495) (1,525) (1,556)
Dog / Cat Impounding Fee (4,317) (1,817) (1,844) (1,872) (1,895) (1,919) (1,948) (1,977) (2,012) (2,047) (2,088) (2,130)
Collection Fines (10,001) (5,001) (5,076) (1,543) 665 836 849 862 877 892 910 928
Cemeteries Burial and Internment Fees (49,509) (53,509) (54,312) (55,127) (55,816) (56,514) (57,362) (58,222) (59,241) (60,278) (61,484) (62,714)
Cemetery Plaques (9,538) (5,538) (5,621) (5,705) (5,776) (5,848) (5,936) (6,025) (6,130) (6,237) (6,362) (6,489)
Total Operating Income (199,300) (177,326) (180,050) (179,207) (179,296) (181,451) (184,214) (187,020) (190,331) (193,701) (197,612) (201,600)
ENVIRONMENTAL SERVICES
2020/2021 Long Term Finanicla Plan Scenario: Planned - 2.60% Rate Pegging Increase
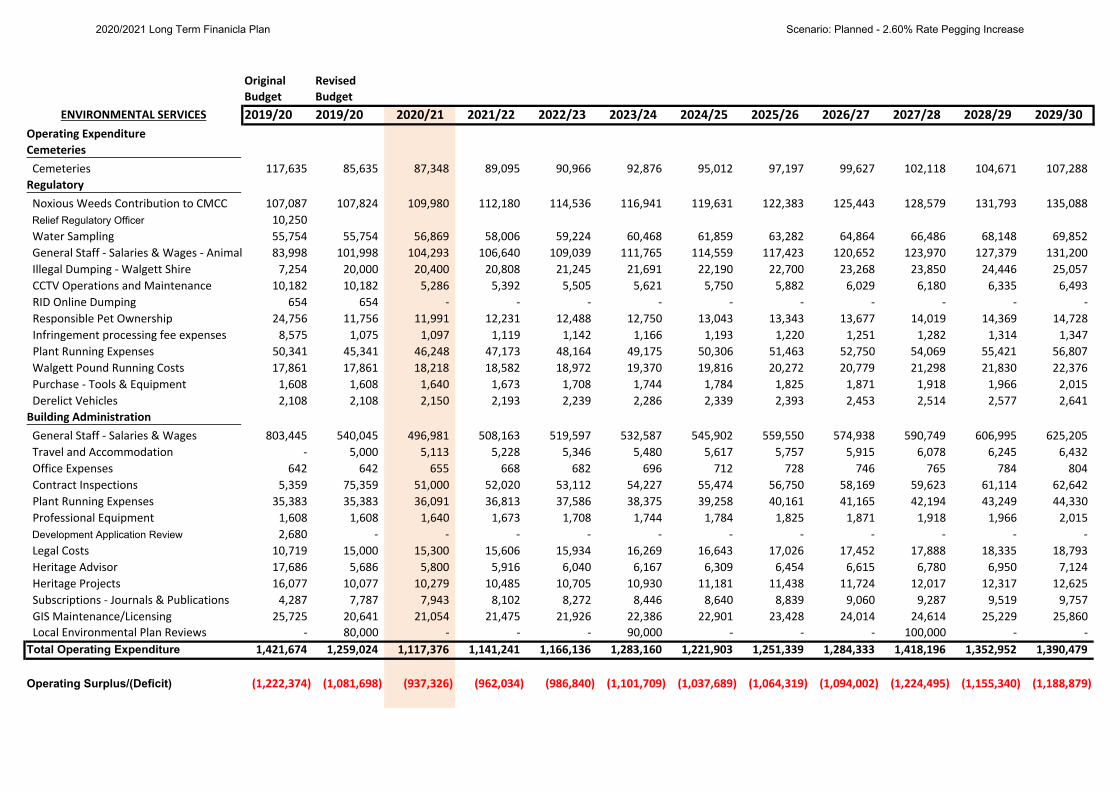
Original RevisedBudget Budget2019/20 2019/20 2020/21 2021/22 2022/23 2023/24 2024/25 2025/26 2026/27 2027/28 2028/29 2029/30ENVIRONMENTAL SERVICES
Operating ExpenditureCemeteries Cemeteries 117,635 85,635 87,348 89,095 90,966 92,876 95,012 97,197 99,627 102,118 104,671 107,288
Regulatory Noxious Weeds Contribution to CMCC 107,087 107,824 109,980 112,180 114,536 116,941 119,631 122,383 125,443 128,579 131,793 135,088
Relief Regulatory Officer 10,250
Water Sampling 55,754 55,754 56,869 58,006 59,224 60,468 61,859 63,282 64,864 66,486 68,148 69,852
General Staff ‐ Salaries & Wages ‐ Animal 83,998 101,998 104,293 106,640 109,039 111,765 114,559 117,423 120,652 123,970 127,379 131,200
Illegal Dumping ‐ Walgett Shire 7,254 20,000 20,400 20,808 21,245 21,691 22,190 22,700 23,268 23,850 24,446 25,057
CCTV Operations and Maintenance 10,182 10,182 5,286 5,392 5,505 5,621 5,750 5,882 6,029 6,180 6,335 6,493
RID Online Dumping 654 654 ‐ ‐ ‐ ‐ ‐ ‐ ‐ ‐ ‐ ‐
Responsible Pet Ownership 24,756 11,756 11,991 12,231 12,488 12,750 13,043 13,343 13,677 14,019 14,369 14,728
Infringement processing fee expenses 8,575 1,075 1,097 1,119 1,142 1,166 1,193 1,220 1,251 1,282 1,314 1,347
Plant Running Expenses 50,341 45,341 46,248 47,173 48,164 49,175 50,306 51,463 52,750 54,069 55,421 56,807
Walgett Pound Running Costs 17,861 17,861 18,218 18,582 18,972 19,370 19,816 20,272 20,779 21,298 21,830 22,376
Purchase ‐ Tools & Equipment 1,608 1,608 1,640 1,673 1,708 1,744 1,784 1,825 1,871 1,918 1,966 2,015
Derelict Vehicles 2,108 2,108 2,150 2,193 2,239 2,286 2,339 2,393 2,453 2,514 2,577 2,641
Building Administration General Staff ‐ Salaries & Wages 803,445 540,045 496,981 508,163 519,597 532,587 545,902 559,550 574,938 590,749 606,995 625,205
Travel and Accommodation ‐ 5,000 5,113 5,228 5,346 5,480 5,617 5,757 5,915 6,078 6,245 6,432
Office Expenses 642 642 655 668 682 696 712 728 746 765 784 804
Contract Inspections 5,359 75,359 51,000 52,020 53,112 54,227 55,474 56,750 58,169 59,623 61,114 62,642
Plant Running Expenses 35,383 35,383 36,091 36,813 37,586 38,375 39,258 40,161 41,165 42,194 43,249 44,330
Professional Equipment 1,608 1,608 1,640 1,673 1,708 1,744 1,784 1,825 1,871 1,918 1,966 2,015
Development Application Review 2,680 ‐ ‐ ‐ ‐ ‐ ‐ ‐ ‐ ‐ ‐ ‐
Legal Costs 10,719 15,000 15,300 15,606 15,934 16,269 16,643 17,026 17,452 17,888 18,335 18,793
Heritage Advisor 17,686 5,686 5,800 5,916 6,040 6,167 6,309 6,454 6,615 6,780 6,950 7,124
Heritage Projects 16,077 10,077 10,279 10,485 10,705 10,930 11,181 11,438 11,724 12,017 12,317 12,625
Subscriptions ‐ Journals & Publications 4,287 7,787 7,943 8,102 8,272 8,446 8,640 8,839 9,060 9,287 9,519 9,757
GIS Maintenance/Licensing 25,725 20,641 21,054 21,475 21,926 22,386 22,901 23,428 24,014 24,614 25,229 25,860
Local Environmental Plan Reviews ‐ 80,000 ‐ ‐ ‐ 90,000 ‐ ‐ ‐ 100,000 ‐ ‐
Total Operating Expenditure 1,421,674 1,259,024 1,117,376 1,141,241 1,166,136 1,283,160 1,221,903 1,251,339 1,284,333 1,418,196 1,352,952 1,390,479
Operating Surplus/(Deficit) (1,222,374) (1,081,698) (937,326) (962,034) (986,840) (1,101,709) (1,037,689) (1,064,319) (1,094,002) (1,224,495) (1,155,340) (1,188,879)
2020/2021 Long Term Finanicla Plan Scenario: Planned - 2.60% Rate Pegging Increase
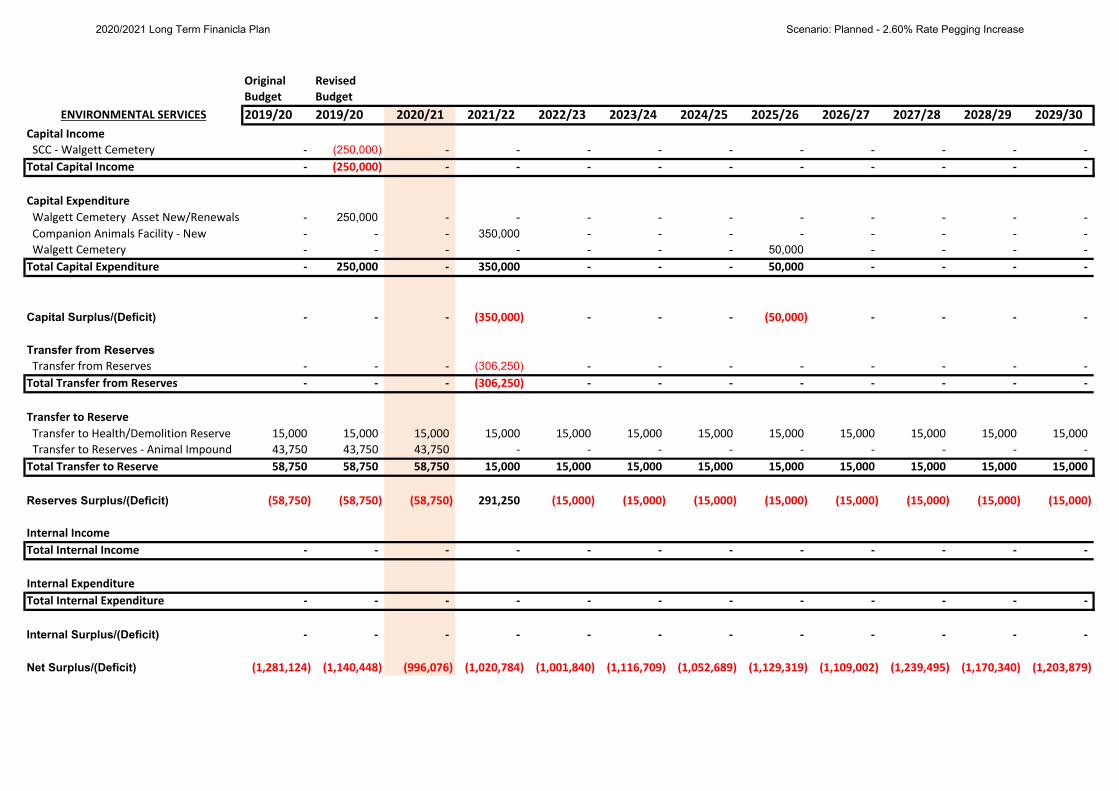
Original RevisedBudget Budget2019/20 2019/20 2020/21 2021/22 2022/23 2023/24 2024/25 2025/26 2026/27 2027/28 2028/29 2029/30ENVIRONMENTAL SERVICES
Capital Income SCC ‐ Walgett Cemetery - (250,000) - - - - - - - - - - Total Capital Income ‐ (250,000) ‐ ‐ ‐ ‐ ‐ ‐ ‐ ‐ ‐ ‐
Capital Expenditure Walgett Cemetery Asset New/Renewals - 250,000 - - - - - - - - - - Companion Animals Facility ‐ New - - - 350,000 - - - - - - - - Walgett Cemetery - - - - - - - 50,000 - - - - Total Capital Expenditure ‐ 250,000 ‐ 350,000 ‐ ‐ ‐ 50,000 ‐ ‐ ‐ ‐
Capital Surplus/(Deficit) ‐ ‐ ‐ (350,000) ‐ ‐ ‐ (50,000) ‐ ‐ ‐ ‐
Transfer from Reserves Transfer from Reserves - - - (306,250) - - - - - - - - Total Transfer from Reserves ‐ ‐ ‐ (306,250) ‐ ‐ ‐ ‐ ‐ ‐ ‐ ‐
Transfer to Reserve Transfer to Health/Demolition Reserve 15,000 15,000 15,000 15,000 15,000 15,000 15,000 15,000 15,000 15,000 15,000 15,000
Transfer to Reserves ‐ Animal Impound 43,750 43,750 43,750 ‐ ‐ ‐ ‐ ‐ ‐ ‐ ‐ ‐
Total Transfer to Reserve 58,750 58,750 58,750 15,000 15,000 15,000 15,000 15,000 15,000 15,000 15,000 15,000
Reserves Surplus/(Deficit) (58,750) (58,750) (58,750) 291,250 (15,000) (15,000) (15,000) (15,000) (15,000) (15,000) (15,000) (15,000)
Internal IncomeTotal Internal Income ‐ ‐ ‐ ‐ ‐ ‐ ‐ ‐ ‐ ‐ ‐ ‐
Internal ExpenditureTotal Internal Expenditure ‐ ‐ ‐ ‐ ‐ ‐ ‐ ‐ ‐ ‐ ‐ ‐
Internal Surplus/(Deficit) ‐ ‐ ‐ ‐ ‐ ‐ ‐ ‐ ‐ ‐ ‐ ‐
Net Surplus/(Deficit) (1,281,124) (1,140,448) (996,076) (1,020,784) (1,001,840) (1,116,709) (1,052,689) (1,129,319) (1,109,002) (1,239,495) (1,170,340) (1,203,879)
2020/2021 Long Term Finanicla Plan Scenario: Planned - 2.60% Rate Pegging Increase
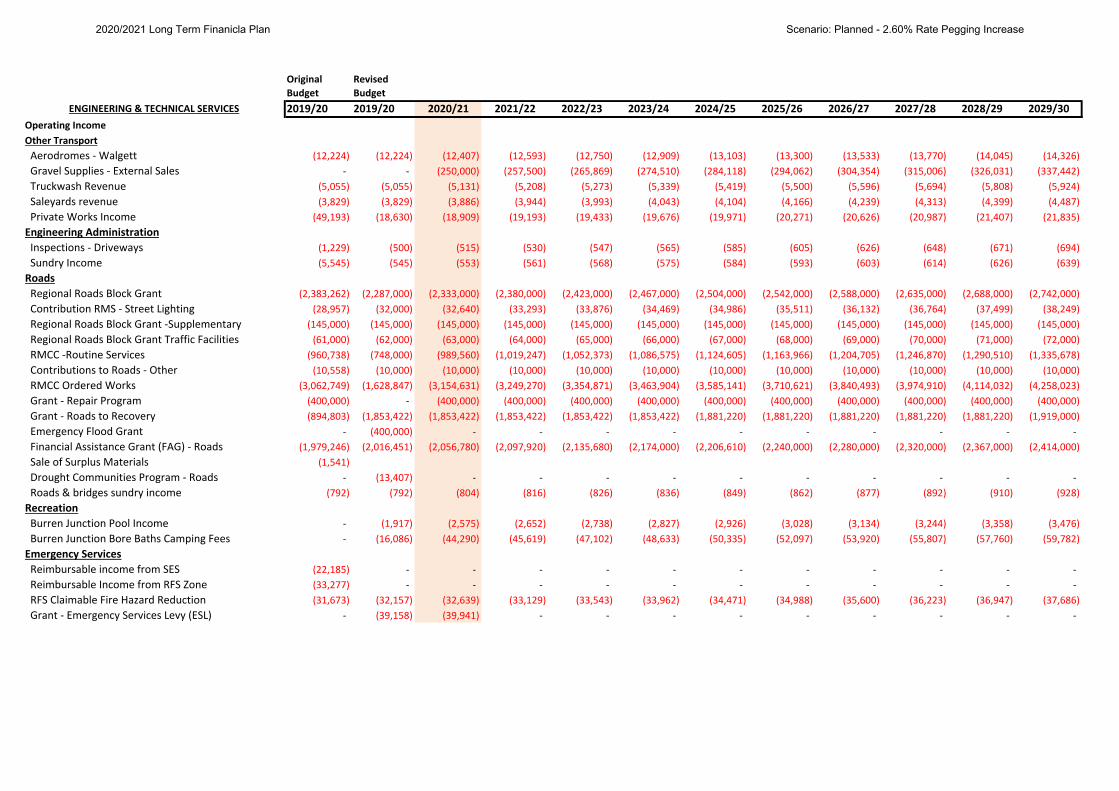
Original RevisedBudget Budget2019/20 2019/20 2020/21 2021/22 2022/23 2023/24 2024/25 2025/26 2026/27 2027/28 2028/29 2029/30
Operating IncomeOther Transport Aerodromes ‐ Walgett (12,224) (12,224) (12,407) (12,593) (12,750) (12,909) (13,103) (13,300) (13,533) (13,770) (14,045) (14,326)
Gravel Supplies ‐ External Sales ‐ ‐ (250,000) (257,500) (265,869) (274,510) (284,118) (294,062) (304,354) (315,006) (326,031) (337,442)
Truckwash Revenue (5,055) (5,055) (5,131) (5,208) (5,273) (5,339) (5,419) (5,500) (5,596) (5,694) (5,808) (5,924)
Saleyards revenue (3,829) (3,829) (3,886) (3,944) (3,993) (4,043) (4,104) (4,166) (4,239) (4,313) (4,399) (4,487)
Private Works Income (49,193) (18,630) (18,909) (19,193) (19,433) (19,676) (19,971) (20,271) (20,626) (20,987) (21,407) (21,835)
Engineering Administration Inspections ‐ Driveways (1,229) (500) (515) (530) (547) (565) (585) (605) (626) (648) (671) (694)
Sundry Income (5,545) (545) (553) (561) (568) (575) (584) (593) (603) (614) (626) (639)
Roads Regional Roads Block Grant (2,383,262) (2,287,000) (2,333,000) (2,380,000) (2,423,000) (2,467,000) (2,504,000) (2,542,000) (2,588,000) (2,635,000) (2,688,000) (2,742,000)
Contribution RMS ‐ Street Lighting (28,957) (32,000) (32,640) (33,293) (33,876) (34,469) (34,986) (35,511) (36,132) (36,764) (37,499) (38,249)
Regional Roads Block Grant ‐Supplementary (145,000) (145,000) (145,000) (145,000) (145,000) (145,000) (145,000) (145,000) (145,000) (145,000) (145,000) (145,000)
Regional Roads Block Grant Traffic Facilities (61,000) (62,000) (63,000) (64,000) (65,000) (66,000) (67,000) (68,000) (69,000) (70,000) (71,000) (72,000)
RMCC ‐Routine Services (960,738) (748,000) (989,560) (1,019,247) (1,052,373) (1,086,575) (1,124,605) (1,163,966) (1,204,705) (1,246,870) (1,290,510) (1,335,678)
Contributions to Roads ‐ Other (10,558) (10,000) (10,000) (10,000) (10,000) (10,000) (10,000) (10,000) (10,000) (10,000) (10,000) (10,000)
RMCC Ordered Works (3,062,749) (1,628,847) (3,154,631) (3,249,270) (3,354,871) (3,463,904) (3,585,141) (3,710,621) (3,840,493) (3,974,910) (4,114,032) (4,258,023)
Grant ‐ Repair Program (400,000) ‐ (400,000) (400,000) (400,000) (400,000) (400,000) (400,000) (400,000) (400,000) (400,000) (400,000)
Grant ‐ Roads to Recovery (894,803) (1,853,422) (1,853,422) (1,853,422) (1,853,422) (1,853,422) (1,881,220) (1,881,220) (1,881,220) (1,881,220) (1,881,220) (1,919,000)
Emergency Flood Grant ‐ (400,000) ‐ ‐ ‐ ‐ ‐ ‐ ‐ ‐ ‐ ‐
Financial Assistance Grant (FAG) ‐ Roads (1,979,246) (2,016,451) (2,056,780) (2,097,920) (2,135,680) (2,174,000) (2,206,610) (2,240,000) (2,280,000) (2,320,000) (2,367,000) (2,414,000)
Sale of Surplus Materials (1,541)
Drought Communities Program ‐ Roads ‐ (13,407) ‐ ‐ ‐ ‐ ‐ ‐ ‐ ‐ ‐ ‐
Roads & bridges sundry income (792) (792) (804) (816) (826) (836) (849) (862) (877) (892) (910) (928)
Recreation Burren Junction Pool Income ‐ (1,917) (2,575) (2,652) (2,738) (2,827) (2,926) (3,028) (3,134) (3,244) (3,358) (3,476)
Burren Junction Bore Baths Camping Fees ‐ (16,086) (44,290) (45,619) (47,102) (48,633) (50,335) (52,097) (53,920) (55,807) (57,760) (59,782)
Emergency Services Reimbursable income from SES (22,185) ‐ ‐ ‐ ‐ ‐ ‐ ‐ ‐ ‐ ‐ ‐
Reimbursable Income from RFS Zone (33,277) ‐ ‐ ‐ ‐ ‐ ‐ ‐ ‐ ‐ ‐ ‐
RFS Claimable Fire Hazard Reduction (31,673) (32,157) (32,639) (33,129) (33,543) (33,962) (34,471) (34,988) (35,600) (36,223) (36,947) (37,686)
Grant ‐ Emergency Services Levy (ESL) ‐ (39,158) (39,941) ‐ ‐ ‐ ‐ ‐ ‐ ‐ ‐ ‐
ENGINEERING & TECHNICAL SERVICES
2020/2021 Long Term Finanicla Plan Scenario: Planned - 2.60% Rate Pegging Increase
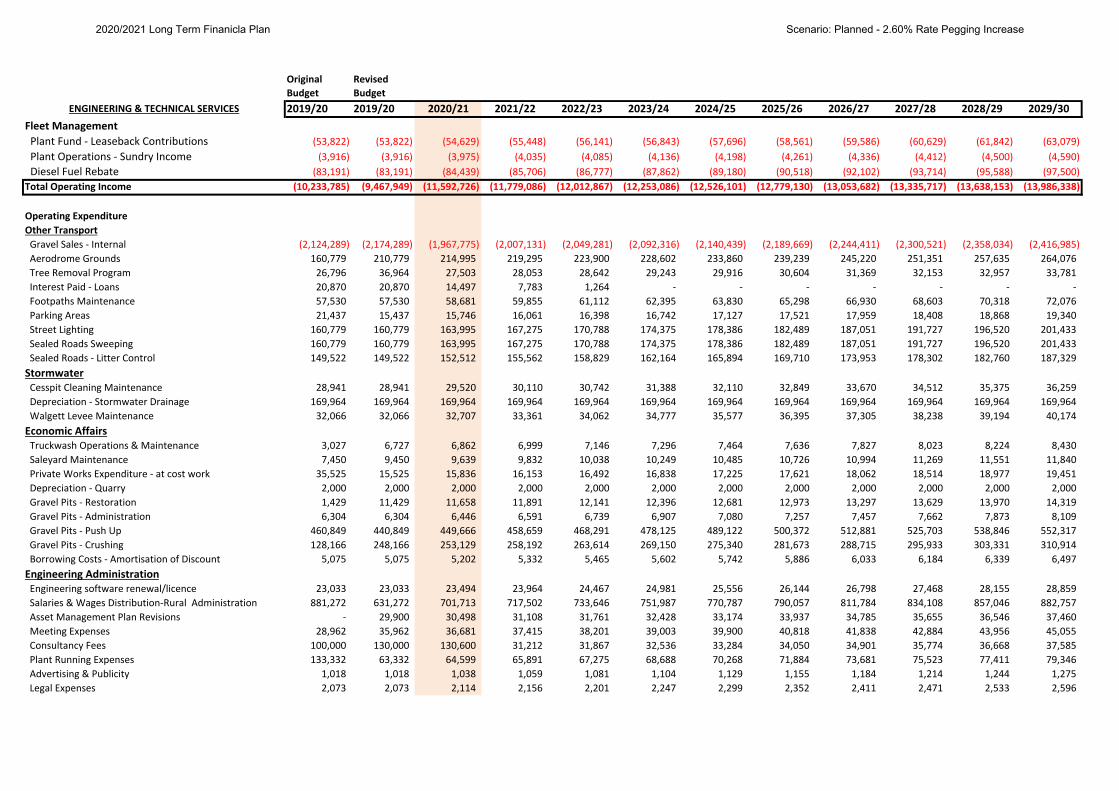
Original RevisedBudget Budget2019/20 2019/20 2020/21 2021/22 2022/23 2023/24 2024/25 2025/26 2026/27 2027/28 2028/29 2029/30ENGINEERING & TECHNICAL SERVICES
Fleet Management Plant Fund ‐ Leaseback Contributions (53,822) (53,822) (54,629) (55,448) (56,141) (56,843) (57,696) (58,561) (59,586) (60,629) (61,842) (63,079)
Plant Operations ‐ Sundry Income (3,916) (3,916) (3,975) (4,035) (4,085) (4,136) (4,198) (4,261) (4,336) (4,412) (4,500) (4,590)
Diesel Fuel Rebate (83,191) (83,191) (84,439) (85,706) (86,777) (87,862) (89,180) (90,518) (92,102) (93,714) (95,588) (97,500)
Total Operating Income (10,233,785) (9,467,949) (11,592,726) (11,779,086) (12,012,867) (12,253,086) (12,526,101) (12,779,130) (13,053,682) (13,335,717) (13,638,153) (13,986,338)
Operating ExpenditureOther Transport Gravel Sales ‐ Internal (2,124,289) (2,174,289) (1,967,775) (2,007,131) (2,049,281) (2,092,316) (2,140,439) (2,189,669) (2,244,411) (2,300,521) (2,358,034) (2,416,985)
Aerodrome Grounds 160,779 210,779 214,995 219,295 223,900 228,602 233,860 239,239 245,220 251,351 257,635 264,076
Tree Removal Program 26,796 36,964 27,503 28,053 28,642 29,243 29,916 30,604 31,369 32,153 32,957 33,781
Interest Paid ‐ Loans 20,870 20,870 14,497 7,783 1,264 ‐ ‐ ‐ ‐ ‐ ‐ ‐
Footpaths Maintenance 57,530 57,530 58,681 59,855 61,112 62,395 63,830 65,298 66,930 68,603 70,318 72,076
Parking Areas 21,437 15,437 15,746 16,061 16,398 16,742 17,127 17,521 17,959 18,408 18,868 19,340
Street Lighting 160,779 160,779 163,995 167,275 170,788 174,375 178,386 182,489 187,051 191,727 196,520 201,433
Sealed Roads Sweeping 160,779 160,779 163,995 167,275 170,788 174,375 178,386 182,489 187,051 191,727 196,520 201,433
Sealed Roads ‐ Litter Control 149,522 149,522 152,512 155,562 158,829 162,164 165,894 169,710 173,953 178,302 182,760 187,329
Stormwater Cesspit Cleaning Maintenance 28,941 28,941 29,520 30,110 30,742 31,388 32,110 32,849 33,670 34,512 35,375 36,259
Depreciation ‐ Stormwater Drainage 169,964 169,964 169,964 169,964 169,964 169,964 169,964 169,964 169,964 169,964 169,964 169,964
Walgett Levee Maintenance 32,066 32,066 32,707 33,361 34,062 34,777 35,577 36,395 37,305 38,238 39,194 40,174
Economic Affairs Truckwash Operations & Maintenance 3,027 6,727 6,862 6,999 7,146 7,296 7,464 7,636 7,827 8,023 8,224 8,430
Saleyard Maintenance 7,450 9,450 9,639 9,832 10,038 10,249 10,485 10,726 10,994 11,269 11,551 11,840
Private Works Expenditure ‐ at cost work 35,525 15,525 15,836 16,153 16,492 16,838 17,225 17,621 18,062 18,514 18,977 19,451
Depreciation ‐ Quarry 2,000 2,000 2,000 2,000 2,000 2,000 2,000 2,000 2,000 2,000 2,000 2,000
Gravel Pits ‐ Restoration 1,429 11,429 11,658 11,891 12,141 12,396 12,681 12,973 13,297 13,629 13,970 14,319
Gravel Pits ‐ Administration 6,304 6,304 6,446 6,591 6,739 6,907 7,080 7,257 7,457 7,662 7,873 8,109
Gravel Pits ‐ Push Up 460,849 440,849 449,666 458,659 468,291 478,125 489,122 500,372 512,881 525,703 538,846 552,317
Gravel Pits ‐ Crushing 128,166 248,166 253,129 258,192 263,614 269,150 275,340 281,673 288,715 295,933 303,331 310,914
Borrowing Costs ‐ Amortisation of Discount 5,075 5,075 5,202 5,332 5,465 5,602 5,742 5,886 6,033 6,184 6,339 6,497
Engineering Administration Engineering software renewal/licence 23,033 23,033 23,494 23,964 24,467 24,981 25,556 26,144 26,798 27,468 28,155 28,859
Salaries & Wages Distribution‐Rural Administration 881,272 631,272 701,713 717,502 733,646 751,987 770,787 790,057 811,784 834,108 857,046 882,757
Asset Management Plan Revisions ‐ 29,900 30,498 31,108 31,761 32,428 33,174 33,937 34,785 35,655 36,546 37,460
Meeting Expenses 28,962 35,962 36,681 37,415 38,201 39,003 39,900 40,818 41,838 42,884 43,956 45,055
Consultancy Fees 100,000 130,000 130,600 31,212 31,867 32,536 33,284 34,050 34,901 35,774 36,668 37,585
Plant Running Expenses 133,332 63,332 64,599 65,891 67,275 68,688 70,268 71,884 73,681 75,523 77,411 79,346
Advertising & Publicity 1,018 1,018 1,038 1,059 1,081 1,104 1,129 1,155 1,184 1,214 1,244 1,275
Legal Expenses 2,073 2,073 2,114 2,156 2,201 2,247 2,299 2,352 2,411 2,471 2,533 2,596
2020/2021 Long Term Finanicla Plan Scenario: Planned - 2.60% Rate Pegging Increase
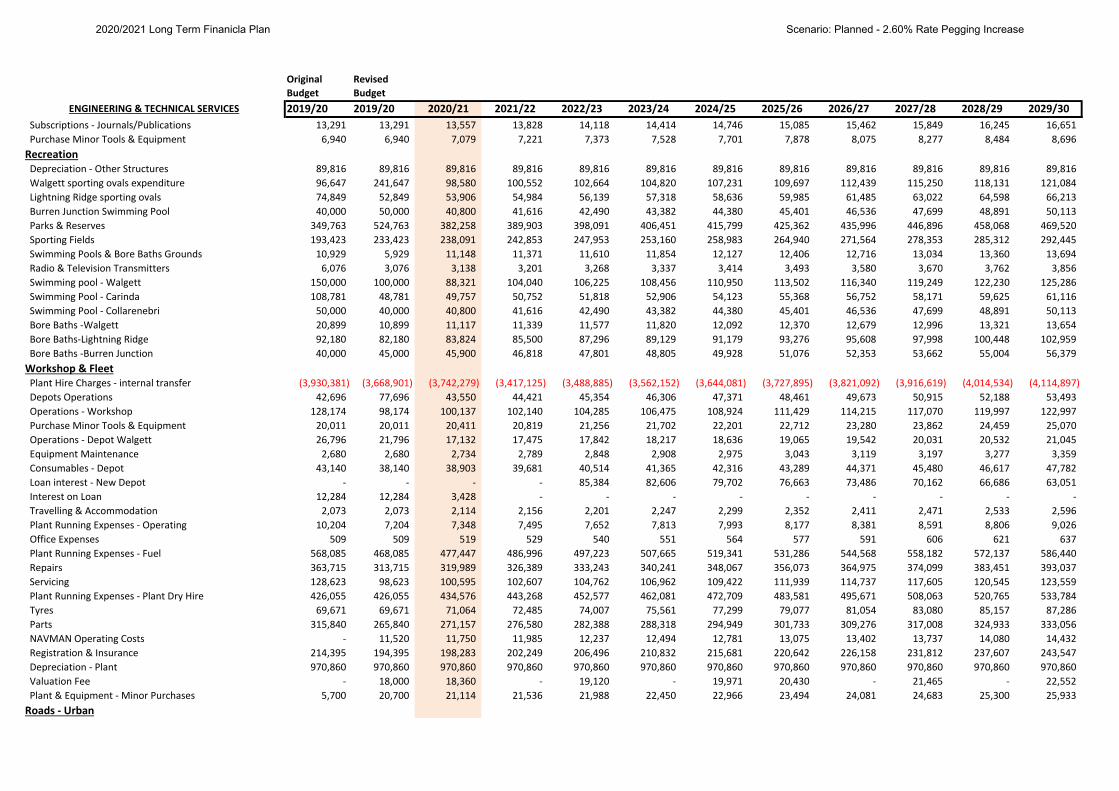
Original RevisedBudget Budget2019/20 2019/20 2020/21 2021/22 2022/23 2023/24 2024/25 2025/26 2026/27 2027/28 2028/29 2029/30ENGINEERING & TECHNICAL SERVICES
Subscriptions ‐ Journals/Publications 13,291 13,291 13,557 13,828 14,118 14,414 14,746 15,085 15,462 15,849 16,245 16,651
Purchase Minor Tools & Equipment 6,940 6,940 7,079 7,221 7,373 7,528 7,701 7,878 8,075 8,277 8,484 8,696
Recreation Depreciation ‐ Other Structures 89,816 89,816 89,816 89,816 89,816 89,816 89,816 89,816 89,816 89,816 89,816 89,816
Walgett sporting ovals expenditure 96,647 241,647 98,580 100,552 102,664 104,820 107,231 109,697 112,439 115,250 118,131 121,084
Lightning Ridge sporting ovals 74,849 52,849 53,906 54,984 56,139 57,318 58,636 59,985 61,485 63,022 64,598 66,213
Burren Junction Swimming Pool 40,000 50,000 40,800 41,616 42,490 43,382 44,380 45,401 46,536 47,699 48,891 50,113
Parks & Reserves 349,763 524,763 382,258 389,903 398,091 406,451 415,799 425,362 435,996 446,896 458,068 469,520
Sporting Fields 193,423 233,423 238,091 242,853 247,953 253,160 258,983 264,940 271,564 278,353 285,312 292,445
Swimming Pools & Bore Baths Grounds 10,929 5,929 11,148 11,371 11,610 11,854 12,127 12,406 12,716 13,034 13,360 13,694
Radio & Television Transmitters 6,076 3,076 3,138 3,201 3,268 3,337 3,414 3,493 3,580 3,670 3,762 3,856
Swimming pool ‐ Walgett 150,000 100,000 88,321 104,040 106,225 108,456 110,950 113,502 116,340 119,249 122,230 125,286
Swimming Pool ‐ Carinda 108,781 48,781 49,757 50,752 51,818 52,906 54,123 55,368 56,752 58,171 59,625 61,116
Swimming Pool ‐ Collarenebri 50,000 40,000 40,800 41,616 42,490 43,382 44,380 45,401 46,536 47,699 48,891 50,113
Bore Baths ‐Walgett 20,899 10,899 11,117 11,339 11,577 11,820 12,092 12,370 12,679 12,996 13,321 13,654
Bore Baths‐Lightning Ridge 92,180 82,180 83,824 85,500 87,296 89,129 91,179 93,276 95,608 97,998 100,448 102,959
Bore Baths ‐Burren Junction 40,000 45,000 45,900 46,818 47,801 48,805 49,928 51,076 52,353 53,662 55,004 56,379
Workshop & Fleet Plant Hire Charges ‐ internal transfer (3,930,381) (3,668,901) (3,742,279) (3,417,125) (3,488,885) (3,562,152) (3,644,081) (3,727,895) (3,821,092) (3,916,619) (4,014,534) (4,114,897)
Depots Operations 42,696 77,696 43,550 44,421 45,354 46,306 47,371 48,461 49,673 50,915 52,188 53,493
Operations ‐ Workshop 128,174 98,174 100,137 102,140 104,285 106,475 108,924 111,429 114,215 117,070 119,997 122,997
Purchase Minor Tools & Equipment 20,011 20,011 20,411 20,819 21,256 21,702 22,201 22,712 23,280 23,862 24,459 25,070
Operations ‐ Depot Walgett 26,796 21,796 17,132 17,475 17,842 18,217 18,636 19,065 19,542 20,031 20,532 21,045
Equipment Maintenance 2,680 2,680 2,734 2,789 2,848 2,908 2,975 3,043 3,119 3,197 3,277 3,359
Consumables ‐ Depot 43,140 38,140 38,903 39,681 40,514 41,365 42,316 43,289 44,371 45,480 46,617 47,782
Loan interest ‐ New Depot ‐ ‐ ‐ ‐ 85,384 82,606 79,702 76,663 73,486 70,162 66,686 63,051
Interest on Loan 12,284 12,284 3,428 ‐ ‐ ‐ ‐ ‐ ‐ ‐ ‐ ‐
Travelling & Accommodation 2,073 2,073 2,114 2,156 2,201 2,247 2,299 2,352 2,411 2,471 2,533 2,596
Plant Running Expenses ‐ Operating 10,204 7,204 7,348 7,495 7,652 7,813 7,993 8,177 8,381 8,591 8,806 9,026
Office Expenses 509 509 519 529 540 551 564 577 591 606 621 637
Plant Running Expenses ‐ Fuel 568,085 468,085 477,447 486,996 497,223 507,665 519,341 531,286 544,568 558,182 572,137 586,440
Repairs 363,715 313,715 319,989 326,389 333,243 340,241 348,067 356,073 364,975 374,099 383,451 393,037
Servicing 128,623 98,623 100,595 102,607 104,762 106,962 109,422 111,939 114,737 117,605 120,545 123,559
Plant Running Expenses ‐ Plant Dry Hire 426,055 426,055 434,576 443,268 452,577 462,081 472,709 483,581 495,671 508,063 520,765 533,784
Tyres 69,671 69,671 71,064 72,485 74,007 75,561 77,299 79,077 81,054 83,080 85,157 87,286
Parts 315,840 265,840 271,157 276,580 282,388 288,318 294,949 301,733 309,276 317,008 324,933 333,056
NAVMAN Operating Costs ‐ 11,520 11,750 11,985 12,237 12,494 12,781 13,075 13,402 13,737 14,080 14,432
Registration & Insurance 214,395 194,395 198,283 202,249 206,496 210,832 215,681 220,642 226,158 231,812 237,607 243,547
Depreciation ‐ Plant 970,860 970,860 970,860 970,860 970,860 970,860 970,860 970,860 970,860 970,860 970,860 970,860
Valuation Fee ‐ 18,000 18,360 ‐ 19,120 ‐ 19,971 20,430 ‐ 21,465 ‐ 22,552
Plant & Equipment ‐ Minor Purchases 5,700 20,700 21,114 21,536 21,988 22,450 22,966 23,494 24,081 24,683 25,300 25,933
Roads ‐ Urban
2020/2021 Long Term Finanicla Plan Scenario: Planned - 2.60% Rate Pegging Increase
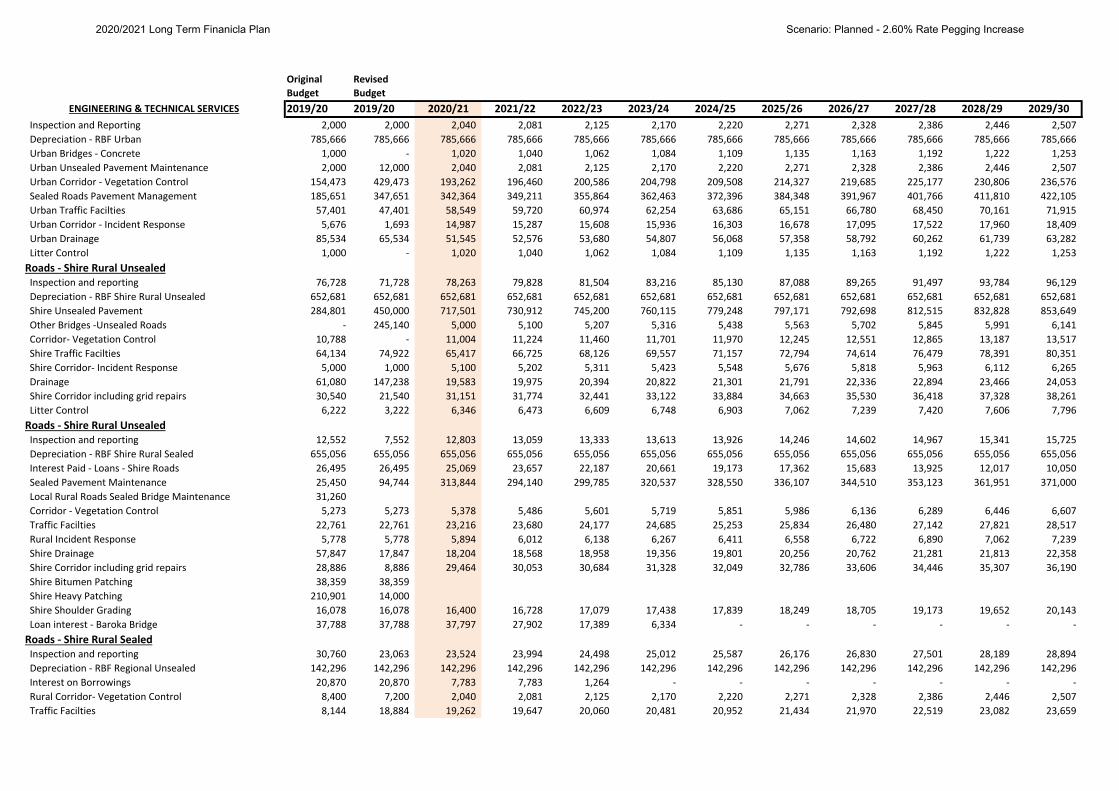
Original RevisedBudget Budget2019/20 2019/20 2020/21 2021/22 2022/23 2023/24 2024/25 2025/26 2026/27 2027/28 2028/29 2029/30ENGINEERING & TECHNICAL SERVICES
Inspection and Reporting 2,000 2,000 2,040 2,081 2,125 2,170 2,220 2,271 2,328 2,386 2,446 2,507
Depreciation ‐ RBF Urban 785,666 785,666 785,666 785,666 785,666 785,666 785,666 785,666 785,666 785,666 785,666 785,666
Urban Bridges ‐ Concrete 1,000 ‐ 1,020 1,040 1,062 1,084 1,109 1,135 1,163 1,192 1,222 1,253
Urban Unsealed Pavement Maintenance 2,000 12,000 2,040 2,081 2,125 2,170 2,220 2,271 2,328 2,386 2,446 2,507
Urban Corridor ‐ Vegetation Control 154,473 429,473 193,262 196,460 200,586 204,798 209,508 214,327 219,685 225,177 230,806 236,576
Sealed Roads Pavement Management 185,651 347,651 342,364 349,211 355,864 362,463 372,396 384,348 391,967 401,766 411,810 422,105
Urban Traffic Facilties 57,401 47,401 58,549 59,720 60,974 62,254 63,686 65,151 66,780 68,450 70,161 71,915
Urban Corridor ‐ Incident Response 5,676 1,693 14,987 15,287 15,608 15,936 16,303 16,678 17,095 17,522 17,960 18,409
Urban Drainage 85,534 65,534 51,545 52,576 53,680 54,807 56,068 57,358 58,792 60,262 61,739 63,282
Litter Control 1,000 ‐ 1,020 1,040 1,062 1,084 1,109 1,135 1,163 1,192 1,222 1,253
Roads ‐ Shire Rural Unsealed Inspection and reporting 76,728 71,728 78,263 79,828 81,504 83,216 85,130 87,088 89,265 91,497 93,784 96,129
Depreciation ‐ RBF Shire Rural Unsealed 652,681 652,681 652,681 652,681 652,681 652,681 652,681 652,681 652,681 652,681 652,681 652,681
Shire Unsealed Pavement 284,801 450,000 717,501 730,912 745,200 760,115 779,248 797,171 792,698 812,515 832,828 853,649
Other Bridges ‐Unsealed Roads ‐ 245,140 5,000 5,100 5,207 5,316 5,438 5,563 5,702 5,845 5,991 6,141
Corridor‐ Vegetation Control 10,788 ‐ 11,004 11,224 11,460 11,701 11,970 12,245 12,551 12,865 13,187 13,517
Shire Traffic Facilties 64,134 74,922 65,417 66,725 68,126 69,557 71,157 72,794 74,614 76,479 78,391 80,351
Shire Corridor‐ Incident Response 5,000 1,000 5,100 5,202 5,311 5,423 5,548 5,676 5,818 5,963 6,112 6,265
Drainage 61,080 147,238 19,583 19,975 20,394 20,822 21,301 21,791 22,336 22,894 23,466 24,053
Shire Corridor including grid repairs 30,540 21,540 31,151 31,774 32,441 33,122 33,884 34,663 35,530 36,418 37,328 38,261
Litter Control 6,222 3,222 6,346 6,473 6,609 6,748 6,903 7,062 7,239 7,420 7,606 7,796
Roads ‐ Shire Rural Unsealed Inspection and reporting 12,552 7,552 12,803 13,059 13,333 13,613 13,926 14,246 14,602 14,967 15,341 15,725
Depreciation ‐ RBF Shire Rural Sealed 655,056 655,056 655,056 655,056 655,056 655,056 655,056 655,056 655,056 655,056 655,056 655,056
Interest Paid ‐ Loans ‐ Shire Roads 26,495 26,495 25,069 23,657 22,187 20,661 19,173 17,362 15,683 13,925 12,017 10,050
Sealed Pavement Maintenance 25,450 94,744 313,844 294,140 299,785 320,537 328,550 336,107 344,510 353,123 361,951 371,000
Local Rural Roads Sealed Bridge Maintenance 31,260
Corridor ‐ Vegetation Control 5,273 5,273 5,378 5,486 5,601 5,719 5,851 5,986 6,136 6,289 6,446 6,607
Traffic Facilties 22,761 22,761 23,216 23,680 24,177 24,685 25,253 25,834 26,480 27,142 27,821 28,517
Rural Incident Response 5,778 5,778 5,894 6,012 6,138 6,267 6,411 6,558 6,722 6,890 7,062 7,239
Shire Drainage 57,847 17,847 18,204 18,568 18,958 19,356 19,801 20,256 20,762 21,281 21,813 22,358
Shire Corridor including grid repairs 28,886 8,886 29,464 30,053 30,684 31,328 32,049 32,786 33,606 34,446 35,307 36,190
Shire Bitumen Patching 38,359 38,359
Shire Heavy Patching 210,901 14,000
Shire Shoulder Grading 16,078 16,078 16,400 16,728 17,079 17,438 17,839 18,249 18,705 19,173 19,652 20,143
Loan interest ‐ Baroka Bridge 37,788 37,788 37,797 27,902 17,389 6,334 ‐ ‐ ‐ ‐ ‐ ‐
Roads ‐ Shire Rural Sealed Inspection and reporting 30,760 23,063 23,524 23,994 24,498 25,012 25,587 26,176 26,830 27,501 28,189 28,894
Depreciation ‐ RBF Regional Unsealed 142,296 142,296 142,296 142,296 142,296 142,296 142,296 142,296 142,296 142,296 142,296 142,296
Interest on Borrowings 20,870 20,870 7,783 7,783 1,264 ‐ ‐ ‐ ‐ ‐ ‐ ‐
Rural Corridor‐ Vegetation Control 8,400 7,200 2,040 2,081 2,125 2,170 2,220 2,271 2,328 2,386 2,446 2,507
Traffic Facilties 8,144 18,884 19,262 19,647 20,060 20,481 20,952 21,434 21,970 22,519 23,082 23,659
2020/2021 Long Term Finanicla Plan Scenario: Planned - 2.60% Rate Pegging Increase
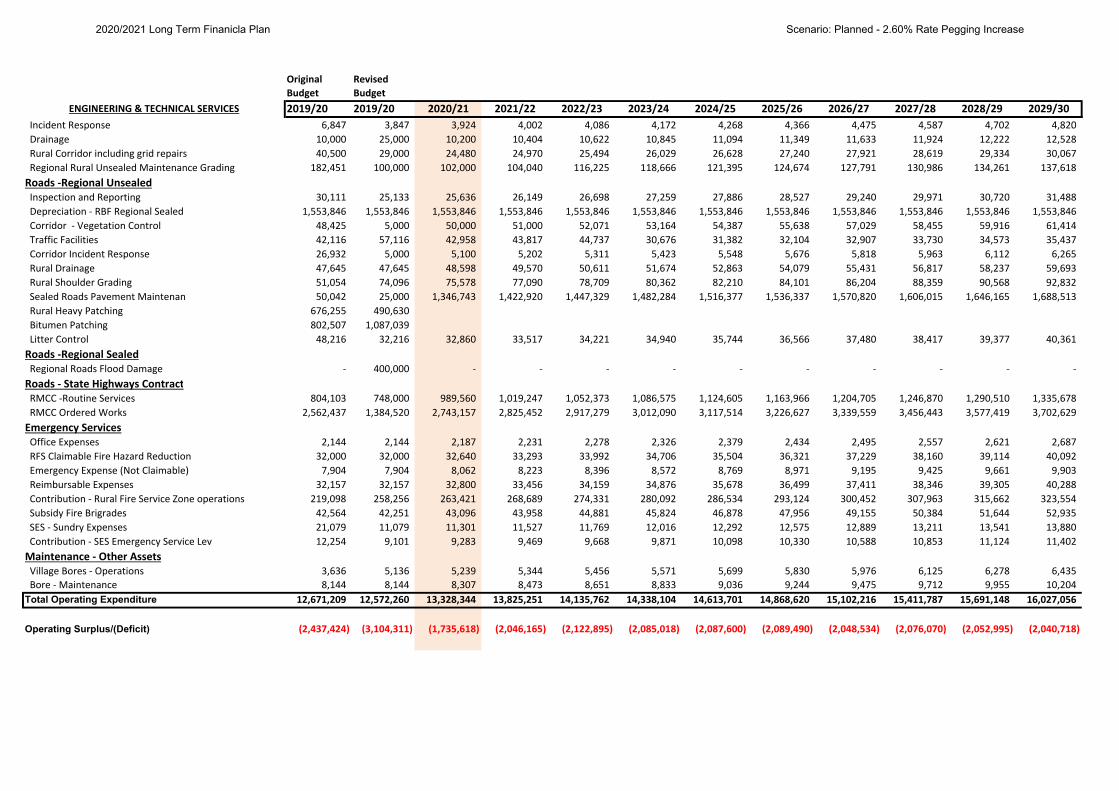
Original RevisedBudget Budget2019/20 2019/20 2020/21 2021/22 2022/23 2023/24 2024/25 2025/26 2026/27 2027/28 2028/29 2029/30ENGINEERING & TECHNICAL SERVICES
Incident Response 6,847 3,847 3,924 4,002 4,086 4,172 4,268 4,366 4,475 4,587 4,702 4,820
Drainage 10,000 25,000 10,200 10,404 10,622 10,845 11,094 11,349 11,633 11,924 12,222 12,528
Rural Corridor including grid repairs 40,500 29,000 24,480 24,970 25,494 26,029 26,628 27,240 27,921 28,619 29,334 30,067
Regional Rural Unsealed Maintenance Grading 182,451 100,000 102,000 104,040 116,225 118,666 121,395 124,674 127,791 130,986 134,261 137,618
Roads ‐Regional Unsealed Inspection and Reporting 30,111 25,133 25,636 26,149 26,698 27,259 27,886 28,527 29,240 29,971 30,720 31,488
Depreciation ‐ RBF Regional Sealed 1,553,846 1,553,846 1,553,846 1,553,846 1,553,846 1,553,846 1,553,846 1,553,846 1,553,846 1,553,846 1,553,846 1,553,846
Corridor ‐ Vegetation Control 48,425 5,000 50,000 51,000 52,071 53,164 54,387 55,638 57,029 58,455 59,916 61,414
Traffic Facilities 42,116 57,116 42,958 43,817 44,737 30,676 31,382 32,104 32,907 33,730 34,573 35,437
Corridor Incident Response 26,932 5,000 5,100 5,202 5,311 5,423 5,548 5,676 5,818 5,963 6,112 6,265
Rural Drainage 47,645 47,645 48,598 49,570 50,611 51,674 52,863 54,079 55,431 56,817 58,237 59,693
Rural Shoulder Grading 51,054 74,096 75,578 77,090 78,709 80,362 82,210 84,101 86,204 88,359 90,568 92,832
Sealed Roads Pavement Maintenan 50,042 25,000 1,346,743 1,422,920 1,447,329 1,482,284 1,516,377 1,536,337 1,570,820 1,606,015 1,646,165 1,688,513
Rural Heavy Patching 676,255 490,630
Bitumen Patching 802,507 1,087,039
Litter Control 48,216 32,216 32,860 33,517 34,221 34,940 35,744 36,566 37,480 38,417 39,377 40,361
Roads ‐Regional Sealed Regional Roads Flood Damage ‐ 400,000 ‐ ‐ ‐ ‐ ‐ ‐ ‐ ‐ ‐ ‐
Roads ‐ State Highways Contract RMCC ‐Routine Services 804,103 748,000 989,560 1,019,247 1,052,373 1,086,575 1,124,605 1,163,966 1,204,705 1,246,870 1,290,510 1,335,678
RMCC Ordered Works 2,562,437 1,384,520 2,743,157 2,825,452 2,917,279 3,012,090 3,117,514 3,226,627 3,339,559 3,456,443 3,577,419 3,702,629
Emergency Services Office Expenses 2,144 2,144 2,187 2,231 2,278 2,326 2,379 2,434 2,495 2,557 2,621 2,687
RFS Claimable Fire Hazard Reduction 32,000 32,000 32,640 33,293 33,992 34,706 35,504 36,321 37,229 38,160 39,114 40,092
Emergency Expense (Not Claimable) 7,904 7,904 8,062 8,223 8,396 8,572 8,769 8,971 9,195 9,425 9,661 9,903
Reimbursable Expenses 32,157 32,157 32,800 33,456 34,159 34,876 35,678 36,499 37,411 38,346 39,305 40,288
Contribution ‐ Rural Fire Service Zone operations 219,098 258,256 263,421 268,689 274,331 280,092 286,534 293,124 300,452 307,963 315,662 323,554
Subsidy Fire Brigrades 42,564 42,251 43,096 43,958 44,881 45,824 46,878 47,956 49,155 50,384 51,644 52,935
SES ‐ Sundry Expenses 21,079 11,079 11,301 11,527 11,769 12,016 12,292 12,575 12,889 13,211 13,541 13,880
Contribution ‐ SES Emergency Service Lev 12,254 9,101 9,283 9,469 9,668 9,871 10,098 10,330 10,588 10,853 11,124 11,402
Maintenance ‐ Other Assets Village Bores ‐ Operations 3,636 5,136 5,239 5,344 5,456 5,571 5,699 5,830 5,976 6,125 6,278 6,435
Bore ‐ Maintenance 8,144 8,144 8,307 8,473 8,651 8,833 9,036 9,244 9,475 9,712 9,955 10,204
Total Operating Expenditure 12,671,209 12,572,260 13,328,344 13,825,251 14,135,762 14,338,104 14,613,701 14,868,620 15,102,216 15,411,787 15,691,148 16,027,056
Operating Surplus/(Deficit) (2,437,424) (3,104,311) (1,735,618) (2,046,165) (2,122,895) (2,085,018) (2,087,600) (2,089,490) (2,048,534) (2,076,070) (2,052,995) (2,040,718)
2020/2021 Long Term Finanicla Plan Scenario: Planned - 2.60% Rate Pegging Increase
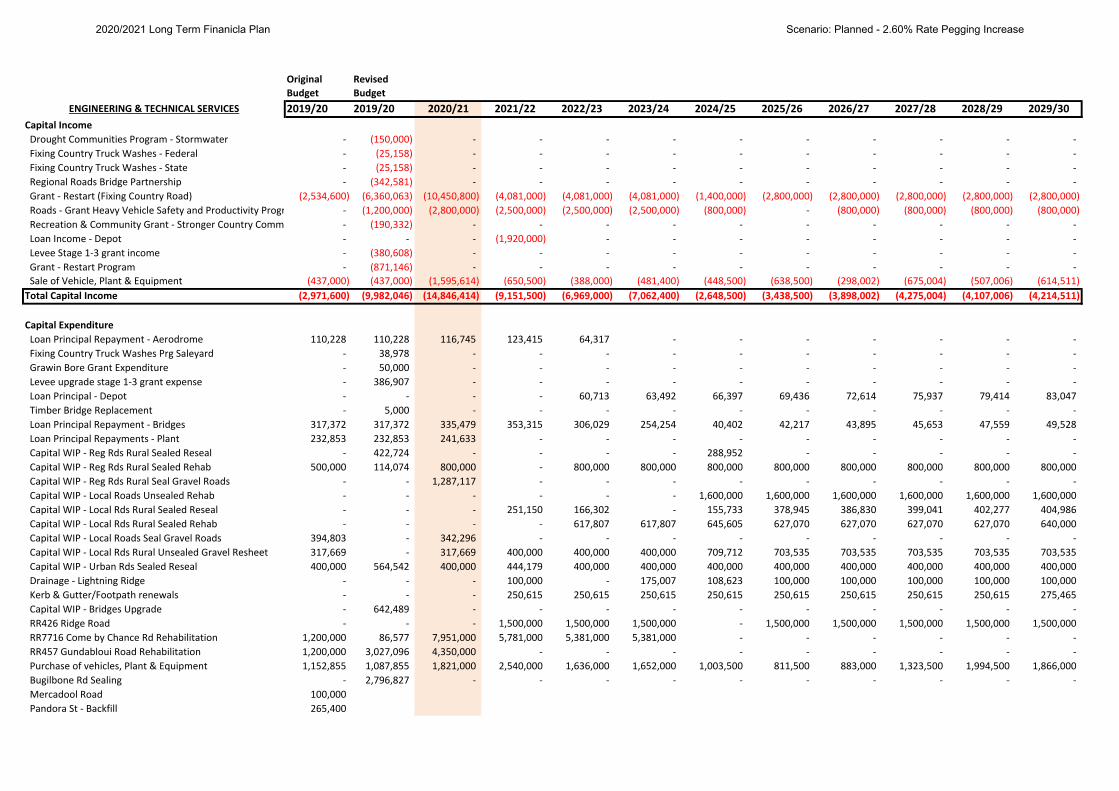
Original RevisedBudget Budget2019/20 2019/20 2020/21 2021/22 2022/23 2023/24 2024/25 2025/26 2026/27 2027/28 2028/29 2029/30ENGINEERING & TECHNICAL SERVICES
Capital Income Drought Communities Program ‐ Stormwater ‐ (150,000) ‐ ‐ ‐ ‐ ‐ ‐ ‐ ‐ ‐ ‐
Fixing Country Truck Washes ‐ Federal ‐ (25,158) ‐ ‐ ‐ ‐ ‐ ‐ ‐ ‐ ‐ ‐
Fixing Country Truck Washes ‐ State ‐ (25,158) ‐ ‐ ‐ ‐ ‐ ‐ ‐ ‐ ‐ ‐
Regional Roads Bridge Partnership ‐ (342,581) ‐ ‐ ‐ ‐ ‐ ‐ ‐ ‐ ‐ ‐
Grant ‐ Restart (Fixing Country Road) (2,534,600) (6,360,063) (10,450,800) (4,081,000) (4,081,000) (4,081,000) (1,400,000) (2,800,000) (2,800,000) (2,800,000) (2,800,000) (2,800,000)
Roads ‐ Grant Heavy Vehicle Safety and Productivity Progr ‐ (1,200,000) (2,800,000) (2,500,000) (2,500,000) (2,500,000) (800,000) ‐ (800,000) (800,000) (800,000) (800,000)
Recreation & Community Grant ‐ Stronger Country Comm ‐ (190,332) ‐ ‐ ‐ ‐ ‐ ‐ ‐ ‐ ‐ ‐
Loan Income ‐ Depot ‐ ‐ ‐ (1,920,000) ‐ ‐ ‐ ‐ ‐ ‐ ‐ ‐
Levee Stage 1‐3 grant income ‐ (380,608) ‐ ‐ ‐ ‐ ‐ ‐ ‐ ‐ ‐ ‐
Grant ‐ Restart Program ‐ (871,146) ‐ ‐ ‐ ‐ ‐ ‐ ‐ ‐ ‐ ‐
Sale of Vehicle, Plant & Equipment (437,000) (437,000) (1,595,614) (650,500) (388,000) (481,400) (448,500) (638,500) (298,002) (675,004) (507,006) (614,511)
Total Capital Income (2,971,600) (9,982,046) (14,846,414) (9,151,500) (6,969,000) (7,062,400) (2,648,500) (3,438,500) (3,898,002) (4,275,004) (4,107,006) (4,214,511)
Capital Expenditure Loan Principal Repayment ‐ Aerodrome 110,228 110,228 116,745 123,415 64,317 ‐ ‐ ‐ ‐ ‐ ‐ ‐
Fixing Country Truck Washes Prg Saleyard ‐ 38,978 ‐ ‐ ‐ ‐ ‐ ‐ ‐ ‐ ‐ ‐
Grawin Bore Grant Expenditure ‐ 50,000 ‐ ‐ ‐ ‐ ‐ ‐ ‐ ‐ ‐ ‐
Levee upgrade stage 1‐3 grant expense ‐ 386,907 ‐ ‐ ‐ ‐ ‐ ‐ ‐ ‐ ‐ ‐
Loan Principal ‐ Depot ‐ ‐ ‐ ‐ 60,713 63,492 66,397 69,436 72,614 75,937 79,414 83,047
Timber Bridge Replacement ‐ 5,000 ‐ ‐ ‐ ‐ ‐ ‐ ‐ ‐ ‐ ‐
Loan Principal Repayment ‐ Bridges 317,372 317,372 335,479 353,315 306,029 254,254 40,402 42,217 43,895 45,653 47,559 49,528
Loan Principal Repayments ‐ Plant 232,853 232,853 241,633 ‐ ‐ ‐ ‐ ‐ ‐ ‐ ‐ ‐
Capital WIP ‐ Reg Rds Rural Sealed Reseal ‐ 422,724 ‐ ‐ ‐ ‐ 288,952 ‐ ‐ ‐ ‐ ‐
Capital WIP ‐ Reg Rds Rural Sealed Rehab 500,000 114,074 800,000 ‐ 800,000 800,000 800,000 800,000 800,000 800,000 800,000 800,000
Capital WIP ‐ Reg Rds Rural Seal Gravel Roads ‐ ‐ 1,287,117 ‐ ‐ ‐ ‐ ‐ ‐ ‐ ‐ ‐
Capital WIP ‐ Local Roads Unsealed Rehab ‐ ‐ ‐ ‐ ‐ ‐ 1,600,000 1,600,000 1,600,000 1,600,000 1,600,000 1,600,000
Capital WIP ‐ Local Rds Rural Sealed Reseal ‐ ‐ ‐ 251,150 166,302 ‐ 155,733 378,945 386,830 399,041 402,277 404,986
Capital WIP ‐ Local Rds Rural Sealed Rehab ‐ ‐ ‐ ‐ 617,807 617,807 645,605 627,070 627,070 627,070 627,070 640,000
Capital WIP ‐ Local Roads Seal Gravel Roads 394,803 ‐ 342,296 ‐ ‐ ‐ ‐ ‐ ‐ ‐ ‐ ‐
Capital WIP ‐ Local Rds Rural Unsealed Gravel Resheet 317,669 ‐ 317,669 400,000 400,000 400,000 709,712 703,535 703,535 703,535 703,535 703,535
Capital WIP ‐ Urban Rds Sealed Reseal 400,000 564,542 400,000 444,179 400,000 400,000 400,000 400,000 400,000 400,000 400,000 400,000
Drainage ‐ Lightning Ridge ‐ ‐ ‐ 100,000 ‐ 175,007 108,623 100,000 100,000 100,000 100,000 100,000
Kerb & Gutter/Footpath renewals ‐ ‐ ‐ 250,615 250,615 250,615 250,615 250,615 250,615 250,615 250,615 275,465
Capital WIP ‐ Bridges Upgrade ‐ 642,489 ‐ ‐ ‐ ‐ ‐ ‐ ‐ ‐ ‐ ‐
RR426 Ridge Road ‐ ‐ ‐ 1,500,000 1,500,000 1,500,000 ‐ 1,500,000 1,500,000 1,500,000 1,500,000 1,500,000
RR7716 Come by Chance Rd Rehabilitation 1,200,000 86,577 7,951,000 5,781,000 5,381,000 5,381,000 ‐ ‐ ‐ ‐ ‐ ‐
RR457 Gundabloui Road Rehabilitation 1,200,000 3,027,096 4,350,000 ‐ ‐ ‐ ‐ ‐ ‐ ‐ ‐ ‐
Purchase of vehicles, Plant & Equipment 1,152,855 1,087,855 1,821,000 2,540,000 1,636,000 1,652,000 1,003,500 811,500 883,000 1,323,500 1,994,500 1,866,000
Bugilbone Rd Sealing ‐ 2,796,827 ‐ ‐ ‐ ‐ ‐ ‐ ‐ ‐ ‐ ‐
Mercadool Road 100,000
Pandora St ‐ Backfill 265,400
2020/2021 Long Term Finanicla Plan Scenario: Planned - 2.60% Rate Pegging Increase
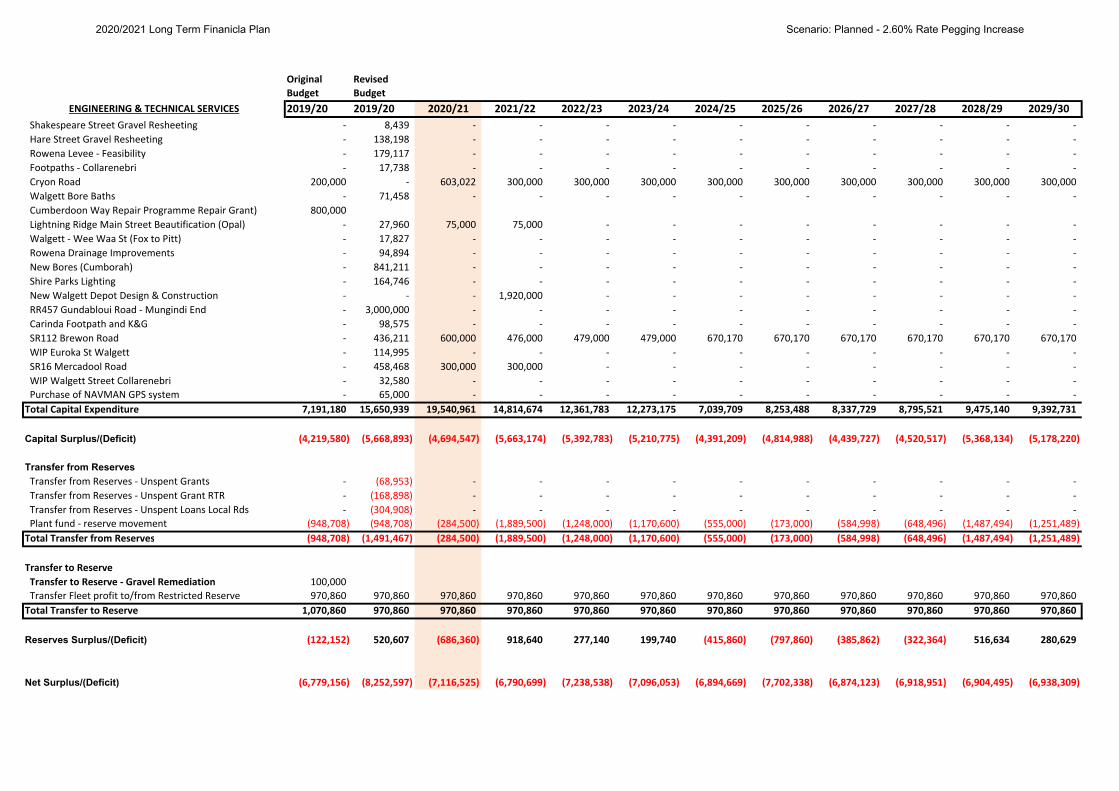
Original RevisedBudget Budget2019/20 2019/20 2020/21 2021/22 2022/23 2023/24 2024/25 2025/26 2026/27 2027/28 2028/29 2029/30ENGINEERING & TECHNICAL SERVICES
Shakespeare Street Gravel Resheeting ‐ 8,439 ‐ ‐ ‐ ‐ ‐ ‐ ‐ ‐ ‐ ‐
Hare Street Gravel Resheeting ‐ 138,198 ‐ ‐ ‐ ‐ ‐ ‐ ‐ ‐ ‐ ‐
Rowena Levee ‐ Feasibility ‐ 179,117 ‐ ‐ ‐ ‐ ‐ ‐ ‐ ‐ ‐ ‐
Footpaths ‐ Collarenebri ‐ 17,738 ‐ ‐ ‐ ‐ ‐ ‐ ‐ ‐ ‐ ‐
Cryon Road 200,000 ‐ 603,022 300,000 300,000 300,000 300,000 300,000 300,000 300,000 300,000 300,000
Walgett Bore Baths ‐ 71,458 ‐ ‐ ‐ ‐ ‐ ‐ ‐ ‐ ‐ ‐
Cumberdoon Way Repair Programme Repair Grant) 800,000
Lightning Ridge Main Street Beautification (Opal) ‐ 27,960 75,000 75,000 ‐ ‐ ‐ ‐ ‐ ‐ ‐ ‐
Walgett ‐ Wee Waa St (Fox to Pitt) ‐ 17,827 ‐ ‐ ‐ ‐ ‐ ‐ ‐ ‐ ‐ ‐
Rowena Drainage Improvements ‐ 94,894 ‐ ‐ ‐ ‐ ‐ ‐ ‐ ‐ ‐ ‐
New Bores (Cumborah) ‐ 841,211 ‐ ‐ ‐ ‐ ‐ ‐ ‐ ‐ ‐ ‐
Shire Parks Lighting ‐ 164,746 ‐ ‐ ‐ ‐ ‐ ‐ ‐ ‐ ‐ ‐
New Walgett Depot Design & Construction ‐ ‐ ‐ 1,920,000 ‐ ‐ ‐ ‐ ‐ ‐ ‐ ‐
RR457 Gundabloui Road ‐ Mungindi End ‐ 3,000,000 ‐ ‐ ‐ ‐ ‐ ‐ ‐ ‐ ‐ ‐
Carinda Footpath and K&G ‐ 98,575 ‐ ‐ ‐ ‐ ‐ ‐ ‐ ‐ ‐ ‐
SR112 Brewon Road ‐ 436,211 600,000 476,000 479,000 479,000 670,170 670,170 670,170 670,170 670,170 670,170
WIP Euroka St Walgett ‐ 114,995 ‐ ‐ ‐ ‐ ‐ ‐ ‐ ‐ ‐ ‐
SR16 Mercadool Road ‐ 458,468 300,000 300,000 ‐ ‐ ‐ ‐ ‐ ‐ ‐ ‐
WIP Walgett Street Collarenebri ‐ 32,580 ‐ ‐ ‐ ‐ ‐ ‐ ‐ ‐ ‐ ‐
Purchase of NAVMAN GPS system ‐ 65,000 ‐ ‐ ‐ ‐ ‐ ‐ ‐ ‐ ‐ ‐
Total Capital Expenditure 7,191,180 15,650,939 19,540,961 14,814,674 12,361,783 12,273,175 7,039,709 8,253,488 8,337,729 8,795,521 9,475,140 9,392,731
Capital Surplus/(Deficit) (4,219,580) (5,668,893) (4,694,547) (5,663,174) (5,392,783) (5,210,775) (4,391,209) (4,814,988) (4,439,727) (4,520,517) (5,368,134) (5,178,220)
Transfer from Reserves Transfer from Reserves ‐ Unspent Grants ‐ (68,953) ‐ ‐ ‐ ‐ ‐ ‐ ‐ ‐ ‐ ‐
Transfer from Reserves ‐ Unspent Grant RTR ‐ (168,898) ‐ ‐ ‐ ‐ ‐ ‐ ‐ ‐ ‐ ‐
Transfer from Reserves ‐ Unspent Loans Local Rds ‐ (304,908) ‐ ‐ ‐ ‐ ‐ ‐ ‐ ‐ ‐ ‐
Plant fund ‐ reserve movement (948,708) (948,708) (284,500) (1,889,500) (1,248,000) (1,170,600) (555,000) (173,000) (584,998) (648,496) (1,487,494) (1,251,489)
Total Transfer from Reserves (948,708) (1,491,467) (284,500) (1,889,500) (1,248,000) (1,170,600) (555,000) (173,000) (584,998) (648,496) (1,487,494) (1,251,489)
Transfer to Reserve Transfer to Reserve ‐ Gravel Remediation 100,000
Transfer Fleet profit to/from Restricted Reserve 970,860 970,860 970,860 970,860 970,860 970,860 970,860 970,860 970,860 970,860 970,860 970,860
Total Transfer to Reserve 1,070,860 970,860 970,860 970,860 970,860 970,860 970,860 970,860 970,860 970,860 970,860 970,860
Reserves Surplus/(Deficit) (122,152) 520,607 (686,360) 918,640 277,140 199,740 (415,860) (797,860) (385,862) (322,364) 516,634 280,629
Net Surplus/(Deficit) (6,779,156) (8,252,597) (7,116,525) (6,790,699) (7,238,538) (7,096,053) (6,894,669) (7,702,338) (6,874,123) (6,918,951) (6,904,495) (6,938,309)
2020/2021 Long Term Finanicla Plan Scenario: Planned - 2.60% Rate Pegging Increase
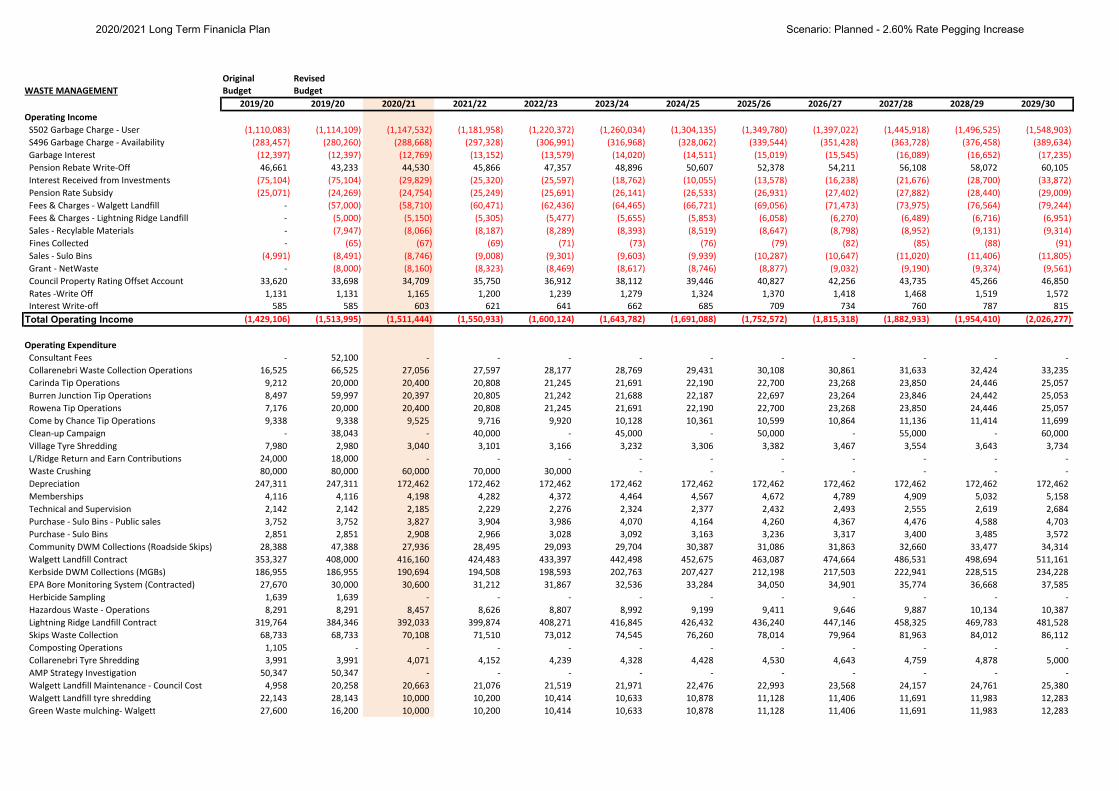
Original RevisedWASTE MANAGEMENT Budget Budget
2019/20 2019/20 2020/21 2021/22 2022/23 2023/24 2024/25 2025/26 2026/27 2027/28 2028/29 2029/30Operating Income S502 Garbage Charge ‐ User (1,110,083) (1,114,109) (1,147,532) (1,181,958) (1,220,372) (1,260,034) (1,304,135) (1,349,780) (1,397,022) (1,445,918) (1,496,525) (1,548,903)
S496 Garbage Charge ‐ Availability (283,457) (280,260) (288,668) (297,328) (306,991) (316,968) (328,062) (339,544) (351,428) (363,728) (376,458) (389,634)
Garbage Interest (12,397) (12,397) (12,769) (13,152) (13,579) (14,020) (14,511) (15,019) (15,545) (16,089) (16,652) (17,235)
Pension Rebate Write‐Off 46,661 43,233 44,530 45,866 47,357 48,896 50,607 52,378 54,211 56,108 58,072 60,105
Interest Received from Investments (75,104) (75,104) (29,829) (25,320) (25,597) (18,762) (10,055) (13,578) (16,238) (21,676) (28,700) (33,872)
Pension Rate Subsidy (25,071) (24,269) (24,754) (25,249) (25,691) (26,141) (26,533) (26,931) (27,402) (27,882) (28,440) (29,009)
Fees & Charges ‐ Walgett Landfill ‐ (57,000) (58,710) (60,471) (62,436) (64,465) (66,721) (69,056) (71,473) (73,975) (76,564) (79,244)
Fees & Charges ‐ Lightning Ridge Landfill ‐ (5,000) (5,150) (5,305) (5,477) (5,655) (5,853) (6,058) (6,270) (6,489) (6,716) (6,951)
Sales ‐ Recylable Materials ‐ (7,947) (8,066) (8,187) (8,289) (8,393) (8,519) (8,647) (8,798) (8,952) (9,131) (9,314)
Fines Collected ‐ (65) (67) (69) (71) (73) (76) (79) (82) (85) (88) (91)
Sales ‐ Sulo Bins (4,991) (8,491) (8,746) (9,008) (9,301) (9,603) (9,939) (10,287) (10,647) (11,020) (11,406) (11,805)
Grant ‐ NetWaste ‐ (8,000) (8,160) (8,323) (8,469) (8,617) (8,746) (8,877) (9,032) (9,190) (9,374) (9,561)
Council Property Rating Offset Account 33,620 33,698 34,709 35,750 36,912 38,112 39,446 40,827 42,256 43,735 45,266 46,850
Rates ‐Write Off 1,131 1,131 1,165 1,200 1,239 1,279 1,324 1,370 1,418 1,468 1,519 1,572
Interest Write‐off 585 585 603 621 641 662 685 709 734 760 787 815
Total Operating Income (1,429,106) (1,513,995) (1,511,444) (1,550,933) (1,600,124) (1,643,782) (1,691,088) (1,752,572) (1,815,318) (1,882,933) (1,954,410) (2,026,277)
Operating Expenditure Consultant Fees ‐ 52,100 ‐ ‐ ‐ ‐ ‐ ‐ ‐ ‐ ‐ ‐
Collarenebri Waste Collection Operations 16,525 66,525 27,056 27,597 28,177 28,769 29,431 30,108 30,861 31,633 32,424 33,235
Carinda Tip Operations 9,212 20,000 20,400 20,808 21,245 21,691 22,190 22,700 23,268 23,850 24,446 25,057
Burren Junction Tip Operations 8,497 59,997 20,397 20,805 21,242 21,688 22,187 22,697 23,264 23,846 24,442 25,053
Rowena Tip Operations 7,176 20,000 20,400 20,808 21,245 21,691 22,190 22,700 23,268 23,850 24,446 25,057
Come by Chance Tip Operations 9,338 9,338 9,525 9,716 9,920 10,128 10,361 10,599 10,864 11,136 11,414 11,699
Clean‐up Campaign ‐ 38,043 ‐ 40,000 ‐ 45,000 ‐ 50,000 ‐ 55,000 ‐ 60,000
Village Tyre Shredding 7,980 2,980 3,040 3,101 3,166 3,232 3,306 3,382 3,467 3,554 3,643 3,734
L/Ridge Return and Earn Contributions 24,000 18,000 ‐ ‐ ‐ ‐ ‐ ‐ ‐ ‐ ‐ ‐
Waste Crushing 80,000 80,000 60,000 70,000 30,000 ‐ ‐ ‐ ‐ ‐ ‐ ‐
Depreciation 247,311 247,311 172,462 172,462 172,462 172,462 172,462 172,462 172,462 172,462 172,462 172,462
Memberships 4,116 4,116 4,198 4,282 4,372 4,464 4,567 4,672 4,789 4,909 5,032 5,158
Technical and Supervision 2,142 2,142 2,185 2,229 2,276 2,324 2,377 2,432 2,493 2,555 2,619 2,684
Purchase ‐ Sulo Bins ‐ Public sales 3,752 3,752 3,827 3,904 3,986 4,070 4,164 4,260 4,367 4,476 4,588 4,703
Purchase ‐ Sulo Bins 2,851 2,851 2,908 2,966 3,028 3,092 3,163 3,236 3,317 3,400 3,485 3,572
Community DWM Collections (Roadside Skips) 28,388 47,388 27,936 28,495 29,093 29,704 30,387 31,086 31,863 32,660 33,477 34,314
Walgett Landfill Contract 353,327 408,000 416,160 424,483 433,397 442,498 452,675 463,087 474,664 486,531 498,694 511,161
Kerbside DWM Collections (MGBs) 186,955 186,955 190,694 194,508 198,593 202,763 207,427 212,198 217,503 222,941 228,515 234,228
EPA Bore Monitoring System (Contracted) 27,670 30,000 30,600 31,212 31,867 32,536 33,284 34,050 34,901 35,774 36,668 37,585
Herbicide Sampling 1,639 1,639 ‐ ‐ ‐ ‐ ‐ ‐ ‐ ‐ ‐ ‐
Hazardous Waste ‐ Operations 8,291 8,291 8,457 8,626 8,807 8,992 9,199 9,411 9,646 9,887 10,134 10,387
Lightning Ridge Landfill Contract 319,764 384,346 392,033 399,874 408,271 416,845 426,432 436,240 447,146 458,325 469,783 481,528
Skips Waste Collection 68,733 68,733 70,108 71,510 73,012 74,545 76,260 78,014 79,964 81,963 84,012 86,112
Composting Operations 1,105 ‐ ‐ ‐ ‐ ‐ ‐ ‐ ‐ ‐ ‐ ‐
Collarenebri Tyre Shredding 3,991 3,991 4,071 4,152 4,239 4,328 4,428 4,530 4,643 4,759 4,878 5,000
AMP Strategy Investigation 50,347 50,347 ‐ ‐ ‐ ‐ ‐ ‐ ‐ ‐ ‐ ‐
Walgett Landfill Maintenance ‐ Council Cost 4,958 20,258 20,663 21,076 21,519 21,971 22,476 22,993 23,568 24,157 24,761 25,380
Walgett Landfill tyre shredding 22,143 28,143 10,000 10,200 10,414 10,633 10,878 11,128 11,406 11,691 11,983 12,283
Green Waste mulching‐ Walgett 27,600 16,200 10,000 10,200 10,414 10,633 10,878 11,128 11,406 11,691 11,983 12,283
2020/2021 Long Term Finanicla Plan Scenario: Planned - 2.60% Rate Pegging Increase
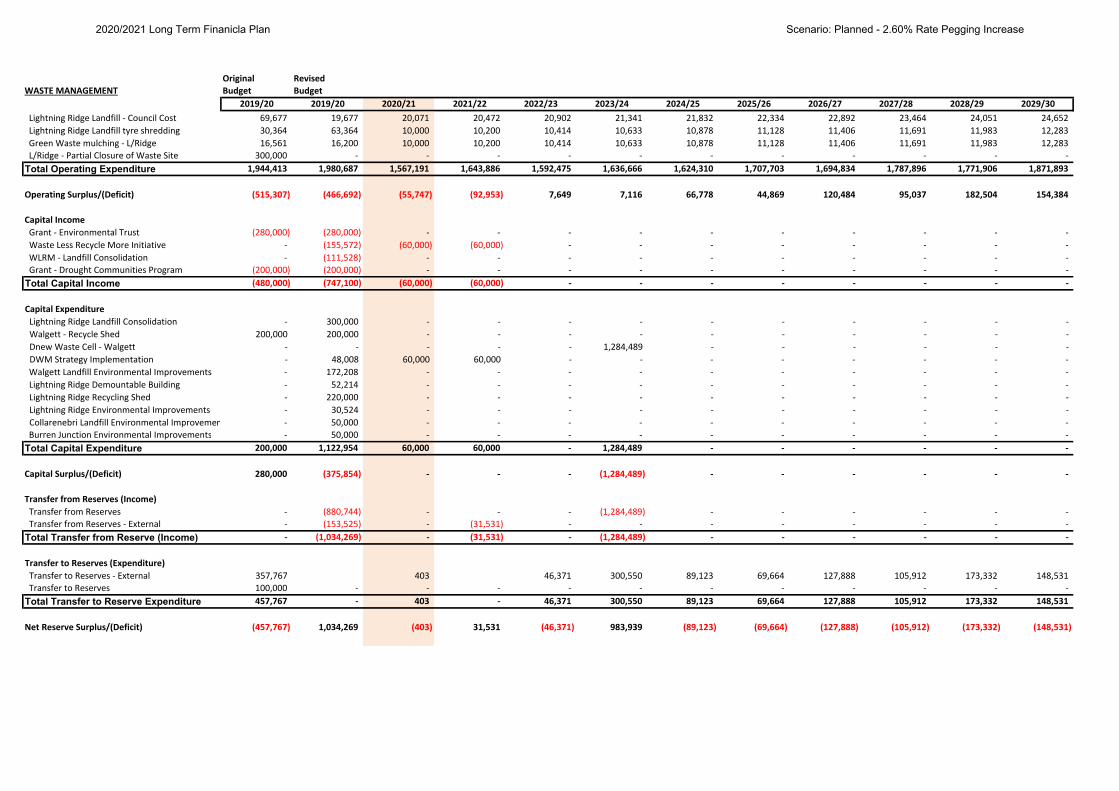
Original RevisedWASTE MANAGEMENT Budget Budget
2019/20 2019/20 2020/21 2021/22 2022/23 2023/24 2024/25 2025/26 2026/27 2027/28 2028/29 2029/30 Lightning Ridge Landfill ‐ Council Cost 69,677 19,677 20,071 20,472 20,902 21,341 21,832 22,334 22,892 23,464 24,051 24,652
Lightning Ridge Landfill tyre shredding 30,364 63,364 10,000 10,200 10,414 10,633 10,878 11,128 11,406 11,691 11,983 12,283
Green Waste mulching ‐ L/Ridge 16,561 16,200 10,000 10,200 10,414 10,633 10,878 11,128 11,406 11,691 11,983 12,283
L/Ridge ‐ Partial Closure of Waste Site 300,000 ‐ ‐ ‐ ‐ ‐ ‐ ‐ ‐ ‐ ‐ ‐
Total Operating Expenditure 1,944,413 1,980,687 1,567,191 1,643,886 1,592,475 1,636,666 1,624,310 1,707,703 1,694,834 1,787,896 1,771,906 1,871,893
Operating Surplus/(Deficit) (515,307) (466,692) (55,747) (92,953) 7,649 7,116 66,778 44,869 120,484 95,037 182,504 154,384
Capital Income Grant ‐ Environmental Trust (280,000) (280,000) ‐ ‐ ‐ ‐ ‐ ‐ ‐ ‐ ‐ ‐
Waste Less Recycle More Initiative ‐ (155,572) (60,000) (60,000) ‐ ‐ ‐ ‐ ‐ ‐ ‐ ‐
WLRM ‐ Landfill Consolidation ‐ (111,528) ‐ ‐ ‐ ‐ ‐ ‐ ‐ ‐ ‐ ‐
Grant ‐ Drought Communities Program (200,000) (200,000) ‐ ‐ ‐ ‐ ‐ ‐ ‐ ‐ ‐ ‐
Total Capital Income (480,000) (747,100) (60,000) (60,000) ‐ ‐ ‐ ‐ ‐ ‐ ‐ ‐
Capital Expenditure Lightning Ridge Landfill Consolidation ‐ 300,000 ‐ ‐ ‐ ‐ ‐ ‐ ‐ ‐ ‐ ‐
Walgett ‐ Recycle Shed 200,000 200,000 ‐ ‐ ‐ ‐ ‐ ‐ ‐ ‐ ‐ ‐
Dnew Waste Cell ‐ Walgett ‐ ‐ ‐ ‐ ‐ 1,284,489 ‐ ‐ ‐ ‐ ‐ ‐
DWM Strategy Implementation ‐ 48,008 60,000 60,000 ‐ ‐ ‐ ‐ ‐ ‐ ‐ ‐
Walgett Landfill Environmental Improvements ‐ 172,208 ‐ ‐ ‐ ‐ ‐ ‐ ‐ ‐ ‐ ‐
Lightning Ridge Demountable Building ‐ 52,214 ‐ ‐ ‐ ‐ ‐ ‐ ‐ ‐ ‐ ‐
Lightning Ridge Recycling Shed ‐ 220,000 ‐ ‐ ‐ ‐ ‐ ‐ ‐ ‐ ‐ ‐
Lightning Ridge Environmental Improvements ‐ 30,524 ‐ ‐ ‐ ‐ ‐ ‐ ‐ ‐ ‐ ‐
Collarenebri Landfill Environmental Improvemen ‐ 50,000 ‐ ‐ ‐ ‐ ‐ ‐ ‐ ‐ ‐ ‐
Burren Junction Environmental Improvements ‐ 50,000 ‐ ‐ ‐ ‐ ‐ ‐ ‐ ‐ ‐ ‐
Total Capital Expenditure 200,000 1,122,954 60,000 60,000 ‐ 1,284,489 ‐ ‐ ‐ ‐ ‐ ‐
Capital Surplus/(Deficit) 280,000 (375,854) ‐ ‐ ‐ (1,284,489) ‐ ‐ ‐ ‐ ‐ ‐
Transfer from Reserves (Income) Transfer from Reserves ‐ (880,744) ‐ ‐ ‐ (1,284,489) ‐ ‐ ‐ ‐ ‐ ‐
Transfer from Reserves ‐ External ‐ (153,525) ‐ (31,531) ‐ ‐ ‐ ‐ ‐ ‐ ‐ ‐
Total Transfer from Reserve (Income) ‐ (1,034,269) ‐ (31,531) ‐ (1,284,489) ‐ ‐ ‐ ‐ ‐ ‐
Transfer to Reserves (Expenditure) Transfer to Reserves ‐ External 357,767 403 46,371 300,550 89,123 69,664 127,888 105,912 173,332 148,531
Transfer to Reserves 100,000 ‐ ‐ ‐ ‐ ‐ ‐ ‐ ‐ ‐ ‐ ‐
Total Transfer to Reserve Expenditure 457,767 ‐ 403 ‐ 46,371 300,550 89,123 69,664 127,888 105,912 173,332 148,531
Net Reserve Surplus/(Deficit) (457,767) 1,034,269 (403) 31,531 (46,371) 983,939 (89,123) (69,664) (127,888) (105,912) (173,332) (148,531)
2020/2021 Long Term Finanicla Plan Scenario: Planned - 2.60% Rate Pegging Increase
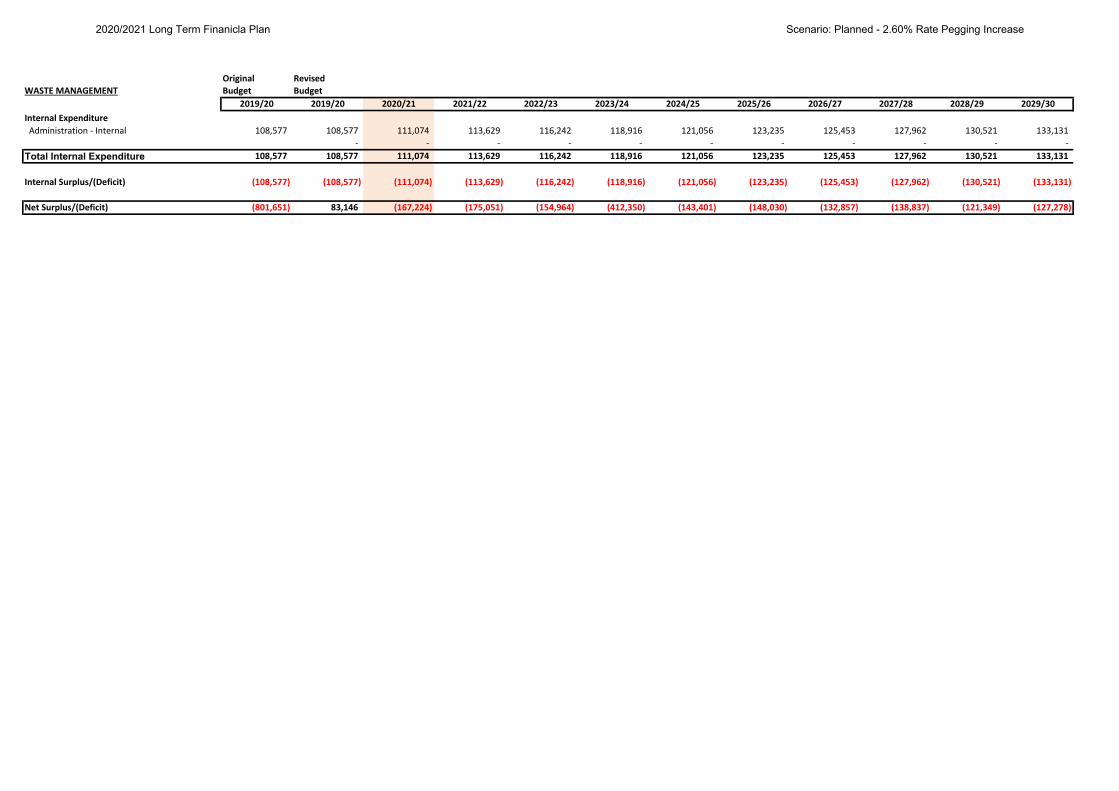
Original RevisedWASTE MANAGEMENT Budget Budget
2019/20 2019/20 2020/21 2021/22 2022/23 2023/24 2024/25 2025/26 2026/27 2027/28 2028/29 2029/30Internal Expenditure Administration ‐ Internal 108,577 108,577 111,074 113,629 116,242 118,916 121,056 123,235 125,453 127,962 130,521 133,131
‐ ‐ ‐ ‐ ‐ ‐ ‐ ‐ ‐ ‐ ‐
Total Internal Expenditure 108,577 108,577 111,074 113,629 116,242 118,916 121,056 123,235 125,453 127,962 130,521 133,131
Internal Surplus/(Deficit) (108,577) (108,577) (111,074) (113,629) (116,242) (118,916) (121,056) (123,235) (125,453) (127,962) (130,521) (133,131)
Net Surplus/(Deficit) (801,651) 83,146 (167,224) (175,051) (154,964) (412,350) (143,401) (148,030) (132,857) (138,837) (121,349) (127,278)
2020/2021 Long Term Finanicla Plan Scenario: Planned - 2.60% Rate Pegging Increase
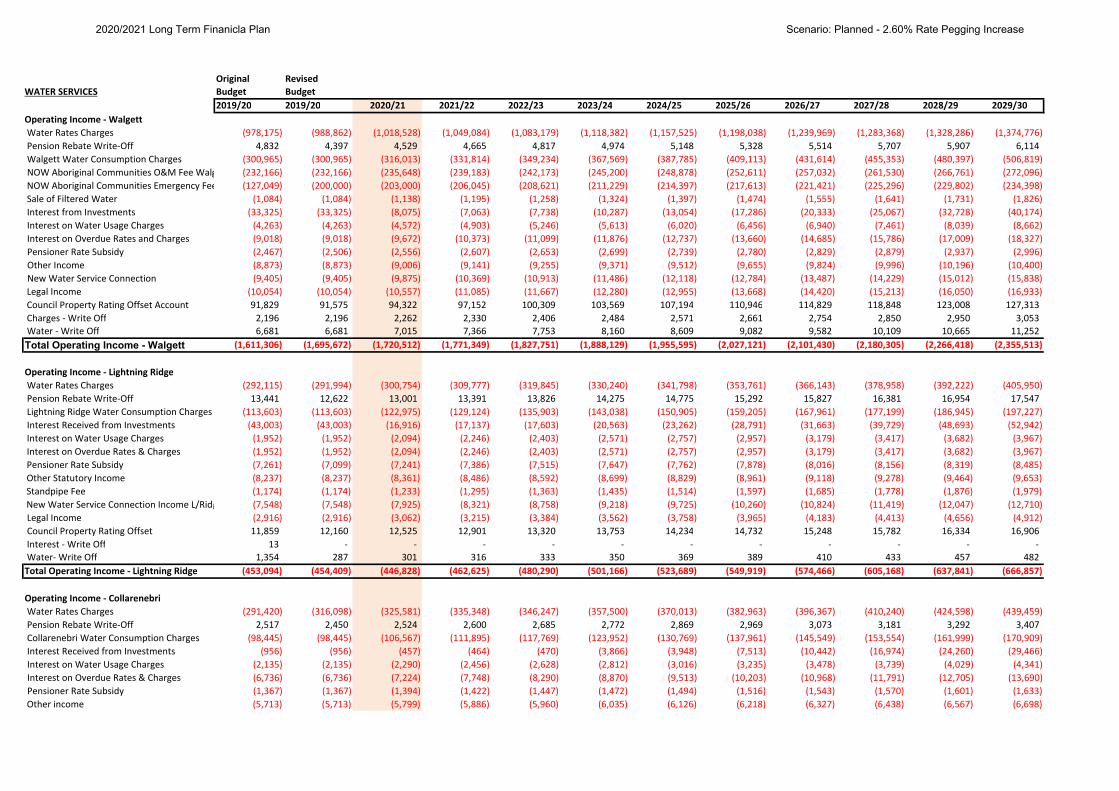
Original RevisedWATER SERVICES Budget Budget
2019/20 2019/20 2020/21 2021/22 2022/23 2023/24 2024/25 2025/26 2026/27 2027/28 2028/29 2029/30Operating Income ‐ Walgett Water Rates Charges (978,175) (988,862) (1,018,528) (1,049,084) (1,083,179) (1,118,382) (1,157,525) (1,198,038) (1,239,969) (1,283,368) (1,328,286) (1,374,776)
Pension Rebate Write‐Off 4,832 4,397 4,529 4,665 4,817 4,974 5,148 5,328 5,514 5,707 5,907 6,114
Walgett Water Consumption Charges (300,965) (300,965) (316,013) (331,814) (349,234) (367,569) (387,785) (409,113) (431,614) (455,353) (480,397) (506,819)
NOW Aboriginal Communities O&M Fee Walg (232,166) (232,166) (235,648) (239,183) (242,173) (245,200) (248,878) (252,611) (257,032) (261,530) (266,761) (272,096)
NOW Aboriginal Communities Emergency Fee (127,049) (200,000) (203,000) (206,045) (208,621) (211,229) (214,397) (217,613) (221,421) (225,296) (229,802) (234,398)
Sale of Filtered Water (1,084) (1,084) (1,138) (1,195) (1,258) (1,324) (1,397) (1,474) (1,555) (1,641) (1,731) (1,826)
Interest from Investments (33,325) (33,325) (8,075) (7,063) (7,738) (10,287) (13,054) (17,286) (20,333) (25,067) (32,728) (40,174)
Interest on Water Usage Charges (4,263) (4,263) (4,572) (4,903) (5,246) (5,613) (6,020) (6,456) (6,940) (7,461) (8,039) (8,662)
Interest on Overdue Rates and Charges (9,018) (9,018) (9,672) (10,373) (11,099) (11,876) (12,737) (13,660) (14,685) (15,786) (17,009) (18,327)
Pensioner Rate Subsidy (2,467) (2,506) (2,556) (2,607) (2,653) (2,699) (2,739) (2,780) (2,829) (2,879) (2,937) (2,996)
Other Income (8,873) (8,873) (9,006) (9,141) (9,255) (9,371) (9,512) (9,655) (9,824) (9,996) (10,196) (10,400)
New Water Service Connection (9,405) (9,405) (9,875) (10,369) (10,913) (11,486) (12,118) (12,784) (13,487) (14,229) (15,012) (15,838)
Legal Income (10,054) (10,054) (10,557) (11,085) (11,667) (12,280) (12,955) (13,668) (14,420) (15,213) (16,050) (16,933)
Council Property Rating Offset Account 91,829 91,575 94,322 97,152 100,309 103,569 107,194 110,946 114,829 118,848 123,008 127,313
Charges ‐ Write Off 2,196 2,196 2,262 2,330 2,406 2,484 2,571 2,661 2,754 2,850 2,950 3,053
Water ‐ Write Off 6,681 6,681 7,015 7,366 7,753 8,160 8,609 9,082 9,582 10,109 10,665 11,252
Total Operating Income - Walgett (1,611,306) (1,695,672) (1,720,512) (1,771,349) (1,827,751) (1,888,129) (1,955,595) (2,027,121) (2,101,430) (2,180,305) (2,266,418) (2,355,513)
Operating Income ‐ Lightning Ridge Water Rates Charges (292,115) (291,994) (300,754) (309,777) (319,845) (330,240) (341,798) (353,761) (366,143) (378,958) (392,222) (405,950)
Pension Rebate Write‐Off 13,441 12,622 13,001 13,391 13,826 14,275 14,775 15,292 15,827 16,381 16,954 17,547
Lightning Ridge Water Consumption Charges (113,603) (113,603) (122,975) (129,124) (135,903) (143,038) (150,905) (159,205) (167,961) (177,199) (186,945) (197,227)
Interest Received from Investments (43,003) (43,003) (16,916) (17,137) (17,603) (20,563) (23,262) (28,791) (31,663) (39,729) (48,693) (52,942)
Interest on Water Usage Charges (1,952) (1,952) (2,094) (2,246) (2,403) (2,571) (2,757) (2,957) (3,179) (3,417) (3,682) (3,967)
Interest on Overdue Rates & Charges (1,952) (1,952) (2,094) (2,246) (2,403) (2,571) (2,757) (2,957) (3,179) (3,417) (3,682) (3,967)
Pensioner Rate Subsidy (7,261) (7,099) (7,241) (7,386) (7,515) (7,647) (7,762) (7,878) (8,016) (8,156) (8,319) (8,485)
Other Statutory Income (8,237) (8,237) (8,361) (8,486) (8,592) (8,699) (8,829) (8,961) (9,118) (9,278) (9,464) (9,653)
Standpipe Fee (1,174) (1,174) (1,233) (1,295) (1,363) (1,435) (1,514) (1,597) (1,685) (1,778) (1,876) (1,979)
New Water Service Connection Income L/Ridg (7,548) (7,548) (7,925) (8,321) (8,758) (9,218) (9,725) (10,260) (10,824) (11,419) (12,047) (12,710)
Legal Income (2,916) (2,916) (3,062) (3,215) (3,384) (3,562) (3,758) (3,965) (4,183) (4,413) (4,656) (4,912)
Council Property Rating Offset 11,859 12,160 12,525 12,901 13,320 13,753 14,234 14,732 15,248 15,782 16,334 16,906
Interest ‐ Write Off 13 ‐ ‐ ‐ ‐ ‐ ‐ ‐ ‐ ‐ ‐ ‐
Water‐ Write Off 1,354 287 301 316 333 350 369 389 410 433 457 482
Total Operating Income ‐ Lightning Ridge (453,094) (454,409) (446,828) (462,625) (480,290) (501,166) (523,689) (549,919) (574,466) (605,168) (637,841) (666,857)
Operating Income ‐ Collarenebri Water Rates Charges (291,420) (316,098) (325,581) (335,348) (346,247) (357,500) (370,013) (382,963) (396,367) (410,240) (424,598) (439,459)
Pension Rebate Write‐Off 2,517 2,450 2,524 2,600 2,685 2,772 2,869 2,969 3,073 3,181 3,292 3,407
Collarenebri Water Consumption Charges (98,445) (98,445) (106,567) (111,895) (117,769) (123,952) (130,769) (137,961) (145,549) (153,554) (161,999) (170,909)
Interest Received from Investments (956) (956) (457) (464) (470) (3,866) (3,948) (7,513) (10,442) (16,974) (24,260) (29,466)
Interest on Water Usage Charges (2,135) (2,135) (2,290) (2,456) (2,628) (2,812) (3,016) (3,235) (3,478) (3,739) (4,029) (4,341)
Interest on Overdue Rates & Charges (6,736) (6,736) (7,224) (7,748) (8,290) (8,870) (9,513) (10,203) (10,968) (11,791) (12,705) (13,690)
Pensioner Rate Subsidy (1,367) (1,367) (1,394) (1,422) (1,447) (1,472) (1,494) (1,516) (1,543) (1,570) (1,601) (1,633)
Other income (5,713) (5,713) (5,799) (5,886) (5,960) (6,035) (6,126) (6,218) (6,327) (6,438) (6,567) (6,698)
2020/2021 Long Term Finanicla Plan Scenario: Planned - 2.60% Rate Pegging Increase
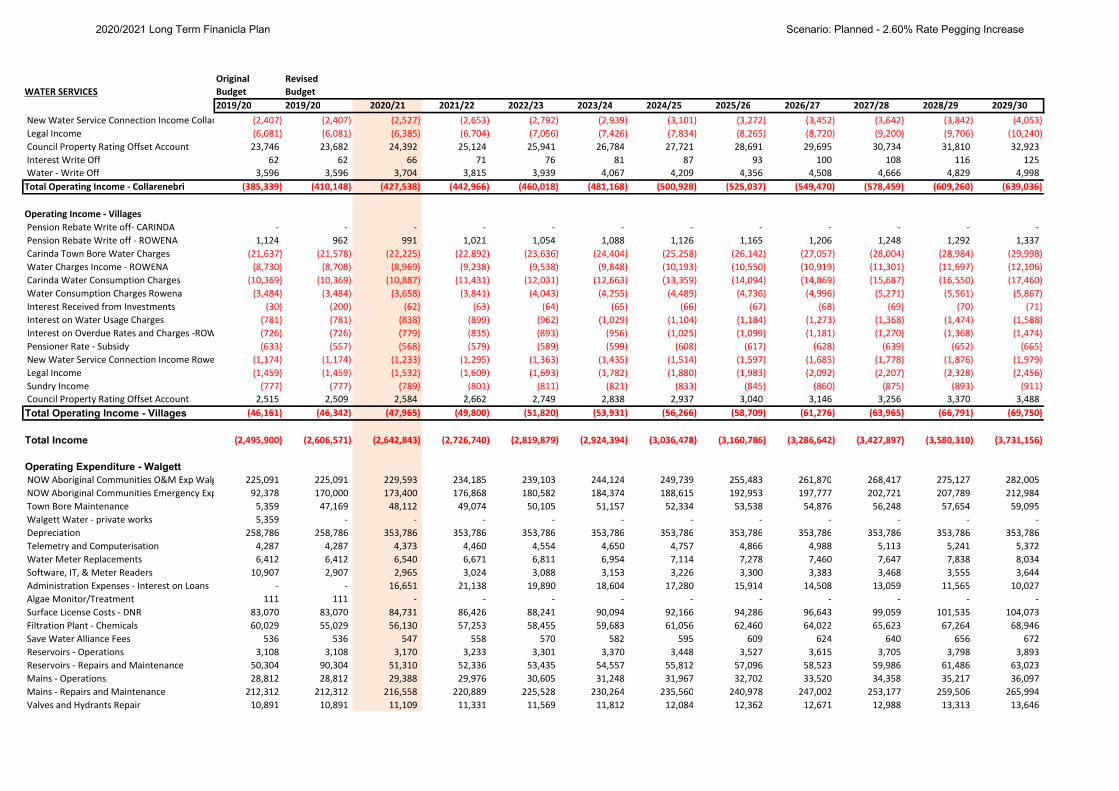
Original RevisedWATER SERVICES Budget Budget
2019/20 2019/20 2020/21 2021/22 2022/23 2023/24 2024/25 2025/26 2026/27 2027/28 2028/29 2029/30 New Water Service Connection Income Collar (2,407) (2,407) (2,527) (2,653) (2,792) (2,939) (3,101) (3,272) (3,452) (3,642) (3,842) (4,053)
Legal Income (6,081) (6,081) (6,385) (6,704) (7,056) (7,426) (7,834) (8,265) (8,720) (9,200) (9,706) (10,240)
Council Property Rating Offset Account 23,746 23,682 24,392 25,124 25,941 26,784 27,721 28,691 29,695 30,734 31,810 32,923
Interest Write Off 62 62 66 71 76 81 87 93 100 108 116 125
Water ‐ Write Off 3,596 3,596 3,704 3,815 3,939 4,067 4,209 4,356 4,508 4,666 4,829 4,998
Total Operating Income ‐ Collarenebri (385,339) (410,148) (427,538) (442,966) (460,018) (481,168) (500,928) (525,037) (549,470) (578,459) (609,260) (639,036)
Operating Income ‐ Villages Pension Rebate Write off‐ CARINDA ‐ ‐ ‐ ‐ ‐ ‐ ‐ ‐ ‐ ‐ ‐ ‐
Pension Rebate Write off ‐ ROWENA 1,124 962 991 1,021 1,054 1,088 1,126 1,165 1,206 1,248 1,292 1,337
Carinda Town Bore Water Charges (21,637) (21,578) (22,225) (22,892) (23,636) (24,404) (25,258) (26,142) (27,057) (28,004) (28,984) (29,998)
Water Charges Income ‐ ROWENA (8,730) (8,708) (8,969) (9,238) (9,538) (9,848) (10,193) (10,550) (10,919) (11,301) (11,697) (12,106)
Carinda Water Consumption Charges (10,369) (10,369) (10,887) (11,431) (12,031) (12,663) (13,359) (14,094) (14,869) (15,687) (16,550) (17,460)
Water Consumption Charges Rowena (3,484) (3,484) (3,658) (3,841) (4,043) (4,255) (4,489) (4,736) (4,996) (5,271) (5,561) (5,867)
Interest Received from Investments (30) (200) (62) (63) (64) (65) (66) (67) (68) (69) (70) (71)
Interest on Water Usage Charges (781) (781) (838) (899) (962) (1,029) (1,104) (1,184) (1,273) (1,368) (1,474) (1,588)
Interest on Overdue Rates and Charges ‐ROW (726) (726) (779) (835) (893) (956) (1,025) (1,099) (1,181) (1,270) (1,368) (1,474)
Pensioner Rate ‐ Subsidy (633) (557) (568) (579) (589) (599) (608) (617) (628) (639) (652) (665)
New Water Service Connection Income Rowe (1,174) (1,174) (1,233) (1,295) (1,363) (1,435) (1,514) (1,597) (1,685) (1,778) (1,876) (1,979)
Legal Income (1,459) (1,459) (1,532) (1,609) (1,693) (1,782) (1,880) (1,983) (2,092) (2,207) (2,328) (2,456)
Sundry Income (777) (777) (789) (801) (811) (821) (833) (845) (860) (875) (893) (911)
Council Property Rating Offset Account 2,515 2,509 2,584 2,662 2,749 2,838 2,937 3,040 3,146 3,256 3,370 3,488
Total Operating Income - Villages (46,161) (46,342) (47,965) (49,800) (51,820) (53,931) (56,266) (58,709) (61,276) (63,965) (66,791) (69,750)
Total Income (2,495,900) (2,606,571) (2,642,843) (2,726,740) (2,819,879) (2,924,394) (3,036,478) (3,160,786) (3,286,642) (3,427,897) (3,580,310) (3,731,156)
Operating Expenditure - Walgett NOW Aboriginal Communities O&M Exp Walg 225,091 225,091 229,593 234,185 239,103 244,124 249,739 255,483 261,870 268,417 275,127 282,005
NOW Aboriginal Communities Emergency Exp 92,378 170,000 173,400 176,868 180,582 184,374 188,615 192,953 197,777 202,721 207,789 212,984
Town Bore Maintenance 5,359 47,169 48,112 49,074 50,105 51,157 52,334 53,538 54,876 56,248 57,654 59,095
Walgett Water ‐ private works 5,359 ‐ ‐ ‐ ‐ ‐ ‐ ‐ ‐ ‐ ‐ ‐
Depreciation 258,786 258,786 353,786 353,786 353,786 353,786 353,786 353,786 353,786 353,786 353,786 353,786
Telemetry and Computerisation 4,287 4,287 4,373 4,460 4,554 4,650 4,757 4,866 4,988 5,113 5,241 5,372
Water Meter Replacements 6,412 6,412 6,540 6,671 6,811 6,954 7,114 7,278 7,460 7,647 7,838 8,034
Software, IT, & Meter Readers 10,907 2,907 2,965 3,024 3,088 3,153 3,226 3,300 3,383 3,468 3,555 3,644
Administration Expenses ‐ Interest on Loans ‐ ‐ 16,651 21,138 19,890 18,604 17,280 15,914 14,508 13,059 11,565 10,027
Algae Monitor/Treatment 111 111 ‐ ‐ ‐ ‐ ‐ ‐ ‐ ‐ ‐ ‐
Surface License Costs ‐ DNR 83,070 83,070 84,731 86,426 88,241 90,094 92,166 94,286 96,643 99,059 101,535 104,073
Filtration Plant ‐ Chemicals 60,029 55,029 56,130 57,253 58,455 59,683 61,056 62,460 64,022 65,623 67,264 68,946
Save Water Alliance Fees 536 536 547 558 570 582 595 609 624 640 656 672
Reservoirs ‐ Operations 3,108 3,108 3,170 3,233 3,301 3,370 3,448 3,527 3,615 3,705 3,798 3,893
Reservoirs ‐ Repairs and Maintenance 50,304 90,304 51,310 52,336 53,435 54,557 55,812 57,096 58,523 59,986 61,486 63,023
Mains ‐ Operations 28,812 28,812 29,388 29,976 30,605 31,248 31,967 32,702 33,520 34,358 35,217 36,097
Mains ‐ Repairs and Maintenance 212,312 212,312 216,558 220,889 225,528 230,264 235,560 240,978 247,002 253,177 259,506 265,994
Valves and Hydrants Repair 10,891 10,891 11,109 11,331 11,569 11,812 12,084 12,362 12,671 12,988 13,313 13,646
2020/2021 Long Term Finanicla Plan Scenario: Planned - 2.60% Rate Pegging Increase
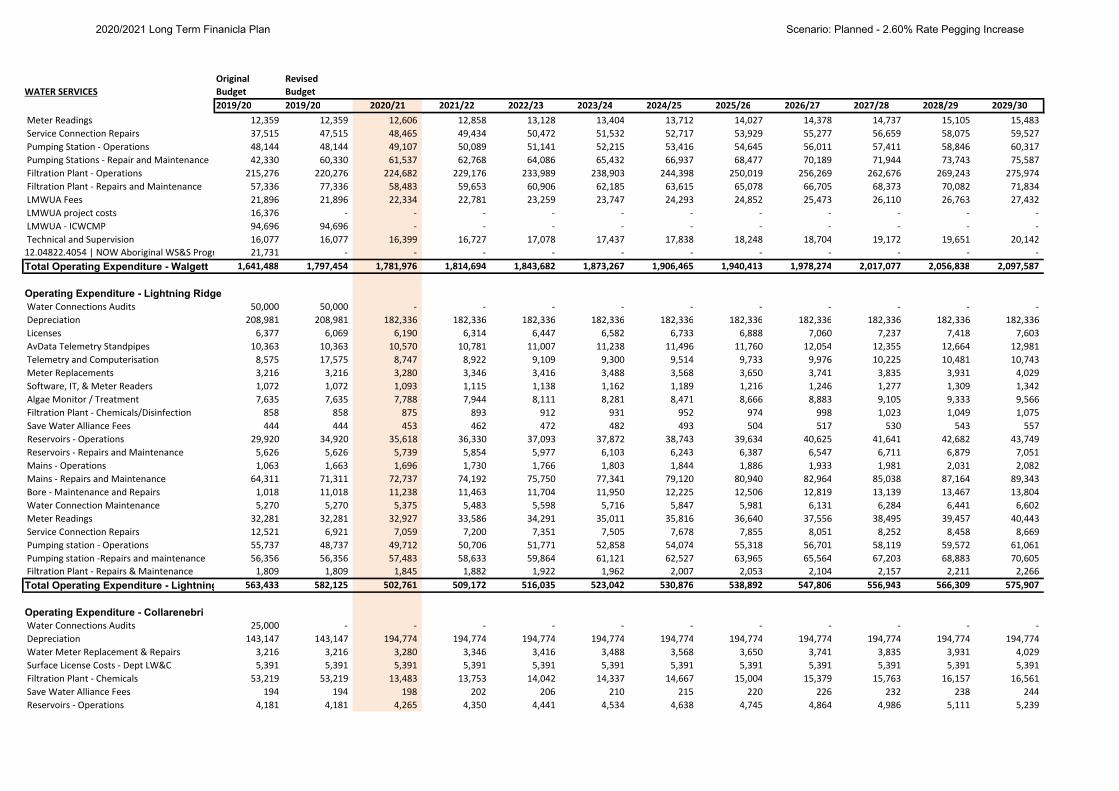
Original RevisedWATER SERVICES Budget Budget
2019/20 2019/20 2020/21 2021/22 2022/23 2023/24 2024/25 2025/26 2026/27 2027/28 2028/29 2029/30 Meter Readings 12,359 12,359 12,606 12,858 13,128 13,404 13,712 14,027 14,378 14,737 15,105 15,483
Service Connection Repairs 37,515 47,515 48,465 49,434 50,472 51,532 52,717 53,929 55,277 56,659 58,075 59,527
Pumping Station ‐ Operations 48,144 48,144 49,107 50,089 51,141 52,215 53,416 54,645 56,011 57,411 58,846 60,317
Pumping Stations ‐ Repair and Maintenance 42,330 60,330 61,537 62,768 64,086 65,432 66,937 68,477 70,189 71,944 73,743 75,587
Filtration Plant ‐ Operations 215,276 220,276 224,682 229,176 233,989 238,903 244,398 250,019 256,269 262,676 269,243 275,974
Filtration Plant ‐ Repairs and Maintenance 57,336 77,336 58,483 59,653 60,906 62,185 63,615 65,078 66,705 68,373 70,082 71,834
LMWUA Fees 21,896 21,896 22,334 22,781 23,259 23,747 24,293 24,852 25,473 26,110 26,763 27,432
LMWUA project costs 16,376 ‐ ‐ ‐ ‐ ‐ ‐ ‐ ‐ ‐ ‐ ‐
LMWUA ‐ ICWCMP 94,696 94,696 ‐ ‐ ‐ ‐ ‐ ‐ ‐ ‐ ‐ ‐
Technical and Supervision 16,077 16,077 16,399 16,727 17,078 17,437 17,838 18,248 18,704 19,172 19,651 20,142
12.04822.4054 | NOW Aboriginal WS&S Progr 21,731 ‐ ‐ ‐ ‐ ‐ ‐ ‐ ‐ ‐ ‐ ‐
Total Operating Expenditure - Walgett 1,641,488 1,797,454 1,781,976 1,814,694 1,843,682 1,873,267 1,906,465 1,940,413 1,978,274 2,017,077 2,056,838 2,097,587
Operating Expenditure - Lightning Ridge Water Connections Audits 50,000 50,000 ‐ ‐ ‐ ‐ ‐ ‐ ‐ ‐ ‐ ‐
Depreciation 208,981 208,981 182,336 182,336 182,336 182,336 182,336 182,336 182,336 182,336 182,336 182,336
Licenses 6,377 6,069 6,190 6,314 6,447 6,582 6,733 6,888 7,060 7,237 7,418 7,603
AvData Telemetry Standpipes 10,363 10,363 10,570 10,781 11,007 11,238 11,496 11,760 12,054 12,355 12,664 12,981
Telemetry and Computerisation 8,575 17,575 8,747 8,922 9,109 9,300 9,514 9,733 9,976 10,225 10,481 10,743
Meter Replacements 3,216 3,216 3,280 3,346 3,416 3,488 3,568 3,650 3,741 3,835 3,931 4,029
Software, IT, & Meter Readers 1,072 1,072 1,093 1,115 1,138 1,162 1,189 1,216 1,246 1,277 1,309 1,342
Algae Monitor / Treatment 7,635 7,635 7,788 7,944 8,111 8,281 8,471 8,666 8,883 9,105 9,333 9,566
Filtration Plant ‐ Chemicals/Disinfection 858 858 875 893 912 931 952 974 998 1,023 1,049 1,075
Save Water Alliance Fees 444 444 453 462 472 482 493 504 517 530 543 557
Reservoirs ‐ Operations 29,920 34,920 35,618 36,330 37,093 37,872 38,743 39,634 40,625 41,641 42,682 43,749
Reservoirs ‐ Repairs and Maintenance 5,626 5,626 5,739 5,854 5,977 6,103 6,243 6,387 6,547 6,711 6,879 7,051
Mains ‐ Operations 1,063 1,663 1,696 1,730 1,766 1,803 1,844 1,886 1,933 1,981 2,031 2,082
Mains ‐ Repairs and Maintenance 64,311 71,311 72,737 74,192 75,750 77,341 79,120 80,940 82,964 85,038 87,164 89,343
Bore ‐ Maintenance and Repairs 1,018 11,018 11,238 11,463 11,704 11,950 12,225 12,506 12,819 13,139 13,467 13,804
Water Connection Maintenance 5,270 5,270 5,375 5,483 5,598 5,716 5,847 5,981 6,131 6,284 6,441 6,602
Meter Readings 32,281 32,281 32,927 33,586 34,291 35,011 35,816 36,640 37,556 38,495 39,457 40,443
Service Connection Repairs 12,521 6,921 7,059 7,200 7,351 7,505 7,678 7,855 8,051 8,252 8,458 8,669
Pumping station ‐ Operations 55,737 48,737 49,712 50,706 51,771 52,858 54,074 55,318 56,701 58,119 59,572 61,061
Pumping station ‐Repairs and maintenance 56,356 56,356 57,483 58,633 59,864 61,121 62,527 63,965 65,564 67,203 68,883 70,605
Filtration Plant ‐ Repairs & Maintenance 1,809 1,809 1,845 1,882 1,922 1,962 2,007 2,053 2,104 2,157 2,211 2,266
Total Operating Expenditure - Lightning 563,433 582,125 502,761 509,172 516,035 523,042 530,876 538,892 547,806 556,943 566,309 575,907
Operating Expenditure - Collarenebri Water Connections Audits 25,000 ‐ ‐ ‐ ‐ ‐ ‐ ‐ ‐ ‐ ‐ ‐
Depreciation 143,147 143,147 194,774 194,774 194,774 194,774 194,774 194,774 194,774 194,774 194,774 194,774
Water Meter Replacement & Repairs 3,216 3,216 3,280 3,346 3,416 3,488 3,568 3,650 3,741 3,835 3,931 4,029
Surface License Costs ‐ Dept LW&C 5,391 5,391 5,391 5,391 5,391 5,391 5,391 5,391 5,391 5,391 5,391 5,391
Filtration Plant ‐ Chemicals 53,219 53,219 13,483 13,753 14,042 14,337 14,667 15,004 15,379 15,763 16,157 16,561
Save Water Alliance Fees 194 194 198 202 206 210 215 220 226 232 238 244
Reservoirs ‐ Operations 4,181 4,181 4,265 4,350 4,441 4,534 4,638 4,745 4,864 4,986 5,111 5,239
2020/2021 Long Term Finanicla Plan Scenario: Planned - 2.60% Rate Pegging Increase
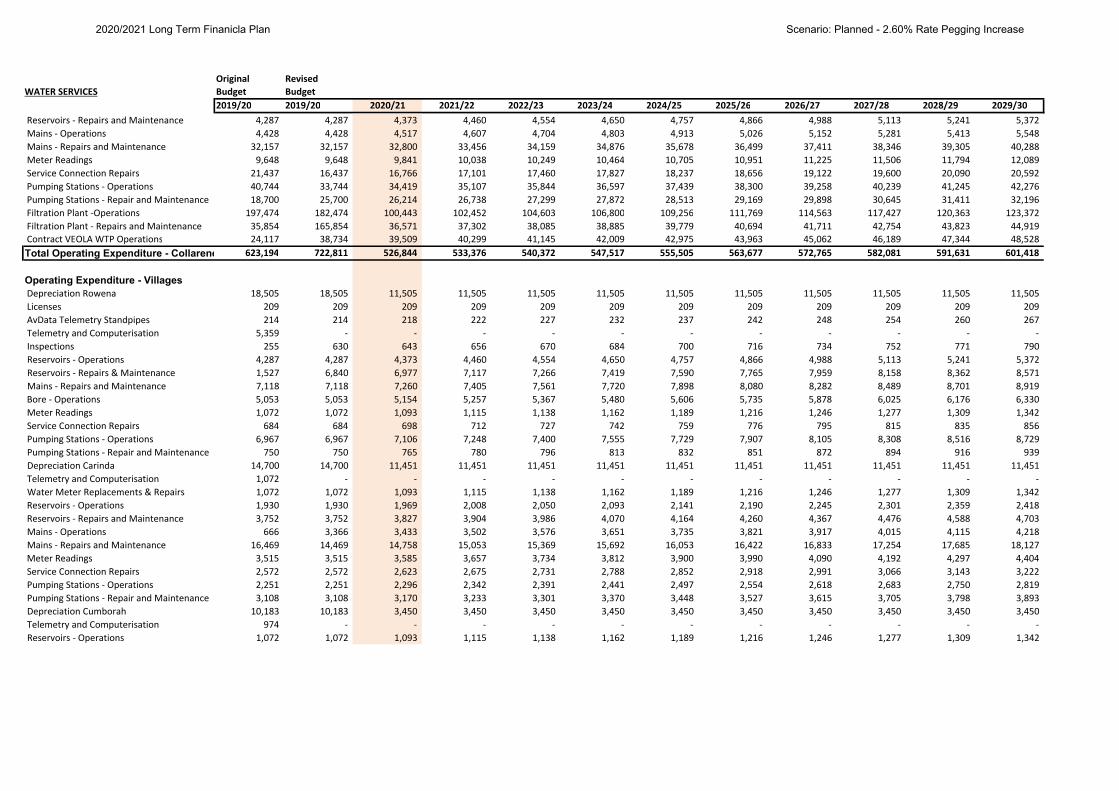
Original RevisedWATER SERVICES Budget Budget
2019/20 2019/20 2020/21 2021/22 2022/23 2023/24 2024/25 2025/26 2026/27 2027/28 2028/29 2029/30 Reservoirs ‐ Repairs and Maintenance 4,287 4,287 4,373 4,460 4,554 4,650 4,757 4,866 4,988 5,113 5,241 5,372
Mains ‐ Operations 4,428 4,428 4,517 4,607 4,704 4,803 4,913 5,026 5,152 5,281 5,413 5,548
Mains ‐ Repairs and Maintenance 32,157 32,157 32,800 33,456 34,159 34,876 35,678 36,499 37,411 38,346 39,305 40,288
Meter Readings 9,648 9,648 9,841 10,038 10,249 10,464 10,705 10,951 11,225 11,506 11,794 12,089
Service Connection Repairs 21,437 16,437 16,766 17,101 17,460 17,827 18,237 18,656 19,122 19,600 20,090 20,592
Pumping Stations ‐ Operations 40,744 33,744 34,419 35,107 35,844 36,597 37,439 38,300 39,258 40,239 41,245 42,276
Pumping Stations ‐ Repair and Maintenance 18,700 25,700 26,214 26,738 27,299 27,872 28,513 29,169 29,898 30,645 31,411 32,196
Filtration Plant ‐Operations 197,474 182,474 100,443 102,452 104,603 106,800 109,256 111,769 114,563 117,427 120,363 123,372
Filtration Plant ‐ Repairs and Maintenance 35,854 165,854 36,571 37,302 38,085 38,885 39,779 40,694 41,711 42,754 43,823 44,919
Contract VEOLA WTP Operations 24,117 38,734 39,509 40,299 41,145 42,009 42,975 43,963 45,062 46,189 47,344 48,528
Total Operating Expenditure - Collarene 623,194 722,811 526,844 533,376 540,372 547,517 555,505 563,677 572,765 582,081 591,631 601,418
Operating Expenditure - Villages Depreciation Rowena 18,505 18,505 11,505 11,505 11,505 11,505 11,505 11,505 11,505 11,505 11,505 11,505
Licenses 209 209 209 209 209 209 209 209 209 209 209 209
AvData Telemetry Standpipes 214 214 218 222 227 232 237 242 248 254 260 267
Telemetry and Computerisation 5,359 ‐ ‐ ‐ ‐ ‐ ‐ ‐ ‐ ‐ ‐ ‐
Inspections 255 630 643 656 670 684 700 716 734 752 771 790
Reservoirs ‐ Operations 4,287 4,287 4,373 4,460 4,554 4,650 4,757 4,866 4,988 5,113 5,241 5,372
Reservoirs ‐ Repairs & Maintenance 1,527 6,840 6,977 7,117 7,266 7,419 7,590 7,765 7,959 8,158 8,362 8,571
Mains ‐ Repairs and Maintenance 7,118 7,118 7,260 7,405 7,561 7,720 7,898 8,080 8,282 8,489 8,701 8,919
Bore ‐ Operations 5,053 5,053 5,154 5,257 5,367 5,480 5,606 5,735 5,878 6,025 6,176 6,330
Meter Readings 1,072 1,072 1,093 1,115 1,138 1,162 1,189 1,216 1,246 1,277 1,309 1,342
Service Connection Repairs 684 684 698 712 727 742 759 776 795 815 835 856
Pumping Stations ‐ Operations 6,967 6,967 7,106 7,248 7,400 7,555 7,729 7,907 8,105 8,308 8,516 8,729
Pumping Stations ‐ Repair and Maintenance 750 750 765 780 796 813 832 851 872 894 916 939
Depreciation Carinda 14,700 14,700 11,451 11,451 11,451 11,451 11,451 11,451 11,451 11,451 11,451 11,451
Telemetry and Computerisation 1,072 ‐ ‐ ‐ ‐ ‐ ‐ ‐ ‐ ‐ ‐ ‐
Water Meter Replacements & Repairs 1,072 1,072 1,093 1,115 1,138 1,162 1,189 1,216 1,246 1,277 1,309 1,342
Reservoirs ‐ Operations 1,930 1,930 1,969 2,008 2,050 2,093 2,141 2,190 2,245 2,301 2,359 2,418
Reservoirs ‐ Repairs and Maintenance 3,752 3,752 3,827 3,904 3,986 4,070 4,164 4,260 4,367 4,476 4,588 4,703
Mains ‐ Operations 666 3,366 3,433 3,502 3,576 3,651 3,735 3,821 3,917 4,015 4,115 4,218
Mains ‐ Repairs and Maintenance 16,469 14,469 14,758 15,053 15,369 15,692 16,053 16,422 16,833 17,254 17,685 18,127
Meter Readings 3,515 3,515 3,585 3,657 3,734 3,812 3,900 3,990 4,090 4,192 4,297 4,404
Service Connection Repairs 2,572 2,572 2,623 2,675 2,731 2,788 2,852 2,918 2,991 3,066 3,143 3,222
Pumping Stations ‐ Operations 2,251 2,251 2,296 2,342 2,391 2,441 2,497 2,554 2,618 2,683 2,750 2,819
Pumping Stations ‐ Repair and Maintenance 3,108 3,108 3,170 3,233 3,301 3,370 3,448 3,527 3,615 3,705 3,798 3,893
Depreciation Cumborah 10,183 10,183 3,450 3,450 3,450 3,450 3,450 3,450 3,450 3,450 3,450 3,450
Telemetry and Computerisation 974 ‐ ‐ ‐ ‐ ‐ ‐ ‐ ‐ ‐ ‐ ‐
Reservoirs ‐ Operations 1,072 1,072 1,093 1,115 1,138 1,162 1,189 1,216 1,246 1,277 1,309 1,342
2020/2021 Long Term Finanicla Plan Scenario: Planned - 2.60% Rate Pegging Increase
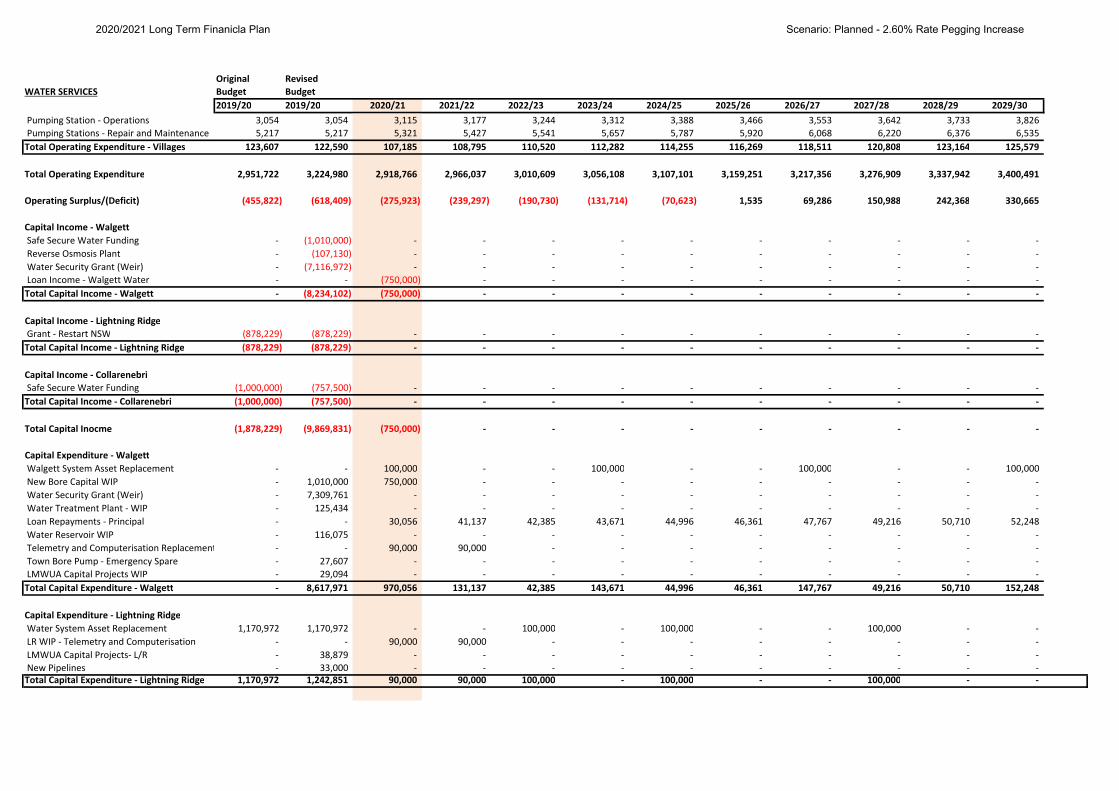
Original RevisedWATER SERVICES Budget Budget
2019/20 2019/20 2020/21 2021/22 2022/23 2023/24 2024/25 2025/26 2026/27 2027/28 2028/29 2029/30 Pumping Station ‐ Operations 3,054 3,054 3,115 3,177 3,244 3,312 3,388 3,466 3,553 3,642 3,733 3,826
Pumping Stations ‐ Repair and Maintenance 5,217 5,217 5,321 5,427 5,541 5,657 5,787 5,920 6,068 6,220 6,376 6,535
Total Operating Expenditure ‐ Villages 123,607 122,590 107,185 108,795 110,520 112,282 114,255 116,269 118,511 120,808 123,164 125,579
Total Operating Expenditure 2,951,722 3,224,980 2,918,766 2,966,037 3,010,609 3,056,108 3,107,101 3,159,251 3,217,356 3,276,909 3,337,942 3,400,491
Operating Surplus/(Deficit) (455,822) (618,409) (275,923) (239,297) (190,730) (131,714) (70,623) 1,535 69,286 150,988 242,368 330,665
Capital Income ‐ Walgett Safe Secure Water Funding ‐ (1,010,000) ‐ ‐ ‐ ‐ ‐ ‐ ‐ ‐ ‐ ‐
Reverse Osmosis Plant ‐ (107,130) ‐ ‐ ‐ ‐ ‐ ‐ ‐ ‐ ‐ ‐
Water Security Grant (Weir) ‐ (7,116,972) ‐ ‐ ‐ ‐ ‐ ‐ ‐ ‐ ‐ ‐
Loan Income ‐ Walgett Water ‐ ‐ (750,000) ‐ ‐ ‐ ‐ ‐ ‐ ‐ ‐ ‐
Total Capital Income ‐ Walgett ‐ (8,234,102) (750,000) ‐ ‐ ‐ ‐ ‐ ‐ ‐ ‐ ‐
Capital Income ‐ Lightning Ridge Grant ‐ Restart NSW (878,229) (878,229) ‐ ‐ ‐ ‐ ‐ ‐ ‐ ‐ ‐ ‐
Total Capital Income ‐ Lightning Ridge (878,229) (878,229) ‐ ‐ ‐ ‐ ‐ ‐ ‐ ‐ ‐ ‐
Capital Income ‐ Collarenebri Safe Secure Water Funding (1,000,000) (757,500) ‐ ‐ ‐ ‐ ‐ ‐ ‐ ‐ ‐ ‐
Total Capital Income ‐ Collarenebri (1,000,000) (757,500) ‐ ‐ ‐ ‐ ‐ ‐ ‐ ‐ ‐ ‐
Total Capital Inocme (1,878,229) (9,869,831) (750,000) ‐ ‐ ‐ ‐ ‐ ‐ ‐ ‐ ‐
Capital Expenditure ‐ Walgett Walgett System Asset Replacement ‐ ‐ 100,000 ‐ ‐ 100,000 ‐ ‐ 100,000 ‐ ‐ 100,000
New Bore Capital WIP ‐ 1,010,000 750,000 ‐ ‐ ‐ ‐ ‐ ‐ ‐ ‐ ‐
Water Security Grant (Weir) ‐ 7,309,761 ‐ ‐ ‐ ‐ ‐ ‐ ‐ ‐ ‐ ‐
Water Treatment Plant ‐ WIP ‐ 125,434 ‐ ‐ ‐ ‐ ‐ ‐ ‐ ‐ ‐ ‐
Loan Repayments ‐ Principal ‐ ‐ 30,056 41,137 42,385 43,671 44,996 46,361 47,767 49,216 50,710 52,248
Water Reservoir WIP ‐ 116,075 ‐ ‐ ‐ ‐ ‐ ‐ ‐ ‐ ‐ ‐
Telemetry and Computerisation Replacement ‐ ‐ 90,000 90,000 ‐ ‐ ‐ ‐ ‐ ‐ ‐ ‐
Town Bore Pump ‐ Emergency Spare ‐ 27,607 ‐ ‐ ‐ ‐ ‐ ‐ ‐ ‐ ‐ ‐
LMWUA Capital Projects WIP ‐ 29,094 ‐ ‐ ‐ ‐ ‐ ‐ ‐ ‐ ‐ ‐
Total Capital Expenditure ‐ Walgett ‐ 8,617,971 970,056 131,137 42,385 143,671 44,996 46,361 147,767 49,216 50,710 152,248
Capital Expenditure ‐ Lightning Ridge Water System Asset Replacement 1,170,972 1,170,972 ‐ ‐ 100,000 ‐ 100,000 ‐ ‐ 100,000 ‐ ‐
LR WIP ‐ Telemetry and Computerisation ‐ ‐ 90,000 90,000 ‐ ‐ ‐ ‐ ‐ ‐ ‐ ‐
LMWUA Capital Projects‐ L/R ‐ 38,879 ‐ ‐ ‐ ‐ ‐ ‐ ‐ ‐ ‐ ‐
New Pipelines ‐ 33,000 ‐ ‐ ‐ ‐ ‐ ‐ ‐ ‐ ‐ ‐ Total Capital Expenditure ‐ Lightning Ridge 1,170,972 1,242,851 90,000 90,000 100,000 ‐ 100,000 ‐ ‐ 100,000 ‐ ‐
2020/2021 Long Term Finanicla Plan Scenario: Planned - 2.60% Rate Pegging Increase
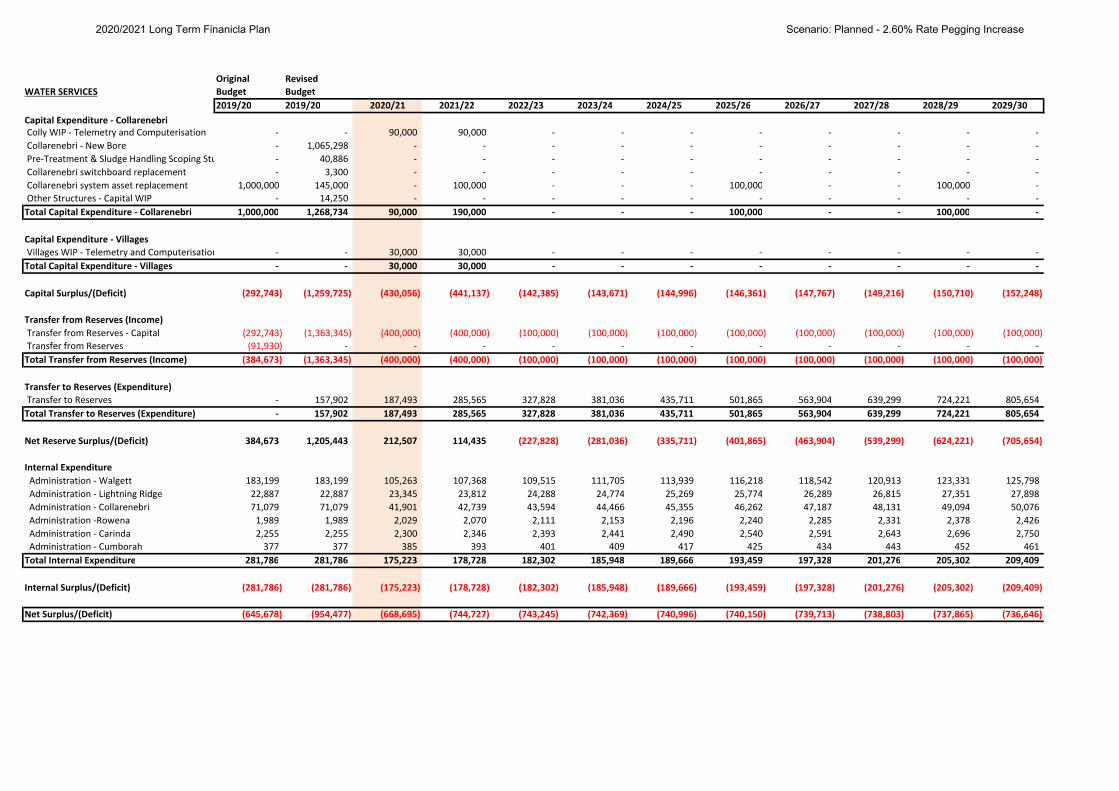
Original RevisedWATER SERVICES Budget Budget
2019/20 2019/20 2020/21 2021/22 2022/23 2023/24 2024/25 2025/26 2026/27 2027/28 2028/29 2029/30Capital Expenditure ‐ Collarenebri Colly WIP ‐ Telemetry and Computerisation ‐ ‐ 90,000 90,000 ‐ ‐ ‐ ‐ ‐ ‐ ‐ ‐
Collarenebri ‐ New Bore ‐ 1,065,298 ‐ ‐ ‐ ‐ ‐ ‐ ‐ ‐ ‐ ‐
Pre‐Treatment & Sludge Handling Scoping Stu ‐ 40,886 ‐ ‐ ‐ ‐ ‐ ‐ ‐ ‐ ‐ ‐
Collarenebri switchboard replacement ‐ 3,300 ‐ ‐ ‐ ‐ ‐ ‐ ‐ ‐ ‐ ‐
Collarenebri system asset replacement 1,000,000 145,000 ‐ 100,000 ‐ ‐ ‐ 100,000 ‐ ‐ 100,000 ‐
Other Structures ‐ Capital WIP ‐ 14,250 ‐ ‐ ‐ ‐ ‐ ‐ ‐ ‐ ‐ ‐
Total Capital Expenditure ‐ Collarenebri 1,000,000 1,268,734 90,000 190,000 ‐ ‐ ‐ 100,000 ‐ ‐ 100,000 ‐
Capital Expenditure ‐ Villages Villages WIP ‐ Telemetry and Computerisation ‐ ‐ 30,000 30,000 ‐ ‐ ‐ ‐ ‐ ‐ ‐ ‐
Total Capital Expenditure ‐ Villages ‐ ‐ 30,000 30,000 ‐ ‐ ‐ ‐ ‐ ‐ ‐ ‐
Capital Surplus/(Deficit) (292,743) (1,259,725) (430,056) (441,137) (142,385) (143,671) (144,996) (146,361) (147,767) (149,216) (150,710) (152,248)
Transfer from Reserves (Income) Transfer from Reserves ‐ Capital (292,743) (1,363,345) (400,000) (400,000) (100,000) (100,000) (100,000) (100,000) (100,000) (100,000) (100,000) (100,000)
Transfer from Reserves (91,930) ‐ ‐ ‐ ‐ ‐ ‐ ‐ ‐ ‐ ‐ ‐
Total Transfer from Reserves (Income) (384,673) (1,363,345) (400,000) (400,000) (100,000) (100,000) (100,000) (100,000) (100,000) (100,000) (100,000) (100,000)
Transfer to Reserves (Expenditure) Transfer to Reserves ‐ 157,902 187,493 285,565 327,828 381,036 435,711 501,865 563,904 639,299 724,221 805,654
Total Transfer to Reserves (Expenditure) ‐ 157,902 187,493 285,565 327,828 381,036 435,711 501,865 563,904 639,299 724,221 805,654
Net Reserve Surplus/(Deficit) 384,673 1,205,443 212,507 114,435 (227,828) (281,036) (335,711) (401,865) (463,904) (539,299) (624,221) (705,654)
Internal Expenditure Administration ‐ Walgett 183,199 183,199 105,263 107,368 109,515 111,705 113,939 116,218 118,542 120,913 123,331 125,798
Administration ‐ Lightning Ridge 22,887 22,887 23,345 23,812 24,288 24,774 25,269 25,774 26,289 26,815 27,351 27,898
Administration ‐ Collarenebri 71,079 71,079 41,901 42,739 43,594 44,466 45,355 46,262 47,187 48,131 49,094 50,076
Administration ‐Rowena 1,989 1,989 2,029 2,070 2,111 2,153 2,196 2,240 2,285 2,331 2,378 2,426
Administration ‐ Carinda 2,255 2,255 2,300 2,346 2,393 2,441 2,490 2,540 2,591 2,643 2,696 2,750
Administration ‐ Cumborah 377 377 385 393 401 409 417 425 434 443 452 461
Total Internal Expenditure 281,786 281,786 175,223 178,728 182,302 185,948 189,666 193,459 197,328 201,276 205,302 209,409
Internal Surplus/(Deficit) (281,786) (281,786) (175,223) (178,728) (182,302) (185,948) (189,666) (193,459) (197,328) (201,276) (205,302) (209,409)
Net Surplus/(Deficit) (645,678) (954,477) (668,695) (744,727) (743,245) (742,369) (740,996) (740,150) (739,713) (738,803) (737,865) (736,646)
2020/2021 Long Term Finanicla Plan Scenario: Planned - 2.60% Rate Pegging Increase
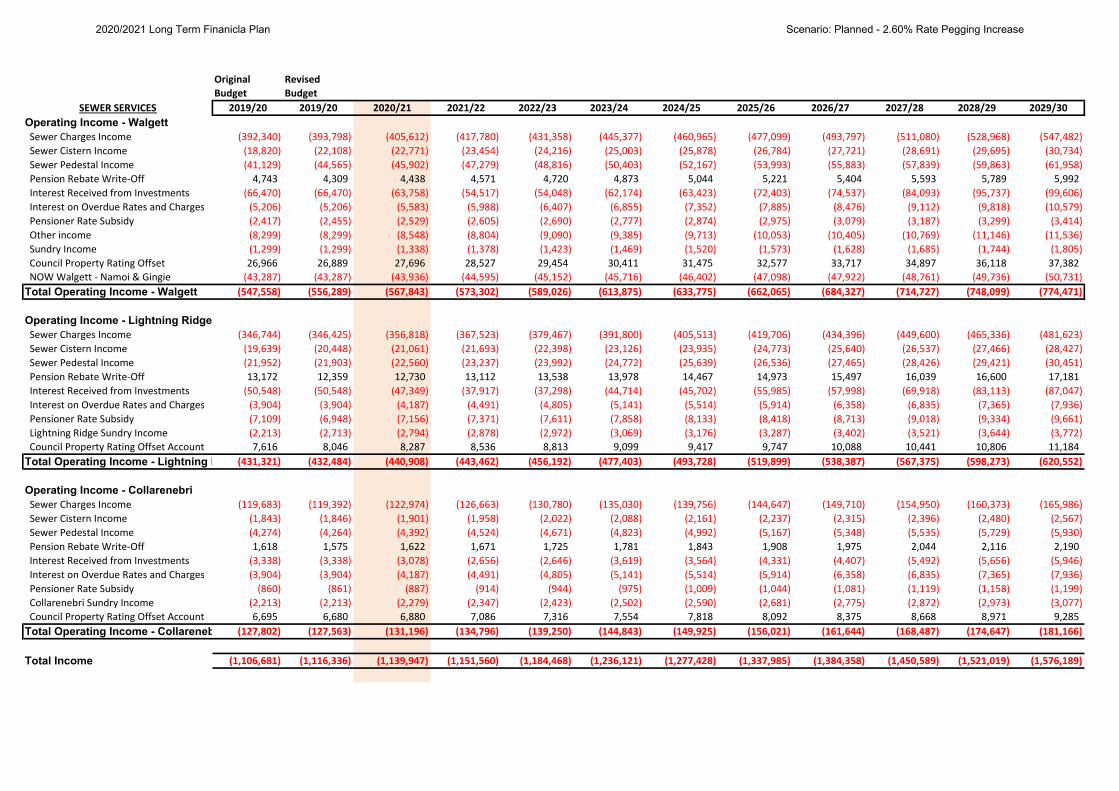
Original RevisedBudget Budget
SEWER SERVICES 2019/20 2019/20 2020/21 2021/22 2022/23 2023/24 2024/25 2025/26 2026/27 2027/28 2028/29 2029/30Operating Income - Walgett Sewer Charges Income (392,340) (393,798) (405,612) (417,780) (431,358) (445,377) (460,965) (477,099) (493,797) (511,080) (528,968) (547,482)
Sewer Cistern Income (18,820) (22,108) (22,771) (23,454) (24,216) (25,003) (25,878) (26,784) (27,721) (28,691) (29,695) (30,734)
Sewer Pedestal Income (41,129) (44,565) (45,902) (47,279) (48,816) (50,403) (52,167) (53,993) (55,883) (57,839) (59,863) (61,958)
Pension Rebate Write‐Off 4,743 4,309 4,438 4,571 4,720 4,873 5,044 5,221 5,404 5,593 5,789 5,992
Interest Received from Investments (66,470) (66,470) (63,758) (54,517) (54,048) (62,174) (63,423) (72,403) (74,537) (84,093) (95,737) (99,606)
Interest on Overdue Rates and Charges (5,206) (5,206) (5,583) (5,988) (6,407) (6,855) (7,352) (7,885) (8,476) (9,112) (9,818) (10,579)
Pensioner Rate Subsidy (2,417) (2,455) (2,529) (2,605) (2,690) (2,777) (2,874) (2,975) (3,079) (3,187) (3,299) (3,414)
Other income (8,299) (8,299) (8,548) (8,804) (9,090) (9,385) (9,713) (10,053) (10,405) (10,769) (11,146) (11,536)
Sundry Income (1,299) (1,299) (1,338) (1,378) (1,423) (1,469) (1,520) (1,573) (1,628) (1,685) (1,744) (1,805)
Council Property Rating Offset 26,966 26,889 27,696 28,527 29,454 30,411 31,475 32,577 33,717 34,897 36,118 37,382
NOW Walgett ‐ Namoi & Gingie (43,287) (43,287) (43,936) (44,595) (45,152) (45,716) (46,402) (47,098) (47,922) (48,761) (49,736) (50,731)
Total Operating Income - Walgett (547,558) (556,289) (567,843) (573,302) (589,026) (613,875) (633,775) (662,065) (684,327) (714,727) (748,099) (774,471)
Operating Income - Lightning Ridge Sewer Charges Income (346,744) (346,425) (356,818) (367,523) (379,467) (391,800) (405,513) (419,706) (434,396) (449,600) (465,336) (481,623)
Sewer Cistern Income (19,639) (20,448) (21,061) (21,693) (22,398) (23,126) (23,935) (24,773) (25,640) (26,537) (27,466) (28,427)
Sewer Pedestal Income (21,952) (21,903) (22,560) (23,237) (23,992) (24,772) (25,639) (26,536) (27,465) (28,426) (29,421) (30,451)
Pension Rebate Write‐Off 13,172 12,359 12,730 13,112 13,538 13,978 14,467 14,973 15,497 16,039 16,600 17,181
Interest Received from Investments (50,548) (50,548) (47,349) (37,917) (37,298) (44,714) (45,702) (55,985) (57,998) (69,918) (83,113) (87,047)
Interest on Overdue Rates and Charges (3,904) (3,904) (4,187) (4,491) (4,805) (5,141) (5,514) (5,914) (6,358) (6,835) (7,365) (7,936)
Pensioner Rate Subsidy (7,109) (6,948) (7,156) (7,371) (7,611) (7,858) (8,133) (8,418) (8,713) (9,018) (9,334) (9,661)
Lightning Ridge Sundry Income (2,213) (2,713) (2,794) (2,878) (2,972) (3,069) (3,176) (3,287) (3,402) (3,521) (3,644) (3,772)
Council Property Rating Offset Account 7,616 8,046 8,287 8,536 8,813 9,099 9,417 9,747 10,088 10,441 10,806 11,184
Total Operating Income - Lightning R (431,321) (432,484) (440,908) (443,462) (456,192) (477,403) (493,728) (519,899) (538,387) (567,375) (598,273) (620,552)
Operating Income - Collarenebri Sewer Charges Income (119,683) (119,392) (122,974) (126,663) (130,780) (135,030) (139,756) (144,647) (149,710) (154,950) (160,373) (165,986)
Sewer Cistern Income (1,843) (1,846) (1,901) (1,958) (2,022) (2,088) (2,161) (2,237) (2,315) (2,396) (2,480) (2,567)
Sewer Pedestal Income (4,274) (4,264) (4,392) (4,524) (4,671) (4,823) (4,992) (5,167) (5,348) (5,535) (5,729) (5,930)
Pension Rebate Write‐Off 1,618 1,575 1,622 1,671 1,725 1,781 1,843 1,908 1,975 2,044 2,116 2,190
Interest Received from Investments (3,338) (3,338) (3,078) (2,656) (2,646) (3,619) (3,564) (4,331) (4,407) (5,492) (5,656) (5,946)
Interest on Overdue Rates and Charges (3,904) (3,904) (4,187) (4,491) (4,805) (5,141) (5,514) (5,914) (6,358) (6,835) (7,365) (7,936)
Pensioner Rate Subsidy (860) (861) (887) (914) (944) (975) (1,009) (1,044) (1,081) (1,119) (1,158) (1,199)
Collarenebri Sundry Income (2,213) (2,213) (2,279) (2,347) (2,423) (2,502) (2,590) (2,681) (2,775) (2,872) (2,973) (3,077)
Council Property Rating Offset Account 6,695 6,680 6,880 7,086 7,316 7,554 7,818 8,092 8,375 8,668 8,971 9,285
Total Operating Income - Collareneb (127,802) (127,563) (131,196) (134,796) (139,250) (144,843) (149,925) (156,021) (161,644) (168,487) (174,647) (181,166)
Total Income (1,106,681) (1,116,336) (1,139,947) (1,151,560) (1,184,468) (1,236,121) (1,277,428) (1,337,985) (1,384,358) (1,450,589) (1,521,019) (1,576,189)
2020/2021 Long Term Finanicla Plan Scenario: Planned - 2.60% Rate Pegging Increase
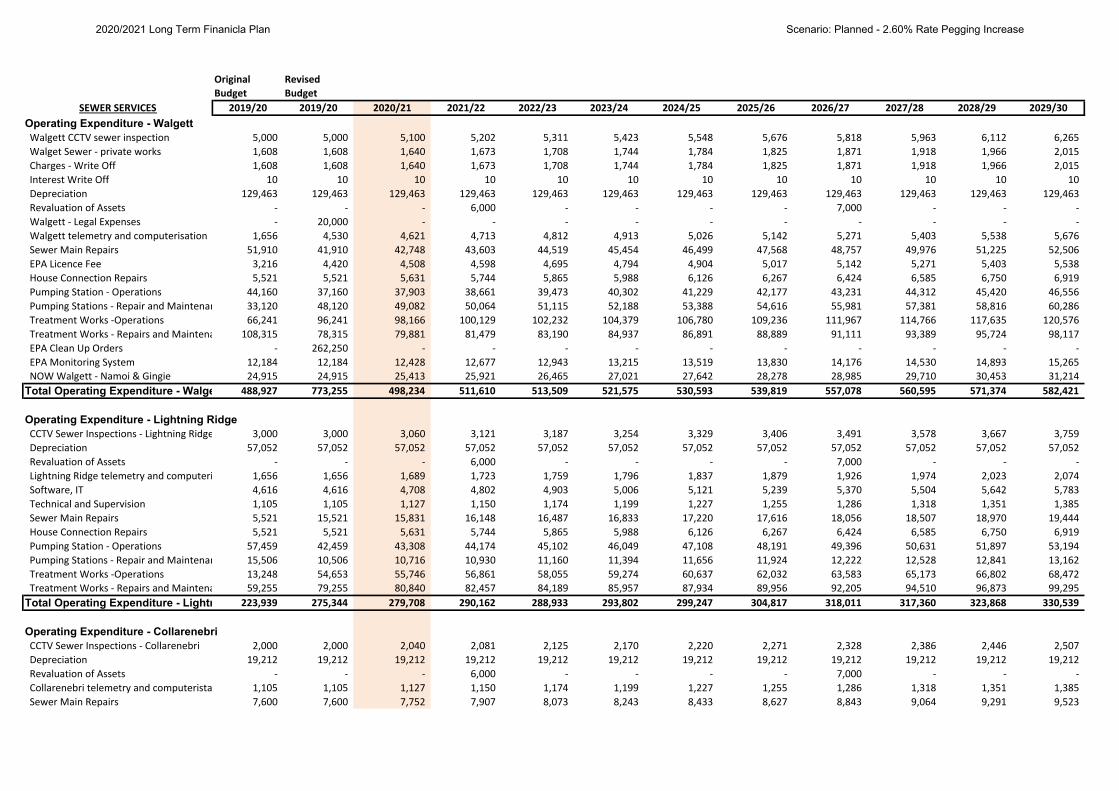
Original RevisedBudget Budget
SEWER SERVICES 2019/20 2019/20 2020/21 2021/22 2022/23 2023/24 2024/25 2025/26 2026/27 2027/28 2028/29 2029/30Operating Expenditure - Walgett Walgett CCTV sewer inspection 5,000 5,000 5,100 5,202 5,311 5,423 5,548 5,676 5,818 5,963 6,112 6,265
Walget Sewer ‐ private works 1,608 1,608 1,640 1,673 1,708 1,744 1,784 1,825 1,871 1,918 1,966 2,015
Charges ‐ Write Off 1,608 1,608 1,640 1,673 1,708 1,744 1,784 1,825 1,871 1,918 1,966 2,015
Interest Write Off 10 10 10 10 10 10 10 10 10 10 10 10
Depreciation 129,463 129,463 129,463 129,463 129,463 129,463 129,463 129,463 129,463 129,463 129,463 129,463
Revaluation of Assets ‐ ‐ ‐ 6,000 ‐ ‐ ‐ ‐ 7,000 ‐ ‐ ‐
Walgett ‐ Legal Expenses ‐ 20,000 ‐ ‐ ‐ ‐ ‐ ‐ ‐ ‐ ‐ ‐
Walgett telemetry and computerisation 1,656 4,530 4,621 4,713 4,812 4,913 5,026 5,142 5,271 5,403 5,538 5,676
Sewer Main Repairs 51,910 41,910 42,748 43,603 44,519 45,454 46,499 47,568 48,757 49,976 51,225 52,506
EPA Licence Fee 3,216 4,420 4,508 4,598 4,695 4,794 4,904 5,017 5,142 5,271 5,403 5,538
House Connection Repairs 5,521 5,521 5,631 5,744 5,865 5,988 6,126 6,267 6,424 6,585 6,750 6,919
Pumping Station ‐ Operations 44,160 37,160 37,903 38,661 39,473 40,302 41,229 42,177 43,231 44,312 45,420 46,556
Pumping Stations ‐ Repair and Maintenan 33,120 48,120 49,082 50,064 51,115 52,188 53,388 54,616 55,981 57,381 58,816 60,286
Treatment Works ‐Operations 66,241 96,241 98,166 100,129 102,232 104,379 106,780 109,236 111,967 114,766 117,635 120,576
Treatment Works ‐ Repairs and Maintena 108,315 78,315 79,881 81,479 83,190 84,937 86,891 88,889 91,111 93,389 95,724 98,117
EPA Clean Up Orders ‐ 262,250 ‐ ‐ ‐ ‐ ‐ ‐ ‐ ‐ ‐ ‐
EPA Monitoring System 12,184 12,184 12,428 12,677 12,943 13,215 13,519 13,830 14,176 14,530 14,893 15,265
NOW Walgett ‐ Namoi & Gingie 24,915 24,915 25,413 25,921 26,465 27,021 27,642 28,278 28,985 29,710 30,453 31,214
Total Operating Expenditure - Walge 488,927 773,255 498,234 511,610 513,509 521,575 530,593 539,819 557,078 560,595 571,374 582,421
Operating Expenditure - Lightning Ridge CCTV Sewer Inspections ‐ Lightning Ridge 3,000 3,000 3,060 3,121 3,187 3,254 3,329 3,406 3,491 3,578 3,667 3,759
Depreciation 57,052 57,052 57,052 57,052 57,052 57,052 57,052 57,052 57,052 57,052 57,052 57,052
Revaluation of Assets ‐ ‐ ‐ 6,000 ‐ ‐ ‐ ‐ 7,000 ‐ ‐ ‐
Lightning Ridge telemetry and computeri 1,656 1,656 1,689 1,723 1,759 1,796 1,837 1,879 1,926 1,974 2,023 2,074
Software, IT 4,616 4,616 4,708 4,802 4,903 5,006 5,121 5,239 5,370 5,504 5,642 5,783
Technical and Supervision 1,105 1,105 1,127 1,150 1,174 1,199 1,227 1,255 1,286 1,318 1,351 1,385
Sewer Main Repairs 5,521 15,521 15,831 16,148 16,487 16,833 17,220 17,616 18,056 18,507 18,970 19,444
House Connection Repairs 5,521 5,521 5,631 5,744 5,865 5,988 6,126 6,267 6,424 6,585 6,750 6,919
Pumping Station ‐ Operations 57,459 42,459 43,308 44,174 45,102 46,049 47,108 48,191 49,396 50,631 51,897 53,194
Pumping Stations ‐ Repair and Maintenan 15,506 10,506 10,716 10,930 11,160 11,394 11,656 11,924 12,222 12,528 12,841 13,162
Treatment Works ‐Operations 13,248 54,653 55,746 56,861 58,055 59,274 60,637 62,032 63,583 65,173 66,802 68,472
Treatment Works ‐ Repairs and Maintena 59,255 79,255 80,840 82,457 84,189 85,957 87,934 89,956 92,205 94,510 96,873 99,295
Total Operating Expenditure - Lightn 223,939 275,344 279,708 290,162 288,933 293,802 299,247 304,817 318,011 317,360 323,868 330,539
Operating Expenditure - Collarenebri CCTV Sewer Inspections ‐ Collarenebri 2,000 2,000 2,040 2,081 2,125 2,170 2,220 2,271 2,328 2,386 2,446 2,507
Depreciation 19,212 19,212 19,212 19,212 19,212 19,212 19,212 19,212 19,212 19,212 19,212 19,212
Revaluation of Assets ‐ ‐ ‐ 6,000 ‐ ‐ ‐ ‐ 7,000 ‐ ‐ ‐
Collarenebri telemetry and computerista 1,105 1,105 1,127 1,150 1,174 1,199 1,227 1,255 1,286 1,318 1,351 1,385
Sewer Main Repairs 7,600 7,600 7,752 7,907 8,073 8,243 8,433 8,627 8,843 9,064 9,291 9,523
2020/2021 Long Term Finanicla Plan Scenario: Planned - 2.60% Rate Pegging Increase
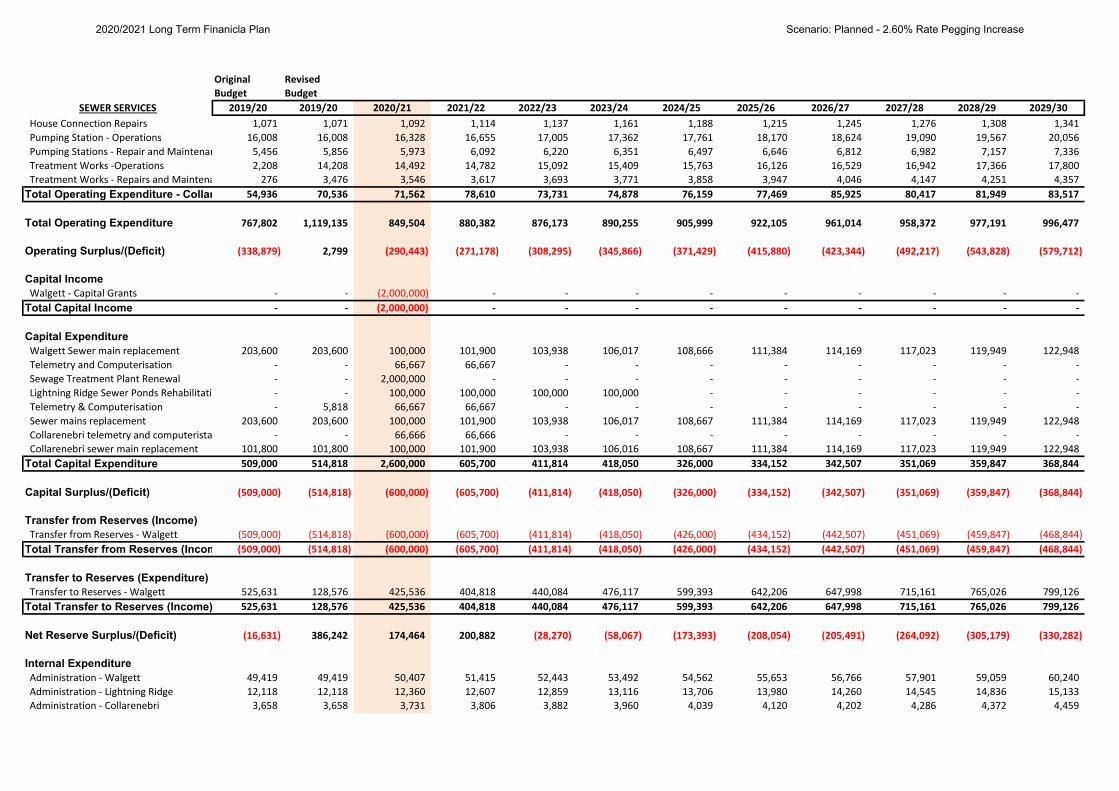
Original RevisedBudget Budget
SEWER SERVICES 2019/20 2019/20 2020/21 2021/22 2022/23 2023/24 2024/25 2025/26 2026/27 2027/28 2028/29 2029/30 House Connection Repairs 1,071 1,071 1,092 1,114 1,137 1,161 1,188 1,215 1,245 1,276 1,308 1,341
Pumping Station ‐ Operations 16,008 16,008 16,328 16,655 17,005 17,362 17,761 18,170 18,624 19,090 19,567 20,056
Pumping Stations ‐ Repair and Maintenan 5,456 5,856 5,973 6,092 6,220 6,351 6,497 6,646 6,812 6,982 7,157 7,336
Treatment Works ‐Operations 2,208 14,208 14,492 14,782 15,092 15,409 15,763 16,126 16,529 16,942 17,366 17,800
Treatment Works ‐ Repairs and Maintena 276 3,476 3,546 3,617 3,693 3,771 3,858 3,947 4,046 4,147 4,251 4,357
Total Operating Expenditure - Collar 54,936 70,536 71,562 78,610 73,731 74,878 76,159 77,469 85,925 80,417 81,949 83,517
Total Operating Expenditure 767,802 1,119,135 849,504 880,382 876,173 890,255 905,999 922,105 961,014 958,372 977,191 996,477
Operating Surplus/(Deficit) (338,879) 2,799 (290,443) (271,178) (308,295) (345,866) (371,429) (415,880) (423,344) (492,217) (543,828) (579,712)
Capital Income Walgett ‐ Capital Grants ‐ ‐ (2,000,000) ‐ ‐ ‐ ‐ ‐ ‐ ‐ ‐ ‐
Total Capital Income ‐ ‐ (2,000,000) ‐ ‐ ‐ ‐ ‐ ‐ ‐ ‐ ‐
Capital Expenditure Walgett Sewer main replacement 203,600 203,600 100,000 101,900 103,938 106,017 108,666 111,384 114,169 117,023 119,949 122,948
Telemetry and Computerisation ‐ ‐ 66,667 66,667 ‐ ‐ ‐ ‐ ‐ ‐ ‐ ‐
Sewage Treatment Plant Renewal ‐ ‐ 2,000,000 ‐ ‐ ‐ ‐ ‐ ‐ ‐ ‐ ‐
Lightning Ridge Sewer Ponds Rehabilitati ‐ ‐ 100,000 100,000 100,000 100,000 ‐ ‐ ‐ ‐ ‐ ‐
Telemetry & Computerisation ‐ 5,818 66,667 66,667 ‐ ‐ ‐ ‐ ‐ ‐ ‐ ‐
Sewer mains replacement 203,600 203,600 100,000 101,900 103,938 106,017 108,667 111,384 114,169 117,023 119,949 122,948
Collarenebri telemetry and computerista ‐ ‐ 66,666 66,666 ‐ ‐ ‐ ‐ ‐ ‐ ‐ ‐
Collarenebri sewer main replacement 101,800 101,800 100,000 101,900 103,938 106,016 108,667 111,384 114,169 117,023 119,949 122,948
Total Capital Expenditure 509,000 514,818 2,600,000 605,700 411,814 418,050 326,000 334,152 342,507 351,069 359,847 368,844
Capital Surplus/(Deficit) (509,000) (514,818) (600,000) (605,700) (411,814) (418,050) (326,000) (334,152) (342,507) (351,069) (359,847) (368,844)
Transfer from Reserves (Income) Transfer from Reserves ‐ Walgett (509,000) (514,818) (600,000) (605,700) (411,814) (418,050) (426,000) (434,152) (442,507) (451,069) (459,847) (468,844)
Total Transfer from Reserves (Incom (509,000) (514,818) (600,000) (605,700) (411,814) (418,050) (426,000) (434,152) (442,507) (451,069) (459,847) (468,844)
Transfer to Reserves (Expenditure) Transfer to Reserves ‐ Walgett 525,631 128,576 425,536 404,818 440,084 476,117 599,393 642,206 647,998 715,161 765,026 799,126
Total Transfer to Reserves (Income) 525,631 128,576 425,536 404,818 440,084 476,117 599,393 642,206 647,998 715,161 765,026 799,126
Net Reserve Surplus/(Deficit) (16,631) 386,242 174,464 200,882 (28,270) (58,067) (173,393) (208,054) (205,491) (264,092) (305,179) (330,282)
Internal Expenditure Administration ‐ Walgett 49,419 49,419 50,407 51,415 52,443 53,492 54,562 55,653 56,766 57,901 59,059 60,240
Administration ‐ Lightning Ridge 12,118 12,118 12,360 12,607 12,859 13,116 13,706 13,980 14,260 14,545 14,836 15,133
Administration ‐ Collarenebri 3,658 3,658 3,731 3,806 3,882 3,960 4,039 4,120 4,202 4,286 4,372 4,459
2020/2021 Long Term Finanicla Plan Scenario: Planned - 2.60% Rate Pegging Increase
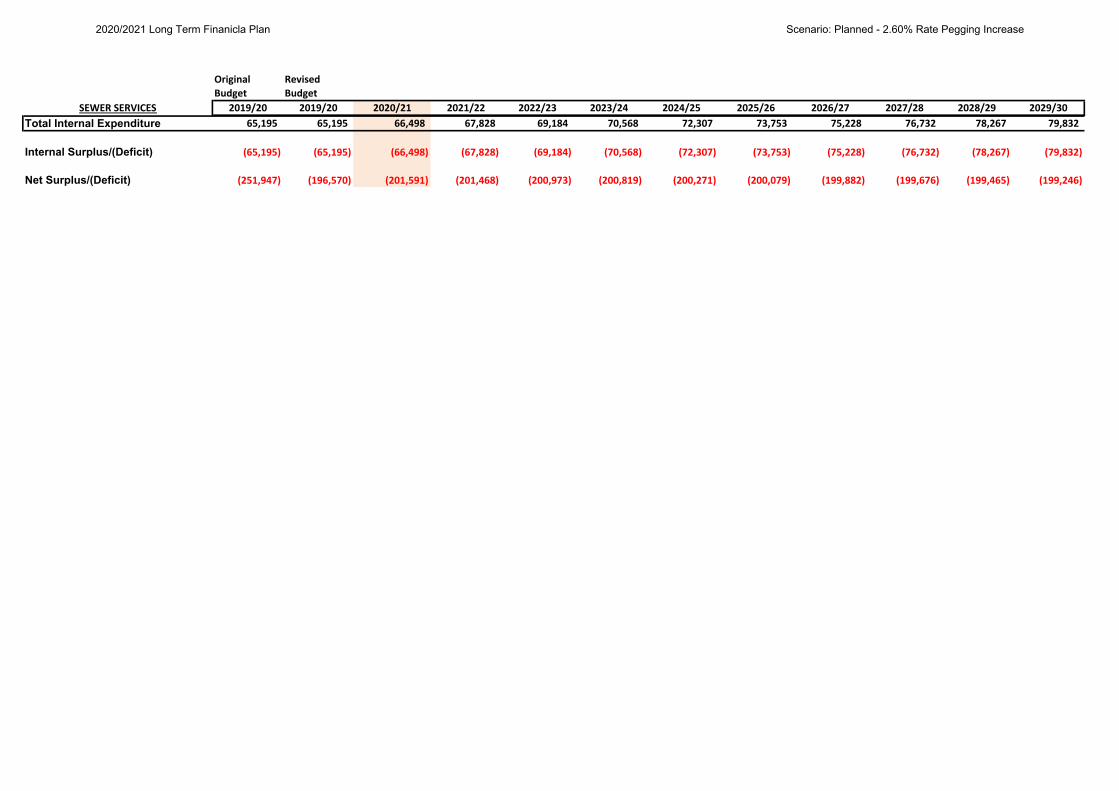
Original RevisedBudget Budget
SEWER SERVICES 2019/20 2019/20 2020/21 2021/22 2022/23 2023/24 2024/25 2025/26 2026/27 2027/28 2028/29 2029/30Total Internal Expenditure 65,195 65,195 66,498 67,828 69,184 70,568 72,307 73,753 75,228 76,732 78,267 79,832
Internal Surplus/(Deficit) (65,195) (65,195) (66,498) (67,828) (69,184) (70,568) (72,307) (73,753) (75,228) (76,732) (78,267) (79,832)
Net Surplus/(Deficit) (251,947) (196,570) (201,591) (201,468) (200,973) (200,819) (200,271) (200,079) (199,882) (199,676) (199,465) (199,246)
2020/2021 Long Term Finanicla Plan Scenario: Planned - 2.60% Rate Pegging Increase
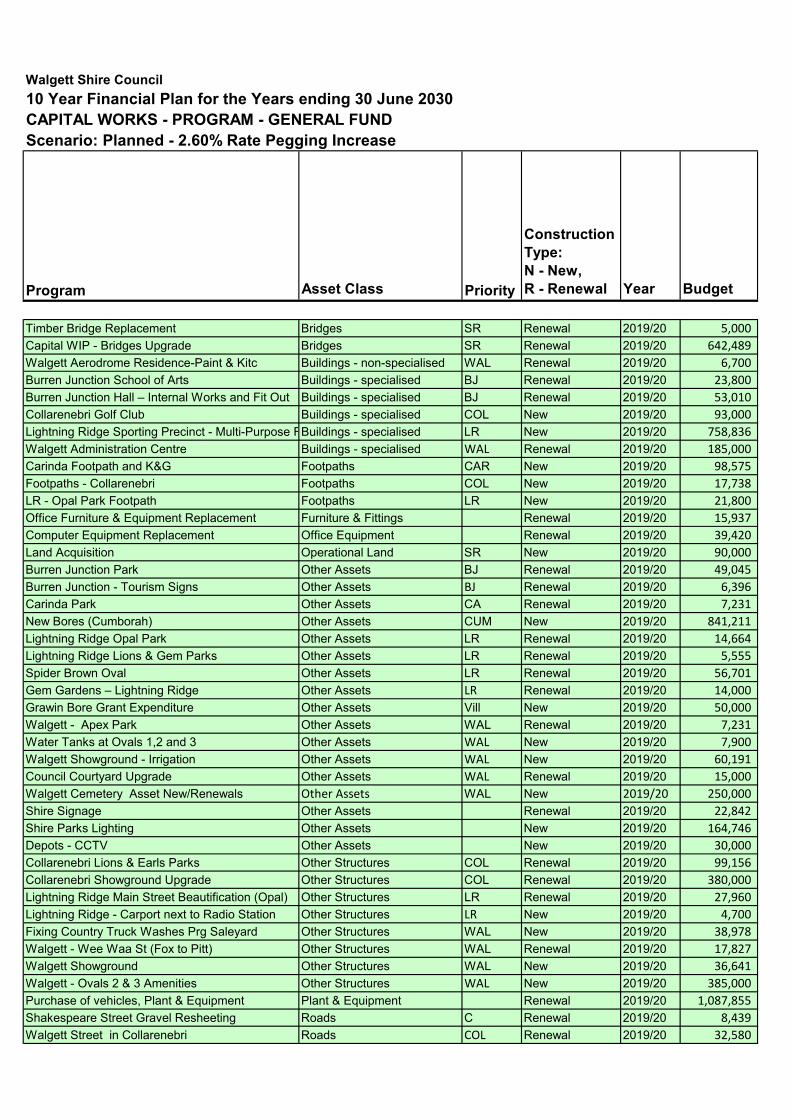
Walgett Shire Council10 Year Financial Plan for the Years ending 30 June 2030CAPITAL WORKS - PROGRAM - GENERAL FUNDScenario: Planned - 2.60% Rate Pegging Increase
Program Asset Class Priority
Construction Type:N - New,R - Renewal Year Budget
Timber Bridge Replacement Bridges SR Renewal 2019/20 5,000
Capital WIP - Bridges Upgrade Bridges SR Renewal 2019/20 642,489
Walgett Aerodrome Residence-Paint & Kitc Buildings - non-specialised WAL Renewal 2019/20 6,700
Burren Junction School of Arts Buildings - specialised BJ Renewal 2019/20 23,800
Burren Junction Hall – Internal Works and Fit Out Buildings - specialised BJ Renewal 2019/20 53,010
Collarenebri Golf Club Buildings - specialised COL New 2019/20 93,000
Lightning Ridge Sporting Precinct - Multi-Purpose FBuildings - specialised LR New 2019/20 758,836
Walgett Administration Centre Buildings - specialised WAL Renewal 2019/20 185,000
Carinda Footpath and K&G Footpaths CAR New 2019/20 98,575
Footpaths - Collarenebri Footpaths COL New 2019/20 17,738
LR - Opal Park Footpath Footpaths LR New 2019/20 21,800
Office Furniture & Equipment Replacement Furniture & Fittings Renewal 2019/20 15,937
Computer Equipment Replacement Office Equipment Renewal 2019/20 39,420
Land Acquisition Operational Land SR New 2019/20 90,000
Burren Junction Park Other Assets BJ Renewal 2019/20 49,045
Burren Junction - Tourism Signs Other Assets BJ Renewal 2019/20 6,396
Carinda Park Other Assets CA Renewal 2019/20 7,231
New Bores (Cumborah) Other Assets CUM New 2019/20 841,211
Lightning Ridge Opal Park Other Assets LR Renewal 2019/20 14,664
Lightning Ridge Lions & Gem Parks Other Assets LR Renewal 2019/20 5,555
Spider Brown Oval Other Assets LR Renewal 2019/20 56,701
Gem Gardens – Lightning Ridge Other Assets LR Renewal 2019/20 14,000
Grawin Bore Grant Expenditure Other Assets Vill New 2019/20 50,000
Walgett - Apex Park Other Assets WAL Renewal 2019/20 7,231
Water Tanks at Ovals 1,2 and 3 Other Assets WAL New 2019/20 7,900
Walgett Showground - Irrigation Other Assets WAL New 2019/20 60,191
Council Courtyard Upgrade Other Assets WAL Renewal 2019/20 15,000
Walgett Cemetery Asset New/Renewals Other Assets WAL New 2019/20 250,000
Shire Signage Other Assets Renewal 2019/20 22,842
Shire Parks Lighting Other Assets New 2019/20 164,746
Depots - CCTV Other Assets New 2019/20 30,000
Collarenebri Lions & Earls Parks Other Structures COL Renewal 2019/20 99,156
Collarenebri Showground Upgrade Other Structures COL Renewal 2019/20 380,000
Lightning Ridge Main Street Beautification (Opal) Other Structures LR Renewal 2019/20 27,960
Lightning Ridge - Carport next to Radio Station Other Structures LR New 2019/20 4,700
Fixing Country Truck Washes Prg Saleyard Other Structures WAL New 2019/20 38,978
Walgett - Wee Waa St (Fox to Pitt) Other Structures WAL Renewal 2019/20 17,827
Walgett Showground Other Structures WAL New 2019/20 36,641
Walgett - Ovals 2 & 3 Amenities Other Structures WAL New 2019/20 385,000
Purchase of vehicles, Plant & Equipment Plant & Equipment Renewal 2019/20 1,087,855
Shakespeare Street Gravel Resheeting Roads C Renewal 2019/20 8,439
Walgett Street in Collarenebri Roads COL Renewal 2019/20 32,580
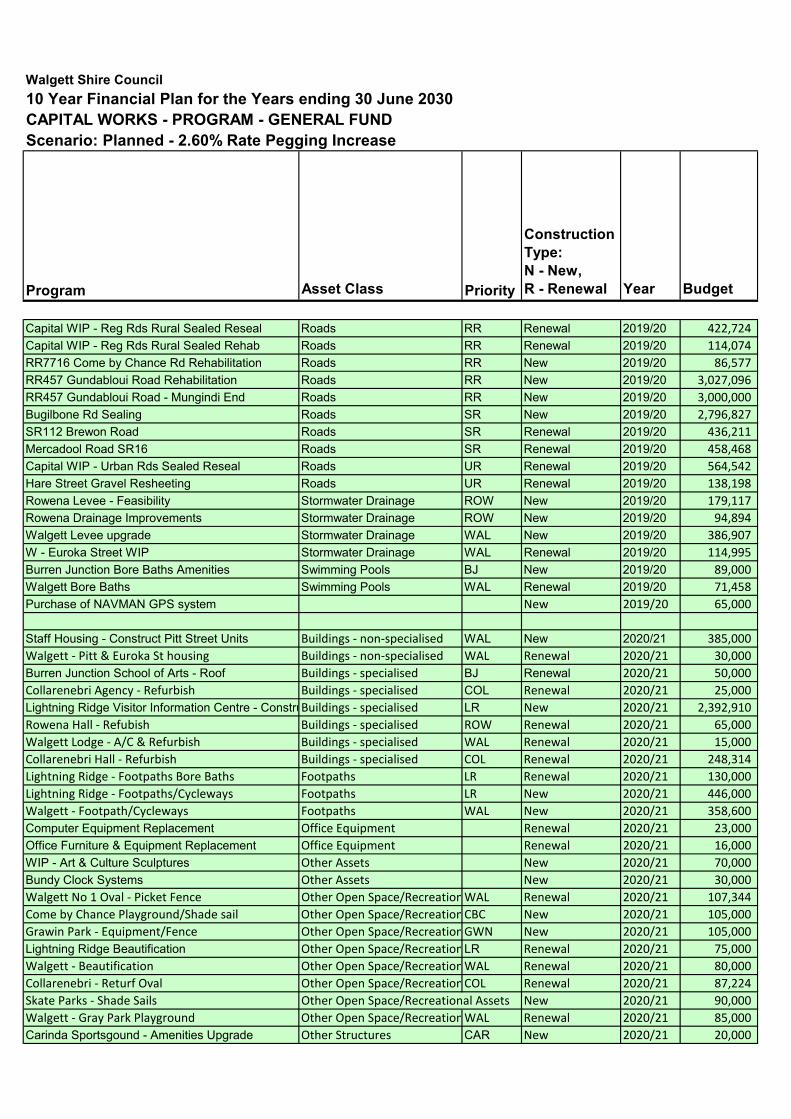
Walgett Shire Council10 Year Financial Plan for the Years ending 30 June 2030CAPITAL WORKS - PROGRAM - GENERAL FUNDScenario: Planned - 2.60% Rate Pegging Increase
Program Asset Class Priority
Construction Type:N - New,R - Renewal Year Budget
Capital WIP - Reg Rds Rural Sealed Reseal Roads RR Renewal 2019/20 422,724
Capital WIP - Reg Rds Rural Sealed Rehab Roads RR Renewal 2019/20 114,074
RR7716 Come by Chance Rd Rehabilitation Roads RR New 2019/20 86,577
RR457 Gundabloui Road Rehabilitation Roads RR New 2019/20 3,027,096
RR457 Gundabloui Road - Mungindi End Roads RR New 2019/20 3,000,000
Bugilbone Rd Sealing Roads SR New 2019/20 2,796,827
SR112 Brewon Road Roads SR Renewal 2019/20 436,211
Mercadool Road SR16 Roads SR Renewal 2019/20 458,468
Capital WIP - Urban Rds Sealed Reseal Roads UR Renewal 2019/20 564,542
Hare Street Gravel Resheeting Roads UR Renewal 2019/20 138,198
Rowena Levee - Feasibility Stormwater Drainage ROW New 2019/20 179,117
Rowena Drainage Improvements Stormwater Drainage ROW New 2019/20 94,894
Walgett Levee upgrade Stormwater Drainage WAL New 2019/20 386,907
W - Euroka Street WIP Stormwater Drainage WAL Renewal 2019/20 114,995
Burren Junction Bore Baths Amenities Swimming Pools BJ New 2019/20 89,000
Walgett Bore Baths Swimming Pools WAL Renewal 2019/20 71,458
Purchase of NAVMAN GPS system New 2019/20 65,000
Staff Housing - Construct Pitt Street Units Buildings ‐ non‐specialised WAL New 2020/21 385,000
Walgett ‐ Pitt & Euroka St housing Buildings ‐ non‐specialised WAL Renewal 2020/21 30,000
Burren Junction School of Arts - Roof Buildings ‐ specialised BJ Renewal 2020/21 50,000
Collarenebri Agency ‐ Refurbish Buildings ‐ specialised COL Renewal 2020/21 25,000
Lightning Ridge Visitor Information Centre - ConstruBuildings ‐ specialised LR New 2020/21 2,392,910
Rowena Hall ‐ Refubish Buildings ‐ specialised ROW Renewal 2020/21 65,000
Walgett Lodge ‐ A/C & Refurbish Buildings ‐ specialised WAL Renewal 2020/21 15,000
Collarenebri Hall ‐ Refurbish Buildings ‐ specialised COL Renewal 2020/21 248,314
Lightning Ridge ‐ Footpaths Bore Baths Footpaths LR Renewal 2020/21 130,000
Lightning Ridge ‐ Footpaths/Cycleways Footpaths LR New 2020/21 446,000
Walgett ‐ Footpath/Cycleways Footpaths WAL New 2020/21 358,600
Computer Equipment Replacement Office Equipment Renewal 2020/21 23,000
Office Furniture & Equipment Replacement Office Equipment Renewal 2020/21 16,000
WIP - Art & Culture Sculptures Other Assets New 2020/21 70,000
Bundy Clock Systems Other Assets New 2020/21 30,000
Walgett No 1 Oval ‐ Picket Fence Other Open Space/RecreationWAL Renewal 2020/21 107,344
Come by Chance Playground/Shade sail Other Open Space/RecreationCBC New 2020/21 105,000
Grawin Park ‐ Equipment/Fence Other Open Space/RecreationGWN New 2020/21 105,000
Lightning Ridge Beautification Other Open Space/RecreationLR Renewal 2020/21 75,000
Walgett ‐ Beautification Other Open Space/RecreationWAL Renewal 2020/21 80,000
Collarenebri ‐ Returf Oval Other Open Space/RecreationCOL Renewal 2020/21 87,224
Skate Parks ‐ Shade Sails Other Open Space/Recreational Assets New 2020/21 90,000
Walgett ‐ Gray Park Playground Other Open Space/RecreationWAL Renewal 2020/21 85,000
Carinda Sportsgound - Amenities Upgrade Other Structures CAR New 2020/21 20,000
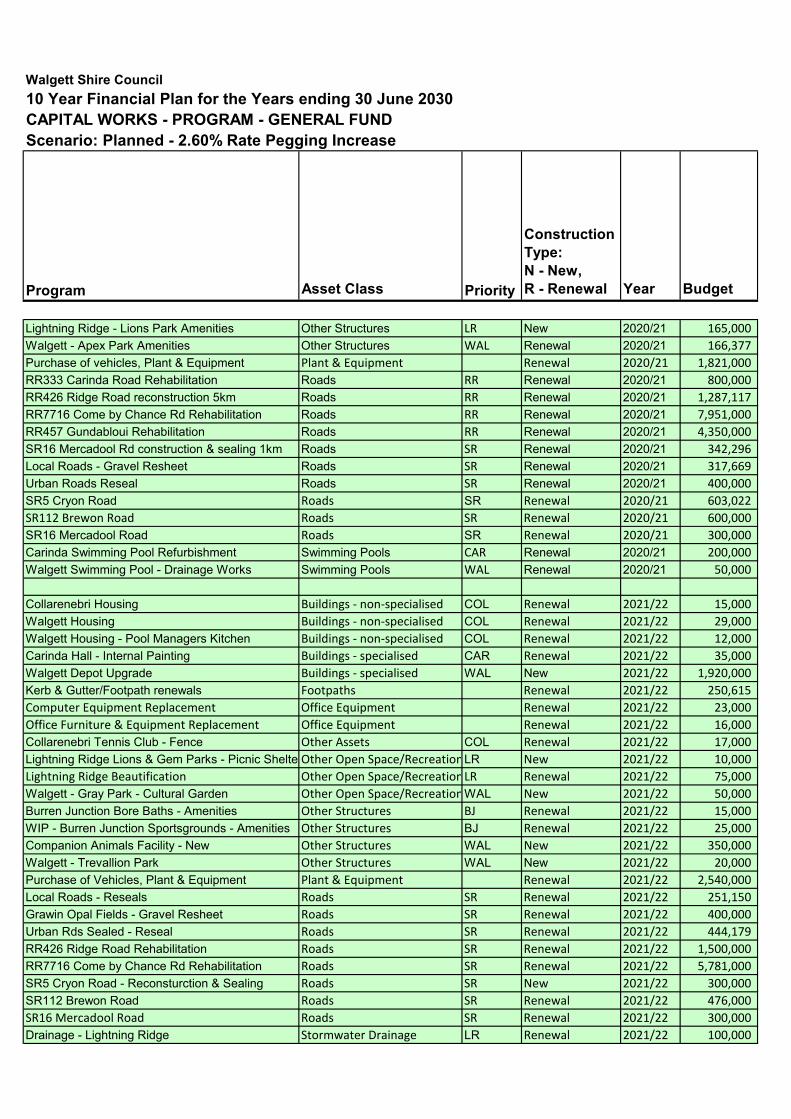
Walgett Shire Council10 Year Financial Plan for the Years ending 30 June 2030CAPITAL WORKS - PROGRAM - GENERAL FUNDScenario: Planned - 2.60% Rate Pegging Increase
Program Asset Class Priority
Construction Type:N - New,R - Renewal Year Budget
Lightning Ridge - Lions Park Amenities Other Structures LR New 2020/21 165,000
Walgett - Apex Park Amenities Other Structures WAL Renewal 2020/21 166,377
Purchase of vehicles, Plant & Equipment Plant & Equipment Renewal 2020/21 1,821,000
RR333 Carinda Road Rehabilitation Roads RR Renewal 2020/21 800,000
RR426 Ridge Road reconstruction 5km Roads RR Renewal 2020/21 1,287,117
RR7716 Come by Chance Rd Rehabilitation Roads RR Renewal 2020/21 7,951,000
RR457 Gundabloui Rehabilitation Roads RR Renewal 2020/21 4,350,000
SR16 Mercadool Rd construction & sealing 1km Roads SR Renewal 2020/21 342,296
Local Roads - Gravel Resheet Roads SR Renewal 2020/21 317,669
Urban Roads Reseal Roads SR Renewal 2020/21 400,000
SR5 Cryon Road Roads SR Renewal 2020/21 603,022
SR112 Brewon Road Roads SR Renewal 2020/21 600,000
SR16 Mercadool Road Roads SR Renewal 2020/21 300,000
Carinda Swimming Pool Refurbishment Swimming Pools CAR Renewal 2020/21 200,000
Walgett Swimming Pool - Drainage Works Swimming Pools WAL Renewal 2020/21 50,000
Collarenebri Housing Buildings ‐ non‐specialised COL Renewal 2021/22 15,000
Walgett Housing Buildings ‐ non‐specialised COL Renewal 2021/22 29,000
Walgett Housing - Pool Managers Kitchen Buildings ‐ non‐specialised COL Renewal 2021/22 12,000
Carinda Hall - Internal Painting Buildings ‐ specialised CAR Renewal 2021/22 35,000
Walgett Depot Upgrade Buildings ‐ specialised WAL New 2021/22 1,920,000
Kerb & Gutter/Footpath renewals Footpaths Renewal 2021/22 250,615
Computer Equipment Replacement Office Equipment Renewal 2021/22 23,000
Office Furniture & Equipment Replacement Office Equipment Renewal 2021/22 16,000
Collarenebri Tennis Club - Fence Other Assets COL Renewal 2021/22 17,000
Lightning Ridge Lions & Gem Parks - Picnic Shelte Other Open Space/RecreationLR New 2021/22 10,000
Lightning Ridge Beautification Other Open Space/RecreationLR Renewal 2021/22 75,000
Walgett - Gray Park - Cultural Garden Other Open Space/RecreationWAL New 2021/22 50,000
Burren Junction Bore Baths - Amenities Other Structures BJ Renewal 2021/22 15,000
WIP - Burren Junction Sportsgrounds - Amenities Other Structures BJ Renewal 2021/22 25,000
Companion Animals Facility - New Other Structures WAL New 2021/22 350,000
Walgett - Trevallion Park Other Structures WAL New 2021/22 20,000
Purchase of Vehicles, Plant & Equipment Plant & Equipment Renewal 2021/22 2,540,000
Local Roads - Reseals Roads SR Renewal 2021/22 251,150
Grawin Opal Fields - Gravel Resheet Roads SR Renewal 2021/22 400,000
Urban Rds Sealed - Reseal Roads SR Renewal 2021/22 444,179
RR426 Ridge Road Rehabilitation Roads SR Renewal 2021/22 1,500,000
RR7716 Come by Chance Rd Rehabilitation Roads SR Renewal 2021/22 5,781,000
SR5 Cryon Road - Reconsturction & Sealing Roads SR New 2021/22 300,000
SR112 Brewon Road Roads SR Renewal 2021/22 476,000
SR16 Mercadool Road Roads SR Renewal 2021/22 300,000
Drainage - Lightning Ridge Stormwater Drainage LR Renewal 2021/22 100,000
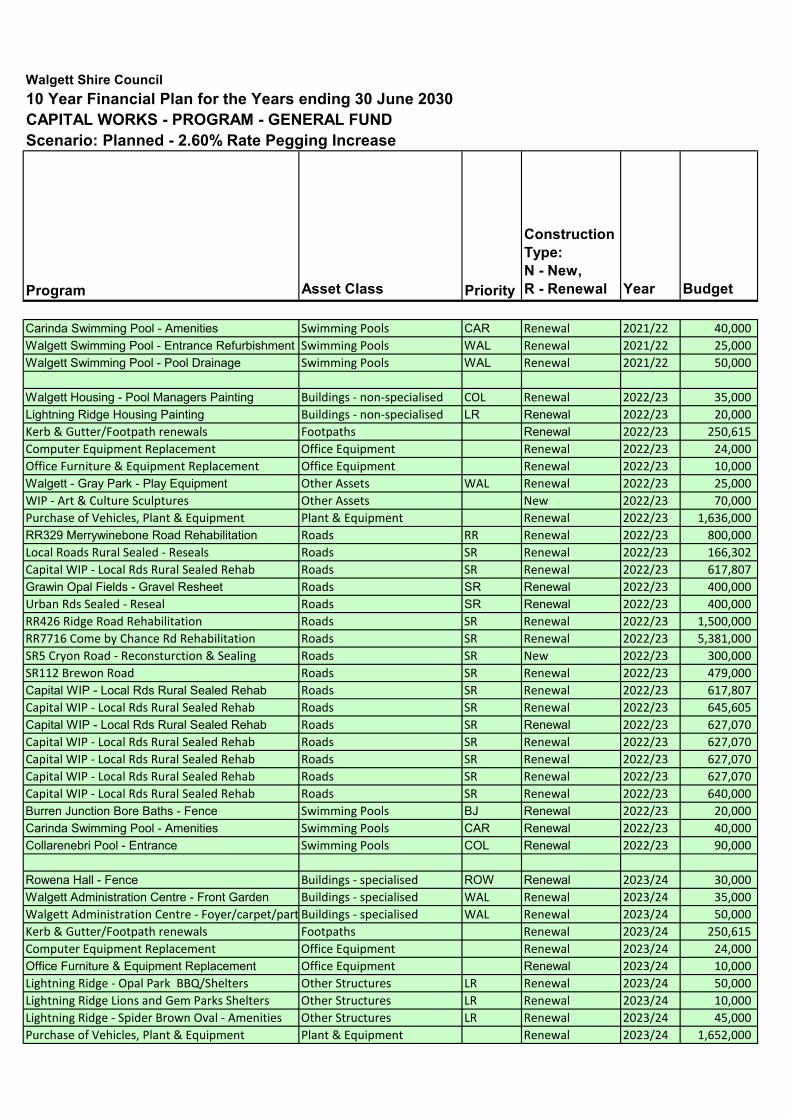
Walgett Shire Council10 Year Financial Plan for the Years ending 30 June 2030CAPITAL WORKS - PROGRAM - GENERAL FUNDScenario: Planned - 2.60% Rate Pegging Increase
Program Asset Class Priority
Construction Type:N - New,R - Renewal Year Budget
Carinda Swimming Pool - Amenities Swimming Pools CAR Renewal 2021/22 40,000
Walgett Swimming Pool - Entrance Refurbishment Swimming Pools WAL Renewal 2021/22 25,000
Walgett Swimming Pool - Pool Drainage Swimming Pools WAL Renewal 2021/22 50,000
Walgett Housing - Pool Managers Painting Buildings ‐ non‐specialised COL Renewal 2022/23 35,000
Lightning Ridge Housing Painting Buildings ‐ non‐specialised LR Renewal 2022/23 20,000
Kerb & Gutter/Footpath renewals Footpaths Renewal 2022/23 250,615
Computer Equipment Replacement Office Equipment Renewal 2022/23 24,000
Office Furniture & Equipment Replacement Office Equipment Renewal 2022/23 10,000
Walgett - Gray Park - Play Equipment Other Assets WAL Renewal 2022/23 25,000
WIP ‐ Art & Culture Sculptures Other Assets New 2022/23 70,000
Purchase of Vehicles, Plant & Equipment Plant & Equipment Renewal 2022/23 1,636,000
RR329 Merrywinebone Road Rehabilitation Roads RR Renewal 2022/23 800,000
Local Roads Rural Sealed ‐ Reseals Roads SR Renewal 2022/23 166,302
Capital WIP ‐ Local Rds Rural Sealed Rehab Roads SR Renewal 2022/23 617,807
Grawin Opal Fields - Gravel Resheet Roads SR Renewal 2022/23 400,000
Urban Rds Sealed ‐ Reseal Roads SR Renewal 2022/23 400,000
RR426 Ridge Road Rehabilitation Roads SR Renewal 2022/23 1,500,000
RR7716 Come by Chance Rd Rehabilitation Roads SR Renewal 2022/23 5,381,000
SR5 Cryon Road ‐ Reconsturction & Sealing Roads SR New 2022/23 300,000
SR112 Brewon Road Roads SR Renewal 2022/23 479,000
Capital WIP - Local Rds Rural Sealed Rehab Roads SR Renewal 2022/23 617,807
Capital WIP ‐ Local Rds Rural Sealed Rehab Roads SR Renewal 2022/23 645,605
Capital WIP - Local Rds Rural Sealed Rehab Roads SR Renewal 2022/23 627,070
Capital WIP ‐ Local Rds Rural Sealed Rehab Roads SR Renewal 2022/23 627,070
Capital WIP ‐ Local Rds Rural Sealed Rehab Roads SR Renewal 2022/23 627,070
Capital WIP ‐ Local Rds Rural Sealed Rehab Roads SR Renewal 2022/23 627,070
Capital WIP ‐ Local Rds Rural Sealed Rehab Roads SR Renewal 2022/23 640,000
Burren Junction Bore Baths - Fence Swimming Pools BJ Renewal 2022/23 20,000
Carinda Swimming Pool - Amenities Swimming Pools CAR Renewal 2022/23 40,000
Collarenebri Pool - Entrance Swimming Pools COL Renewal 2022/23 90,000
Rowena Hall - Fence Buildings ‐ specialised ROW Renewal 2023/24 30,000
Walgett Administration Centre - Front Garden Buildings ‐ specialised WAL Renewal 2023/24 35,000
Walgett Administration Centre ‐ Foyer/carpet/part Buildings ‐ specialised WAL Renewal 2023/24 50,000
Kerb & Gutter/Footpath renewals Footpaths Renewal 2023/24 250,615
Computer Equipment Replacement Office Equipment Renewal 2023/24 24,000
Office Furniture & Equipment Replacement Office Equipment Renewal 2023/24 10,000
Lightning Ridge ‐ Opal Park BBQ/Shelters Other Structures LR Renewal 2023/24 50,000
Lightning Ridge Lions and Gem Parks Shelters Other Structures LR Renewal 2023/24 10,000
Lightning Ridge ‐ Spider Brown Oval ‐ Amenities Other Structures LR Renewal 2023/24 45,000
Purchase of Vehicles, Plant & Equipment Plant & Equipment Renewal 2023/24 1,652,000
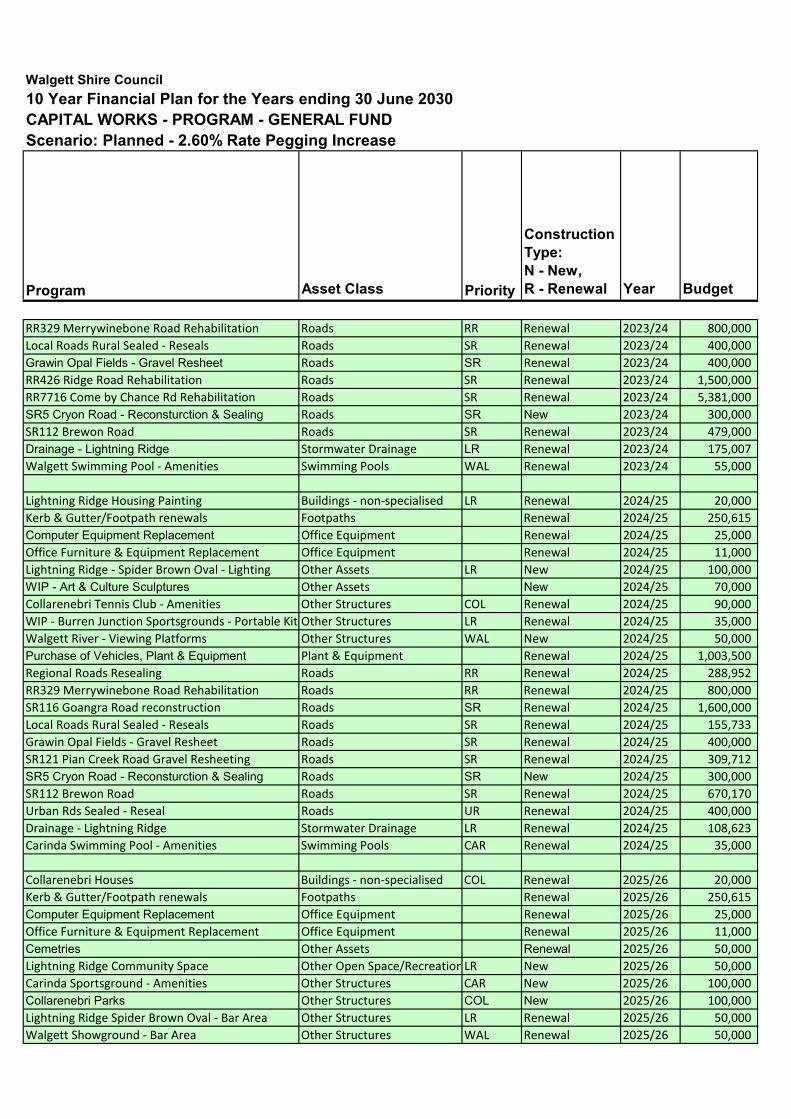
Walgett Shire Council10 Year Financial Plan for the Years ending 30 June 2030CAPITAL WORKS - PROGRAM - GENERAL FUNDScenario: Planned - 2.60% Rate Pegging Increase
Program Asset Class Priority
Construction Type:N - New,R - Renewal Year Budget
RR329 Merrywinebone Road Rehabilitation Roads RR Renewal 2023/24 800,000
Local Roads Rural Sealed ‐ Reseals Roads SR Renewal 2023/24 400,000
Grawin Opal Fields - Gravel Resheet Roads SR Renewal 2023/24 400,000
RR426 Ridge Road Rehabilitation Roads SR Renewal 2023/24 1,500,000
RR7716 Come by Chance Rd Rehabilitation Roads SR Renewal 2023/24 5,381,000
SR5 Cryon Road - Reconsturction & Sealing Roads SR New 2023/24 300,000
SR112 Brewon Road Roads SR Renewal 2023/24 479,000
Drainage - Lightning Ridge Stormwater Drainage LR Renewal 2023/24 175,007
Walgett Swimming Pool ‐ Amenities Swimming Pools WAL Renewal 2023/24 55,000
Lightning Ridge Housing Painting Buildings ‐ non‐specialised LR Renewal 2024/25 20,000
Kerb & Gutter/Footpath renewals Footpaths Renewal 2024/25 250,615
Computer Equipment Replacement Office Equipment Renewal 2024/25 25,000
Office Furniture & Equipment Replacement Office Equipment Renewal 2024/25 11,000
Lightning Ridge ‐ Spider Brown Oval ‐ Lighting Other Assets LR New 2024/25 100,000
WIP - Art & Culture Sculptures Other Assets New 2024/25 70,000
Collarenebri Tennis Club ‐ Amenities Other Structures COL Renewal 2024/25 90,000
WIP ‐ Burren Junction Sportsgrounds ‐ Portable Kit Other Structures LR Renewal 2024/25 35,000
Walgett River ‐ Viewing Platforms Other Structures WAL New 2024/25 50,000
Purchase of Vehicles, Plant & Equipment Plant & Equipment Renewal 2024/25 1,003,500
Regional Roads Resealing Roads RR Renewal 2024/25 288,952
RR329 Merrywinebone Road Rehabilitation Roads RR Renewal 2024/25 800,000
SR116 Goangra Road reconstruction Roads SR Renewal 2024/25 1,600,000
Local Roads Rural Sealed ‐ Reseals Roads SR Renewal 2024/25 155,733
Grawin Opal Fields ‐ Gravel Resheet Roads SR Renewal 2024/25 400,000
SR121 Pian Creek Road Gravel Resheeting Roads SR Renewal 2024/25 309,712
SR5 Cryon Road - Reconsturction & Sealing Roads SR New 2024/25 300,000
SR112 Brewon Road Roads SR Renewal 2024/25 670,170
Urban Rds Sealed ‐ Reseal Roads UR Renewal 2024/25 400,000
Drainage ‐ Lightning Ridge Stormwater Drainage LR Renewal 2024/25 108,623
Carinda Swimming Pool ‐ Amenities Swimming Pools CAR Renewal 2024/25 35,000
Collarenebri Houses Buildings ‐ non‐specialised COL Renewal 2025/26 20,000
Kerb & Gutter/Footpath renewals Footpaths Renewal 2025/26 250,615
Computer Equipment Replacement Office Equipment Renewal 2025/26 25,000
Office Furniture & Equipment Replacement Office Equipment Renewal 2025/26 11,000
Cemetries Other Assets Renewal 2025/26 50,000
Lightning Ridge Community Space Other Open Space/RecreationLR New 2025/26 50,000
Carinda Sportsground ‐ Amenities Other Structures CAR New 2025/26 100,000
Collarenebri Parks Other Structures COL New 2025/26 100,000
Lightning Ridge Spider Brown Oval ‐ Bar Area Other Structures LR Renewal 2025/26 50,000
Walgett Showground ‐ Bar Area Other Structures WAL Renewal 2025/26 50,000
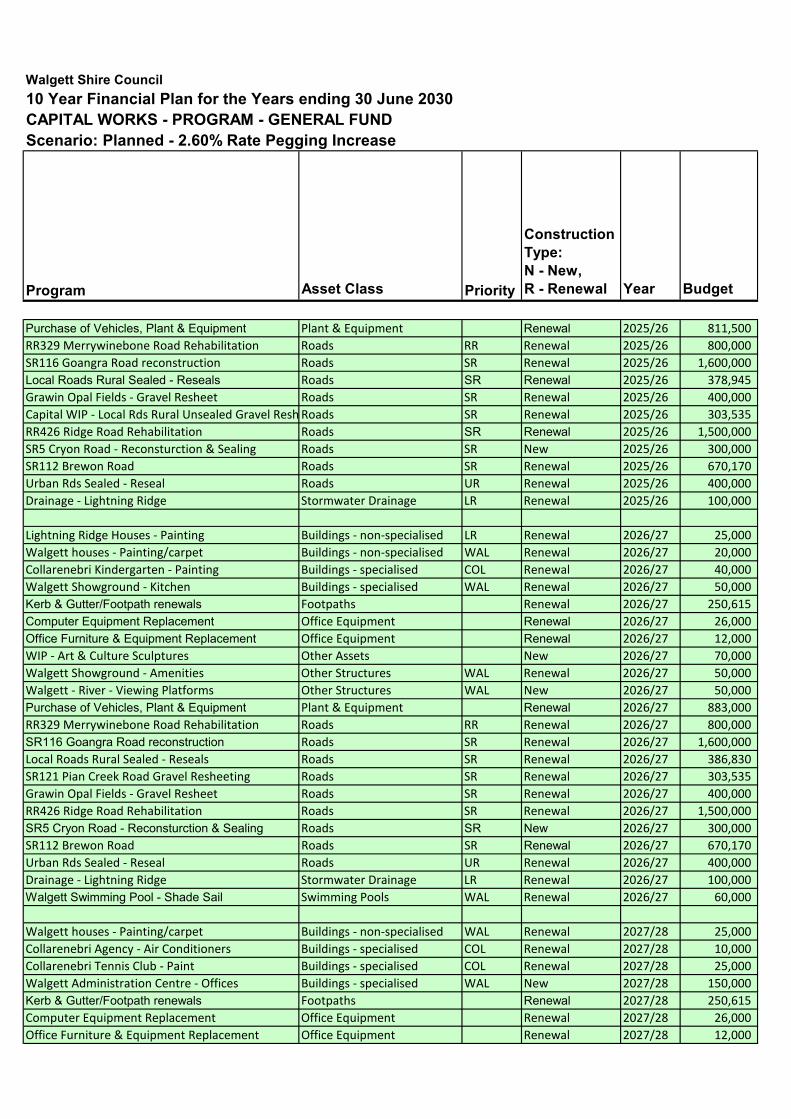
Walgett Shire Council10 Year Financial Plan for the Years ending 30 June 2030CAPITAL WORKS - PROGRAM - GENERAL FUNDScenario: Planned - 2.60% Rate Pegging Increase
Program Asset Class Priority
Construction Type:N - New,R - Renewal Year Budget
Purchase of Vehicles, Plant & Equipment Plant & Equipment Renewal 2025/26 811,500
RR329 Merrywinebone Road Rehabilitation Roads RR Renewal 2025/26 800,000
SR116 Goangra Road reconstruction Roads SR Renewal 2025/26 1,600,000
Local Roads Rural Sealed - Reseals Roads SR Renewal 2025/26 378,945
Grawin Opal Fields ‐ Gravel Resheet Roads SR Renewal 2025/26 400,000
Capital WIP ‐ Local Rds Rural Unsealed Gravel Resh Roads SR Renewal 2025/26 303,535
RR426 Ridge Road Rehabilitation Roads SR Renewal 2025/26 1,500,000
SR5 Cryon Road ‐ Reconsturction & Sealing Roads SR New 2025/26 300,000
SR112 Brewon Road Roads SR Renewal 2025/26 670,170
Urban Rds Sealed ‐ Reseal Roads UR Renewal 2025/26 400,000
Drainage ‐ Lightning Ridge Stormwater Drainage LR Renewal 2025/26 100,000
Lightning Ridge Houses ‐ Painting Buildings ‐ non‐specialised LR Renewal 2026/27 25,000
Walgett houses ‐ Painting/carpet Buildings ‐ non‐specialised WAL Renewal 2026/27 20,000
Collarenebri Kindergarten ‐ Painting Buildings ‐ specialised COL Renewal 2026/27 40,000
Walgett Showground ‐ Kitchen Buildings ‐ specialised WAL Renewal 2026/27 50,000
Kerb & Gutter/Footpath renewals Footpaths Renewal 2026/27 250,615
Computer Equipment Replacement Office Equipment Renewal 2026/27 26,000
Office Furniture & Equipment Replacement Office Equipment Renewal 2026/27 12,000
WIP ‐ Art & Culture Sculptures Other Assets New 2026/27 70,000
Walgett Showground ‐ Amenities Other Structures WAL Renewal 2026/27 50,000
Walgett ‐ River ‐ Viewing Platforms Other Structures WAL New 2026/27 50,000
Purchase of Vehicles, Plant & Equipment Plant & Equipment Renewal 2026/27 883,000
RR329 Merrywinebone Road Rehabilitation Roads RR Renewal 2026/27 800,000
SR116 Goangra Road reconstruction Roads SR Renewal 2026/27 1,600,000
Local Roads Rural Sealed ‐ Reseals Roads SR Renewal 2026/27 386,830
SR121 Pian Creek Road Gravel Resheeting Roads SR Renewal 2026/27 303,535
Grawin Opal Fields ‐ Gravel Resheet Roads SR Renewal 2026/27 400,000
RR426 Ridge Road Rehabilitation Roads SR Renewal 2026/27 1,500,000
SR5 Cryon Road - Reconsturction & Sealing Roads SR New 2026/27 300,000
SR112 Brewon Road Roads SR Renewal 2026/27 670,170
Urban Rds Sealed ‐ Reseal Roads UR Renewal 2026/27 400,000
Drainage ‐ Lightning Ridge Stormwater Drainage LR Renewal 2026/27 100,000
Walgett Swimming Pool - Shade Sail Swimming Pools WAL Renewal 2026/27 60,000
Walgett houses ‐ Painting/carpet Buildings ‐ non‐specialised WAL Renewal 2027/28 25,000
Collarenebri Agency ‐ Air Conditioners Buildings ‐ specialised COL Renewal 2027/28 10,000
Collarenebri Tennis Club ‐ Paint Buildings ‐ specialised COL Renewal 2027/28 25,000
Walgett Administration Centre ‐ Offices Buildings ‐ specialised WAL New 2027/28 150,000
Kerb & Gutter/Footpath renewals Footpaths Renewal 2027/28 250,615
Computer Equipment Replacement Office Equipment Renewal 2027/28 26,000
Office Furniture & Equipment Replacement Office Equipment Renewal 2027/28 12,000
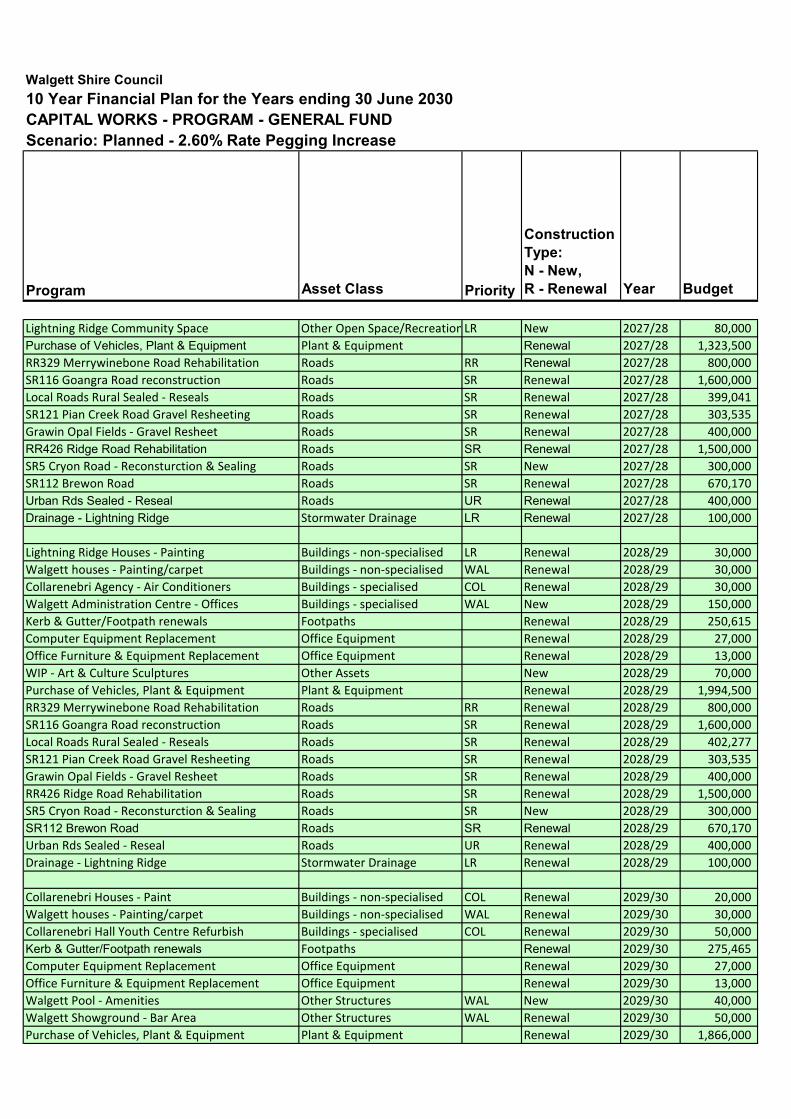
Walgett Shire Council10 Year Financial Plan for the Years ending 30 June 2030CAPITAL WORKS - PROGRAM - GENERAL FUNDScenario: Planned - 2.60% Rate Pegging Increase
Program Asset Class Priority
Construction Type:N - New,R - Renewal Year Budget
Lightning Ridge Community Space Other Open Space/RecreationLR New 2027/28 80,000
Purchase of Vehicles, Plant & Equipment Plant & Equipment Renewal 2027/28 1,323,500
RR329 Merrywinebone Road Rehabilitation Roads RR Renewal 2027/28 800,000
SR116 Goangra Road reconstruction Roads SR Renewal 2027/28 1,600,000
Local Roads Rural Sealed ‐ Reseals Roads SR Renewal 2027/28 399,041
SR121 Pian Creek Road Gravel Resheeting Roads SR Renewal 2027/28 303,535
Grawin Opal Fields ‐ Gravel Resheet Roads SR Renewal 2027/28 400,000
RR426 Ridge Road Rehabilitation Roads SR Renewal 2027/28 1,500,000
SR5 Cryon Road ‐ Reconsturction & Sealing Roads SR New 2027/28 300,000
SR112 Brewon Road Roads SR Renewal 2027/28 670,170
Urban Rds Sealed - Reseal Roads UR Renewal 2027/28 400,000
Drainage - Lightning Ridge Stormwater Drainage LR Renewal 2027/28 100,000
Lightning Ridge Houses ‐ Painting Buildings ‐ non‐specialised LR Renewal 2028/29 30,000
Walgett houses ‐ Painting/carpet Buildings ‐ non‐specialised WAL Renewal 2028/29 30,000
Collarenebri Agency ‐ Air Conditioners Buildings ‐ specialised COL Renewal 2028/29 30,000
Walgett Administration Centre ‐ Offices Buildings ‐ specialised WAL New 2028/29 150,000
Kerb & Gutter/Footpath renewals Footpaths Renewal 2028/29 250,615
Computer Equipment Replacement Office Equipment Renewal 2028/29 27,000
Office Furniture & Equipment Replacement Office Equipment Renewal 2028/29 13,000
WIP ‐ Art & Culture Sculptures Other Assets New 2028/29 70,000
Purchase of Vehicles, Plant & Equipment Plant & Equipment Renewal 2028/29 1,994,500
RR329 Merrywinebone Road Rehabilitation Roads RR Renewal 2028/29 800,000
SR116 Goangra Road reconstruction Roads SR Renewal 2028/29 1,600,000
Local Roads Rural Sealed ‐ Reseals Roads SR Renewal 2028/29 402,277
SR121 Pian Creek Road Gravel Resheeting Roads SR Renewal 2028/29 303,535
Grawin Opal Fields ‐ Gravel Resheet Roads SR Renewal 2028/29 400,000
RR426 Ridge Road Rehabilitation Roads SR Renewal 2028/29 1,500,000
SR5 Cryon Road ‐ Reconsturction & Sealing Roads SR New 2028/29 300,000
SR112 Brewon Road Roads SR Renewal 2028/29 670,170
Urban Rds Sealed ‐ Reseal Roads UR Renewal 2028/29 400,000
Drainage ‐ Lightning Ridge Stormwater Drainage LR Renewal 2028/29 100,000
Collarenebri Houses ‐ Paint Buildings ‐ non‐specialised COL Renewal 2029/30 20,000
Walgett houses ‐ Painting/carpet Buildings ‐ non‐specialised WAL Renewal 2029/30 30,000
Collarenebri Hall Youth Centre Refurbish Buildings ‐ specialised COL Renewal 2029/30 50,000
Kerb & Gutter/Footpath renewals Footpaths Renewal 2029/30 275,465
Computer Equipment Replacement Office Equipment Renewal 2029/30 27,000
Office Furniture & Equipment Replacement Office Equipment Renewal 2029/30 13,000
Walgett Pool ‐ Amenities Other Structures WAL New 2029/30 40,000
Walgett Showground ‐ Bar Area Other Structures WAL Renewal 2029/30 50,000
Purchase of Vehicles, Plant & Equipment Plant & Equipment Renewal 2029/30 1,866,000
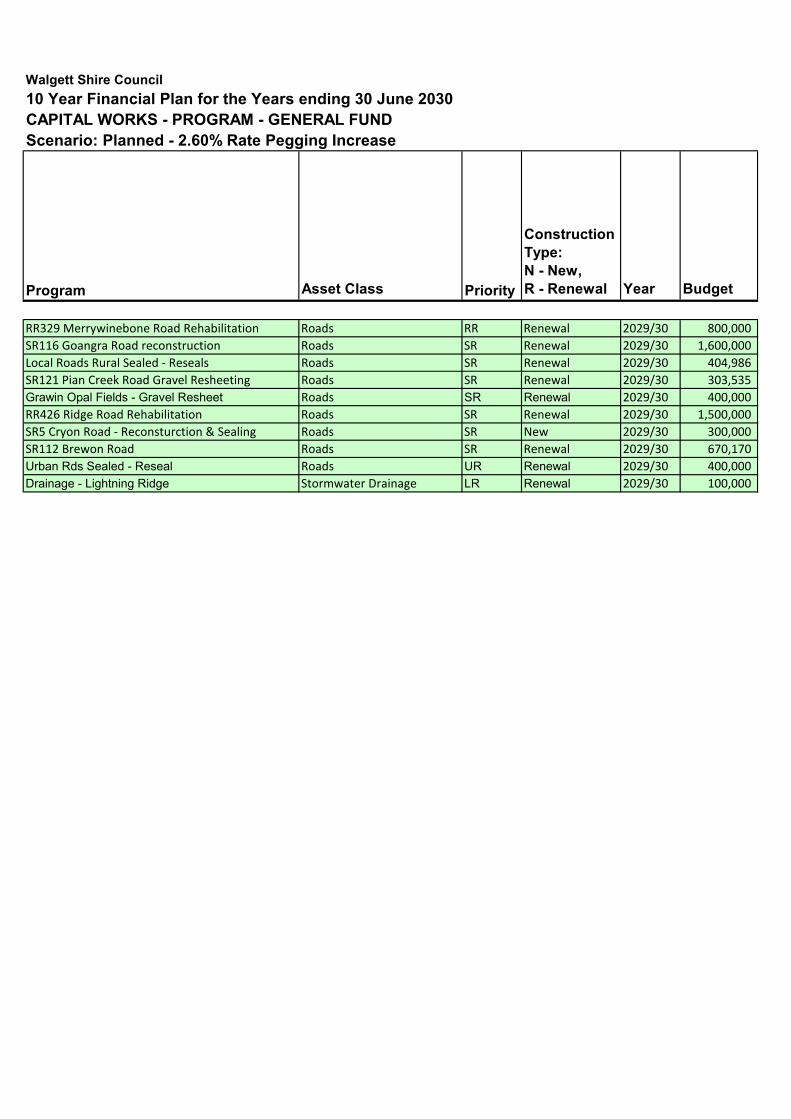
Walgett Shire Council10 Year Financial Plan for the Years ending 30 June 2030CAPITAL WORKS - PROGRAM - GENERAL FUNDScenario: Planned - 2.60% Rate Pegging Increase
Program Asset Class Priority
Construction Type:N - New,R - Renewal Year Budget
RR329 Merrywinebone Road Rehabilitation Roads RR Renewal 2029/30 800,000
SR116 Goangra Road reconstruction Roads SR Renewal 2029/30 1,600,000
Local Roads Rural Sealed ‐ Reseals Roads SR Renewal 2029/30 404,986
SR121 Pian Creek Road Gravel Resheeting Roads SR Renewal 2029/30 303,535
Grawin Opal Fields - Gravel Resheet Roads SR Renewal 2029/30 400,000
RR426 Ridge Road Rehabilitation Roads SR Renewal 2029/30 1,500,000
SR5 Cryon Road ‐ Reconsturction & Sealing Roads SR New 2029/30 300,000
SR112 Brewon Road Roads SR Renewal 2029/30 670,170
Urban Rds Sealed - Reseal Roads UR Renewal 2029/30 400,000
Drainage - Lightning Ridge Stormwater Drainage LR Renewal 2029/30 100,000
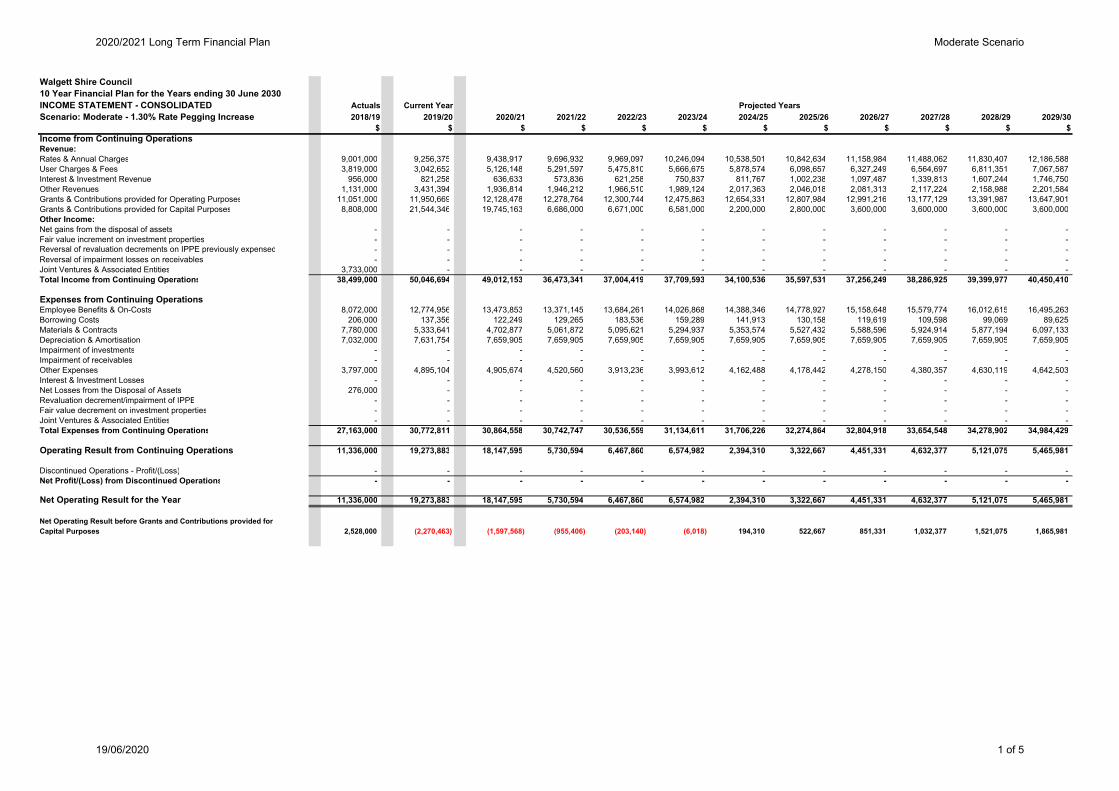
Walgett Shire Council10 Year Financial Plan for the Years ending 30 June 2030INCOME STATEMENT - CONSOLIDATED Actuals Current YearScenario: Moderate - 1.30% Rate Pegging Increase 2018/19 2019/20 2020/21 2021/22 2022/23 2023/24 2024/25 2025/26 2026/27 2027/28 2028/29 2029/30
$ $ $ $ $ $ $ $ $ $ $ $Income from Continuing OperationsRevenue:Rates & Annual Charges 9,001,000 9,256,375 9,438,917 9,696,932 9,969,097 10,246,094 10,538,501 10,842,634 11,158,984 11,488,062 11,830,407 12,186,588 User Charges & Fees 3,819,000 3,042,652 5,126,148 5,291,597 5,475,810 5,666,675 5,878,574 6,098,657 6,327,249 6,564,697 6,811,351 7,067,587 Interest & Investment Revenue 956,000 821,258 636,633 573,836 621,258 750,837 811,767 1,002,238 1,097,487 1,339,813 1,607,244 1,746,750 Other Revenues 1,131,000 3,431,394 1,936,814 1,946,212 1,966,510 1,989,124 2,017,363 2,046,018 2,081,313 2,117,224 2,158,988 2,201,584 Grants & Contributions provided for Operating Purposes 11,051,000 11,950,669 12,128,478 12,278,764 12,300,744 12,475,863 12,654,331 12,807,984 12,991,216 13,177,129 13,391,987 13,647,901 Grants & Contributions provided for Capital Purposes 8,808,000 21,544,346 19,745,163 6,686,000 6,671,000 6,581,000 2,200,000 2,800,000 3,600,000 3,600,000 3,600,000 3,600,000 Other Income:Net gains from the disposal of assets - - - - - - - - - - - - Fair value increment on investment properties - - - - - - - - - - - - Reversal of revaluation decrements on IPPE previously expensed - - - - - - - - - - - - Reversal of impairment losses on receivables - - - - - - - - - - - - Joint Ventures & Associated Entities 3,733,000 - - - - - - - - - - - Total Income from Continuing Operations 38,499,000 50,046,694 49,012,153 36,473,341 37,004,419 37,709,593 34,100,536 35,597,531 37,256,249 38,286,925 39,399,977 40,450,410
Expenses from Continuing OperationsEmployee Benefits & On-Costs 8,072,000 12,774,956 13,473,853 13,371,145 13,684,261 14,026,868 14,388,346 14,778,927 15,158,648 15,579,774 16,012,615 16,495,263 Borrowing Costs 206,000 137,356 122,249 129,265 183,536 159,289 141,913 130,158 119,619 109,598 99,069 89,625 Materials & Contracts 7,780,000 5,333,641 4,702,877 5,061,872 5,095,621 5,294,937 5,353,574 5,527,432 5,588,596 5,924,914 5,877,194 6,097,133 Depreciation & Amortisation 7,032,000 7,631,754 7,659,905 7,659,905 7,659,905 7,659,905 7,659,905 7,659,905 7,659,905 7,659,905 7,659,905 7,659,905 Impairment of investments - - - - - - - - - - - - Impairment of receivables - - - - - - - - - - - - Other Expenses 3,797,000 4,895,104 4,905,674 4,520,560 3,913,236 3,993,612 4,162,488 4,178,442 4,278,150 4,380,357 4,630,119 4,642,503 Interest & Investment Losses - - - - - - - - - - - - Net Losses from the Disposal of Assets 276,000 - - - - - - - - - - - Revaluation decrement/impairment of IPPE - - - - - - - - - - - - Fair value decrement on investment properties - - - - - - - - - - - - Joint Ventures & Associated Entities - - - - - - - - - - - - Total Expenses from Continuing Operations 27,163,000 30,772,811 30,864,558 30,742,747 30,536,559 31,134,611 31,706,226 32,274,864 32,804,918 33,654,548 34,278,902 34,984,429
Operating Result from Continuing Operations 11,336,000 19,273,883 18,147,595 5,730,594 6,467,860 6,574,982 2,394,310 3,322,667 4,451,331 4,632,377 5,121,075 5,465,981
Discontinued Operations - Profit/(Loss) - - - - - - - - - - - - Net Profit/(Loss) from Discontinued Operations - - - - - - - - - - - -
Net Operating Result for the Year 11,336,000 19,273,883 18,147,595 5,730,594 6,467,860 6,574,982 2,394,310 3,322,667 4,451,331 4,632,377 5,121,075 5,465,981
Net Operating Result before Grants and Contributions provided for Capital Purposes 2,528,000 (2,270,463) (1,597,568) (955,406) (203,140) (6,018) 194,310 522,667 851,331 1,032,377 1,521,075 1,865,981
Projected Years
2020/2021 Long Term Financial Plan Moderate Scenario
19/06/2020 1 of 5
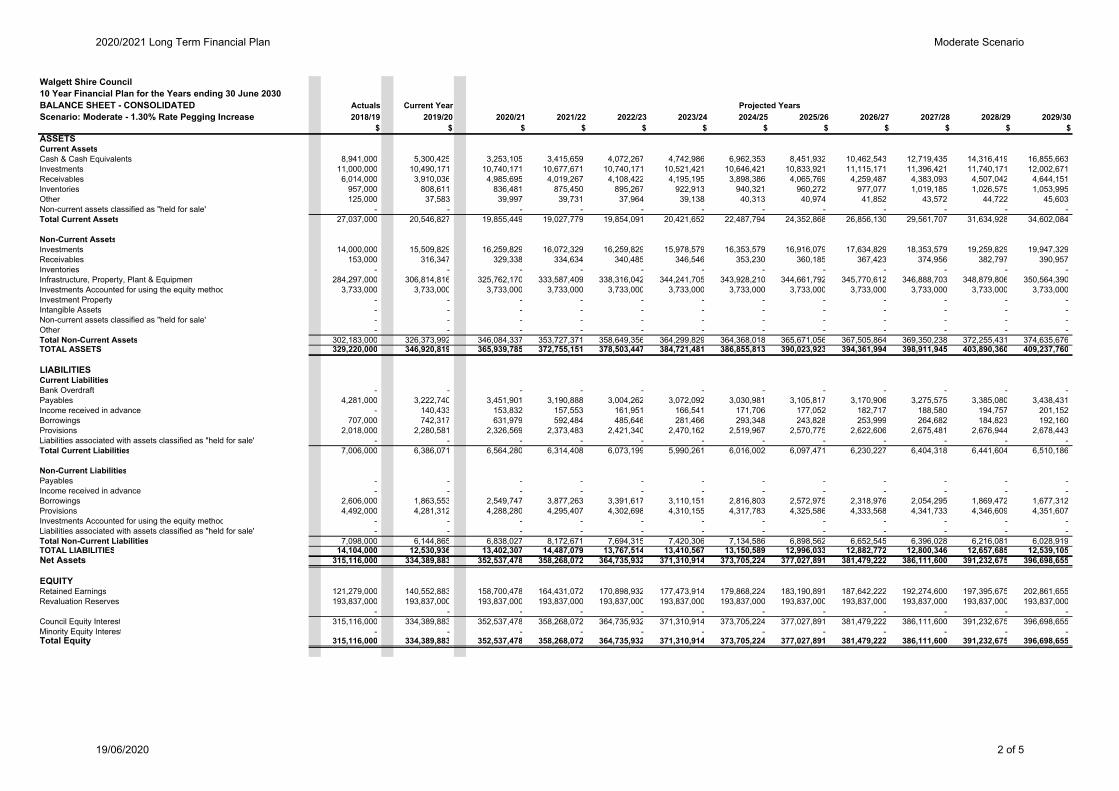
Walgett Shire Council10 Year Financial Plan for the Years ending 30 June 2030BALANCE SHEET - CONSOLIDATED Actuals Current YearScenario: Moderate - 1.30% Rate Pegging Increase 2018/19 2019/20 2020/21 2021/22 2022/23 2023/24 2024/25 2025/26 2026/27 2027/28 2028/29 2029/30
$ $ $ $ $ $ $ $ $ $ $ $ASSETSCurrent AssetsCash & Cash Equivalents 8,941,000 5,300,425 3,253,105 3,415,659 4,072,267 4,742,986 6,962,353 8,451,932 10,462,543 12,719,435 14,316,419 16,855,663 Investments 11,000,000 10,490,171 10,740,171 10,677,671 10,740,171 10,521,421 10,646,421 10,833,921 11,115,171 11,396,421 11,740,171 12,002,671 Receivables 6,014,000 3,910,036 4,985,695 4,019,267 4,108,422 4,195,195 3,898,386 4,065,769 4,259,487 4,383,093 4,507,042 4,644,151 Inventories 957,000 808,611 836,481 875,450 895,267 922,913 940,321 960,272 977,077 1,019,185 1,026,575 1,053,995 Other 125,000 37,583 39,997 39,731 37,964 39,138 40,313 40,974 41,852 43,572 44,722 45,603 Non-current assets classified as "held for sale" - - - - - - - - - - - - Total Current Assets 27,037,000 20,546,827 19,855,449 19,027,779 19,854,091 20,421,652 22,487,794 24,352,868 26,856,130 29,561,707 31,634,928 34,602,084
Non-Current AssetsInvestments 14,000,000 15,509,829 16,259,829 16,072,329 16,259,829 15,978,579 16,353,579 16,916,079 17,634,829 18,353,579 19,259,829 19,947,329 Receivables 153,000 316,347 329,338 334,634 340,485 346,546 353,230 360,185 367,423 374,956 382,797 390,957 Inventories - - - - - - - - - - - - Infrastructure, Property, Plant & Equipment 284,297,000 306,814,816 325,762,170 333,587,409 338,316,042 344,241,705 343,928,210 344,661,792 345,770,612 346,888,703 348,879,806 350,564,390 Investments Accounted for using the equity method 3,733,000 3,733,000 3,733,000 3,733,000 3,733,000 3,733,000 3,733,000 3,733,000 3,733,000 3,733,000 3,733,000 3,733,000 Investment Property - - - - - - - - - - - - Intangible Assets - - - - - - - - - - - - Non-current assets classified as "held for sale" - - - - - - - - - - - - Other - - - - - - - - - - - - Total Non-Current Assets 302,183,000 326,373,992 346,084,337 353,727,371 358,649,356 364,299,829 364,368,018 365,671,056 367,505,864 369,350,238 372,255,431 374,635,676 TOTAL ASSETS 329,220,000 346,920,819 365,939,785 372,755,151 378,503,447 384,721,481 386,855,813 390,023,923 394,361,994 398,911,945 403,890,360 409,237,760
LIABILITIESCurrent LiabilitiesBank Overdraft - - - - - - - - - - - - Payables 4,281,000 3,222,740 3,451,901 3,190,888 3,004,262 3,072,092 3,030,981 3,105,817 3,170,906 3,275,575 3,385,080 3,438,431 Income received in advance - 140,433 153,832 157,553 161,951 166,541 171,706 177,052 182,717 188,580 194,757 201,152 Borrowings 707,000 742,317 631,979 592,484 485,646 281,466 293,348 243,828 253,999 264,682 184,823 192,160 Provisions 2,018,000 2,280,581 2,326,569 2,373,483 2,421,340 2,470,162 2,519,967 2,570,775 2,622,606 2,675,481 2,676,944 2,678,443 Liabilities associated with assets classified as "held for sale" - - - - - - - - - - - - Total Current Liabilities 7,006,000 6,386,071 6,564,280 6,314,408 6,073,199 5,990,261 6,016,002 6,097,471 6,230,227 6,404,318 6,441,604 6,510,186
Non-Current LiabilitiesPayables - - - - - - - - - - - - Income received in advance - - - - - - - - - - - - Borrowings 2,606,000 1,863,553 2,549,747 3,877,263 3,391,617 3,110,151 2,816,803 2,572,975 2,318,976 2,054,295 1,869,472 1,677,312 Provisions 4,492,000 4,281,312 4,288,280 4,295,407 4,302,698 4,310,155 4,317,783 4,325,586 4,333,568 4,341,733 4,346,609 4,351,607 Investments Accounted for using the equity method - - - - - - - - - - - - Liabilities associated with assets classified as "held for sale" - - - - - - - - - - - - Total Non-Current Liabilities 7,098,000 6,144,865 6,838,027 8,172,671 7,694,315 7,420,306 7,134,586 6,898,562 6,652,545 6,396,028 6,216,081 6,028,919 TOTAL LIABILITIES 14,104,000 12,530,936 13,402,307 14,487,079 13,767,514 13,410,567 13,150,589 12,996,033 12,882,772 12,800,346 12,657,685 12,539,105 Net Assets 315,116,000 334,389,883 352,537,478 358,268,072 364,735,932 371,310,914 373,705,224 377,027,891 381,479,222 386,111,600 391,232,675 396,698,655
EQUITYRetained Earnings 121,279,000 140,552,883 158,700,478 164,431,072 170,898,932 177,473,914 179,868,224 183,190,891 187,642,222 192,274,600 197,395,675 202,861,655 Revaluation Reserves 193,837,000 193,837,000 193,837,000 193,837,000 193,837,000 193,837,000 193,837,000 193,837,000 193,837,000 193,837,000 193,837,000 193,837,000
- - - - - - - - - - - - Council Equity Interest 315,116,000 334,389,883 352,537,478 358,268,072 364,735,932 371,310,914 373,705,224 377,027,891 381,479,222 386,111,600 391,232,675 396,698,655 Minority Equity Interest - - - - - - - - - - - - Total Equity 315,116,000 334,389,883 352,537,478 358,268,072 364,735,932 371,310,914 373,705,224 377,027,891 381,479,222 386,111,600 391,232,675 396,698,655
Projected Years
2020/2021 Long Term Financial Plan Moderate Scenario
19/06/2020 2 of 5
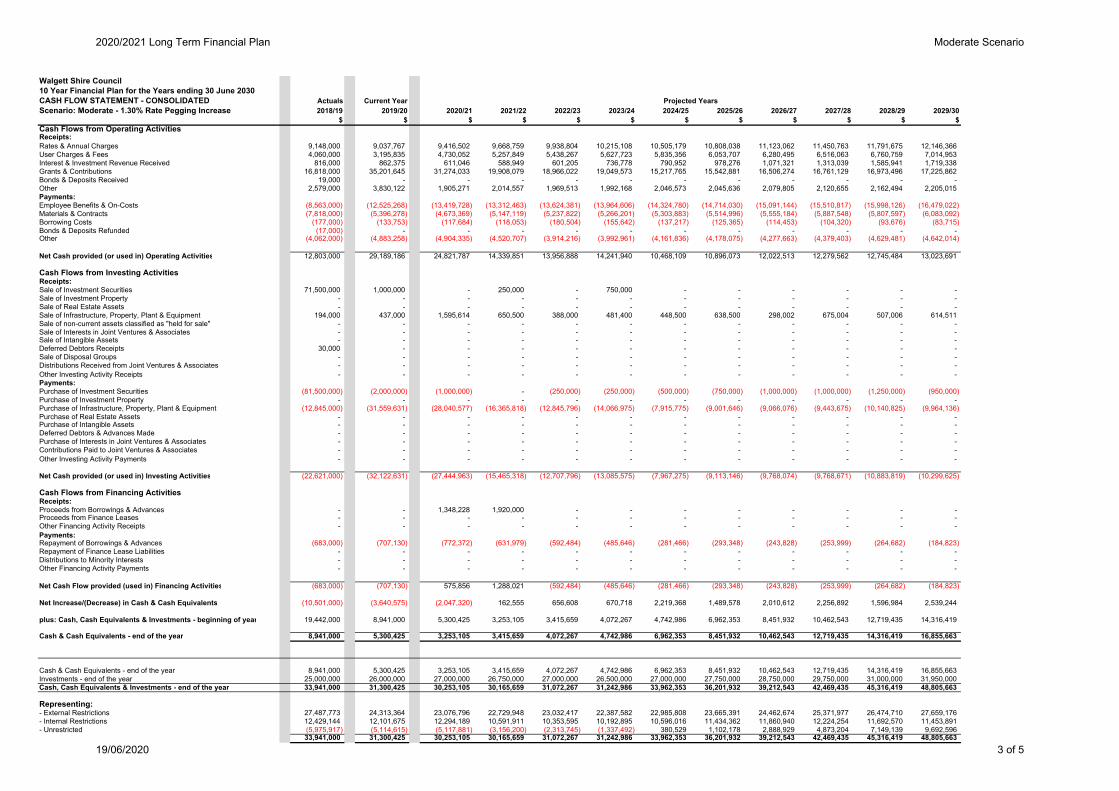
Walgett Shire Council10 Year Financial Plan for the Years ending 30 June 2030CASH FLOW STATEMENT - CONSOLIDATED Actuals Current YearScenario: Moderate - 1.30% Rate Pegging Increase 2018/19 2019/20 2020/21 2021/22 2022/23 2023/24 2024/25 2025/26 2026/27 2027/28 2028/29 2029/30
$ $ $ $ $ $ $ $ $ $ $ $Cash Flows from Operating ActivitiesReceipts:Rates & Annual Charges 9,148,000 9,037,767 9,416,502 9,668,759 9,938,804 10,215,108 10,505,179 10,808,038 11,123,062 11,450,763 11,791,675 12,146,366 User Charges & Fees 4,060,000 3,195,835 4,730,052 5,257,849 5,438,267 5,627,723 5,835,356 6,053,707 6,280,495 6,516,063 6,760,759 7,014,953 Interest & Investment Revenue Received 816,000 862,375 611,046 588,949 601,205 736,778 790,952 978,276 1,071,321 1,313,039 1,585,941 1,719,338 Grants & Contributions 16,818,000 35,201,645 31,274,033 19,908,079 18,966,022 19,049,573 15,217,765 15,542,881 16,506,274 16,761,129 16,973,496 17,225,862 Bonds & Deposits Received 19,000 - - - - - - - - - - - Other 2,579,000 3,830,122 1,905,271 2,014,557 1,969,513 1,992,168 2,046,573 2,045,636 2,079,805 2,120,655 2,162,494 2,205,015 Payments:Employee Benefits & On-Costs (8,563,000) (12,525,268) (13,419,728) (13,312,463) (13,624,381) (13,964,606) (14,324,780) (14,714,030) (15,091,144) (15,510,817) (15,998,126) (16,479,022) Materials & Contracts (7,818,000) (5,396,278) (4,673,369) (5,147,119) (5,237,822) (5,266,201) (5,303,883) (5,514,996) (5,555,184) (5,887,548) (5,807,597) (6,083,092) Borrowing Costs (177,000) (133,753) (117,684) (118,053) (180,504) (155,642) (137,217) (125,365) (114,453) (104,320) (93,676) (83,715) Bonds & Deposits Refunded (17,000) - - - - - - - - - - - Other (4,062,000) (4,883,258) (4,904,335) (4,520,707) (3,914,216) (3,992,961) (4,161,836) (4,178,075) (4,277,663) (4,379,403) (4,629,481) (4,642,014)
Net Cash provided (or used in) Operating Activities 12,803,000 29,189,186 24,821,787 14,339,851 13,956,888 14,241,940 10,468,109 10,896,073 12,022,513 12,279,562 12,745,484 13,023,691
Cash Flows from Investing ActivitiesReceipts:Sale of Investment Securities 71,500,000 1,000,000 - 250,000 - 750,000 - - - - - - Sale of Investment Property - - - - - - - - - - - - Sale of Real Estate Assets - - - - - - - - - - - - Sale of Infrastructure, Property, Plant & Equipment 194,000 437,000 1,595,614 650,500 388,000 481,400 448,500 638,500 298,002 675,004 507,006 614,511 Sale of non-current assets classified as "held for sale" - - - - - - - - - - - - Sale of Interests in Joint Ventures & Associates - - - - - - - - - - - - Sale of Intangible Assets - - - - - - - - - - - - Deferred Debtors Receipts 30,000 - - - - - - - - - - - Sale of Disposal Groups - - - - - - - - - - - - Distributions Received from Joint Ventures & Associates - - - - - - - - - - - - Other Investing Activity Receipts - - - - - - - - - - - - Payments:Purchase of Investment Securities (81,500,000) (2,000,000) (1,000,000) - (250,000) (250,000) (500,000) (750,000) (1,000,000) (1,000,000) (1,250,000) (950,000) Purchase of Investment Property - - - - - - - - - - - - Purchase of Infrastructure, Property, Plant & Equipment (12,845,000) (31,559,631) (28,040,577) (16,365,818) (12,845,796) (14,066,975) (7,915,775) (9,001,646) (9,066,076) (9,443,675) (10,140,825) (9,964,136) Purchase of Real Estate Assets - - - - - - - - - - - - Purchase of Intangible Assets - - - - - - - - - - - - Deferred Debtors & Advances Made - - - - - - - - - - - - Purchase of Interests in Joint Ventures & Associates - - - - - - - - - - - - Contributions Paid to Joint Ventures & Associates - - - - - - - - - - - - Other Investing Activity Payments - - - - - - - - - - - -
Net Cash provided (or used in) Investing Activities (22,621,000) (32,122,631) (27,444,963) (15,465,318) (12,707,796) (13,085,575) (7,967,275) (9,113,146) (9,768,074) (9,768,671) (10,883,819) (10,299,625)
Cash Flows from Financing ActivitiesReceipts:Proceeds from Borrowings & Advances - - 1,348,228 1,920,000 - - - - - - - - Proceeds from Finance Leases - - - - - - - - - - - - Other Financing Activity Receipts - - - - - - - - - - - - Payments:Repayment of Borrowings & Advances (683,000) (707,130) (772,372) (631,979) (592,484) (485,646) (281,466) (293,348) (243,828) (253,999) (264,682) (184,823) Repayment of Finance Lease Liabilities - - - - - - - - - - - - Distributions to Minority Interests - - - - - - - - - - - - Other Financing Activity Payments - - - - - - - - - - - -
Net Cash Flow provided (used in) Financing Activities (683,000) (707,130) 575,856 1,288,021 (592,484) (485,646) (281,466) (293,348) (243,828) (253,999) (264,682) (184,823)
Net Increase/(Decrease) in Cash & Cash Equivalents (10,501,000) (3,640,575) (2,047,320) 162,555 656,608 670,718 2,219,368 1,489,578 2,010,612 2,256,892 1,596,984 2,539,244
plus: Cash, Cash Equivalents & Investments - beginning of year 19,442,000 8,941,000 5,300,425 3,253,105 3,415,659 4,072,267 4,742,986 6,962,353 8,451,932 10,462,543 12,719,435 14,316,419
Cash & Cash Equivalents - end of the year 8,941,000 5,300,425 3,253,105 3,415,659 4,072,267 4,742,986 6,962,353 8,451,932 10,462,543 12,719,435 14,316,419 16,855,663
Cash & Cash Equivalents - end of the year 8,941,000 5,300,425 3,253,105 3,415,659 4,072,267 4,742,986 6,962,353 8,451,932 10,462,543 12,719,435 14,316,419 16,855,663 Investments - end of the year 25,000,000 26,000,000 27,000,000 26,750,000 27,000,000 26,500,000 27,000,000 27,750,000 28,750,000 29,750,000 31,000,000 31,950,000 Cash, Cash Equivalents & Investments - end of the year 33,941,000 31,300,425 30,253,105 30,165,659 31,072,267 31,242,986 33,962,353 36,201,932 39,212,543 42,469,435 45,316,419 48,805,663
Representing:- External Restrictions 27,487,773 24,313,364 23,076,796 22,729,948 23,032,417 22,387,582 22,985,808 23,665,391 24,462,674 25,371,977 26,474,710 27,659,176 - Internal Restrictions 12,429,144 12,101,675 12,294,189 10,591,911 10,353,595 10,192,895 10,596,016 11,434,362 11,860,940 12,224,254 11,692,570 11,453,891 - Unrestricted (5,975,917) (5,114,615) (5,117,881) (3,156,200) (2,313,745) (1,337,492) 380,529 1,102,178 2,888,929 4,873,204 7,149,139 9,692,596
33,941,000 31,300,425 30,253,105 30,165,659 31,072,267 31,242,986 33,962,353 36,201,932 39,212,543 42,469,435 45,316,419 48,805,663
Projected Years
2020/2021 Long Term Financial Plan Moderate Scenario
19/06/2020 3 of 5
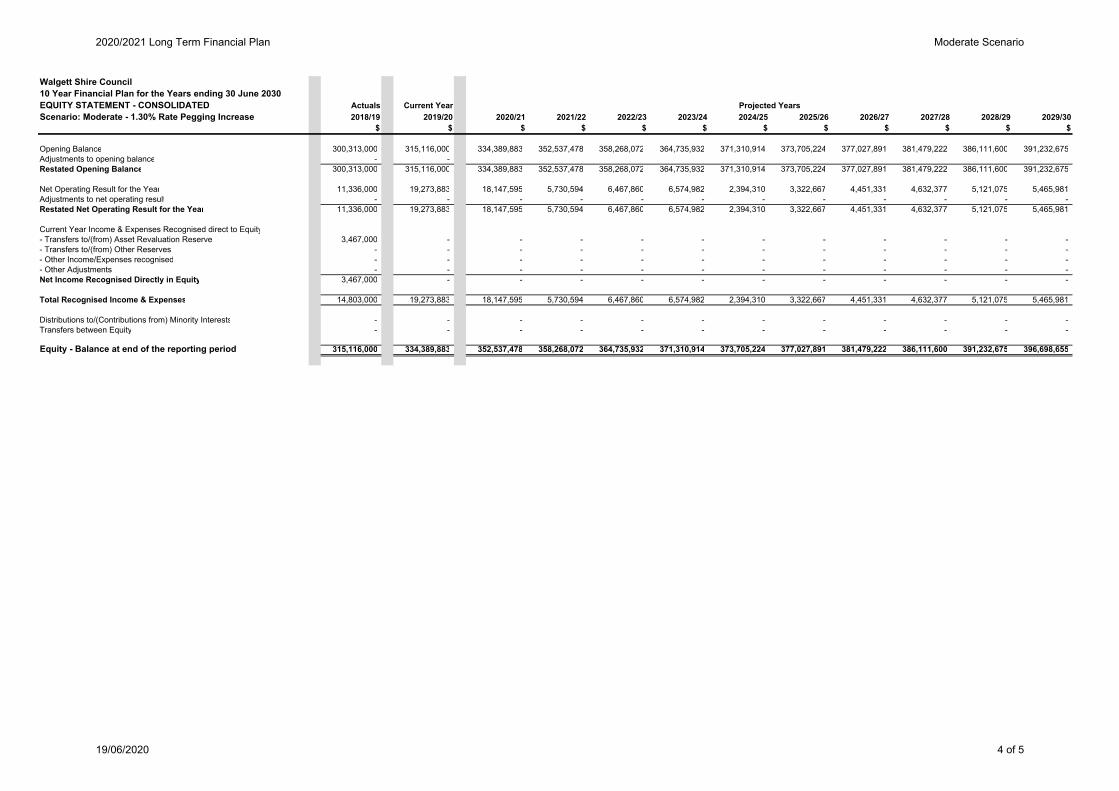
Walgett Shire Council10 Year Financial Plan for the Years ending 30 June 2030EQUITY STATEMENT - CONSOLIDATED Actuals Current YearScenario: Moderate - 1.30% Rate Pegging Increase 2018/19 2019/20 2020/21 2021/22 2022/23 2023/24 2024/25 2025/26 2026/27 2027/28 2028/29 2029/30
$ $ $ $ $ $ $ $ $ $ $ $
Opening Balance 300,313,000 315,116,000 334,389,883 352,537,478 358,268,072 364,735,932 371,310,914 373,705,224 377,027,891 381,479,222 386,111,600 391,232,675 Adjustments to opening balance - - Restated Opening Balance 300,313,000 315,116,000 334,389,883 352,537,478 358,268,072 364,735,932 371,310,914 373,705,224 377,027,891 381,479,222 386,111,600 391,232,675
Net Operating Result for the Year 11,336,000 19,273,883 18,147,595 5,730,594 6,467,860 6,574,982 2,394,310 3,322,667 4,451,331 4,632,377 5,121,075 5,465,981 Adjustments to net operating result - - - - - - - - - - - - Restated Net Operating Result for the Year 11,336,000 19,273,883 18,147,595 5,730,594 6,467,860 6,574,982 2,394,310 3,322,667 4,451,331 4,632,377 5,121,075 5,465,981
Current Year Income & Expenses Recognised direct to Equity- Transfers to/(from) Asset Revaluation Reserve 3,467,000 - - - - - - - - - - - - Transfers to/(from) Other Reserves - - - - - - - - - - - - - Other Income/Expenses recognised - - - - - - - - - - - - - Other Adjustments - - - - - - - - - - - - Net Income Recognised Directly in Equity 3,467,000 - - - - - - - - - - -
Total Recognised Income & Expenses 14,803,000 19,273,883 18,147,595 5,730,594 6,467,860 6,574,982 2,394,310 3,322,667 4,451,331 4,632,377 5,121,075 5,465,981
Distributions to/(Contributions from) Minority Interests - - - - - - - - - - - - Transfers between Equity - - - - - - - - - - - -
Equity - Balance at end of the reporting period 315,116,000 334,389,883 352,537,478 358,268,072 364,735,932 371,310,914 373,705,224 377,027,891 381,479,222 386,111,600 391,232,675 396,698,655
Projected Years
2020/2021 Long Term Financial Plan Moderate Scenario
19/06/2020 4 of 5
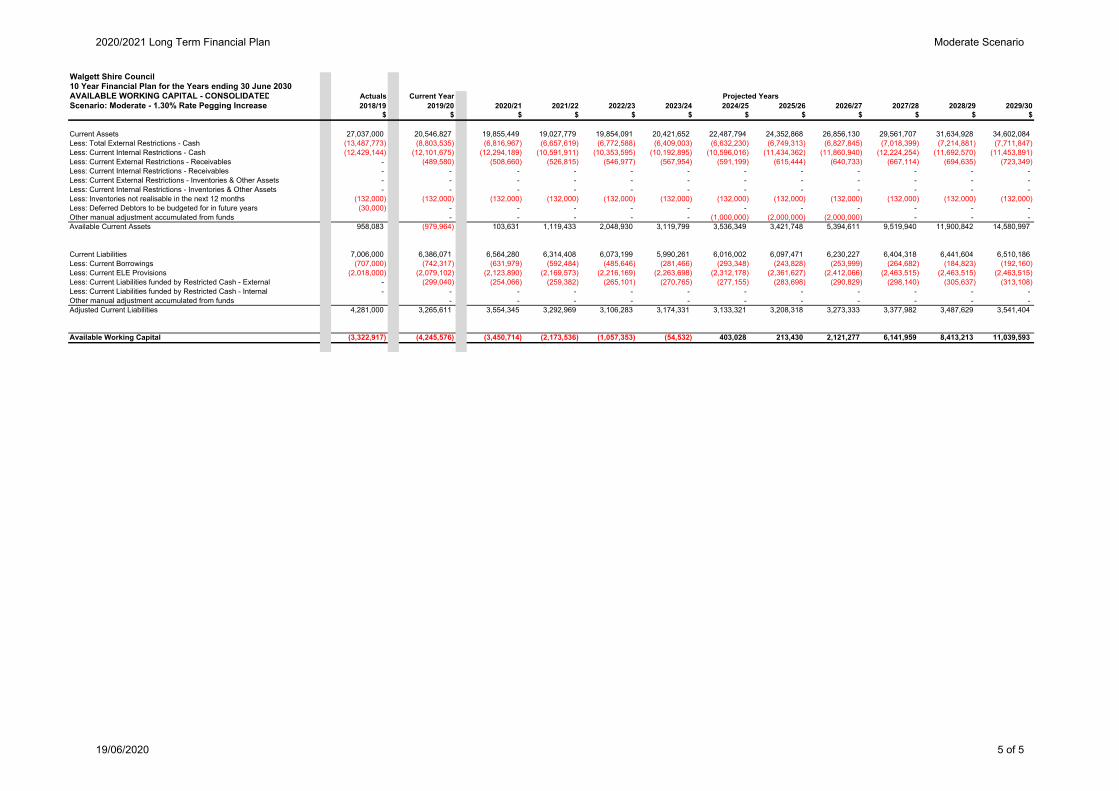
Walgett Shire Council10 Year Financial Plan for the Years ending 30 June 2030AVAILABLE WORKING CAPITAL - CONSOLIDATED Actuals Current YearScenario: Moderate - 1.30% Rate Pegging Increase 2018/19 2019/20 2020/21 2021/22 2022/23 2023/24 2024/25 2025/26 2026/27 2027/28 2028/29 2029/30
$ $ $ $ $ $ $ $ $ $ $ $
Current Assets 27,037,000 20,546,827 19,855,449 19,027,779 19,854,091 20,421,652 22,487,794 24,352,868 26,856,130 29,561,707 31,634,928 34,602,084 Less: Total External Restrictions - Cash (13,487,773) (8,803,535) (6,816,967) (6,657,619) (6,772,588) (6,409,003) (6,632,230) (6,749,313) (6,827,845) (7,018,399) (7,214,881) (7,711,847) Less: Current Internal Restrictions - Cash (12,429,144) (12,101,675) (12,294,189) (10,591,911) (10,353,595) (10,192,895) (10,596,016) (11,434,362) (11,860,940) (12,224,254) (11,692,570) (11,453,891) Less: Current External Restrictions - Receivables - (489,580) (508,660) (526,815) (546,977) (567,954) (591,199) (615,444) (640,733) (667,114) (694,635) (723,349) Less: Current Internal Restrictions - Receivables - - - - - - - - - - - - Less: Current External Restrictions - Inventories & Other Assets - - - - - - - - - - - - Less: Current Internal Restrictions - Inventories & Other Assets - - - - - - - - - - - - Less: Inventories not realisable in the next 12 months (132,000) (132,000) (132,000) (132,000) (132,000) (132,000) (132,000) (132,000) (132,000) (132,000) (132,000) (132,000) Less: Deferred Debtors to be budgeted for in future years (30,000) - - - - - - - - - - - Other manual adjustment accumulated from funds - - - - - (1,000,000) (2,000,000) (2,000,000) - - - Available Current Assets 958,083 (979,964) 103,631 1,119,433 2,048,930 3,119,799 3,536,349 3,421,748 5,394,611 9,519,940 11,900,842 14,580,997
Current Liabilities 7,006,000 6,386,071 6,564,280 6,314,408 6,073,199 5,990,261 6,016,002 6,097,471 6,230,227 6,404,318 6,441,604 6,510,186 Less: Current Borrowings (707,000) (742,317) (631,979) (592,484) (485,646) (281,466) (293,348) (243,828) (253,999) (264,682) (184,823) (192,160) Less: Current ELE Provisions (2,018,000) (2,079,102) (2,123,890) (2,169,573) (2,216,169) (2,263,698) (2,312,178) (2,361,627) (2,412,066) (2,463,515) (2,463,515) (2,463,515) Less: Current Liabilities funded by Restricted Cash - External - (299,040) (254,066) (259,382) (265,101) (270,765) (277,155) (283,698) (290,829) (298,140) (305,637) (313,108) Less: Current Liabilities funded by Restricted Cash - Internal - - - - - - - - - - - - Other manual adjustment accumulated from funds - - - - - - - - - - - Adjusted Current Liabilities 4,281,000 3,265,611 3,554,345 3,292,969 3,106,283 3,174,331 3,133,321 3,208,318 3,273,333 3,377,982 3,487,629 3,541,404
Available Working Capital (3,322,917) (4,245,576) (3,450,714) (2,173,536) (1,057,353) (54,532) 403,028 213,430 2,121,277 6,141,959 8,413,213 11,039,593
Projected Years
2020/2021 Long Term Financial Plan Moderate Scenario
19/06/2020 5 of 5

Walgett Shire Council10 Year Financial Plan for the Years ending 30 June 2030INCOME STATEMENT - CONSOLIDATED Actuals Current YearScenario: Planned - 2.60% Rate Pegging Increase 2018/19 2019/20 2020/21 2021/22 2022/23 2023/24 2024/25 2025/26 2026/27 2027/28 2028/29 2029/30
$ $ $ $ $ $ $ $ $ $ $ $Income from Continuing OperationsRevenue:Rates & Annual Charges 9,001,000 9,256,375 9,365,307 9,621,444 9,891,720 10,166,818 10,457,320 10,759,465 11,073,736 11,400,640 11,740,714 12,094,518 User Charges & Fees 3,819,000 3,042,652 5,126,148 5,291,597 5,475,810 5,666,675 5,878,574 6,098,657 6,327,249 6,564,697 6,811,351 7,067,587 Interest & Investment Revenue 956,000 821,258 636,633 573,836 621,258 750,837 811,767 1,002,238 1,097,487 1,339,813 1,607,244 1,746,750 Other Revenues 1,131,000 3,431,394 1,936,814 1,946,212 1,966,510 1,989,124 2,017,363 2,046,018 2,081,313 2,117,224 2,158,988 2,201,584 Grants & Contributions provided for Operating Purposes 11,051,000 11,950,669 12,128,478 12,278,764 12,300,744 12,475,863 12,654,331 12,807,984 12,991,216 13,177,129 13,391,987 13,647,901 Grants & Contributions provided for Capital Purposes 8,808,000 21,544,346 19,745,163 6,686,000 6,671,000 6,581,000 2,200,000 2,800,000 3,600,000 3,600,000 3,600,000 3,600,000 Other Income:Net gains from the disposal of assets - - - - - - - - - - - - Fair value increment on investment properties - - - - - - - - - - - - Reversal of revaluation decrements on IPPE previously expensed - - - - - - - - - - - - Reversal of impairment losses on receivables - - - - - - - - - - - - Joint Ventures & Associated Entities 3,733,000 - - - - - - - - - - - Total Income from Continuing Operations 38,499,000 50,046,694 48,938,543 36,397,853 36,927,042 37,630,317 34,019,355 35,514,362 37,171,001 38,199,503 39,310,284 40,358,340
Expenses from Continuing OperationsEmployee Benefits & On-Costs 8,072,000 12,774,956 13,473,853 13,371,145 13,684,261 14,026,868 14,388,346 14,778,927 15,158,648 15,579,774 16,012,615 16,495,263 Borrowing Costs 206,000 137,356 122,249 129,265 183,536 159,289 141,913 130,158 119,619 109,598 99,069 89,625 Materials & Contracts 7,780,000 5,333,641 4,702,877 5,061,872 5,095,621 5,294,937 5,353,574 5,527,432 5,588,596 5,924,914 5,877,194 6,097,133 Depreciation & Amortisation 7,032,000 7,631,754 7,659,905 7,659,905 7,659,905 7,659,905 7,659,905 7,659,905 7,659,905 7,659,905 7,659,905 7,659,905 Impairment of investments - - - - - - - - - - - - Impairment of receivables - - - - - - - - - - - - Other Expenses 3,797,000 4,895,104 4,905,674 4,520,560 3,913,236 3,993,612 4,162,488 4,178,442 4,278,150 4,380,357 4,630,119 4,642,503 Interest & Investment Losses - - - - - - - - - - - - Net Losses from the Disposal of Assets 276,000 - - - - - - - - - - - Revaluation decrement/impairment of IPPE - - - - - - - - - - - - Fair value decrement on investment properties - - - - - - - - - - - - Joint Ventures & Associated Entities - - - - - - - - - - - - Total Expenses from Continuing Operations 27,163,000 30,772,811 30,864,558 30,742,747 30,536,559 31,134,611 31,706,226 32,274,864 32,804,918 33,654,548 34,278,902 34,984,429
Operating Result from Continuing Operations 11,336,000 19,273,883 18,073,985 5,655,106 6,390,483 6,495,706 2,313,129 3,239,498 4,366,083 4,544,955 5,031,382 5,373,911
Discontinued Operations - Profit/(Loss) - - - - - - - - - - - - Net Profit/(Loss) from Discontinued Operations - - - - - - - - - - - -
Net Operating Result for the Year 11,336,000 19,273,883 18,073,985 5,655,106 6,390,483 6,495,706 2,313,129 3,239,498 4,366,083 4,544,955 5,031,382 5,373,911
Net Operating Result before Grants and Contributions provided for Capital Purposes 2,528,000 (2,270,463) (1,671,178) (1,030,894) (280,517) (85,294) 113,129 439,498 766,083 944,955 1,431,382 1,773,911
Projected Years
2020 Long Term Financial Plan Conservative Scenario
19/06/2020 1 of 5
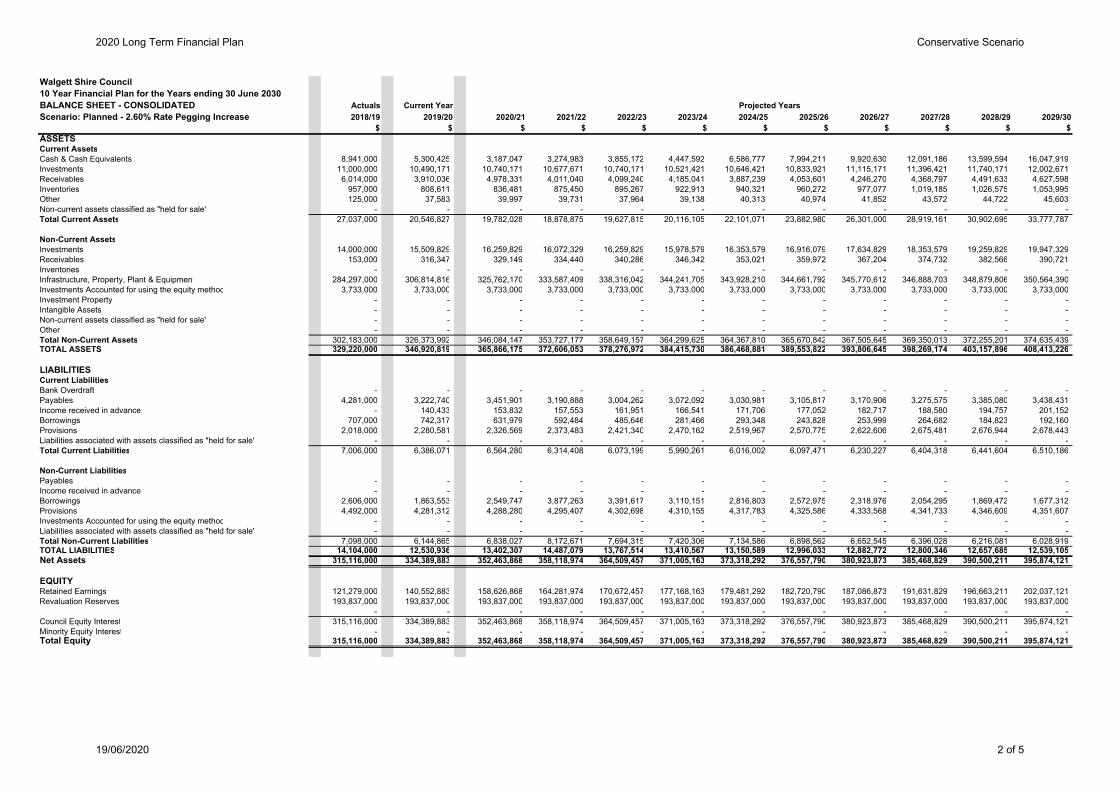
Walgett Shire Council10 Year Financial Plan for the Years ending 30 June 2030BALANCE SHEET - CONSOLIDATED Actuals Current YearScenario: Planned - 2.60% Rate Pegging Increase 2018/19 2019/20 2020/21 2021/22 2022/23 2023/24 2024/25 2025/26 2026/27 2027/28 2028/29 2029/30
$ $ $ $ $ $ $ $ $ $ $ $ASSETSCurrent AssetsCash & Cash Equivalents 8,941,000 5,300,425 3,187,047 3,274,983 3,855,172 4,447,592 6,586,777 7,994,211 9,920,630 12,091,186 13,599,594 16,047,919 Investments 11,000,000 10,490,171 10,740,171 10,677,671 10,740,171 10,521,421 10,646,421 10,833,921 11,115,171 11,396,421 11,740,171 12,002,671 Receivables 6,014,000 3,910,036 4,978,331 4,011,040 4,099,240 4,185,041 3,887,239 4,053,601 4,246,270 4,368,797 4,491,633 4,627,598 Inventories 957,000 808,611 836,481 875,450 895,267 922,913 940,321 960,272 977,077 1,019,185 1,026,575 1,053,995 Other 125,000 37,583 39,997 39,731 37,964 39,138 40,313 40,974 41,852 43,572 44,722 45,603 Non-current assets classified as "held for sale" - - - - - - - - - - - - Total Current Assets 27,037,000 20,546,827 19,782,028 18,878,875 19,627,815 20,116,105 22,101,071 23,882,980 26,301,000 28,919,161 30,902,695 33,777,787
Non-Current AssetsInvestments 14,000,000 15,509,829 16,259,829 16,072,329 16,259,829 15,978,579 16,353,579 16,916,079 17,634,829 18,353,579 19,259,829 19,947,329 Receivables 153,000 316,347 329,149 334,440 340,286 346,342 353,021 359,972 367,204 374,732 382,566 390,721 Inventories - - - - - - - - - - - - Infrastructure, Property, Plant & Equipment 284,297,000 306,814,816 325,762,170 333,587,409 338,316,042 344,241,705 343,928,210 344,661,792 345,770,612 346,888,703 348,879,806 350,564,390 Investments Accounted for using the equity method 3,733,000 3,733,000 3,733,000 3,733,000 3,733,000 3,733,000 3,733,000 3,733,000 3,733,000 3,733,000 3,733,000 3,733,000 Investment Property - - - - - - - - - - - - Intangible Assets - - - - - - - - - - - - Non-current assets classified as "held for sale" - - - - - - - - - - - - Other - - - - - - - - - - - - Total Non-Current Assets 302,183,000 326,373,992 346,084,147 353,727,177 358,649,157 364,299,625 364,367,810 365,670,842 367,505,645 369,350,013 372,255,201 374,635,439 TOTAL ASSETS 329,220,000 346,920,819 365,866,175 372,606,053 378,276,972 384,415,730 386,468,881 389,553,822 393,806,645 398,269,174 403,157,896 408,413,226
LIABILITIESCurrent LiabilitiesBank Overdraft - - - - - - - - - - - - Payables 4,281,000 3,222,740 3,451,901 3,190,888 3,004,262 3,072,092 3,030,981 3,105,817 3,170,906 3,275,575 3,385,080 3,438,431 Income received in advance - 140,433 153,832 157,553 161,951 166,541 171,706 177,052 182,717 188,580 194,757 201,152 Borrowings 707,000 742,317 631,979 592,484 485,646 281,466 293,348 243,828 253,999 264,682 184,823 192,160 Provisions 2,018,000 2,280,581 2,326,569 2,373,483 2,421,340 2,470,162 2,519,967 2,570,775 2,622,606 2,675,481 2,676,944 2,678,443 Liabilities associated with assets classified as "held for sale" - - - - - - - - - - - - Total Current Liabilities 7,006,000 6,386,071 6,564,280 6,314,408 6,073,199 5,990,261 6,016,002 6,097,471 6,230,227 6,404,318 6,441,604 6,510,186
Non-Current LiabilitiesPayables - - - - - - - - - - - - Income received in advance - - - - - - - - - - - - Borrowings 2,606,000 1,863,553 2,549,747 3,877,263 3,391,617 3,110,151 2,816,803 2,572,975 2,318,976 2,054,295 1,869,472 1,677,312 Provisions 4,492,000 4,281,312 4,288,280 4,295,407 4,302,698 4,310,155 4,317,783 4,325,586 4,333,568 4,341,733 4,346,609 4,351,607 Investments Accounted for using the equity method - - - - - - - - - - - - Liabilities associated with assets classified as "held for sale" - - - - - - - - - - - - Total Non-Current Liabilities 7,098,000 6,144,865 6,838,027 8,172,671 7,694,315 7,420,306 7,134,586 6,898,562 6,652,545 6,396,028 6,216,081 6,028,919 TOTAL LIABILITIES 14,104,000 12,530,936 13,402,307 14,487,079 13,767,514 13,410,567 13,150,589 12,996,033 12,882,772 12,800,346 12,657,685 12,539,105 Net Assets 315,116,000 334,389,883 352,463,868 358,118,974 364,509,457 371,005,163 373,318,292 376,557,790 380,923,873 385,468,829 390,500,211 395,874,121
EQUITYRetained Earnings 121,279,000 140,552,883 158,626,868 164,281,974 170,672,457 177,168,163 179,481,292 182,720,790 187,086,873 191,631,829 196,663,211 202,037,121 Revaluation Reserves 193,837,000 193,837,000 193,837,000 193,837,000 193,837,000 193,837,000 193,837,000 193,837,000 193,837,000 193,837,000 193,837,000 193,837,000
- - - - - - - - - - - - Council Equity Interest 315,116,000 334,389,883 352,463,868 358,118,974 364,509,457 371,005,163 373,318,292 376,557,790 380,923,873 385,468,829 390,500,211 395,874,121 Minority Equity Interest - - - - - - - - - - - - Total Equity 315,116,000 334,389,883 352,463,868 358,118,974 364,509,457 371,005,163 373,318,292 376,557,790 380,923,873 385,468,829 390,500,211 395,874,121
Projected Years
2020 Long Term Financial Plan Conservative Scenario
19/06/2020 2 of 5
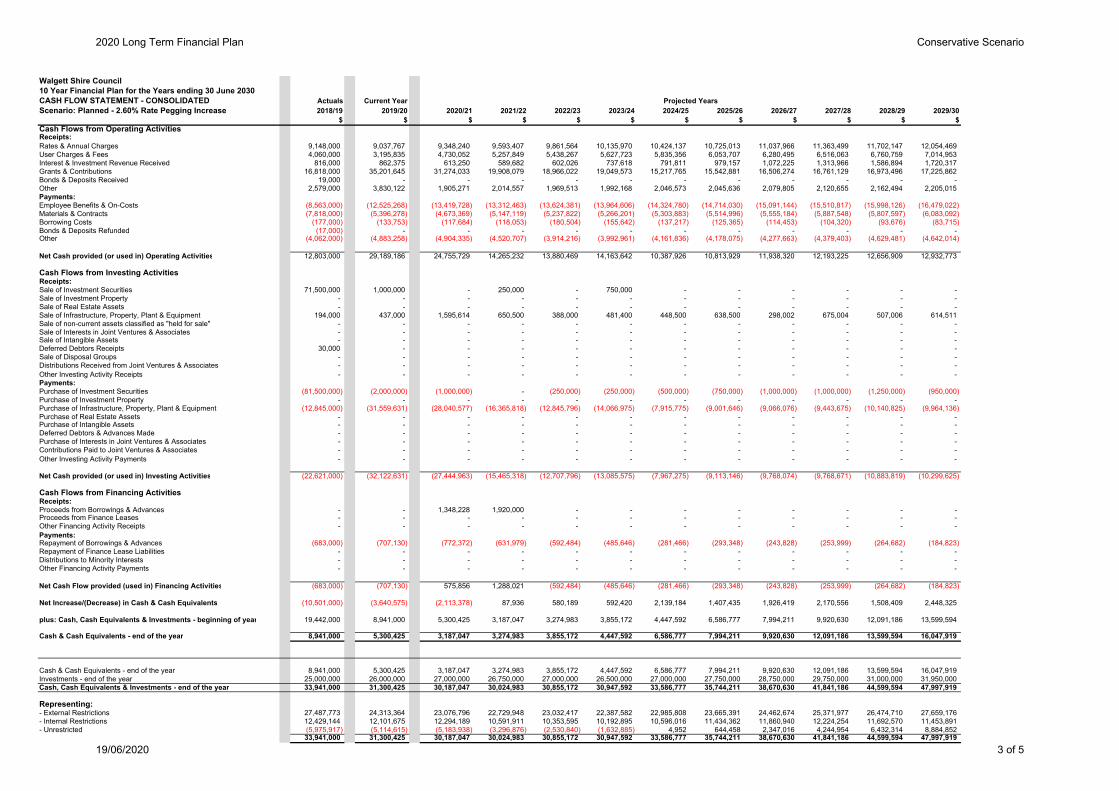
Walgett Shire Council10 Year Financial Plan for the Years ending 30 June 2030CASH FLOW STATEMENT - CONSOLIDATED Actuals Current YearScenario: Planned - 2.60% Rate Pegging Increase 2018/19 2019/20 2020/21 2021/22 2022/23 2023/24 2024/25 2025/26 2026/27 2027/28 2028/29 2029/30
$ $ $ $ $ $ $ $ $ $ $ $Cash Flows from Operating ActivitiesReceipts:Rates & Annual Charges 9,148,000 9,037,767 9,348,240 9,593,407 9,861,564 10,135,970 10,424,137 10,725,013 11,037,966 11,363,499 11,702,147 12,054,469 User Charges & Fees 4,060,000 3,195,835 4,730,052 5,257,849 5,438,267 5,627,723 5,835,356 6,053,707 6,280,495 6,516,063 6,760,759 7,014,953 Interest & Investment Revenue Received 816,000 862,375 613,250 589,682 602,026 737,618 791,811 979,157 1,072,225 1,313,966 1,586,894 1,720,317 Grants & Contributions 16,818,000 35,201,645 31,274,033 19,908,079 18,966,022 19,049,573 15,217,765 15,542,881 16,506,274 16,761,129 16,973,496 17,225,862 Bonds & Deposits Received 19,000 - - - - - - - - - - - Other 2,579,000 3,830,122 1,905,271 2,014,557 1,969,513 1,992,168 2,046,573 2,045,636 2,079,805 2,120,655 2,162,494 2,205,015 Payments:Employee Benefits & On-Costs (8,563,000) (12,525,268) (13,419,728) (13,312,463) (13,624,381) (13,964,606) (14,324,780) (14,714,030) (15,091,144) (15,510,817) (15,998,126) (16,479,022) Materials & Contracts (7,818,000) (5,396,278) (4,673,369) (5,147,119) (5,237,822) (5,266,201) (5,303,883) (5,514,996) (5,555,184) (5,887,548) (5,807,597) (6,083,092) Borrowing Costs (177,000) (133,753) (117,684) (118,053) (180,504) (155,642) (137,217) (125,365) (114,453) (104,320) (93,676) (83,715) Bonds & Deposits Refunded (17,000) - - - - - - - - - - - Other (4,062,000) (4,883,258) (4,904,335) (4,520,707) (3,914,216) (3,992,961) (4,161,836) (4,178,075) (4,277,663) (4,379,403) (4,629,481) (4,642,014)
Net Cash provided (or used in) Operating Activities 12,803,000 29,189,186 24,755,729 14,265,232 13,880,469 14,163,642 10,387,926 10,813,929 11,938,320 12,193,225 12,656,909 12,932,773
Cash Flows from Investing ActivitiesReceipts:Sale of Investment Securities 71,500,000 1,000,000 - 250,000 - 750,000 - - - - - - Sale of Investment Property - - - - - - - - - - - - Sale of Real Estate Assets - - - - - - - - - - - - Sale of Infrastructure, Property, Plant & Equipment 194,000 437,000 1,595,614 650,500 388,000 481,400 448,500 638,500 298,002 675,004 507,006 614,511 Sale of non-current assets classified as "held for sale" - - - - - - - - - - - - Sale of Interests in Joint Ventures & Associates - - - - - - - - - - - - Sale of Intangible Assets - - - - - - - - - - - - Deferred Debtors Receipts 30,000 - - - - - - - - - - - Sale of Disposal Groups - - - - - - - - - - - - Distributions Received from Joint Ventures & Associates - - - - - - - - - - - - Other Investing Activity Receipts - - - - - - - - - - - - Payments:Purchase of Investment Securities (81,500,000) (2,000,000) (1,000,000) - (250,000) (250,000) (500,000) (750,000) (1,000,000) (1,000,000) (1,250,000) (950,000) Purchase of Investment Property - - - - - - - - - - - - Purchase of Infrastructure, Property, Plant & Equipment (12,845,000) (31,559,631) (28,040,577) (16,365,818) (12,845,796) (14,066,975) (7,915,775) (9,001,646) (9,066,076) (9,443,675) (10,140,825) (9,964,136) Purchase of Real Estate Assets - - - - - - - - - - - - Purchase of Intangible Assets - - - - - - - - - - - - Deferred Debtors & Advances Made - - - - - - - - - - - - Purchase of Interests in Joint Ventures & Associates - - - - - - - - - - - - Contributions Paid to Joint Ventures & Associates - - - - - - - - - - - - Other Investing Activity Payments - - - - - - - - - - - -
Net Cash provided (or used in) Investing Activities (22,621,000) (32,122,631) (27,444,963) (15,465,318) (12,707,796) (13,085,575) (7,967,275) (9,113,146) (9,768,074) (9,768,671) (10,883,819) (10,299,625)
Cash Flows from Financing ActivitiesReceipts:Proceeds from Borrowings & Advances - - 1,348,228 1,920,000 - - - - - - - - Proceeds from Finance Leases - - - - - - - - - - - - Other Financing Activity Receipts - - - - - - - - - - - - Payments:Repayment of Borrowings & Advances (683,000) (707,130) (772,372) (631,979) (592,484) (485,646) (281,466) (293,348) (243,828) (253,999) (264,682) (184,823) Repayment of Finance Lease Liabilities - - - - - - - - - - - - Distributions to Minority Interests - - - - - - - - - - - - Other Financing Activity Payments - - - - - - - - - - - -
Net Cash Flow provided (used in) Financing Activities (683,000) (707,130) 575,856 1,288,021 (592,484) (485,646) (281,466) (293,348) (243,828) (253,999) (264,682) (184,823)
Net Increase/(Decrease) in Cash & Cash Equivalents (10,501,000) (3,640,575) (2,113,378) 87,936 580,189 592,420 2,139,184 1,407,435 1,926,419 2,170,556 1,508,409 2,448,325
plus: Cash, Cash Equivalents & Investments - beginning of year 19,442,000 8,941,000 5,300,425 3,187,047 3,274,983 3,855,172 4,447,592 6,586,777 7,994,211 9,920,630 12,091,186 13,599,594
Cash & Cash Equivalents - end of the year 8,941,000 5,300,425 3,187,047 3,274,983 3,855,172 4,447,592 6,586,777 7,994,211 9,920,630 12,091,186 13,599,594 16,047,919
Cash & Cash Equivalents - end of the year 8,941,000 5,300,425 3,187,047 3,274,983 3,855,172 4,447,592 6,586,777 7,994,211 9,920,630 12,091,186 13,599,594 16,047,919 Investments - end of the year 25,000,000 26,000,000 27,000,000 26,750,000 27,000,000 26,500,000 27,000,000 27,750,000 28,750,000 29,750,000 31,000,000 31,950,000 Cash, Cash Equivalents & Investments - end of the year 33,941,000 31,300,425 30,187,047 30,024,983 30,855,172 30,947,592 33,586,777 35,744,211 38,670,630 41,841,186 44,599,594 47,997,919
Representing:- External Restrictions 27,487,773 24,313,364 23,076,796 22,729,948 23,032,417 22,387,582 22,985,808 23,665,391 24,462,674 25,371,977 26,474,710 27,659,176 - Internal Restrictions 12,429,144 12,101,675 12,294,189 10,591,911 10,353,595 10,192,895 10,596,016 11,434,362 11,860,940 12,224,254 11,692,570 11,453,891 - Unrestricted (5,975,917) (5,114,615) (5,183,938) (3,296,876) (2,530,840) (1,632,885) 4,952 644,458 2,347,016 4,244,954 6,432,314 8,884,852
33,941,000 31,300,425 30,187,047 30,024,983 30,855,172 30,947,592 33,586,777 35,744,211 38,670,630 41,841,186 44,599,594 47,997,919
Projected Years
2020 Long Term Financial Plan Conservative Scenario
19/06/2020 3 of 5
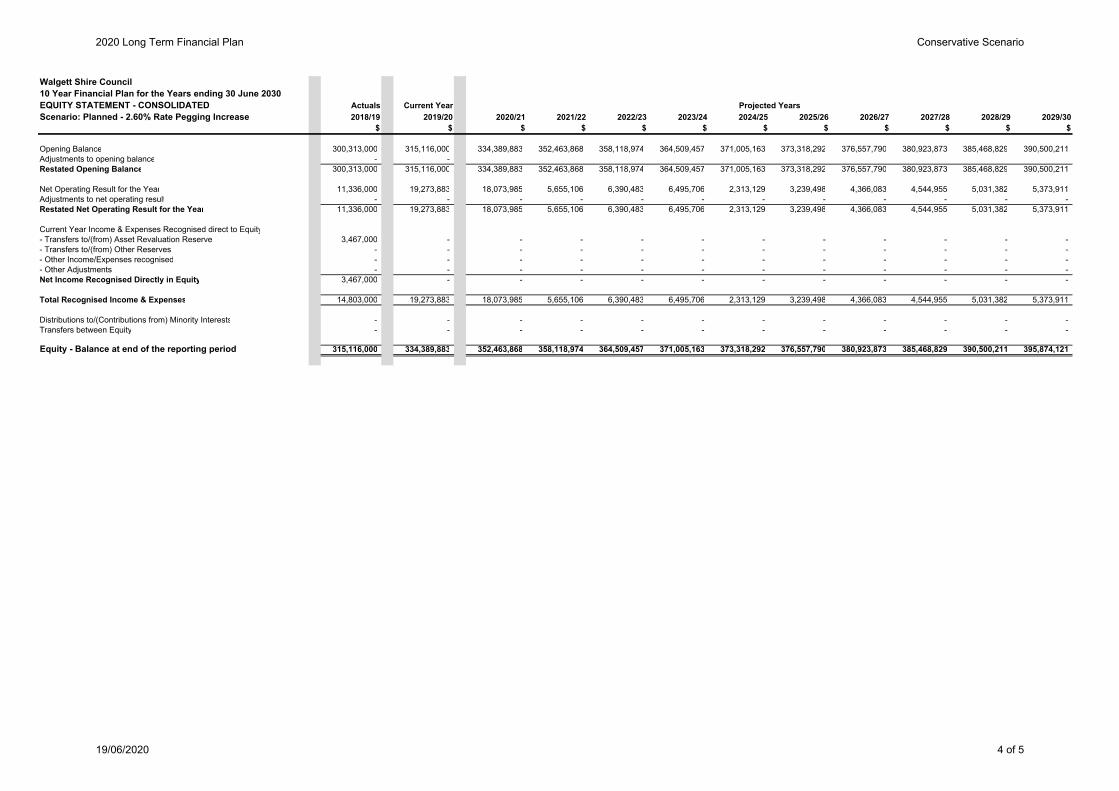
Walgett Shire Council10 Year Financial Plan for the Years ending 30 June 2030EQUITY STATEMENT - CONSOLIDATED Actuals Current YearScenario: Planned - 2.60% Rate Pegging Increase 2018/19 2019/20 2020/21 2021/22 2022/23 2023/24 2024/25 2025/26 2026/27 2027/28 2028/29 2029/30
$ $ $ $ $ $ $ $ $ $ $ $
Opening Balance 300,313,000 315,116,000 334,389,883 352,463,868 358,118,974 364,509,457 371,005,163 373,318,292 376,557,790 380,923,873 385,468,829 390,500,211 Adjustments to opening balance - - Restated Opening Balance 300,313,000 315,116,000 334,389,883 352,463,868 358,118,974 364,509,457 371,005,163 373,318,292 376,557,790 380,923,873 385,468,829 390,500,211
Net Operating Result for the Year 11,336,000 19,273,883 18,073,985 5,655,106 6,390,483 6,495,706 2,313,129 3,239,498 4,366,083 4,544,955 5,031,382 5,373,911 Adjustments to net operating result - - - - - - - - - - - - Restated Net Operating Result for the Year 11,336,000 19,273,883 18,073,985 5,655,106 6,390,483 6,495,706 2,313,129 3,239,498 4,366,083 4,544,955 5,031,382 5,373,911
Current Year Income & Expenses Recognised direct to Equity- Transfers to/(from) Asset Revaluation Reserve 3,467,000 - - - - - - - - - - - - Transfers to/(from) Other Reserves - - - - - - - - - - - - - Other Income/Expenses recognised - - - - - - - - - - - - - Other Adjustments - - - - - - - - - - - - Net Income Recognised Directly in Equity 3,467,000 - - - - - - - - - - -
Total Recognised Income & Expenses 14,803,000 19,273,883 18,073,985 5,655,106 6,390,483 6,495,706 2,313,129 3,239,498 4,366,083 4,544,955 5,031,382 5,373,911
Distributions to/(Contributions from) Minority Interests - - - - - - - - - - - - Transfers between Equity - - - - - - - - - - - -
Equity - Balance at end of the reporting period 315,116,000 334,389,883 352,463,868 358,118,974 364,509,457 371,005,163 373,318,292 376,557,790 380,923,873 385,468,829 390,500,211 395,874,121
Projected Years
2020 Long Term Financial Plan Conservative Scenario
19/06/2020 4 of 5
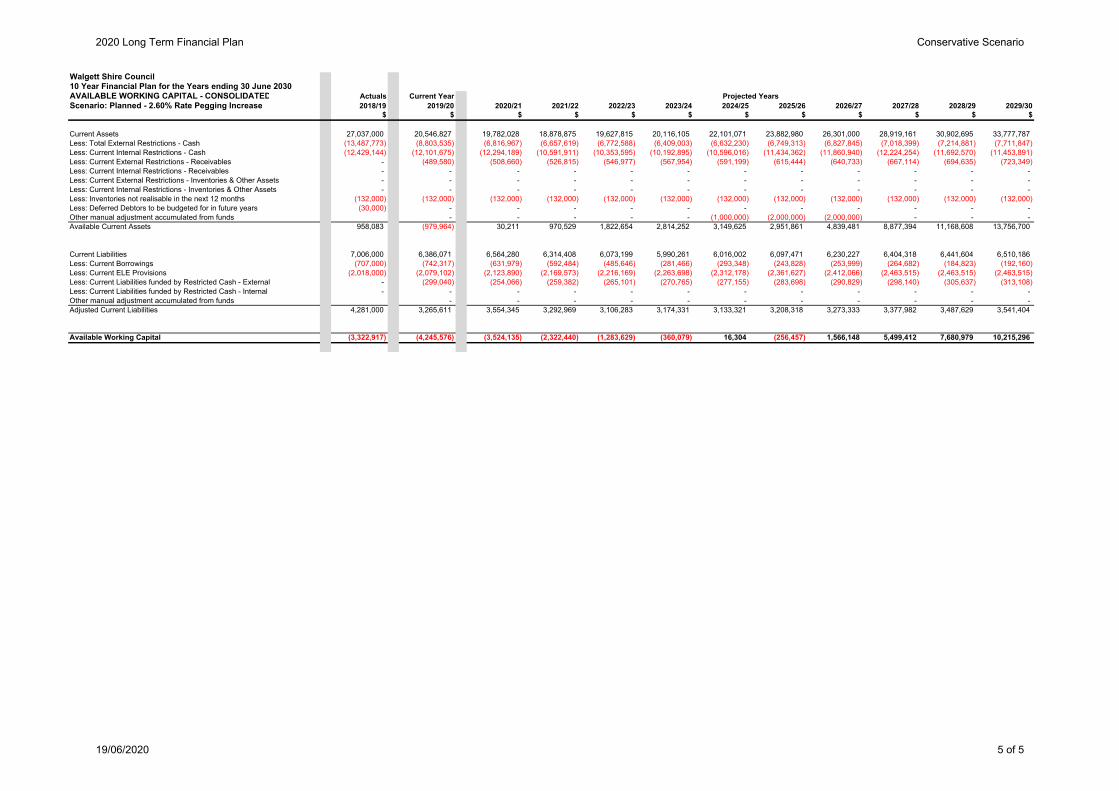
Walgett Shire Council10 Year Financial Plan for the Years ending 30 June 2030AVAILABLE WORKING CAPITAL - CONSOLIDATED Actuals Current YearScenario: Planned - 2.60% Rate Pegging Increase 2018/19 2019/20 2020/21 2021/22 2022/23 2023/24 2024/25 2025/26 2026/27 2027/28 2028/29 2029/30
$ $ $ $ $ $ $ $ $ $ $ $
Current Assets 27,037,000 20,546,827 19,782,028 18,878,875 19,627,815 20,116,105 22,101,071 23,882,980 26,301,000 28,919,161 30,902,695 33,777,787 Less: Total External Restrictions - Cash (13,487,773) (8,803,535) (6,816,967) (6,657,619) (6,772,588) (6,409,003) (6,632,230) (6,749,313) (6,827,845) (7,018,399) (7,214,881) (7,711,847) Less: Current Internal Restrictions - Cash (12,429,144) (12,101,675) (12,294,189) (10,591,911) (10,353,595) (10,192,895) (10,596,016) (11,434,362) (11,860,940) (12,224,254) (11,692,570) (11,453,891) Less: Current External Restrictions - Receivables - (489,580) (508,660) (526,815) (546,977) (567,954) (591,199) (615,444) (640,733) (667,114) (694,635) (723,349) Less: Current Internal Restrictions - Receivables - - - - - - - - - - - - Less: Current External Restrictions - Inventories & Other Assets - - - - - - - - - - - - Less: Current Internal Restrictions - Inventories & Other Assets - - - - - - - - - - - - Less: Inventories not realisable in the next 12 months (132,000) (132,000) (132,000) (132,000) (132,000) (132,000) (132,000) (132,000) (132,000) (132,000) (132,000) (132,000) Less: Deferred Debtors to be budgeted for in future years (30,000) - - - - - - - - - - - Other manual adjustment accumulated from funds - - - - - (1,000,000) (2,000,000) (2,000,000) - - - Available Current Assets 958,083 (979,964) 30,211 970,529 1,822,654 2,814,252 3,149,625 2,951,861 4,839,481 8,877,394 11,168,608 13,756,700
Current Liabilities 7,006,000 6,386,071 6,564,280 6,314,408 6,073,199 5,990,261 6,016,002 6,097,471 6,230,227 6,404,318 6,441,604 6,510,186 Less: Current Borrowings (707,000) (742,317) (631,979) (592,484) (485,646) (281,466) (293,348) (243,828) (253,999) (264,682) (184,823) (192,160) Less: Current ELE Provisions (2,018,000) (2,079,102) (2,123,890) (2,169,573) (2,216,169) (2,263,698) (2,312,178) (2,361,627) (2,412,066) (2,463,515) (2,463,515) (2,463,515) Less: Current Liabilities funded by Restricted Cash - External - (299,040) (254,066) (259,382) (265,101) (270,765) (277,155) (283,698) (290,829) (298,140) (305,637) (313,108) Less: Current Liabilities funded by Restricted Cash - Internal - - - - - - - - - - - - Other manual adjustment accumulated from funds - - - - - - - - - - - Adjusted Current Liabilities 4,281,000 3,265,611 3,554,345 3,292,969 3,106,283 3,174,331 3,133,321 3,208,318 3,273,333 3,377,982 3,487,629 3,541,404
Available Working Capital (3,322,917) (4,245,576) (3,524,135) (2,322,440) (1,283,629) (360,079) 16,304 (256,457) 1,566,148 5,499,412 7,680,979 10,215,296
Projected Years
2020 Long Term Financial Plan Conservative Scenario
19/06/2020 5 of 5