walking + cycling in vancouver · source: vpd traffic fatality data (1996-2015) safety target: zero...
TRANSCRIPT

Walking + Cycling
in Vancouver
2015 Report Card
“Above all, do not lose your desire to walk. Every day I walk myself into a state of well-being and away from every illness. I have walked myself into my best thoughts, and I know no thought so burdensome that I cannot walk away from it.” Søren Aabye Kierkegaard, Philosopher (1813-1855)

Policy Overview 2How Vancouverites are Getting Around 10Walkability + Bikeability 24Perceptions + Motivations 34Addressing Barriers 44Photo Credits 56Glossary 57
Contents
Policy Overview
PoliCy oVerVieW | 2015 rePorT CArD2015 rePorT CArD | PoliCy oVerVieW2

Vancouver’s Transportation 2040 plan has a vision of “a city with a smart and efficient transportation system.”The plan supports “a thriving economy while
increasing affordability; healthy citizens who are
mobile in a safe, accessible, and vibrant city; and
an enhanced natural environment that ensures a
healthy future for people and the planet.”
Active modes of transportation – that is, walking,
cycling, and rolling – are central to that vision for
Vancouver. Public transit, private vehicles, and
goods movement also have important roles to play,
but our vision cannot be achieved without building
infrastructure and a culture that supports and
encourages Vancouverites to choose walking and
cycling for more of their trips.
T2040
3PoliCy oVerVieW | 2015 rePorT CArD2015 rePorT CArD | PoliCy oVerVieW

Mobility target: By 2040, make at least two-thirds of all trips on foot, bike, or transit. As an interim target, Transportation 2040 also supports the Greenest City target to make at least half of all trips by foot, bike, and transit by 2020. We have reached this target five years early, with 50 per cent of trips in the city made by walking, cycling, and transit in 2015.
By 2040, the total number of trips made by sustainable modes will grow significantly, while motor vehicle volumes will remain the same.
Transportation 2040 Targets and Progress
Percentage of trips made by foot, bike, and transit
0% 20% 40% 60% 80% 100%
40%2008
2015
2020 target
2040 target
50%
50%
66%
4 2015 rePorT CArD | PoliCy oVerVieW PoliCy oVerVieW | 2015 rePorT CArD

Source: VPD Traffic Fatality Data (1996-2015)
Safety target: Zero traffic-related fatalities People walking and cycling are among the most vulnerable road users on our streets. Vancouver’s ultimate safety goal is to eliminate all fatalities from our transportation system.
Traffic fatalities have been declining for the last 20 years, even as Vancouver’s population has continued to grow.
However, one fatality is too many. As we approach 2040, we will continue enhancing our infrastructure and working with partners to improve safety and reach our target.
Traffic Related Fatalities
40
35
30
25
20
15
10
5
0
199
6
199
7
199
8
199
9
20
00
20
01
20
02
20
03
20
04
20
05
20
06
20
07
20
08
20
09
20
10
20
11
20
12
20
13
20
14
20
15
25
34
39
33
26 25 25 25
19 19
9
16 1615
12
28
13
23
3032
52015 rePorT CArD | PoliCy oVerVieW PoliCy oVerVieW | 2015 rePorT CArD
TitleBuilding a walkable and bikeable city through increased density, mixed land use, traffic-calming, interesting streetscapes...
Vancouver is a world leader in the development of complete, compact, and livable communities that allow most people to meet their daily needs...
Many health benefits are associated with sustainable transportation, including reduced rates of obesity, diabetes, heart disease and cancers...
PoliCy oVerVieW | 2015 rePorT CArD2015 rePorT CArD | PoliCy oVerVieW6

Greenest City Action Plan
Active transportation will help us meet many of our Greenest City goals. Fewer car trips in Vancouver mean reduced greenhouse gas emissions, contributing to cleaner air and helping to combat climate change.
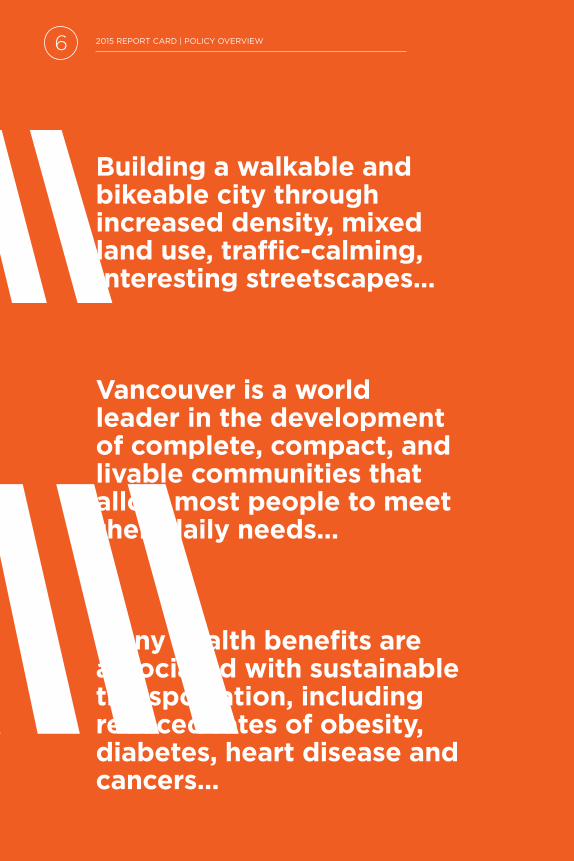
Building a walkable and bikeable city through increased density, mixed land use, traffic-calming, interesting streetscapes, connected infrastructure, and a supportive culture is key to achieving our Greenest City vision.
Read more at: vancouver.ca/greenestcity
Renewable City Strategy
renewable energy is energy that is naturally replenished as it is used. our goal is to get 100 per cent of our energy in Vancouver from renewable sources before 2050.
We already have what it takes – Vancouver is a world leader in the development of complete, compact, and livable communities that allow most people to meet their daily needs through walking, cycling, and transit. The renewable City Strategy positions Vancouver to increase its economic diversity for a stronger, more resilient economy.
Read more at: vancouver.ca/renewable-city
Healthy City Strategy
The ways we move around the city impact our health as individuals and communities. An array of accessible, sustainable transportation options allows people to save time and money while improving health and well-being.
Many health benefits are associated with sustainable transportation, including reduced rates of obesity, diabetes, heart disease and cancers, and less respiratory and cardiovascular disease. Active transportation allows us to make exercise part of our daily routine and gives us opportunities to connect with others in our communities.
Read more at: vancouver.ca/healthycity
7PoliCy oVerVieW | 2015 rePorT CArD2015 rePorT CArD | PoliCy oVerVieW

How Vancouver Compares
Vancouver is a leader in active transportation mode share in North America, especially when walking and cycling are taken together. in this section are some commuting mode share numbers from other cities across Canada and the U.S.
even in 2011, Vancouver was leading among large Canadian cities by a wide margin for walking and cycling to work, and we have come a long way since then. See pages 20-21 for more up-to-date mode share numbers.
The U.S. numbers cannot be compared directly to Vancouver as they are collected through the American Community Survey, but they can give us a sense of how we are doing.
Walking to Work in Large Canadian Cities, 2011
14
12
10
8
6
4
2
0
Van
co
uver
Mo
ntr
eal
Toro
nto
ott
aw
a
Win
nip
eg
Sask
ato
on
Calg
ary
ed
mo
nto
n
12.5%
8.5%7.3% 7.3%
5.5% 5.3% 5.1% 4.6%
Source: 2011 National Household Survey
8 2015 rePorT CArD | PoliCy oVerVieW PoliCy oVerVieW | 2015 rePorT CArD
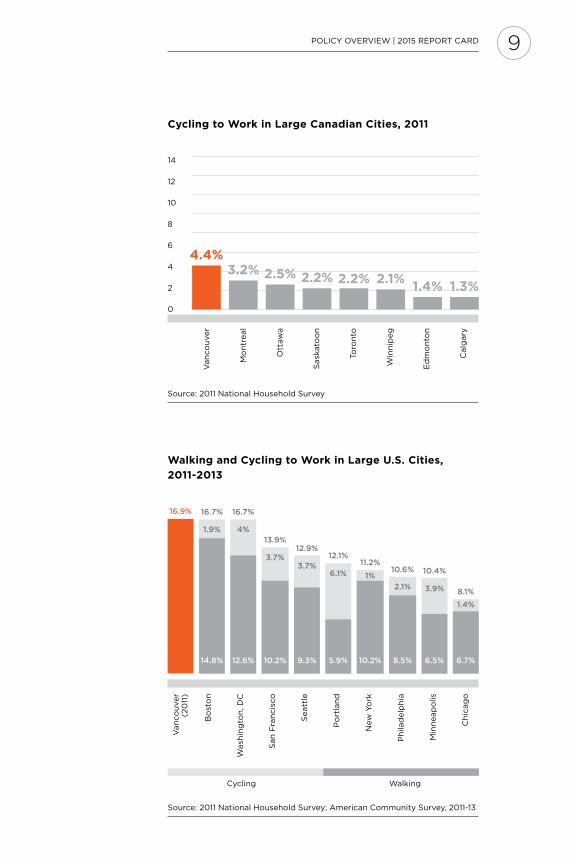
Walking and Cycling to Work in Large U.S. Cities,
2011-2013
Source: 2011 National Household Survey; American Community Survey, 2011-13
16.9%
14.8%
16.7%
1.9%
12.6%
4%
16.7%
10.2%
3.7%
13.9%
9.3%
3.7%
12.9%
5.9%
6.1%
12.1%
10.2%
1%
11.2%
8.5%
2.1%
10.6%
6.5%
3.9%
10.4%
6.7%
1.4%
8.1%
Van
co
uver
Bo
sto
n
Wash
ing
ton
, D
C
San
Fra
ncis
co
Seatt
le
Po
rtla
nd
New
yo
rk
Ph
ilad
elp
hia
Min
neap
olis
Ch
icag
o
(20
11)
Cycling to Work in Large Canadian Cities, 2011
Van
co
uver
Mo
ntr
eal
ott
aw
a
Sask
ato
on
Toro
nto
Win
nip
eg
ed
mo
nto
n
Calg
ary
14
12
10
8
6
4
2
0
4.4%3.2%
2.2%2.5% 2.1%2.2%1.3%1.4%
Source: 2011 National Household Survey
Cycling Walking
92015 rePorT CArD | PoliCy oVerVieW PoliCy oVerVieW | 2015 rePorT CArD

How Vancouverites are Getting Around
HoW VANCoUVeriTeS Are GeTTiNG AroUND | 2015 rePorT CArD2015 rePorT CArD | HoW VANCoUVeriTeS Are GeTTiNG AroUND10

Vancouverites are making more of their trips on foot and by bike every year. Cycling has long been the fastest growing
mode share. Since 2013, cycling trips have
increased from four to seven per cent of
all trips made. Walking trips have also
increased, while car and transit trips have
decreased slightly.
Mode Share for All Trips
Source: 2015 Transportation Panel Survey
0% 20% 40% 60% 80% 100%
2013
2014
53% 18% 26% 4%
51% 18% 26% 5%
50% 16% 27% 7%
Auto Transit Walk Cycle
2015
11HoW VANCoUVeriTeS Are GeTTiNG AroUND | 2015 rePorT CArD2015 rePorT CArD | HoW VANCoUVeriTeS Are GeTTiNG AroUND

Since 2013, walking trips have increased from 26 to 27 per cent of all trips in Vancouver.
The City conducts a comprehensive pedestrian count every five years. in 2013, the count covered 400 locations on 60 commercial streets across Vancouver.
The busiest walking locations downtown were along:
Granville Street, Burrard Street, Georgia Street, and robson Street.
The busiest walking locations outside of downtown were clustered around:
• Two SkyTrain stations at Commercial Drive and Broadway,• Cambie Corridor around Canada line stations, and• Broadway transit corridor.
View the full 2013 Pedestrian Survey at: vancouver.ca/walkvancouver
Source: 2013 Pedestrian Survey
Change in Pedestrian Volumes, 2008-2013
Outside Downtown
+3%
Downtown
+4%
Walking Volumes
12 2015 rePorT CArD | HoW VANCoUVeriTeS Are GeTTiNG AroUND HoW VANCoUVeriTeS Are GeTTiNG AroUND | 2015 rePorT CArD
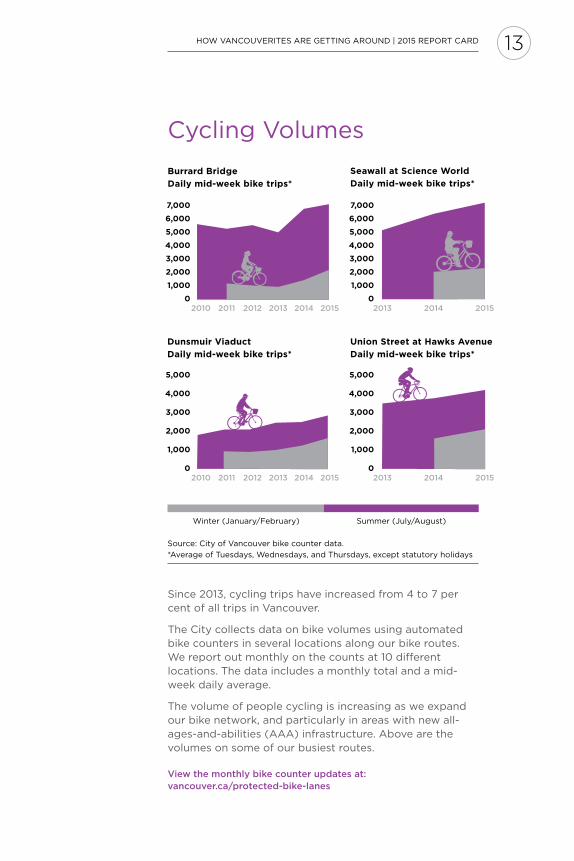
Since 2013, cycling trips have increased from 4 to 7 per cent of all trips in Vancouver.
The City collects data on bike volumes using automated bike counters in several locations along our bike routes. We report out monthly on the counts at 10 different locations. The data includes a monthly total and a mid-week daily average.
The volume of people cycling is increasing as we expand our bike network, and particularly in areas with new all-ages-and-abilities (AAA) infrastructure. Above are the volumes on some of our busiest routes.
View the monthly bike counter updates at: vancouver.ca/protected-bike-lanes
Source: City of Vancouver bike counter data.
*Average of Tuesdays, Wednesdays, and Thursdays, except statutory holidays
Burrard Bridge
Daily mid-week bike trips*
Seawall at Science World
Daily mid-week bike trips*
7,000
6,000
5,000
4,000
3,000
2,000
1,000
0
7,000
6,000
5,000
4,000
3,000
2,000
1,000
02010 20122011 2013 2014 2015 2013 2014 2015
Union Street at Hawks Avenue
Daily mid-week bike trips*
Dunsmuir Viaduct
Daily mid-week bike trips*
5,000
4,000
3,000
2,000
1,000
0
5,000
4,000
3,000
2,000
1,000
02010 20122011 2013 2014 2015 2013 2014 2015
Summer (July/August)Winter (January/February)
Cycling Volumes
132015 rePorT CArD | HoW VANCoUVeriTeS Are GeTTiNG AroUND HoW VANCoUVeriTeS Are GeTTiNG AroUND | 2015 rePorT CArD

Age
Vancouverites of all ages walk and cycle to get around. Transit is the most commonly used mode among 18-24 year olds, many of whom are likely to be students with transit passes. Driving is more common in older age groups. Walking is most common in the 25-44 age group and least common for those 18-24. The cycling mode share is equal amongst the three younger age groups and less common for those over 65.
Mode Share by Age Group
Source: 2015 Transportation Panel Survey
0% 20% 40% 60% 80% 100%
18–24
25–44
7%
7%
45–64 7%
65+ 4%
31% 47% 15%
44% 19% 30%
56% 11% 25%
59% 9% 27%
Auto Transit Walk Cycle
Who is Walking and Cycling in Vancouver?
14 2015 rePorT CArD | HoW VANCoUVeriTeS Are GeTTiNG AroUND HoW VANCoUVeriTeS Are GeTTiNG AroUND | 2015 rePorT CArD

39%2015
Female Cyclists on Hornby Street
Protected Bike Lane
Painted Bike Lane
28%2010
The share of women cycling on Hornby Street grew 40% after a protected bike lane was constructed in 2011.
Gender
The number of women cycling is often used as an indicator of a route’s perceived safety and comfort. The share of women cycling on Hornby Street has increased from 28 per cent of all riders in 2010, when the route was a painted bike lane, to 39 per cent in 2015, after a protected bike lane was constructed in 2011.
152015 rePorT CArD | HoW VANCoUVeriTeS Are GeTTiNG AroUND HoW VANCoUVeriTeS Are GeTTiNG AroUND | 2015 rePorT CArD

51%48% 26%
18%
14%22%
19%
27% 29%
Walking Mode Share by Home Area
Geography
Though people walk and cycle in all of Vancouver’s neighbourhoods, there are clear geographical differences in the ways we get around. Walking is most common downtown.
Source: 2015 Transportation Panel Survey
16 2015 rePorT CArD | HoW VANCoUVeriTeS Are GeTTiNG AroUND HoW VANCoUVeriTeS Are GeTTiNG AroUND | 2015 rePorT CArD

4% 17%
8%
3%
2%
9% 7%
4%
8%
Cycling Mode Share by Home Area
Source: 2015 Transportation Panel Survey
Cycling is most common in the Vancouver Port area, made up of the Downtown Eastside, Strathcona, and Grandview-Woodland neighbourhoods.
172015 rePorT CArD | HoW VANCoUVeriTeS Are GeTTiNG AroUND HoW VANCoUVeriTeS Are GeTTiNG AroUND | 2015 rePorT CArD

Income
While people with higher incomes choose to switch from transit to driving, walking and cycling are similar across all income levels.
Mode Share by Income
Source: 2015 Transportation Panel Survey
Auto Transit Walk/Cycle
0% 20% 40% 60% 80% 100%
Under
$50k
$50k –
$100k
Over $100k
41% 24% 35%
50% 16% 34%
54% 12% 34%
18 2015 rePorT CArD | HoW VANCoUVeriTeS Are GeTTiNG AroUND HoW VANCoUVeriTeS Are GeTTiNG AroUND | 2015 rePorT CArD

Auto Transit Walk/Cycle
Source: 2015 Transportation Panel Survey
0% 20% 40% 60% 80% 100%
No Access
to Private
Vehicle
Have Access
to Private
Vehicle
Access to Private Vehicles
Vancouverites who have access to private vehicles use active modes less often than those without cars, but still choose walking and cycling for 30 per cent of their trips.
Mode Share by Vehicle Access
9% 35% 56%
59% 11% 30%
192015 rePorT CArD | HoW VANCoUVeriTeS Are GeTTiNG AroUND HoW VANCoUVeriTeS Are GeTTiNG AroUND | 2015 rePorT CArD

Trips Made by Foot and Bike
Ten per cent of Vancouverites cycle to work and 24 per cent walk to work.Destinations
Vancouverites choose different ways of getting around for different kinds of trips. Active modes are most often chosen for commuting, shopping, dining, and recreational or social outings.
20 2015 rePorT CArD | HoW VANCoUVeriTeS Are GeTTiNG AroUND HoW VANCoUVeriTeS Are GeTTiNG AroUND | 2015 rePorT CArD

Source: 2015 Transportation Panel Survey
To Work10%
41%
24%
24%
Shopping
6%
49%
37%
8%
Dining/Restaurant
1%
41%
47%
11%
Recreation, Social
+ Entertainment
7%
49%
30%
14%
To School
7%
20%10%
64%
Auto Driver or
Passenger
Transit Walking Cycling
Mode Share by Destination
212015 rePorT CArD | HoW VANCoUVeriTeS Are GeTTiNG AroUND HoW VANCoUVeriTeS Are GeTTiNG AroUND | 2015 rePorT CArD
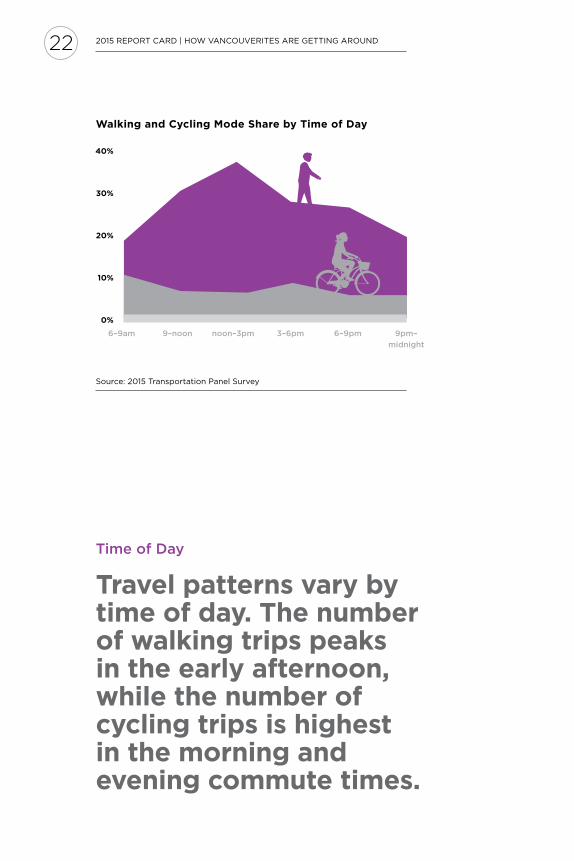
Time of Day
Travel patterns vary by time of day. The number of walking trips peaks in the early afternoon, while the number of cycling trips is highest in the morning and evening commute times.
Walking and Cycling Mode Share by Time of Day
Source: 2015 Transportation Panel Survey
40%
30%
20%
10%
0%
6–9am 9–noon noon–3pm 3–6pm 6–9pm 9pm–
midnight
22 2015 rePorT CArD | HoW VANCoUVeriTeS Are GeTTiNG AroUND HoW VANCoUVeriTeS Are GeTTiNG AroUND | 2015 rePorT CArD

32,000 people in Vancouver bike at least 5 times per week in rainy cold weather.Source: 2015 Transportation Panel Survey
Seasons
Vancouverites make different travel choices in different seasons. Cycling trips vary more between the light and dry season and the dark and rainy season than walking trips.
Walking and Cycling by Season
Light and Dry Season non commuting trips
Cycling
21%
Walking
62%
Source: Active Transportation Survey, 2015
Dark and Rainy Season non commuting trips
Percentage of respondents who walk and cycle at least occasionally.
Cycling
13%
Walking
54%
232015 rePorT CArD | HoW VANCoUVeriTeS Are GeTTiNG AroUND HoW VANCoUVeriTeS Are GeTTiNG AroUND | 2015 rePorT CArD
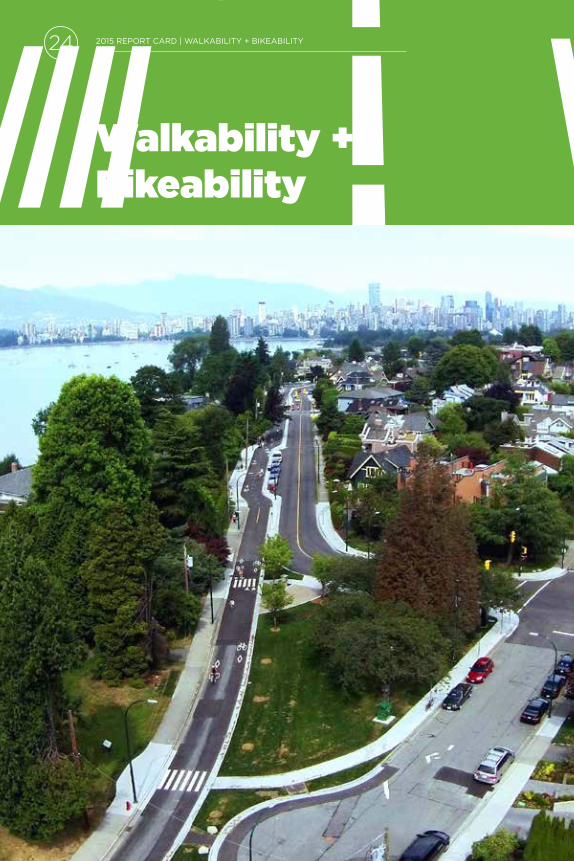
Walkability + Bikeability
WAlKABiliTy + BiKeABiliTy | 2015 rePorT CArD2015 rePorT CArD | WAlKABiliTy + BiKeABiliTy24
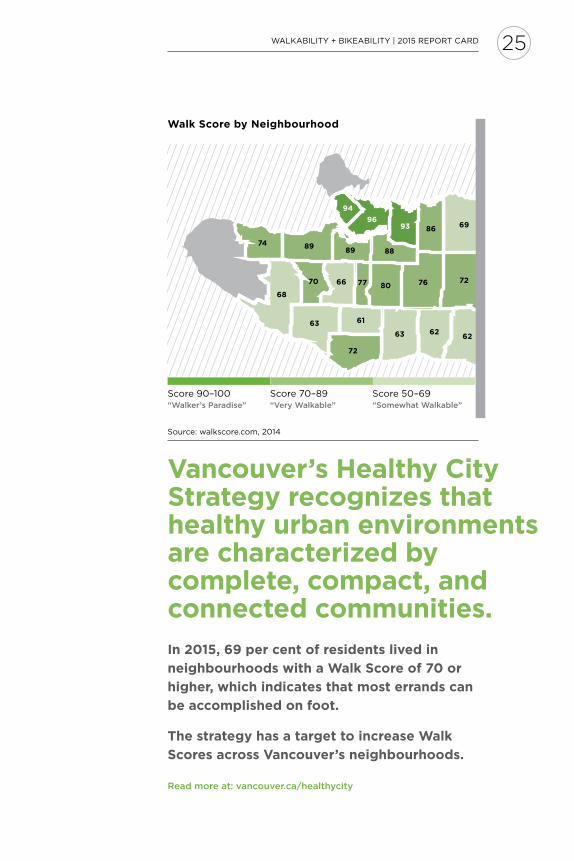
Vancouver’s Healthy City Strategy recognizes that healthy urban environments are characterized by complete, compact, and connected communities. In 2015, 69 per cent of residents lived in
neighbourhoods with a Walk Score of 70 or
higher, which indicates that most errands can
be accomplished on foot.
The strategy has a target to increase Walk
Scores across Vancouver’s neighbourhoods.
Read more at: vancouver.ca/healthycity
Walk Score by Neighbourhood
Source: walkscore.com, 2014
66 768070
72
96
63
94
74
6993
72
88
61
89
77
89
63
86
6262
68
Score 90–100 Score 70–89 Score 50–69“Walker’s Paradise” “Very Walkable” “Somewhat Walkable”
25WAlKABiliTy + BiKeABiliTy | 2015 rePorT CArD2015 rePorT CArD | WAlKABiliTy + BiKeABiliTy

Title
View and download our most up-to-date cycling map at: vancouver.ca/bikevancouver
from the Vancouver Convention Centre to Spanish Banks, Seaside Greenway is Vancouver’s longest
300km
24%
28km
designed for all-ages-and-abilities
Vancouver’s total bike network
WAlKABiliTy + BiKeABiliTy | 2015 rePorT CArD2015 rePorT CArD | WAlKABiliTy + BiKeABiliTy26

Longest Greenway: Seaside Greenway
would like to travel by bicycle more often.2015 Transportation Panel Survey
54%
27WAlKABiliTy + BiKeABiliTy | 2015 rePorT CArD2015 rePorT CArD | WAlKABiliTy + BiKeABiliTy

infrastructure: 2013 – 2015
For our first annual report card, we are taking
a look back at major improvements made to
walking and cycling routes in the first three
years of our Transportation 2040 plan.
Designing for All Ages and Abilities (AAA)
Shared use lane
Painted bike lane
Buffered bike lane
local street bikeway
Protected bike lane
off-street pathway
Less Comfortable More Comfortable
28 2015 rePorT CArD | WAlKABiliTy + BiKeABiliTy WAlKABiliTy + BiKeABiliTy | 2015 rePorT CArD

Union Street Bikeway Upgrade (2013)
The Adanac Bikeway extends from Downtown to Boundary road where it connects with Burnaby’s Francis Union Bikeway. The Union Street upgrade significantly improved connections between the Adanac Bikeway, the Seawall/Seaside Greenway, the Carrall Street Greenway, and the Dunsmuir Viaduct protected bike lane.
The upgrade addressed safety issues at the intersection of Union Street and Main Street, and brought the section between Gore Street and Main Street up to a AAA design through the installation of protected bike lanes and paint- and parking-buffered bike lanes.
Read more at: vancouver.ca/adanacbikeway
The upgrade addressed safety issues at the intersection of Union Street and Main Street, and brought this section of Union Street up to a AAA design.
292015 rePorT CArD | WAlKABiliTy + BiKeABiliTy WAlKABiliTy + BiKeABiliTy | 2015 rePorT CArD

Comox-Helmcken Greenway (2013)
The development of Section 1 of the Comox-Helmcken
Greenway provides an east-west connection through
the West end. People of all ages and abilities can now
walk and cycle along the Greenway from Stanley Park
to Hornby Street.
The Greenway connects parks, schools, community
centres, neighbourhoods, and retail areas. Benches, trees,
and gardens beautify the street and provide places to
rest and socialize.
Read more at: vancouver.ca/comoxgreenway
People of all ages and abilities can now walk and cycle along the Greenway from Stanley Park to Hornby Street through the West End.
30 2015 rePorT CArD | WAlKABiliTy + BiKeABiliTy WAlKABiliTy + BiKeABiliTy | 2015 rePorT CArD

The City commissioned a study by the UBC Health and
Community Design lab and partnered on another study
with the Centre for Hip Health and Mobility. Both studies
reinforced the health and well-being benefits to nearby
residents of improved access to walking, cycling, and
social opportunities along the Comox-Helmcken Greenway.
Greenway Health Benefits
Time spent sitting
and being sedentary
Days of poor physical
and mental health
Source: UBC Health & Community Design lab - Study of Travel, Health,
and Activity, Comox-Helmcken Greenway: 2012-2015
-8% -9.8%
Days engaged in moderate
physical activity per week
16.1%
312015 rePorT CArD | WAlKABiliTy + BiKeABiliTy WAlKABiliTy + BiKeABiliTy | 2015 rePorT CArD

Seaside Greenway: Point Grey Road Active Transportation Corridor and York Bikeway (2014)
Phase 1 of the development of an Active Transportation Corridor along Point Grey road provides a safe, convenient, and comfortable connection between Burrard Bridge and Jericho Beach Park. People of all ages and abilities can now walk and cycle the full 28-km length of the Seaside Greenway from the downtown Convention Centre to Spanish Banks Park, through Coal Harbour, Stanley Park, english Bay, False Creek, Kitsilano, and Point Grey.
To make this AAA improvement, Point Grey road between Alma and Macdonald Streets was converted to a traffic-calmed residential street, redistributing 10,000 daily vehicle trips to other arterial roads. The project also enhanced connections for cycling commuters between downtown, Kitsilano, and Point Grey via a new local street bikeway on york Avenue.
Phase 2 of the project (2016-17) will make further improvements to the pedestrian realm along Point Grey road, including wider sidewalks, raised crosswalks, lighting upgrades, additional traffic calming, and other amenities.
Point Grey Road and Macdonald Street
900 2700
BeFore Phase 1
completion (August
2013 weekday)
AFTer Phase 1
completion (August
2014 weekday)
Average Daily Bicycle Volumes
32 2015 rePorT CArD | WAlKABiliTy + BiKeABiliTy WAlKABiliTy + BiKeABiliTy | 2015 rePorT CArD
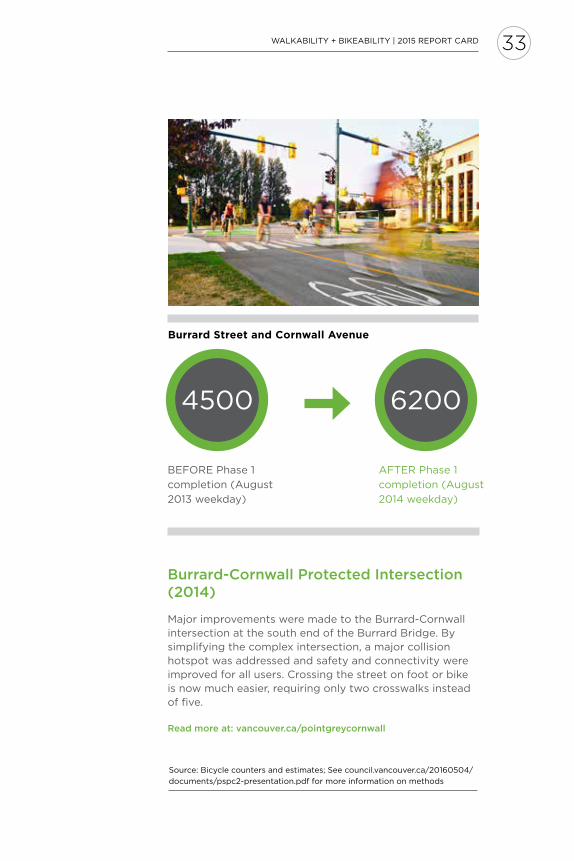
Burrard-Cornwall Protected Intersection (2014)
Major improvements were made to the Burrard-Cornwall intersection at the south end of the Burrard Bridge. By simplifying the complex intersection, a major collision hotspot was addressed and safety and connectivity were improved for all users. Crossing the street on foot or bike is now much easier, requiring only two crosswalks instead of five.
Read more at: vancouver.ca/pointgreycornwall
Source: Bicycle counters and estimates; See council.vancouver.ca/20160504/
documents/pspc2-presentation.pdf for more information on methods
4500 6200
BeFore Phase 1
completion (August
2013 weekday)
AFTer Phase 1
completion (August
2014 weekday)
Burrard Street and Cornwall Avenue
332015 rePorT CArD | WAlKABiliTy + BiKeABiliTy WAlKABiliTy + BiKeABiliTy | 2015 rePorT CArD

Perceptions + Motivations
PerCePTioNS + MoTiVATioNS | 2015 rePorT CArD2015 rePorT CArD | PerCePTioNS + MoTiVATioNS34

In January 2015, we conducted two surveys on perceptions of active transportation using the City’s Talk Vancouver online panel. Nearly 1,000 panelists took part in the Walking
Questionnaire, and nearly 1,300 panelists in the
Cycling Questionnaire.
The results of these surveys indicate some
common perceptions and attitudes toward
walking and cycling in Vancouver.
35PerCePTioNS + MoTiVATioNS | 2015 rePorT CArD2015 rePorT CArD | PerCePTioNS + MoTiVATioNS
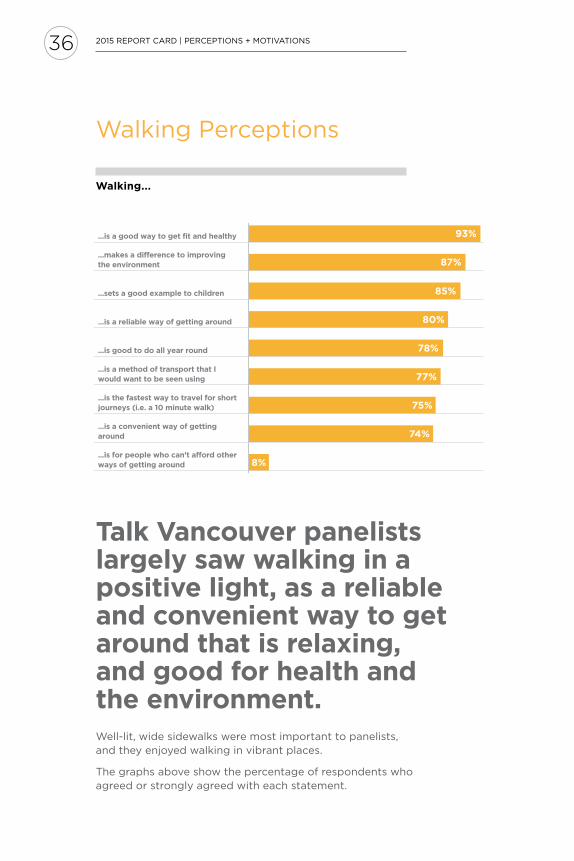
Talk Vancouver panelists largely saw walking in a positive light, as a reliable and convenient way to get around that is relaxing, and good for health and the environment. Well-lit, wide sidewalks were most important to panelists, and they enjoyed walking in vibrant places.
The graphs above show the percentage of respondents who agreed or strongly agreed with each statement.
...is a good way to get fit and healthy
...makes a difference to improving the environment
...sets a good example to children
...is a reliable way of getting around
...is good to do all year round
...is a method of transport that I would want to be seen using
...is the fastest way to travel for short journeys (i.e. a 10 minute walk)
...is a convenient way of getting around
...is for people who can’t afford other ways of getting around
93%
87%
85%
80%
78%
77%
75%
74%
8%
Walking...
Walking Perceptions
36 2015 rePorT CArD | PerCePTioNS + MoTiVATioNS PerCePTioNS + MoTiVATioNS | 2015 rePorT CArD
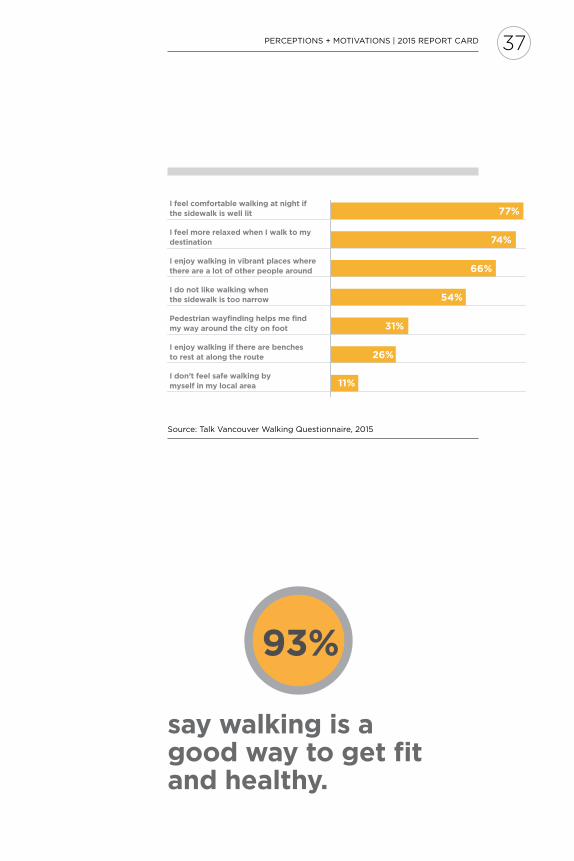
I feel comfortable walking at night if the sidewalk is well lit
I feel more relaxed when I walk to my destination
I enjoy walking in vibrant places where there are a lot of other people around
I do not like walking when the sidewalk is too narrow
Pedestrian wayfinding helps me find my way around the city on foot
I enjoy walking if there are benches to rest at along the route
I don’t feel safe walking by myself in my local area
77%
74%
66%
54%
31%
26%
11%
Source: Talk Vancouver Walking Questionnaire, 2015
say walking is a good way to get fit and healthy.
93%
372015 rePorT CArD | PerCePTioNS + MoTiVATioNS PerCePTioNS + MoTiVATioNS | 2015 rePorT CArD

Cycling...
...is a good way to get fit and healthy
...makes a difference to improving the environment
...sets a good example to children
...is a reliable way of getting around
...is good to do all year round
...is a method of transport that I would want to be seen using
...is the fastest way to travel for short journeys (i.e. a 10 minute bike ride)
...is a convenient way of getting around
...is for people who can’t afford other ways of getting around
90%
81%
73%
70%
68%
66%
64%
48%
11%
Cycling Perceptions
Talk Vancouver panelists saw cycling as a reliable and convenient way to get around that is healthy and good for the environment. Secure bike parking, well-lit routes, and routes separated from vehicle traffic were important to panelists.
The graphs above show the percentage of respondents who agreed or strongly agreed with each statement.
38 2015 rePorT CArD | PerCePTioNS + MoTiVATioNS PerCePTioNS + MoTiVATioNS | 2015 rePorT CArD

do not like cycling when the route means sharing the road with vehicle traffic.
I feel comfortable cycling at night if the route is well lit
I feel more relaxed when I cycle tomy destination
I enjoy cycling in vibrant places where there are a lot of other people around, on foot or on a bike travelling or gathering
I do not like cycling when the route means sharing the road with vehicle traffic
Cycling is good to do all year round
I enjoy cycling if there is secure bike parking at my destination
I don’t feel safe cycling by myself in my local area
64%
59%
56%
49%
48%
47%
17%
56%
Source: Talk Vancouver Cycling Questionnaire, 2015
392015 rePorT CArD | PerCePTioNS + MoTiVATioNS PerCePTioNS + MoTiVATioNS | 2015 rePorT CArD
Title
01
02
03
04
05
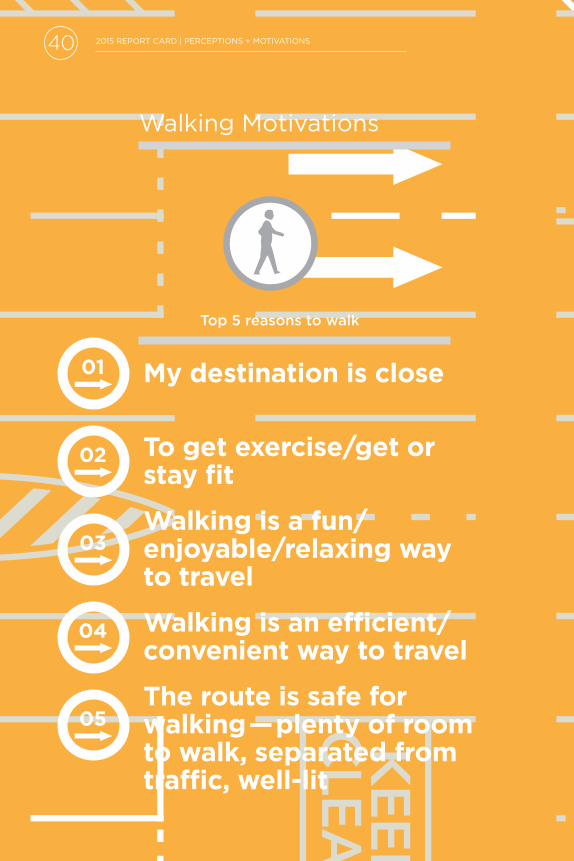
Top 5 reasons to walk
Walking Motivations
My destination is close
To get exercise/get or stay fit
Walking is a fun/enjoyable/relaxing way to travel
Walking is an efficient/convenient way to travel
The route is safe for walking — plenty of room to walk, separated from traffic, well-lit
PerCePTioNS + MoTiVATioNS | 2015 rePorT CArD40 2015 rePorT CArD | PerCePTioNS + MoTiVATioNS
Source: Active Transportation Survey, 2015
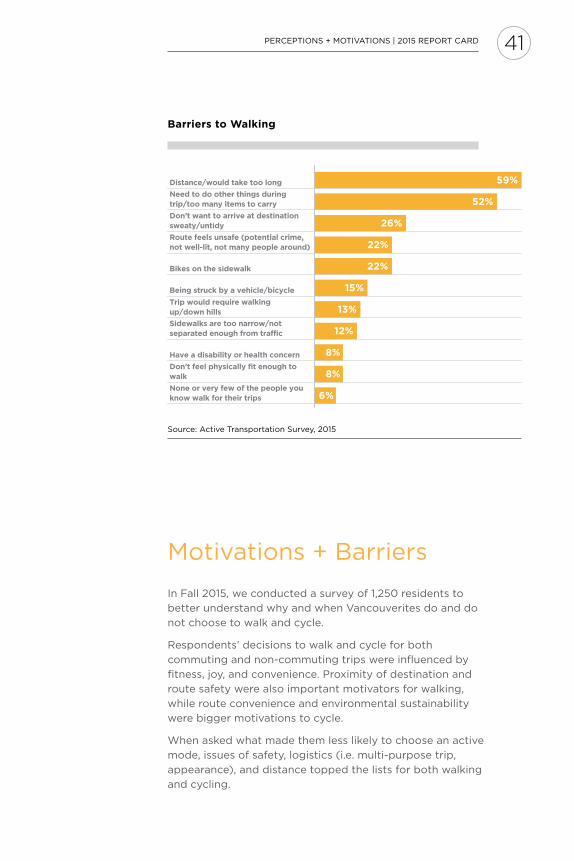
Distance/would take too long
Need to do other things during trip/too many items to carry
Don’t want to arrive at destination sweaty/untidy
Route feels unsafe (potential crime, not well-lit, not many people around)
Bikes on the sidewalk
Being struck by a vehicle/bicycle
Trip would require walking up/down hills
Sidewalks are too narrow/not separated enough from traffic
Have a disability or health concern
Don’t feel physically fit enough to walk
None or very few of the people you know walk for their trips
59%
52%
26%
22%
22%
15%
13%
12%
8%
8%
6%
Barriers to Walking
Motivations + Barriers
in Fall 2015, we conducted a survey of 1,250 residents to
better understand why and when Vancouverites do and do
not choose to walk and cycle.
respondents’ decisions to walk and cycle for both
commuting and non-commuting trips were influenced by
fitness, joy, and convenience. Proximity of destination and
route safety were also important motivators for walking,
while route convenience and environmental sustainability
were bigger motivations to cycle.
When asked what made them less likely to choose an active
mode, issues of safety, logistics (i.e. multi-purpose trip,
appearance), and distance topped the lists for both walking
and cycling.
41PerCePTioNS + MoTiVATioNS | 2015 rePorT CArD2015 rePorT CArD | PerCePTioNS + MoTiVATioNS

Title
01
02
03
04
05
Top 5 reasons to cycle
Cycling Motivations
To get exercise/get or stay fit
Cycling is a fun/enjoyable way to make your trips
There are convenient bike routes
Cycling is an efficient/convenient way to travel
It’s good for the environment/sustainabilitySource: Active Transportation Survey, 2015
PerCePTioNS + MoTiVATioNS | 2015 rePorT CArD2015 rePorT CArD | PerCePTioNS + MoTiVATioNS42
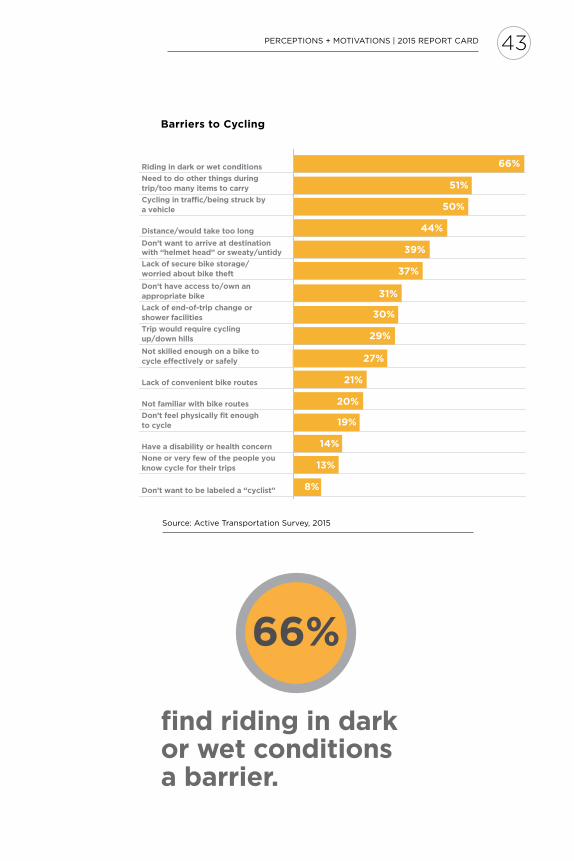
find riding in dark or wet conditions a barrier.
66%
Barriers to Cycling
Riding in dark or wet conditions
Need to do other things during trip/too many items to carry
Cycling in traffic/being struck by a vehicle
Distance/would take too long
Don’t want to arrive at destination with “helmet head” or sweaty/untidy
Lack of secure bike storage/worried about bike theft
Don’t have access to/own an appropriate bike
Lack of end-of-trip change or shower facilities
Trip would require cycling up/down hills
Not skilled enough on a bike to cycle effectively or safely
Lack of convenient bike routes
Not familiar with bike routes
Don’t feel physically fit enoughto cycle
66%
51%
50%
44%
39%
37%
31%
30%
29%
27%
21%
20%
19%
Have a disability or health concern
None or very few of the people you know cycle for their trips
Don’t want to be labeled a “cyclist”
14%
13%
8%
Source: Active Transportation Survey, 2015
43PerCePTioNS + MoTiVATioNS | 2015 rePorT CArD2015 rePorT CArD | PerCePTioNS + MoTiVATioNS
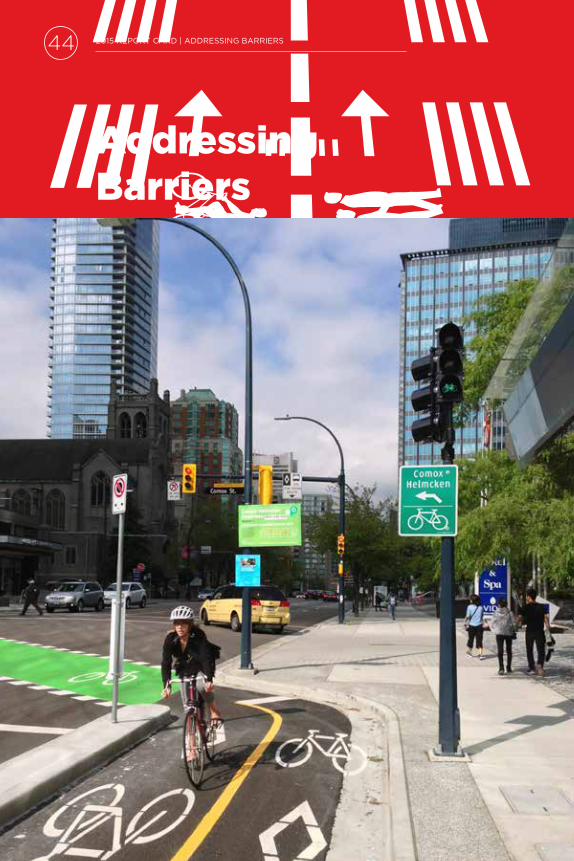
Addressing Barriers
ADDreSSiNG BArrierS | 2015 rePorT CArD44 2015 rePorT CArD | ADDreSSiNG BArrierS

Eliminating transportation-related fatalities is a key goal of Transportation 2040. Improving safety for vulnerable road users – including
people walking and cycling, children, seniors, and
people using mobility aids – is a critical part of
achieving that goal.
People walking and cycling make up a small share of
road users involved in collisions, but are much more
vulnerable to injury and fatality than occupants of
motor vehicles.
Collisions and Fatalities by Road User
Source: iCBC Collision Data, 2009-13; VPD Traffic Fatality Data, 2009-13
Collision
Fatality
Collision
Fatality
58%
1%
1%
5%
45ADDreSSiNG BArrierS | 2015 rePorT CArD2015 rePorT CArD | ADDreSSiNG BArrierS

Walking Safety
Feeling safe while walking depends on high-quality infrastructure as well as a sense of personal safety.
Pedestrian Safety Study (2012)
in 2012, the City commissioned a Pedestrian Safety Study to analyse collision patterns and safety issues for people walking throughout Vancouver. The study found that collisions involving people walking have been declining since 1996.
The study identified a number of key hot spots, many of which are located at intersections on arterial roads. To enhance safety, the City has completed improvements at priority intersections, including crosswalk countdown timers, pedestrian safety 30 km/h zones, leD lights, new traffic signals, and longer crosswalk crossing times.
Read more at: vancouver.ca/files/cov/pedestrian-safety-study-2012-final-report.pdf
Source: 2012 Pedestrian Safety Study
46 2015 rePorT CArD | ADDreSSiNG BArrierS ADDreSSiNG BArrierS | 2015 rePorT CArD

Source: 2012 Pedestrian Safety Study
Pedestrian Collisions
Approximately three quarters of pedestrian collisions classified in the Pedestrian Safety Study occurred at intersections.
26%
17%
Vehicle turns left while person crosses with right-of-way at signalized intersection
Vehicle turns right while person crosses with right-of-way at signalized intersection
A smaller percentage of collisions occurred mid-block.
Person hit while crossing mid-block without a traffic control
8%
472015 rePorT CArD | ADDreSSiNG BArrierS ADDreSSiNG BArrierS | 2015 rePorT CArD

Between 2008 and 2011:
Source: 2015 Cycling Safety Study
Cycling Safety
A large part of feeling safe while cycling is being protected from higher-speed motor vehicle traffic, whether through physical barriers, or traffic-calming measures designed to slow vehicle speeds.
Cycling Trips Collision Rates
+41% -17%
48 2015 rePorT CArD | ADDreSSiNG BArrierS ADDreSSiNG BArrierS | 2015 rePorT CArD
Cycling Safety Study
In 2015, the City commissioned a Cycling
Safety Study to better understand cycling
safety issues throughout Vancouver. The
study found that the annual number of
collisions involving people cycling have
remained consistent since 1996 even as the
number of daily cycling trips has increased
significantly.
The City uses education, enforcement, and engineering to improve cycling safety. Key practices include:
• Protected bike lanes and protected intersections• Bicycle signals with vehicle turn lanes• Pavement markings and green paint at lanes, driveways,
and intersections• improved visibility at intersections, lanes, and driveways• Sufficient and consistent width on busy local street
bikeways• The Cycling Spot improvement Program (read more
at vancouver.ca/spotimprovements)• Separation for walking and biking on off-street
pathways• Designing for slow cycling on the Seawall and other
paths• Promoting safe behaviour for all modes of
transportation• Bylaw enforcement
Using these tools, we are working to address high-collision corridors and intersections identified in the report, as well as others throughout the city.
Read more at: vancouver.ca/files/cov/cycling-safety-study-final-report.pdf
Source: 2015 Cycling Safety Study
492015 rePorT CArD | ADDreSSiNG BArrierS ADDreSSiNG BArrierS | 2015 rePorT CArD

Nearly half of all cycling crashes classified in the Cycling Safety Study are a result of a conflict with a motor vehicle.
Source: 2015 Cycling Safety Study
29%
10%
8%
fall to avoid collision with motor vehicle
collision with motor vehicle door
collision with motor vehicle
ADDreSSiNG BArrierS | 2015 rePorT CArD2015 rePorT CArD | ADDreSSiNG BArrierS50
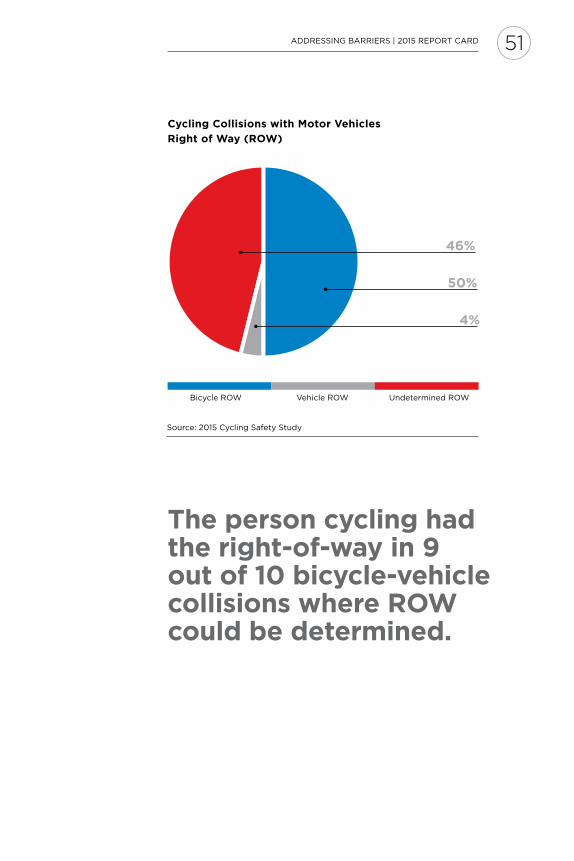
The person cycling had the right-of-way in 9 out of 10 bicycle-vehicle collisions where ROW could be determined.
Source: 2015 Cycling Safety Study
Bicycle roW Vehicle roW Undetermined roW
46%
50%
4%
Cycling Collisions with Motor Vehicles
Right of Way (ROW)
51ADDreSSiNG BArrierS | 2015 rePorT CArD2015 rePorT CArD | ADDreSSiNG BArrierS

Bike Theft
Fear of bike theft is a barrier to cycling and a factor in overall cycling safety. The number of reported bike thefts has been growing since 2012.
Source: Vancouver Police Department
We are aiming to decrease
bike theft with 529 Garage and
other efforts
1,8382,045
2,407
3,132
2012 2013 2014 2015
52 2015 rePorT CArD | ADDreSSiNG BArrierS ADDreSSiNG BArrierS | 2015 rePorT CArD
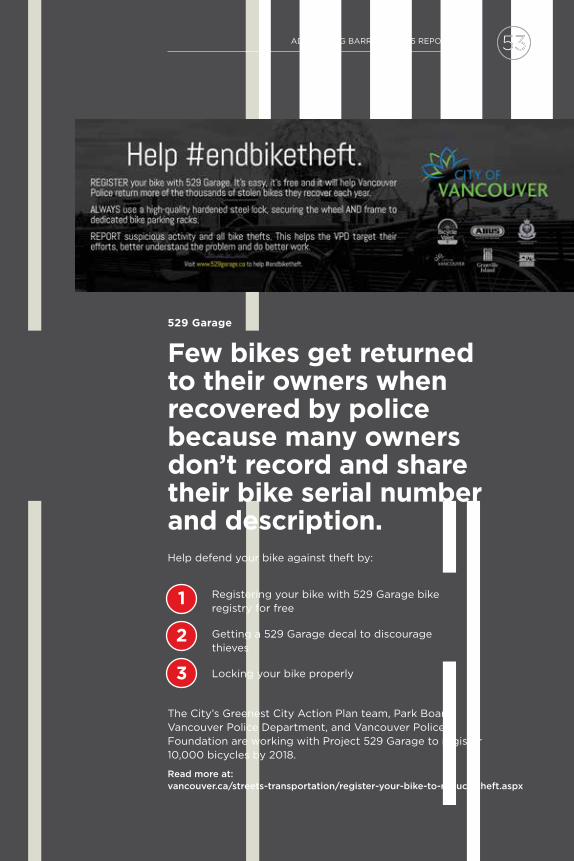
529 Garage
Few bikes get returned to their owners when recovered by police because many owners don’t record and share their bike serial number and description. Help defend your bike against theft by:
The City’s Greenest City Action Plan team, Park Board, Vancouver Police Department, and Vancouver Police Foundation are working with Project 529 Garage to register 10,000 bicycles by 2018.
Read more at: vancouver.ca/streets-transportation/register-your-bike-to-reduce-theft.aspx
registering your bike with 529 Garage bike registry for free
Getting a 529 Garage decal to discourage thieves
locking your bike properly
1
2
3
532015 rePorT CArD | ADDreSSiNG BArrierS 53ADDreSSiNG BArrierS | 2015 rePorT CArD

Education and Promotion
Educating, promoting, and celebrating are important to build a culture in Vancouver that supports and encourages active transportation.
Our aim is for Vancouverites to see walking and cycling as convenient, fun, and normal ways to get around every day.
54 2015 rePorT CArD | ADDreSSiNG BArrierS ADDreSSiNG BArrierS | 2015 rePorT CArD

This is How We Roll Photo Shoot
and Sweepstakes
The City hosted the “This is How We roll Photo Shoot and Sweepstakes” at three locations in July 2015 to promote active transportation and to let people know about upcoming public engagement on the 10th Avenue corridor.
The collection of photos from the shoot show the faces of everyday Vancouverites who get around on foot and bike – and who like to have a little fun while doing it!
One Million Bikes Across
Burrard Bridge
on Saturday, August 22, 2015 at approximately 11:15am, the millionth bike of 2015 crossed the Burrard Bridge. The City held a celebration at the south side of the bridge on Thursday, August 20 to mark the occasion by having people guess the exact time the bike counter would hit one million, as well as handing out fun BikeVancouver swag and “thank you” chocolates to people passing by on bike or on foot.
Bike to Work Week
Bike to Work Week is celebrated across BC every spring, and in Metro Vancouver a second time every fall.
in 2015, close to 12,000 Vancouver residents participated in the spring and fall events (up from 8,200 in 2014). Nearly 2,000 of these participants were new bike commuters (up from 1,500 in 2014).
552015 rePorT CArD | ADDreSSiNG BArrierS ADDreSSiNG BArrierS | 2015 rePorT CArD
Photo Credits
Cover ImageSteve Chou
Page 2Steve Chou
Page 10rod Preston
Page 20Dylan Passmore
Page 24Brian Gould
Page 29Paul Krueger
Page 30rod Preston
Page 33Steve Chou
Page 34Steve Chou
Page 35Paul Krueger
Page 44Paul Krueger
Page 46Dylan Passmore
Page 47Paul Krueger
2015 rePorT CArD | PHoTo CreDiTS56
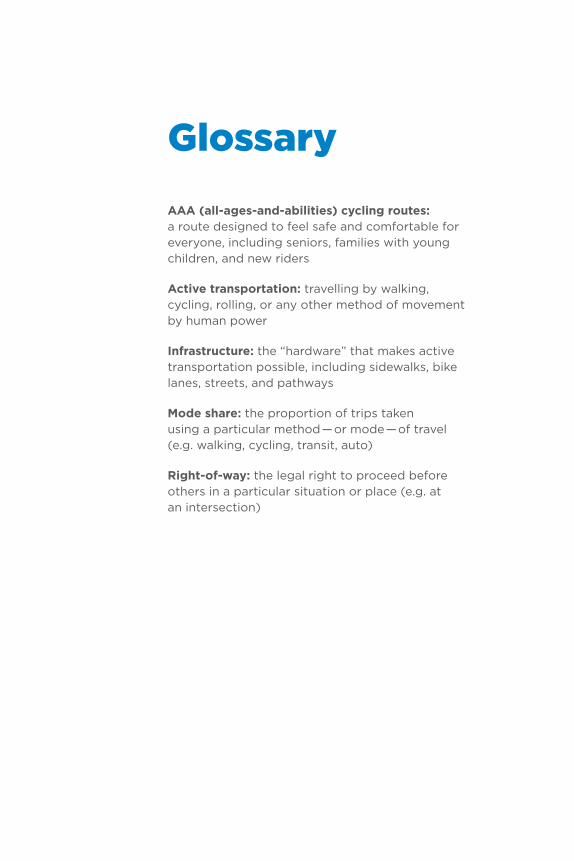
Glossary
AAA (all-ages-and-abilities) cycling routes: a route designed to feel safe and comfortable for everyone, including seniors, families with young children, and new riders
Active transportation: travelling by walking, cycling, rolling, or any other method of movement by human power
Infrastructure: the “hardware” that makes active transportation possible, including sidewalks, bike lanes, streets, and pathways
Mode share: the proportion of trips taken using a particular method — or mode — of travel (e.g. walking, cycling, transit, auto)
Right-of-way: the legal right to proceed before others in a particular situation or place (e.g. at an intersection)

For More information:
Phone: 3–1–1
TTy: 7–1–1
outside Vancouver:
604 – 873 – 7000
vancouver.ca
H i chi tiêt
obtenga información