walla walla subbasin assessment - northwest power
TRANSCRIPT

1
Walla Walla Subbasin Assessment
General Overview Components
Prepared by: Walla Walla Basin Watershed Council Version 2: April 2004
Note: This document was not reviewed or approved by the Subbasin Planning Team, subbasin plan leads, co-managers, or subbasin technical
staff.

2
Introduction History and Description of Planning Entity
The organization for developing the Walla Walla River Subbasin Plan was comprised of the lead agencies, subcontractors, the Planning Team, the Technical Team, and other governmental and non-governmental organizations that will provide local input. The role of each member group is described below.
Lead Agencies and Co-Lead Agency The lead agency for the Oregon portion of the Walla Walla subbasin was the Walla Walla Basin Watershed Council, with the Walla Walla Watershed Foundation serving as its fiscal agent. The co-lead entity for the Washington portion of the subbasin was Walla Walla County. The responsibility of co-leads was to oversee and initiate the planning process and ensure that it was an open and inclusive and there was proper outreach to and input from subbasin stakeholders.
Subcontractors The Co-lead entities subcontracted with consultant(s) to perform the following functions: (1) facilitation assistance, (2) public involvement assistance, and (3) report preparation including technical assistance. The consultants’ roles were to facilitate and assist with the coordination of Technical and Planning Team and Working Group meetings. The consultants worked closely with the Technical and Planning Teams and the Working Group, and compiled, edited, and wrote (as appropriate) various sections of all draft and final versions of the assessment, inventory, and management plan components of the subbasin plan. The consultant worked with the lead agencies to interface meetings with the public and public review process.
Planning Team Drawn from the Walla Walla Bi-State Habitat Conservation Planning Coordination Committee, the Planning Team was organized by the Lead Agencies. This Team was composed of representatives from government agencies with jurisdictional authority in the subbasin and quasi-governmental groups. These individuals were the most active members of the subbasin planning process. Their primary responsibility was to coordinate the process, but they also took the lead in working with stakeholders to develop the vision, the biological objectives, and prioritization of subbasin strategies. Planning Team meetings were held regularly and on a schedule established with the planning team (see attachment ___ for meeting agendas and minutes). All planning team meetings were open to the public.
Technical Team The Technical Team was comprised of fish and wildlife co-managers as well as key members of the Planning Team, and also included technical consultants. Their primary responsibility was to provide and analyze scientific data and review and compile previous reports as part of the subbasin assessment, so planners will have the biological, physical, and management background to refine, validate, and analyze data that will inform development of the management plan. The Technical Team met several times during subbasin plan development and again near the end of the process to review the draft of the plan. All Technical Team meetings were open to the public.
Working Group

3
One or more Working Groups representing key interests and/or geographical areas may be organized as needed to focus on and further discuss key concepts identified through the general public involvement efforts. The Working Groups would assist in further defining critical issues, recommending guiding principles, and identifying and analyzing alternative solutions. All Working Group(s) meetings will be open to the public.
Commissions and Boards County commissions and citizen boards can offer valuable insight and knowledge about the community and the complex issues facing the subbasin. Presentations were made to boards and commissions by the Subbasin Coordinator to keep them informed and an integral part of the process.
Other Governmental and Quasi-governmental Groups Other governmental and quasi-governmental groups also played a role in the planning process. These include but were not limited to: The Confederated Tribes of the Umatilla Indian Reservation (CTUIR) Tribal Council. The Tribal Council governs the interest of ceded subbasin lands. The Tribal Council was kept informed on the process and plan development through their designated representatives. Snake River Salmon Recovery Funding Board. The Salmon Recovery Funding Board is in the process of developing a Regional Salmon Recovery Plan for Southeast Washington. The fisheries portion of the Walla Walla River Subbasin Plan was coordinated regionally with the Snake River Salmon Recovery Plan. Federal Land Management Agencies. The U.S. Forest Service has management responsibility for thousands of acres in the Subbasin. Agency participation was invited, and the agencies were kept involved through their designated representatives. The agencies provided valuable information to inform assessment components, as well as insight and guidance during management plan development. NOAA Fisheries and US Fish and Wildlife Service (USFWS). Both NOAA Fisheries and USFWS are participating in the development of a Basin wide Habitat Conservation Plan for steelhead and bull trout. Communications and coordination efforts with these agencies were expanded to include the Subbasin Plan The Oregon and Washington State Departments of Fish and Wildlife and Natural Resources. These state agencies have an interest in subbasin planning. As with the Tribes and the federal agencies, their participation was a critical factor in developing subbasin plan components, and the agencies that wanted to participate were kept informed through designated representatives. The Oregon Water Resources Department and Washington Department of Ecology. These state agencies have an interest in subbasin planning in regards to water usage, allocation, and regulation. As with the Tribes and the federal agencies, their participation was important in informing planning decisions and constraint Other agencies that wanted to participate were kept informed through their designated representatives.

4
The Oregon Department of Environmental Quality (DEQ). The Oregon DEQ provided extensive information and valuable insight into various assessment, inventory, and management plan components. Its participation was important in informing planning decisions and constraints, and was kept informed and offered assistance through designated representatives.
Lead Entity Description (Oregon Portion) The Walla Walla Basin Watershed Council (WWBWC) is a local, volunteer Board established to improve the conditions of its local watershed as part of the Oregon Plan for Salmon and Watersheds, and is staffed by Director, Hydrologist, Water Conservation Technician, Watershed Planner, and seasonal Hydrologic Technician. The Council is also staffed by a part-time Education Coordinator and Project Manager. Based in Oregon and authorized for creation by the State Legislature and county government to find locally acceptable strategies for watershed improvement, the Council offers local residents the opportunity to evaluate independently watershed conditions and identify opportunities for coordination and cooperation. The WWBWC has taken the initiative implementing watershed management improvements and policy, as well as in providing scientifically rigorous monitoring and analysis to support those areas. The Council draws upon input and guidance from a variety of local, regional, and national sources, including landowners, basin irrigators and water managers, local governmental bodies, and nongovernmental organizations. In addition, the Walla Walla Basin Watershed Council is a co-initiator in convening and drawing upon a basin-wide Technical Work Group (TWG) across the state line. This group is composed of technical experts from state, federal, and tribal agencies, Watershed Council staff, and other nongovernmental organizations. Through it's staff and Board, the Walla Walla Basin Watershed Council (WWBWC) provides crucial local and regional leadership in these ongoing collaborative efforts. Amidst a regional climate of conflict, the Walla Walla Basin has become a unique example of stakeholders from across the political spectrum coming together to seek practical and fair solutions to natural resource challenges. Restoration projects, planning, and monitoring are coordinated within and between the two states that share the Walla Walla Basin. The collaborative aspects to this work have been labeled the "Walla Walla Way" by those involved in the process.
Planning Entity Infrastructure (Oregon portion) Subbasin Planning participants worked as individual teams with some overlap and guidance and coordination provided by the Planning Team, Subcontractors, and Lead Entities (WWBWC and Walla Walla County). The Oregon portion Lead Entity (WWBWC) is guided by a volunteer board composed of prominent local citizens representing a variety of interests and background. Operating on a day-to-day basis through the combined efforts of a Coordinator, Planner, Staff Scientists and Technicians, and Administrative Projects Manager. Major funding and policy decisions are reached by the Council Board by majority vote, and those decisions are carried out by Council staff. Activities undertaken by Council staff are generally separate and distinct, but are driven by a common Mission, Goals, and Objectives, outlined in a Watershed Action Plan (renewed in August of 2003). For legal and financial reasons, the Watershed Council has also established

5
the Walla Walla Basin Watershed Foundation to serve as an associated nonprofit, 501(c)3 entity.
Planning Process Participants Significant participants in the Walla Walla Subbasin Planning Process are summarized in Table 1.
Table 1: List of Planning Process Participants
Planning Process Participant Lead Contact Email
Oregon Coordinating Group Technical Outreach and Assistance Team Phil Roger [email protected] TOAST Oversight Group/Confederated Tribes of the Umatilla Indian Reservation Carl Scheeler [email protected]
Confederated Tribes of the Umatilla Indian Reservation Brian Mahoney [email protected]
Walla Walla Basin Watershed Council Brian Wolcott [email protected]
Walla Walla Basin Watershed Council Bob Bower [email protected]
Walla Walla Basin Watershed Council Eric Pfeifer [email protected]
Oregon Water Department of Water Resources Tony Justus [email protected]
Oregon Department of Fish and Wildlife Tim Bailey [email protected]
Oregon Department of Fish and Wildlife Mark Kirsch [email protected]
Oregon Department of Fish and Wildlife Kevin Blakely [email protected]
Washington Department of Fish and Wildlife Glen Mendel [email protected]
Washington Department of Fish and Wildlife Mark Wachtel [email protected]
Washington Department of Fish and Wildlife Mark Grandstaff [email protected]
USDA Forest Service Dave Crabtree [email protected]
USDA Forest Service Caty Clifton [email protected]
USDA Forest Service Stacia Peterson [email protected]
USDA Forest Service John Sanchez [email protected]
United States Fish and Wildlife Service Charley Cobar [email protected]
United States Fish and Wildlife Service Ron Rhew [email protected]
United States Army Corps of Engineers Ben Tice [email protected]
National Marine Fisheries Service Dale Bambrick [email protected]
National Marine Fisheries Service Nora Berwick [email protected]
National Marine Fisheries Service Doug Baus [email protected]
National Marine Fisheries Service Elizabeth Gaar [email protected]
United States Fish and Wildlife Service Gustavo Bisbal [email protected]
Confederated Tribes of the Umatilla Indian Reservation Craig Contor [email protected]
Confederated Tribes of the Umatilla Indian Reservation Jim Webster [email protected]
Confederated Tribes of the Umatilla Indian Reservation Gary James [email protected]
Confederated Tribes of the Umatilla Indian Reservation Jed Volkman [email protected]
Confederated Tribes of the Umatilla Indian Reservation Veejay Singh [email protected]
Oregon Department of Environmental Quality Don Butcher [email protected]
Private Landowners
Parametrix, Inc. John Marsh [email protected]
Economic and Engineering Services, Inc. Ben Floyd [email protected]
Walla Walla Conservation District Rick Jones [email protected]
Tri-State Steelheaders John Geidl [email protected]

6
Background of Existing Conditions Early Inhabitants Present subbasin conditions reflect land use practices that have occurred throughout its history. The earliest known inhabitants of the Walla Walla River Basin included three Native American Tribes: the Cayuse, Walla Walla, and Umatilla. These peoples primarily sustained themselves as nomadic hunters and gatherers. Although it is difficult to precisely characterize the extent and nature of tribal interactions with their surrounding environment, the impact of indigenous peoples on the Walla Walla basin landscape was certainly substantial, particularly after the introduction of horses and guns to the subbasin. Currently, the populations of both humans and horses are thought to have varied greatly, depending on location (Bower, 2003). For thousands of years, the area has served as a hub for Native American trade and culture, and it is generally accepted that local tribes frequently utilized and/or took advantage of fire to alter the surrounding landscape vegetation and wildlife in important ways, the most important of which being the encouragement of vegetative conditions associated with frequent fire return intervals. A recent Washington State University Water Resource Newsletter (May, 2002) quoted William Robbins:
Because floral and plant successions were critically important to hunting and gathering economies, native people regularly used fire to successfully manipulate the proper environmental conditions to enhance their subsistence prospects (quoted in Bower, 2003).
Localized populations of Native Americans probably had an impact on woody riparian species in certain areas of the subbasin. Exploration and Trapping In 1805, the Corps of Discovery led by Lewis and Clark entered the Walla Walla valley through what is now known as the Touchet river. The large influx of Euro-Americans to the basin began in the mid-1800’s. Generally, at this time, timber and brush mixed with grass and forbs were found in the Blue Mountains, bunch grasses in the mid-elevation portions of the watershed, and wild rye and sagebrush in the valleys (U.S. Dept. of Agriculture, 1941). In 1839, an early explorer near Whitman Mission on the Walla Walla River wrote “The plain about the waters of this river is about thirty miles square. A great part of this surface is more or less covered with bunch grass” (Farnham, 1839). The Walla Walla, Umatilla, and Cayuse Tribes ceded 6.4 million acres of their traditional homeland to the United States in an 1855 treaty (CTUIR website). In 1858, Charles Dickerson, the son of an early settler on Pine Creek (near the city of Milton-Freewater, Oregon), remembered the raw farm land of his childhood as being fertile but covered thickly with clumps of tall rye grass (Caverhill, 1971). Further downstream, Lewis and Clark in 1806, and David Douglas in 1826, noted the surrounding country as being dominated by sagebrush (Sexton and Volkman, 2000). Once Fort Nez Perce (Fort Walla Walla) was established in 1818 by the Northwest French Fur trading company at the Mouth of the Walla Walla River, trappers and hunters were to accomplish a nearly complete elimination of beaver (Castor Canadensis) within the subbasin. The loss of most of the beavers to the Walla Walla may have dramatically affected the riparian communities by reducing the amount and availability of water storage and water table levels. Horses were introduced into the Walla Walla Valley from Spanish settlements to the south in the 1730’s. Native American Indians began to make use of them soon afterward. In the mid-

7
1800’s, large numbers of domestic cattle, sheep, and draft horses were introduced to the area (United States Dept. of Agriculture, 1941). Ultimately most of the rangelands were overgrazed, which led to the condition seen today: native plant populations often being replaced by more competitive introduced plant species and widespread soil loss (Sexton and Volkman, 2000). Agricultural Development The earliest noted agriculture in the valley occurred in about 1825 at Fort Nez Perce, later known as Fort Walla Walla, near the mouth of the Walla Walla River. In 1839, the area around Whitman Mission was primarily wheat, corn, onion, melons, and various other crops (Farnham, 1839). Prior to the establishment of Whitman Mission in 1836, the grass-covered hills were thought to be only suitable for grazing. By 1850, small amounts of cropland were situated along the river bottoms, including some utilizing irrigation. In the fall o f 1863, a farmer sowed 50 acres of wheat on the uplands near Weston and the following summer collected an average of 35 bushels to the acre. From this point forward, land was broken out at an accelerated rate and by the late 1870’s, Umatilla, Columbia, and Walla Walla Counties were considered as one of the leading regions in producing cultivated grains (United States Dept. of Agriculture, 1941) (Sexton and Volkman, 2000). Much of the following has been derived from Bower’s History of Riparian Vegetation Along the Walla Walla River (2003), which is still provisional and subject to revision. The Whitman Mission became a fundamental settlement foothold as it became a regular stop for settlers traveling the Oregon Trail. Some settlers opted to stay on at the mission and settle in the Walla Walla Valley area. However, the “Whitman Massacre” and subsequent local and regional Indian Wars (1845-58) kept settlement of the Walla Walla valley to a minimum until after the third major war in 1858. It was from that point forward that settlers began to populate the valley in force. The settlement and subsequent land use changes brought the next major influences to changes in the riparian vegetation communities. Captain Mullan took particular note of the amount of settlements that had occurred by 1860, “The valley bottoms are nearly all densely settled; the land in the bottom being sufficient for farms of considerable size…” (Mullan, 1863; quoted in Bower, 2003). Settlement of the valley continued with settlers focusing on homesteads and farms in or near the riparian areas of the Walla Walla River. Lyman wrote of the first settlements in the late 1850s and early 1860s: “The first locations were mainly near the vicinity of the present City of Walla Walla, with a few on the Touchet… the first settlers generally sought locations convenient to water, with bottom land where they thought grain and vegetables might flourish, but with the range of luxuriant bunch-grass as the essential consideration.” The city of Walla Walla was named and officially established on November 17, 1859. This “musical” name1 was “commonly suppose[d] to mean the ‘Valley of Waters’, referring to the numerous springs in the vicinity of the city.” Lyman also noted that “the Walla Walla [River] above that point was commonly known to the Indians as ‘Tum-a-lum’.” That name coincides today with the name of a school and bridge in the Oregon portion of the river downstream of today’s Milton-Freewater (Bower, 2003).
1 “Many poetic and some prosaic accounts have been given of the origin of the name. Among others, Joaquin Miller, “Poet of the Sierras,” insisted that when the French voyageurs first looked down from the Blue Mountains (“Les Montagnes Bleues” in their Gallic speech) upon the fair fertile valley, they exclaimed: “Voilá Voilá!” (Behold Behold!) and thus the name became fixed. This fantastic idea is, however, easily disproved by the fact that Lewis and Clark, who entered the country by Snake River, got the name from the Indians, on the Columbia near the mouth of the Walla Walla.” (Lyman, 1918)

8
Initially, irrigation ditches were easily created by appropriating existing streams that broke away from Mill Creek above the present city of Walla Walla and the Walla Walla River Main Stem above the present city of Milton-Freewater. These streams essentially became de-facto irrigation ditches. Several of these streams remain today in conditions that range from relatively-intact to substantially altered. The lower reaches of many continue to offer rearing habitat for salmonids and resident species, raising concerns for current fish and water managers. As agriculture in the Walla Walla Valley continued to expand, so too did the availability of large machinery capable of manipulating the landscape. Harper et al. (1938) indicates that steam-powered tractors were available in Umatilla County (Oregon) in 1904 and 1905, caterpillar-type gasoline-powered tractors were introduced from 1907 to 1909, and diesel oil-burning caterpillar tractors could be purchased in 1932. Riparian areas were cleared for farming and grazing, and extensive channel straightening had begun (Bower, 2003). Following the introduction of horses, the next major agricultural development with the potential to influence the riparian vegetation was the gold rush. The Walla Walla River Valley has a proud history of agricultural development ranging from hunting and gathering in early times to modern day orchards, vineyards, and grain and row crop farming. Lyman writes:
“Anticipating the rush for the mines in the year 1862, a great deal of livestock had been brought to the Walla Walla Country in the latter part of 1861, while the demands for food products led many ranchers to make provisions for raising greatly increased crops of grain and other produce to meet the demands of the coming season” (quoted in Bower, 2003).
Like the horse, agricultural livestock such as sheep and cattle could have influenced the riparian vegetation along the Walla Walla River by grazing. This would be particularly true in the early years of their introduction when fencing was all but non-existent. The seasonal changes of water availability in the Walla Walla River basin would also have helped to focus the impacts of grazing to near-river areas. The relevant abundance of green forage and proximity to drinking water make riparian areas alluring particularly during the dry mid-to-late summer months when surrounding ground dries out. While the mechanical impacts of grazing would focus effects on riparian grass and shrub species, longer-term effects could show up in the form of bank destabilization and subsequent channel incision2. It is commonly thought that as a river channel incises, the net effect is the narrowing of the riparian area width and a drop in the water table making it more difficult for riparian plants to reach water. The consequences of this can range from limited riparian vegetation production to an outright shift in the type of riparian communities. Grazing on riparian vegetation could have occurred at any location in the watershed, but initially was most likely limited to areas near valley settlements (Bower, 2003). Agricultural development and subsequent impacts on riparian vegetation along the Walla River continued through the 1800s and 1900s. Donald Meinig, in his 1953 thesis The Walla Walla Country: 1805 –1902, A century of man and the land, depicted the successional transition of agricultural land use in the Walla Walla River basin (Figure 2). Initially a predominantly range and livestock based system, agriculture transitioned into a more space-based farming system. By 1910, the valley had already transitioned to what we typically see today with more than 90% of the agriculture being based in orchards, grains and row crop farming (Bower, 2003).
2 Channel Incision is generally understood to mean a stream or river channel that has eroded downward causing the river channel to deepen.

9
Figure XX: History of Agriculture Development in the Walla Walla Subbasin (Bower, 2003)
According to Bower (2003), historical agricultural land activities may have affected the riparian vegetation in a variety of ways including: • Channel straightening and bank stabilization to protect fertile flood plain crops, pastures,
and farm buildings. • Mechanical and chemical removal of streamside vegetation for farming near or in the
historical riparian vegetation areas. • Transformation of Walla Walla River Branches, particularly the East and West Little Walla
Walla systems, into irrigation ditches and the subsequent removal of riparian vegetation. Although the overall effects of agricultural development have been basin-wide, the first activities focused on the mid-section of the Walla Walla River, near the first settlements. However, today agricultural land use stretches from the mouth to the forested headwaters (Bower, 2003). Forestry Management The history of timber harvest in the Walla Walla River basin is similar to western United States regional trends. Logging of both the uplands and riparian tree species has occurred throughout much of the three major drainages of the Walla Walla River: Mill Creek, North and South Forks of Walla Walla Rivers. Historically riparian tree species were removed and either allowed to regenerate naturally or were actively re-planted after harvest. Forest management activities

10
and logging have been conducted by both private and public entities. A large influx of settlers in the 1880s created a demand for wood. Riparian forests had fairly extensive amounts of cottonwoods (especially along the Touchet River), but in comparison the nearby Blue Mountains were heavily timbered with coniferous trees (Lewis and W.Clark 1893, McKinney 1998). Early timber cruisers felt the timber supply in the Blue Mountains was inexhaustible. Logging activity was centralized in the Upper Touchet River Subbasin on the Cahill, Eckler, and Robinette Mountains, and Lewis Creek and the Wolf Fork Touchet River. Timber harvest averaged 13,000 board feet per day. Oxen and an 18-mile long flume from the upper Robinson Fork to the town of Dayton were used to transport logs until 1900 (McKinney 1998). Early harvests focused on the most profitable trees, large Douglas-fir and Ponderosa pine. Harvest shifted to western larch, grand fir, white fir, and lodgepole pine once Douglas-fir and Ponderosa pine supplies were exhausted. Logs were commonly yarded across streams, destroying spawning grounds. Stream channels were also modified to reduce road construction costs (Van Cleve and Ting 1960). Clearcutting was the logging method of choice. In recent history, the Mill Creek and South Fork Walla Walla River drainages have set aside from logging. The upper portion of the Mill Creek watershed was set aside by the USFS (in cooperation with the City of Walla Walla) for water quality purposes because it provides a majority of the municipal water for the City of Walla Walla. The upper South Fork Walla Walla River drainage, mainly under federal control of United States Forest Service and the Federal Bureau of Land Management for water quality protection and for fish habitat and production. Under these more recent management strategies, riparian vegetation is allowed to regenerate and flourish based on natural selection and successional processes. Logging continues in the North Fork Walla Walla River drainage on lands that are in private ownership (Bower, 2003). Other changes in riparian vegetation in the forested upper parts of the basin have evidence of having been affected by a variety of other factors including: • Fire suppression. • Introduction of non-native stock and/or noxious weed species. • Insects. • Disease. Numerous research and historical documents have been written discussing both the historical and current effects of management in these upper areas of the Walla Walla River Basin. David Powell’s Historical References About Vegetation Conditions: A Bibliography With Abstracts (Powell, 1999) provides 983 separate references for the Umatilla National Forest alone, of which the Walla Walla River basin exists. As comprehensive review of these documents is outside the time available for this study. Interested readers are encouraged to review Powell’s work (Bower, 2003). Aquatic Species Background Historical accounts clearly indicate the presence of several now-extinct species of salmon in the Walla Walla River. Some species, particularly fall chinook and chum, were likely spillover from the Columbia River, essentially of Columbia River origin but using the lower portions of the Walla Walla River for spawning. Nevertheless, according to Swindell (1942), runs of spring and fall Chinook, chum, coho, and sockeye salmon are reported to have been present at some level . Several historical journals remark that the Touchet, Mill Creek, mainstem Walla Walla River, and various other tributaries contained healthy populations of spring Chinook salmon at one
11
time. The last spring Chinook salmon run of any significance was reported in 1925 (Van Cleve and Ting, 1960) (specific numbers?). By 1955, only 18 spring Chinook salmon were reported to have been captured in the sport fishery (Oregon Game Commission, 1956 and 1957). Local and regional summer steelhead and bull trout are presently listed as threatened under the Federal Endangered Species Act (ESA) (Sexton and Volkman, 2000).
Over the past 150 years, subbasin aquatic species have been heavily impacted by high levels of water appropriation and inadequate passage conditions. In 1950, Nielson reported a total of 130 points of water diversion in the basin, of which 123 had no protective fish screen of any kind. Numerous historical journals report “sacks of smolts” being collected from the cropland fields in the spring outmigration months. Early accounts by local inhabitants note that annual returns of spring chinook salmon reduced dramatically following the construction of Nine-Mile Dam at Reese, Washington, in 1905 (Nielsen, 1950; Van Cleve and Ting, 1960). Van Cleve and Ting (1960), while summarizing data for the period of 1935-36, wrote that it would be practically impossible for spring Chinook salmon to ascend the river under the circa-1930s system of water use (Sexton and Volkman, 2000). During the summer irrigation season (especially June through September), the amount of water flowing through the mainstem of the river has traditionally been reduced by diversions throughout the river and its tributaries as water was drawn for irrigation of crops and pastures. For over 75 years, the Walla Walla river went dry on an annual basis, often leaving many fish stranded in pools. Until recently, Fish biologists from the Oregon Department of Fish and Wildlife and Confederated Tribes of the Umatilla Indian Reservation biologists conducted “fish rescue” operations to relocate the fish. In addition to irrigation, the natural flow of the “Tum-A-Lum” branch of the braided river system was affected by the flood control levee and gravel mining, which likely increased water seeping into the shallow aquifer.
Urban Development
Cities and towns began appearing in the Walla Walla Basin around the 1860s. The city of Walla Walla was founded in 1858. At that time it was called “Waiilatpu,” which has been interpreted as: “Place of the People of the Rye Grass.” Waitsburg soon followed and had a population of 107 by 1869. Dayton was platted in 1872. The Walla Walla area was a popular site for settlement. By 1910 the population of Walla Walla had risen to 20,000 people. There was even talk of making Walla Walla the state capitol (Meinig 1968). The most dramatic influence along this lower Oregon portion of the Walla Walla river is the construction of a flood control levee above and through the town of Milton-Freewater. The levee was originally designed and constructed in the 1940s and completed in 1952 (USACE, 1997). A devastating flood early in 1965 destroyed much of the original levee structure. Following the flood, local groups and the USACE rebuilt a reinforced version of the levee that is provides flood control today. While the levee provides critical flood protection for the citizens of Milton-Freewater, its design and size make it necessary to remove riparian vegetation in and on the levee control structures. For approximately the past 40 years, most, if not all, of the riparian vegetation was removed creating a straightened, unshaded, degraded riparian habitat section of the Walla Walla River. While the entire levee length of the levee is seven miles (from Joe West Bridge to Tum-a-lum Bridge), the majority of intensive vegetation management has taken place along the section of levee near the town of Milton-Freewater. The population of the valley’s cities and towns has continued to increase through the most recent decades. The 2000 United States Census reported approximately 129,000 people in
12
Walla Walla and Umatilla Counties (US Census, 2000). Generally, population growth and urban development can lead to the impediment, exclusion or removal of riparian vegetation in activities such as: • Construction of streamside roads and water crossings including road and railroad bridges • River channel and straightening using rip-rap such as large boulders, trees, and old
automobiles and farm equipment. • Displacement of the riparian zone through building construction in the near-river areas. • Displacement of native vegetation through the introduction of non-native noxious weeds and
plants. • Removal of larger riparian tree species in order to protect downstream buildings and bridges
during major flood events. Most of the impacts caused by settlement and development have been focused on the lower and middle portions of the Walla Walla River system because this is the area that hosts the majority of the valley’s population. Residing downstream of extensive transient snow zones,the Walla Walla Valley is prone to flood-related damage. On June 28, 1938, the Flood Control Act was passed in Congress, which called for two projects to be built in the Walla Walla Valley: the Mill Creek Flood Control Plan and the Mill Creek Channel. The Army Corps of Engineers completed the Mill Creek Flood Control Plan in 1943, the first of two projects. The project was created to divert as much as 4000 cubic feet per second (cfs) of water from Mill Creek in times of flood. The project included a diversion structure that was built across Mill Creek at Rooks Park, diverting water to the south into an intake channel that ran to a reservoir (Figure 1). A return canal was able to drain water held in the reservoir back into Mill Creek when the potential for flooding subsided. Also included in the project was an additional diversion device located approximately half a mile downstream from the first diversion. This device diverted water from Mill Creek into Garrison and Yellowhawk Creeks, directing the water south of the City of Walla Walla. The Army Corps of Engineers completed the Mill Creek Channel in 1948. This project was initiated in order to channelize Mill Creek though the city. Concrete barriers, walls, floors and waterfalls, as well as gabions, were constructed along its shores to create the channel. Both structures have been proven to be successful at preventing extensive flood damage to the City of Walla Walla. As would be expected, flood-control activities on the middle and lower reaches of Mill Creek as it approaches the city of Walla Walla have exerted a profound impact upon existing hydrologic, chemical, and biological conditions in this reach, which are discussed in other sections of this assessment and others.
Numerous shallow wells (30’-300’ deep) tapping into the valley floor continue to influence shallow aquifer levels, contributing to seasonal draw-down that fluxuates annually according to precipitation during the winter and sprint. This annual draw-down and recharge occurs in an unconfined aquifer composed of numerous alluvial strata superimposed atop a bedrock basalt layer. There is a high degree of hydraulic continuity between surface springs and streams and aquifer levels in the region, which primarily lies north and west of Milton-Freewater. An increase in the overall amount of well use and reduced surface water supplies available for use (which leads to increased strains on shallow ground water resources) have, to some extent, negatively impacted both surface flows in some groundwater-influenced streams, and overall groundwater levels.

13
The traditional use of all the water in the river became an issue of political concern once bull trout were listed in 1998 and steelhead in 1999 as threatened species in the Walla Walla River under the Endangered Species Act. Federal agencies considered direct intervention and conservation groups considered lawsuits against the irrigation districts to enforce the law. Unlike other water users in Western watersheds (in particular, the Klamath and Methow basins), Walla Walla basin irrigators whose livelihoods depend on water for their farms stepped forward with a proactive willingness to reach a mutually-acceptable agreement with federal agencies and conservation groups. The Walla Walla Basin Watershed Council, along with Kooskooskie Commons and the Confederated Tribes of the Umatilla Indian Reservation, helped facilitate a negotiation process that led to a compromise solution.
Beginning in 2000, three irrigation districts (representing the majority of surface water use in the subbasin) pledged to keep a minimum water flow in the river and signed an agreement to this effect with the U.S. Fish and Wildlife Service. Two of the irrigation districts that signed the agreement divert water in Oregon (Hudson Bay District Improvement Company and Walla Walla River Irrigation District). During the driest part of the season, they left 13cfs in the river. The third district (Gardena Farms Irrigation District #13) is located in Washington, west of the City of Walla Walla, and left 10cfs in the river. The instream water improved flows and helped provide a continuous flow for passage to upriver for any bull trout and other fish in the mid to lower river sections.
In 2001, the Oregon irrigation districts bypassed 18cfs and the Washington irrigation district bypassed 14cfs. In 2002, they left a minimum of 25cfs in the river in Oregon and 18cfs in Washington, a level that challenged the districts and irrigators within the districts to rapidly become more efficient but that is expected to be sustainable. The most common efficiency practices adopted include drilling deep wells (at irrigator expense), installing on-farm storage sites, piping delivery ditches, and sprinkler conversion. The Districts have also reduced river fluctuations caused by their operations to prevent the stranding of fish. Cost-share assistance from state, federal, and BPA sources have been essential for the survival of the affected districts and farms.
Water Rights along the mainstem of the Walla Walla River are currently seasonally (summer irrigation season) over-appropriated and likely impact ESA-listed bull trout & summer steelhead (B. Bower, WWBWC, personal communication, June, 2002; cited in Saul 2001). A century of seasonally over-appropriated water use for irrigation diversions, shallow aquifer wells for rural use, flood control structures, and excessive fishing have impacted both the instream flows, ground water levels and the habitat potential for ESA listed bull trout and summer steelhead. Some streams, particularly the “Spring Branches” of the Walla Walla river and Little Walla Walla River have likely seen flow improvements as a result of seasonal irrigation raising groundwater levels in some areas of the basin.
Recent efforts by the Umatilla Tribes, the Corps of Engineers, Departments of Fish and Wildlife (WA & OR), and irrigation districts have addressed most of the instream barrier structures. The three main irrigation districts are also implementing conservation and irrigation efficiency programs to increase instream flows with assistance from the Bureau of Reclamation, Oregon Water Resources Department and the Walla Walla Basin Watershed Council. However, the possible effects (with regard to the basin water budget) of transferring surface water rights to ground water rights and increasing instream flows are unknown (Bower, 2002).
14
The hydrologic connectivity between the shallow aquifer and surface flows along the mainstem of the Walla Walla River (Oregon) has been impacted over the years by human activity including the construction and maintenance of a flood-control levee system, extensive in-channel gravel mining, and the use of numerous shallow aquifer domestic and agriculture wells. It is speculated that these human-induced disturbances of the river’s characteristics and ground water levels have significantly impacted the ability of the mainstem to carry surface flow, making it an influent river during the dry summer months. Thus, up to 50% of water bypassed by the irrigation districts appears to seep into the gravel substrate within a relatively short distance from the bypass point at the Little Walla Walla diversion (Bower, 2002).

15
Subbasin Overview Subbasin Description
Location and Characteristics Figure 1. Location of the Walla Walla subbasin within the Columbia plateau ecoprovince (Saul 2002).

16

17
N
CountiesColumbiaUmatillaUnionWalla WallaWallowa
Walla Walla sub-basinMajor StreamsMajor RoadsTownsState Boundary
Ayer
Touc
het N
orth
Sudbu ry
Ha r ve y Sh aw
St at e Hw
y 12 5
Mill Creek
Touc
hetLuckenbill
State Hwy 204
Frog Hollow
Stat
e Hw
y 11
Wol f For k
State Hwy 124US Hwy 12
Gardena
Umapine
Whetst
one
Bruce
Mou
n t P
lea s
ant
Tucker
Cott onw
ood
US Hwy 12
Patit
Walla Walla
Dayton
College Place
Milton-Freewater
Waitsburg
Weston
Dixie
Prescott
MILL CR
TOUCHET R
PINE C
R
DRY CR
DRY CR
WALLA WALLA R
WO
LF CR
WHETSTONE HOLLOW
BIRCH CR
TOUCHET R, N FK
WHISKEY C
R
TOU
CHE
T R
, S F
K
WALLA WALLA R, S FK
SPRING VALLEY
WALLA WALLA R, N FK
RO
BINS
ON
CR
PATIT CR
RUSSELL CREEK
COTTO
NWOO
D CR
COPPEI CR
BLUE CREEK
JIM CREEKLEWIS C
REEKSPRING CREEK
COUSE CR
WALLA WALLA R
TOU
CH
ET R US
Hw
y 12
Washington
Oregon
10 0 10 KilometersData Source: ICBEMP
Figure 2. The counties, towns, major roads, and major streams contained within the Walla Walla subbasin (Saul 2002).

18
Figure 3. Elevation and topography of the Walla Walla subbasin (Saul 2002).

19
Figure 4 Jurisdictional boundaries and land ownership within the Walla Walla subbasin (Saul 2002).

20
Jurisdictional Authorities and Land Ownership Because the Walla Walla subbasin occurs in two states and five different counties, it is subject to a number of different jurisdictional authorities. Federal land management entities include the U. S. Forest Service (Umatilla National Forest) and the U. S. Bureau of Land Management. All lands managed by the Forest Service (USFS) and Bureau of Land Management (BLM) are located in the Blue Mountains along the eastern side of the subbasin (Saul 2002). The McNary National Wildlife Refuge is managed by the United States Fish and Wildlife Service. State management entities in the subbasin include the Washington Department of Fish and Wildlife (WDFW), Oregon Department of Fish and Wildlife (ODFW), Oregon Department of Forestry (ODF), Washington Department of Natural Resources (WDNR), Oregon Department of Environmental Quality (ODEQ), Washington Department of Ecology (WDE), the Oregon Water Resources Department (OWRD), the Washington Department of Agriculture, the Oregon Department of Agriculture (ODA), Umatilla County, and Walla Walla County. The small portions of Union and Wallowa county contained in the subbasin are owned and managed by the United States Forest Service. Figure 4 shows jurisdictional boundaries and land ownership within the Walla Walla subbasin. Despite the majority of the subbasin being privately owned and managed, the CTUIR maintain reserved rights under the Treaty of 1855 for the harvesting of salmon, wildlife, and vegetative resources at “usual and accustomed places” (U. S. Army Corps of Engineers 1997).
Physical Environment Topography and geology
The topographic features of the Walla Walla subbasin range from low relief plateaus and rolling hills dotted with steptoes, to steep, high relief breaks, narrow valleys and deeply entrenched major streams (Nesser, 1997). The features are a result of high magnitude geologic events, including prehistoric catastrophic flooding, volcanism and plate tectonics (Saul 2002). Intense volcanism during the Miocene epoch (between 17 and 6 million years ago) produced multiple lava flows that blanketed the region. Because individual flows occurred over a protracted time frame (11 million years), each maintained a unique geophysical formation (Orr and Orr 1996). As the formations were stacked upon one another they began to take on the appearance of a layer cake, which eventually filled the Walla Walla and surrounding area with up to 3.2 kilometers (2 mi) of Columbia River basalts. The current topography of the basin is directly related to the folding, faulting, and erosion of these formations, creating a regional structure that dips westward from the Blue Mountains, southward down the Touchet Slope (the area between the Walla Walla and Touchet Rivers), northward from Horse Heaven Ridge, and eastward from a dividing ridge in the lower Walla Walla valley (Newcomb, 1965). The gentle sloping of the lowlands is also due to a gradual sinking of the earths crust from the weight of the lava upon it (e.g. Allen et al. cited in Bryce and Omernik 1997). The three major formations that occur in the Walla Walla subbasin are the Saddle Mountains, Wanapum, and Grande Ronde. The Grande Ronde flows were the most significant since they are estimated to have accounted for more than 85% of the Columbia River Basalt Group, within which Wanapum and Saddle Mountain Basalt Groups are included. The flow thickness can range from five feet to as much as 150 feet, and collectively is estimated to be hundreds to thousands of feet thick (Newcomb 1965). Sedimentary deposits, or paleosols, may be interspersed between the layers of basalt, as soil genesis and/or deposition occurred between successive flows (Saul 2002).

21
Plate tectonics have played an important role in shaping the topography of the subbasin. The most prominent topographic feature of the Walla Walla are the Blue Mountains, a range that is thought to have originated as a group of offshore islands in the eastern Pacific Ocean during Devonian to early Jurassic time (275 to 200 million years ago) (Bryce and Omernik 1997). Collisions and divisions of continental plates caused a progression of folding, faulting, and uplifting of the underlying Columbia River basalt formations and ultimately formed the southern lobe of the Walla Walla subbasin (Bryce and Omernik 1997). The portion of the uplifted basalt plateau in the Walla Walla ranges in elevation from 915 to 1,800 meters (3,000 – 6,000 ft) (Bryce and Omernik 1997). The foothills of the Blues, or Deep Loess Foothills subregion, could be a disjunct portion of the Palouse Hills subregion, as both areas share similar soil types, precipitation range, and land use capability with annual cropping possible (Bryce and Omernik 1997). The difference is partly topographic, as the Deep Loess Foothills are terraced and the Palouse Hills dune like (Saul 2002). The effects of Pleistocene glaciation have greatly influenced Walla Walla topography. The advancement and retreat of glaciers scoured and shaped much of the subbasin, and in the process created voluminous amounts of silt and sand, also referred to as loess. Glacially generated winds redeposited much of the loess across the region, forming the characteristic dune-like mounds common to the Palouse. The blanket of loess was violently stripped away following landscape-shaping flows delivered by periodic breaching of an ice dam on the Clark Fork River near present-day Missoula Montana (Orr and Orr 1996). Each of the 40 cataclysmic flows of water that poured into the Columbia Basin are said to have contained up to 10 times the volume of all rivers in the world (Allen et al. 1986), or 400 cubic miles of water each (Orr and Orr 1996). Although the flows took divergent paths between Montana and southeastern Washington, all floodwater streams flowed into the Pasco basin where they were temporarily backed up by a single outlet through Wallula Gap in Washington (Orr and Orr 1996; Alwin 1970). The impounded water created the 1,000-foot deep Lake Lewis, whose fluctuating levels eventually deposited 40 distinct layers of silts and sands currently seen at the Touchet Beds in Washington (Orr and Orr 1996). The highest point in the subbasin is 6250 feet at Table Rock, while the average elevation of the Blue Mountains is 5,000 feet. The topography of the Blue Mountains features numerous flat-topped ridges and steep stair-stepped valley walls formed by the Miocene basalt flows that engulfed the folded, faulted, and uplifted granitic core of the mountains. The valley lowland extends from the center of the basin north to the divide between the Touchet and Snake Rivers and south to the Horse Heaven Hills. Land surface elevations of the lowland province range from 2,500 feet at the base of the Blue Mountains to less than 270 feet at the confluence with the Columbia River (Saul 2002). Geologically, the upland areas influenced by a maritime climate are comprised almost entirely of Columbia River basalt (Bryce and Omernik, 1997). Flows of Miocene lava inundated and subdued previous erosional topography, building a vast plateau that all but covered the tallest peaks in the Blue Mountain range (Orr and Orr 1996). The soil of the region, however, is not a direct reflection of the basalt parent material. A thick ashcap, derived from eruptions of Mount Mazama, Mount St. Helens, and Glacier Peak, covers the Blue Mountains and is common in Maritime-Influenced areas (Bryce and Omernik 1997). Because of the maritime influence and vigorous growth of vegetation, ashy soils in forested upland areas have minimal erosion rates. Erosion is higher in the lower elevation loessial soils. Soil temperature and moisture regimes in the Blues range from mesic and typic xeric in foothill and mid-elevation portions, to cryic and udic at higher elevations (Nesser 1997).

22
Fertile soils formed from Pleistocene silt and sand blanket the subbasin. The oldest of the Pleistocene deposits were washed down from the canyons of the Blue Mountains and are referred to locally as the “old gravels and clays” (Newcomb, 1965). These deposits filled the structural troughs formed by folded basalt layers. Younger deposits belong to the Palouse loess formation, which covers the entire area of the Columbia Plateau. Palouse loess is of granitic and metamorphic origin, and was glacially and aerially transported to the subbasin over the past 50,000 years (Baker et al. cited, in Bryce and Omernik 1997). Although relatively uniform in distribution, Palouse loess varies in thickness. The deepest loess generally occurs on the southerly aspect of hills in the north central and northeastern portions of the subbasin. Thinner loess deposits are located on north aspects of hills, or near stream channels, which were the areas most susceptible to the scouring effects of persistent southwest winds and the Missoula Floods (respectively) (Saul 2002). Besides being highly fertile, the loess soils tend to absorb and hold water beyond one growing season and have therefore been converted to agricultural uses, especially dryland crops like wheat. The high erosivity of loess is problematic for certain agricultural practices however, and has contributed to some of the highest soil loss rates in the United States (CTUIR, 1990). Farming on steep slopes and farming practices such as clean tilling fallow fields has lead to average sheet/rill erosion rates of 44.8 tons per hectare (20 tons per acre) (Bryce and Omernik 1997). Much of the annual sediment load conveyed in the Touchet and Walla Walla Rivers is agriculturally derived loess (e.g. Kuttel 2001). Alluvium, gravel, sand, and silt are common in the lower elevation portions of the subbasin. Floodwaters that tore through the channeled Scablands of north-central Washington dropped their load of loess, sand, and outwash gravel in the prehistoric Lake Lewis basin (among others), and along primary channels (Bryce and Omernik, 1997). The Touchet Beds reflect the sediment load deposited by periodic fluctuations in lake levels approximately 1.8 million years ago (Orr and Orr, 1996), while the deep beds of alluvium along primary river channels provide evidence of the bedload deposited by Pleistocene floodwaters. Geologists also believe that the numerous large erratics located in the Walla Walla Valley were entrained in ice and subsequently redeposited following the recession of Lake Lewis floodwaters (Baker et al., Cited in Bryce and Omernik, 1997). Deposition of upland and fluvial sediment is common in lower elevations, a fact supported by the numerous miles of entrenched and embedded stream channels in the lower Touchet and Walla Walla Rivers (e.g. Kuttel, 2001). Upland erosion rates in this area are low however, due to low precipitation amounts and the gentle topography (Watershed Professionals Network, 1999). Although highly erosive Pleistocene lake sediments are easily entrained during runoff or following storm events, they are equally likely to be deposited in this low gradient portion of the subbasin. Combined with bank and channel erosion, the continual accrual and deposition of upland sediment has gradually created secondary floodplains in many Pleistocene Lake Basins stream channels (Kuttel, 2001). Where protected, many of the new floodplains are being colonized by riparian vegetation, but in many places where protection is needed, the streambanks are raw and eroding (Kuttel, 2001). Similar examples of eroding banks can be found in channel reaches that have been straightened and allow for high water velocity. Lower-elevation bedrock in the subbasin is composed of layer upon layer of basalt, extending in some areas to depths of 3,648 meters (12,000 feet; Bryce and Omernik, 1997). Low amounts of precipitation in this part of the subbasin limits soil genesis and productivity. Soil on the north side of ridges is thin and of basalt origin, while soil on the south side of ridges is aerially deposited loess that varies in depth (Bryce and Omernik, 1997). Land use capability is

23
accordant with soil types and precipitation amounts, and may include dryland wheat farming on southerly aspects and grazing on northerly aspects. The soil types of the Umatilla Plateau subregion mark a transition from nonforested loessial soil to the forest soils of the Blue Mountains (Bryce and Omernik, 1997). As the rolling wheat fields grade into the foothills of the Blue Mountains, the deep loess becomes thinner and more interspersed with basaltic rock fragments (Bryce and Omernik, 1997). Land use transition is accordant with changes in soil type, changing from dryland wheat farming to grazing. The soils in the upper Walla Walla subbasin and their uses are briefly described below:
Alluvial soils are on nearly level to gently sloping valley bottoms near the rivers and creeks, fanning northwest from Milton-Freewater. They vary from excessively to poorly drained. These soils are often irrigated and are adapted to a wide variety of crops.
The Athena-Palouse-Waha association of soils occur east of Milton-Freewater on the lower slopes of the Blue Mountains. Most of the Athena and Palouse and a part of Waha is cultivated in annual cropping rotation of winter wheat and green peas. The remainder of these soils is in range with a dominant native vegetation of Idaho fescue and bluebunch wheatgrass. These soils are well adapted to irrigation except in areas with Umatilla National Forestavorable topography.
The Ritzville-Starbuck association of soils is developed from loess and found mostly on the northwestern end of the subbasin. Most of the Starbuck and some Ritzville is used for range. Ritzville soils are well adapted for irrigation.
The Sagemoor-Quincy-Taunton association of soils is formed on the medium-textured glacial sediments and also located in the northwestern corner of the subbasin. Winter range for sheep is the principal use of these soils with the vegetation being bluebunch wheatgrass, annual grasses, and sagebrush. A small portion of Sagemoor is producing wheat successfully. These soils are reasonably well adapted to irrigation.
The Tolo-Klicker association occurs in the eastern subbasin, in the high country of the Blue Mountains with nearly level to gently sloping uplands which break off to very steeply sloping canyon walls. Most of these soils support a forest or mixed-forest-grass type vegetation which is used for summer grazing of livestock. Minor areas of all the deep soils are cultivated and produce small grains, legumes, grass, and berries. The shallow, stony soils are used for range.
The Waha-Snipe association is found on the lower slopes of the Blue Mountains from nearly level to very steep slopes. These soils are used mostly for relatively high-producing range. The major vegetation is Idaho fescue, bluebunch wheatgrass, and shrubs.
The Walla Walla series of soils has four phases, each developed from loess. Two are present in the subbasin — Walla Walla and Walla Walla high rainfall — and are used for wheat production in both a wheat-fallow rotation and a wheat-green pea rotation. Both would be very well adapted for irrigation (U.S. Bureau of Reclamation, 1999).
Climate and Weather

24
Climate in the Walla Walla subbasin is continental with a marine influence. The climate is generally arid, with cold winters and hot summers. Topographic features such as the Rocky Mountains to the east, Cascade Mountains to the west, and Pacific Ocean beyond the Cascades, have direct bearing on prevailing easterly and westerly winds. The Rocky Mountains block the subbasin from the westerly-moving continental air masses, while the Cascade Mountain range blocks the majority of the easterly-moving maritime air masses that originate from the Pacific Ocean. The result is a rain shadow effect, which contributes to the general aridity of the subbasin. Annual precipitation amounts vary by subregion (Table 2). For example, ecosystems within the Pleistocene Lake Basin subregion near the confluence of the Columbia River receive less than 25 centimeters (9.8 inches) every year, compared to ecosystems in the Maritime Zone, which may receive over 100 centimeters (40 inches) annually (U. S. Army Corps of Engineers, 1997;). Precipitation in the maritime zone is the highest of anywhere else in the subbasin. The climate in the maritime zone is influenced by a unique break in the Cascade Range and Columbia Gorge that allows marine weather to directly funnel through to the Blue Mountains (Bryce and Omernik, 1997). The wet weather is intensified with the orographic lifting produced from the rise of the Blues, delivering rain and snow to the area three out of four seasons. Because it’s a snow-dominated area, the Maritime Zone is the region in the subbasin most likely to contribute to the effects of flooding brought on by an early spring thaw or rain-on-snow events (Saul 2002) Table 2: Annual precipitation range of Level IV subregions in the Walla Walla subbasin (Bryce and Omernik 1997)
Level IV Subregion Annual Precipitation (cm) Annual Precipitation (in) Loess Islands 17.8 – 45.7 7.1 – 18.0 Umatilla Plateau 20.3 – 58.4 8.0 – 23.0 Pleistocene Lake Basin 15.2 – 30.5 6.0 – 12.0 Yakima Folds 15.3 – 38.1 6.0 – 15.0 Deep Loess Foothills 40.6 – 58.4 16.0 – 23.0 Maritime-Influenced Zone: 58.0 – 100.0 23.0 – 40.0
Mesic Forest 58.0 – 85.0 23.0 – 33.5Subalpine Zone 38.0 – 100.0 15.0 – 40.0
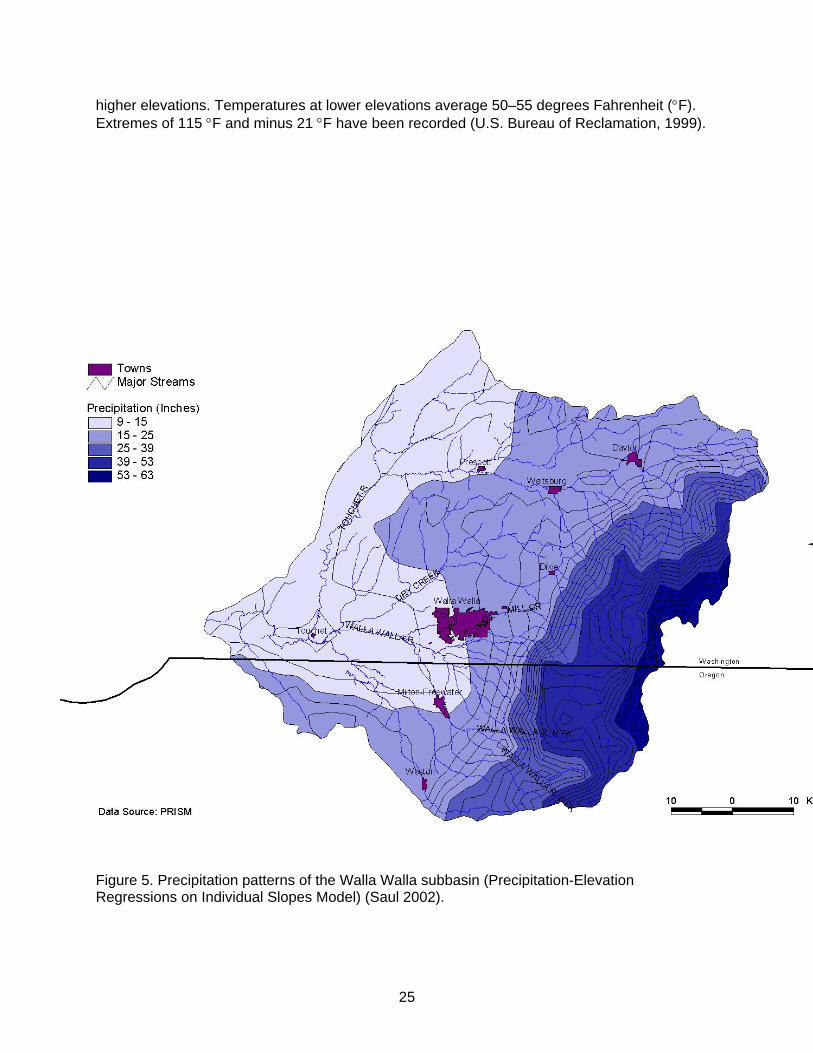
Precipitation across the Walla Walla subbasin falls mainly in the winter, with 64% occurring from October through March (Newcomb, 1965). The lower elevations in the watershed experience precipitation primarily as rain, while higher elevations receive winter and early spring precipitation as snow. Thunderstorms occur on average only 11 days per year, mostly during the summer months, but may be extremely intense and produce torrential flows capable of causing major fish kills and sediment deposition. Rain-on-frozen-soil and rain-on-snow events during the winters of 1995–96 and 1996–97 resulted in severe flooding and erosion damage (U.S. Bureau of Reclamation, 1999). Elevation affects temperatures and precipitation from west to east, as it varies from warm and semiarid in the western lower part of the river valley to cool and relatively wet at the headwaters in the Blue Mountains (refer to Figures 3 and 5). Temperatures exhibit a large seasonal variation with maximum temperatures rising above 38°C (100°F) in the summer and falling below –18°C (0°F) in the winter (U. S. Army Corps of Engineers, 1997). Average monthly high temperatures from June through September range from 67°F in the lower elevations to 54°F at
25
higher elevations. Temperatures at lower elevations average 50–55 degrees Fahrenheit (°F). Extremes of 115 °F and minus 21 °F have been recorded (U.S. Bureau of Reclamation, 1999).
Figure 5. Precipitation patterns of the Walla Walla subbasin (Precipitation-Elevation Regressions on Individual Slopes Model) (Saul 2002).

26
Vegetation Vegetation of the Columbia Plateau ecoregion (Figures 1 and 2) is dominated by xeric species, whereas vegetation of the Blue Mountain ecoregion is predominately mesic species. Historically, timber and brush mixed with grass and forbs were found in the Blue Mountains, bunch grasses in the middle portions of the watershed, and wild rye and sagebrush in the valleys (U. S. War Department 1860; U. S. Department of Agriculture 1941). As part of a governmental railroad survey from the Mississippi River to the Pacific Ocean conducted in 1853, the Touchet River was noted as “separated by a rolling, grassy prairie; its banks better wooded than those of any stream met with west of the Bitter Root mountains, and the soil equal to any which had been seen on the route” (U. S. War Department, 1860). Other historical accounts describe a limited amount of vegetative diversity, such as that recorded by historian David Douglas of the London Horticulture Society who traveled up the Walla Walla River in 1826 to collect samples for the Hudson’s Bay Company. While near the mouth, he described the country to the north as an “entirely level plain of gravel and sand, destitute of timber, with not even a shrub exceeding four feet in height except a few low straggling birch and willow on the sides of rivulets or springs” (Lavender, 1972). (Add information from Bower 2003 TMDL vegetation report when it is finalized) Vegetative conditions in the Walla Walla River subbasin have changed in response to effects of land use practices (Figures 6, 8 and 9). The most significant changes as they relate to surface water, fish, and wildlife have occurred in the last 150 years. The large influx of Euro-Americans to the subbasin began in the mid 1800s. The settlers brought with them large numbers of domestic cattle, sheep, and draft horses (U. S. Department of Agriculture, 1941), adding to grazing pressure brought by wild native ungulates and extensive Native American horse herds, present since the 1700’s. Ultimately many rangelands were overgrazed, which led to native plant species such as steppe grass vegetation associations being replaced by more competitive and/or introduced plant species (Grable 1974). Dominant exotic species include cheatgrass (Bromus tectorum), velvet grass (Holcus lanatus), yellow starthistle (Centaurea solstitialis), barnyard grass (Echinochloa crusgual alli), tansy (Tanacetum vulgare), and rattlegrass (Bromus brizaeformis). The historically extensive riparian zones of the Walla Walla subbasin (U. S. Army Corps of Engineers 1997) have been reduced by approximately 63% in the Touchet River subwatershed (Mudd 1975), and by 70% in Oregon portions of the subbasin (Water Resources Commission 1988, cited in U.S. Army Corps of Engineers 1997) (Saul 2002). Current land cover types are characterized in Figure 6. (Download latest NHI habitat maps for current and historic Columbia basin cover types)

27
Figure 6. Current land cover in the Walla Walla subbasin (Saul 2002)


29
Current planning efforts within the Walla Walla generally conceptualize terrestrial cover types along those delineated by the Northwest Habitat Institute’s Interactive Biodiversity Information System (IBIS) database. The following section has been transplanted from the online IBIS database introduction and wildlife-habitat type descriptions, and adapted from Wildlife-Habitat Relationships in Oregon and Washington (Johnson and O'Neil, OSU Press. 2001). It offers detailed descriptions of each wildlife-habitat type to support a common understanding for their delineation, inventory, and management across the Pacific Northwest. The author of each habitat description is listed below the habitat title, with a Sources Cited page specific to this vegetation section placed at the end of the section. These wildlife-habitat types update and expand the prior regional works of Thomas (1979), Maser (1984), and Brown (1985) and for the first time give a more complete perspective. For a description of how these wildlife-habitat types were determined, please see “Chapter 1” in Wildlife-Habitat Relationships in Oregon and Washington (Johnson and O'Neil, 2001). Each wildlife habitat below is described as to its geographic distribution, physical setting, landscape setting, structure, and composition. Although some passages are not specific to the Walla Walla subbasin, they accurately describe wildlife habitat conditions within our basin. Additionally, other information is included that may help managers, researchers, and others gain further insight into each habitat, like listing other classifications systems and key references, natural disturbance regimes, succession and stand dynamics, effects of management and anthropogenic impacts, and its status and trends. Importantly, also included are photographs of each wildlife-habitat type to give the reader an idea of what each habitat type looks like, multiple photographs are offered for most habitats, to depict some of the variability (vegetationally or structurally) that exist within each type. Although photographs may not be of locations specifically within the Walla Walla subbasin, they are representative of subbasin habitat types. Each of the habitats below is numbered. The authors of this section reference over 200 literature citations in these descriptions, found at the conclusion of this chapter. The following are definitions of each category used to characterize the wildlife-habitat types: Geographic Distribution. Describes the broad geographic range within which the habitat is located, both within Oregon and Washington and elsewhere. For each habitat type, refer to Figure __ (download NHI data) for a precise description of habitat distribution specifically within the Walla Walla subbasin. Physical Setting. Describes physical features of the environment on sites where the habitat is found in Oregon and Washington. These typically include climate, elevation, soils, hydrology, geology, and topography. Landscape Setting. Describes the landscape pattern and distribution of the habitat in relation to other habitats. Primary land use is also noted. Structure. Describes the physical structure of the habitat, both its typical aspect and the range of variation in structure present within the habitat. Aspects of physical structure include some description of cover or density (horizontal dimension) of vegetation or sessile invertebrate communities; layering (vertical dimension) of vegetation or sessile invertebrate communities; dominant growth forms, leaf phenologies (evergreen or deciduous), leaf characters (conifer or broadleaf), and vegetation persistence (annual or perennial) represented in different structural layers; and significant structural components of dead and decaying vegetation. Growth forms

30
include trees, shrubs (>1.6 ft [0.5 m] tall), dwarf-shrubs (<1.6 ft [0.5 m] tall), graminoids (grasses, sedges, rushes), forbs, ferns, mosses, lichens, algae, and marine invertebrates. Vegetation cover categories frequently referred to include forest (>60% cover of trees), woodland (25-60% cover of trees), shrubland (>25% cover of shrubs), dwarf-shrubland (>25% cover of dwarf-shrubs), and grassland (graminoids dominant). Water-dominated habitats (e.g., marine and open water) may be described in terms of the physical aspects of the water column and the bottom substrate of the habitat. Composition. Describes the species composition of the vegetation or sessile invertebrate communities that create structure. Composition is described as dominant, co-dominant (shares dominance with ³1 species), or important indicator species by structural layer. English names for all vertebrates are used in the text and corresponding standard names are in Appendix I. The geographic distribution or physical setting is noted for those dominant species that occur only in particular physical settings or specific geographic areas of the overall habitat’s range of occurrence. Other Classifications and Key References. Notes other names that have been applied to this habitat by other classifications or major summary publications and important references that describe the habitat or parts of the habitat in greater detail. Natural Disturbance Regime. Describes the major natural disturbances that are important in the habitat. The regime includes the disturbance type, severity, frequency, extent, and range of variation in these characteristics. Succession and Stand Dynamics. Describes the way in which structure and composition change over time in relation to natural disturbances. Effects of Management and Anthropogenic Impacts. Describes typical changes in structure and composition observed after typical management activities (human disturbances) and widespread changes in the habitat that have occurred since Euro-American settlement. Disturbances addressed include land uses that do not necessarily convert the habitat to urban or agriculture, but have a significant influence on structure or composition, e.g., hydrologic alterations, logging, and grazing. Exotic species that have become abundant in the habitat are noted. Status and Trends. Describes the general extent of the type in Oregon and Washington (Idaho and parts of other states to come later), its current ecological condition, and historical and current trends in extent and condition. Ecological condition refers primarily to how similar the current structure, composition, and disturbance regime is to natural or pre-settlement conditions. The total number of plant associations recognized in the habitat and the number of those that are considered globally imperiled provide some idea of the degree of loss, degradation, and threat that is associated with the habitat.
31
Land Use and Population Land Use
Land uses in the Walla Walla subbasin are subject to the jurisdiction of five counties and two states, Walla Walla and Columbia Counties in Washington State and Umatilla, Union, and Wallowa Counties in Oregon (Saul 2002). Figure 7 displays major land uses in the Walla Walla subbasin. Federal land management entities include the U. S. Forest Service (Umatilla National Forest) and the U. S. Bureau of Land Management. Table 10 summarizes the areas within the Walla Walla subbasin that are protected and/or are managed using a conservation strategy. All lands managed by the Forest Service (USFS) and Bureau of Land Management (BLM) are located in the Blue Mountains. State management entities in the subbasin include the Washington Department of Fish and Wildlife (WDFW), Oregon Department of Fish and Wildlife (ODFW), Oregon Department of Forestry (ODF), Washington Department of Forestry (WDF), Washington Department of Natural Resources (WDNR), Oregon Department of Environmental Quality (ODEQ), Washington Department of Ecology (WDE), the Oregon Water Resources Department (OWRD), and the United States Fish and Wildlife Service (Saul 2002). Please refer to sections describing individual sub-watersheds for detailed summaries of county and state land use regulations.

32
Table 10. Areas in the Walla Walla subbasin that are protected and/or are managed using a conservation strategy (U. S. Forest Service 1990; Allen Childs, CTUIR, February 2, 2001). Site Location Acreage Type of Protection Management Objectives Whitman Mission National Historic Site
At juncture between Cold Creek and the Walla Walla River
98 National Park Service
Managed for historical preservation; includes native vegetation restoration
Lewis and Clark Trail State Park
Between Waitsburg and Dayton on the Touchet River
Washington State park
Managed for historical preservation; includes native vegetation restoration
Touchet River Road #64
Forest boundary to Forest Road #6437 in the upper Touchet watershed
8,874 USFS viewshed 1 Managed as natural appearing landscape Dead and down tree habitat managed for 60% of potential population level for all primary cavity excavators
South Fork Walla Walla Trail #3225
13,708 USFS viewshed 2
Tiger Creek Road #65
Upper North and South Fork Walla Walla
8,333
USFS viewshed 2
Fire suppression of mid to high intensity fires Down and dead trees managed for 60% of potential population level for all primary cavity excavators 90% of potential smolt habitat capability index Mixed size and age of trees Suppress moderate to high intensity wildfires
Mill Creek municipal watershed
21,740 Municipal watershed
Sufficient quantity and quality of water No grazing Natural vegetative conditions Restricted recreation No off-highway vehicle use No timber harvest of firewood cutting Down and dead trees managed for 80% of potential population level for all primary cavity excavators and maintained for other cavity users No mining No road construction Fire suppression and prescribed fire outside of riparian zones allowed

33
Site Location Acreage Type of Protection Management Objectives Rainwater Wildlife Area
Upper South Fork Touchet River subbasin
8,678 NPPC Fish & Wildlife Program Wildlife Mitigation Project
Protect and enhance watershed resources and mitigate impacts to wildlife resources impacted by hydroelectric development in the Columbia River basin Promote and maintain a self-sustaining, functional, and healthy watershed Protect, restore, and enhance water quality, quantity, and instream fish habitat conditions Protect, restore, and enhance upland and riparian/floodplain habitat Control, and where feasible, eradicate noxious/undesirable weed species and encourage restoration of native plant communities Minimize disturbance and harassment to wildlife resources and provide security habitats during critical seasons
Mill Creek Watershed roadless area #14021
Includes Mill Creek Watershed and adjacent North Burnt Fork watershed in the Touchet
26,700 Roadless Area Mill Creek for potable water Burnt Fork for elk forage, domestic livestock and wood fiber No access allowed to Mill Creek portion of area
Walla Walla R. roadless area #14022
Includes most of the south and north forks of Walla Walla R.
34,500 Roadless Area Harvest timber without using roads 11 corridors along South Fork Walla Walla allocated to primitive recreation
Walla Walla watershed
All National Forest land within North and South Fork Walla Walla watershed except Target Meadows area on the south edge of the watershed
Management area Elk habitat managed to achieve an effectiveness index of no less than 60, including discounts for roads open to motorized vehicles Manage for big game Habitat effectiveness index of 60 and cover standards apply to all other areas within unit Manage for 90% potential smolt habitat

34
Site Location Acreage Type of Protection Management Objectives index
Wallula Habitat Management Unit
Department of Defense
South Fork Walla Walla Area of Critical Environmental Concern
3 river miles of the South Fork from Harris Park to the USFS Boundary
1,280 Bureau of Land Management
Managed for protection/preservation of threatened and endangered plant and fish species
Swegle Complex Mouth of Mill Creek (WA) and adjacent Walla Walla River
120 WDFW/U.S. Army Corps of Engineers
Fishing access as mitigation Fish and Wildlife habitat mitigation
McDonald Complex Near McDonald Road, below the mouth of Mill Creek
121 WDFW/U.S. Army Corps of Engineers
Fishing access as mitigation Fish and Wildlife habitat mitigation
Dodd property 7-8 miles above Touchet, WA 2.4 Perpetual easement
Fishing access as mitigation Fish and Wildlife habitat mitigation

35
Figure 7. Land use in the Walla Walla subbasin (Saul 2002).

Walla Walla Subbasin Assessment 36
Agriculture The earliest noted agriculture in the valley occurred in about 1825 at Fort Nez Perce near the mouth of the Walla Walla River. In 1839 at Whitman Mission, wheat, corn, onions, melons, and various other crops were in cultivation (Farnham 1844). Prior to the establishment of Whitman Mission in 1836, the grass-covered hills were thought to be only suited for grazing, but by 1850 small amounts of cropland were situated along the river bottoms including some irrigation. In the fall of 1863, a farmer sowed 50 acres of wheat on the upland near Weston and the following summer collected an average of 35 bushels to the acre. From this point forward, land was broken out at an accelerated rate and by the late 1870s, Walla Walla County was considered one of the leaders in cultivated grains (U. S. Department of Agriculture 1941) (Saul 2002). In 1997, 88% of Walla Walla county acres were utilized for farming, which may reasonably be extrapolated to the greater subbasin, due to relatively similar topography, soil types, and precipitation. The growing conditions for most local crops are recognized as some of the best to be found in the Northwestern United States, if not the world. This is particularly true for grapes, apples, and dryland wheat (Saul 2002). Other significant agricultural products include barley, hay, onion, potato, orchard fruits, and multiple pea varieties. For detailed summaries of crop and livestock production rates and value in Columbia, Walla Walla, and Umatilla counties, see Appendices __ through __. The areas encompassed by these counties are greater than the area of the subbasin, but include all of its agricultural acres and give the best possible estimates of crop and livestock production. The data is derived from the 1992 an d1997 United States Census of Agriculture. The Walla Walla floodplain valley is extensively and intensively irrigated (Figure 8__). Irrigated lands primarily occur in the narrow lowland portions of the subbasin, representing the largest use of surface and groundwater in the subbasin). The floodplains are relatively narrow except for the (relatively) wide alluvial fans over Mill Creek and the mainstem between Milton-Freewater and the Oregon border. A report by the U.S. Bureau of Reclamation (1999) estimated that in Oregon there are about 14,000 acres irrigated from surface flows and shallow wells and about 2,000 acres irrigated from deep wells. Further study examining recent respective volumes of surface and groundwater used for irrigation purposes is warranted (Saul 2002). There has been a steady increase in the acres of irrigated croplands in the Walla Walla subbasin since the mid 1800s. The estimated area of irrigated Walla Walla County land in 1987 was 75,333 acres, compared to 97,136 acres a decade later, which represents nearly a 30% increase (National Agricultural Statistics Service 1997). Primary water sources include the Touchet and Walla Walla Rivers, gravel aquifers, and the basalt system (Saul 2002). Primary water delivery conduits in the subbasin include the East-West Canal, Gardena Canal, Lowden Canals, the Hudson Bay Improvement Company ditches, Walla Walla Irrigation District ditches, and a number of small ditches upstream of Milton-Freewater.

Walla Walla Subbasin Assessment 37 Draft 9/24/02
22%
9%
69%
1
2
3IndustrialMunicipal
Irrigation
Figure 8. Water use in the Walla Walla subbasin (U. S. Army Corps of Engineers, 1997). In addition to irrigated grain crops, fruit crops such as orchards and vineyards represent a growing portion of irrigated agriculture in the subbasin. Irrigated orchard acreage in UmatillaCounty, most of which lies in the Walla Walla subbasin, has essentially remained unchanged between 1992 and 1997: 4,984 acres vs. 4,743 acres respectively (National Agricultural Statistics Service, 1997). Other irrigated crops include asparagus, beans, onions, pasture, and potatoes (James et al., 1991) (Saul 2002). To a small degree in Oregon, and a much larger degree in Washington, agricultural lands (irrigated and non-irrigated) and riparian areas have recently been converted to residential and commercial use. The Conservation Reserve Program (CRP) as managed by NRCS, assists farmland owners and operators in conserving and improving soil, water, and wildlife resources. Highly erodible and other environmentally sensitive acreage previously devoted to the production of agricultural commodities is converted to long-term approved cover. CRP enhances habitats and forage and reduces sediment delivery. Participants enroll in contracts for 10 to 15 years. Signups have been occurring since the 1985 Farm Bill (Greg Schlenz, NRCS, January 3, 2001) (Saul 2002). The CRP has made improvements to 38,211 acres in Columbia County, 148,894 acres in Walla Walla County, and 107,283 acres in Umatilla County from 1986-2001 (U. S. Department of Agriculture 2000).

Walla Walla Subbasin Assessment 38 Draft 9/24/02
Figure 9. Irrigated and non-irrigated cropland in the Walla Walla subbasin (Saul 2002).fix upriver characterization – need to characterize as predominantly irrigated cropland
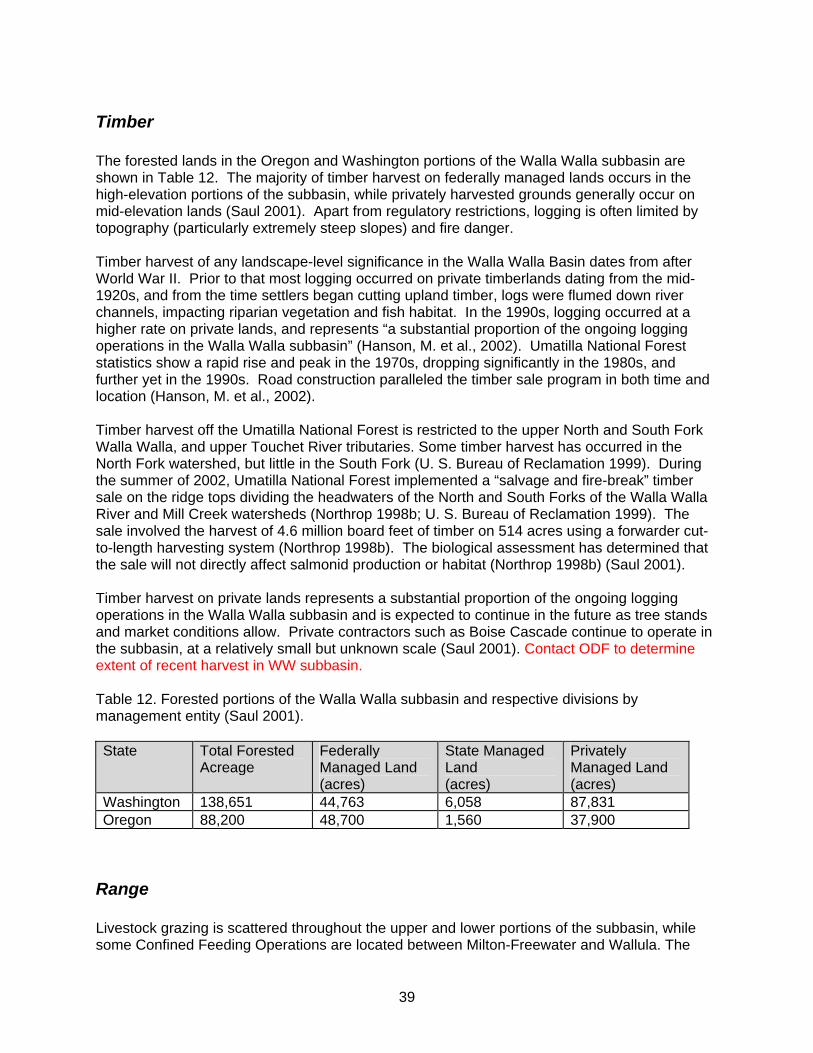
39
Timber The forested lands in the Oregon and Washington portions of the Walla Walla subbasin are shown in Table 12. The majority of timber harvest on federally managed lands occurs in the high-elevation portions of the subbasin, while privately harvested grounds generally occur on mid-elevation lands (Saul 2001). Apart from regulatory restrictions, logging is often limited by topography (particularly extremely steep slopes) and fire danger. Timber harvest of any landscape-level significance in the Walla Walla Basin dates from after World War II. Prior to that most logging occurred on private timberlands dating from the mid-1920s, and from the time settlers began cutting upland timber, logs were flumed down river channels, impacting riparian vegetation and fish habitat. In the 1990s, logging occurred at a higher rate on private lands, and represents “a substantial proportion of the ongoing logging operations in the Walla Walla subbasin” (Hanson, M. et al., 2002). Umatilla National Forest statistics show a rapid rise and peak in the 1970s, dropping significantly in the 1980s, and further yet in the 1990s. Road construction paralleled the timber sale program in both time and location (Hanson, M. et al., 2002). Timber harvest off the Umatilla National Forest is restricted to the upper North and South Fork Walla Walla, and upper Touchet River tributaries. Some timber harvest has occurred in the North Fork watershed, but little in the South Fork (U. S. Bureau of Reclamation 1999). During the summer of 2002, Umatilla National Forest implemented a “salvage and fire-break” timber sale on the ridge tops dividing the headwaters of the North and South Forks of the Walla Walla River and Mill Creek watersheds (Northrop 1998b; U. S. Bureau of Reclamation 1999). The sale involved the harvest of 4.6 million board feet of timber on 514 acres using a forwarder cut-to-length harvesting system (Northrop 1998b). The biological assessment has determined that the sale will not directly affect salmonid production or habitat (Northrop 1998b) (Saul 2001). Timber harvest on private lands represents a substantial proportion of the ongoing logging operations in the Walla Walla subbasin and is expected to continue in the future as tree stands and market conditions allow. Private contractors such as Boise Cascade continue to operate in the subbasin, at a relatively small but unknown scale (Saul 2001). Contact ODF to determine extent of recent harvest in WW subbasin. Table 12. Forested portions of the Walla Walla subbasin and respective divisions by management entity (Saul 2001). State Total Forested
Acreage Federally Managed Land (acres)
State Managed Land (acres)
Privately Managed Land (acres)
Washington 138,651 44,763 6,058 87,831 Oregon 88,200 48,700 1,560 37,900
Range Livestock grazing is scattered throughout the upper and lower portions of the subbasin, while some Confined Feeding Operations are located between Milton-Freewater and Wallula. The

40
upper portion of the subbasin in Oregon supports about 15% of the Umatilla County’s cow-calf operations (about 4,800 pairs; U. S. Bureau of Reclamation 1999). Columbia County contains one large-scale livestock operation; other operations in the Touchet portion are either secondary businesses and/or small (Roland Schirman, WSU Cooperative Extension, April 7, 1999). With its steep slopes and limited grasslands, little grazing occurs on federal lands in the North and South Fork Walla Walla watersheds. Add table of summary figures.
Urban Development There are numerous towns located within the Walla Walla subbasin which are incorporated (Table 13Table). Urban sprawl is a concern for resource managers, as indicated by the growing number of ranchettes, subdivisions, subdivided cropland, and floodplain encroachment. These areas often occur near wooded areas, or streams. One of the concerns is over the increasing number of shallow individual domestic wells (existing and proposed) and their impact on streamflows (Hanson and Mitchell 1977). Similarly, the increasing number of dwellings poses a threat to water quality due to the increased amount and dispersion of potential nutrient sources and exotic plants immediately adjacent to waterways (Saul 2001). Table 13. Incorporated towns with populations exceeding 1,000 in the Walla Walla subbasin (U. S. Census Bureau 2000) (Saul 2001). Insert table of growth projections
Population City Urban Area (mi2)
1990 1992 1994 1996 1998
Walla Walla, Washington
12.2 26,482 28,134 28,730 28,930 29,440
College Place, Washington
1.7 6,308 6,410 6,710 6,865 7,110
Milton-Freewater, Oregon
1.7 5,699 5,837 6,002 6,037 6,054
Dayton, Washington
1.5 2,468 2,470 2,505 2,550 2,553
Waitsburg, Washington
0.8 990 1,015 1,130 1,224 1,225
In the Washington portion of the subbasin, municipal water systems are supplied from both surface and groundwater sources (Hanson and Mitchell 1977). Walla Walla, the largest city in the subbasin, obtains approximately 85% of its water supply from Mill Creek (Hanson and Mitchell 1977). Trends indicate the aquifer underlying Walla Walla and many other urbanized areas is being depleted at an alarmingly high rate (Hanson and Mitchell 1977) (Saul 2001). Relying on a deep basalt aquifer, the city of Milton-Freewater was estimated in a 1977 study to consume as much as 400,000 gallons of water per day (Hanson and Mitchell 1977) (Saul 2001). Since that time, several food processing plants have closed and have left the city with an adequacy of water for current and expected growth (Umatilla Basin Report, 1988).

41
Transportation The Burlington Northern and Union Pacific are the two main railroads serving the area. Walla Walla has scheduled air service, along with bus and motor freight. U.S. Highway 12 and Washington State Highway 125 give Walla Walla good highway access. Oregon State Highway 11 provides Milton-Freewater access to the north and south. U.S. Highways 12-395 and 395-730 border the Walla Walla subbasin on the west. Numerous county roads provide access throughout the subbasin. Columbia River water transportation is used for importing agricultural machinery, fertilizers, bulk cement, and petroleum products, and exporting bulk grain, manufactured goods, and processed foods (Saul 2001). Insert reference to planned Highway12 widening
Economy The Walla Walla subbasin remains predominantly rural in character, and is known for a high quality of life. The town of Walla Walla has recently been rated as one of the 100 best places in America to live by Relocate-america.com (2003), and as possessing one of the 10 best downtowns in America (Sunset Magazine, 2002). The economic base of the region has remained relatively stable over the past few decades, exhibiting modest growth despite poor prices for major agricultural commodities. This is owing, in large part, to the diversity of its economy and the presence of relatively stable educational, penal, and medical institutions. No wage sector of the tri-county area encompassing the subbasin is larger than 27% (see Figure XX) of the overall economy. Figure XX. 2001 Wage Distribution (estimated) – Walla Walla, Columbia, and Umatilla Counties (US Bureau of Economic Analysis 2000, Washington State Labor Market Information, 2001).
AGRICULTURE, FORESTRY AND FISHING
5% CONSTRUCTION7%
MANUFACTURING17%
WHOLESALE TRADE4%
RETAIL TRADE12%SERVICES
20%
GOVERNMENT27%
FINANCE, INSURANCE, AND REAL ESTATE
2%TRANSPORTATION AND PUBLIC UTILITIES
6%

42
In addition, because of its abundant natural resources and rural lifestyle, the region remains attractive to prospective investors, residents, and, most significantly, tourists. Several subbasin towns and cities derive substantial economic revenue linked to tourist activity as well as agricultural income. Subbasin-wide data documenting revenue derived from tourism is currently not available. Most often, tourists visit to enjoy cultural events and recreational activities, many of which are closely associated with winter sports and fish and wildlife resources. The subbasin is regionally marketed to tourists, business, and potential residents in terms of its natural beauty and resources as much or more than inexpensive real estate, vibrant downtowns, and educational institutions. The subbasin has always been closely linked economically to the Pacific Northwest as a region, primarily through the export of commodities and the import of visitor use and governmental activity. This relationship is dominated by the export of agricultural commodities out of the subbasin, especially dryland wheat, sweet onions, wine, wine grapes, and apples. Nearly all agricultural commodities produced in the subbasin are exported, often across the world. In 1997 the total value of all agricultural products sold in Columbia, Umatilla, and Walla Walla counties was $530,608,000 (1997 USDA Ag. Census). Reference appendix of charts displaying value by commodity, and include table of top 10 commodities in subbasin. The subbasin is also a regional producer of paper and beef products, and aside from hydropower, is also a major producer/exporter of wind energy, possessing the Northwest’s largest wind-generated power facility along the Horse Heaven Hills. Refer to Appendix XX for agricultural data and statistics in Columbia, Walla Walla, and Umatilla Counties. The subbasin provides some of the Northwest’s best hunting in the Blue Mountains and sportsmen and women come from throughout the Northwest to harvest (legally and illegally) game birds and deer, elk, bear, and cougar. The subbasin winter steelhead and trout fishery also remains important within the regions of the Northwest east of the Cascades, resulting in thousands of visitor-days of activity each year. The Blue Mountain headwaters of the subbasin host the most snowmobile activity in the Northwest during the winter, and Bluewood, one of two subbasin ski resorts, receives visitors from throughout southeast Washington. The subbasin contains one of three State Penitentiaries in Washington, a source of substantial and consistent economic wage revenue. Specific revenue and value data on these sectors is not currently available. The subbasin is also economically linked to the Pacific Northwest region in terms of fish and wildlife recovery. Substantial support enters the basin aimed at fish and wildlife enhancement, through state, federal, and private sources. This support directly reaches subbasin government agencies and private service providers as revenue, can be re-transmitted to contractors or other service providers as revenue or widely diffuse into the economy as wages. Subbasin wage and revenue data for these sectors is not currently available. Agricultural producers and forest users are also directly and indirectly impacted economically by fish and wildlife regulations. These impacts (which can be either positive or negative) often reverberate throughout the subbasin economy as these commodities constitute substantial forms of revenue within the subbasin.
Major Economic Sectors The economic base of the Walla Walla subbasin has long included dryland and irrigated agriculture as a substantial component. The growing conditions for most local crops are recognized as some of the best to be found in the Northwestern United States, if not the world. This is particularly true for grapes, apples, and dryland wheat (Saul 2002). Other significant

43
agricultural products include barley, hay, onion, potato, orchard fruits, and multiple pea varieties. Refer to Appendix XX for agricultural data and statistics in Columbia, Walla Walla, and Umatilla Counties. According to an agribusiness committee convened by the Milton-Freewater Chamber of Commerce in the early 1980’s, “After the initial settlement of the Walla Walla River Valley near Milton-Freewater the growing of apples, cherries, prunes and plums, peaches and nectarines have been an important factor in the local economy” (Agri-business Committee, 1985). According to a 1982 Umatilla County Comprehensive Plan, “Orchardists in the Milton-Freewater area are heavily dependent upon the Walla Walla River for irrigation, especially in July and August” (p. D-75) On a regional and national level, the Walla Walla Valley remains known primarily in terms of its agricultural capacity, which also serves as a strong selling point to outside businesses, consumers, and potential residents. Walla Walla has been and continues to be utilized as an effective marketing label, drawing unique and important consumer attention to local products. Some agricultural products are value-added and processed within the valley as well. For example, packing houses and juice-production facilities for apples constitute some of the largest industrial employers in Milton-Freewater, and other food processors such as Smith Frozen Foods, Inc., Seneca, and Iowa Beef Producers, Inc., continue to operate, contributing substantial revenue in the form of personal income and public taxes. Ranching and timber constitute the dominant land uses and resources produced in upland areas, and there are small sheep and cattle operations scattered throughout the basin. The Walla Walla subbasin has seen tremendous growth in its local wine industry, which have become world-renowned for quality. The monetary influx associated with federal payments and subsidies for conservation and agricultural activities also represents a large and important sector of the subbasin economy. The total amount for federal assistance programs entering Columbia County, Walla Walla County, and the area encompassed by ZIP code 97862 (roughly the region of Umatilla County associated with the Oregon-Walla Walla basin) was $208,917,488 from 1996-2001, or approximately $41,783,498 per year during that time in direct and indirect revenue for subbasin agricultural producers (Environmental Working Group Agricultural Subsidy database - http://www.ewg.org/farm/). These numbers include payments for farming subsidies, conservation programs, and disaster relief. See Table 13 for 1997 statistics in federal payments and total market value of crops. That year, farming subsidies constituted about 6.4% of the total market value of all agricultural products. Table 14: 1997 Federal Subsidies and Market Value of Agricultural products in Umatilla, Walla Walla, and Columbia Counties (USDA 1997 Ag. Census data). Add column for percentages. 1997 Federal Payments 1997 Market Value of Total Ag. Products Sold (dollars)
Walla Walla County 13,861,966.00 256,930,000.00
Columbia County 5,393,957.00 24,477,000.00
Umatilla County * 14,634,024.00 249,201,000.00
Totals 33,889,947.00 530,608,000.00
* Data not available specific to Walla Walla subbasin in Umatilla County

44
Beyond agriculture and related industries, the Walla Walla subbasin contains a diverse array of additional economic sectors. Several major packing houses, engineering, call center, graphic design, construction, and consulting firms remain in the basin. Boise-Cascade operates a major paper products facility near the mouth of the Walla Walla. The towns of Walla Walla subbasin all provide a variety of cultural, agricultural, technical, and recreational events, workshops, and conferences. Other major employers include educational, penal, and county, state, and federal governmental institutions, and a regional medical center in the city of Walla Walla. A major regional Army Corps of Engineers Office is located in the city of Walla Walla. Finally, year-round recreation activities (including hunting, fishing, gathering, winter sports, bicycling, birding, and hiking/backpacking) constitute a stable and significant revenue source for local businesses. Figure XX displays these industries and many others grouped within economic sectors, showing the distribution of these components in the overall wage economy of the three counties the subbasin lies within.
Relationship of Economy to Natural Resources The relationship of major economic sectors in the Walla Walla subbasin is partially summarized in Table XX. Table XX: Major Relationships of Principal Economic Sectors to Subbasin Natural Resources.
Economic Sector Relationship to subbasin natural resources Revenue from healthy crops and forests Activities afftect habitat quality, size, and connectivity. Agriculture and Forestry Afftected by regulatory pressure, burden, and scrutiny Revenue from healthy fishing stocks Recreational enjoyment Sustenance Afftected by regulatory pressure, burden, and scrutiny Structures and activities afftect habitat quality, size, and connectivity.
Fishing
Cultural significance Revenue from development linked to landscape health and beauty Afftected by regulatory pressure, burden, and scrutiny Construction Structures and activities afftect habitat quality, size, and connectivity.
Manufacturing Afftected by regulatory pressure, burden, and scrutiny
WholesaleTrade No direct and discernable relationship.
Retail Trade Revenue from recreational and agricultural activities associated with natural resources Revenue and other funding for managing, monitoring, protecting, and enhancing natural resources. Services Revenue associated with planning, legal issue resolution Responsible for sound management and stewardship of natural resources Partially responsible for monitoring Government Dictates and is afftected by regulatory pressure, burden, and scrutiny Structures and activities afftect habitat quality, size, and connectivity.
Transportation Afftected by regulatory pressure, burden, and scrutiny Afftected by regulatory pressure, burden, and scrutiny
Finance, Insurance, and Real Estate Revenue from with property values associated with natural resources

45
Importance of Water to Economy It is hard to overstate the importance of water resources to agriculture within the Walla Walla valley, especially the Oregon portion. According Newcomb’s 1965 seminal and definitive report of ground and surface water resources in the Walla Walla Basin :
After the discharge of the last of the snowmelt, by about July 1 of each year, the 150 cfs of ground-water outflow carried to the Walla Walla Valley by these two streams (the Walla Walla River and Mill Creek), along with the water pumped from ground-water storage beneath the valley, forms the bulk of the water supply on which the economic life of the valley is based.
Additionally, on p. 63 Newcomb states: Protection and increase of the water resources of the old gravel are vital to the established economy of the Walla Walla Valley (including the Washington portion). Actions that might permanently decrease the natural infiltration recharge from the surface or the artificial recharge by irrigation and other means may be detrimental to full use of the water-storage resource(emphasis added).
It should be noted that “full use” not only refers to human use but use by fish and wildlife, particularly in spring-fed branches and distributaries that receive summer base flows as a result of shallow aquifer infiltration and recharge. The 1982 the Umatilla County Comprehensive Plan stated:
Water resources quality is extremely important to future growth possibilities in Umatilla County. Should the present water supply drastically deteriorate in quality, domestic consumption could be restricted and population growth curtailed. Directly related to water quality is the functional relationship of water quantity. Water supplies or quantities can either cause quality degradation or they abate polluting activities leading to water quality deterioration. Adequate water supplies are similarly important to the economic health of the area, which is heavily dependent upon irrigated agriculture and related industries (Tech Report #1 E-5).
In terms of cost versus revenue per unit sold, the highest-value crops in the subbasin are all irrigated crops. The water rights one which these crops depend are purchased on either an annual or permanent basis. Annual senior water rights in the Oregon portion of the basin have been valued at approximately $80-100 acre ($2,160-$2,700 per cfs in the Walla Walla basin, assuming 1 acre = 1/27 cfs), while permanent senior rights are typically valued at $1,000/acre ($27,000/cfs). Permanent senior water rights in Washington have recently been purchased for $50,000-$100,000/cfs, and sometimes more (T. Anthony, and B. Wolcott, personal communication, 2003). This puts the current market value of water bypassed by basin Irrigation Districts at somewhere between $675,000 and $2.5 million or more. Some basin irrigators have recently switched to crops requiring less water during the driest part of the irrigation season (such as apples to cherries and grapes) without incurring a substantial loss in economic revenue.
Fish and Wildlife Enhancement/Recovery As a result of natural resources issues associated with the Clean Water Act, Endangered Species Act, and Tribal Treaty Obligations, a the Walla Walla subbasin economy receives substantial annual monetary inputs in the form of county, state, federal, and private support for habitat enhancement and fish and wildlife recovery. Total estimates for this are not currently available. Some of the largest employers in this arena include state and federal management agencies, the US Army Corps of Engineers, the Confederated Tribes of the Umatilla Indian Reservation, and the Bonneville Power Administration. Additional revenue entering the basin partially supports (usually in the form of cost-share assistance for projects) contracting entities,

46
resource users (especially water resource users) and nonprofit organizations such as the Walla Walla Basin Watershed Council and Tri-State Steelheaders.
Cultural relationships Many cultural values within the Walla Walla subbasin have long been placed on natural resources. The Cayuse, Walla Walla, and Umatilla peoples maintained and developed a myriad of relationships to natural resources, which were at once spiritual, religious, economic, political, artistic, familial, and practical. Other subbasin inhabitants maintain similar relationships, particularly through recreational activities such as hunting, fishing, hiking, farming, and ranching. Family ties are strengthened through the enjoyment and utilization of natural resources, religious sentiments are forged and strengthened, artistic endeavors are inspired, and a sense of identity and place is cultivated. Indeed, fundamental conceptions of well-being, as individuals, families, and communities encompass social, ecological, and economic facets and all are intimately tied to the health of subbasin natural resources.
Human Influences on Aquatic Environments and Subbasin Ecology Riparian area reduction
While riparian conditions are generally excellent in the high-elevation headwaters, the historically-extensive riparian zones of the lower Walla Walla subbasin (below National Forest boundaries) have been reduced by 65-70% throughout many areas (Water Resources Commission 1988, cited in U.S. Army Corps of Engineers, 1997). Agricultural conversion, grazing (by both livestock and wildlife), beaver impacts, flood-control activities, and other forms of riparian vegetation reduction have reduced shade provided by riparian zones (Kuttel 2001). Riparian zones have suffered from water yield and adversely altered timing of yield, resulting in destabilized stream banks and stream channels, increased sedimentation and water temperatures, and decreased fish cover and food availability (U.S. Bureau of Reclamation, 1999). Reductions in riparian vegetation have also led to reduced aquatic and terrestrial habitat quantity and complexity (especially with regard to large woody debris recruitment and availability), as well as bank stability and flood energy absorption capacity. Refer to Kuttel for quantifiable numbers? Other sources?
Sediment Sediment in the river is one of the two main water quality problems, along with water temperatures. Contributions associated with anthropogenic factors often come from poorly designed and maintained roads, agricultural lands, grazing lands, river bank erosion, and irrigation return flows. Weeds on steeper slopes and pastures, especially knapweed and thistle, are shallow-rooted and lack the soil retention capability of native grasses and plants (U.S. Bureau of Reclamation, 1999). This sediment has degraded fish habitat by filling pools, creating a wider and shallower channel, and covering spawning gravel. Several hundred acres of important wetland habitat at the mouth of the Walla Walla River also have been lost or degraded due to silt deposition. The large delta that has developed at the confluence with the Columbia is a graphic illustration of the amount of sediment carried by the Walla Walla and Touchet Rivers. See section XX for a characterization of subbasin sediment/turbidity levels.

47
Changes in hydrologic regime and water quality There are numerous towns located within the Walla Walla subbasin, many of which are incorporated (Table). Urban sprawl is a concern for resource managers, as indicated by the growing number of subdivisions and other forms of land conversion to non-agricultural uses. Urban sprawl is now occurring around streams (such as Mill, Yellowhawk, and Stone creeks), many of which contain ESA-listed Bull Trout and Steelhead. Other concerns involve the increasing number of shallow individual domestic wells (existing and proposed), which pose a very real and significant threat to available water resources in the underlying shallow aquifer (Hanson and Mitchell 1977). Similarly, the increasing number of dwellings poses a threat to surface water quality and quantity due to the increased amount and dispersion of potential nutrient sources immediately adjacent to waterways (Saul 2001), contaminated water runoff, and hydrologic problems associated with increased impervious surface area. In the Washington portion of the subbasin, municipal water systems are supplied from both surface and groundwater sources (Hanson and Mitchell, 1977). Walla Walla, the largest city in the subbasin, obtains approximately 85% of its water supply from Mill Creek (Hanson and Mitchell 1977). Trends indicate the aquifer underlying Walla Walla and many other urbanized areas is being depleted at an alarmingly high rate (Hanson and Mitchell 1977) (Saul 2001). The city of Walla Walla is still planning to incorporate future areas within the Urban Growth Boundary that currently rely on wells (Warriner, personal communication, 2003).
Surface and ground water management Recharge of the shallow aquifer has decreased in some areas because of conversion from flood to sprinkler irrigation, as well as ditch-to-pipe conversion. Past irrigation inefficiencies resulted in elevated water inputs into the shallow aquifer during the irrigation season, which in turn led to a higher summer water table, increased spring flow and associated riparian vegetation. As a result of the flow bypass agreement, water that normally entered the shallow aquifer through irrigation inefficiencies has been saved through irrigation upgrades and reallocated to be bypassed in the Tum-A-Lum branch of the Walla Walla system. Research is currently underway to understand and quantify the effect of these changes on groundwater levels and spring activity. Base flows in the Walla Walla subbasin change due to natural variability, geologic conditions and irrigation withdrawals. In a number of areas, water diversions historically completely dewatered reaches of the river and principle tributaries. This has been documented in the lower Touchet River, lower reaches of Mill Creek, and the Walla Walla River near the Oregon-Washington border. Mill Creek, near Walla Walla, has experienced a dramatic increase in the number of zero-flow days since 1950. These dewatered periods were due in large part to upstream diversions (Pacific Groundwater Group 1995). Dewatering generally occurred during the irrigation season (April through November), its duration dependent upon the water year. In wetter years, the irrigation season is shorter, whereas in drier years the season is longer (U. S. Army Corps of Engineers, 1997). During the winter of 1999-2000, negotiations between local irrigators, the US Fish and Wildlife Service, and environmental groups led to an out-of-court settlement to restore flows to the “Tum-A-Lum” branch of the Walla Walla River. In 2001, this landmark agreement resulted in that branch flowing continuously through the summer from mouth to headwaters for the first time in over a hundred years (Fig. 8). The current two-year agreement facilitated the two Oregon irrigation district's (Walla Walla River Irrigation District and Hudson Bay District Improvement

48
Company) release of 18 cubic-feet-per-second (cfs) during the 2001 irrigation season and 25 cfs of water for 2002. In addition, a Washington irrigation district (Gardena Farms Irrigation District #13) bypassed 14 cfs in 2001 and 18 cfs in 2002. In 2000, the initial year of the agreement, the two Oregon Districts bypassed 13 cfs and Gardena Farms bypassed 7 cfs. The gradual reductions in river flows have allowed fish more time to move upriver to better habitat as lower river conditions degraded. Annual rescues of stranded fish are no longer necessary, but more research is needed (throughout the lower basin) to quantify effects of maintaining base flows through that branch year-round. Issues to be addressed include, for example, additional contributions to higher temperatures, which may reduce of the relative portion of cool groundwater input to the Walla Walla river and increasing the portion of warmer surface bypass flow (B. Bower, WWBWC, personal conversation, 2003).
Channel alteration Flood-control efforts (primarily levee construction and channel straightening) have resulted in dramatic changes to channel morphology and sinuosity. In the Walla Walla Basin, as in most northwestern basins, there are ample examples of human influence leading to straightening: road building, structures, rip-rap, vegetation removal, bank weakening, diking and channelization. (cite: Oregon WW Basin TMDL) These changes have reduced the quantity of instream habitat, lowered adjacent water table depths, reduced riparian quality and quantity, increased downcutting, and altered hydrologic regimes by increasing peak flows and reducing base flows. See section XX for a detailed description of subbasin sinuosity.
Fish Passage barriers and water diversion hazards Historically, the absolute number of diversion points, in addition to the volume of water diverted, has been identified as a primary cause for historic reductions and extirpations of fish populations in the subbasin (Van Cleve and Ting 1960). Diversions designed to prohibit fish from entering adjoining ditch systems were limited during the early and mid-nineteen hundreds. In 1950, Nielson reported a total of 130 points of irrigation diversion in the Walla Walla, 123 of which lacked any form of screen (Saul 2002). See Section XX for an updated inventory of diversions and their passage status.
Human Influences on Terrestrial Environments and Subbasin Ecology Wildlife reduction/extirpation
As a result of human-caused mortality and reductions in available habitat quality and quantity, the Walla Walla subbasin has seen a dramatic reduction and/or elimination of a variety of native aquatic and terrestrial fauna over the past 200 years. Many local populations have ceased to exist, including antelope, a small race of white-tailed deer, spring Chinook salmon, and condor vultures, sharp-tailed grouse, and bighorn sheep (Saul 2001). Many others exhibit significantly depressed population levels. Refer to T E & S list. The reduction of beaver habitat (through channel straightening and riparian area reduction) and population (by hunting, trapping, and poisoning) over the past 200 years has had a dramatic impact on stream and river morphology, hydrologic regime, and riparian area size and composition. Additionally, the extirpation of large predators such as the grey wolf (through eradication campaigns) has impacted prey population size and health, which has in turn affected vegetation in many areas of the basin. Hunting and fishing (both legal and illegal) continues to have a large impact on many fish and wildlife populations in the Walla Walla

49
subbasin. See Section __ for a detailed description of primary limiting factors for aquatic and terrestrial species.
Species displacement (floral and faunal) Vegetative conditions in the Walla Walla River subbasin have changed in response to effects of land use practices (Figure 6). The most significant changes as relating to surface water, fish, and wildlife have occurred in the last 150 years. Prior to Euro-American settlement, large herds of horses bred by Native Americans and fires (ignited by both humans and lightning) ranged throughout the subbasin below the mesic forest zone (Saul 2002). The large influx of Euro-Americans to the subbasin began in the mid 1800s. The settlers brought with them large numbers of domestic cattle, sheep, and draft horses (U. S. Department of Agriculture 1941). Ultimately the rangelands were heavily grazed, leading to native plant species such as native steppe grass vegetation associations being replaced by more competitive and/or introduced plant species (Grable 1974). Exotic species introduction also increases as a result of available transport opportunities (whether by horse, automobile, train, etc.). Dominant introduced species include cheatgrass. (Bromus tectorum), velvet grass (Holcus lanatus), yellow starthistle (Centaurea solstitialis), barnyard grass (Echinochloa crusgual alli), tansy (Tanacetum vulgare), and rattlegrass (Bromus brizaeformis). Anthropogenic factors have, in large part, enabled the dominance of these introduced species, which has in turn led to a reduction in forage, cover, habitat complexity, seasonal water storage, fire resistance, and soil stability, all on a landscape level (Saul 2002). Many non-native wildlife species have taken advantage of anthropogenic disturbances and have supplemented or displaced many native species. These include, but are not limited to, starlings, opossum, domestic cats, European honeybees, bass and other warm-water fish species, and bull frogs. Additional anthropogenic disturbances and interactions with specific habitats and cover types are discussed in the above Vegetation chapter.
Relation to the Columbia Basin, Ecological Province, and other Subbasins in the Province
Development and operation of the Federal Columbia River Power System (FCRPS), which includes 13 mainstem dams used for hydropower, navigation, flood control, and irrigation in the Columbia River basin, resulted in widespread changes in riparian, riverine, and upland habitats. Because of the significant loss of mainstem habitat and habitat function associated with the FCRPS, tributary habitat has become more critical to the survival and recovery of Endangered Species Act listed species throughout the Columbia basin, especially in the Walla Walla Subbasin. Because of direct and indirect effects of the FCRPS on fish and wildlife, tributary habitat improvements have been recommended as part of the off-site mitigation activities required of the Corps of Engineers, the Bureau of Reclamation, and the Bonneville Power Administration. Such improvements are required in order for continued operation of the hydrosystem to be allowed under the Endangered Species Act. Such habitat improvement activities were specified as reasonable and prudent alternatives in a NMFS Biological Opinion (Bi-Op) in December, 2000, entitled, “Re-initiation of Consultation on Operation of the Federal Columbia River Power System, Including Juvenile Fish Transportation Program, and 19 Bureau of Reclamation Projects in the Columbia Basin. Tributary habitat improvement is also referenced in the Federal Caucus™ December 2000 Salmon Recovery Strategy, entitled Conservation of Columbia Basin Fish: Final Basin-wide Salmon Recovery

50
Strategy. The Bi-Op found that there is not universal agreement that the Columbia hydropower system is the primary factor limiting salmon recovery (Mamorek and Peters 1998). The Bi-Op suggests that it may be possible to recover Snake River stocks through restoration of freshwater spawning and rearing habitat in addition to some mainstem actions. Substantial responsibility has thus been placed on tributary systems to mitigate for productivity losses associated with the FCRPS, primarily by enhancing opportunity for salmonid spawning, rearing, and migration upstream from the mainstem Columbia. Along with other tributary subbasins along the lower to mid Columbia, the Walla Walla subbasin represents a critical opportunity for headwater mitigation within the Columbia Plateau province for main stem degradation, particularly in light of its significant potential for improvement and recent successes. The Walla Walla subbasin is one of eleven subbasins included within the Columbia plateau province under the NWPPC’s fish and wildlife program. Compared to other Level III ecoregions throughout the northwest, and other subbasins within the Columbia Basin Ecoregion (within which the Walla Walla subbasin occurs and is a representative example) the Walla Walla subbasin contains some of the highest percentages of landscape converted to non-native habitats and human uses (e.g. Clarke and Bryce 1997). The historic conversion of natural grasslands, brushy draws, tree-lined streams and springs to agriculture has been the driving force behind landscape alteration in the Walla Walla subbasin. Not surprisingly, the changes have occurred in the subbasin due to the fertility of the area, mild climate, and presence of water (surface and/or groundwater). Indeed, the factors that have made the subbasin so productive in terms of fish and wildlife have made it equally attractive to human development for agriculture. The effects of these changes have been an overall reduction in the abundance, distribution, diversity, and persistence of native fish and wildlife species (Saul 2002). The human development that has occurred within the Walla Walla subbasin, however, has left substantial opportunity for improvements and restoration. Since the majority of the land uses in the basin are related to agriculture, timber, and recreation, some improvements can still be made that restore and/or mimic, to some degree, historic hydrologic, morphological, floral, and faunal conditions. In other words, relative to other subbasins in the plateau province, Walla Walla subbasin restoration has not yet been limited to large degree by residential, industrial, or commercial development, although these constitute significant and growing problems for ecosystem recovery. Indeed, the cumulative and combined efforts of the agricultural, logging, ranching, and recreational communities within the subbasin have led to substantial and consistent improvements for both fish and wildlife and their habitat. There is every reason to believe that the conditions of the Walla Walla subbasin (a stable, growing economy, continuing agricultural community, relatively healthy upland forest ecosystems, etc.) render it uniquely capable of substantial and sustained ecological improvement over the long term.
Unique Qualities of the Walla Walla Subbasin The Walla Walla subbasin is unique to other subbasins in several broad but important ways. From a climatic standpoint, the subbasin is unique in its extremes, regarding both temperature and precipitation. Within the basin, relatively warm and arid lowland regions receive an abundance of summer and early-fall water in the form of surface and subsurface flow, fed by comparatively cool and moist headwater regions. This helps allow for a myriad of productive riparian and aquatic habitats, particularly in lower elevations where streams have the opportunity to meander. Conversely, upland and montaigne environments in the subbasin

51
experience a relative abundance of precipitation and relatively cool temperatures, leading to species and habitats vastly different than lowland areas. In addition to unique characteristics offered by the climate, unusual geologic factors have led to a highly complex system of surface and subsurface flow relationships. One of the primary elements of this system is a “distributary” system in which the Walla Walla and Mill Creek “main stems” break apart and branch off into a myriad of feeder springs and streams, which gradually rejoin the original channel at lower elevations. These distributary systems were historically productive in terms of fish and wildlife, providing extensive high quality habitat throughout many lower reaches of the subbasin. In particular, many of these springs and streams provided riparian protection, ample large woody debris recruitment, and perhaps most importantly, cool water chilled by subsurface input throughout hot and dry summers. It is thought many of these distributary these reaches provided high quality habitat for all stages of salmonid life cycles. In recent years, however, many of these streams have been converted to irrigation conduits, while others have dried and/or seen reduced flow as a result of climatic shifts and changes in water irrigation and delivery practices. Efforts to restore habitat for spawning, rearing, and migration, as well as terrestrial and avian species, should include these historically-productive and critical areas. Furthermore, any discussion of continued and changing water management strategies should take into account the unique and complex surface and subsurface hydrogeologic characteristics of the subbasin. Two of three main headwaters in the basin (South Fork Walla Walla and Mill Creek) are managed (above National Forest boundaries) as limited-access areas and with little or no recent timber harvest. The Mill Creek headwaters are managed as a restricted-access municipal watershed, and the South Fork Walla Walla is an Inventoried Roadless Area. The current overall condition of these watersheds (at least in terms of fish and wildlife habitat) can be characterized as excellent (Saul 2001), although both watersheds contain exceptionally high levels of fuels available for wildfire. While the North Fork Walla Walla headwaters have seen significant timber harvest within the past 30 years, the riparian areas are functioning and intact in these headwaters as well (Saul 2001). The Walla Walla subbasin possesses an exceptionally wide range of ecotypes, from high alpine and mesic forest types to arid and riparian lowland environments. The subbasin also contains part of a major National Wildlife Refuge near its mouth at McNary, which is situated in the midst of a major avian migratory corridor. The subbasin encompasses areas within two different states – Oregon and Washington. In terms of subbasin planning and management, this leads to a number of unique issues and circumstances. It encourages the combination of activity and resources associated with two states instead of one, which both increases management capacity and administrative challenges. Funding and staff resources are drawn from two states, but basin-wide management requires consultation and coordination between two sets of agencies and across two state jurisdictions, increasing time and effort needed for those activities. The Walla Walla subbasin contains a wild and distinct steelhead (Oncorhynchus mykiss ) species (an aquatic focal species for subbasin planning) based in its Oregon headwaters. The species is included in the Middle Columbia River evolutionary significant unit, making it a distinct population under the Endangered Species Act (Busby et al. 1996). Past management efforts have prohibited hatchery steelhead from reaching upriver spawning grounds and breeding or competing with wild stocks, thus ensuring the native stocks’ genetic integrity.

52
The Walla Walla subbasin is situated in the midst of lands ceded by the Confederated Tribes of the Umatilla Indian Reservation in the Treaty of 1855. Ongoing federal obligations associated with the Treaty (which included granting the Cayuse, Walla Walla, and Umatilla tribes reserved rights for fishing, hunting, gathering foods and medicines, and pasturing livestock, as well as 510,000 acres on which to live) afford unique, challenging, and exciting opportunities for protection, restoration, and cooperation in the subbasin. Finally, but perhaps most importantly, amidst a regional climate of conflict, the Walla Walla Basin has become a unique example of stakeholders from across the political spectrum coming together to seek practical and fair solutions to natural resource challenges. Restoration projects, planning, and monitoring are coordinated within and between the two states that share the Walla Walla Basin. The collaborative aspects to this work have been labeled the "Walla Walla Way" by those involved in the process. Several important groups have participated in a variety of collaborative efforts aimed at improving social, economic, and ecological conditions in the subbasin. The Walla Walla Watershed Alliance and Walla Walla Basin Watershed Council have perhaps worked the most to encourage cooperation in these efforts.
Note – the following pages were added in April, 2004 Current and Historic Land Use
Native American land uses Present subbasin conditions reflect land use practices that have occurred throughout its history. The earliest known inhabitants of the Walla Walla River Basin included three Native American Tribes: the Cayuse, Walla Walla, and Umatilla. These peoples primarily sustained themselves as nomadic hunters and gatherers. Although it is difficult to precisely characterize the extent and nature of tribal interactions with their surrounding environment, the impact of indigenous peoples on the Walla Walla basin landscape was certainly substantial, particularly after the introduction of horses and guns to the subbasin. Currently, the populations of both humans and horses are thought to have varied greatly, depending on location (Bower, 2003). For thousands of years, the area has served as a hub for Native American trade and culture, and it is generally accepted that local tribes frequently utilized and/or took advantage of fire to alter the surrounding landscape vegetation and wildlife in important ways, the most important of which being the encouragement of vegetative conditions associated with frequent fire return intervals. A recent Washington State University Water Resource Newsletter (May, 2002) quoted William Robbins:
Because floral and plant successions were critically important to hunting and gathering economies, native people regularly used fire to successfully manipulate the proper environmental conditions to enhance their subsistence prospects (quoted in Bower, 2003).
Localized populations of Native Americans probably had an impact on woody riparian species in certain areas of the subbasin.
Exploration and Trapping In 1805, the Corps of Discovery led by Lewis and Clark entered the Walla Walla valley through what is now known as the Touchet river. The large influx of Euro-Americans to the basin began in the mid-1800’s. Generally, at this time, timber and brush mixed with grass and forbs were found in the Blue Mountains, bunch grasses in the mid-elevation portions of the watershed, and

53
wild rye and sagebrush in the valleys (U.S. Dept. of Agriculture, 1941). In 1839, an early explorer near Whitman Mission on the Walla Walla River wrote “The plain about the waters of this river is about thirty miles square. A great part of this surface is more or less covered with bunch grass” (Farnham, 1839). The Walla Walla, Umatilla, and Cayuse Tribes ceded 6.4 million acres of their traditional homeland to the United States in an 1855 treaty (CTUIR website). In 1858, Charles Dickerson, the son of an early settler on Pine Creek (near the city of Milton-Freewater, Oregon), remembered the raw farm land of his childhood as being fertile but covered thickly with clumps of tall rye grass (Caverhill, 1971). Further downstream, Lewis and Clark in 1806, and David Douglas in 1826, noted the surrounding country as being dominated by sagebrush (Sexton and Volkman, 2000). Once Fort Nez Perce (Fort Walla Walla) was established in 1818 by the Northwest French Fur trading company at the Mouth of the Walla Walla River, trappers and hunters were to accomplish a nearly complete elimination of beaver (Castor Canadensis) within the subbasin. The loss of most of the beavers to the Walla Walla may have dramatically affected the riparian communities by reducing the amount and availability of water storage and water table levels. Horses were introduced into the Walla Walla Valley from Spanish settlements to the south in the 1730’s. Native American Indians began to make use of them soon afterward. In the mid-1800’s, large numbers of domestic cattle, sheep, and draft horses were introduced to the area (United States Dept. of Agriculture, 1941). Ultimately most of the rangelands were overgrazed, which led to the condition seen today: native plant populations often being replaced by more competitive introduced plant species and widespread soil loss (Sexton and Volkman, 2000). Current land uses in the Walla Walla subbasin are subject to the jurisdiction of five counties and two states, Walla Walla and Columbia Counties in Washington State and Umatilla, Union, and Wallowa Counties in Oregon (Saul 2002). Figure 7 displays major land uses in the Walla Walla subbasin. Federal land management entities include the U. S. Forest Service (Umatilla National Forest) and the U. S. Bureau of Land Management. Table 10 summarizes the areas within the Walla Walla subbasin that are protected and/or are managed using a conservation strategy. All lands managed by the Forest Service (USFS) and Bureau of Land Management (BLM) are located in the Blue Mountains. State management entities in the subbasin include the Washington Department of Fish and Wildlife (WDFW), Oregon Department of Fish and Wildlife (ODFW), Oregon Department of Forestry (ODF), Washington Department of Forestry (WDF), Washington Department of Natural Resources (WDNR), Oregon Department of Environmental Quality (ODEQ), Washington Department of Ecology (WDE), the Oregon Water Resources Department (OWRD), and the United States Fish and Wildlife Service (Saul 2002).
54
Agriculture The earliest noted agriculture in the valley occurred in about 1825 at Fort Nez Perce near the mouth of the Walla Walla River. In 1839 at Whitman Mission, wheat, corn, onions, melons, and various other crops were in cultivation (Farnham 1844). Prior to the establishment of Whitman Mission in 1836, the grass-covered hills were thought to be only suited for grazing, but by 1850 small amounts of cropland were situated along the river bottoms including some irrigation. In the fall of 1863, a farmer sowed 50 acres of wheat on the upland near Weston and the following summer collected an average of 35 bushels to the acre. From this point forward, land was broken out at an accelerated rate and by the late 1870s, Walla Walla County was considered one of the leaders in cultivated grains (U. S. Department of Agriculture 1941) (Saul 2002). The earliest noted agriculture in the valley occurred in about 1825 at Fort Nez Perce, later known as Fort Walla Walla, near the mouth of the Walla Walla River. In 1839, the area around Whitman Mission was primarily wheat, corn, onion, melons, and various other crops (Farnham, 1839). Prior to the establishment of Whitman Mission in 1836, the grass-covered hills were thought to be only suitable for grazing. By 1850, small amounts of cropland were situated along the river bottoms, including some utilizing irrigation. In the fall o f 1863, a farmer sowed 50 acres of wheat on the uplands near Weston and the following summer collected an average of 35 bushels to the acre. From this point forward, land was broken out at an accelerated rate and by the late 1870’s, Umatilla, Columbia, and Walla Walla Counties were considered as one of the leading regions in producing cultivated grains (United States Dept. of Agriculture, 1941) (Sexton and Volkman, 2000). Much of the following has been derived from Robert Bower’s History of Riparian Vegetation Along the Walla Walla River (2003). The Whitman Mission became a fundamental settlement foothold as it became a regular stop for settlers traveling the Oregon Trail. Some settlers opted to stay on at the mission and settle in the Walla Walla Valley area. However, the “Whitman Massacre” and subsequent local and regional Indian Wars (1845-58) kept settlement of the Walla Walla valley to a minimum until after the third major war in 1858. It was from that point forward that settlers began to populate the valley in force. The settlement and subsequent land use changes brought the next major influences to changes in the riparian vegetation communities. Captain Mullan took particular note of the amount of settlement that had occurred by 1860, “The valley bottoms are nearly all densely settled; the land in the bottom being sufficient for farms of considerable size…” (Mullan, 1863; quoted in Bower, 2003). Settlement of the valley continued with settlers focusing on homesteads and farms in or near the riparian areas of the Walla Walla River. Lyman wrote of the first settlements in the late 1850s and early 1860s: “The first locations were mainly near the vicinity of the present City of Walla Walla, with a few on the Touchet… the first settlers generally sought locations convenient to water, with bottom land where they thought grain and vegetables might flourish, but with the range of luxuriant bunch-grass as the essential consideration.” The city of Walla Walla was named and officially established on November 17, 1859. This “musical” name3 was “commonly
3 “Many poetic and some prosaic accounts have been given of the origin of the name. Among others, Joaquin Miller, “Poet of the Sierras,” insisted that when the French voyageurs first looked down from the Blue Mountains (“Les Montagnes Bleues” in their Gallic speech) upon the fair fertile valley, they exclaimed: “Voilá Voilá!” (Behold Behold!) and thus the name became fixed. This fantastic idea is, however, easily disproved by the fact that Lewis and Clark, who
55
suppose[d] to mean the ‘Valley of Waters’, referring to the numerous springs in the vicinity of the city.” Lyman also noted that “the Walla Walla [River] above that point was commonly known to the Indians as ‘Tum-a-lum’.” That name coincides today with the name of a school and bridge in the Oregon portion of the river downstream of today’s Milton-Freewater (Bower, 2003). Initially, irrigation ditches were easily created by appropriating existing streams that broke away from Mill Creek above the present city of Walla Walla and the Walla Walla River Main Stem above the present city of Milton-Freewater. These streams essentially became de-facto irrigation ditches. Several of these streams remain today in conditions that range from relatively-intact to substantially altered. The lower reaches of many continue to offer rearing habitat for salmonids and resident species, raising concerns for current fish and water managers. As agriculture in the Walla Walla Valley continued to expand, so too did the availability of large machinery capable of manipulating the landscape. Harper et al. (1938) indicates that steam-powered tractors were available in Umatilla County (Oregon) in 1904 and 1905, caterpillar-type gasoline-powered tractors were introduced from 1907 to 1909, and diesel oil-burning caterpillar tractors could be purchased in 1932. Riparian areas were cleared for farming and grazing, and extensive channel straightening had begun (Bower, 2003). Following the introduction of horses, the next major agricultural development with the potential to influence the riparian vegetation was the gold rush. The Walla Walla River Valley has a proud history of agricultural development ranging from hunting and gathering in early times to modern day orchards, vineyards, and grain and row crop farming. Lyman writes:
“Anticipating the rush for the mines in the year 1862, a great deal of livestock had been brought to the Walla Walla Country in the latter part of 1861, while the demands for food products led many ranchers to make provisions for raising greatly increased crops of grain and other produce to meet the demands of the coming season” (quoted in Bower, 2003).
Like the horse, agricultural livestock such as sheep and cattle could have influenced the riparian vegetation along the Walla Walla River by grazing. This would be particularly true in the early years of their introduction when fencing was all but non-existent. The seasonal changes of water availability in the Walla Walla River basin would also have helped to focus the impacts of grazing to near-river areas. The relevant abundance of green forage and proximity to drinking water make riparian areas alluring particularly during the dry mid-to-late summer months when surrounding ground dries out. While the mechanical impacts of grazing would focus effects on riparian grass and shrub species, longer-term effects could show up in the form of bank destabilization and subsequent channel incision4. It is commonly thought that as a river channel incises, the net effect is the narrowing of the riparian area width and a drop in the water table making it more difficult for riparian plants to reach water. The consequences of this can range from limited riparian vegetation production to an outright shift in the type of riparian communities. Grazing on riparian vegetation could have occurred at any location in the watershed, but initially was most likely limited to areas near valley settlements (Bower, 2003).
entered the country by Snake River, got the name from the Indians, on the Columbia near the mouth of the Walla Walla.” (Lyman, 1918) 4 Channel Incision is generally understood to mean a stream or river channel that has eroded downward causing the river channel to deepen.

56
Agricultural development and subsequent impacts on riparian vegetation along the Walla River continued through the 1800s and 1900s. Donald Meinig, in his 1953 thesis The Walla Walla Country: 1805 –1902, A century of man and the land, depicted the successional transition of agricultural land use in the Walla Walla River basin (Figure 2). Initially a predominantly range and livestock based system, agriculture transitioned into a more space-based farming system. By 1910, the valley had already transitioned to what we typically see today with more than 90% of the agriculture being based in orchards, grains and row crop farming (Bower, 2003).
Figure XX: History of Agricultural Development in the Walla Walla Subbasin (Bower, 2003) According to Bower (2003), historical agricultural land activities may have affected the riparian vegetation in a variety of ways including: • Channel straightening and bank stabilization to protect fertile flood plain crops, pastures,
and farm buildings. • Mechanical and chemical removal of streamside vegetation for farming near or in the
historical riparian vegetation areas. • Transformation of Walla Walla River Branches, particularly the East and West Little Walla
Walla systems, into irrigation ditches and the subsequent removal of riparian vegetation. Although the overall effects of agricultural development have been basin-wide, the first activities focused on the mid-section of the Walla Walla River, near the first settlements. However, today agricultural land use stretches from the mouth to the forested headwaters (Bower, 2003).

57
In 1997, 88% of Walla Walla county acres were utilized for farming, which may reasonably be extrapolated to the greater subbasin, due to relatively similar topography, soil types, and precipitation. The growing conditions for most local crops are recognized as some of the best to be found in the Northwestern United States, if not the world. This is particularly true for grapes, apples, and dryland wheat (Saul 2002). Other significant agricultural products include barley, hay, onion, potato, orchard fruits, and multiple pea varieties. The areas encompassed by these counties are greater than the area of the subbasin, but include all of its agricultural acres and give the best possible estimates of crop and livestock production. The data is derived from the 1992 an d1997 United States Census of Agriculture. The Walla Walla floodplain valley is extensively and intensively irrigated (Figure __). Irrigated lands primarily occur in the narrow lowland portions of the subbasin, representing the largest use of surface and groundwater in the subbasin). The floodplains are relatively narrow except for the (relatively) wide alluvial fans over Mill Creek and the mainstem between Milton-Freewater and the Oregon border. A report by the U.S. Bureau of Reclamation (1999) estimated that in Oregon there are about 14,000 acres irrigated from surface flows and shallow wells and about 2,000 acres irrigated from deep wells. Further study examining recent respective volumes of surface and groundwater used for irrigation purposes is warranted (Saul 2002). There has been a steady increase in the acres of irrigated croplands in the Walla Walla subbasin since the mid 1800s. The estimated area of irrigated Walla Walla County land in 1987 was 75,333 acres, compared to 97,136 acres a decade later, which represents nearly a 30% increase (National Agricultural Statistics Service 1997). Primary water sources include the Touchet and Walla Walla Rivers, gravel aquifers, and the basalt system (Saul 2002). Primary water delivery conduits in the subbasin include the East-West Canal, Gardena Canal, Lowden Canals, the Hudson Bay Improvement Company ditches, Walla Walla Irrigation District ditches, and a number of small ditches upstream of Milton-Freewater.
The traditional use of all the water in the river became an issue of political concern once bull trout were listed in 1998 and steelhead in 1999 as threatened species in the Walla Walla River under the Endangered Species Act. Federal agencies considered direct intervention and conservation groups considered lawsuits against the irrigation districts to enforce the law. Unlike other water users in Western watersheds (in particular, the Klamath and Methow basins), Walla Walla basin irrigators whose livelihoods depend on water for their farms stepped forward with a proactive willingness to reach a mutually-acceptable agreement with federal agencies and conservation groups. The Walla Walla Basin Watershed Council, along with Kooskooskie Commons and the Confederated Tribes of the Umatilla Indian Reservation, helped facilitate a negotiation process that led to a compromise solution.
Beginning in 2000, three irrigation districts (representing the majority of surface water use in the subbasin) pledged to keep a minimum water flow in the river and signed an agreement to this effect with the U.S. Fish and Wildlife Service. Two of the irrigation districts that signed the agreement divert water in Oregon (Hudson Bay District Improvement Company and Walla Walla River Irrigation District). During the driest part of the season, they left 13cfs in the river. The third district (Gardena Farms Irrigation District #13) is located in Washington, west of the City of Walla Walla, and left 10cfs in the river. The instream water improved flows and helped provide a continuous flow for passage to upriver for any bull trout and other fish in the mid to lower river sections.

58
In 2001, the Oregon irrigation districts bypassed 18cfs and the Washington irrigation district bypassed 14cfs. In 2002, they left a minimum of 25cfs in the river in Oregon and 18cfs in Washington, a level that challenged the districts and irrigators within the districts to rapidly become more efficient but that is expected to be sustainable. The most common efficiency practices adopted include drilling deep wells (at irrigator expense), installing on-farm storage sites, piping delivery ditches, and sprinkler conversion. The Districts have also reduced river fluctuations caused by their operations to prevent the stranding of fish. Cost-share assistance from state, federal, and BPA sources have been essential for the survival of the affected districts and farms.
22%
9%
69%
1
2
3IndustrialMunicipal
Irrigation
Figure 10. Water use in the Walla Walla subbasin (U. S. Army Corps of Engineers, 1997). In addition to irrigated grain crops, fruit crops such as orchards and vineyards represent a growing portion of irrigated agriculture in the subbasin. Irrigated orchard acreage in UmatillaCounty, most of which lies in the Walla Walla subbasin, has essentially remained unchanged between 1992 and 1997: 4,984 acres vs. 4,743 acres respectively (National Agricultural Statistics Service, 1997). Other irrigated crops include asparagus, beans, onions, pasture, and potatoes (James et al., 1991) (Saul 2002). To a small degree in Oregon, and a much larger degree in Washington, agricultural lands (irrigated and non-irrigated) and riparian areas have recently been converted to residential and commercial use. The Conservation Reserve Program (CRP) as managed by NRCS, assists farmland owners and operators in conserving and improving soil, water, and wildlife resources. Highly erodible and other environmentally sensitive acreage previously devoted to the production of agricultural commodities is converted to long-term approved cover. CRP enhances habitats and forage and reduces sediment delivery. Participants enroll in contracts for 10 to 15 years. Signups have been occurring since the 1985 Farm Bill (Greg Schlenz, NRCS, January 3, 2001) (Saul 2002).

59
The CRP has made improvements to 38,211 acres in Columbia County, 148,894 acres in Walla Walla County, and 107,283 acres in Umatilla County from 1986-2001 (U. S. Department of Agriculture 2000).

60
Timber The history of timber harvest in the Walla Walla River basin is similar to western United States regional trends. Logging of both the uplands and riparian tree species has occurred throughout much of the three major drainages of the Walla Walla River: Mill Creek, North and South Forks of Walla Walla Rivers. Historically riparian tree species were removed and either allowed to regenerate naturally or were actively re-planted after harvest. Forest management activities and logging have been conducted by both private and public entities. A large influx of settlers in the 1880s created a demand for wood. Riparian forests had fairly extensive amounts of cottonwoods (especially along the Touchet River), but in comparison the nearby Blue Mountains were heavily timbered with coniferous trees (Lewis and W.Clark 1893, McKinney 1998). Early timber cruisers felt the timber supply in the Blue Mountains was inexhaustible. Logging activity was centralized in the Upper Touchet River Subbasin on the Cahill, Eckler, and Robinette Mountains, and Lewis Creek and the Wolf Fork Touchet River. Timber harvest averaged 13,000 board feet per day. Oxen and an 18-mile long flume from the upper Robinson Fork to the town of Dayton were used to transport logs until 1900 (McKinney 1998). Early harvests focused on the most profitable trees, large Douglas-fir and Ponderosa pine. Harvest shifted to western larch, grand fir, white fir, and lodgepole pine once Douglas-fir and Ponderosa pine supplies were exhausted. Logs were commonly yarded across streams, destroying spawning grounds. Stream channels were also modified to reduce road construction costs (Van Cleve and Ting 1960). Clearcutting was the logging method of choice. In recent history, the Mill Creek and South Fork Walla Walla River drainages have set aside from logging. The upper portion of the Mill Creek watershed was set aside by the USFS (in cooperation with the City of Walla Walla) for water quality purposes because it provides a majority of the municipal water for the City of Walla Walla. The upper South Fork Walla Walla River drainage, mainly under federal control of United States Forest Service and the Federal Bureau of Land Management for water quality protection and for fish habitat and production. Under these more recent management strategies, riparian vegetation is allowed to regenerate and flourish based on natural selection and successional processes. Logging continues in the North Fork Walla Walla River drainage on lands that are in private ownership (Bower, 2003). Other changes in riparian vegetation in the forested upper parts of the basin have evidence of having been affected by a variety of other factors including: • Fire suppression. • Introduction of non-native stock and/or noxious weed species. • Insects. • Disease. Numerous research and historical documents have been written discussing both the historical and current effects of management in these upper areas of the Walla Walla River Basin. David Powell’s Historical References About Vegetation Conditions: A Bibliography With Abstracts (Powell, 1999) provides 983 separate references for the Umatilla National Forest alone, of which the Walla Walla River basin exists. As comprehensive review of these documents is outside the time available for this study. Interested readers are encouraged to review Powell’s work (Bower, 2003).

61
The forested lands in the Oregon and Washington portions of the Walla Walla subbasin are shown in Table 12. The majority of timber harvest on federally managed lands occurs in the high-elevation portions of the subbasin, while privately harvested grounds generally occur on mid-elevation lands (Saul 2001). Apart from regulatory restrictions, logging is often limited by topography (particularly extremely steep slopes) and fire danger. Timber harvest of any landscape-level significance in the Walla Walla Basin dates from after World War II. Prior to that most logging occurred on private timberlands dating from the mid-1920s, and from the time settlers began cutting upland timber, logs were flumed down river channels, impacting riparian vegetation and fish habitat. In the 1990s, logging occurred at a higher rate on private lands, and represents “a substantial proportion of the ongoing logging operations in the Walla Walla subbasin” (Hanson, M. et al., 2002). Umatilla National Forest statistics show a rapid rise and peak in the 1970s, dropping significantly in the 1980s, and further yet in the 1990s. Road construction paralleled the timber sale program in both time and location (Hanson, M. et al., 2002). Timber harvest off the Umatilla National Forest is restricted to the upper North and South Fork Walla Walla, and upper Touchet River tributaries. Some timber harvest has occurred in the North Fork watershed, but little in the South Fork (U. S. Bureau of Reclamation 1999). During the summer of 2002, Umatilla National Forest implemented a “salvage and fire-break” timber sale on the ridge tops dividing the headwaters of the North and South Forks of the Walla Walla River and Mill Creek watersheds (Northrop 1998b; U. S. Bureau of Reclamation 1999). The sale involved the harvest of 4.6 million board feet of timber on 514 acres using a forwarder cut-to-length harvesting system (Northrop 1998b). The biological assessment has determined that the sale will not directly affect salmonid production or habitat (Northrop 1998b) (Saul 2001). Timber harvest on private lands represents a substantial proportion of the ongoing logging operations in the Walla Walla subbasin and is expected to continue in the future as tree stands and market conditions allow. Private contractors such as Boise Cascade continue to operate in the subbasin, at a relatively small but unknown scale (Saul 2001). Table 12. Forested portions of the Walla Walla subbasin and respective divisions by management entity (Saul 2001). State Total Forested
Acreage Federally Managed Land (acres)
State Managed Land (acres)
Privately Managed Land (acres)
Washington 138,651 44,763 6,058 87,831 Oregon 88,200 48,700 1,560 37,900
Range Livestock grazing is scattered throughout the upper and lower portions of the subbasin, while some Confined Feeding Operations are located between Milton-Freewater and Wallula. The upper portion of the subbasin in Oregon supports about 15% of the Umatilla County’s cow-calf operations (about 4,800 pairs; U. S. Bureau of Reclamation 1999). Columbia County contains one large-scale livestock operation; other operations in the Touchet portion are either secondary businesses and/or small (Roland Schirman, WSU Cooperative Extension, April 7, 1999). With

62
its steep slopes and limited grasslands, little grazing occurs on federal lands in the North and South Fork Walla Walla watersheds.
Urban Development Cities and towns began appearing in the Walla Walla Basin around the 1860s. The city of Walla Walla was founded in 1858. At that time it was called “Waiilatpu,” which has been interpreted as: “Place of the People of the Rye Grass.” Waitsburg soon followed and had a population of 107 by 1869. Dayton was platted in 1872. The Walla Walla area was a popular site for settlement. By 1910 the population of Walla Walla had risen to 20,000 people. There was even talk of making Walla Walla the state capitol (Meinig 1968). The most dramatic influence along this lower Oregon portion of the Walla Walla river is the construction of a flood control levee above and through the town of Milton-Freewater. The levee was originally designed and constructed in the 1940s and completed in 1952 (USACE, 1997). A devastating flood early in 1965 destroyed much of the original levee structure. Following the flood, local groups and the USACE rebuilt a reinforced version of the levee that is provides flood control today. While the levee provides critical flood protection for the citizens of Milton-Freewater, its design and size make it necessary to remove riparian vegetation in and on the levee control structures. For approximately the past 40 years, most, if not all, of the riparian vegetation was removed creating a straightened, unshaded, degraded riparian habitat section of the Walla Walla River. While the entire levee length of the levee is seven miles (from Joe West Bridge to Tum-a-lum Bridge), the majority of intensive vegetation management has taken place along the section of levee near the town of Milton-Freewater. The population of the valley’s cities and towns has continued to increase through the most recent decades. The 2000 United States Census reported approximately 129,000 people in Walla Walla and Umatilla Counties (US Census, 2000). Generally, population growth and urban development can lead to the impediment, exclusion or removal of riparian vegetation in activities such as: • Construction of streamside roads and water crossings including road and railroad bridges • River channel and straightening using rip-rap such as large boulders, trees, and old
automobiles and farm equipment. • Displacement of the riparian zone through building construction in the near-river areas. • Displacement of native vegetation through the introduction of non-native noxious weeds and
plants. • Removal of larger riparian tree species in order to protect downstream buildings and bridges
during major flood events. Most of the impacts caused by settlement and development have been focused on the lower and middle portions of the Walla Walla River system because this is the area that hosts the majority of the valley’s population. Residing downstream of extensive transient snow zones,the Walla Walla Valley is prone to flood-related damage. On June 28, 1938, the Flood Control Act was passed in Congress, which called for two projects to be built in the Walla Walla Valley: the Mill Creek Flood Control Plan and the Mill Creek Channel. The Army Corps of Engineers completed the Mill Creek Flood Control Plan in 1943, the first of two projects. The project was created to divert as much as

63
4000 cubic feet per second (cfs) of water from Mill Creek in times of flood. The project included a diversion structure that was built across Mill Creek at Rooks Park, diverting water to the south into an intake channel that ran to a reservoir (Figure 1). A return canal was able to drain water held in the reservoir back into Mill Creek when the potential for flooding subsided. Also included in the project was an additional diversion device located approximately half a mile downstream from the first diversion. This device diverted water from Mill Creek into Garrison and Yellowhawk Creeks, directing the water south of the City of Walla Walla. The Army Corps of Engineers completed the Mill Creek Channel in 1948. This project was initiated in order to channelize Mill Creek though the city. Concrete barriers, walls, floors and waterfalls, as well as gabions, were constructed along its shores to create the channel. Both structures have been proven to be successful at preventing extensive flood damage to the City of Walla Walla. As would be expected, flood-control activities on the middle and lower reaches of Mill Creek as it approaches the city of Walla Walla have exerted a profound impact upon existing hydrologic, chemical, and biological conditions in this reach, which are discussed in other sections of this assessment and others.
Numerous shallow wells (30’-300’ deep) tapping into the valley floor continue to influence shallow aquifer levels, contributing to seasonal draw-down that fluxuates annually according to precipitation during the winter and sprint. This annual draw-down and recharge occurs in an unconfined aquifer composed of numerous alluvial strata superimposed atop a bedrock basalt layer. There is a high degree of hydraulic continuity between surface springs and streams and aquifer levels in the region, which primarily lies north and west of Milton-Freewater. An increase in the overall amount of well use and reduced surface water supplies available for use (which leads to increased strains on shallow ground water resources) have, to some extent, negatively impacted both surface flows in some groundwater-influenced streams, and overall groundwater levels.
There are numerous towns located within the Walla Walla subbasin which are incorporated (Table 13Table). Urban sprawl is a concern for resource managers, as indicated by the growing number of ranchettes, subdivisions, subdivided cropland, and floodplain encroachment. These areas often occur near wooded areas, or streams. One of the concerns is over the increasing number of shallow individual domestic wells (existing and proposed) and their impact on streamflows (Hanson and Mitchell 1977). Similarly, the increasing number of dwellings poses a threat to water quality due to the increased amount and dispersion of potential nutrient sources and exotic plants immediately adjacent to waterways (Saul 2001). Table 13. Incorporated towns with populations exceeding 1,000 in the Walla Walla subbasin (U. S. Census Bureau 2000) (Saul 2001).
Population City Urban Area (mi2)
1990 1992 1994 1996 1998
Walla Walla, Washington
12.2 26,482 28,134 28,730 28,930 29,440
College Place, Washington
1.7 6,308 6,410 6,710 6,865 7,110
Milton- 1.7 5,699 5,837 6,002 6,037 6,054

64
Freewater, Oregon Dayton, Washington
1.5 2,468 2,470 2,505 2,550 2,553
Waitsburg, Washington
0.8 990 1,015 1,130 1,224 1,225
In the Washington portion of the subbasin, municipal water systems are supplied from both surface and groundwater sources (Hanson and Mitchell 1977). Walla Walla, the largest city in the subbasin, obtains approximately 85% of its water supply from Mill Creek (Hanson and Mitchell 1977). Trends indicate the aquifer underlying Walla Walla and many other urbanized areas is being depleted at an alarmingly high rate (Hanson and Mitchell 1977) (Saul 2001). Relying on a deep basalt aquifer, the city of Milton-Freewater was estimated in a 1977 study to consume as much as 400,000 gallons of water per day (Hanson and Mitchell 1977) (Saul 2001). Since that time, several food processing plants have closed and have left the city with an adequacy of water for current and expected growth (Umatilla Basin Report, 1988).
Transportation The Burlington Northern and Union Pacific are the two main railroads serving the area. Walla Walla has scheduled air service, along with bus and motor freight. U.S. Highway 12 and Washington State Highway 125 give Walla Walla good highway access. Oregon State Highway 11 provides Milton-Freewater access to the north and south. U.S. Highways 12-395 and 395-730 border the Walla Walla subbasin on the west. Numerous county roads provide access throughout the subbasin. Columbia River water transportation is used for importing agricultural machinery, fertilizers, bulk cement, and petroleum products, and exporting bulk grain, manufactured goods, and processed foods (Saul 2001).
Vegetation Vegetation of the Columbia Plateau ecoregion (Figures 1 and 2) is dominated by xeric species, whereas vegetation of the Blue Mountain ecoregion is predominately mesic species. Historically, timber and brush mixed with grass and forbs were found in the Blue Mountains, bunch grasses in the middle portions of the watershed, and wild rye and sagebrush in the valleys (U. S. War Department 1860; U. S. Department of Agriculture 1941). As part of a governmental railroad survey from the Mississippi River to the Pacific Ocean conducted in 1853, the Touchet River was noted as “separated by a rolling, grassy prairie; its banks better wooded than those of any stream met with west of the Bitter Root mountains, and the soil equal to any which had been seen on the route” (U. S. War Department, 1860). Other historical accounts describe a limited amount of vegetative diversity, such as that recorded by historian David Douglas of the London Horticulture Society who traveled up the Walla Walla River in 1826 to collect samples for the Hudson’s Bay Company. While near the mouth, he described the country to the north as an “entirely level plain of gravel and sand, destitute of timber, with not even a shrub exceeding four feet in height except a few low straggling birch and willow on the sides of rivulets or springs” (Lavender, 1972).
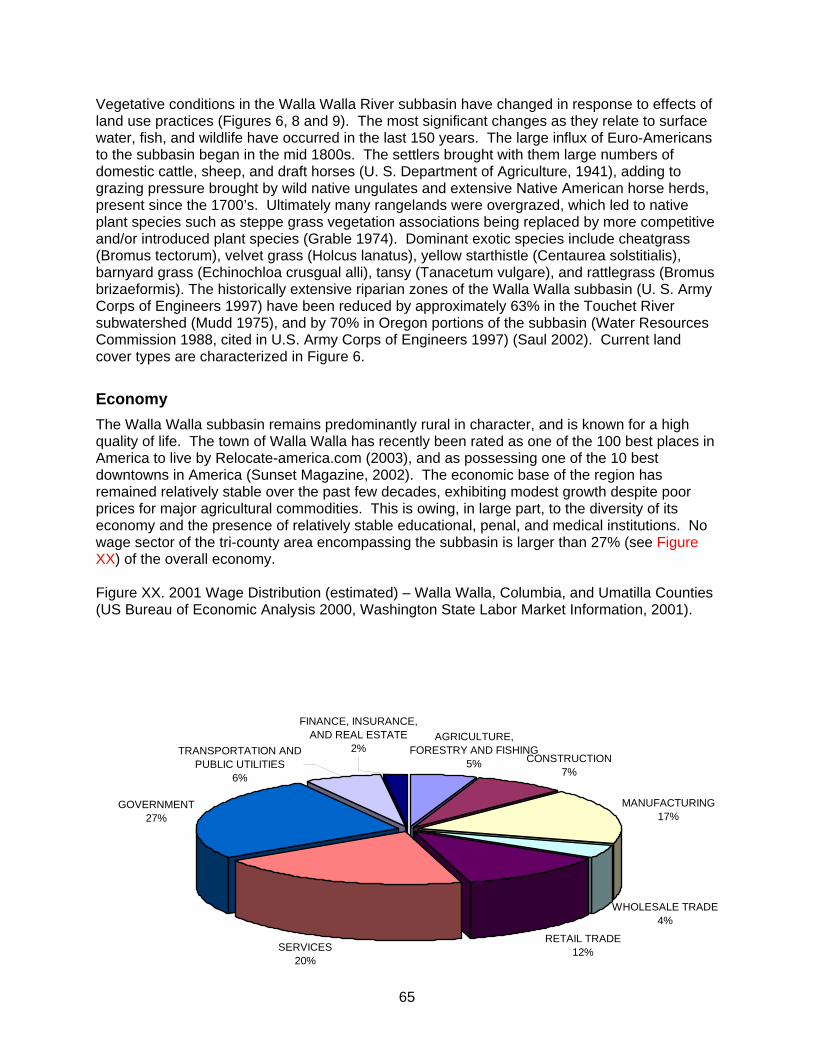
65
Vegetative conditions in the Walla Walla River subbasin have changed in response to effects of land use practices (Figures 6, 8 and 9). The most significant changes as they relate to surface water, fish, and wildlife have occurred in the last 150 years. The large influx of Euro-Americans to the subbasin began in the mid 1800s. The settlers brought with them large numbers of domestic cattle, sheep, and draft horses (U. S. Department of Agriculture, 1941), adding to grazing pressure brought by wild native ungulates and extensive Native American horse herds, present since the 1700’s. Ultimately many rangelands were overgrazed, which led to native plant species such as steppe grass vegetation associations being replaced by more competitive and/or introduced plant species (Grable 1974). Dominant exotic species include cheatgrass (Bromus tectorum), velvet grass (Holcus lanatus), yellow starthistle (Centaurea solstitialis), barnyard grass (Echinochloa crusgual alli), tansy (Tanacetum vulgare), and rattlegrass (Bromus brizaeformis). The historically extensive riparian zones of the Walla Walla subbasin (U. S. Army Corps of Engineers 1997) have been reduced by approximately 63% in the Touchet River subwatershed (Mudd 1975), and by 70% in Oregon portions of the subbasin (Water Resources Commission 1988, cited in U.S. Army Corps of Engineers 1997) (Saul 2002). Current land cover types are characterized in Figure 6.
Economy The Walla Walla subbasin remains predominantly rural in character, and is known for a high quality of life. The town of Walla Walla has recently been rated as one of the 100 best places in America to live by Relocate-america.com (2003), and as possessing one of the 10 best downtowns in America (Sunset Magazine, 2002). The economic base of the region has remained relatively stable over the past few decades, exhibiting modest growth despite poor prices for major agricultural commodities. This is owing, in large part, to the diversity of its economy and the presence of relatively stable educational, penal, and medical institutions. No wage sector of the tri-county area encompassing the subbasin is larger than 27% (see Figure XX) of the overall economy. Figure XX. 2001 Wage Distribution (estimated) – Walla Walla, Columbia, and Umatilla Counties (US Bureau of Economic Analysis 2000, Washington State Labor Market Information, 2001).
AGRICULTURE, FORESTRY AND FISHING
5% CONSTRUCTION7%
MANUFACTURING17%
WHOLESALE TRADE4%
RETAIL TRADE12%SERVICES
20%
GOVERNMENT27%
FINANCE, INSURANCE, AND REAL ESTATE
2%TRANSPORTATION AND PUBLIC UTILITIES
6%

66
In addition, because of its abundant natural resources and rural lifestyle, the region remains attractive to prospective investors, residents, and, most significantly, tourists. Several subbasin towns and cities derive substantial economic revenue linked to tourist activity as well as agricultural income. Subbasin-wide data documenting revenue derived from tourism is currently not available. Most often, tourists visit to enjoy cultural events and recreational activities, many of which are closely associated with winter sports and fish and wildlife resources. The subbasin is regionally marketed to tourists, business, and potential residents in terms of its natural beauty and resources as much or more than inexpensive real estate, vibrant downtowns, and educational institutions. The subbasin has always been closely linked economically to the Pacific Northwest as a region, primarily through the export of commodities and the import of visitor use and governmental activity. This relationship is dominated by the export of agricultural commodities out of the subbasin, especially dryland wheat, sweet onions, wine, wine grapes, and apples. Nearly all agricultural commodities produced in the subbasin are exported, often across the world. In 1997 the total value of all agricultural products sold in Columbia, Umatilla, and Walla Walla counties was $530,608,000 (1997 USDA Ag. Census). The subbasin is also a regional producer of paper and beef products, and aside from hydropower, is also a major producer/exporter of wind energy, possessing the Northwest’s largest wind-generated power facility along the Horse Heaven Hills. Refer to Appendix XX for agricultural data and statistics in Columbia, Walla Walla, and Umatilla Counties. The subbasin provides some of the Northwest’s best hunting in the Blue Mountains and sportsmen and women come from throughout the Northwest to harvest (legally and illegally) game birds and deer, elk, bear, and cougar. The subbasin winter steelhead and trout fishery also remains important within the regions of the Northwest east of the Cascades, resulting in thousands of visitor-days of activity each year. The Blue Mountain headwaters of the subbasin host the most snowmobile activity in the Northwest during the winter, and Bluewood, one of two subbasin ski resorts, receives visitors from throughout southeast Washington. The subbasin contains one of three State Penitentiaries in Washington, a source of substantial and consistent economic wage revenue. Specific revenue and value data on these sectors is not currently available. The subbasin is also economically linked to the Pacific Northwest region in terms of fish and wildlife recovery. Substantial support enters the basin aimed at fish and wildlife enhancement, through state, federal, and private sources. This support directly reaches subbasin government agencies and private service providers as revenue, can be re-transmitted to contractors or other service providers as revenue or widely diffuse into the economy as wages. Subbasin wage and revenue data for these sectors is not currently available. Agricultural producers and forest users are also directly and indirectly impacted economically by fish and wildlife regulations. These impacts (which can be either positive or negative) often reverberate throughout the subbasin economy as these commodities constitute substantial forms of revenue within the subbasin.
Major Economic Sectors The economic base of the Walla Walla subbasin has long included dryland and irrigated agriculture as a substantial component. The growing conditions for most local crops are recognized as some of the best to be found in the Northwestern United States, if not the world.

67
This is particularly true for grapes, apples, and dryland wheat (Saul 2002). Other significant agricultural products include barley, hay, onion, potato, orchard fruits, and multiple pea varieties. Refer to Appendix XX for agricultural data and statistics in Columbia, Walla Walla, and Umatilla Counties. According to an agribusiness committee convened by the Milton-Freewater Chamber of Commerce in the early 1980’s, “After the initial settlement of the Walla Walla River Valley near Milton-Freewater the growing of apples, cherries, prunes and plums, peaches and nectarines have been an important factor in the local economy” (Agri-business Committee, 1985). According to a 1982 Umatilla County Comprehensive Plan, “Orchardists in the Milton-Freewater area are heavily dependent upon the Walla Walla River for irrigation, especially in July and August” (p. D-75) On a regional and national level, the Walla Walla Valley remains known primarily in terms of its agricultural capacity, which also serves as a strong selling point to outside businesses, consumers, and potential residents. Walla Walla has been and continues to be utilized as an effective marketing label, drawing unique and important consumer attention to local products. Some agricultural products are value-added and processed within the valley as well. For example, packing houses and juice-production facilities for apples constitute some of the largest industrial employers in Milton-Freewater, and other food processors such as Smith Frozen Foods, Inc., Seneca, and Iowa Beef Producers, Inc., continue to operate, contributing substantial revenue in the form of personal income and public taxes. Ranching and timber constitute the dominant land uses and resources produced in upland areas, and there are small sheep and cattle operations scattered throughout the basin. The Walla Walla subbasin has seen tremendous growth in its local wine industry, which have become world-renowned for quality. The monetary influx associated with federal payments and subsidies for conservation and agricultural activities also represents a large and important sector of the subbasin economy. The total amount for federal assistance programs entering Columbia County, Walla Walla County, and the area encompassed by ZIP code 97862 (roughly the region of Umatilla County associated with the Oregon-Walla Walla basin) was $208,917,488 from 1996-2001, or approximately $41,783,498 per year during that time in direct and indirect revenue for subbasin agricultural producers (Environmental Working Group Agricultural Subsidy database - http://www.ewg.org/farm/). These numbers include payments for farming subsidies, conservation programs, and disaster relief. See Table 13 for 1997 statistics in federal payments and total market value of crops. That year, farming subsidies constituted about 6.4% of the total market value of all agricultural products. Table 14: 1997 Federal Subsidies and Market Value of Agricultural products in Umatilla, Walla Walla, and Columbia Counties (USDA 1997 Ag. Census data). 1997 Federal Payments 1997 Market Value of Total Ag. Products Sold (dollars)
Walla Walla County 13,861,966.00 256,930,000.00
Columbia County 5,393,957.00 24,477,000.00
Umatilla County * 14,634,024.00 249,201,000.00
Totals 33,889,947.00 530,608,000.00
* Data not available specific to Walla Walla subbasin in Umatilla County

68
Beyond agriculture and related industries, the Walla Walla subbasin contains a diverse array of additional economic sectors. Several major packing houses, engineering, call center, graphic design, construction, and consulting firms remain in the basin. Boise-Cascade operates a major paper products facility near the mouth of the Walla Walla. The towns of Walla Walla subbasin all provide a variety of cultural, agricultural, technical, and recreational events, workshops, and conferences. Other major employers include educational, penal, and county, state, and federal governmental institutions, and a regional medical center in the city of Walla Walla. A major regional Army Corps of Engineers Office is located in the city of Walla Walla. Finally, year-round recreation activities (including hunting, fishing, gathering, winter sports, bicycling, birding, and hiking/backpacking) constitute a stable and significant revenue source for local businesses. Figure _ displays these industries and many others grouped within economic sectors, showing the distribution of these components in the overall wage economy of the three counties the subbasin lies within.
Relationship of Economy to Natural Resources The relationship of major economic sectors in the Walla Walla subbasin is partially summarized in Table __. Table __: Major Relationships of Principal Economic Sectors to Subbasin Natural Resources.
Economic Sector Relationship to subbasin natural resources Revenue from healthy crops and forests Activities afftect habitat quality, size, and connectivity. Agriculture and Forestry Afftected by regulatory pressure, burden, and scrutiny Revenue from healthy fishing stocks Recreational enjoyment Sustenance Afftected by regulatory pressure, burden, and scrutiny Structures and activities afftect habitat quality, size, and connectivity.
Fishing
Cultural significance Revenue from development linked to landscape health and beauty Afftected by regulatory pressure, burden, and scrutiny Construction Structures and activities afftect habitat quality, size, and connectivity.
Manufacturing Afftected by regulatory pressure, burden, and scrutiny
WholesaleTrade No direct and discernable relationship.
Retail Trade Revenue from recreational and agricultural activities associated with natural resources Revenue and other funding for managing, monitoring, protecting, and enhancing natural resources. Services Revenue associated with planning, legal issue resolution Responsible for sound management and stewardship of natural resources Partially responsible for monitoring Government Dictates and is afftected by regulatory pressure, burden, and scrutiny Structures and activities afftect habitat quality, size, and connectivity.
Transportation Afftected by regulatory pressure, burden, and scrutiny Afftected by regulatory pressure, burden, and scrutiny
Finance, Insurance, and Real Estate Revenue from with property values associated with natural resources

69
Importance of Water to Economy It is hard to overstate the importance of water resources to agriculture within the Walla Walla valley, especially the Oregon portion. According Newcomb’s 1965 seminal and definitive report of ground and surface water resources in the Walla Walla Basin :
After the discharge of the last of the snowmelt, by about July 1 of each year, the 150 cfs of ground-water outflow carried to the Walla Walla Valley by these two streams (the Walla Walla River and Mill Creek), along with the water pumped from ground-water storage beneath the valley, forms the bulk of the water supply on which the economic life of the valley is based.
Additionally, on p. 63 Newcomb states: Protection and increase of the water resources of the old gravel are vital to the established economy of the Walla Walla Valley (including the Washington portion). Actions that might permanently decrease the natural infiltration recharge from the surface or the artificial recharge by irrigation and other means may be detrimental to full use of the water-storage resource(emphasis added).
It should be noted that “full use” not only refers to human use but use by fish and wildlife, particularly in spring-fed branches and distributaries that receive summer base flows as a result of shallow aquifer infiltration and recharge. The 1982 the Umatilla County Comprehensive Plan stated:
Water resources quality is extremely important to future growth possibilities in Umatilla County. Should the present water supply drastically deteriorate in quality, domestic consumption could be restricted and population growth curtailed. Directly related to water quality is the functional relationship of water quantity. Water supplies or quantities can either cause quality degradation or they abate polluting activities leading to water quality deterioration. Adequate water supplies are similarly important to the economic health of the area, which is heavily dependent upon irrigated agriculture and related industries (Tech Report #1 E-5).
In terms of cost versus revenue per unit sold, the highest-value crops in the subbasin are all irrigated crops. The water rights one which these crops depend are purchased on either an annual or permanent basis. Annual senior water rights in the Oregon portion of the basin have been valued at approximately $80-100 acre ($2,160-$2,700 per cfs in the Walla Walla basin, assuming 1 acre = 1/27 cfs), while permanent senior rights are typically valued at $1,000/acre ($27,000/cfs). Permanent senior water rights in Washington have recently been purchased for $50,000-$100,000/cfs, and sometimes more (T. Anthony, and B. Wolcott, personal communication, 2003). This puts the current market value of water bypassed by basin Irrigation Districts at somewhere between $675,000 and $2.5 million or more. Some basin irrigators have recently switched to crops requiring less water during the driest part of the irrigation season (such as apples to cherries and grapes) without incurring a substantial loss in economic revenue.
Fish and Wildlife Enhancement/Recovery As a result of natural resources issues associated with the Clean Water Act, Endangered Species Act, and Tribal Treaty Obligations, a the Walla Walla subbasin economy receives substantial annual monetary inputs in the form of county, state, federal, and private support for habitat enhancement and fish and wildlife recovery. Total estimates for this are not currently available. Some of the largest employers in this arena include state and federal management agencies, the US Army Corps of Engineers, the Confederated Tribes of the Umatilla Indian Reservation, and the Bonneville Power Administration. Additional revenue entering the basin partially supports (usually in the form of cost-share assistance for projects) contracting entities,
70
resource users (especially water resource users) and nonprofit organizations such as the Walla Walla Basin Watershed Council and Tri-State Steelheaders.
Cultural relationships Many cultural values within the Walla Walla subbasin have long been placed on natural resources. The Cayuse, Walla Walla, and Umatilla peoples maintained and developed a myriad of relationships to natural resources, which were at once spiritual, religious, economic, political, artistic, familial, and practical. Other subbasin inhabitants maintain similar relationships, particularly through recreational activities such as hunting, fishing, hiking, farming, and ranching. Family ties are strengthened through the enjoyment and utilization of natural resources, religious sentiments are forged and strengthened, artistic endeavors are inspired, and a sense of identity and place is cultivated. Indeed, fundamental conceptions of well-being, as individuals, families, and communities encompass social, ecological, and economic facets and all are intimately tied to the health of subbasin natural resources.