washington pink shrimp fishery shrimp trawl …wdfw.wa.gov/publications/01884/wdfw01884.pdf · mike...
TRANSCRIPT

STATE OF WASHINGTON December 2016
Washington Pink Shrimp Fishery Shrimp Trawl Operations and Bycatch of Eulachon Smelt, Rockfish, and Flatfish
Washington Department ofFISH AND WILDLIFEFish ProgramFish Management Division
by Lorna Wargo, Kristen E. Ryding, Brad W. Speidel, and Kristen E. Hinton
FPA 16-13


Washington Pink Shrimp Fishery
Shrimp Trawl Operations and Bycatch of Eulachon Smelt, Rockfish, and Flatfish
Technical Report No. FPT 16-13
Lorna L. Wargo, Kristen E. Ryding Brad W. Speidel, Kristen E. Hinton
Washington Department of Fish and Wildlife Fish Program
Marine Resources Division 600 Capitol Way N.
Olympia, Washington 98501-1091
December 2016

Acknowledgements We would like to thank the Washington shrimp fleet for generously cooperating with our research efforts and for safely housing our observers aboard their vessels during the two year observer project. Their willingness to collaborate and share information was appreciated. Mike Allen William Dickey Tom Jones Michael Smith Ed Bittner Benjamine Downs Buddy King Cody Vandercoevering Rich Brown Craig Howse Roger Marshall Gary Vining Jam Copenhaver Bert Johns Jimmy Myers Rocky Walker Paul Daniels Robert Johnstone Tung Nguyen Jerry Wright We would also like to thank our observers whose data collection was vital to this study. Richard Burrows Kristen Hinton James Pace Brad Speidel Mark Flahaut Ross Kary Michael Sinclair Paul Daniels (F/V Swell Rider) and Ben Downs (F/V Pacific Dove) were instrumental in helping us with this study. Their advice and voluntary contributions to experimental excluder and net design were invaluable in the early stages and throughout this study. For assisting in tracking down vessels and for allowing us a portion of the annual shrimper’s industry meeting agenda, the ever helpful Bill Weidman at Washington Crab Producers Inc. deserves our recognition. To Dr. Tien-shui “Theresa” Tsou, we offer our thanks for her wise leadership and thoughtful direction throughout the project. Last, but certainly not least, we would like to extend our thanks to Dr. Robert “Bob” Hannah (ODFW) for guiding us in the early stages of this project, and for always being our “go-to guy” while setting up and carrying out this project.

Abstract The ocean pink shrimp (Pandalus jordani) trawl fishery is a vital component of Washington’s coastal commercial fisheries. Beginning in the late 1950’s the fishery expanded through the 1980’s with landings peaking at 18 million pounds and then contracted in the following decade with annual landings less than five million pounds. Since the late 1990’s, landings have generally increased, and the direct value of the fishery has trended continuously upward while fleet size has continued to decline. During this same period, annual shrimp landings into Washington averaged about 20% of the coastwide total for California, Oregon, and Washington combined. The fishery is state managed, although it is also subject to federal restrictions for groundfish catch and essential fish habitat through the Pacific Fishery Management Council Groundfish Fishery Management Plan (PFMC 2014). Management is accomplished through a state limited entry program with regulations for a fixed seven-month season, shrimp size restrictions, mandatory use of biological reduction devices, and logbooks. In March 2010, the National Marine Fisheries Service listed the southern Distinct Population Segment of Thaleichthyus pacificus, also known as eulachon, as threatened under the Endangered Species Act (75 FR13012). The Eulachon Biological Review Team ranked bycatch second among the severity of threats impacting recovery of eulachon stocks (Gustafson et al. 2010). At that time, bycatch data was lacking for the Washington ocean shrimp trawl fishery which encounters eulachon on the fishing grounds. In this study, we evaluate various factors influencing the catch of eulachon, rockfish, and flatfish species. Observers were deployed aboard Washington shrimp trawl vessels in 2011 and 2012 to collect catch composition data at the tow level. In 2011, 24% of trips were observed. In 2012, following reduced funding, 16% of trips were observed. During these two comparatively strong years for pink shrimp production, with landings at 9.6 and 9.3 million pounds respectively, eulachon bycatch was estimated at 7.8 metric tons (17,100 pounds) for 2011 and 171 metric tons (378,011 pounds) for 2012. The increase in eulachon bycatch occurred at the same time fishery regulations reduced the allowable bar-spacing for fin fish excluders from 2 inches (51 millimeters) to 0.75 inches (19 millimeters) in 2012. Flatfish species bycatch was estimated at 27 metric tons (60,000 pounds) and 54 metric tons (119,000 pounds), and rockfish species bycatch at 3.2 metric tons (7,000 pounds) and 1.8 metric tons (4,700 pounds), in 2011 and 2012, respectively. Bycatch data were analyzed for gear, temporal, and spatial effects. Results indicate a reduction in bycatch volume by excluders with narrower (1 inch and less) bar-spacing in the panel, compared to wider (more than 1 inch) bar-spacing, but not a significant difference among the excluders with sub 1 inch bar spacing. Other effects, including fishing month, depth, latitude, and tow duration were found in some instances to be statistically significant, but not biologically meaningful.

Shrimp Trawl Operations and Bycatch of Eulachon Smelt, Rockfish, and Flatfish 1
Table of Contents
Acknowledgements ......................................................................................................................... 3
Abstract ........................................................................................................................................... 4
Table of Contents ............................................................................................................................ 1
List of Figures ................................................................................................................................. 3
List of Tables .................................................................................................................................. 7
List of Appendixes ........................................................................................................................ 12
Introduction ................................................................................................................................... 14
Report Structure and Study Objectives ..................................................................................... 14
Fishery Description ....................................................................................................................... 16
Methods......................................................................................................................................... 21
Catch and Logbook Data .......................................................................................................... 21
Vessel Selection ........................................................................................................................ 21
Observer Data Collection .......................................................................................................... 22
Trip ........................................................................................................................................ 22
Tow ....................................................................................................................................... 23
Catch Composition................................................................................................................ 23
Biological Data ..................................................................................................................... 23
Data Processing ......................................................................................................................... 24
Error Checking ...................................................................................................................... 24
Bycatch Ratios ...................................................................................................................... 25
Results and Discussion ................................................................................................................. 27
Fishery Catches and Effort ........................................................................................................ 27
Observer coverage levels .......................................................................................................... 28
Bycatch Evaluation ................................................................................................................... 28
Estimate of Eulachon catch and spatial distribution ............................................................. 28
Linear Mixed Effects Modelling: Analysis of Factors Effecting Bycatch of Eulachon, Rockfish, and Flatfish ........................................................................................................... 29
Biological sampling .................................................................................................................. 50
Eulachon ............................................................................................................................... 50
Rockfish ................................................................................................................................ 51
Flatfish .................................................................................................................................. 52
Conclusion .................................................................................................................................... 54

Shrimp Trawl Operations and Bycatch of Eulachon Smelt, Rockfish, and Flatfish 2
Figures........................................................................................................................................... 56
Fishery Description ................................................................................................................... 56
Methods..................................................................................................................................... 60
Results and Discussion ............................................................................................................. 61
Linear Mixed Effects Modelling: Analysis of Factors Effecting Bycatch of Eulachon, Rockfish and Flatfish ............................................................................................................ 65
Tables .......................................................................................................................................... 103
Methods................................................................................................................................... 103
Results and Discussion ........................................................................................................... 106
Literature Cited ........................................................................................................................... 138
Appendix 1: Coastal Commercial Pink Shrimp Fishery Regulations and Fishery Permits ........ 141
Appendix 2: WDFW Pink Shrimp Trawl Logbook .................................................................... 147
Appendix 3: Observer Data Collection Sheets ........................................................................... 148

Shrimp Trawl Operations and Bycatch of Eulachon Smelt, Rockfish, and Flatfish 3
List of Figures Figure 1. Washington pink shrimp landings in millions of pounds, 1970-2013. .......................... 56 Figure 2. Number of active vessels, 1970-2013. .......................................................................... 57 Figure 3. Direct fishery value in millions of dollars, 1970-2013. ................................................. 57 Figure 4. Stylized schematic of a pink shrimp trawl net with “ladder” style groundgear. This net
is configured from the front and is not to scale; all measurements are approximations (Hannah 2011). ....................................................................................................................... 58
Figure 5. Stylized schematic of a pink shrimp trawl net without a ground line, but with a “tickle chain.” This net is configured from the front and is not to scale; all measurements are approximations (Hannah 2011). .............................................................................................. 58
Figure 6. Stylized schematic of fishing net with BRD and escape hole, showing how fish enter net and can escape prior to entering the cod end (Doyle and Hildenbrand 2013). ................. 59
Figure 7. Biological reduction device (BRD) bar spacing. Measurement made from edges of neighboring bars. ..................................................................................................................... 59
Figure 8. Stylized map showing Oregon Dept. of Fish and Wildlife pink shrimp areas versus Washington Dept. of Fish and Wildlife marine fish/shellfish areas. ...................................... 60
Figure 9. Annual pink shrimp landings (pounds) and number of active vessels, 1990 – 2013. ... 61 Figure 10. Annual percent of total Washington landings by combined WDFW Marine Fish
Shellfish Fish Ticket Areas: WA North (58A-59A2), WA South (60A-60A2), and Oregon/California. .................................................................................................................. 61
Figure 11. Monthly Washington pink shrimp landings by ODFW management area in 2011. ... 62 Figure 12. Monthly Washington pink shrimp landings by ODFW management area in 2012. ... 62 Figure 13. Monthly Washington CPUE grouped by ODFW management area in 2011. ............. 63 Figure 14. Monthly Washington CPUE grouped by ODFW management area in 2012. ............. 63 Figure 15. Eulachon CPUE (a) and bycatch ratios (b) across 2011 and 2012. ............................. 64 Figure 16. Density plots of bycatch ratios of eulachon for each of the vessels observed in 2011.
................................................................................................................................................. 65 Figure 17. Density plots of the natural logarithm of bycatch ratios of eulachon for each of the
vessels observed in 2011. ........................................................................................................ 65 Figure 18. Density plots of the natural logarithm of bycatch ratios of eulachon for each of the
vessels observed in 2011. ........................................................................................................ 66 Figure 19. Density plots of the natural logarithm of bycatch ratios of eulachon for each of the
vessels observed in 2012. ........................................................................................................ 66 Figure 20. A dot plot of the difference from the mean overall logarithm of bycatch for each
vessel observed in 2011. ......................................................................................................... 67 Figure 21. Boxplots of the natural logarithm of the bycatch ratio of eulachon for month fished in
2011......................................................................................................................................... 67 Figure 22. Boxplots of the natural logarithm of eulachon bycatch ratios by excluder size used in
the 2011 pink shrimp fishery. ................................................................................................. 68 Figure 23. Interaction plot of the effects of gear (excluder bar-spacing) and month on the natural
logarithm of eulachon bycatch. If no interactions were present, the line would be parallel. . 68 Figure 24. Interaction plot of gear types, 0.75 and 0.875, by month for the natural logarithm of
eulachon bycatch. The increased bycatch in October for the 0.875 bar-spacing is most likely

Shrimp Trawl Operations and Bycatch of Eulachon Smelt, Rockfish, and Flatfish 4
the reason for the significant interaction. No interaction effect is typically indicated by parallel, or nearly parallel lines. .............................................................................................. 69
Figure 25. Differences from mean eulachon bycatch for the 13 vessels with observers that fished in 2012 and were included in this analysis. ............................................................................ 69
Figure 26. Boxplots of the distribution of eulachon bycatch ratios for each month fished in 2012. May had the highest ratios, April and October the lowest. ..................................................... 70
Figure 27. Relationships between depth in fathoms and log (bycatch ratio) for each month in 2011. The difference among months indicates a significant interaction effect. ..................... 70
Figure 28. Relationships between depth in fathoms and log (eulachon bycatch ratio) for each month in 2012. The difference among months indicates a significant interaction effect. ...... 71
Figure 29. Boxplot of the natural logarithm of eulachon bycatch ratios for tows fished north and south of the Columbia River plume. ....................................................................................... 71
Figure 30. Relationships between fishing location as measured by latitude and log (eulachon bycatch ratio) for each month in 2012. The difference in slopes among months indicates a significant interaction effect. .................................................................................................. 72
Figure 31. Relationships between tow time and log (eulachon bycatch ratio) for each month in 2012. The difference in slopes among months indicates a significant interaction effect. ...... 72
Figure 32. Density plots of bycatch ratios of rockfish for each tow by the vessels with observed rockfish catch in the 2011 fishery. .......................................................................................... 73
Figure 33. Density plots of the natural logarithm of bycatch ratios of rockfish for each tow by the vessels with observed rockfish catch in the 2011 fishery. ...................................................... 73
Figure 34. Density plots of bycatch ratios of rockfish for each tow by the vessels with observed rockfish catch in the 2012 fishery. .......................................................................................... 74
Figure 35. Density plots of the natural logarithm of bycatch ratios of rockfish for each tow by the vessels with observed rockfish catch in the 2012 fishery. ...................................................... 74
Figure 36. A dot plot of the difference from the mean overall logarithm of rockfish bycatch for each vessel observed in 2011. ................................................................................................. 75
Figure 37. Boxplots of the natural logarithm of the bycatch ratio of rockfish for month fished in 2011......................................................................................................................................... 75
Figure 38. Boxplots of the natural logarithm of bycatch ratio of rockfish by excluder size used in the 2011 pink shrimp fishery. ................................................................................................. 76
Figure 39. Interaction plot of the effects of gear (excluder bar-spacing) and month on the natural logarithm of rockfish bycatch. If no interactions were present, the line would be parallel. ... 76
Figure 40. Interaction plot of gear type by month. No interaction effect is typically indicated by parallel, or nearly parallel lines. .............................................................................................. 77
Figure 41. Differences from mean rockfish bycatch for the 13 vessels with observers that fished in 2012 and were included in this analysis. ............................................................................ 77
Figure 42. Boxplots of the distribution of bycatch ratios for each month fished in 2012. May had the highest ratios, April and October the lowest. .................................................................... 78
Figure 43. Relationships between depth in fathoms and log (rockfish bycatch ratio) for each month in 2011. The difference among months indicates a significant interaction effect. ...... 78
Figure 44. Relationships between depth in fathoms and log (rockfish bycatch ratio) for each month in 2012. The difference among months indicates a significant interaction effect. ...... 79
Figure 45. Boxplot of the natural logarithm of rockfish bycatch ratios for tows fished north and south of the Columbia River plume. ....................................................................................... 79

Shrimp Trawl Operations and Bycatch of Eulachon Smelt, Rockfish, and Flatfish 5
Figure 46. Relationships between fishing location as measured by latitude and log (bycatch ratio) for each month in 2012. The difference in slopes among months indicates a significant interaction effect. .................................................................................................................... 80
Figure 47. Relationships between tow time and log (rockfish bycatch ratio) for each month in 2011. Slopes were consistent across all months but October, indicating a non-significant interaction between month and tow time. ............................................................................... 80
Figure 48. Relationships between tow time and log (rockfish bycatch ratio) for each month in 2012. The difference in slopes among months indicates a significant interaction effect. ...... 81
Figure 49. Density plots of bycatch ratios of flatfish for each tow by the vessels with observed flatfish catch in the 2011 fishery. ............................................................................................ 81
Figure 50. Density plots of the natural logarithm of bycatch ratios of flatfish for each tow by the vessels with observed flatfish catch in the 2011 fishery. ........................................................ 82
Figure 51. Density plots of bycatch ratios of flatfish for each tow by the vessels with observed flatfish catch in the 2012 fishery. ............................................................................................ 82
Figure 52. Density plots of bycatch ratios of flatfish for each tow by the vessels with observed flatfish catch in the 2012 fishery. ............................................................................................ 83
Figure 53. A dot plot of the difference from the mean overall logarithm of flatfish bycatch for each vessel observed in 2011. ................................................................................................. 83
Figure 54. Boxplots of the natural logarithm of the bycatch ratio of flatfish for month fished in 2011......................................................................................................................................... 84
Figure 55. Boxplots of the natural logarithm of bycatch ratio of flatfish by excluder size used in the 2011 pink shrimp fishery. ................................................................................................. 84
Figure 56. Interaction plot of the effects of gear (excluder bar-spacing) and month on the natural logarithm of flatfish bycatch. If no interactions were present, the lines would be parallel. ... 85
Figure 57. Interaction plot of gear type by month. No interaction effect is typically indicated by parallel, or nearly parallel lines. .............................................................................................. 85
Figure 58. Differences from mean flatfish bycatch for the 13 vessels with observers that fished in 2012 and were included in this analysis. ................................................................................ 86
Figure 59. Boxplots of the distribution of flatfish bycatch ratios for each month fished in 2012. May had the highest ratios, April and October the lowest. ..................................................... 86
Figure 60. Relationships between depth in fathoms and log (flatfish bycatch ratio) for each month in 2011. The difference among months indicates a significant interaction effect. ...... 87
Figure 61. Relationships between depth in fathoms and log (flatfish bycatch ratio) for each month in 2012. The difference among months indicates a significant interaction effect. ...... 87
Figure 62. Boxplot of the natural logarithm of bycatch ratios for tows fished north and south of the Columbia River plume. ..................................................................................................... 88
Figure 63. Relationships between fishing location as measured by latitude and log of flatfish bycatch ratios for each month in 2011. The difference in slopes among months indicates a significant interaction effect. .................................................................................................. 88
Figure 64. Relationships between fishing location as measured by latitude and log (flatfish bycatch ratio) for each month in 2012. The difference in slopes among months indicates a significant interaction effect. .................................................................................................. 89
Figure 65. Relationships between tow time and log (flatfish bycatch ratio) for each month in 2011. The difference in slopes among months indicates a significant interaction effect. ...... 89
Figure 66. Relationships between tow time and log (bycatch ratio) for each month in 2012. The difference in slopes among months indicates a significant interaction effect ........................ 90

Shrimp Trawl Operations and Bycatch of Eulachon Smelt, Rockfish, and Flatfish 6
Figure 67. Eulachon total length to fork length (n = 2950), derived from study data, applied when only total length was recorded. ............................................................................................... 90
Figure 68. Eulachon length frequency for 2011 with fork length pooled in two millimeter increments. .............................................................................................................................. 91
Figure 69. Eulachon length frequency for 2011 with fork length pooled in two millimeter increments. .............................................................................................................................. 91
Figure 70. Eulachon length frequency for April, fork length, mm. .............................................. 92 Figure 71. Eulachon length frequency for May, fork length, mm. ............................................... 92 Figure 72. Eulachon length frequency for June, fork length, mm. ............................................... 93 Figure 73. Eulachon length frequency for July fork length, mm. ................................................. 93 Figure 74. Eulachon length frequency for August, fork length, mm. ........................................... 94 Figure 75. Eulachon length frequency for September, fork length, mm. ..................................... 94 Figure 76. Eulachon length frequency for October, fork length, mm. .......................................... 95 Figure 77. Eulachon median length frequency by month in 2011. ............................................... 95 Figure 78. Eulachon median length frequency by month in 2012. ............................................... 96 Figure 79. Eulachon length frequency for April-May, 2011, in standard length (mm), presented
for comparison with DFO findings (DFO 2014). ................................................................... 96 Figure 80. Eulachon length frequency for April-May 2012, in standard length (mm), presented
for comparison with DFO findings (DFO 2014). ................................................................... 97 Figure 81. Mean length frequencies pooled by ODFW management area for 2011. ................... 98 Figure 82. Mean length frequencies pooled by ODFW management area for 2012. ................... 98 Figure 83. Eulachon lengths by tow depth, in fathoms, in 2011. ................................................. 99 Figure 84. Eulachon lengths by tow depth, in fathoms, in 2012. ................................................. 99 Figure 85. Eulachon median length frequency by year. ............................................................. 100 Figure 86. Eulachon median length by BRD bar-spacing with 0.75 in. for both 2011 and 2012.
............................................................................................................................................... 100 Figure 87. Eulachon median length by BRD spacing with 1.25 in. in 2011 and 0.75 in. in 2012.
............................................................................................................................................... 100 Figure 88. Arrowtooth flounder fork length (mm) frequency, 2011. ......................................... 101 Figure 89. Dover sole fork length (mm) frequency, 2011. ......................................................... 101 Figure 90. Flathead sole fork length (mm) frequency, 2011. ..................................................... 101 Figure 91. Rex sole fork length (mm) frequency, 2011. ............................................................. 102 Figure 92. Slender sole fork length (mm) frequency, 2011. ....................................................... 102

Shrimp Trawl Operations and Bycatch of Eulachon Smelt, Rockfish, and Flatfish 7
List of Tables Table 1. Crosswalk table of ODFW catch areas and WDFW marine fish-shellfish fish ticket
catch area codes. ................................................................................................................... 103 Table 2. Species encountered as bycatch and recorded by observers in 2011 and 2012. ........... 103 Table 3. The number of observed tows for each vessel/month combination in the 2011
Washington pink shrimp fishery. .......................................................................................... 106 Table 4. The number of observed tows for each of the five gear types (excluder size) by vessel in
the 2011 Washington pink shrimp fishery. Excluder size refers to the spacing between panel bars. ....................................................................................................................................... 107
Table 5. The number of observed tows by month and gear type (excluder size) in the 2011 Washington pink shrimp fishery. Excluder size refers to the spacing between panel bars. . 108
Table 6. The number of observations south and north of the Columbia River plume by month in 2011....................................................................................................................................... 109
Table 7. The number of observed tows for each vessel/gear type combination in the 2012 Washington pink shrimp fishery. .......................................................................................... 110
Table 8. The distribution of tows by month and vessel for the 2012 pink shrimp fishery. All tows in this table were made with the 0.75 in. bar-spacing. .......................................................... 111
Table 9. The number of observations used in the analysis that were south and north of the Columbia River plume by month in 2012............................................................................. 112
Table 10. The number of observed tows with eulachon for each vessel/month combination in the 2011 Washington pink shrimp fishery. ................................................................................. 113
Table 11. The number of observed tows with eulachon for each of the 5 gear types (excluder size) by vessel in the 2011 Washington pink shrimp fishery. Excluder size refers to the spacing between panel bars. .................................................................................................. 113
Table 12. Estimates of the contribution of Vessel to the overall variance of the logarithm of eulachon bycatch ratios for 2011. ......................................................................................... 114
Table 13. Results of the analysis that removed month first, Eq. 1 (: ) from the above model using observations from June,
July, and August, and gear types 0.75 in., 0.875 in., 1.25 in., and 1.5 in. ............................ 114 Table 14. Results of the analysis that removed gear type first from the model, (Eq. 3:
: ) using observations from June, July, and August, and gear types 0.75 in., 0.875 in., 1.25 in., and 1.5 in. ................... 114
Table 15. ANOVA results table for the analysis of the August tow data, Eq. 4 (.) .......................................................................................................... 114
Table 16. Results of the pairwise comparison analysis for different gear types in August 2011. The 0.875 in. gear type was significantly lower than the 0.75 in., 1.25 in., and 1.5 in. bar-spacing. ................................................................................................................................. 115
Table 17. Results of the analysis that compared the effects 0.875 in. and 0.75 in. bar-spacing across all months both gears were fished. Month was removed first in this analysis. .......... 115
Table 18. Results of the analysis that compared the effects 0.875 in. and 0.75 in. bar-spacing across all months both gears were fished. Gear was removed first in this analysis. ............ 115
Table 19. Results of the analysis testing the effect of month on eulachon bycatch for tows using the 0.875 in. gear only........................................................................................................... 116

Shrimp Trawl Operations and Bycatch of Eulachon Smelt, Rockfish, and Flatfish 8
Table 20. Results of the pairwise comparisons of mean eulachon bycatch ratio by for the months fished with the 0.875 in gear. April is significantly higher than all months except October................................................................................................................................................ 116
Table 21. Estimates of the contribution of Vessel to the overall variance of the logarithm of eulachon bycatch ratios for 2012. ......................................................................................... 116
Table 22. Results of the analysis testing the effect of month for 2012. ...................................... 117 Table 23. Results of the pairwise comparisons from the Tukey HSD test for months fished in
2012. May was consistently higher than all months but June............................................... 117 Table 24. Results of the analysis testing the effect of depth with month for eulachon for 2011.
Only the 0.875 in. gear types and associated months were used for the analysis. ................ 118 Table 25. The effect of changes in one fathom of fishing depth on the amount of eulachon
bycatch, in pounds, for each month fished in 2011 (Eq. 6:% 1 ∙ 100 ). ................................................... 118
Table 26. Analysis of deviance table for the analysis of the effects of month and depth on log(bycatch) for 2012. ........................................................................................................... 118
Table 27. The effect of changes in one fathom of fishing depth on the amount of eulachon bycatch, in pounds, for each month fished in 2012 (Eq. 6: % 1 ∙ 100). .................................................... 119
Table 28. The number of tows by month south and north of the Columbia River plume in 2011................................................................................................................................................ 119
Table 29. The number of tows for each gear type south and north of the Columbia River plume in 2011. ................................................................................................................................. 119
Table 30. Analysis of deviance table for the analysis of the effects of month and latitude on log(bycatch) in 2011 for tows fished north of the Columbia River. ..................................... 120
Table 31. Analysis of deviance table for the analysis of the effects of month and latitude on log(bycatch) in 2012. All fishing occurred north of the Columbia River. ............................ 120
Table 32. The effect an 0.5 degree increase in latitude of fishing on the amount of eulachon bycatch, in pounds, for each month fished in 2012 (Eq. 7: % 0.5 ∙ 100). ................................... 120
Table 33. Analysis of deviance table for the analysis of the effects of month and tow time on log(bycatch) in 2011. ............................................................................................................ 121
Table 34. Analysis of deviance table for the analysis of the effects of month and tow time on log(bycatch) in 2012. ............................................................................................................ 121
Table 35. The effect a 30 minute increase in time per tow on the amount of eulachon bycatch, in pounds, per 10,000 pounds of shrimp for each month fished in 2012 .................................. 121
Table 36. Estimates of the contribution of Vessel to the overall variance of the logarithm of bycatch ratios for 2011. ......................................................................................................... 122
Table 37. Results of the analysis that removed month first from the above model using observations from June, July, and August, gear types 0.75 in., 0.875 in., 1.25 in., and 1.5 in. (Model 1 Eq. 1: : ). ....... 122
Table 38. Results of the analysis that removed gear type first from the model (Model 1 Eq. 3: : ) using observations from June, July, and August, gear types 0.75 in., 0.875 in., 1.25 in., and 1.5 in. .......................... 122
Table 39. ANOVA results table for the analysis of the August tow data (Eq. 4:.). ........................................................................................................ 123

Shrimp Trawl Operations and Bycatch of Eulachon Smelt, Rockfish, and Flatfish 9
Table 40. Results of the pairwise comparison analysis for different gear types in August 2011. The 0.875 in. gear type was significantly lower than the 0.75 in. and 1.25 in. There was no difference between the 0.875 in. and 1 in. and 1.5 in. bar-spacing. ...................................... 123
Table 41. Results of the analysis that compared the effects 0.875 in. and 0.75 in. bar-spacing across all months both gears were fished. Month was removed first in this analysis. .......... 123
Table 42. Results of the analysis that compared the effects 0.875 in. and 0.75 in. bar-spacing across all months both gears were fished. Gear was removed first in this analysis. ............ 124
Table 43. Results of the analysis testing the effect of month for tows using the 0.875 in. gear only. ...................................................................................................................................... 124
Table 44. Results of the pairwise comparisons of mean rockfish bycatch ratio by for the months fished with the 0.875 in. gear. April is significantly lower than May, June, and October. .. 124
Table 45. Estimates of the contribution of Vessel to the overall variance of the logarithm of rockfish bycatch ratios for 2012. .......................................................................................... 125
Table 46. Results of the analysis testing the effect of month for 2012. ...................................... 125 Table 47. Results of the pairwise comparisons from the Tukey’s HSD test for months fished in
2012. There was no difference in the ratio of rockfish bycatch across the months fished. .. 125 Table 48. Results of the analysis testing the effect of depth with month for 2011. Only the 0.875
in. gear types and associated months were used for the analysis. ......................................... 126 Table 49. The effect of changes in one fathom of fishing depth on the amount of rockfish
bycatch, in pounds, for each month fished in 2011 (Eq. 6:% 1 ∙ 100 ). ................................................... 126
Table 50. Analysis of deviance table for the analysis of the effects of month and depth on log(bycatch) for 2012. ........................................................................................................... 126
Table 51. The effect of changes in one fathom of fishing depth on the amount of rockfish bycatch, in percent change, for each month fished in 2012 .................................................. 127
Table 52. The number of tows with rockfish by month south and north of the Columbia River plume in 2011. ...................................................................................................................... 127
Table 53. The number of tows with rockfish for each gear type south and north of the Columbia River plume in 2011.............................................................................................................. 127
Table 54. Analysis of deviance table for the analysis of the effects of month and latitude on log(bycatch) in 2011 for tows fished north of the Columbia River. ..................................... 128
Table 55. Analysis of deviance table for the analysis of the effects of month and latitude on log(bycatch) in 2012. All fishing occurred north of the Columbia River. ............................ 128
Table 56. The effect an 0.5 degree increase in latitude of fishing on the amount of rockfish bycatch, in pounds, for each month fished in 2012 (Eq. 7: % 0.5 ∙ 100). ................................... 128
Table 57. Analysis of deviance table for the analysis of the effects of month and tow time on log(bycatch) in 2011. ............................................................................................................ 129
Table 58. Analysis of deviance table for the analysis of the effects of month and tow time on log(bycatch) in 2012. ............................................................................................................ 129
Table 59. The number of tows, estimated coefficients, p-values for slope estimates, and the percent change in rockfish bycatch ratios for an increase of 30 minutes of tow time for 2012 fishery (Eq. 8: % 30 ∙ 100).................................. 129

Shrimp Trawl Operations and Bycatch of Eulachon Smelt, Rockfish, and Flatfish 10
Table 60. Estimates of the contribution of Vessel to the overall variance of the logarithm of flatfish bycatch ratios for 2011. ............................................................................................ 130
Table 61. Results of the analysis that removed month first from the model (Model 1 Eq. 1: : ) using observations from
June, July, and August, gear types 0.75 in., 0.875 in., 1.25 in., and 1.5 in. .......................... 130 Table 62. Results of the analysis that removed gear type first from the model (Model 1 Eq.
3; : ) using observations from June, July, and August, gear types 0.75 in., 0.875 in., 1.25 in., and 1.5 in. .......................... 130
Table 63. ANOVA results table for the analysis of the August tow data (Eq. 4:). .......................................................................................................... 130
Table 64. Results of the pairwise comparison analysis for different gear types in August 2011. The 0.875 in. gear type was significantly lower than the 0.75 in., 1.25 in., and 1.5 in. bar-spacing. ................................................................................................................................. 131
Table 65. Results of the analysis that compared the effects 0.875 in. and 0.75 in. bar-spacing across all months both gears were fished. Month was removed first in this analysis. .......... 131
Table 66. Results of the analysis that compared the effects 0.875 in. and 0.75 in. bar-spacing across all months both gears were fished. Gear was removed first in this analysis. ............ 131
Table 67. Results of the analysis testing the effect of month for tows using the 0.875 in. gear only. ...................................................................................................................................... 131
Table 68. Results of the pairwise comparisons of mean flatfish bycatch ratio by for the months fished with the 0.875 in. gear. ............................................................................................... 132
Table 69. Estimates of the contribution of Vessel to the overall variance of the logarithm of flatfish bycatch ratios for 2012. ............................................................................................ 132
Table 70. Results of the analysis testing the effect of month for 2012. ...................................... 132 Table 71. Results of the pairwise comparisons from the Tukey’s HSD test for months fished in
2012. May was consistently higher than all months but June............................................... 133 Table 72. Results of the analysis testing the effect of depth with month for 2011. Only the 0.875
in. gear and associated months were used for the analysis. .................................................. 133 Table 73. Analysis of deviance table for the analysis of the effects of month and depth on
log(flatfish bycatch) for 2012. .............................................................................................. 134 Table 74. The effect of changes in one fathom of fishing depth on the change of percent of
flatfish bycatch for each month fished in 2012 (Eq. 6: % 1∙ 100). ............................................................. 134
Table 75. The number of tows with flatfish south and north of the Columbia River plume in 2011....................................................................................................................................... 134
Table 76. The number of tows for each type and location with regard to the Columbia River plume in 2011. ...................................................................................................................... 135
Table 77. Analysis of deviance table for the analysis of the effects of month and latitude on log(flatfish bycatch) in 2011 for tows fished north of the Columbia River. ......................... 135
Table 78. The effect an 0.5 degree increase in latitude of fishing on the amount of flatfish bycatch, in pounds, for each month fished in 2011 (Eq. 7: % 0.5 ∙ 100.). .................................. 135
Table 79. Analysis of deviance for the analysis of the effects of month and latitude on log(flatfish bycatch) in 2012. All fishing occurred north of the Columbia River. ............... 136

Shrimp Trawl Operations and Bycatch of Eulachon Smelt, Rockfish, and Flatfish 11
Table 80. The effect of a 0.5 degree increase in latitude of fishing on the amount of flatfish bycatch, in pounds, for each month fished in 2012 (Eq. 7: % 0.5 ∙ 100.). .................................. 136
Table 81. Analysis of deviance table for the analysis of the effects of month and tow time on log(flatfish bycatch) in 2011. ................................................................................................ 136
Table 82. Analysis of deviance for the analysis of the effects of month and tow time on log(flatfish bycatch) in 2012. ................................................................................................ 137
Table 83. The effect a 30 minute increase in tow time on the amount of flatfish bycatch, in percent difference of shrimp per tow for each month fished in 2012 ................................... 137

Shrimp Trawl Operations and Bycatch of Eulachon Smelt, Rockfish, and Flatfish 12
List of Appendixes Appendix 1: Coastal Commercial Pink Shrimp Fishery Regulations and Fishery Permits ........ 141
Appendix 2: WDFW Pink Shrimp Trawl Logbook .................................................................... 147
Appendix 3: Observer Data Collection Sheets ........................................................................... 148

Shrimp Trawl Operations and Bycatch of Eulachon Smelt, Rockfish, and Flatfish 13
Eulachon (Thaleichthyus pacificus)

Shrimp Trawl Operations and Bycatch of Eulachon Smelt, Rockfish, and Flatfish 14
Introduction In this report, we provide an overview of the Washington pink shrimp fishery from its earliest years through 2013 and present the results of a two year observer project intended to evaluate bycatch in the fishery. The objective of the observer project was to estimate bycatch, particularly of eulachon (Thaleichthyus pacificus), and to identify any temporal or spatial patterns of eulachon distribution in the fishery which might inform management strategies to reduce encounters, and finally, to collect biological data from eulachon during the marine life history phase. The focus on eulachon encounters in the shrimp trawl fishery follows the March 2010 listing by the National Marine Fisheries Service (NMFS) of the southern Distinct Population Segment (DPS) of Thaleichthyus pacificus as threatened under the Endangered Species Act (75 FR13012). The southern DPS range includes and extends from the Mad River in California to the Skeena River in British Columbia. In the listing, the Pacific Northwest trawl fisheries for ocean pink shrimp (Pandalus jordani) were deemed a moderate threat to eulachon recovery; the Eulachon Biological Review Team (BRT) ranked bycatch second among the severity of threats impacting recovery of eulachon stocks (Gustafson et al. 2010). At that time, data on bycatch rates were lacking for the Washington shrimp trawl fishery. To close this data gap, the Washington Department of Fish and Wildlife (WDFW) undertook two actions: 1) implemented regulations effective in 2010 (Appendix 1) requiring Washington licensed shrimp trawl fishers to participate in the West Coast Groundfish Observer Program (WCGOP); and 2) through National Oceanic and Atmospheric Administration (NOAA) Fisheries Protected Species Conservation and Recovery (Section 6 of the ESA) funding, implemented a state-based observer project to assess pink shrimp trawl fishery impacts on eulachon, as well as enumerate bycatch data for other species or species categories (Mallette 2014).
Report Structure and Study Objectives Following a brief description of the Washington ocean pink shrimp fishery, the remainder of this report presents the work and findings from the 2011-2012 WDFW observer project. The goal for the study was to evaluate various factors influencing the catch of eulachon; these factors were also evaluated for two other species categories: flatfish and rockfish. This was accomplished by placing observers aboard shrimp trawl vessels to collect catch composition data at the tow level. Ultimately, this information will be used to inform management strategies to reduce eulachon bycatch in the pink shrimp trawl fishery.

Shrimp Trawl Operations and Bycatch of Eulachon Smelt, Rockfish, and Flatfish 15
Under Methods, we describe fishery catch data sources and compilation, skipper logbook data, the observer project including vessel selection, observer deployment and observer sampling protocols, and bycatch ratio calculation. Results and discussion are combined and cover fishery and observer performance, bycatch estimates, bycatch evaluation modeling, and eulachon biological data. Key findings are summarized at the end.

Shrimp Trawl Operations and Bycatch of Eulachon Smelt, Rockfish, and Flatfish 16
Fishery Description Dating from the late 1950’s, the ocean pink shrimp trawl fishery is a vital component of Washington’s coastal economy. Beginning off Grays Harbor in 1956, the installation of mechanical peelers and growing consumer demand for “cocktail” shrimp spurred fishery development. Catches in 1958 exceeded 6.5 million pounds (Alverson et al. 1960). Through the 1960’s, landings did not exceed two million pounds; during the following two decades, the fishery expanded with abundant shrimp and good markets (Figure 1). In 1990, nearly 100 vessels landed about 15 million pounds. However, subsequent dramatic declines in local abundance drove many fishers out of the fishery; by 1994 the active fleet totaled just over 50 vessels with fewer than 30 several years later (Figure 2). Since the late 1990’s, fleet size has continued to decline, whereas landings have generally increased and the direct value1 of the fishery has trended continuously upward (Figure 3). During this latter period, annual shrimp landings into Washington averaged about 20 percent (%) of the coastwide total for California, Oregon, and Washington combined. The US west coast ocean pink shrimp fishery is state managed (Appendix 1) and subject to federal restrictions for groundfish catch and essential fish habitat (EFH) through the Pacific Fishery Management Council (PFMC) Groundfish Fishery Management Plan (PFMC 2014). Along the Washington coast, the pink shrimp fishery operates only in federal waters (3-200 miles); most commercial gears, including trawl, are prohibited inside Washington state waters (0-3 miles). A 1994 limited entry (LE) license program established 143 licenses. As of 2013, the number of LE licenses stood at 83. Licenses must be renewed annually, but do not need to be fished actively to remain valid; the decline is attributed to LE license owners electing not to renew. The regulatory history of the coastal pink shrimp fishery is marked by few changes. In 1982, the states of Washington, Oregon, and California established a common season and a maximum count per pound regulation to minimize regulatory conflicts. Washington rules for minimum codend mesh size were rescinded in 1994. Following the overfished designation of canary rockfish (Sebastes pinniger) by the PFMC in 1999 (Wallace 2011) and a two-year implementation program, the mandatory use of biological reduction devices (BRDs), also known as fin fish excluders, was set in permanent rule, effective 2003. Typically, rockfish and other species had represented about 5% of the total direct value of the shrimp fishery.
1 Direct fishery value, also known as ex-vessel value, represents total payment to fishermen.

Shrimp Trawl Operations and Bycatch of Eulachon Smelt, Rockfish, and Flatfish 17
Shrimp boat with nets at the surface. Also pictured are the nets’ mouth-spreading doors suspended from the vessel’s outriggers.

Shrimp Trawl Operations and Bycatch of Eulachon Smelt, Rockfish, and Flatfish 18
For the purposes of this study and report, data attributed or references to “fleet” mean only Washington licensed vessels that landed catch at Washington ports. State pink shrimp trawl fishery licenses issued by Washington, Oregon, and California regulate where a vessel may land catch; licensed fishers/vessels may fish in federal waters offshore Washington, Oregon, or California. Landing receipts (fish tickets) and logbook data document that Washington licensed vessels deliver shrimp caught frequently offshore Washington and Oregon, and occasionally California to Washington ports. Active fleet size is not static and can fluctuate within and between seasons as dual licensed vessels move between states/ports. From 2000 through 2013, the total active Washington fleet size did not exceeded 30 vessels. Washington coastal shrimp fishing activity is split between two ports: Westport and Ilwaco, with processors located at each.
The fishing season is fixed in permanent regulation, opening and closing on April 1 and October 31, respectively (Appendix 1). Fishing occurs during daylight hours reflecting the behavior of ocean pink shrimp which exhibit a vertical diurnal migration, moving to the bottom during daylight hours and ascending to feed at night. The typical commercial trip ranges from 3 to 6 days including transit to and from the fishing grounds. Shorter trips can occur when fishing is especially productive. Fishing occurs over muddy bottom within the continental shelf. The fleet includes vessels that tow one or two independent nets, which are referred to as single or double-rigged, respectively. Towing duration is typically 0.5 to 2 hours at speeds of 1.5 to 2 knots. On double rigged vessels, the nets are deployed and retrieved simultaneously. Catch typically is dumped into a container or “hopper” on deck. Bycatch species are manually removed by crew as pink shrimp are run across a sorting belt and then loaded and iced in the vessel hold. Through 2013, all shrimp were landed iced; no Washington licensed vessel froze catch at sea. The majority of active vessels in the Washington fleet are double-rigged with semi-pelagic, fine-meshed shrimp trawl nets. These vessels tow their nets from the end of their out-riggers (a long boom guyed out perpendicular to the centerline of the vessel) which handle each net independently. Each net has its own mouth-spreading doors and is operated by its own winch to maintain an even balance while towing. Fishers utilize various groundgear (the portion of rigging attached to the bottom of the net) on their nets to maximize shrimp catch. Typically, one of two types of groundgear is used: a ladder style or tickler chain type (Figure 4 and Figure 5). The ladder style ground gear is built of either chain, cable, or a mix of both, rigged in the shape of a ladder and attached to the bottom line of the net known as the fishing line (Figure 4 and Figure 5). When a net is equipped with a “tickler chain” the fishing line is usually weighted with rigging (chain) and preceded by a length of chain attached to the door-connecting lines which span the width of the net. The tickler chain skims the seafloor ahead of the opening as the nets are towed.

Shrimp Trawl Operations and Bycatch of Eulachon Smelt, Rockfish, and Flatfish 19
The use of excluders has been adopted formally and informally in the fishery over the last fifteen years. From 2003 to the outset of this study in 2011, Washington regulations permitted rigid bar excluders or soft-panel excluders constructed of netting. For rigid bar excluders, maximum bar-spacing (Figure 7) could not exceed 2 inches (in.) or 51 millimeters (mm) and soft-panel net meshes could not exceed 5.5 in. or 140 mm. Yet by 2011, within the Washington fleet, none of the rigid-panel excluders in use had bar-spacing in excess of 1.5 in. (38 mm) and only one vessel was outfitted with a soft-panel excluder. The use of excluders with maximum 2 in. (51 mm) bar-spacing became a permanent requirement in 2003 as a means to reduce the bycatch of rockfish species, mainly canary rockfish. As a result, most adult finfish and other bycatch avoid capture in the codend, greatly reducing the time and effort associated with bycatch sorting on deck (Hannah et al. 2011). Spurred by the convenience of sorting less bycatch, many fishers began installing excluders with narrower bar-spacing, effectively staying ahead of regulatory requirements. Based on this and findings by Hannah (2007) that 0.75 in. (19 mm) bar-spacing could maintain shrimp production while reducing bycatch, Washington rules were amended in 2012 to allow only rigid-panel style excluders and to reduce legal bar-spacing to a maximum of 0.75 in. However, a limited number of special gear permits (Appendix 1) were issued that allowed an excluder in one net to exceed 0.75 in. for a specified duration of time. Fishers requested this accommodation to allow testing of net configurations with the 0.75 in. excluder against a control – a previously used excluder bar-spacing – to compare catch rates and make modifications to their 0.75 in. excluder configuration to maximize shrimp catch. Figure 6 depicts a trawl net and excluder configuration typical to the Washington fleet. The excluder panel is set at an angle, with the angle from vertical varying by vessel. As catch moves down the net, the excluder presents a barrier to fish which can then either escape through a hole positioned forward of and generally atop the excluder or pass through the excluder; usually shrimp and smaller fish, unable to escape, pass through the bars and into the codend of the net. Washington regulations stipulate a minimum escape hole of 100 square in. (0.065 m2), however, a number of vessels have enlarged the opening; the largest opening is almost 20 square feet (1.9 m2).

Shrimp Trawl Operations and Bycatch of Eulachon Smelt, Rockfish, and Flatfish 20
Excluder Panel shown through the escape hole on top of this net.

Shrimp Trawl Operations and Bycatch of Eulachon Smelt, Rockfish, and Flatfish 21
Methods
Catch and Logbook Data Fishery catch data were retrieved from the WDFW LiFT (Licensing and Fish Ticket) database. To facilitate comparison of fishery catch statistics between Washington and Oregon, catch areas described by the Oregon Department of Fish and Wildlife (ODFW) were utilized for this report. Table 1 and Figure 8 provide a crosswalk between ODFW and WDFW marine fish-shellfish fish ticket catch area codes. Estimates of catch, hours fished, and location were documented for each trip at the tow level and obtained from skipper logbooks (Appendix 2). For all analyses, skipper catch estimates were adjusted to the weight documented on fish tickets since the former are approximations and the latter measured values. Catch was assigned to areas using skipper tow location data. Catch per unit effort (CPUE) was computed from the tow durations and adjusted skipper estimates. Effort was computed as single-rig equivalents (SRE): a single-rig equivalent hour equals 1.6 times a double-rig hour. In instances when a logbook was not received, the catch documented on the WDFW fish ticket from that trip was assigned by month, proportionally to the corresponding ODFW catch area. Estimates of total bycatch and hours fished were expanded to the fleet level from logbook data.
Vessel Selection Random vessel selection was intended by design; in practice, selection was more opportunistic. Vessels were selected across ports for observation on a trip by trip basis depending on observer availability. Selection was not stratified by port because the fleet was predominantly based at one port and it maximized the utilization of observers if vessels at one port were not fishing. Because this study ran concurrently with the WCGOP, vessels were excluded from the trip by trip selection process for state coverage while carrying a federal observer. Once federal coverage concluded, these vessels were then included for state observer coverage. WCGOP observers typically observed the shrimp trawl vessels for a one month duration. The WDFW observation period was the length of one trip, typically two to four days. Vessels were also not included under certain other circumstances. Waivers were given to vessels that would have normally been part of the selection process if a vessel was deemed by the observer coordinator to be unsafe for WDFW personnel. In a few instances, vessels were

Shrimp Trawl Operations and Bycatch of Eulachon Smelt, Rockfish, and Flatfish 22
carrying extra crew and sufficient living quarters were not available for observers; these vessels were also not included in the selection process during those times. If a normally selected vessel was not available for observation, e.g., due to a mechanical breakdown, the observer was transferred to the next available vessel. On rare occasions, observers were deployed aboard a vessel departing from Warrenton, Oregon when the skipper indicated the vessel intended to land in Washington. To ensure new vessels entering the fishery were identified and considered in the selection process, ports and incoming fish tickets were monitored by observers and the observer coordinator. During the study, fishers intending to fish for and land pink shrimp at Washington ports were required to give advance notice (usually 24 hours) of departure to the observer coordinator as a condition of the fishing permit. Close contact was maintained between the observer coordinator and fishers participating in the pink shrimp fishery to maximize observer coverage.
Observer Data Collection Data collection methods followed protocols outlined in the NMFS WCGOP sampling manual (NWFSC 2006). Where necessary, methods were adapted or simplified for this study. Compared to groundfish trawl fisheries, sampling the pink shrimp fishery is less complicated because subsampling large catches falling over multiple species categories is not necessary. The targeted retained species – pink shrimp – is homogenous and all other catch is discarded at sea. In this fishery, the quantity of bycatch can be small enough that it is practical to sample an entire haul. Data collection was broken into a hierarchal organization: trip level, tow level, catch composition, and biological data (Appendix 3). At the trip level, observers collected general information about the vessel, fishing gear, logistics, and sampling issues. At the tow level, tow location, tow duration, depth, vessel tow speed, and total catch estimate were recorded. For each tow, observers sorted and weighed the bycatch as close to the species level as their ability and time would allow. When time allowed on any given tow, length frequency data was collected for most species. Priority was given to eulachon and tissue samples were gathered from eulachon for genetic analysis.
Trip Observers kept logbooks (Appendix 3) detailing their trip, as well as recording pre-trip and general information about the vessels. Before each trip, scale calibration and vessel safety were checked. The vessel’s fishing gear was documented with an emphasis on the ground gear used. Each vessel in the Washington fleet uses a hopper bin on deck to dump the contents of the

Shrimp Trawl Operations and Bycatch of Eulachon Smelt, Rockfish, and Flatfish 23
codend on each tow. The hopper bin capacity was measured for each vessel to be used during the trip to calculate volumetric estimates of catch on tows where time permitted.
Tow A daily log of tows was kept to collect information regarding the fishing location specifics. New permit requirements included a mandatory skipper logbook to be kept for all coastal pink shrimp fishing activity. These logbooks were referenced by observers throughout each trip to gather information related to their onboard data collection. Skippers would record GPS location and time of day at the beginning and end of each tow, the depth fished, a visual total catch estimate (TCE), and an estimate of bycatch for each tow. This information was transferred daily to observer data (Appendix 3) and was included with the observer’s data packet for each trip.
Catch Composition It was the observer’s goal for each tow to sort and weigh, by species, the entire amount of bycatch. If time did not allow, or the amount of bycatch was too large, a random subsample was collected for composition and the total weight of all bycatch was collected. For many species, bycatch were sorted into groups above species level when time did not allow a full sort, or when species identification was problematic; visual identification of many juvenile rockfish is particularly difficult (Butler et al. 2012). Unknown species were documented and saved for later identification. Table 2 depicts all bycatch species encountered over the two year observation period. When the volume of bycatch precluded complete (whole haul) sampling, tows were subsampled and total bycatch weight was recorded so that bycatch composition could be expanded to the tow level in data processing. All observed vessels sorted bycatch species from pink shrimp catch with deck sorting equipment. Generally, a single conveyor-like sorting belt was used to move shrimp into the hold, allowing deckhands to pick bycatch out as catch moved past them. For tows with very large amounts of bycatch, “smelt belts” were sometimes employed to increase sorting capacity. The smelt belt has a sandpaper-like surface and is set on an incline. Shrimp tumble down these belts onto the main belt, whereas small fish stick to the rough surface and get diverted to a chute and overboard. When employed during observation, catch from the smelt belt was typically of different composition. On these tows, both the smelt belt and the main belt were subsampled simultaneously but separately due to this different mix of species occurring with each.
Biological Data After catch compositions were complete for each tow, observers randomly selected fish for biological sampling. Length data were collected from encountered species, primarily eulachon

Shrimp Trawl Operations and Bycatch of Eulachon Smelt, Rockfish, and Flatfish 24
and flatfish, until 50 fish of that species were measured for a trip. In addition, weight data were collected from the batches of 50 individuals (Appendix 3). Eulachon were prioritized for biological sampling, and for some sampled eulachon, a caudal fin clip was collected and preserved in ethanol. These samples are archived with the WDFW Genetics Unit for future analysis.
Bycatch is sorted after being separated from the shrimp catch.
Data Processing Error Checking All observer data underwent a rigorous quality assurance procedure producing the final data set archived in a Microsoft Access 2010 database. Observers were debriefed weekly, or by trip, to collect and check data, and to address and resolve any sampling issues or data errors. All data were checked prior to keypunching and again after keypunching against the field sheets. Finally,

Shrimp Trawl Operations and Bycatch of Eulachon Smelt, Rockfish, and Flatfish 25
queries were designed to highlight outliers, GIS software (ArcMap 10.1) was used to identify incorrect location information, and data were matched to fish tickets. Incomplete data or data not meeting sampling protocol standards were separated from the dataset if the omission or error could not be resolved. All remaining data that were not a whole haul sample were expanded to the tow level. Skipper logbooks were checked for errors, omissions, and discrepancies; however, changes were made only when the correct information could be determined without subjectivity.
Bycatch Ratios Bycatch ratios (B), the ratio of bycatch (b) to pink shrimp (Pfin) for each tow (T), were the final data product after data processing was complete. Bycatch ratios were calculated for each bycatch species or species group (s),
, , ,⁄ .
Bycatch for some tows was 100% sorted and each bycatch species (or species group) weighed for use in the bycatch ratio calculation. In most cases, the total bycatch for a tow was weighed and a subsample (SS) taken to obtain the species composition (SC; by weight). The species composition is the percent composition of each species in the subsample,
, , ∑⁄ .
The species composition was then applied to the total weight of all bycatch to get the species-specific bycatch weight for each tow,
, , ∗ .
When the bycatch was split using two bycatch sorting belts (main and smelt belt), separate catch compositions were recorded for each belt and bycatch compositions were summed by tow for total bycatch weight by species by tow. For each tow, estimated pink shrimp weight, Pest, was calculated as the difference between the skippers hailed weight (Total Catch Estimate, TCE) minus the sum of bycatch weights across species,
, ∑ .
When the skippers hailed weight for pink shrimp differed from the official weight of pink shrimp on the trip-level Fish Ticket (FT), the estimated pink shrimp weights were expanded using the ratio of total pink shrimp hailed weight to Fish Ticket pink shrimp weight to produce the final pink shrimp, Pfin, weight per tow,
, , ∑ ∑⁄ .

Shrimp Trawl Operations and Bycatch of Eulachon Smelt, Rockfish, and Flatfish 26
Conveyor belt moves shrimp from hopper to vessel hold. Crew positioned to remove bycatch.

Shrimp Trawl Operations and Bycatch of Eulachon Smelt, Rockfish, and Flatfish 27
Results and Discussion In this section, fishery performance, observer coverage rates, and levels of skipper logbook reporting are summarized. Next, we provide fishery level estimates of eulachon catch, CPUE, and spatial distribution. The modeling approach and results used to evaluate the influence of various factors affecting eulachon, rockfish, and flatfish bycatch at the tow level are detailed in the subsection entitled Linear Mixed Effects Modelling: Analysis of Factors Effecting Bycatch of Eulachon, Rockfish, and Flatfish. Finally, biological data collected during the study from eulachon and selected other species are presented.
Fishery Catches and Effort The 2011 and 2012 fishery seasons were comparatively strong for the Washington shrimp trawl fishery (Figure 9). Landings these two years were increased approximately 40% over the average from 2000 through 2010. However, the fleet size was similar to recent years with 15 and 16 active vessels in 2011 and 2012, respectively. The direct value of landed catch was about $4.6 million in 2011 and about $4.4 million in 2012; both years double the long-term average of $2.2 million from 2000 through 2010. Discontinued in the early 1990’s due to funding reductions, the Washington shrimp trawl logbook program was fully reinstated in 2011. Logbooks were returned for 75% of trips in 2011 and 88% of trips for 2012 (Appendix 2). Absent a logbook program prior to 2011, fishery location information could only be derived from catch area reported on fish tickets. Typically, the most productive fishing occurs along the mid-coast of Washington and south to Oregon (Figure 10). Since 2000, catches originating off Oregon have ranged from 8% to 50% of the annual total landed in Washington; in 2011 and 2012 only, Washington landings include catch taken offshore California. With the inception of the logbook program, more specific location information can be derived from skipper data as well as CPUE. Figure 11 and Figure 12 depict monthly landings by ODFW management area for 2011 and 2012. Overall, 2011 catches from Oregon and California represented a smaller percentage of the annual total landed in Washington than in 2012, but had a more southerly distribution, coming from the Mud Hole and areas to the south. In comparison, the majority of catches originating offshore Oregon and/or California in 2012 were from the Mud Hole and areas to the north.

Shrimp Trawl Operations and Bycatch of Eulachon Smelt, Rockfish, and Flatfish 28
Logbook data were used to estimate total hours fished and CPUE for the fishery in 2011 and 2012. Data are not available for comparison from earlier years within the fishery, but similarly to Oregon, catch rates were higher in 2011 than 2012 (Hannah 2013). Overall CPUE was 1,018 pounds/SRE hour in 2011 and 898 pounds/SRE hour in 2012. Monthly CPUE was higher towards the latter part of the season in 2011, while fairly consistent across months in 2012; by area, CPUE was generally higher for beds off Oregon and Destruction Island (Figure 13 and Figure 14).
Observer coverage levels The project objective was to observe no less than 20% of the trips in a season. In 2011, the total number of trips was 207 and coverage was 24% of trips, or 26% relative to landed pink shrimp catch. Coverage rates of trips and relative to pink shrimp landed in 2012 were 16% and 14%, respectively. The decreases are due to an increase in total trips (252) and a reduction in the number of observers following federal funding cuts for the project. Observed trips ranged from Cape Blanco, Oregon to La Push, Washington; most trips were primarily off the mid-coast of Washington.
Bycatch Evaluation Estimate of Eulachon catch and spatial distribution Applying the ratio of total observed eulachon bycatch to total adjusted shrimp landed weight for observed trips produces total fishery estimates of eulachon bycatch of 7.8 mt (17,132 pounds) for 2011 and 171 mt (378,011 pounds) for 2012. This increase in bycatch occurred at the same time fishery regulations reduced the allowable bar-spacing for BRDs to 0.75 in. (19 mm) in 2012. With no estimate of eulachon population size, it is not possible to evaluate whether the magnitude of bycatch would have been higher yet in 2012 without the mandated gear changes or voluntary improvements to reduce bycatch. As the Canadian West Coast Vancouver Island (WCVI) shrimp trawl fishery encounters eulachon of both Columbia River and Fraser River origin, data from that fishery may provide some context for the increase in eulachon bycatch (Gustafson et al. 2010). The Canada Department of Fisheries and Oceans (DFO) age composition of eulachon sampled in the WCVI shrimp fishery points to an increased eulachon abundance and supports anecdotal reports by shrimpers of noticeably greater abundance of eulachon in 2012 than in 2011 (JCRMS 2014). Although not officially published, estimates of

Shrimp Trawl Operations and Bycatch of Eulachon Smelt, Rockfish, and Flatfish 29
age 1+ and 2+ eulachon in terms of number of individuals are produced, and the combined value was 88.5 million in 2011 and 448.7 million in 2012. Eulachon were encountered across the full extent of shrimp fishing grounds with some exceptions. Eulachon CPUE and bycatch ratios from observed tows in 2011 and 2012 combined are plotted in Figure 15a and 15b. Depicting both years together was done to more fully represent fishing grounds and meet confidentiality standards. The furthest northern and southern beds were characterized by the lowest eulachon CPUE and bycatch ratios. The highest CPUE and bycatch ratios were found along the mid-coast of Washington and the northern portion of Oregon. High CPUEs for eulachon generally corresponded to high bycatch ratios indicative of a high degree of co-occurrence. Some extraordinarily high bycatch ratios are apparent (Figure 15b). These tows may represent the first one of the day when skippers are prospecting for shrimp and the presence of other fish is unknown. If bycatch is unacceptably high, skippers will relocate to fishing grounds where the prevalence of fish is lower. It is also common practice for skippers to warn each other of incidences of high bycatch. Otherwise, the high bycatch ratio tows may reflect random occurrence.
Linear Mixed Effects Modelling: Analysis of Factors Effecting Bycatch of Eulachon, Rockfish, and Flatfish Along with the weight for each species of bycatch encountered in a tow, observers recorded the month, depth, location as measured by latitude and longitude, duration of the tow in minutes, and time of day as measured by the number of minutes before sunrise and before sunset. These data were recorded in 2011 and 2012. The analysis focused on testing which factors had the largest effect on the ratio of eulachon, rockfish, or flatfish to pink shrimp weight in each tow. We are particularly interested in the effect of gear type, or excluder bar-spacing on bycatch. However, fishing month, location, depth, and duration of tow could also affect bycatch ratios, and work synergistically with bar-spacing. Owing to differences in gear types used, pink shrimp abundance, and other factors discussed elsewhere in the report between the 2011 and 2012 fishing seasons, the two years were analyzed separately. This section begins with a brief description of analytical techniques followed by the results.
Linear Mixed Effects Modelling Analytical Techniques Ratios of bycatch originate from observations made for each tow on a random selection of vessels from the fleet involved in the pink shrimp fishery. We used linear mixed effects modelling to account for the correlation between ratios from tows of the same vessel under the assumption that these observations might be more similar due to use of the same gear and fishing methods rather than observations made from different vessels (Diggle et al. 1996). If the

Shrimp Trawl Operations and Bycatch of Eulachon Smelt, Rockfish, and Flatfish 30
correlation between observations within a vessel is not taken into account, variances of estimated regression coefficients will be overestimated.
In the linear mixed model of this project, the random effect is vessel and the model is:
where: = the bycatch ratio from tow i, in the vessel j;
X = the matrix of fixed effects in the linear model, where each row is an observation (tows) and each column is a predictor, e.g., excluder size and;
= a vector of coefficients for the predictors (fixed effects) of length equal to the number of columns in matrix X;
Z = the matrix of random effects in the linear model, where each row is an observation (tows) and the number of columns is equal to the number of vessels by the number of observations per vessel;
u = a random vector with length equal to the number of column in Z, distributed
0, ;
= the error term, distributed 0, independent of u.
The fixed effects (predictors) of the model were excluder size, month, depth, location, and tow time. The purpose of the analysis is to determine if any of the above predictors has an effect on bycatch ratios across the entire fleet, not just the vessels observed. We tested the significance of fixed effect using the change in residual deviance between nested models. All tests were
conducted at the = 0.05 level. Analyses were conducted using the R statistical software package
(version 3.1.0), lme4 library (R Core Team 2012; Bates 2010).
Assumptions used in the analysis are:
1. Vessels sampled in the study were chosen randomly and are representative of the pink shrimp fishery fleet.
2. Observations from one vessel are independent of observations between all other vessels. 3. The error term, 0, ,and is independent of the random errors, u.
4. The random error term u 0, .

Shrimp Trawl Operations and Bycatch of Eulachon Smelt, Rockfish, and Flatfish 31
Although the original study design had observers randomly assigned to vessel, logistically this was not always possible and in these cases, observers were assigned to vessels that were available. We make the assumption that vessel availability is a random process and that observations were still representative of the fleet.
Before fitting models to the data directly, we conducted exploratory analyses to determine if assumptions of normality were reasonably met, and if observations (the bycatch ratio in a tow) were distributed evenly across months, gear types, locations, and vessels in 2011 and 2012. There were major differences between 2011 and 2012 in which vessels fished, and the gear types used. These differences determined what factors could be analyzed as having an effect on bycatch ratios in 2011 and 2012.
In 2011, 10 vessels fished for pink shrimp from April to October, inclusive, but not all vessels fished in all months (Table 3). The vessels fished one gear type (excluder size), with the exception of vessel 7 which fished the two smallest gear types (Table 4). In 2011, all vessels fished only one gear type at a time. Further, the larger gear sizes (1 in., 1.25 in., and 1.5 in. excluders) were only fished by one vessel each. Vessels 5 and 3 fished with the 0.75 in. and 0.875 in. excluders, respectively. Because not all vessels fished in all months, gear types were not fished in all months (Table 5). All of these factors complicated the analysis of determining the effect of fishing month and gear type on bycatch ratios in 2011. Most of the fishing in 2011 occurred north of the Columbia River plume (Table 6). Only two vessels fished south of the Columbia River plume, with one fishing exclusively in that area.
In the 2012 Washington pink shrimp fishery, only excluders with 0.75 in. bar-spacing were allowed by regulation, with some exceptions made. Vessel 3 fished two different excluder types simultaneously, and vessel 8 had 26 tows with the 1.25 in. excluder bar-spacing (Table 7). These observations were not included in the analysis, leaving only tows made with the 0.75 in. excluders. Subsequently, we did not examine gear effect in 2012. The months in which each of the remaining 13 vessels fished varied across the 2012 season (Table 8). All vessels fished north of the Columbia River plume in 2012 (Table 9).
Linear Mixed Effects Modelling Results and Discussion: Eulachon, Rockfish, and Flatfish
Eulachon In 2011, one of the ten vessels participating in the pink shrimp fishery did not have eulachon bycatch, but did have flatfish and rockfish (Table 10). This vessel was left out of the eulachon analysis, leaving nine vessels (2, 3, 6, 7, 9, 10, 11, 14, and 15). The first step of the analysis was to check major assumptions of the analytical technique. Among the assumptions, one is that error terms are normally distributed. This assumption can be checked by plotting the density of bycatch ratios for each vessel. On the original scale, bycatch ratios are clustered at the lower end (Figure 16). If the errors in the model were normally distributed, the bycatch ratios should be

Shrimp Trawl Operations and Bycatch of Eulachon Smelt, Rockfish, and Flatfish 32
more evenly distributed horizontally, and take on the shape of a bell curve. Using the natural logarithm of 2011 bycatch ratios produced data plots that would be expected if errors were normally distributed (Figure 17). Plots of the bycatch ratios from 2012 had the same results: on the original scale, observations are clustered at the lower end (Figure 18). Using the natural logarithm of bycatch ratios resulted in density plots more typical of normally distributed data, and hence errors (Figure 19).
Among the important questions in the study is the effect of gear size, specifically the bar-spacing on excluders, on bycatch of eulachon. Testing the effect of gear size on bycatch can only be done using the 2011 data because it was the only year in the study in which multiple bar-spacings were used. The analysis is complicated by not all vessels fishing the same gear; the 1 in., 1.25 in., and 1.5 in. bar-spacing were each fished by only one vessel (Table 11). Further, they were not fished evenly across the fishing season. Hence, the effects of vessel, gear, and month are not easily analyzed for the 2011 data. Only the effects of month and vessel can be analyzed for the 2012 data. Analysis of the other predictors such as latitude, depth, and tow time will be dependent on the results of vessel, gear, and month effects.
Eulachon: Vessel, Gear, and Month - 2011 The first step in the analysis was to determine if the predictor, Vessel, contributed enough to the variance to include it as a random effect. We used the lmer function in R (R Core Team 2012; Bates 2010) to obtain estimates of the variance contribution of Vessel to the overall error variance. Correlation between tows of the same vessel contributed approximately 13.4% to the overall error variance (Table 12), too large to be ignored. If there were no correlation within tows from the same vessel, the estimate of the vessel variance would be zero.
Ordering each vessel by the average amount of bycatch for a vessel differed from the average across all vessels (Figure 20). Vessel number 10 had the highest bycatch ratio and the fewest number of tows, at 18, fishing in June and July with the 0.75 in. excluder (Table 10 and Table 11). The next two highest, vessels 3 and 15, fished with the 1.5 in. and 1.25 in. excluders, respectively, and were the only vessels with this gear type. These vessels fished in June, July, and August. The only vessel to fish the 1 in. excluder, vessel 6, had the smallest bycatch ratios, but vessel 6 only fished in August, the month with the lowest observed bycatch (Figure 21). This might be why the 1 in. excluder size had the smallest bycatch ratio (Figure 22). No vessel fished in all months, although, vessel 11 (with the second lowest ratio), and vessel 14 (which was slightly above the mean) fished in every month except September with the 0.875 in. excluder size. There is a marked difference between the amount of bycatch caught by the small and larger excluder sizes (Figure 22).
The above description, Tables 3 through 6, and Figures 20 through 22 underscore the complications in teasing apart the effects of vessel, gear, and month in the analysis. To look at

Shrimp Trawl Operations and Bycatch of Eulachon Smelt, Rockfish, and Flatfish 33
the effects of gear and month, we confined the analysis to the months of June, July, and August, and gear types (excluder sizes) 0.75 in., 0.875 in., 1.25 in., and 1.5 in. because these were the combinations available. We fit the following series of nested models to test if any of the fixed effects of month, gear type, and the interaction between the two was significant,
Model1 : Eq.1
Model2
Model3 .
Model4 ..
where equals the overall mean of bycatch. Significance of each of the factor effects, Month, Gear, and Interaction, is determined by the difference in the residual deviance, ∆ ,
between the model having that factor and the model with the factor removed, calculated as
∆ , Eq.2
where ∆ is distributed .
Because the order at which a predictor enters or is removed from the model can affect its significance in the analysis of deviance, particularly when the number of observations is unequal among categories, we fit a second set of models, removing gear first, written as follows:
Model1 : Eq.3
Model2
Model3 .
Model4 .. .
Significance of factor effects for Eq. 3 were tested using differences in deviance between reduced models using Eq. 2. We then compared results between the two sets of models.
Results of the analysis for Eq. 1 indicate a significant interaction between gear type and month (Table 13), and a significant gear effect. The interaction between month and gear indicates that for each level of month, each level of gear will change with regard to how it increases or decreases bycatch. Further, regardless of the outcome of test for each main effect, both must be kept in the model in the presence of a significant interaction. In each analysis, the month of fishing had a significant effect on eulachon bycatch (Table 13 and Table 14). The effect of gear is less clear, being significant in one model, but not the other.
An interaction plot of the effects of month and gear type supports the results of the analysis (Figure 23). The effects of gear type are not consistent across months. For example, bycatch of eulachon increased in July for the 1.5 in. spacing while all other gear types decreased. Also,

Shrimp Trawl Operations and Bycatch of Eulachon Smelt, Rockfish, and Flatfish 34
while the 0.75 in., 0.875 in., and 1.5 in. gear types decreased in the amount of bycatch caught in August, the 1.25 in. spacing increased.
To look at the effects of gear type more closely, we analyzed the data for tows conducted in August, the only month that all bar-spacings were fished. There was no need to model Vessel as a random effect for August as the within vessel variance was estimated as zero. The model for bycatch in the August tows was:
. Eq.4
The results of an analysis of variance (ANOVA), used to analyze categorical data, showed a significant gear effect on the amount of bycatch of eulachon (Table 15). An ANOVA only tests for an inequality somewhere among gear types. Subsequently, we conducted pairwise comparisons for the five gear types using Tukey’s honestly significant difference (TukeyHSD; Zar 1994, pg. 186). The 0.875 in. bar-spacing was consistently lower than all other types except for the 1.0 in. spacing (Table 16). However, the 1.0 in. spacing was fished only in August, when bycatch ratios were lowest overall, by one vessel, and for a total of 27 tows. Eulachon catch for the 0.75 bar-spacing was not significantly different from the larger gear types.
Results of the ANOVA should be approached with caution when the number of observations is not equal across categories, particularly when p-values are close to the significance level of the test. However, there are enough observations in each category, and p-values are much lower than the 0.05 significance level that this should not be a concern.
To examine the effects of gear more broadly across the fishing season, we restricted the analysis to the 0.75 in. and 0.875 in. bar-spacing so that we could test for month effect across the entire season. We first restricted the analysis to the months of May, June, July, August, and October, when both gear types were fished. Results of the analysis for the model in which month is removed first differed from previous results regardless of whether gear was removed first (Table 17 and Table 18; Eq. 1 and Eq. 3, respectively) in that gear type was not significantly different in the amount of bycatch. The 0.875 in. bar-spacing was constantly lower than the 0.75 in. spacing except in October (Figure 24). The change in the relative difference between the two gear types in October could be cause of the significant interaction, particularly in larger sample sizes. The number of tows for the 0.75 in. and 0.875 in. gear were 15 and 29, respectively (Table 5).
Because gear type must be considered when looking at differences in bycatch across month in 2011, we conducted one last analysis for the effect of month on bycatch of eulachon using tows made with the 0.875 in. gear type only. This bar-spacing was fished in every month except September, thus covering the temporal span of the 2011 season. Controlling for the extra variation due to Vessel in the model by considering it a random effect, results showed significant differences by month in eulachon bycatch (Table 19). Pairwise comparisons conducted using

Shrimp Trawl Operations and Bycatch of Eulachon Smelt, Rockfish, and Flatfish 35
Tukey’s HSD showed that eulachon bycatch was greatest in April, followed by October (Table 20).
Eulachon: Vessel and Month - 2012 Analysis of the effect of fishing month was simpler in 2012 than in 2011. By regulation, only one gear type was fished in 2012. One vessel made tows from two gear types simultaneously. Because bycatch ratios were calculated by the tows from the two gear types, observations from this vessel were excluded from the analysis. Another vessel used the 0.75 in. and 1.25 in. bar-spacing, although not simultaneously. The 26 tows made with the 1.25 in. bar-spacing were also removed from the analysis, however there were still 59 observed tows from this vessel. Across all 13 remaining vessels in the analysis, there were 508 observed tows with eulachon bycatch. Vessels 2, 3, and 6 were not included in the 2012 analysis.
The first step in the analysis was to determine if Vessel needed to be included in analytical models as a random effect. The results were the same as with the 2011 analysis. Correlation of observations within vessel contributed 24.3% to the overall variance (Table 21). By modelling Vessel as a random effect, the variance structure of the data will be adequately captured, and the estimate variance of other model parameters will be more accurate than if the within Vessel variation was not taken into account. Differences among vessels with regard to the overall mean log bycatch ratio are displayed graphically in Figure 25. In both 2011 and 2012, vessel number 10 had the highest bycatch ratios and vessel 11 was among the lowest.
A plot of the natural logarithm of ratios for each month show that the highest eulachon bycatch occurred in May, the lowest in October (Figure 26). April had the highest variability in bycatch. Results of the analysis showed that there were significant differences among month in eulachon bycatch (Table 22). Pairwise comparison conducted using Tukey’s HSD supported the plot in Figure 26. May was significantly higher and October significantly lower than all months except April which had the highest variability and hence was not statistically different from any of the other months (Table 23).
Eulachon: Depth, Latitude, and Tow Time – 2011 and 2012 Three continuous predictor variables were analyzed for their effect on bycatch of eulachon: depth of tow measured in fathoms, time of tow measured in minutes, and the latitude of the tow as a measure of location. The model used to analyze the effect of the continuous predictor, X, was:
∙ : . Eq.5
Month was included in the analysis because it was shown to have a significant effect on bycatch in 2011, but the gear type was restricted to the 0.875 in. bar-spacing as this was fished across all
months except September. Hence, there was no gear effect in the model. The term : is

Shrimp Trawl Operations and Bycatch of Eulachon Smelt, Rockfish, and Flatfish 36
the interaction. Significance of this term indicates that the linear relationship between the continuous predictor and bycatch is different among months.
Eulachon: Depth The relationship between depth and bycatch ratio differed among months in 2011 as indicated by the significant interaction (Table 24). The difference in the direction and degree of the regression lines for each month supports the results of the analysis and indicate the difficulty of assessing the effect of any one predictor in the presence of an interaction (Figure 27). Three of the six months had a significantly positive depth-bycatch relationship (Table 25).
The interpretation of the regression parameter, , is that it is the change in the log of bycatch ratio for each unit increase in the predictor, X (Eq. 5). Analytical results indicate a significant relationship between depth and bycatch; however, this may not be biologically significant. The effects of depth on bycatch for each month were calculated as follows:
% ∙ . Eq.6
The largest increase in bycatch was for the month of April, which had a 20.4% increase for a one fathom increase in fishing depth (Table 25). This translates into an increase of 6.6 pounds of eulachon per 10,000 pounds of shrimp caught. Although the bycatch relationship with depth is statistically significant, it may not be biologically meaningful.
Consistent with 2011, the 2012 depth-bycatch relationship was statistically different in each month and overall (Table 26). The relationship was significantly positive in only two out of the seven months in 2012, and estimated as positive in two other months (Table 27; Figure 28). The largest significant increase in percent change in eulachon for a one fathom increase in depth was observed in June, with a change of 8.1% or 22.9 pounds. The next largest significant increase is in September, with a 3.7% increase or about 9 pounds.
Eulachon: Latitude Latitude was used as a measure of fishing location off the coast. In 2011 most of the fishing occurred north of the Columbia River plume, but there were 32 observations south of the plume in October (Table 28) using excluder devices with the 0.75 in. and 0.875 in. bar-spacing (Table 29). There was no apparent difference in the bycatch between locations fished north and south of the plume (Figure 29). Although the interaction between month and latitude was significant for tows north of the plume in 2011, this may be an artifact of the strong month effect observed in 2011 as the effect of latitude alone was not significant (Table 30).
All tows included in the analysis in 2012 were conducted north of the Columbia River plume, and were significantly different among months as indicated by a significant interaction effect (Table 31). Relationships between latitude and depth were significant in five out of the seven

Shrimp Trawl Operations and Bycatch of Eulachon Smelt, Rockfish, and Flatfish 37
months, but the direction was not consistent (Table 32). Changes in the bycatch of eulachon for a half a degree increase were estimated for each month by:
% .
∙ . Eq.7
The large change in October is an artifact of a very steep slope over a narrow range of values (Figure 30). Under these conditions, small perturbations in the value of latitude will produce vastly different estimates. Further, a 0.5 degree increase in the relationship for October is predicting beyond the range of the data. Other estimates are below an increase in 100 pounds, but the direction of change is not consistent.
Eulachon: Tow Time The average time per tow was approximately 100 minutes. In 2011, there was no significant interaction between tow time and month (Table 33) and the overall time-bycatch relationship was significant and the same across all months, but at -0.007 not very strong. For example, a 30 minute increase in tow time in April would be associated with a decrease of 8 pounds of eulachon per 10,000 pounds of shrimp.
Tow time-bycatch relationships were not constant across months fished in 2012 (Table 34; Figure 31). The strongly increasing slope estimated for April is most likely driving the significant interaction. All other months were either not significantly different from zero, or negative. Changes in eulachon bycatch on the original scale for a 30 minute increase in tow time were calculated as:
% ∙ Eq.8
Even with the strong positive relationship in April, the increase in eulachon bycatch is 21 pounds per 10,000 pounds shrimp (Table 35). All other changes are ±5 pounds.
Rockfish Ten of the 16 vessels in the study had measureable rockfish bycatch in the 2011 fishery. Fourteen of the 16 vessels were included in the 2012 analysis. One vessel, number 2, was not included in the 2012 analysis because it fished with two gears sizes simultaneously and bycatch could not be attributed to any one size. A total of 579 and 474 tows had measureable bycatch in 2011 and 2012, respectively (Table 3 and Table 8). Results of the analysis of the major factors affecting rockfish bycatch ratios at the tow level are presented and discussed in this section.
Although the need to transform bycatch ratios to meet the assumption of normally distributed errors was established in the eulachon analysis, we plotted density of rockfish bycatch ratios on the original and logarithmic scale to verify that the data transformation was necessary for rockfish. Plots of the density for 2011 and 2012 data confirmed the need to transform the data

Shrimp Trawl Operations and Bycatch of Eulachon Smelt, Rockfish, and Flatfish 38
(Figures 32 through 35). All analyses examining the factors effecting rockfish bycatch were conducted on the logarithmic scale.
Similar to the eulachon analysis, analysis of the effect of gear size on rockfish bycatch was only possible using the 2011 data. Only the 0.75 in. bar-spacing was fished in 2012. Further complicating the analysis, not all gear types were fished by all vessels, or in all months, in 2011. Only one vessel fished each of the 1 in., 1.25 in., and 1.5 in. bar-spacings. Hence, the effects of month, gear, and vessel are not easily analyzed, nor are the effects of each easily interpreted. Only the effects of month and vessel can be analyzed using the 2012 tow level data. Analysis of other predictors such as latitude, depth, and tow time will be dependent on the results of vessel, gear, and month effects.
Rockfish: Vessel, Gear, and Month - 2011 After verifying the need for data transformations, the next step of the analysis was to determine if variance in total bycatch attributable to the predictor Vessel contributed enough to the overall variance to include it as a random effect. Using the lmer function in R, we found that variability in bycatch owing to Vessel contributed 31.6% to the overall variance, too large to be ignored (Table 36). Hence, we analyzed the data with Vessel as a random effect.
Ordering each vessel by the average amount of rockfish bycatch for a vessel differed from the average across all vessels. Figure 36 showed that vessel number 15 had the highest bycatch ratio among all vessels. This vessel fished from June through September with the 1.25 in. excluder, and also had the third highest bycatch ratio for eulachon (Figure 20). Vessel 7, the next highest, fished with the 0.75 in. and 0.875 in. gear types May through August. The third highest, vessel 3, fished with the 1.5 in. excluder, and was the only vessel with this gear type fishing in June, July, and August. Vessel 3 also had the second highest eulachon bycatch. Vessel 2 had the lowest bycatch, only fishing in October with the 0.75 in. bar-spacing. Vessel 14 had the second lowest rockfish bycatch, fishing in every month except September with the 0.875 in. bar-spacing. No vessel fished in all months, although vessel 14, with the second lowest ratio, and vessel 11, which was slightly above the mean, fished in every month except September with the 0.875 in. excluder size.
Rockfish bycatch was highest in September and lowest in April (Figure 37). This is different than eulachon bycatch which was highest in April (Figure 21). There seems to be no difference in bycatch across the months of May, June, July, August, and October. As observed with eulachon, the 1.25 in. bar-spacing had the highest rockfish bycatch (Figure 22 and Figure 38). However, only one vessel fished this gear type, vessel 15, and also fished in September along with one other vessel which fished the 0.75 in. gear. Because there is no replication of gear and vessel with the 1.25 in. bar-spacing, the effects of gear type and vessel cannot be separated.

Shrimp Trawl Operations and Bycatch of Eulachon Smelt, Rockfish, and Flatfish 39
In the above description, the exploratory analysis of Table 3 through Table 6 underscores the complications in teasing apart the effects of vessel, gear, and month in the analysis. To look at the effects of gear and month, we conducted the same analysis for rockfish as for eulachon; we confined the analysis to the months of June, July, and August, and gear types (excluder sizes) 0.75 in., 0.875 in., 1.25 in., and 1.5 in. because these were the combinations available. We fit the rockfish data to the series of nested models in Eq. 1, and tested the significance of predictors using Eq. 2. We then reversed the order in which the effects of Gear and Month entered the model, fitting the series of nested models of Eq. 3 because the order at which a predictor enters the model can affect its significance, particularly when the number of observations is unequal among categories. We then compared results between the two sets of models, looking for consistency in the significance of the predictors.
Results of the analysis for Eq. 1 indicate a significant interaction between gear type and month (Table 37), and a significant gear effect. The significant interaction between month and gear indicates that for each level of month, each level of gear will change with regard to how it increases or decreases bycatch. Further, regardless of the test outcome for each main effect, both must be kept in the model in the presence of significant interaction. However, month was not significant in either model (Table 37 and Table 38), leading to the conclusion that the month of fishing does not have a significant effect on rockfish bycatch. This confirms what was observed in the boxplot of rockfish bycatch ratios by month (Figure 37) and by excluder size (Figure 38).
An interaction plot of the effects of month and gear type supports the results of the analysis (Figure 39). The effects of gear type are not consistent across months. For example, bycatch of rockfish increased in July for the 1.5 in. spacing while all other gear types decreased. Also, while the 0.75 in., 0.875 in., and 1.5 in. gear types decreased in the amount of bycatch caught in August, the 1.25 in. spacing increased.
To look at the effects of gear type more closely, we analyzed the data for tows conducted in August, the only month that all bar-spacing sizes were fished (Eq. 4). There was no need to model vessel as a random effect for August as the within vessel variance was estimated as zero. Results of ANOVA used to analyze categorical data, showed that gear had a significant effect on rockfish (Table 39). An ANOVA only tests for an inequality somewhere among gear types. Subsequently we conducted pairwise comparisons for the 5 gear types using Tukey’s HSD (Zar 1994, pg. 186). The 0.875 in. bar-spacing was consistently lower than the 0.75 and 1.25 in. spacing but equal to the 1 in. and 1.5 in. spacing (Table 40). The 1.0 in. spacing was fished only in August by one vessel and had a total of 48 tows.
Results of the ANOVA should be approached with caution when the number of observations is not equal across categories, particularly when p-values are close to the significance level of the

Shrimp Trawl Operations and Bycatch of Eulachon Smelt, Rockfish, and Flatfish 40
test. However, when there are enough observations in each category and p-values are much lower than the 0.05 significance level, this should not be a concern.
To examine the effects of gear more broadly across the fishing season, we restricted the analysis to the 0.75 in. and 0.875 in. bar-spacing so that we could test for month effect across the entire season. We first restricted the analysis to the months of May, June, July, August, and October, when both gear types were fished. We also changed the order of entry of the main effects, Month and Gear, repeating the previous analysis (Eq. 1 and Eq. 3). Results of the analysis with the 0.75 in. and 0.875 in. gear types only showed that gear effect was different in different months, and also that gear may be a more significant predictor of rockfish bycatch than month (Table 41 and Table 42). This confirms results in the previous analysis in which gear and month were removed in different orders (Eq. 1 and Eq. 3; Table 37 and Table 38). The amount of rockfish bycatch with 0.875 in. bar-spacing was lower than the 0.75 in. spacing except in May and August, almost equal in June and July, and higher in October (Figure 40). The change in the relative difference between the two gear types in May and October could be cause of the significant interaction, particularly in larger sample sizes. The number of tows for the 0.75 in. and 0.875 in. were 7 and 26, respectively, for October (Table 5).
Because gear type must be considered when looking at differences in bycatch across month in 2011, we conducted one last analysis for the effect of month on bycatch of rockfish using tows made with the 0.875 in. gear type only using Models 3 and 4 of Eq. 3. This bar-spacing was fished in every month except September, thus covering the temporal span of the 2011 season. Controlling for the extra variation due to vessel in the model by considering it a random effect, results showed significant differences by month in rockfish bycatch (Table 43 and Table 44). Pairwise comparisons conducted using Tukey’s HSD showed that rockfish bycatch was greatest in April, followed by October (Table 44).
Rockfish: Vessel and Month - 2012 Analysis of the effect of fishing month was simpler in 2012 than in 2011. By regulation, only one gear type was fished in 2012; however, exceptions were allowed via special permit for gear testing. One vessel made tows from two gear types simultaneously. Because bycatch ratios were calculated by the tows from the two gear types, observations from this vessel were excluded from the analysis. Another vessel used the 0.75 in. and 1.25 in. bar-spacing, although not simultaneously. The 24 tows with rockfish bycatch made with the 1.25 in. bar-spacing were also removed from the analysis; however, there were still 49 observed tows with rockfish bycatch from this vessel. Vessels 2, 3, and 6 were not included in the 2012 analysis. Across all 13 remaining vessels in the analysis, there were 474 observed tows with rockfish bycatch.
The first step in the analysis was to determine if vessel needed to be included in analytical models as a random effect. The results were the same as with the 2011 analysis. Correlation of

Shrimp Trawl Operations and Bycatch of Eulachon Smelt, Rockfish, and Flatfish 41
observations within vessel contributed 23.3% to the overall variance (Table 45). By modelling Vessel as a random effect, the variance structure of the data will be adequately captured, and the estimated variance of other model parameters will be more accurate than if the within vessel variation was not taken into account. Differences among vessels with regard to the overall mean log bycatch ratio are displayed graphically in Figure 41. Vessel 14 was the second lowest in both 2011 and 2012. Among other vessels fishing in both years, there was no consistent order (Figure 36 and Figure 41).
A plot of the natural logarithm of ratios for each month shows that the highest rockfish bycatch occurred in April, with the lowest in August (Figure 42). However, there was no significant difference in rockfish bycatch among months (Table 46). Pairwise comparison conducted using Tukey’s HSD supported the plot in Figure 42. There was no significant difference in rockfish bycatch between any two months in 2012 (Table 47).
Rockfish: Depth, Latitude, and Tow Time Three continuous predictor variables were analyzed for their effect on rockfish bycatch, depth of tow measured in fathoms, time of tow measured in minutes, and the latitude of the tow as a measure of location. The model used to analyze the effect of the continuous predictors of depth, tow time, and latitude was that of Eq. 5,
∙ : .
Month was included in the analysis because it was shown to have a significant effect on bycatch in 2011, but gear type was restricted to the 0.875 in. bar-spacing as this was fished across all
months except September. Hence, there was no gear effect in the model. The term : is
the interaction. Significance of this term indicates that the linear relationship between the continuous predictor and bycatch is different among months. Although there was no difference in rockfish bycatch across months in 2012, we kept the interaction term to look at month to month differences in bycatch-predictor relationships.
Rockfish: Depth The relationship between depth and bycatch ratio differed among months in 2011 as indicated by the significant interaction (Table 48). Again, we restricted the analysis to include only the 0.875 in. gear type because this gear was fished all months but September. The difference in the direction and degree of the regression lines for each month support the results of the analysis, and indicate the difficulty of assessing the effect of any one predictor in the presence of an interaction (Figure 43). Three of the six months had a significantly positive depth-bycatch relationship (Table 49).
The interpretation of the regression parameter, β, is that it is the change in the log of bycatch ratio for each unit increase in the predictor, X. Analytical results indicate a significant

Shrimp Trawl Operations and Bycatch of Eulachon Smelt, Rockfish, and Flatfish 42
relationship between depth and bycatch; however, this may not be biologically significant. The effects of depth on bycatch for each month were calculated as the percent change in bycatch ratios for a one fathom increase in depth using Eq. 6. The greatest increase in the percent change in bycatch for an increase in one fathom of fishing depth was estimated to be about 11% in May (Table 49). This translates into 0.25 pounds of rockfish per 10,000 pounds of shrimp caught. Although the bycatch relationship with depth is statistically significant, it may not be biologically meaningful.
Consistent with 2011, the depth-bycatch relationship in 2012 was statistically different in each month and overall (Table 50). The relationship was significantly positive in only two out of the seven months in 2012, and estimated as positive in two other months (Table 51; Figure 44). The largest percentage change in rockfish bycatch for a one fathom increase in depth is an increase of 41% in October; however, this is based on only 14 tows. The next largest significant change is an increase of about 5%.
Rockfish: Latitude Latitude was used as a measure of fishing location off the coast. In 2011 most of the fishing occurred north of the Columbia River plume, but there were 24 observations south of the plume in October (Table 52) using excluder devices with the 0.75 in. and 0.875 in. bar-spacing (Table 53). There was no apparent difference in the bycatch between locations fished north and south of the plume (Figure 45). Although the interaction between month and latitude was significant for tows north of the plume in 2011, this may be an artifact of the strong month effect observed in 2011 as the effect of latitude alone was not significant (Table 54).
All tows included in the analysis in 2012 were conducted north of the Columbia River plume, and were significantly different among months as indicated by a significant interaction effect (Table 55). Relationships between latitude and month were significant in three out of the seven months, June, July and October, but the direction was not consistent. Changes in the bycatch of rockfish for a half of a degree increase in latitude were estimated for each month by Eq. 7 (Table 56). Aside from October, the largest change in rockfish bycatch for a change in latitude is a 113% increase in June, which translates into a 4.8 lb. increase in rockfish per 10,000 lbs. of shrimp caught. The large change in October is an artifact of a very steep slope over a narrow range of values (Figure 46). Under these conditions, small perturbations in the value of latitude will produce vastly different estimates. Further, a 0.5 degree increase in the relationship for October is predicting beyond the range of the data.
Rockfish: Tow Time In the 2011 fishery, the average time per tow was approximately 100 minutes. There was no significant interaction between tow time and month (Table 57) and the overall tow time-bycatch relationship was significant and the same across all months. However, a slope of -0.007 is not a

Shrimp Trawl Operations and Bycatch of Eulachon Smelt, Rockfish, and Flatfish 43
very strong relationship. For example, a 30 minute increase in tow time in April would be associated with a decrease of 8 pounds of rockfish per 10,000 pounds of shrimp.
Tow time-bycatch relationships were not constant across months fished in 2012 as indicated by the significant interaction (Table 58; Figure 48). The significantly negative estimated slope for August is most likely driving the significant interaction. All other months were not significantly different from zero. The percent change of rockfish bycatch on the original scale for a 30 minute increase in tow time was calculated using Eq. 8 (Table 59). The largest percent change is an increase of 75.3% in April; however the slope is not significantly different from zero (Table 57). This increase represents about a 3 pound increase in rockfish bycatch per 10,000 pounds of shrimp caught at the tow time levels. All other changes are smaller in terms of absolute differences.
Flatfish Ten of the 16 vessels in the study had measureable flatfish bycatch in the 2011 fishery. Thirteen of the 16 vessels were included in the 2012 analysis. One vessel, number 2, was not included in the 2012 analysis because it fished with two gears sizes simultaneously and bycatch could not be attributed to any one size. A total of 1863 and 1788 tows had measureable bycatch of flatfish species in 2011 and 2012, respectively. Results of the analysis of the major factors affecting bycatch ratios of flatfish at the tow level are presented and discussed in this section.
Although the need to transform bycatch ratios by the taking the natural logarithm of the data to meet the assumption of normally distributed errors was established in the analysis with other species, we plotted density of bycatch ratios on the original and logarithmic scale to verify that the same transformation was necessary for flatfish. Plots of the density for 2011 and 2012 data confirmed the need to transform the data (Figures 49 through 52). All analyses examining the factors effecting flatfish bycatch were conducted on the logarithmic scale.
Similar to the eulachon and rockfish, analysis of the effect of gear size on flatfish bycatch was only possible using the 2011 data. Only the 0.75 in. bar-spacing was fished in 2012. Further complicating the analysis, not all gear types were fished by all vessels, or in all months in 2011. Only one vessel fished each of the 1 in., 1.25 in., and 1.5 in. bar-spacing. Hence, the effects of month, gear, and vessel are not easily analyzed, nor are the effects of each easily interpreted. Only the effects of month and vessel can be analyzed using the 2012 tow level data. Analysis of other predictors such as latitude, depth, and tow time will be dependent on the results of vessel, gear, and month effects.
Flatfish: Vessel, Gear, and Month – 2011 After verifying the need for data transformations, the next step of the analysis was to determine if variance in total bycatch attributable to the predictor of Vessel contributed enough to the overall variance to include it as a random effect. Using the lmer function in R, we found that

Shrimp Trawl Operations and Bycatch of Eulachon Smelt, Rockfish, and Flatfish 44
variability in bycatch owing to Vessel contributed 30.8% to the overall variance, too large to be ignored (Table 60). Hence, we analyzed the data with Vessel as a random effect. Ordering each vessel by the amount the average bycatch for a vessel differed from the average across all vessels (Figure 53). Vessel 15 had the highest bycatch ratio among all vessels, fished from June through September with the 1.25 in. excluder, and also had the third highest bycatch ratio for eulachon, and the highest for rockfish. Vessel 7, the next highest, fished with the 0.75 in. and 0.875 in. gear types May through August. The third and fourth highest, vessels 3 and 1, respectively, were also the third and fourth highest for rockfish bycatch, although in reverse order. Vessel 3 also had the second highest eulachon bycatch. Vessel 2 had the lowest bycatch for both flatfish and rockfish, although it only fished in October with the 0.75 in. bar-spacing. Vessel 14 had the second lowest flatfish and rockfish bycatch, fishing in every month except September with the 0.875 in. bar-spacing. No vessel fished in all months, although vessel 14, with the second lowest ratio, and vessel 11, which was slightly above the mean, fished in every month except September with the 0.875 in. excluder size.
Flatfish bycatch was lowest in October and higher in July and September, although only slightly. This is different than eulachon bycatch which was highest in April 2011 (Figure 21). There seems to be no difference in bycatch across the months April to June. As observed with eulachon and rockfish, the 1.25 in. bar-spacing had the highest flatfish bycatch (Figure 55). However, only one vessel fished this gear type, vessel 15, and also fished in September along with one other vessel which fished the 0.75 in. gear. Because there is no replication of gear and vessel with the 1.25 in. bar-spacing, the effects of gear type and vessel cannot be separated.
The description above and the exploratory analyses in Table 3 through Table 6 again underscore the complications in teasing apart the effects of vessel, gear, and month in the analysis. To look at the effects of gear and month, we conducted the same analysis for flatfish as for eulachon; we confined the analysis to the months of June, July, and August, and gear types (excluder sizes) 0.75 in., 0.875 in., 1.25 in., and 1.5 in. because these were the combinations available. We fit the flatfish data to the series of nested models in Eq. 1, and tested the significance of predictors using Eq. 2. We then reversed the order in which the effects of Gear and Month entered the model, fitting the series of nested models of Eq. 3 because order at which a predictor entered the model can affect its significance, particularly when the number of observations is unequal among categories. We then compared results between to two sets of models, looking for consistency in the significance of the predictors.
Results of the analysis for Eq. 1 indicate a significant interaction between gear type and month (Table 61), and significant main effects of gear and month on the ratios of flatfish bycatch. The significant interaction between month and gear indicates that for each level of Month, each level of Gear will change with regard to how it increases or decreases flatfish bycatch. Further,

Shrimp Trawl Operations and Bycatch of Eulachon Smelt, Rockfish, and Flatfish 45
regardless of the outcome of testing for each main effect, both must be kept in the model in the presence of a significant interaction. The analysis of Eq. 3 had the same results as Eq. 1 (Table 62); the interaction and main effects all had a significant effect on flatfish bycatch.
An interaction plot of the effects of month and gear type supports the results of the analysis (Figure 56). The effects of gear type are not consistent across months. For example, bycatch of rockfish for the 1.25 in. excluder increased from June to July while the 1.5 in. and 0.875 in. gear types decreased or stayed the same.
To look at the effects of gear type more closely, we analyzed the data using only tows conducted in August, the only month that all bar-spacing sizes were fished. There was no need to model Vessel as a random effect for August as the within vessel variance was estimated as zero. Eq. 4 was used to model bycatch in the August tows. The results of ANOVA used to analyze categorical data, showed a significant gear effect on the amount of bycatch of flatfish (Table 63). An ANOVA only tests for an inequality somewhere among gear types. Subsequently we conducted pairwise comparisons for the 5 gear types using Tukey’s HSD. The 0.875 in. bar-spacing was consistently lower than all other types except for the 1 in. spacing (Table 64). The 1 in. spacing was fished only in August by one vessel and had a total of 86 tows. Flatfish bycatch was highest for the 1.25 in. bar-spacing. The 0.75 in. bar-spacing was only lower in flatfish bycatch than the 1.25 in. gear.
Results of the ANOVA should be approached with caution when the number of observations is not equal across categories, particularly when p-values are close to the significance level of the test. However, there are enough observations in each category, and p-values are much lower than the 0.05 significance level, that this should not be a concern.
To examine the effects of gear size more broadly across the fishing season, we restricted the analysis to the 0.75 in. and 0.875 in. bar-spacing so that we could test for month effect across the entire season. We first restricted the analysis to the months of May, June, July, August, and October, when both gear types were fished. Results of the analysis for the model in which month is removed first differed from previous results regardless of whether gear was removed first (Table 65 and Table 66; Eq. 1 and Eq. 3, respectively) in that gear type was not significantly different in the amount of bycatch. The 0.875 in. bar-spacing was constantly lower than the 0.75 in. spacing except in October (Figure 57). The change in the relative difference between the two gear types in October could be cause of the significant interaction, particularly in larger sample sizes. The number of tows with flatfish bycatch for the 0.75 in. and 0.875 in. were 21 and 93, respectively (Table 5).
Because gear type must be considered when looking at differences in bycatch across month in 2011, we conducted one last analysis for the effect of month on bycatch of flatfish using tows made with the 0.875 in. gear type only. This bar-spacing was fished in every month except

Shrimp Trawl Operations and Bycatch of Eulachon Smelt, Rockfish, and Flatfish 46
September, thus covering the temporal span of the 2011 season. Controlling for the extra variation due to vessel in the model by considering it a random effect, results showed that at least one month was significantly different from other months in flatfish bycatch (Table 67). Pairwise comparisons conducted using Tukey’s HSD showed that July bycatch was significantly lower than April, May, and August, but similar to June and October (Table 68). Other months were pairwise similar.
Flatfish: Vessel and Month - 2012 Analysis of the effect of fishing month was simpler in 2012 than in 2011. By regulation, only one gear type was fished in 2012. One vessel made tows from two gear types simultaneously. Because bycatch ratios were calculated by the tows from the two gear types, observations from this vessel were excluded from the analysis. Another vessel used the 0.75 in. and 1.25 in. bar-spacing, although not simultaneously. The 106 tows made with the 1.25 in. bar-spacing were also removed from the analysis; however, there were still 240 observed tows from this vessel. Across all 13 remaining vessels in the analysis, there were 1,788 observed tows with flatfish bycatch. Vessels 2, 3, and 6 were not included in the 2012 analysis.
The first step in the analysis was to determine if Vessel needed to be included in analytical models as a random effect. The results were the same as with the 2011 analysis. Correlation of observations within vessel contributed 13.7% to the overall variance (Table 69). By modelling vessel as a random effect, the variance structure of the data will be adequately captured, and the estimate variance of other model parameters will be more accurate than if the within vessel variation was not taken into account.
Differences among vessels with regard to the overall mean log bycatch ratio are displayed graphically in Figure 58. Similar to eulachon, vessel 7 and 10 had the highest flatfish bycatch ratios in 2012. Vessels 11, 12, and 14 had the three lowest bycatch ratios, again similar to eulachon bycatch. All other vessels were similar.
A plot of the natural logarithm of ratios for each month show that the highest flatfish bycatch occurred in May, the lowest in October (Figure 59). Results of the analysis showed that there were significant differences among month in flatfish bycatch (Table 70). Pairwise comparison conducted using Tukey’s HSD supported the plot in Figure 59 (Table 71). May was significantly higher than all other months. April was also significantly greater in bycatch ratios than September and October. The lowest bycatch ratio was observed in October.
Flatfish: Depth, Latitude, and Tow Time Three continuous predictor variables were analyzed for their effect on bycatch, depth of tow measured in fathoms, time of tow measured in minutes, and the latitude of the tow as a measure of location. The model used to analyze the effect of the continuous predictors of depth, tow time, and latitude was that of Eq. 5.

Shrimp Trawl Operations and Bycatch of Eulachon Smelt, Rockfish, and Flatfish 47
∙ : .
Month was included in the analysis because it was shown to have a significant effect on bycatch in 2011, but the gear type was restricted to the 0.875 in. bar-spacing as this was fished across all
months except September. Hence, there was no gear effect in the model. The term : is
the interaction. Significance of this term indicates that the linear relationship between the continuous predictor and bycatch is different among months.
Flatfish: Depth The relationship between depth and bycatch ratio did not differ among months in 2011 as indicated by the non-significant interaction (Table 72). This indicates that the relationship between depth and flatfish bycatch ratios were similar across all months, as indicated by a common slope estimate of -0.013. The lack of any real differences in the direction and degree of the regression lines for each month support the results of the analysis (Figure 60).
The interpretation of the regression parameter, , is that it is the change in the log of bycatch
ratio for each unit increase in the predictor, X. Analytical results indicate a significant relationship between depth and bycatch; however, this may not be biologically significant. The effect of depth on bycatch was calculated using Eq. 6. The percent increase in flatfish bycatch for a one fathom increase in depth is 1.3%.
In 2012, the nature of the relationship with depth changed. The depth-bycatch relationship was statistically different in each month and overall, as indicated by the significant interaction effect (Table 73). However, the relationship was significantly positive in only one (August) out of the seven months in 2012 (Table 74; Figure 61).
Flatfish: Latitude Latitude was used as a measure of fishing location off the coast. In 2011 most of the fishing occurred north of the Columbia River plume, but there were 76 tows with flatfish bycatch south of the plume in October (Table 75) using excluder devices with the 0.75 in. and 0.875 in. bar-spacing (Table 76). There was no apparent difference in flatfish bycatch between locations fished north and south of the plume (Figure 62).
In the 2011 fishery, data on flatfish bycatch ratios indicated that the interaction between month and latitude was significant for tows north of the plume. This may be an artifact of the strong month effect observed in 2011 as the effect of latitude alone was not significant (Table 77). Changes in the bycatch of flatfish for a half of a degree increase were calculated for the regression relationship in each month using Eq. 7. The large percent changes in flatfish bycatch per change in latitude observed in April, July, and August are artifacts of a very steep slope over a narrow range of values (Table 78; Figure 63). This also could account for the significant interaction between latitude and month. Under these conditions, small perturbations in the value

Shrimp Trawl Operations and Bycatch of Eulachon Smelt, Rockfish, and Flatfish 48
of latitude will produce vastly different estimates. Further, for these months, a 0.5 degree increase in latitude is predicting beyond the range of the data. Although percent changes seem large for the months of May, June, and October, in terms of absolute differences in flatfish bycatch per 10,000 pounds of shrimp, they are less than 2 pounds. In the months with a wider range of latitude, the relationship was not significant (Table 78; Figure 63).
All tows included in the analysis in 2012 were conducted north of the Columbia River plume, and were significantly different among months as indicated by a significant interaction effect (Table 79). The range of latitudes fished was wider than observed in 2011. Relationships between latitude and depth were significant in four out of the seven months. Three of months with significant relationships had decreasing flatfish bycatch with increasing latitude (Table 80; Figure 64). The steep increasing slope in October was not significant, owing to the narrow range of latitudes fished in that month. Again, for the October data, an increase in 0.5 degrees latitude is beyond the range of the data. The 784.4% increase in bycatch in May equates to about a 210 pound increase in flatfish bycatch for a half of a degree increase in latitude north per 10,000 pounds shrimp. All other changes are less than 6 pounds per 10,000 pounds shrimp.
Flatfish: Tow Time The average time per tow was approximately 100 minutes. In 2011, there was no significant interaction between tow time and month (Table 81) and the overall time-flatfish bycatch relationship was significant and approximately the same across all months (Table 82; Figure 65). The percent change in flatfish bycatch on the original scale for a 30 minute increase in tow time was calculated by Eq. 8 as a 20% decrease, or approximately between 300 and 500 pounds less of flatfish bycatch per 10,000 pounds of shrimp, depending on the month.
Tow time-bycatch relationships were consistently negative across months fished in 2012 with the exception of April (Table 82; Figure 66). The strongly increasing slope estimated for April is most likely driving the significant interaction. In other months with a slope significantly different from zero, the relationship was negative with decreasing flatfish bycatch and increasing tow time. The strong positive relationship in April translates to a 94.1% increase in flatfish bycatch with a 30 minute increase in tow time (Table 83), or an increase in flatfish bycatch of 15 pounds per 10,000 pounds shrimp. All other changes represent a decrease in 3 pounds at the most.
Summary of Linear Mixed Effects Modelling Bycatch Analysis Differences between 2011 and 2012 with regard to fishing effort, the amount of shrimp and bycatch encountered, and gear types fished, prevent analyzing the data in a single analysis. The effects of different excluder sizes on bycatch for eulachon, rockfish, and flatfish were only possible with the 2011 data. Because vessels tended to fish one gear type only, analysis of gear effects was confounded by differences in fishing among vessels, and an uneven dispersal of gear types fished in each month. It was not possible to separate what effect gear had independent of

Shrimp Trawl Operations and Bycatch of Eulachon Smelt, Rockfish, and Flatfish 49
vessel. Differences among months in the amount of bycatch encountered could only be looked at by restricting the analysis to a couple of gear types. Despite these difficulties in analyzing the 2011 data, there were a few results that were conclusive. The 2012 data did not have these issues as only the 0.75 in. excluder device was fished.
In the 2011 fishery, the 0.75 in. and 0.875 in. gear types had the lowest bycatch for eulachon, rockfish, and flatfish. The 0.875 in. spacing was lower in bycatch encountered than the 0.75 in. spacing; however, regulation changes in 2012 meant that only the 0.75 in. spacing was fished. The effect of month could only be analyzed using the smaller gear types in 2011. Eulachon bycatch was highest in April and May and lowest during July and August. Rockfish bycatch was highest in October and about equal across all other months. Flatfish bycatch was highest in July. In 2012, April and May had the highest bycatch for eulachon and flatfish. October had the lowest eulachon bycatch. There was no difference in rockfish bycatch across months.
Among the continuous predictors (effects) of time, depth, and latitude, the most consistent relationship was with tow time. There was a consistent negative relationship between the time each device was fished and bycatch. Increases in tow time had a decreased bycatch. However, this could be due to a low shrimp abundance requiring a longer tow time. High pink shrimp abundance, and a large concentration of all species, could be associated with short tow times because nets fill faster. The effect of depth differed depending on the month fished. In general, bycatch of eulachon and rockfish increased with depth in 2011, while flatfish bycatch decreased with fishing depth. In 2012, there was a consistent increase in bycatch with an increase in depth. Although analytical results showed significant relationships between bycatch and latitude, these results should be approached with caution as the range of the latitude fished was small in the analysis.
Shrimp being dumped from the codend of the net into the hopper on deck.

Shrimp Trawl Operations and Bycatch of Eulachon Smelt, Rockfish, and Flatfish 50
Biological sampling
Eulachon A total of 3,311 eulachon were sampled for length; due to reduced observer coverage and larger amounts of bycatch, fewer were collected in 2012 (n = 956) than 2011 (n = 2355). Sample sizes by month varied due to fewer numbers of active vessels in the early and latter parts of the season. Both total and fork lengths were measured but fork length data were used for analysis. Fork length was calculated from total length when the former data were missing. The total to fork length conversion factor was derived from study data (Figure 67). For frequency plots, length data are pooled in two millimeter increments. Overall, eulachon length ranged from 74 mm to 231 mm during the two years of observation. The ranges for 2011 and 2012 were essentially identical, yet the modes for each year were distinctly different (Figure 68 and Figure 69). The median length in 2011 was 181 mm compared to a median of 127 mm in 2012. Within year variation was low with mean lengths of 178 mm and 128 mm nearly equal to the medians for 2011 and 2012, respectively. Monthly length frequency plots for each year are consistent with annual distribution: Figures 70 through 76 show eulachon length frequency data collected on approximately the same date(s) each month for each year. The bimodal distribution of length frequency data in 2011, although weak, suggests the presence of two age classes, where only one is evident in 2012. Despite sample size variations between years and across months, in both years median length generally trended up from April to October pointing to intra-annual growth (Figure 77 and Figure 78). The DFO evaluates eulachon length frequency data from the WCVI shrimp trawl fishery from approximately one date from late April and early May across years. To facilitate comparison, study eulachon length frequency data from April and May were computed as standard lengths and presented in a similar manner (Figure 79 and Figure 80). The 2011 WCVI distribution peaked at about 110 mm and 168 mm, corresponding to modes at 110 mm and 114 mm in our study. The WCVI data from 2012 was bimodal with peaks at about 104 mm and 176 mm; this contrasts with the single mode from 2012 in the Washington fishery at 102 mm. Spatially, no length trends are apparent. Mean length frequencies pooled by ODFW management area for each year reflect only the annual difference in size distribution (Figure 81 and Figure 82). Study eulachon (n = 3290) were sampled from tows ranging in depth from 104 m to 182 m. For each tow, start and end depth were recorded. As fewer than 10% of the tows had start and end depths that differed by more than 9 m, mean tow depth was calculated and used to evaluate

Shrimp Trawl Operations and Bycatch of Eulachon Smelt, Rockfish, and Flatfish 51
length distribution and tow depth. No significant difference in eulachon size by tow depth is evident in either year (Figure 83 and Figure 84). Likewise, no apparent size distribution differences were evident in comparisons by BRD bar-spacing. Although not required by rule until 2012, several vessels had already installed BRDs with bars spaced at 0.75 in. (19.1 mm) in 2011. Median length frequency for these vessels was 180 mm in 2011 and 126 mm in 2012 or essentially the same as the fleet median in each year (Figure 85 and Figure 86). The outcome is similar when comparing narrower and wider bar-spacing of 0.75 in (19.1 mm) and 1.25 in. (31.8 mm; Figure 87). Hannah et al. (2011) found no difference in eulachon mean total length between grates with 0.75 in. (19.1 mm) and 1.0 in. (25.4 mm) bar-spacing. In Hannah’s study, observed reductions in eulachon bycatch with the 0.75 in. (19.1 mm) bar-spacing were attributed to greater efficiency to exclude eulachon overall and not to selective exclusion of larger eulachon. Our results, spanning varying differences in bar-spacing found in the fleet, also suggest that eulachon are not excluded only on the basis of fish length. Determination of eulachon ages poses challenges due to overlapping age at size and otolith versus scale aging method discrepancies (Hay and McCarter 2000); no method has been validated (Scweigert et al. 2012). Ageing conventions based on standard length have been developed and are used by DFO; under this scheme age 1+ range from 60-130 mm, age 2+ range from 100-180 mm and age 3+ range from 140-200 mm. Applying this scheme, age 1+ and age 2+ fish were present in the Washington fishery in 2011, whereas age 1+ were predominant in 2012.
Rockfish During the study, only juvenile rockfish were observed in the codend. Individual rockfish observed in 2011 ranged in size from about 70 mm to 130 mm, except greenstripe rockfish which were fairly easily distinguished and ranged in size from about 100 mm to 200 mm. Representative specimens were collected and brought in for cursory laboratory evaluation and identification. However, routine onboard species identification and biological sampling were not conducted due to the difficulty inherit in ascertaining species at juvenile stages (Butler et al. 2012). No rockfish lengths were collected in 2012 due to time constraints and species identification issues. Moreover, it is challenging for a short-term project to recruit or train observers with the necessary skills.

Shrimp Trawl Operations and Bycatch of Eulachon Smelt, Rockfish, and Flatfish 52
Two juvenile rockfish collected during study, 2011.
Flatfish In total, 1261 flatfish were sampled for length in 2011; the number of flatfish sampled in 2012 was insufficient to be meaningful. Five species were sampled for fork length: arrowtooth flounder, dover sole, flathead sole, rex sole, and slender sole. Figures 88-92 present length frequency histograms for each. Arrowtooth flounder lengths ranged from 13.7 cm to 56.5 cm with a mean length of 35.1 cm (Figure 88). Arrowtooth flounder off Oregon were found to be 50 percent mature at lengths of 28 cm and 43 cm for males and females respectively (Hosie 1976). Dover sole lengths ranged from 14.6 cm to 47.7 cm with a mean length of 30.7 cm (Figure 89). Hagerman (1952) determined a mean length at 50 percent maturity for dover sole off California to be 32 cm and 35 cm for males and females respectively. By comparison, flatfish sampled by WDFW biologists from commercial groundfish trawl landings of arrowtooth flounder and dover sole in 2011 and 2012 averaged 54 cm for arrowtooth and 42 cm for dover. Flathead sole lengths ranged from 9.5 cm to 58 cm with a mean length of 26.7 cm (Figure 90). 50 percent maturity length for female flathead sole in the eastern Bering Sea was found to be

Shrimp Trawl Operations and Bycatch of Eulachon Smelt, Rockfish, and Flatfish 53
about 34 cm (TenBrink 2015). Rex sole lengths ranged from 7.5 cm to 35.5 cm with a mean length of 21.6 cm (Figure 90). Rex sole off Oregon were found to be 50 percent mature at lengths of 16 cm and 24 cm for males and females respectively (Hosie 1976). Mean slender sole length was 17.3 cm; lengths ranged from 7.8 cm to 30 cm (Figure 92).
Flathead sole: one of the species of flatfish encountered in the shrimp trawl fishery.

Shrimp Trawl Operations and Bycatch of Eulachon Smelt, Rockfish, and Flatfish 54
Conclusion The primary purpose of this study was to improve our understanding of the factors influencing eulachon bycatch in the Washington shrimp trawl fishery. Access to eulachon for biological and genetic sampling was also made possible. In the evaluation of bycatch, results from the study indicate a marked difference between the amounts of bycatch caught by excluders with smaller, sub-1 in. bar-spacing in the panel, compared to larger, or more than 1 in. bar-spacing. However, the analysis did not find a significant difference among the excluders with smaller bar-spacing. Among the smaller group, the middle sized excluder bar-spacing, 0.875 in., was associated with the lowest bycatch ratios. Gear effects other than bar-spacing may account for this result. The type of ground gear used may influence bycatch rates, as well as the height of the net off the bottom. Absolute and relative abundance of eulachon and pink shrimp will also influence results. Also, it should be noted that concurrent with the study, some skippers were actively evaluating gear performance to reduce bycatch. At least two vessels took advantage of the Pacific States Marine Fisheries underwater camera system loan program. In 2012, WDFW deployed a similar camera system on observed vessels. Dozens of hours of footage were recorded and viewed providing a first-time opportunity for fishers and managers to see the interaction between gear, shrimp, and fish. Based on these observations, skippers began testing and adopting different gear, e.g., rectangular excluder panel, and gear configurations, e.g., angle of excluder, orientation of escape hole, and size of escape hole. These efforts were not discouraged, although study results are likely confounded by some of the changes. Documenting these changes was also difficult given the rapidity of change. Of the changes, the most effective at reducing bycatch appears, at least anecdotally, to be increases in escape-hole size. A larger escape-hole could result in the excluder with slightly larger bar-spacing to out-perform an excluder with somewhat smaller bar-spacing. This, along with other gear configurations specific to each vessel, requires consideration when interpreting results. Other factors affecting bycatch ratios were variously significant across month, depth, and latitude. By month, April and October were associated with significantly different and higher bycatch ratios in 2011. In 2012, the bycatch ratios were significant and highest for May, and the lowest in October. This is consistent with observer impressions that bycatch overall is highest in the spring. Whereas the bycatch relationship with depth is statistically significant, it may not be biologically meaningful. Likewise, latitude and depth relationships were significant but inconsistent. Generally, spatial distribution results point to the co-occurrence of eulachon and pink shrimp.

Shrimp Trawl Operations and Bycatch of Eulachon Smelt, Rockfish, and Flatfish 55
Eulachon biological data were consistent with data from the WCVI shrimp trawl fishery and the understanding that for eulachon, the effectiveness of excluders is not solely related to fish size. Genetic samples were collected and, pending funding for analysis, could contribute further to our understanding of eulachon in the marine environment off the coast of Washington. Finally, and importantly, the analysis showed between-vessel differences in bycatch rates indicating the potential for improved fleet-wide performance. Considering the interest in eulachon recovery, it is reasonable to expect possible regulatory actions to further reduce bycatch; these actions might include time and/or area closures. Of these two approaches, reducing season length from the current fixed seven-months would be easier to monitor compliance and be simpler to evaluate impacts. Determining area closures and their impacts would be more difficult as eulachon “hot spots” could vary across years. The fishery and various bycatch species will benefit if early adopters of successful gears or strategies are in a position to share information and if others in the fleet are willing and/or able to follow their advice or guidance.

Shrimp Trawl Operations and Bycatch of Eulachon Smelt, Rockfish, and Flatfish 56
Figures
Fishery Description
Figure 1. Washington pink shrimp landings in millions of pounds, 1970-2013.
0
2
4
6
8
10
12
14
16
18
20
1970
1973
1976
1979
1982
1985
1988
1991
1994
1997
2000
2003
2006
2009
2012
Landings (Pounds_Millions)

Shrimp Trawl Operations and Bycatch of Eulachon Smelt, Rockfish, and Flatfish 57
Figure 2. Number of active vessels, 1970-2013.
Figure 3. Direct fishery value in millions of dollars, 1970-2013.
0
20
40
60
80
100
120
140
160
180
2001970
1973
1976
1979
1982
1985
1988
1991
1994
1997
2000
2003
2006
2009
2012
Number Active Vessels
0
2
4
6
8
10
12
1970
1973
1976
1979
1982
1985
1988
1991
1994
1997
2000
2003
2006
2009
2012
Direct Fishery Value_Millions ($)

Shrimp Trawl Operations and Bycatch of Eulachon Smelt, Rockfish, and Flatfish 58
Figure 4. Stylized schematic of a pink shrimp trawl net with “ladder” style groundgear. This net is configured from the front and is not to scale; all measurements are approximations (Hannah 2011).
Figure 5. Stylized schematic of a pink shrimp trawl net without a ground line, but with a “tickle chain.” This net is configured from the front and is not to scale; all measurements are approximations (Hannah 2011).

Shrimp Trawl Operations and Bycatch of Eulachon Smelt, Rockfish, and Flatfish 59
Figure 6. Stylized schematic of fishing net with BRD and escape hole, showing how fish enter net and can escape prior to entering the cod end (Doyle and Hildenbrand 2013).
Figure 7. Biological reduction device (BRD) bar spacing. Measurement made from edges of neighboring bars.
x inches
solid bar
solid bar
solid bar
solid bar

Shrimp Trawl Operations and Bycatch of Eulachon Smelt, Rockfish, and Flatfish 60
Methods
Figure 8. Stylized map showing Oregon Dept. of Fish and Wildlife pink shrimp areas versus Washington Dept. of Fish and Wildlife marine fish/shellfish areas.

Shrimp Trawl Operations and Bycatch of Eulachon Smelt, Rockfish, and Flatfish 61
Results and Discussion
Fishery Catches and Effort
Figure 9. Annual pink shrimp landings (pounds) and number of active vessels, 1990 – 2013.
Figure 10. Annual percent of total Washington landings by combined WDFW Marine Fish Shellfish Fish Ticket Areas: WA North (58A-59A2), WA South (60A-60A2), and Oregon/California.
0
10
20
30
40
50
60
70
80
90
100
0
2
4
6
8
10
12
14
16
18
90 91 92 93 94 95 96 97 98 99 00 01 02 03 04 05 06 07 08 09 10 11 12 13
Number of Vessels
Pounds (millions)
Pink Shrimp Pounds Number of active vessels
0%
10%
20%
30%
40%
50%
60%
70%
80%
90%
100%
1991
1993
1995
1997
1999
2001
2003
2005
2007
2009
2011
2013
Percent of Total A
nnual Landings
North Coast (58A‐59A2) South coast 60A‐60A2) Oregon/California

Shrimp Trawl Operations and Bycatch of Eulachon Smelt, Rockfish, and Flatfish 62
Figure 11. Monthly Washington pink shrimp landings by ODFW management area in 2011.
Figure 12. Monthly Washington pink shrimp landings by ODFW management area in 2012.
Apr M
ay Jun Ju
l
Aug S
ep Oct0
500,000
1,000,000
1,500,000
2,000,000
Apr M
ay Jun Ju
l
Aug S
ep Oct0
500,000
1,000,000
1,500,000
2,000,000

Shrimp Trawl Operations and Bycatch of Eulachon Smelt, Rockfish, and Flatfish 63
Figure 13. Monthly Washington CPUE grouped by ODFW management area in 2011.
Figure 14. Monthly Washington CPUE grouped by ODFW management area in 2012.
Apr M
ay Jun Ju
l
Aug S
ep Oct0
1,000
2,000
3,000
4,000
5,000
Apr M
ay Jun Ju
lA
ug Sep O
ct0
1,000
2,000
3,000
4,000
5,000

Shrimp Trawl Operations and Bycatch of Eulachon Smelt, Rockfish, and Flatfish 64
Bycatch Evaluation
Figure 15. Eulachon CPUE (a) and bycatch ratios (b) across 2011 and 2012.
a b

Shrimp Trawl Operations and Bycatch of Eulachon Smelt, Rockfish, and Flatfish 65
Linear Mixed Effects Modelling: Analysis of Factors Effecting Bycatch of Eulachon, Rockfish and Flatfish
Eulachon
Figure 16. Density plots of bycatch ratios of eulachon for each of the vessels observed in 2011.
Figure 17. Density plots of the natural logarithm of bycatch ratios of eulachon for each of the vessels observed in 2011.
Bycatch Ratio
Fre
quency
0.00 0.10 0.20
2 3
0.00 0.10 0.20
6
7 9 10
11
0.00 0.10 0.20
14 15
log(Bycatch) Ratio
Fre
qu
ency
-10 -5 0
2 3
-10 -5 0
6
7 9 10
11
-10 -5 0
14 15

Shrimp Trawl Operations and Bycatch of Eulachon Smelt, Rockfish, and Flatfish 66
Figure 18. Density plots of the natural logarithm of bycatch ratios of eulachon for each of the vessels observed in 2011.
Figure 19. Density plots of the natural logarithm of bycatch ratios of eulachon for each of the vessels observed in 2012.
Bycatch Ratio
Fre
quency
0.0 0.4 0.8
1 4
0.0 0.4 0.8
5 7
0.0 0.4 0.8
8
9 10 11 12 13
14
0.0 0.4 0.8
15 16
log(Bycatch) Ratio
Fre
quency
-10 -6 -4 -2 0 2
1 4
-10 -6-4 -2 0 2
5 7
-10 -6 -4-2 0 2
8
9 10 11 12 13
14
-10 -6-4 -2 0 2
15 16

Shrimp Trawl Operations and Bycatch of Eulachon Smelt, Rockfish, and Flatfish 67
Eulachon: Vessel, Gear, and Month - 2011
Figure 20. A dot plot of the difference from the mean overall logarithm of bycatch for each vessel observed in 2011.
Figure 21. Boxplots of the natural logarithm of the bycatch ratio of eulachon for month fished in 2011.
6
11
2
9
14
7
15
3
10
-1 0 1 2
Difference from mean bycatch
Apr
il
May
June
July
Aug
ust
Sep
tem
ber
Oct
ober
-12
-10
-8
-6
-4
log(
Byc
atch
rat
io)
Eul
acho
n

Shrimp Trawl Operations and Bycatch of Eulachon Smelt, Rockfish, and Flatfish 68
Figure 22. Boxplots of the natural logarithm of eulachon bycatch ratios by excluder size used in the 2011 pink shrimp fishery.
Figure 23. Interaction plot of the effects of gear (excluder bar-spacing) and month on the natural logarithm of eulachon bycatch. If no interactions were present, the line would be parallel.
0.75 0.875 1 1.25 1.75
-12
-10
-8-6
-4
Bar Spacing (inches)
log(
Byc
atch
rat
io)
Eul
acho
n
-9-8
-7-6
Month
log
(Byc
atc
h R
atio
) E
ula
cho
n
June July August
Bar Spacing0.750.8751.251.5

Shrimp Trawl Operations and Bycatch of Eulachon Smelt, Rockfish, and Flatfish 69
Figure 24. Interaction plot of gear types, 0.75 and 0.875, by month for the natural logarithm of eulachon bycatch. The increased bycatch in October for the 0.875 bar-spacing is most likely the reason for the significant interaction. No interaction effect is typically indicated by parallel, or nearly parallel lines.
Eulachon: Vessel and Month – 2012
Figure 25. Differences from mean eulachon bycatch for the 13 vessels with observers that fished in 2012 and were included in this analysis.
-9.0
-8.0
-7.0
-6.0
Month
log(B
ycatc
h R
atio
) E
ula
chon
May
June
July
August
Oct
ober
Bar Spacing0.750.875
12
11
14
8
15
7
5
13
4
9
1
16
10
-2 -1 0 1
Difference from mean bycatch

Shrimp Trawl Operations and Bycatch of Eulachon Smelt, Rockfish, and Flatfish 70
Figure 26. Boxplots of the distribution of eulachon bycatch ratios for each month fished in 2012. May had the highest ratios, April and October the lowest.
Eulachon: Depth, Latitude, and Tow Time – 2011 and 2012
Figure 27. Relationships between depth in fathoms and log (bycatch ratio) for each month in 2011. The difference among months indicates a significant interaction effect.
Apr
il
May
June
July
Aug
ust
Sep
tem
ber
Oct
ober
-8
-6
-4
-2
0lo
g(B
ycat
ch r
atio
) E
ulac
hon
Depth (fathoms)
log
(B
yca
tch
Ra
tio)
-12
-10
-8
-6
-4
60 70 80 90 100
April May
60 70 80 90 100
June
July
60 70 80 90 100
August
-12
-10
-8
-6
-4
October

Shrimp Trawl Operations and Bycatch of Eulachon Smelt, Rockfish, and Flatfish 71
Figure 28. Relationships between depth in fathoms and log (eulachon bycatch ratio) for each month in 2012. The difference among months indicates a significant interaction effect.
Figure 29. Boxplot of the natural logarithm of eulachon bycatch ratios for tows fished north and south of the Columbia River plume.
Depth
log
(B
yca
tch
Ra
tio)
-10
-8
-6
-4
-2
0
20 40 60 80 100
April May
20 40 60 80 100
June
July August
-10
-8
-6
-4
-2
0September
-10
-8
-6
-4
-2
0October
North South
-12
-8-6
-4
Latitude
log(
Byc
atch
rat
io)
Eul
acho
n

Shrimp Trawl Operations and Bycatch of Eulachon Smelt, Rockfish, and Flatfish 72
Figure 30. Relationships between fishing location as measured by latitude and log (eulachon bycatch ratio) for each month in 2012. The difference in slopes among months indicates a significant interaction effect.
Figure 31. Relationships between tow time and log (eulachon bycatch ratio) for each month in 2012. The difference in slopes among months indicates a significant interaction effect.
Latitude
log
(B
yca
tch
Ra
tio)
-10
-8
-6
-4
-2
0
45.5 46.5 47.5
April May
45.5 46.5 47.5
June
July August
-10
-8
-6
-4
-2
0September
-10
-8
-6
-4
-2
0October
Tow Time (minutes)
log
(Byc
atc
h R
atio
)
-10
-8
-6
-4
-2
0
0 100 200 300 400
April May
0 100 200 300 400
June
July August
-10
-8
-6
-4
-2
0September
-10
-8
-6
-4
-2
0October

Shrimp Trawl Operations and Bycatch of Eulachon Smelt, Rockfish, and Flatfish 73
Rockfish
Figure 32. Density plots of bycatch ratios of rockfish for each tow by the vessels with observed rockfish catch in the 2011 fishery.
Figure 33. Density plots of the natural logarithm of bycatch ratios of rockfish for each tow by the vessels with observed rockfish catch in the 2011 fishery.
Bycatch Ratio
Fre
qu
en
cy
0.000.100.20
1 2
0.000.100.20
3 6
7 9 10 11
14
0.000.100.20
15
log(Bycatch) Ratio
Fre
que
ncy
-15 -10 -5 0
1 2
-15 -10 -5 0
3 6
7 9 10 11
14
-15 -10 -5 0
15

Shrimp Trawl Operations and Bycatch of Eulachon Smelt, Rockfish, and Flatfish 74
Figure 34. Density plots of bycatch ratios of rockfish for each tow by the vessels with observed rockfish catch in the 2012 fishery.
Figure 35. Density plots of the natural logarithm of bycatch ratios of rockfish for each tow by the vessels with observed rockfish catch in the 2012 fishery.
Bycatch Ratio
Fre
qu
en
cy
0.00 0.10
1 3
0.00 0.10
4 5
0.00 0.10
7
8 9 10 11 12
13
0.00 0.10
14 15
0.00 0.10
16
log(Bycatch) Ratio
Fre
que
ncy
-10 -5
1 3
-10 -5
4 5
-10 -5
7
8 9 10 11 12
13
-10 -5
14 15
-10 -5
16

Shrimp Trawl Operations and Bycatch of Eulachon Smelt, Rockfish, and Flatfish 75
Rockfish: Vessel, Gear, and Month – 2011
Figure 36. A dot plot of the difference from the mean overall logarithm of rockfish bycatch for each vessel observed in 2011.
Figure 37. Boxplots of the natural logarithm of the bycatch ratio of rockfish for month fished in 2011.
2
14
10
9
6
11
1
3
7
15
-3 -2 -1 0 1 2
Difference from mean log(Bycatch Ratio)
Apr
il
May
June
July
Aug
ust
Sep
tem
ber
Oct
ober
-12
-10
-8
-6
-4
-2
log(
Byc
atch
Rat
io)
Roc
kfis
h

Shrimp Trawl Operations and Bycatch of Eulachon Smelt, Rockfish, and Flatfish 76
Figure 38. Boxplots of the natural logarithm of bycatch ratio of rockfish by excluder size used in the 2011 pink shrimp fishery.
Figure 39. Interaction plot of the effects of gear (excluder bar-spacing) and month on the natural logarithm of rockfish bycatch. If no interactions were present, the line would be parallel.
0.75 0.875 1 1.25 1.75
-12
-10
-8-6
-4-2
Bar Spacing (inches)
log(
Byc
atch
Rat
io)
Roc
kfis
h

Shrimp Trawl Operations and Bycatch of Eulachon Smelt, Rockfish, and Flatfish 77
Figure 40. Interaction plot of gear type by month. No interaction effect is typically indicated by parallel, or nearly parallel lines.
Rockfish: Vessel and Month – 2012
Figure 41. Differences from mean rockfish bycatch for the 13 vessels with observers that fished in 2012 and were included in this analysis.
-11
-10
-9-8
-7
Month
log(
Byc
atch
Rat
io)
Roc
kfis
h
May
June
July
Aug
ust
Oct
ober
Bar Spacing0.750.875
13
14
1
12
9
10
8
15
7
16
11
5
4
-1 0 1
Difference from mean bycatch ratio Rockfish

Shrimp Trawl Operations and Bycatch of Eulachon Smelt, Rockfish, and Flatfish 78
Figure 42. Boxplots of the distribution of bycatch ratios for each month fished in 2012. May had the highest ratios, April and October the lowest.
Rockfish: Depth
Figure 43. Relationships between depth in fathoms and log (rockfish bycatch ratio) for each month in 2011. The difference among months indicates a significant interaction effect.
Apr
il
May
June
July
Aug
ust
Sep
tem
ber
Oct
ober
-12
-10
-8
-6
-4
-2lo
g(B
ycat
ch r
atio
) R
ockf
ish
Depth (fathoms)
log
(B
yca
tch
Rat
io)
-12
-10
-8
-6
-4
60 70 80 90 100
April May
60 70 80 90 100
June
July
60 70 80 90 100
August
-12
-10
-8
-6
-4
October

Shrimp Trawl Operations and Bycatch of Eulachon Smelt, Rockfish, and Flatfish 79
Figure 44. Relationships between depth in fathoms and log (rockfish bycatch ratio) for each month in 2012. The difference among months indicates a significant interaction effect.
Rockfish: Latitude
Figure 45. Boxplot of the natural logarithm of rockfish bycatch ratios for tows fished north and south of the Columbia River plume.
Depth
log
(B
yca
tch
Ra
tio)
-12
-10
-8
-6
-4
-2
20 40 60 80
April May
20 40 60 80
June
July August
-12
-10
-8
-6
-4
-2September
-12
-10
-8
-6
-4
-2October

Shrimp Trawl Operations and Bycatch of Eulachon Smelt, Rockfish, and Flatfish 80
Figure 46. Relationships between fishing location as measured by latitude and log (bycatch ratio) for each month in 2012. The difference in slopes among months indicates a significant interaction effect.
Figure 47. Relationships between tow time and log (rockfish bycatch ratio) for each month in 2011. Slopes were consistent across all months but October, indicating a non-significant interaction between month and tow time.
Latitude
log (B
ycatc
h R
atio
)
-12
-10
-8
-6
-4
-2
45.5 46.5 47.5
April May
45.5 46.5 47.5
June
July August
-12
-10
-8
-6
-4
-2September
-12
-10
-8
-6
-4
-2October
Time (minutes)
log (B
ycatc
h R
atio
)
-12
-10
-8
-6
-4
0 50 100150200250
April May
0 50 100150200250
June
July
0 50 100150200250
August
-12
-10
-8
-6
-4
October

Shrimp Trawl Operations and Bycatch of Eulachon Smelt, Rockfish, and Flatfish 81
Figure 48. Relationships between tow time and log (rockfish bycatch ratio) for each month in 2012. The difference in slopes among months indicates a significant interaction effect.
Flatfish
Figure 49. Density plots of bycatch ratios of flatfish for each tow by the vessels with observed flatfish catch in the 2011 fishery.
Tow Time (minutes)
log
(Byc
atc
h R
atio
)
-12
-10
-8
-6
-4
-2
50 100 150200 250
April May
50 100150200 250
June
July August
-12
-10
-8
-6
-4
-2September
-12
-10
-8
-6
-4
-2October
Bycatch Ratio
Fre
qu
en
cy
0.0 0.2 0.4
1 2
0.0 0.2 0.4
3 6
7 9 10 11
14
0.0 0.2 0.4
15

Shrimp Trawl Operations and Bycatch of Eulachon Smelt, Rockfish, and Flatfish 82
Figure 50. Density plots of the natural logarithm of bycatch ratios of flatfish for each tow by the vessels with observed flatfish catch in the 2011 fishery.
Figure 51. Density plots of bycatch ratios of flatfish for each tow by the vessels with observed flatfish catch in the 2012 fishery.
log(Bycatch Ratio)
Fre
quency
-15 -10 -5 0
1 2
-15 -10 -5 0
3 6
7 9 10 11
14
-15 -10 -5 0
15
Bycatch Ratio
Fre
qu
en
cy
0.0 0.2 0.4 0.6 0.8 1.0
1 4
0.0 0.2 0.4 0.6 0.8 1.0
5
7 8 9
10 11 12
13 14 15
16

Shrimp Trawl Operations and Bycatch of Eulachon Smelt, Rockfish, and Flatfish 83
Figure 52. Density plots of bycatch ratios of flatfish for each tow by the vessels with observed flatfish catch in the 2012 fishery.
Flatfish: Vessel, Gear, and Month – 2011
Figure 53. A dot plot of the difference from the mean overall logarithm of flatfish bycatch for each vessel observed in 2011.
log(Bycatch Ratio)
Fre
quency
-15 -10 -5 0
1 4
-15 -10 -5 0
5
7 8 9
10 11 12
13 14 15
16
2
14
6
9
11
10
3
1
7
15
-3 -2 -1 0 1 2
Difference from mean log(Bycatch Ratio) Flatfish species

Shrimp Trawl Operations and Bycatch of Eulachon Smelt, Rockfish, and Flatfish 84
Figure 54. Boxplots of the natural logarithm of the bycatch ratio of flatfish for month fished in 2011.
Figure 55. Boxplots of the natural logarithm of bycatch ratio of flatfish by excluder size used in the 2011 pink shrimp fishery.
Apr
il
May
June
July
Aug
ust
Sep
tem
ber
Oct
ober
-12
-10
-8
-6
-4
-2
log(B
ycatc
h R
atio
) F
latfis
h
0.75 0.875 1 1.25 1.75
-12
-10
-8-6
-4-2
Bar Spacing (inches)
log(
Byc
atch
Rat
io)
Fla
tfis
h

Shrimp Trawl Operations and Bycatch of Eulachon Smelt, Rockfish, and Flatfish 85
Figure 56. Interaction plot of the effects of gear (excluder bar-spacing) and month on the natural logarithm of flatfish bycatch. If no interactions were present, the lines would be parallel.
Figure 57. Interaction plot of gear type by month. No interaction effect is typically indicated by parallel, or nearly parallel lines.
-8.0
-7.0
-6.0
Month
log(
Byc
atch
Rat
io)
Fla
tfis
h
June July August
Bar Spacing0.750.8751.251.5
-10
-9-8
-7-6
Month
log(
Byc
atch
Rat
io)
Fla
tfis
h
May June July August October
Bar Spacing0.750.875

Shrimp Trawl Operations and Bycatch of Eulachon Smelt, Rockfish, and Flatfish 86
Flatfish: Vessel and Month – 2012
Figure 58. Differences from mean flatfish bycatch for the 13 vessels with observers that fished in 2012 and were included in this analysis.
Figure 59. Boxplots of the distribution of flatfish bycatch ratios for each month fished in 2012. May had the highest ratios, April and October the lowest.
12
14
11
15
9
1
13
8
16
5
4
10
7
-2 -1 0 1
Difference from mean bycatch ratio Flatfish
Apr
il
May
June
July
Aug
ust
Sep
tem
ber
Oct
ober
-12
-10
-8
-6
-4
-2
0
log(
Byc
atch
rat
io)
Fla
tfis
h

Shrimp Trawl Operations and Bycatch of Eulachon Smelt, Rockfish, and Flatfish 87
Flatfish: Depth, Latitude, and Tow Time
Figure 60. Relationships between depth in fathoms and log (flatfish bycatch ratio) for each month in 2011. The difference among months indicates a significant interaction effect.
Figure 61. Relationships between depth in fathoms and log (flatfish bycatch ratio) for each month in 2012. The difference among months indicates a significant interaction effect.
Depth (fathoms)
log
(Byc
atch
Ra
tio)
-12
-10
-8
-6
-4
-2
60 70 80 90 100
April May
60 70 80 90 100
June
July
60 70 80 90 100
August
-12
-10
-8
-6
-4
-2
October
Depth
log
(B
yca
tch
Ra
tio)
-10
-5
0
20 40 60 80 100
April May
20 40 60 80 100
June July
August
20 40 60 80 100
September
-10
-5
0October

Shrimp Trawl Operations and Bycatch of Eulachon Smelt, Rockfish, and Flatfish 88
Flatfish: Latitude
Figure 62. Boxplot of the natural logarithm of bycatch ratios for tows fished north and south of the Columbia River plume.
Figure 63. Relationships between fishing location as measured by latitude and log of flatfish bycatch ratios for each month in 2011. The difference in slopes among months indicates a significant interaction effect.
North South
-12
-10
-8-6
-4-2
Latitude
log(
Byc
atch
rat
io)
Fla
tfis
h
Latitude
log(B
ycatc
h R
atio
)
-12
-10
-8
-6
-4
46.0 47.0 48.0
April May
46.0 47.0 48.0
June
July
46.0 47.0 48.0
August
-12
-10
-8
-6
-4
October

Shrimp Trawl Operations and Bycatch of Eulachon Smelt, Rockfish, and Flatfish 89
Figure 64. Relationships between fishing location as measured by latitude and log (flatfish bycatch ratio) for each month in 2012. The difference in slopes among months indicates a significant interaction effect.
Flatfish: Tow Time
Figure 65. Relationships between tow time and log (flatfish bycatch ratio) for each month in 2011. The difference in slopes among months indicates a significant interaction effect.
Latitude
log
(B
yca
tch
Ra
tio)
-10
-5
0
45.5 46.5 47.5
April May
45.5 46.5 47.5
June July
August
45.5 46.5 47.5
September
-10
-5
0October
Time (minutes)
log (B
ycatc
h R
atio
)
-12
-10
-8
-6
-4
-2
0 50 100150200250
April May
0 50 100150200250
June
July
0 50 100150200250
August
-12
-10
-8
-6
-4
-2
October

Shrimp Trawl Operations and Bycatch of Eulachon Smelt, Rockfish, and Flatfish 90
Figure 66. Relationships between tow time and log (bycatch ratio) for each month in 2012. The difference in slopes among months indicates a significant interaction effect
Biological Sampling
Eulachon
Figure 67. Eulachon total length to fork length (n = 2950), derived from study data, applied when only total length was recorded.
Tow Time (minutes)
log
(Byc
atc
h R
atio
)
-10
-5
0
0 100 200 300400
April May
0 100 200 300 400
June July
August
0 100200 300 400
September
-10
-5
0October
y = 0.8955x + 6.4864R² = 0.9609
0
50
100
150
200
250
0 50 100 150 200 250 300
For
k L
engt
h
Total Length

Shrimp Trawl Operations and Bycatch of Eulachon Smelt, Rockfish, and Flatfish 91
Figure 68. Eulachon length frequency for 2011 with fork length pooled in two millimeter increments.
Figure 69. Eulachon length frequency for 2011 with fork length pooled in two millimeter increments.
020406080
100120140160180
50 70 90 110 130 150 170 190 210 230
Fre
qu
ency
Length Bin (mm)
N= 2355
020406080
100120140160180
50 70 90 110 130 150 170 190 210 230
Fre
qu
ency
Length Bin (mm)
N = 956

Shrimp Trawl Operations and Bycatch of Eulachon Smelt, Rockfish, and Flatfish 92
Figure 70. Eulachon length frequency for April, fork length, mm.
Figure 71. Eulachon length frequency for May, fork length, mm.
0
20
40
50 70 90 110 130 150 170 190 210 230
April 2011
0
20
40
50 70 90 110 130 150 170 190 210 230
April 2012
0
20
40
50 70 90 110 130 150 170 190 210 230
May 2011
0
20
40
50 70 90 110 130 150 170 190 210 230
May 2012

Shrimp Trawl Operations and Bycatch of Eulachon Smelt, Rockfish, and Flatfish 93
Figure 72. Eulachon length frequency for June, fork length, mm.
Figure 73. Eulachon length frequency for July fork length, mm.
0
20
40
50 70 90 110 130 150 170 190 210 230
June 2011
0
20
40
50 70 90 110 130 150 170 190 210 230
June 2012
0
20
40
50 70 90 110 130 150 170 190 210 230
July 2011
0
20
40
50 70 90 110 130 150 170 190 210 230
July 2012

Shrimp Trawl Operations and Bycatch of Eulachon Smelt, Rockfish, and Flatfish 94
Figure 74. Eulachon length frequency for August, fork length, mm.
Figure 75. Eulachon length frequency for September, fork length, mm.
0
20
40
50 70 90 110 130 150 170 190 210 230
August 2011
0
20
40
50 70 90 110 130 150 170 190 210 230
August 2012
0
20
40
50 70 90 110 130 150 170 190 210 230
September 2011
0
20
40
50 70 90 110 130 150 170 190 210 230
September 2012

Shrimp Trawl Operations and Bycatch of Eulachon Smelt, Rockfish, and Flatfish 95
Figure 76. Eulachon length frequency for October, fork length, mm.
Figure 77. Eulachon median length frequency by month in 2011.
0
20
40
50 70 90 110 130 150 170 190 210 230
October 2011
0
20
40
50 70 90 110 130 150 170 190 210 230
October 2012
0
40
80
120
160
200
240
April May June July August September October

Shrimp Trawl Operations and Bycatch of Eulachon Smelt, Rockfish, and Flatfish 96
Figure 78. Eulachon median length frequency by month in 2012.
Figure 79. Eulachon length frequency for April-May, 2011, in standard length (mm), presented for comparison with DFO findings (DFO 2014).
0
40
80
120
160
200
240
April May June July August September October
0
5
10
15
20
25
30
35
40
50 70 90 110 130 150 170 190 210 230 250 270
Frequency
Length Bin (mm)

Shrimp Trawl Operations and Bycatch of Eulachon Smelt, Rockfish, and Flatfish 97
Figure 80. Eulachon length frequency for April-May 2012, in standard length (mm), presented for comparison with DFO findings (DFO 2014).
0
5
10
15
20
25
30
35
40
50 70 90 110 130 150 170 190 210 230 250 270
Frequency
Length Bin (mm)

Shrimp Trawl Operations and Bycatch of Eulachon Smelt, Rockfish, and Flatfish 98
Figure 81. Mean length frequencies pooled by ODFW management area for 2011.
Figure 82. Mean length frequencies pooled by ODFW management area for 2012.

Shrimp Trawl Operations and Bycatch of Eulachon Smelt, Rockfish, and Flatfish 99
Figure 83. Eulachon lengths by tow depth, in fathoms, in 2011.
Figure 84. Eulachon lengths by tow depth, in fathoms, in 2012.
y = 0.1799x + 164.85R² = 0.0046
0
50
100
150
200
250
50 60 70 80 90 100
For
k L
engt
h (
mm
)
Fathoms (mean of set and haul depths)
y = 0.1098x + 120.07R² = 0.0023
0
50
100
150
200
250
50 60 70 80 90 100
For
k L
engt
h (
mm
)
Fathoms (mean of set and haul depths)

Shrimp Trawl Operations and Bycatch of Eulachon Smelt, Rockfish, and Flatfish 100
Figure 85. Eulachon median length frequency by year.
Figure 86. Eulachon median length by BRD bar-spacing with 0.75 in. for both 2011 and 2012.
Figure 87. Eulachon median length by BRD spacing with 1.25 in. in 2011 and 0.75 in. in 2012.
0
40
80
120
160
200
240
2011 2012
0
40
80
120
160
200
240
2011 2012
0
40
80
120
160
200
240
2011 2012

Shrimp Trawl Operations and Bycatch of Eulachon Smelt, Rockfish, and Flatfish 101
Flatfish
Figure 88. Arrowtooth flounder fork length (mm) frequency, 2011.
Figure 89. Dover sole fork length (mm) frequency, 2011.
Figure 90. Flathead sole fork length (mm) frequency, 2011.
0
5
10
15
20
70
90
110
130
150
170
190
210
230
250
270
290
310
330
350
370
390
410
430
450
470
490
510
530
550
570
590
610
More
Frequency
Length bin (mm)
Arrowtooth Flounder
N=141
02468101214
70
90
110
130
150
170
190
210
230
250
270
290
310
330
350
370
390
410
430
450
470
490
510
530
550
570
590
610
More
Frequency
Length bin (mm)
Dover Sole
N=61
0
10
20
30
40
70
90
110
130
150
170
190
210
230
250
270
290
310
330
350
370
390
410
430
450
470
490
510
530
550
570
590
610
More
Frequency
Length bin (mm)
Flathead Sole
N=117

Shrimp Trawl Operations and Bycatch of Eulachon Smelt, Rockfish, and Flatfish 102
Figure 91. Rex sole fork length (mm) frequency, 2011.
Figure 92. Slender sole fork length (mm) frequency, 2011.
0
10
20
30
40
70
90
110
130
150
170
190
210
230
250
270
290
310
330
350
370
390
410
430
450
470
490
510
530
550
570
590
610
More
Frequency
Length bin (mm)
Rex Sole
N=316
0
20
40
60
80
100
120
70
90
110
130
150
170
190
210
230
250
270
290
310
330
350
370
390
410
430
450
470
490
510
530
550
570
590
610
More
Frequency
Length bin (mm)
Slender Sole
N=626

Shrimp Trawl Operations and Bycatch of Eulachon Smelt, Rockfish, and Flatfish 103
Tables
Methods Table 1. Crosswalk table of ODFW catch areas and WDFW marine fish-shellfish fish ticket catch area codes.
Table 2. Species encountered as bycatch and recorded by observers in 2011 and 2012.
Species Encountered
Scientific Name
Arrowtooth Flounder
Atheresthes stomias
Barracudinia Paralepididae (family)
Basket Star Gorgonocephalus
eucnemis Bluebarred prickleback
Plectobranchus evides
Box crab Lopholithodes spp.
Cephalopod (unspecified)
Cephalopoda (class)
Clam (unidentified) Bivalvia (class)
Species Encountered
Scientific Name
Cod (unidentified) Gadidae (family)
Crab (unidentified) Crustacean (subphylum)
Ctenophore (unidentified)
Ctenophora (phylum)
Darkblotched rockfish
Sebastes crameri
Decorator crab Loxorhynchus crispatus
Dover sole Microstomus pacificus
Dungeness crab Cancer magister
ODFW State area
Name Southern bound
(latitude) Northern Bound
(latitude) WDFW MFSF
Catch Area
12 Mendocino and south 38.83 40.5 62
18 Northern California 40.5 42 62
19 Rogue River 42 42.4334 61
20 Port Orford 42.4334 42.833 61
21 Bandon Bed 42.833 43.3 61
22 Mudhole 43.3 44.3 61
24 Cape Foulweather 44.3 45.05 61
26 Cape Lookout 45.05 45.76667 61
28 Tillamook Head 45.76667 46.225 61
29 Columbia River 46.225 46.6667 60A-2
30 Grays Harbor 46.6667 47.333 60A-2
32 Destruction Island 47.333 48.5 59A-2
33 North of DI 48.5 49 59A-1

Shrimp Trawl Operations and Bycatch of Eulachon Smelt, Rockfish, and Flatfish 104
Species Encountered
Scientific Name
Dwarf Wrymouth Cryptacanthodes
aleutensis Echinoid
(unidentified) Echinacea (superorder)
Eel (unidentified)
Eelpout (unspecified)
Zoarcidae (family)
English sole Pleuronectes vetulus
Eulachon Thaleichthys pacificua
Flatfish (unspecified)
Pleuronectiformes (order)
Flathead sole Hippoglossoides
elassodon Greenstriped
rockfish Sebastes elongates
Hagfish Myxinidae (family)
Invertebrate (unspecified)
Isopod (unidentified)
Isopoda (order)
Jellyfish (unidentified)
Cnidaria (phylum)
Lanternfish (unidentified)
Myctophidae (family)
Lingcod Ophiodon elongates
Longnose skate Raja rhina
Mackerel (unidentified)
Scombridae (family)
Moon Snail Naticidae (family)
Northern anchovy Engraulis mordax
Nudibranch (unidentified)
Nudibranchia (order)
Octopus (unidentified)
Octopoda (order)
Species Encountered
Scientific Name
Pacific argentine Argentina sialis
Pacific hake Merluccius productus
Pacific halibut Hippoglossus stenolepis
Pacific Herring Clupea pallasi
Pacific lamprey Entosphenus tridentatus
Pacific sanddab Citharichthys sordidus
Pacific sardine Sardinops sagax
Perch (unidentified)
Embiotocidae (family)
Petrale sole Eopsetta jordani
Plainfin midshipman
Porichthys notatus
Poacher (unspecified)
Agonidae (family)
Polychaete (unidentified)
Polychaeta (class)
Prickleback (unspecified)
Stichaeidae (family)
Rex sole Errex zachirus
Rockfish (unspecified)
Sebastidae (family)
Sablefish Anoplopoma fimbria
Sailfin sculpin Nautichthys
oculofasciatus
Sand Shrimp Neotrypaea
californiensis
Sandpaper skate Bathyraja interrupta
Scallop (unidentified)
Pectinidae (family)
Sculpin (unidentified)
Cottidae (family)

Shrimp Trawl Operations and Bycatch of Eulachon Smelt, Rockfish, and Flatfish 105
Species Encountered
Scientific Name
Sea anemone (unidentified)
Actiniaria (order)
Sea cucumber (unidentified)
Holothuroidea (class)
Sea star (unidentified)
Asteroidea (class)
Sea whip (unidentified)
Gorgonacea (family)
Seaweed (unidentified)
Shad Alosa sapidissima
Sharpchin rockfish Sebastes zacentrus
Shiner perch Cymatogaster aggregata
Skate (unidentified)
Rajidae (family)
Slender sole Eopsetta exilis
Smelt (unidentified)
Osmeridae (family)
Snail (unidentified) Gastropoda (class)
Snailfish (unidentified)
Cyclopteridae (family)
Spiny dogfish Squalus acanthias
Sponge (unidentified)
Porifera (phylum)
Spot shrimp Pandalus platycerous
Spotted cusk-eel Chilara taylori
Species Encountered
Scientific Name
Spotted ratfish Hydrolagus colliei
Spotted ratfish egg case
Squat lobster Munida quadrispina
Squid (unspecified) Ancistrocheiridae
(family) Stickleback
(unidentified) Gasterosteidae (family)
Striped nudibranch Armina californica
Surf perch Embiotocidae (family)
Thornyhead (unidentified)
Sebastolobus spp.
Threadfin sculpin Icelinus filamentosus
Tidepool snailfish Liparis florae
Walleye pollock Theragra
chalcogramma
Whitebait smelt Allosmerus elongatus
Whitebarred prickleback
Poroclinus rothtocki
Wrymouth (unidentified)
Cryptacanthodidae (family)
Yelloweye rockfish Sebastes ruberrimus
Yellowtail rockfish Sebastes flavidus

Shrimp Trawl Operations and Bycatch of Eulachon Smelt, Rockfish, and Flatfish 106
Results and Discussion Linear Mixed Effects Modelling: Analysis of Factors Effecting Bycatch of Eulachon, Rockfish and Flatfish Table 3. The number of observed tows for each vessel/month combination in the 2011 Washington pink shrimp fishery.
Vessel Number
Species Complex
2011
April May June July August September October Total
1
Eulachon Rockfish 8 8Flatfish 42 42
2
Eulachon 15 15Rockfish 7 7Flatfish 21 21
3
Eulachon 22 16 14 52Rockfish 45 23 18 86Flatfish 95 73 80 248
6
Eulachon 27 27Rockfish 48 48Flatfish 86 86
7
Eulachon 8 25 3 19 55Rockfish 8 23 3 27 61Flatfish 17 77 7 89 190
9
Eulachon 26 8 22 9 65Rockfish 9 1 22 14 46Flatfish 36 23 29 30 118
10
Eulachon 6 12 18Rockfish 4 17 21Flatfish 18 33 51
11
Eulachon 4 49 24 11 18 17 123Rockfish 4 53 3 19 39 17 135Flatfish 4 140 100 51 118 55 468
14
Eulachon 18 38 30 30 11 12 139Rockfish 18 33 29 3 2 9 94Flatfish 44 67 63 68 33 38 313
15
Eulachon 12 23 10 9 54Rockfish 12 44 1 16 73Flatfish 42 172 45 67 326
Total
Eulachon 22 95 145 103 121 18 44 548Rockfish 22 94 125 118 157 30 33 579Flatfish 48 224 431 469 480 97 114 1863

Shrimp Trawl Operations and Bycatch of Eulachon Smelt, Rockfish, and Flatfish 107
Table 4. The number of observed tows for each of the five gear types (excluder size) by vessel in the 2011 Washington pink shrimp fishery. Excluder size refers to the spacing between panel bars.
Vessel Number Species Complex
2011 Excluder Size (inches) 0.75 0.875 1 1.25 1.5
1 Eulachon Rockfish 8 Flatfish 42
2 Eulachon 15 Rockfish 7 Flatfish 21
3 Eulachon 52Rockfish 86Flatfish 248
6 Eulachon 27 Rockfish 48 Flatfish 86
7 Eulachon 48 7 Rockfish 54 7 Flatfish 161 29
9 Eulachon 65 Rockfish 55 Flatfish 118
10 Eulachon 18 Rockfish 21 Flatfish 51
11 Eulachon 123 Rockfish 162 Flatfish 468
14 Eulachon 139 Rockfish 139 Flatfish 313
15 Eulachon 54 Rockfish 82 Flatfish 326

Shrimp Trawl Operations and Bycatch of Eulachon Smelt, Rockfish, and Flatfish 108
Table 5. The number of observed tows by month and gear type (excluder size) in the 2011 Washington pink shrimp fishery. Excluder size refers to the spacing between panel bars.
Month Species Complex Excluder Size (inches)
0.75 0.875 1 1.25 1.5
April Eulachon 22 Rockfish 22 Flatfish 48
May Eulachon 8 87 Rockfish 8 86 Flatfish 17 207
June
Eulachon 50 61 12 22Rockfish 29 66 12 45Flatfish 102 192 42 95
July
Eulachon 23 41 23 16Rockfish 38 49 44 23Flatfish 105 119 172 73
August
Eulachon 41 29 27 10 14Rockfish 49 59 48 1 18Flatfish 118 151 86 45 80
September Eulachon 9 9 Rockfish 14 16 Flatfish 30 67
October Eulachon 15 29 Rockfish 7 26 Flatfish 21 93

Shrimp Trawl Operations and Bycatch of Eulachon Smelt, Rockfish, and Flatfish 109
Table 6. The number of observations south and north of the Columbia River plume by month in 2011.
Month Species Complex South North
April Eulachon 22Rockfish 22Flatfish 48
May Eulachon 95Rockfish 94Flatfish 224
June Eulachon 145Rockfish 152Flatfish 431
July Eulachon 103Rockfish 154Flatfish 469
August Eulachon 121Rockfish 184Flatfish 480
September Eulachon 18Rockfish 30Flatfish 97
October Eulachon 32 12Rockfish 24 9Flatfish 38 76

Shrimp Trawl Operations and Bycatch of Eulachon Smelt, Rockfish, and Flatfish 110
Table 7. The number of observed tows for each vessel/gear type combination in the 2012 Washington pink shrimp fishery.
Vessel Number
Species Complex
Excluder 1 - Bar-spacing Excluder 2 - Bar-spacing 0.75 1.25 0.75 1.25 1.5
1 Eulachon 19 19 Rockfish 5 5 Flatfish 48 48
3 Eulachon 62 62 Rockfish 47 47 Flatfish 233 233
4 Eulachon 17 17 Rockfish 22 22 Flatfish 70 70
5 Eulachon 9 9 Rockfish 9 9 Flatfish 23 23
7 Eulachon 43 43 Rockfish 41 41 Flatfish 178 178
8 Eulachon 59 26 59 26 Rockfish 49 24 49 24 Flatfish 240 106 240 106
9 Eulachon 7 7 Rockfish 4 4 Flatfish 15 15
10 Eulachon 10 10 Rockfish 4 4 Flatfish 50 50
11 Eulachon 55 55 Rockfish 58 58 Flatfish 162 162
12 Eulachon 18 18 Rockfish 15 15 Flatfish 57 57
13 Eulachon 29 29 Rockfish 19 19 Flatfish 94 94
14 Eulachon 32 32 Rockfish 28 28 Flatfish 85 85
15 Eulachon 174 174 Rockfish 160 160 Flatfish 541 541
16 Eulachon 36 36 Rockfish 36 36 Flatfish 119 119

Shrimp Trawl Operations and Bycatch of Eulachon Smelt, Rockfish, and Flatfish 111
Table 8. The distribution of tows by month and vessel for the 2012 pink shrimp fishery. All tows in this table were made with the 0.75 in. bar-spacing.
Vessel Number
Species Complex
2012 April May June July August September October Total
1
Eulachon 5 14 19Rockfish 1 4 5Flatfish 15 33 48
4
Eulachon 17 17Rockfish 22 22Flatfish 70 70
5
Eulachon 9 9Rockfish 9 9Flatfish 23 23
7
Eulachon 4 19 1 19 43Rockfish 4 17 1 19 41Flatfish 19 80 12 67 178
8
Eulachon 15 14 30 59Rockfish 15 24 6 28 73Flatfish 65 106 42 133 346
9
Eulachon 7 7Rockfish 4 4Flatfish 15 15
10
Eulachon 10 10Rockfish 4 4Flatfish 50 50
11
Eulachon 16 25 14 55Rockfish 17 27 14 58Flatfish 51 55 56 162
12
Eulachon 18 18Rockfish 15 15Flatfish 57 57
13
Eulachon 3 19 7 29Rockfish 2 11 6 19Flatfish 9 62 23 94
14
Eulachon 32 32Rockfish 28 28Flatfish 85 85
15
Eulachon 25 25 52 28 44 174Rockfish 25 22 48 23 42 160Flatfish 82 98 173 95 93 541

Shrimp Trawl Operations and Bycatch of Eulachon Smelt, Rockfish, and Flatfish 112
Vessel Number
Species Complex
2012 April May June July August September October Total
16
Eulachon 11 25 36Rockfish 10 26 36Flatfish 29 90 119
Total
Eulachon 23 61 80 103 139 88 14 508Rockfish 23 50 68 124 121 74 14 474Flatfish 79 227 289 424 454 259 56 1788
Table 9. The number of observations used in the analysis that were south and north of the Columbia River plume by month in 2012.
Month Species Complex South North
April Eulachon 23Rockfish 23Flatfish 79
May Eulachon 66Rockfish 54Flatfish 227
June Eulachon 102Rockfish 83Flatfish 282
July Eulachon 122Rockfish 114Flatfish 318
August Eulachon 125Rockfish 115Flatfish 412
September Eulachon 103Rockfish 87Flatfish 259
October Eulachon 14Rockfish 14Flatfish 56

Shrimp Trawl Operations and Bycatch of Eulachon Smelt, Rockfish, and Flatfish 113
Eulachon
Table 10. The number of observed tows with eulachon for each vessel/month combination in the 2011 Washington pink shrimp fishery.
Vessel Number
2011 Number of Observed Tows
April May June July August September October Total
2 15 15
3 22 16 14 52
6 27 27
7 8 25 3 19 55
9 26 8 22 9 65
10 6 12 18
11 4 49 24 11 18 17 123
14 18 38 30 30 11 12 139
15 12 23 10 9 54
Total 22 95 145 103 121 18 44 548
Table 11. The number of observed tows with eulachon for each of the 5 gear types (excluder size) by vessel in the 2011 Washington pink shrimp fishery. Excluder size refers to the spacing between panel bars.
Vessel Number
2011 Excluder Size (inches)
0.75 0.875 1 1.25 1.5
2 15
3 52
6 27
7 48 7
9 65
10 18
11 123
14 139
15 54

Shrimp Trawl Operations and Bycatch of Eulachon Smelt, Rockfish, and Flatfish 114
Table 12. Estimates of the contribution of Vessel to the overall variance of the logarithm of eulachon bycatch ratios for 2011.
Estimate Vessel Variance 0.4716 Residual Variance 3.0495 Total Variance 3.5211 Percent of Variability from Vessel 13.4%
Table 13. Results of the analysis that removed month first, Eq. 1 (
: ) from the above model using observations from June, July, and
August, and gear types 0.75 in., 0.875 in., 1.25 in., and 1.5 in.
Source Deviance deviance ( ) Chi-square df p-value
Vessel 1370.784 Gear 1366.513 4.271 3 0.234Month 1285.446 81.068 2 < 0.001Interaction 1260.945 24.500 6 < 0.001
Table 14. Results of the analysis that removed gear type first from the model, (Eq. 3:
: ) using observations from June, July, and August, and
gear types 0.75 in., 0.875 in., 1.25 in., and 1.5 in.
Source Deviance Change in deviance (Chi-square) Chi-square df p-value
Vessel 1370.784 Month 1294.112 76.672 2 <0.001Gear 1285.446 8.666 3 0.034Interaction 1260.945 24.500 6 <0.001
Table 15. ANOVA results table for the analysis of the August tow data, Eq. 4 (
.)
Source df SS MSE F-value p-value Gear 4 73.846 18.462 7.30 < 0.001Vessel 2 7.027 3.513 1.39 0.253Residual 114 288.172 2.538
Total 120 369.045

Shrimp Trawl Operations and Bycatch of Eulachon Smelt, Rockfish, and Flatfish 115
Table 16. Results of the pairwise comparison analysis for different gear types in August 2011. The 0.875 in. gear type was significantly lower than the 0.75 in., 1.25 in., and 1.5 in. bar-spacing.
Gear Contrasts Difference in mean log ratio p-value (adj) Direction 0.875 - 0.75 -1.572 0.001 0.875" Lower
1 - 0.75 -0.484 0.736 No Difference
1.25 - 0.75 1.197 0.213 No Difference
1.5 - 0.75 -0.041 1.000 No Difference
1 - 0.875 1.088 0.085 No Difference
1.25 - 0.875 2.768 < 0.001 0.875" Lower
1.5 - 0.875 1.531 0.030 0.875" Lower
1.25 - 1 1.680 0.040 1" Lower
1.5 - 1 0.443 0.916 No Difference
1.5 - 1.25 -1.238 0.334 No Difference
Table 17. Results of the analysis that compared the effects 0.875 in. and 0.75 in. bar-spacing across all months both gears were fished. Month was removed first in this analysis.
Source Deviance deviance ( ) Chi-square df p-value Vessel 1516.913 Gear 1516.207 0.706 1 0.401Month 1416.073 100.134 3 < 0.001Interaction 1396.926 19.147 5 0.002
Table 18. Results of the analysis that compared the effects 0.875 in. and 0.75 in. bar-spacing across all months both gears were fished. Gear was removed first in this analysis.
Source Deviance deviance ( ) Chi-square df p-value Vessel 1516.913 Month 1416.073 100.840 4 < 0.001Gear 1413.28 2.793 1 0.095Interaction 1396.926 16.354 4 0.003

Shrimp Trawl Operations and Bycatch of Eulachon Smelt, Rockfish, and Flatfish 116
Table 19. Results of the analysis testing the effect of month on eulachon bycatch for tows using the 0.875 in. gear only.
Source Deviance deviance ( ) Chi-square df p-value Vessel 12904 Month 12528 376.49 5 <0.001
Table 20. Results of the pairwise comparisons of mean eulachon bycatch ratio by for the months fished with the 0.875 in gear. April is significantly higher than all months except October.
Month Contrast Difference p-value (adj) Direction April - May -1.797 < 0.001 April Higher April - June -1.145 0.039 April Higher April - July -2.997 < 0.001 April Higher April - August -3.791 < 0.001 April Higher April - October -0.646 0.686 Same May - June 0.652 0.126 Same May - July -1.200 0.001 May Higher May - August -1.994 < 0.001 May Higher May - October 1.152 0.009 October Higher June - July -1.852 < 0.001 June Higher June - August -2.646 < 0.001 June Higher June - October 0.499 0.714 Same July - August -0.793 0.291 Same July - October 2.352 < 0.001 October Higher August - October 3.145 < 0.001 October Higher
Eulachon: Vessel and Month - 2012
Table 21. Estimates of the contribution of Vessel to the overall variance of the logarithm of eulachon bycatch ratios for 2012.
Estimate Vessel Variance 0.536 Residual Variance 1.669 Total Variance 2.205 Percent of Variability from Vessel 24.3%

Shrimp Trawl Operations and Bycatch of Eulachon Smelt, Rockfish, and Flatfish 117
Table 22. Results of the analysis testing the effect of month for 2012.
Source Deviance deviance ( ) Chi-square df p-value Vessel 1731.4 Month 1712.8 18.62 6 0.005
Table 23. Results of the pairwise comparisons from the Tukey HSD test for months fished in 2012. May was consistently higher than all months but June.
Pairwise Contrast Difference in mean log(Bycatch Ratio)
p-value (adjusted) Direction
May - April 1.340 0.002 May higher June - April 0.701 0.322 Same July - April 0.539 0.616 Same August - April 0.690 0.282 Same September - April 0.547 0.617 Same October - April -0.569 0.886 Same June - May -0.639 0.093 Same July - May -0.800 0.006 May higher August - May -0.650 0.036 May higher September - May -0.793 0.010 May higher October - May -1.908 0.000 May higher July - June -0.162 0.986 Same August - June -0.011 1.000 Same September - June -0.154 0.991 Same October - June -1.270 0.025 June Higher August - July 0.151 0.980 Same September - July 0.008 1.000 Same October - July -1.108 0.072 July Higher September - August -0.143 0.988 Same October - August -1.259 0.020 August Higher October - September -1.116 0.074 Same

Shrimp Trawl Operations and Bycatch of Eulachon Smelt, Rockfish, and Flatfish 118
Table 24. Results of the analysis testing the effect of depth with month for eulachon for 2011. Only the 0.875 in. gear types and associated months were used for the analysis.
Source Deviance deviance Chi-square df p-value
Vessel 1097.81 Month 990.36 107.45 5 < 0.001Depth 983.26 7.10 1 0.008Depth:Month Interaction 959.94 23.33 5 < 0.001
Table 25. The effect of changes in one fathom of fishing depth on the amount of eulachon bycatch, in pounds, for each month fished in 2011 (Eq. 6:%
∙ 100 ).
Month Tows Intercept ( )
Estimate ( )
p-value ( ) for slope
Average depth in fathoms
Percent change in eulachon bycatch for a one fathom increase in fishing depth
April 21 -20.280 0.186 0.059 0.003 78.19 20.4%May 87 -4.774 -0.032 0.026 0.107 74.14 -3.2%June 61 -7.063 0.007 0.012 0.290 74.98 0.70%July 41 -17.657 0.127 0.049 0.007 72.07 13.5%August 29 -2.444 -0.089 0.052 0.050 73.76 -8.5%October 29 -10.222 0.052 0.023 0.016 80.79 5.3%
Table 26. Analysis of deviance table for the analysis of the effects of month and depth on log(bycatch) for 2012.
Source Deviance deviance ( ) Chi-square df p-value Vessel 3 Month 9 18.616 6 0.005Depth 10 5.749 1 0.017Depth:Month Interaction 16 17.604 6 0.007

Shrimp Trawl Operations and Bycatch of Eulachon Smelt, Rockfish, and Flatfish 119
Table 27. The effect of changes in one fathom of fishing depth on the amount of eulachon bycatch, in pounds, for each month fished in 2012 (Eq. 6: %
∙ 100).
Month Tows Intercept ( )
Estimate ( )
p-value ( )
Average depth in fathoms
Percent change in eulachon bycatch ratio for a one fathom increase in fishing depth
April 23 2.097 -0.085 0.124 0.253 79.61 -8.2%May 61 -3.333 0.006 0.015 0.347 70.23 0.6%June 80 -9.169 0.078 0.022 0.000 71.86 8.1%July 103 -3.623 -0.001 0.015 0.466 74.34 -0.10%August 139 -1.951 -0.024 0.015 0.054 70.05 -2.4%September 87 -6.160 0.036 0.013 0.003 68.36 3.7%October 13 -10.260 0.071 0.065 0.30 75.93 7.4%
Table 28. The number of tows by month south and north of the Columbia River plume in 2011.
Month South North April 0 22May 0 95June 0 145July 0 103August 0 121September 0 18October 32 12
Table 29. The number of tows for each gear type south and north of the Columbia River plume in 2011.
Gear South North 0.75 15 1310.875 17 2521 0 271.25 0 541.5 0 52

Shrimp Trawl Operations and Bycatch of Eulachon Smelt, Rockfish, and Flatfish 120
Table 30. Analysis of deviance table for the analysis of the effects of month and latitude on log(bycatch) in 2011 for tows fished north of the Columbia River.
Source Deviance deviance ( ) Chi-square df p-value Month 928.2207 93.391 5 < 0.001Latitude 927.554 0.667 1 0.414Interaction 870.7384 56.816 5 < 0.001
Table 31. Analysis of deviance table for the analysis of the effects of month and latitude on log(bycatch) in 2012. All fishing occurred north of the Columbia River.
Source Deviance deviance ( ) Chi-square df p-value Vessel 1731.431 Month 1712.815 18.616 6 0.005Latitude 1673.894 38.921 1 < 0.001Latitude:Month 1631.866 42.028 6 < 0.001
Table 32. The effect an 0.5 degree increase in latitude of fishing on the amount of eulachon bycatch, in pounds, for each month fished in 2012 (Eq. 7: %
.
∙ 100).
Month Tows Intercept ( )
Estimate ( )
p-value ( )
Average latitude
Percent change in eulachon bycatch for an increase of 0.5 degrees latitude
April 23 176.953 -3.870 0.879 0.000 47.12 -17.6%May 61 34.991 -0.811 0.324 0.008 48.84 -4.0%June 79 21.760 -0.540 0.574 0.175 46.81 -2.7%July 103 -0.102 -0.077 0.240 0.375 46.52 -0.4%August 125 -32.890 0.628 0.255 0.008 46.54 3.2%September 88 32.226 -0.770 0.305 0.007 46.78 -3.8%October 13 -472.116 9.917 3.609 0.018 47.11 64.2%

Shrimp Trawl Operations and Bycatch of Eulachon Smelt, Rockfish, and Flatfish 121
Table 33. Analysis of deviance table for the analysis of the effects of month and tow time on log(bycatch) in 2011.
Source Deviance deviance ( ) Chi-square df p-value Vessel 1097.81 Month 990.36 107.447 5 < 0.001Time 980.12 10.249 1 0.001Interaction 975.49 4.623 5 0.464 = ‐0. 007( = 0.003)
Table 34. Analysis of deviance table for the analysis of the effects of month and tow time on log(bycatch) in 2012.
Source Deviance deviance ( ) Chi-square df p-value Vessel 1731.431 Month 1712.815 18.616 6 0.005Time 1684.51 28.305 1 < 0.001Time:Month 1658.087 26.423 6 < 0.001
Table 35. The effect a 30 minute increase in time per tow on the amount of eulachon bycatch, in pounds, per 10,000 pounds of shrimp for each month fished in 2012
(Eq. 8: % ∙ 100).
Month Tows Intercept ( )
Estimate ( )
p-value ( )
Average tow time
Percent change in eulachon bycatch for an increase 30 minute increase tow time
April 23 -9.38 0.039 0.013 0.001 121 222.2%May 60 -2.62 -0.003 0.005 0.288 102 -8.6%June 80 -3.456 -0.001 0.004 0.426 101 -3.0%July 101 -3.312 -0.004 0.005 0.190 97 -11.3%August 138 -3.164 -0.004 0.002 0.036 113 -11.3%September 87 -3.896 0.002 0.004 0.269 102 6.2%October 14 -5.17 0.002 0.009 0.822 127 6.2%

Shrimp Trawl Operations and Bycatch of Eulachon Smelt, Rockfish, and Flatfish 122
Rockfish
Rockfish: Vessel, Gear, and Month - 2011
Table 36. Estimates of the contribution of Vessel to the overall variance of the logarithm of bycatch ratios for 2011.
Estimate Vessel Variance 1.205Residual Variance 2.612Total Variance 3.817Percent of Variability from Vessel 31.6%
Table 37. Results of the analysis that removed month first from the above model using observations from June, July, and August, gear types 0.75 in., 0.875 in., 1.25 in., and 1.5 in.
(Model 1 Eq. 1: : ).
Source Deviance deviance ( ) Chi-square df p-value Vessel 1679.148
Gear 1672.21 6.939 3 0.074
Month 1671.229 0.981 2 0.612
Interaction 1609.781 61.447 6 <0.001
Table 38. Results of the analysis that removed gear type first from the model (Model 1 Eq.
3: : ) using observations from June, July, and
August, gear types 0.75 in., 0.875 in., 1.25 in., and 1.5 in.
Source Deviance Change in deviance (Chi-square) Chi-square df p-value Vessel 1679.148
Month 1677.869 1.279 2 0.527
Gear 1671.229 6.640 3 0.084
Interaction 1609.781 61.447 6 <0.001

Shrimp Trawl Operations and Bycatch of Eulachon Smelt, Rockfish, and Flatfish 123
Table 39. ANOVA results table for the analysis of the August tow data (Eq. 4:
.).
Source df SS MSE F-value p-value Gear 4 110.58 27.645 12.40 <0.001Vessel 2 60.17 30.083 13.50 <0.001Residual 177 394.48 2.229
Total 183 565.23
Table 40. Results of the pairwise comparison analysis for different gear types in August 2011. The 0.875 in. gear type was significantly lower than the 0.75 in. and 1.25 in. There was no difference between the 0.875 in. and 1 in. and 1.5 in. bar-spacing.
Gear Contrasts Difference in mean log ratio p-value (adj) Direction 0.875 - 0.75 -1.451 <0.001 0.875" Lower
1 - 0.75 -1.051 0.006 0.75" Lower
1.25 - 0.75 1.437 0.048 1.25" Lower
1.5 - 0.75 -0.388 0.880 No Difference
1 - 0.875 0.400 0.643 No Difference
1.25 - 0.875 2.888 <0.001 0.875" Lower
1.5 - 0.875 1.063 0.067 No Difference
1.25 - 1 2.488 <0.001 1" Lower
1.5 - 1 0.663 0.495 No Difference
1.5 - 1.25 -1.825 0.019 1.5" Lower
Table 41. Results of the analysis that compared the effects 0.875 in. and 0.75 in. bar-spacing across all months both gears were fished. Month was removed first in this analysis.
Source Deviance deviance ( ) Chi-square df p-value
Vessel 1521.435 NA NA NA
Gear 1509.048 12.387 4 0.015
Month 1508.601 0.447 1 0.504
Interaction 1476.114 32.487 4 < 0.001

Shrimp Trawl Operations and Bycatch of Eulachon Smelt, Rockfish, and Flatfish 124
Table 42. Results of the analysis that compared the effects 0.875 in. and 0.75 in. bar-spacing across all months both gears were fished. Gear was removed first in this analysis.
Source Deviance deviance ( ) Chi-square df p-value Vessel 1521.4 NA NA NA
Gear 1520.9 0.50 1 0.48
Month 1509.0 11.9 3 0.008
Interaction 1476.1 32.93 5 < 0.001
Table 43. Results of the analysis testing the effect of month for tows using the 0.875 in. gear only.
Source Deviance deviance ( ) Chi-square df p-value Vessel 1139.2 Month 1119.8 19.4 5 0.002
Table 44. Results of the pairwise comparisons of mean rockfish bycatch ratio by for the months fished with the 0.875 in. gear. April is significantly lower than May, June, and October.
Month Contrast Difference p-value (adj) Direction April - May - 1.399 0.004 May HigherApril - June - 1.205 0.027 June HigherApril - July - 0.770 0.409 No DiffferenceApril - August - 0.758 0.395 No DiffferenceApril - October - 1.967 0.000 October HigherMay - June 0.194 0.976 No DiffferenceMay - July 0.629 0.234 No DiffferenceMay - August 0.640 0.164 No DiffferenceMay - October -0.568 0.599 No DiffferenceJune - July 0.435 0.695 No DiffferenceJune - August 0.446 0.618 No DiffferenceJune - October -0.762 0.303 No DiffferenceJuly - August 0.012 1.000 No DiffferenceJuly - October -1.197 0.025 October HigherAugust - October -1.208 0.017 October Higher

Shrimp Trawl Operations and Bycatch of Eulachon Smelt, Rockfish, and Flatfish 125
Table 45. Estimates of the contribution of Vessel to the overall variance of the logarithm of rockfish bycatch ratios for 2012.
Estimate Vessel Variance 0.545Residual Variance 1.796Total Variance 2.341Percent of Variability from Vessel 23.3%
Rockfish: Vessel and Month - 2012
Table 46. Results of the analysis testing the effect of month for 2012.
Source Deviance deviance ( ) Chi-square df p-value Vessel 1566.952 NA NA NA
Month 1556.902 10.050 6 0.123
Table 47. Results of the pairwise comparisons from the Tukey’s HSD test for months fished in 2012. There was no difference in the ratio of rockfish bycatch across the months fished.
Pairwise Contrast Difference in Mean log (Bycatch Ratio) p-value (adjusted) Direction
April - May -0.353 0.960 No DifferenceApril - June -0.607 0.588 No DifferenceApril -July -0.755 0.266 No DifferenceApril - August -0.963 0.055 No DifferenceApril - September -0.675 0.443 No DifferenceApril - October -0.382 0.987 No DifferenceMay - June -0.254 0.965 No DifferenceMay - July -0.402 0.678 No DifferenceMay - August -0.609 0.158 No DifferenceMay - September -0.322 0.887 No DifferenceMay - October -0.029 1.000 No DifferenceJune - July -0.148 0.995 No DifferenceJune - August -0.356 0.666 No DifferenceJune - September -0.069 1.000 No DifferenceJune - October 0.225 0.998 No DifferenceJuly - August -0.207 0.939 No DifferenceJuly - September 0.080 1.000 No DifferenceJuly - October 0.373 0.972 No DifferenceAugust - September 0.287 0.829 No DifferenceAugust - October 0.581 0.789 No DifferenceSeptember - October 0.293 0.993 No Difference

Shrimp Trawl Operations and Bycatch of Eulachon Smelt, Rockfish, and Flatfish 126
Rockfish: Depth, Latitude, and Tow Time
Table 48. Results of the analysis testing the effect of depth with month for 2011. Only the 0.875 in. gear types and associated months were used for the analysis.
Source Deviance deviance ( ) Chi-square df p-value
Vessel 1139.188 NA NA NA
Month 1119.81 19.377 5 0.002
Depth 1105.153 14.657 1 0.000
Depth:Month Interaction 1048.169 56.984 5 < 0.001
Table 49. The effect of changes in one fathom of fishing depth on the amount of rockfish bycatch, in pounds, for each month fished in 2011 (Eq. 6:%
∙ 100 ).
Month Tows Intercept ( )
Estimate ( )
p-value ( ) for slope
Average depth in fathoms
Percent change in rockfish bycatch ratio for a one fathom increase in fishing depth
April 22 -16.247 0.082 0.068 0.237 76.5 9%May 86 -16.442 0.108 0.025 < 0.001 74.44 11%June 66 -11.289 0.039 0.015 0.012 74.33 4%July 49 0.704 -0.135 0.026 < 0.001 71.45 -13%August 59 -2.384 -0.090 0.030 0.003 75.39 -9%October 26 -15.021 0.085 0.022 0.001 84.38 9%
Table 50. Analysis of deviance table for the analysis of the effects of month and depth on log(bycatch) for 2012.
Source Deviance deviance ( ) Chi-square df p-value
Vessel 1566.952 NA NA NA
Month 1556.902 10.050 6 0.123
Depth 1542.061 14.841 1 < 0.001
Depth:Month Interaction 1516.578 25.482 6 < 0.001

Shrimp Trawl Operations and Bycatch of Eulachon Smelt, Rockfish, and Flatfish 127
Table 51. The effect of changes in one fathom of fishing depth on the amount of rockfish bycatch, in percent change, for each month fished in 2012
(Eq. 6: % ∙ 100).
Month Tows Intercept ( )
Estimate ( )
p-value ( )
Average depth in fathoms
Percent change rockfish bycatch ratio for one fathom increase in fishing depth
April 23 -15.595 0.101 0.075 0.192 79.39 11%May 50 -10.916 0.048 0.022 0.032 69.48 5%June 68 -9.004 0.018 0.029 0.543 71.79 2%July 100 -8.654 0.004 0.016 0.820 74.32 0%August 121 -8.853 0.008 0.015 0.598 70.16 1%September 74 -9.630 0.019 0.022 0.409 66.96 2%October 14 -33.591 0.342 0.064 0.000 75.93 41%
Table 52. The number of tows with rockfish by month south and north of the Columbia River plume in 2011.
Month
South
North
April 0 22
May 0 94
June 0 152
July 0 154
August 0 184
September 0 30
October 24 9
Table 53. The number of tows with rockfish for each gear type south and north of the Columbia River plume in 2011.
Gear South North 0.75 7 138
0.875 17 291
1 0 48
1.25 0 82
1.5 0 86

Shrimp Trawl Operations and Bycatch of Eulachon Smelt, Rockfish, and Flatfish 128
Table 54. Analysis of deviance table for the analysis of the effects of month and latitude on log(bycatch) in 2011 for tows fished north of the Columbia River.
Source Deviance deviance ( ) Chi-square df p-value Month 1054.456 13.086 5 0.023
Latitude 1054.232 0.225 1 0.636
Interaction 1035.495 18.737 5 0.002
Table 55. Analysis of deviance table for the analysis of the effects of month and latitude on log(bycatch) in 2012. All fishing occurred north of the Columbia River.
Source Deviance deviance ( ) Chi-square df p-value Vessel 1566.952 NA NA NA
Month 1556.902 10.050 6 0.123
Latitude 1529.341 27.561 1 < 0.001
Latitude:Month 1513.25 16.091 6 0.013
Table 56. The effect an 0.5 degree increase in latitude of fishing on the amount of rockfish bycatch, in pounds, for each month fished in 2012 (Eq. 7: %
.
∙ 100).
Month Tows Intercept ( )
Estimate ( )
p-value ( )
Average latitude
Percent change rockfish bycatch ratio for 0.5 degree increase in latitude
April 23 -60.091 1.117 0.633 0.092 47.17 75%May 50 -36.834 0.622 0.752 0.412 46.96 36%June 68 -78.553 1.510 0.574 0.011 46.88 113%July 100 -41.255 0.708 0.244 0.005 46.58 42%August 121 -15.677 0.161 0.267 0.548 46.63 8%September 74 16.803 -0.539 0.826 0.516 46.89 -24%October 14 -958.081 20.175 5.493 0.003 47.11 2403962%
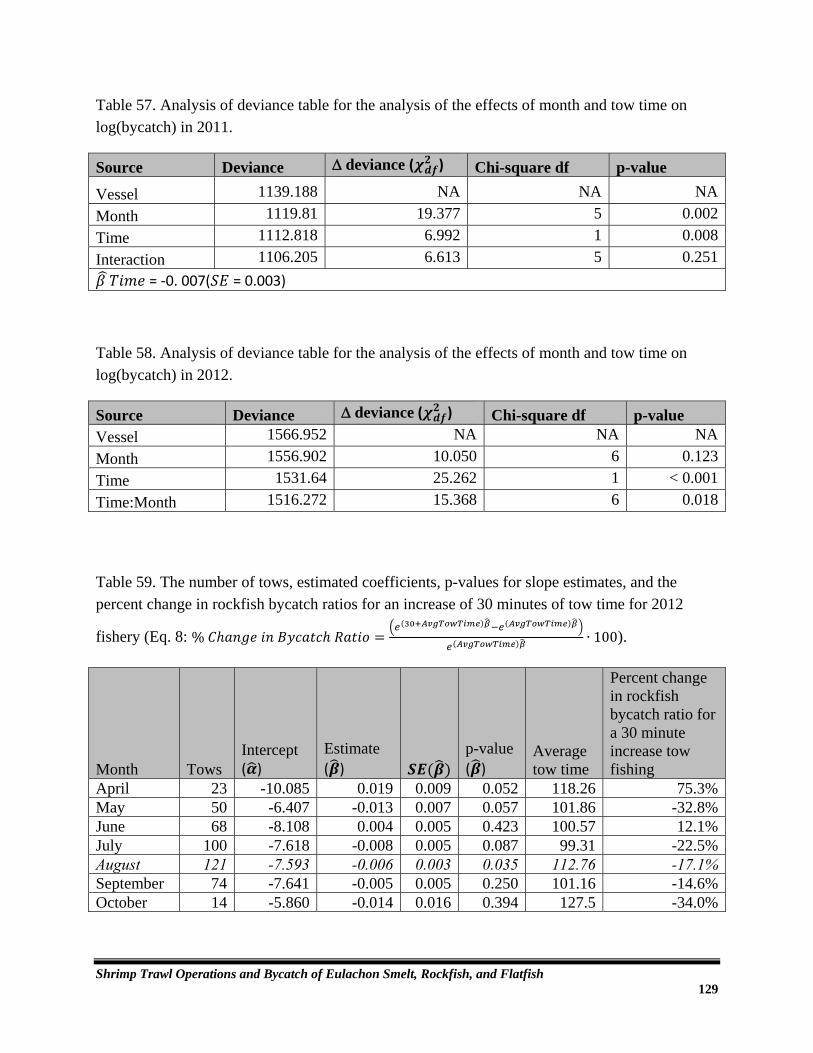
Shrimp Trawl Operations and Bycatch of Eulachon Smelt, Rockfish, and Flatfish 129
Table 57. Analysis of deviance table for the analysis of the effects of month and tow time on log(bycatch) in 2011.
Source Deviance deviance ( ) Chi-square df p-value
Vessel 1139.188 NA NA NA
Month 1119.81 19.377 5 0.002
Time 1112.818 6.992 1 0.008
Interaction 1106.205 6.613 5 0.251
= ‐0. 007( = 0.003)
Table 58. Analysis of deviance table for the analysis of the effects of month and tow time on log(bycatch) in 2012.
Source Deviance deviance ( ) Chi-square df p-value Vessel 1566.952 NA NA NA
Month 1556.902 10.050 6 0.123
Time 1531.64 25.262 1 < 0.001
Time:Month 1516.272 15.368 6 0.018
Table 59. The number of tows, estimated coefficients, p-values for slope estimates, and the percent change in rockfish bycatch ratios for an increase of 30 minutes of tow time for 2012
fishery (Eq. 8: % ∙ 100).
Month Tows Intercept ( )
Estimate ( )
p-value ( )
Average tow time
Percent change in rockfish bycatch ratio for a 30 minute increase tow fishing
April 23 -10.085 0.019 0.009 0.052 118.26 75.3%May 50 -6.407 -0.013 0.007 0.057 101.86 -32.8%June 68 -8.108 0.004 0.005 0.423 100.57 12.1%July 100 -7.618 -0.008 0.005 0.087 99.31 -22.5%August 121 -7.593 -0.006 0.003 0.035 112.76 -17.1%September 74 -7.641 -0.005 0.005 0.250 101.16 -14.6%October 14 -5.860 -0.014 0.016 0.394 127.5 -34.0%

Shrimp Trawl Operations and Bycatch of Eulachon Smelt, Rockfish, and Flatfish 130
Flatfish
Table 60. Estimates of the contribution of Vessel to the overall variance of the logarithm of flatfish bycatch ratios for 2011.
Estimate Vessel Variance 1.311 Residual Variance 2.946 Total Variance 4.257 Percent of Variability from Vessel 30.8%
Table 61. Results of the analysis that removed month first from the model (Model 1 Eq. 1:
: ) using observations from June, July, and
August, gear types 0.75 in., 0.875 in., 1.25 in., and 1.5 in.
Source Deviance deviance ( ) Chi-square df p-value Vessel 5069.112
Gear 5054.239 14.872 3 0.002
Month 5043.544 10.695 2 0.005
Interaction 4995.962 47.583 6 < 0.001
Table 62. Results of the analysis that removed gear type first from the model (Model 1 Eq.
3; : ) using observations from June, July, and
August, gear types 0.75 in., 0.875 in., 1.25 in., and 1.5 in.
Source Deviance Change in deviance (Chi-square) Chi-square df p-value
Vessel 5069.112
Month 5055.016 14.096 2 0.001
Gear 5043.544 11.472 3 0.009
Interaction 4995.962 47.583 6 < 0.001
Table 63. ANOVA results table for the analysis of the August tow data (Eq. 4:
).
Source df SS MSE F-value p-value Gear 4 300.2 75.05 25.67 < 0.001Vessel 2 98.8 49.39 16.89 < 0.001Residual 473 1383.0 2.92

Shrimp Trawl Operations and Bycatch of Eulachon Smelt, Rockfish, and Flatfish 131
Table 64. Results of the pairwise comparison analysis for different gear types in August 2011. The 0.875 in. gear type was significantly lower than the 0.75 in., 1.25 in., and 1.5 in. bar-spacing.
Gear Contrasts Difference in mean log ratio p-value (adj) Direction
0.875"-0.75" -1.048 <0.001 0.875" Lower1" - 0.75" -1.507 <0.001 1" Lower1.25" - 0.75" 1.178 0.001 0.75" Lower1.5" - 0.75" -0.120 0.989 No Difference1" - 0.875" -0.459 0.274 No Difference1.25" - 0.875" 2.226 <0.001 0.875" Lower1.5" - 0.875" 0.928 0.001 0.875" Lower1.25" - 1" 2.685 <0.001 1" Lower1.5" - 1" 1.387 <0.001 1" Lower1.5"- 1.25" -1.298 0.001 1.5" Lower
Table 65. Results of the analysis that compared the effects 0.875 in. and 0.75 in. bar-spacing across all months both gears were fished. Month was removed first in this analysis.
Source Deviance deviance ( ) Chi-square df p-value Vessel 4380.357 NA NA NA
Gear 4372.819 7.538 1 0.006
Month 4365.856 6.963 3 0.073
Interaction 4346.733 19.122 5 0.002
Table 66. Results of the analysis that compared the effects 0.875 in. and 0.75 in. bar-spacing across all months both gears were fished. Gear was removed first in this analysis.
Source Deviance deviance ( ) Chi-square df p-value Vessel 4380.357 NA NA NA
Month 4365.856 14.5 4 0.006
Gear 4361.197 4.66 1 0.031
Interaction 4346.733 14.46 4 0.006
Table 67. Results of the analysis testing the effect of month for tows using the 0.875 in. gear only.
Source Deviance deviance ( ) Chi-square df p-value
Vessel 3160.1 NA NA NA
Month 3140.4 19.656 5 0.001

Shrimp Trawl Operations and Bycatch of Eulachon Smelt, Rockfish, and Flatfish 132
Table 68. Results of the pairwise comparisons of mean flatfish bycatch ratio by for the months fished with the 0.875 in. gear.
Month Contrast Difference (Log scale) p-value (adj) Direction April - May -0.168 0.990 No Difference
April - June -0.471 0.530 No Difference
April - July -0.914 0.023 July Lower
April - August -0.272 0.931 No Difference
April - October -0.403 0.771 No Difference
May - June -0.302 0.491 No Difference
May - July -0.746 0.002 July Lower
May - August -0.103 0.993 No Difference
May - October -0.235 0.881 No Difference
June - July -0.444 0.229 No Difference
June - August 0.199 0.894 No Difference
June - October 0.067 1.000 No Difference
July - August 0.643 0.027 July Lower
July - October 0.511 0.259 No Difference
August - October -0.132 0.992 No Difference
Flatfish: Vessel and Month - 2012
Table 69. Estimates of the contribution of Vessel to the overall variance of the logarithm of flatfish bycatch ratios for 2012.
Estimate Vessel Variance 0.6043Residual Variance 3.8214Total Variance 4.4257Percent of Variability from Vessel 13.7%
Table 70. Results of the analysis testing the effect of month for 2012.
Source Deviance deviance ( ) Chi-square df p-value
Vessel 6976.29 NA NA NA
Month 6916.19 60.100 6 < 0.001

Shrimp Trawl Operations and Bycatch of Eulachon Smelt, Rockfish, and Flatfish 133
Table 71. Results of the pairwise comparisons from the Tukey’s HSD test for months fished in 2012. May was consistently higher than all months but June.
Pairwise Contrast
Difference in mean log(Bycatch Ratio) p-value (adjusted) Direction
April - May 0.372 0.777 No Difference
April - June -0.377 0.741 No Difference
April - July -0.613 0.169 No Difference
April - August -0.612 0.143 No Difference
April - September -0.849 0.014 April Higher
April - October -1.269 0.004 April Higher
May - June -0.749 <0.001 May Higher
May - July -0.985 <0.001 May Higher
May - August -0.984 <0.001 May Higher
May - September -1.221 <0.001 May Higher
May - October -1.641 <0.001 May Higher
June - July -0.236 0.761 No Difference
June - August -0.235 0.691 No Difference
June - September -0.472 0.076 No Difference
June - October -0.892 0.032 June Higher
July - August 0.001 1 No Difference
July - September -0.236 0.785 No Difference
July - October -0.656 0.246 No Difference
August - September -0.237 0.719 No Difference
August - October -0.656 0.220 No Difference
September - October -0.420 0.777 No Difference
Table 72. Results of the analysis testing the effect of depth with month for 2011. Only the 0.875 in. gear and associated months were used for the analysis.
Source Deviance deviance ( ) Chi‐square df p‐value
Vessel 3160.058 NA NA NA
Month 3140.403 19.656 5 0.001
Depth 3122.175 18.228 1 < 0.001
Depth:Month Interaction 3113.934 8.241 5 0.143
= ‐0. 013( = 0.007)

Shrimp Trawl Operations and Bycatch of Eulachon Smelt, Rockfish, and Flatfish 134
Table 73. Analysis of deviance table for the analysis of the effects of month and depth on log(flatfish bycatch) for 2012.
Source Deviance deviance ( ) Chi-square df p-value Vessel 6976.29 NA NA NA
Month 6916.19 60.100 6 < 0.001
Depth 6876.921 39.269 1 < 0.001
Depth:Month Interaction 6861.835 15.086 6 0.020
Table 74. The effect of changes in one fathom of fishing depth on the change of percent of
flatfish bycatch for each month fished in 2012 (Eq. 6: %
∙ 100).
Month Tows Intercept ( )
Estimate ( )
p-value ( )
Average depth in fathoms
Percent change in flatfish bycatch for a one fathom increase in fishing depth
April 79 -7.286 0.011 0.041 0.782 78.47 1.13%May 227 -5.213 -0.013 0.016 0.403 70.63 -1.33%June 289 -4.065 -0.035 0.018 0.055 71.12 -3.44%July 318 -7.846 0.005 0.014 0.740 73.4 0.46%August 454 -9.729 0.039 0.013 0.002 69.77 4.03%September 259 -7.274 0.000 0.016 0.981 65.17 0.04%October 56 -14.342 0.088 0.060 0.150 75.93 9.18%
Table 75. The number of tows with flatfish south and north of the Columbia River plume in 2011.
Month South North April 0 48
May 0 224
June 0 431
July 0 469
August 0 480
September 0 97
October 76 38

Shrimp Trawl Operations and Bycatch of Eulachon Smelt, Rockfish, and Flatfish 135
Table 76. The number of tows for each type and location with regard to the Columbia River plume in 2011.
Gear South North
0.75 21 372
0.875 55 755
1 0 86
1.25 0 326
1.5 0 248
Table 77. Analysis of deviance table for the analysis of the effects of month and latitude on log(flatfish bycatch) in 2011 for tows fished north of the Columbia River.
Source Deviance deviance ( ) Chi-square df p-value Vessel 2929.662 NA NA NA
Month 2909.503 20.158 5 0.001
Latitude 2907.379 2.125 1 0.145
Latitude:Month 2868.129 39.250 5 < 0.001
Table 78. The effect an 0.5 degree increase in latitude of fishing on the amount of flatfish bycatch, in pounds, for each month fished in 2011 (Eq. 7: %
.
∙ 100.).
Month Tows Intercept ( )
Estimate ( )
p-value ( )
Average latitude
Percent change in flatfish bycatch for increase in 0.5 degrees latitude
April 48 -502.965 10.552 3.235 0.002 46.96 19460%May 207 42.352 -1.058 0.329 0.002 47.31 -41%June 192 -30.548 0.477 0.513 0.354 47.64 27%July 119 -149.138 2.938 4.617 0.526 47.95 334%August 151 -373.469 7.631 2.444 0.002 47.93 4439%October 93 -0.788 -0.157 0.082 0.061 44.91 -8%

Shrimp Trawl Operations and Bycatch of Eulachon Smelt, Rockfish, and Flatfish 136
Table 79. Analysis of deviance for the analysis of the effects of month and latitude on log(flatfish bycatch) in 2012. All fishing occurred north of the Columbia River.
Source Deviance deviance ( ) Chi-square df p-value Vessel 6976.290 NA NA NA
Month 6916.190 60.100 6 < 0.001
Latitude 6669.900 246.290 1 < 0.001
Latitude:Month 6621.524 48.376 6 < 0.001
Table 80. The effect of a 0.5 degree increase in latitude of fishing on the amount of flatfish bycatch, in pounds, for each month fished in 2012 (Eq. 7: %
.
∙ 100.).
Month Tows Intercept ( )
Estimate ( )
p-value ( )
Average latitude
Percent change in flatfish bycatch for an increase in 0.5 degrees latitude
April 79 34.506 -0.868 0.382 0.026 47.14 -35.20%May 227 -209.858 4.359 1.515 0.004 46.78 784.38%June 289 -2.194 -0.093 0.535 0.862 46.82 -4.56%July 318 8.366 -0.342 0.232 0.142 46.51 -15.71%August 454 49.493 -1.218 0.218 0.000 46.61 -45.60%September 259 44.049 -1.100 0.526 0.037 46.8 -42.29%October 56 -340.498 7.064 4.255 0.103 47.11 3320.02%
Table 81. Analysis of deviance table for the analysis of the effects of month and tow time on log(flatfish bycatch) in 2011.
Source Deviance deviance ( ) Chi-square df p-value
Vessel 3160.058 NA NA NA
Month 3140.403 19.656 5 0.001
Time 3121.787 18.615 1 < 0.001
Interaction 3116.032 5.756 5 0.331
= ‐0. 007( = 0.002)

Shrimp Trawl Operations and Bycatch of Eulachon Smelt, Rockfish, and Flatfish 137
Table 82. Analysis of deviance for the analysis of the effects of month and tow time on log(flatfish bycatch) in 2012.
Source Deviance deviance ( ) Chi-square df p-value Vessel 6976.290 NA NA NA
Month 6916.190 60.100 6 < 0.001
Time 6845.566 70.624 1 < 0.001
Time:Month 6813.570 31.996 6 < 0.001
Table 83. The effect a 30 minute increase in tow time on the amount of flatfish bycatch, in percent difference of shrimp per tow for each month fished in 2012
(Eq. 8: % ∙ 100).
Month Tows Intercept ( )
Estimate ( )
p-value ( )
Average tow time
Percent change in flatfish bycatch for an increase 30 minute increase tow time
April 79 -8.931 0.022 0.007 0.002 116.14 92.14%May 227 -5.990 -0.002 0.004 0.655 102.58 -5.27%June 289 -6.408 -0.002 0.003 0.627 98.11 -4.42%July 318 -5.912 -0.017 0.005 0.000 98.68 -39.77%August 454 -6.771 -0.002 0.002 0.383 113.36 -5.18%September 259 -6.706 -0.005 0.003 0.096 107.48 -13.33%October 56 -4.098 -0.027 0.008 0.001 131.43 -55.77%

Shrimp Trawl Operations and Bycatch of Eulachon Smelt, Rockfish, and Flatfish 138
Literature Cited Alverson, D.L., R.L. McNeely, and H.C. Johnson. Results of Exploratory Shrimp Fishing off
Washington and Oregon. Commercial Fisheries Review 22.1 (1960): 1-11. Bates, D. M. 2010. Lme4: Mixed-effects model with R. Butler, J.L., M.S. Love, and T.E. Laidig. 2012. A Guide to the Rockfishes, Thornyheads, and
Scorpionfishes of the Northeast Pacific. University of California Press, Berkeley and Los Angeles, California.
Clarke, A. D., A. Lewis, K. H, Telmer, and J. M. Shrimpton. Life history and age at maturity of
an anadromous smelt, the eulachon Thaleichthys pacificus (Rishardson). Journal of Fish Biology 71 (2007): 1479-1493.
DFO (Fisheries and Oceans Canada). Offshore Juvenile Eulachon Growth and Abundance.
Government of Canada. 09 May 2014. Web. 10 June 2014. Doyle, J., and K. Hildenbrand. You’re Excluded! An Activity Exploring Changes in Trawl
Industry Technology. Oregon Sea Grant, Summer 2013. Federal Register, Volume 75, No.13012. March 18, 2010. Final Rule: Endangered and
Threatened Wildlife and Plants: Threatened Status for Southern Distinct Population Segment of Eulachon.
Gustafson, R.G, M.J. Ford, D. Teel, and J.S. Drake. 2010. Status review of eulachon
(Thaleichthys pacificus) in Washington, Oregon, and California. U.S. Dept. Commer., NOAA Tech. Memo. NMFS-NWFSC-105, 360 p.
Hagerman, F. B. 1952. The biology of the Dover sole, Microstomus pacificus (Lockington). CA
Dept. Fish and Game, Fish Bull. 85. Hannah, R. W., S. A. Jones., 2007. Effectiveness of bycatch reduction devices (BRDs) in the
ocean shrimp (Pandalus jordani) trawl fishery. Fisheries Research 85 (2007): 217-225.3. Hannah, R., and S. Jones. 2013. 24th Annual Pink Shrimp Review. Oregon Dept. Fish Wildlife,
Marine Resources Program, Newport.

Shrimp Trawl Operations and Bycatch of Eulachon Smelt, Rockfish, and Flatfish 139
Hannah, R. W., S. A. Jones, M. J. M. Lomelli, and W. W. Wakefield. 2011. Trawl net modifications to reduce the bycatch of eulachon (Thaleichthys pacificus) in the ocean shrimp (Pandalus jordani) fishery. Fisheries Research 110:277-282.
Hosie, M.J. 1976. The Rex Sole. Oregon Department of Fish and Wildlife, Informational Report
76-2. 5p. Hosie, M.J. 1976. The Arrowtooth Flounder. Oregon Department of Fish and Wildlife,
Informational Report 76-3. 4p. JCRMS (Joint Columbia River Management Staff). 2014. 2014 Joint Staff Report Concerning
Stock Status and Fisheries for Sturgeon and Smelt. Oregon Dept. Fish and Wildlife and Washington Dept. Fish and Wildlife.
Mallette, C. (Ed.), Studies of Eulachon Smelt in Oregon and Washington, prepared for the
National Oceanic and Atmospheric Administration, Washington, DC by the Oregon Department of Fish and Wildlife and the Washington Department of Fish and Wildlife. Grant No.: NA10NMF4720038.
NWFSC (Northwest Fisheries Science Center). 2006. West Coast Groundfish Observer Manual.
West Coast Groundfish Observer Program. NWFSC, 2725 Montlake Blvd. East, Seattle, Washington, 98112.
PFMC (Pacific Fishery Management Council). 2014. Pacific Coast Groundfish Fishery
Management Plan for the California, Oregon and Washington Groundfish Fishery. PFMC, Portland, Oregon. 146 p.
R Core Team (2012). R: A language and environment for statistical computing. R Foundation for
Statistical Computing, Vienna, Austria. ISBN 3-900051-07-0, URL http://www.R-
project.org/ Schweigert, J., Wood, C., Hay, D., M. McAllister, Boldt, J., McCarter, B., Therriault, T. W., and
H. Brekke. 2012. Recovery Potential Assessment of Eulachon (Thaleichthys pacificus) in Canada. DFO Can. Sci. Advis. Sec. Res. Doc. 2012/098. vii+ 121p.
Todd T. TenBrink & Thomas K. Wilderbuer (2015) Updated Maturity Estimates for Flatfishes
(Pleuronectidae) in the Eastern Bering Sea, with Implications for Fisheries Management, Marine and Coastal Fisheries, 7:1, 474-482, DOI: 10.1080/19425120.2015.1091411

Shrimp Trawl Operations and Bycatch of Eulachon Smelt, Rockfish, and Flatfish 140
Wallace, J. R., J. M. Cope. 2011. Status Update of the US canary rockfish resource in 2011. Pacific Fishery Management Council, Portland, Oregon.

Shrimp Trawl Operations and Bycatch of Eulachon Smelt, Rockfish, and Flatfish 141
Appendix 1: Coastal Commercial Pink Shrimp Fishery Regulations and Fishery Permits
WAC 220-52-050 Ocean pink shrimp trawl fishery—Coastal waters. It is unlawful to fish for, possess or deliver ocean pink shrimp taken for commercial purposes from the waters of the Exclusive Economic Zone, except as provided for in this section: Area (1) It is unlawful to fish for ocean pink shrimp within the territorial boundaries of the state. A violation of this subsection is punishable under RCW 77.15.550, Violation of commercial fishing area or time—Penalty. Season (2) It is unlawful to fish for, take, or possess on board a fishing vessel, pink shrimp, except during the following time: The open season for trawl gear is April 1 through October 31 of each year. A violation of this subsection is punishable under RCW 77.15.550, Violation of commercial fishing area or time—Penalty. Gear (3) It is unlawful to fish with trawl gear for pink shrimp for commercial purposes unless an approved by-catch reduction device is used in each net. A by-catch reduction device, also known as a finfish excluder, uses a rigid panel or grate of narrowly spaced bars to guide fish out of an escape hole forward of the panel, generally in the top of the net. An approved by-catch reduction device must meet the following criteria: (a) The exterior circumference of the rigid panel must fit completely within the interior circumference of the trawl net; (b) None of the openings between the bars in the rigid panel may exceed 0.75 inches; (c) The escape hole must, when spread open, expose a hole of at least 100 square inches; and (d) The escape hole must be forward of the rigid panel and must begin within four meshes of the furthest aft point of attachment of the rigid panel to the net. (4) It is unlawful to modify by-catch reduction devices in any way that interferes with their ability to allow fish to escape from the trawl, except as provided by special gear permit as described in subsection (5) of this section. (5) Testing of by-catch reduction devices is allowed by special gear permit only, consistent with the terms and conditions of the permit. (6) It is unlawful to remove trawl gear from the vessel prior to offloading shrimp without advance notification to WDFW enforcement. To provide advance notification, contact 360-902-2936, and then press zero when the recording begins. (7) A violation of subsections (3) through (6) of this section is punishable under RCW 77.15.520, Commercial fishing—Unlawful gear or methods—Penalty. (8) It is unlawful to land or deliver pink shrimp to an original receiver that exceeds the following count per pound restriction: The count per pound must average no more than 160 shrimp per pound for a minimum of two samples, increasing at a rate of one sample per one thousand pounds landed or in possession, up to a maximum requirement of twenty samples. Such samples shall consist of at least one pound each of whole, unbroken shrimp taken at random from

Shrimp Trawl Operations and Bycatch of Eulachon Smelt, Rockfish, and Flatfish 142
throughout the individual load landed or in possession. This landing restriction shall apply only to loads of 3,000 pounds of shrimp or more. A violation of this subsection is punishable under RCW 77.15.550, Violation of commercial fishing area or time—Penalty. Incidental catch (9) It is unlawful to take salmon incidental to any shrimp trawl fishery. (10) It is unlawful to retain any bottomfish species taken incidental to any shrimp trawl fishery, except as provided for in WAC 220-44-050. (11) It is unlawful to retain any species of shellfish, except that it is permissible to: (a) Retain up to 50 pounds round weight of other shrimp species taken incidentally in the ocean pink shrimp fishery; and (b) Retain octopus or squid. (12) A violation of subsections (9) through (11) of this section is punishable under RCW 77.15.550, Violation of commercial fishing area or time—Penalty. License (13) An ocean pink shrimp delivery license is required to operate the gear provided for in this section, and it allows the operator to retain shrimp taken in the waters of the Exclusive Economic Zone. A violation of this subsection is punishable under RCW 77.15.500, Commercial fishing without a license—Penalty. Permit (14) It is unlawful to fish for, retain, land, or deliver shrimp taken with trawl gear without a valid shrimp trawl fishery permit. (15) It is unlawful to take, retain, land, or deliver any shrimp or groundfish taken with trawl gear without complying with all provisions of a shrimp trawl fishery permit. (16) A violation of subsection (14) or (15) of this section is punishable under RCW 77.15.750. WAC 220-52-075 Shellfish harvest logs. (1) It is unlawful for any vessel operator engaged in the commercial harvest of crawfish, sea cucumber, sea urchin, scallop, shrimp other than ocean pink shrimp, or squid to fail to obtain and accurately maintain the appropriate harvest log available from the Washington department of fish and wildlife. It is unlawful for any license holder engaged in commercial sand shrimp fishing or operator of mechanical clam digging device to fail to obtain and accurately maintain the appropriate harvest log available from the Washington department of fish and wildlife. (2) It is unlawful for any harvest vessel operator or license holder engaged in harvest as described in subsection (1) of this section, to fail to maintain the required harvest log: Aboard the vessel; at the harvest site; when crawfish, sea cucumbers, sea urchins, shrimp other than ocean pink shrimp, squid, scallops, clams, or sand shrimp are aboard during transit of a harvest vessel; or are in possession of the license holder. (3) It is unlawful for the vessel operator or license holder, engaged in harvest as described in subsection (1) of this section, to fail to submit harvest logs for inspection upon request by department of fish and wildlife officers or authorized employees. (4) It is unlawful for any vessel operator or license holder, engaged in harvest as described in subsection (1) of this section, to fail to comply with the following methods of logbook submittal and time frames related to harvest logbook submittal:

Shrimp Trawl Operations and Bycatch of Eulachon Smelt, Rockfish, and Flatfish 143
(a) Within ten days following any calendar month in which fishing occurred, required completed harvest logs must be received by the department; however, vessel operators or license holders may submit logs directly to authorized department employees. (b) Vessel operators or license holders responsible for submitting logs to the department, as described in subsection (1) of this section, must maintain a copy of all submitted logs for a period of three years following the harvest activity. Copies of harvest logs, which are required to be maintained, must be available for inspection upon request by department of fish and wildlife officers and authorized employees. (c) Original harvest logs must be maintained and submitted in ascending consecutive order of log serial number. (5) It is unlawful for any vessel operator or license holder, engaged in harvest as described in subsection (1) of this section, to fail to send completed harvest logs to the appropriate following mailing address, except as provided for in subsection (4)(a) of this section. For Shrimp Harvest Logbooks: ATTN: SHRIMP HARVEST MANAGER Washington Department of Fish and Wildlife 48 Devonshire Road Montesano, WA 98563

Shrimp Trawl Operations and Bycatch of Eulachon Smelt, Rockfish, and Flatfish 144
2010 Coastal Shrimp Fishery Permit

Shrimp Trawl Operations and Bycatch of Eulachon Smelt, Rockfish, and Flatfish 145
2011 Coastal Shrimp Fishery Permit

Shrimp Trawl Operations and Bycatch of Eulachon Smelt, Rockfish, and Flatfish 146
2012 Coastal Shrimp Fishery Permit

Shrimp Trawl Operations and Bycatch of Eulachon Smelt, Rockfish, and Flatfish 147
Appendix 2: WDFW Pink Shrimp Trawl Logbook

Shrimp Trawl Operations and Bycatch of Eulachon Smelt, Rockfish, and Flatfish 148
Appendix 3: Observer Data Collection Sheets

Shrimp Trawl Operations and Bycatch of Eulachon Smelt, Rockfish, and Flatfish 149

Shrimp Trawl Operations and Bycatch of Eulachon Smelt, Rockfish, and Flatfish 150

Shrimp Trawl Operations and Bycatch of Eulachon Smelt, Rockfish, and Flatfish 151
Observer Trip FormStat week: ______
Page:___of___
Excluding Bar Spacing: _______
Degrees Minutes Degrees Minutes
SET
UP
SET
UP
SET
UP
SET
UP
SET
UP
SET
UP
SET
UP
Weigh Methods: 1‐ Actual 2‐ Bin/Alley/Hopper 3‐ Visual by Skipper 4‐ Visual by Observer
Skipper Log #:____________________
DEPTH
(ftm)
TIME
(24 HR)
LATITUDE LONGITUDECOMMENTSDATE
TOW
#
SPEED
(kts)
Weigh
Method
Total
Catch
Volume
(M3)
Total
Catch
Density
(lbs/M3)
Observer: Landing Date:
Vessel Name: Fish Ticket:
USCG #: Landing Port:
Total
Catch
Estimate
(lbs)
Skipper
Estimate
Trip Form Front. Location and catch information were recorded here. TOW
BIN AREA
X = ÷ = X =
TOW
BIN AREA
X = ÷ = X =
TOW
BIN AREA
X = ÷ = X =
BIN DEPTHS BASKET WEIGHTS LENGTH UNITS = Meters WEIGHT = POUNDS
TOTAL
CATCH
VOLUME
TOTAL
CATCH
VOLUME
TOTAL CATCH
ESTIMATE
BASKET
VOLUME
CATCH
DENSITYAVERAGE DEPTH AVERAGE WEIGHT
BIN DEPTHS BASKET WEIGHTS LENGTH UNITS = Meters WEIGHT = POUNDS
TOTAL
CATCH
VOLUME
TOTAL
CATCH
VOLUME
TOTAL CATCH
ESTIMATE
BASKET
VOLUME
CATCH
DENSITYAVERAGE DEPTH AVERAGE WEIGHT
BIN DEPTHS BASKET WEIGHTS LENGTH UNITS = Meters WEIGHT = POUNDS
TOTAL
CATCH
VOLUME
TOTAL
CATCH
VOLUME
TOTAL CATCH
ESTIMATE
BASKET
VOLUME
CATCH
DENSITYAVERAGE DEPTH AVERAGE WEIGHT
Trip Form Front. This worksheet was used to calculate volumetric estimates of catch dumped in to the hoppers.

Shrimp Trawl Operations and Bycatch of Eulachon Smelt, Rockfish, and Flatfish 152
Circle:
Vessel: Date:
USCG #: Tow:
Landing Port:
Observer:
Catch Composition Whole Haul Bycatch Subsample Stat Week: _____ Page ___of___
Fish Ticket:
Whole Haul Bycatch SubsampleR
or
D
Species/CategoryWeigh
Metho
Sample
Method
Total
Weight
Total #
Fish50 Fish
Weight
Sample
Weight# Fish
Unsorted
WeightComments
Weight Methods: 1‐ Actual 2‐ Bin/Alley/Hopper 3‐ Visual by Skipper 4‐ Visual by Observer
Sample Methods: 1‐ Total Sample 2‐ 50 Fish Subsample Catch Compostion Form. Used to collect weight information for the observed bycatch.
Date: Vessel:
Tow: Observer:
Fish Ticket #: Landing Port:
1 1 1 1 1 1
2 2 2 2 2 2
3 3 3 3 3 3
4 4 4 4 4 4
5 5 5 5 5 5
Vials:
Length (mm) Length (mm) Length (mm) Length (mm) Length (mm) Length (mm)
Vials: Vials: Vials: Vials: Vials:
Page:___of___
Stat Week: ____
Wt: Wt: Wt: Wt: Wt: Wt:
Species: Species: Species: Species: Species: Species:
Length Frequency
Length Frequency Form. Lengths and tissue sample information were recorded here.