washington state climate change impacts assessment: implications of 21 st century climate change for...
Post on 22-Dec-2015
213 views
TRANSCRIPT
Washington StateClimate Change
Impacts Assessment:
Implications of 21st century climate change for the hydrology of Washington
Marketa M Elsner1
with Lan Cuo2, Nathalie Voisin2, Jeffrey S Deems2, Alan F Hamlet1,2, Julie A Vano2, Kristian EB Mickelson2, Se-Yeun Lee2, and Dennis P Lettenmaier1,2
1) Center for Science in the Earth System, Climate Impacts Group, University of Washington, Seattle, WA 981952) Dept. of Civil and Environmental Engineering, University of Washington, Seattle, WA 98195
Climate science in the public interest
Overview
• Approach– incorporating climate change information into
modeling• Hydrologic Simulations
– Models, their inputs, climate change projections– Focus watersheds
• Findings– Washington and focus watersheds
• Conclusion
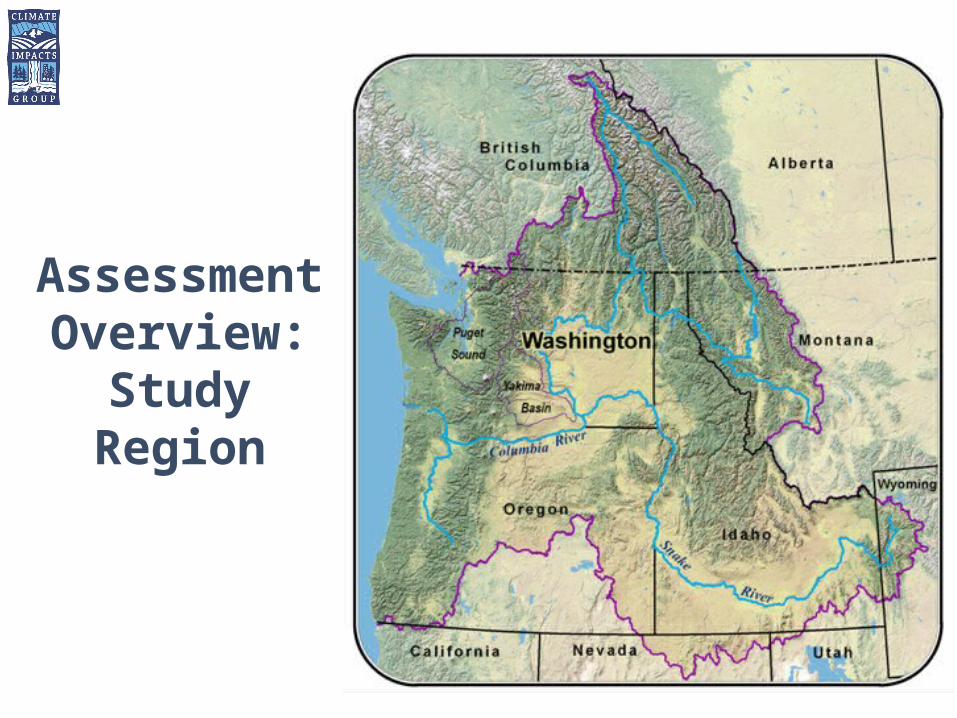
Assessment Overview:
Study Region
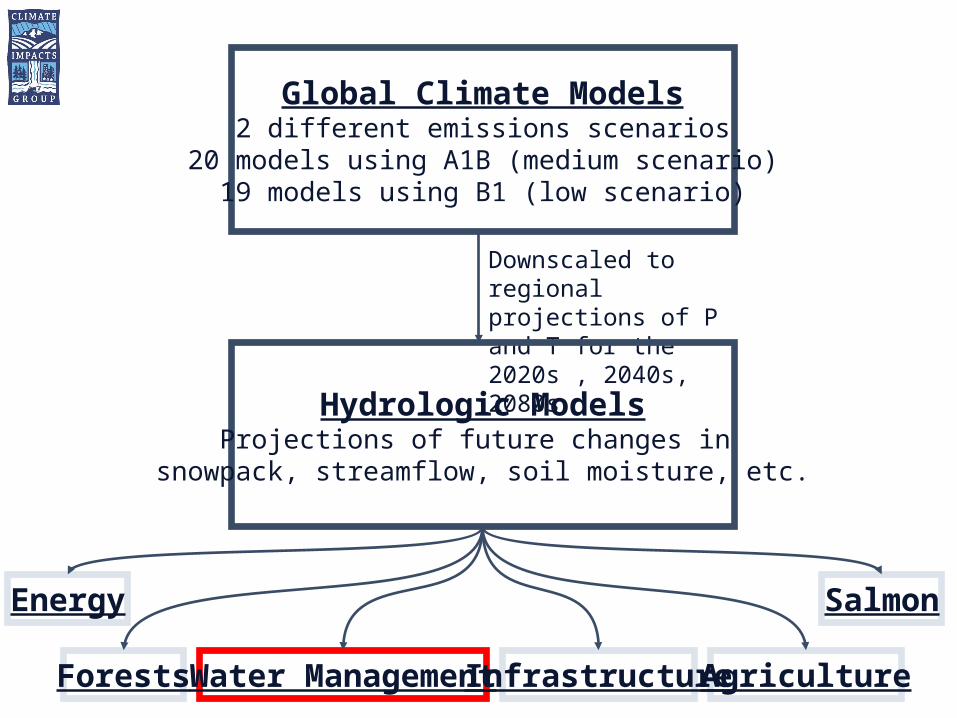
Global Climate Models2 different emissions scenarios
20 models using A1B (medium scenario)19 models using B1 (low scenario)
Downscaled to regional projections of P and T for the 2020s , 2040s, 2080s
Hydrologic ModelsProjections of future changes in
snowpack, streamflow, soil moisture, etc.
Energy
Water ManagementForests Agriculture
Salmon
Infrastructure
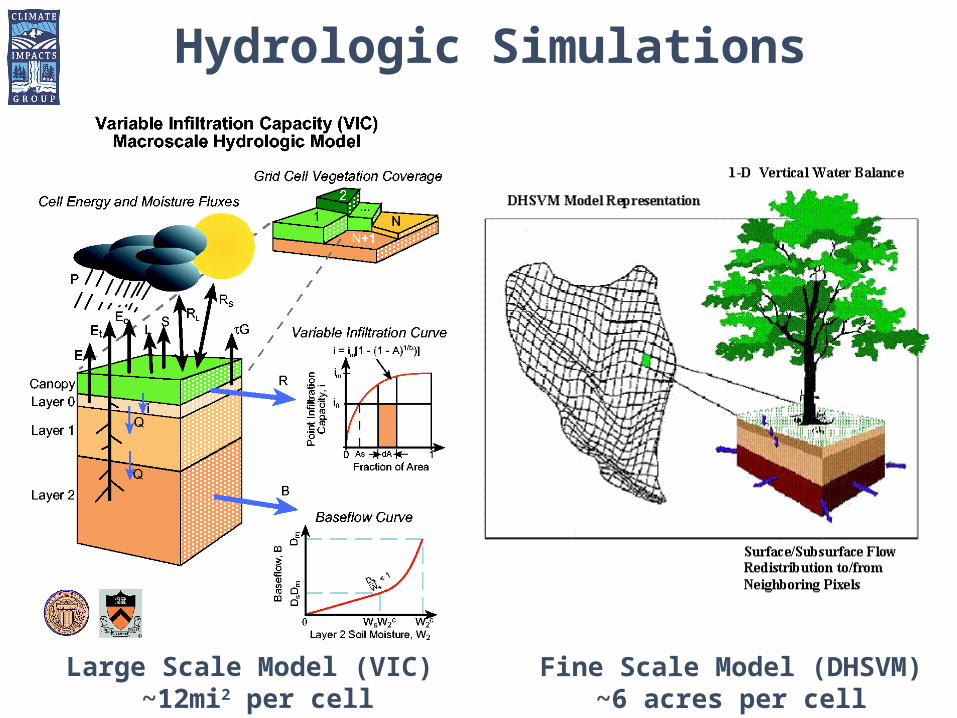
Large Scale Model (VIC) ~12mi2 per cell
Hydrologic Simulations
Fine Scale Model (DHSVM)~6 acres per cell
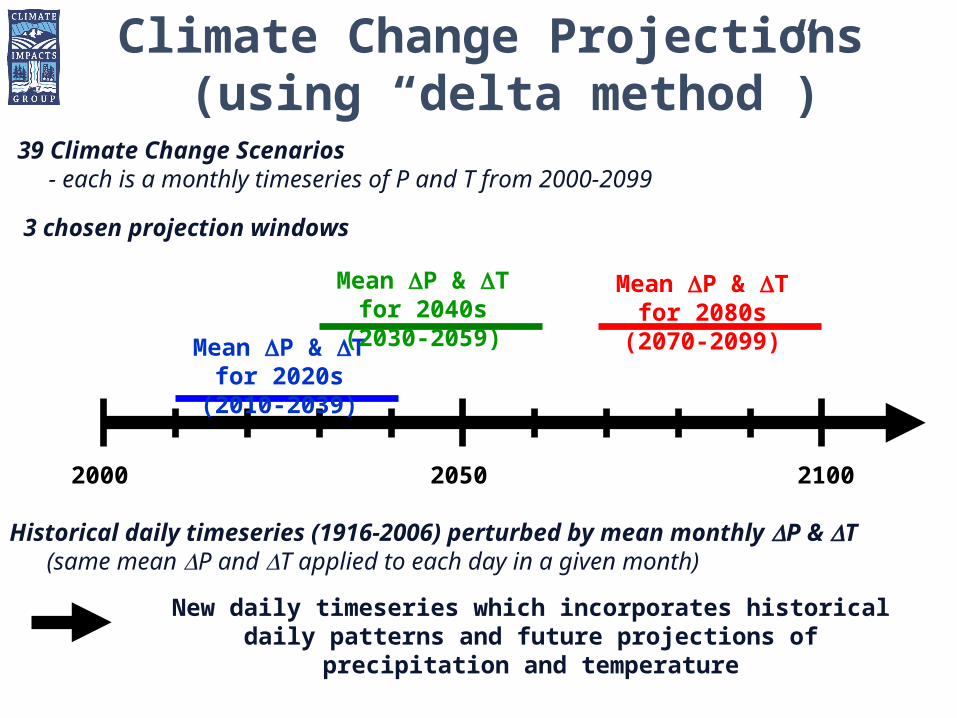
Climate Change Projections (using “delta method”)
39 Climate Change Scenarios - each is a monthly timeseries of P and T from 2000-2099
3 chosen projection windows
2000 2050 2100
Mean P & T for 2020s (2010-2039)
Mean P & T for 2040s (2030-2059)
Mean P & T for 2080s (2070-2099)
Historical daily timeseries (1916-2006) perturbed by mean monthly P & T (same mean P and T applied to each day in a given month)
New daily timeseries which incorporates historical daily patterns and future projections of precipitation and temperature
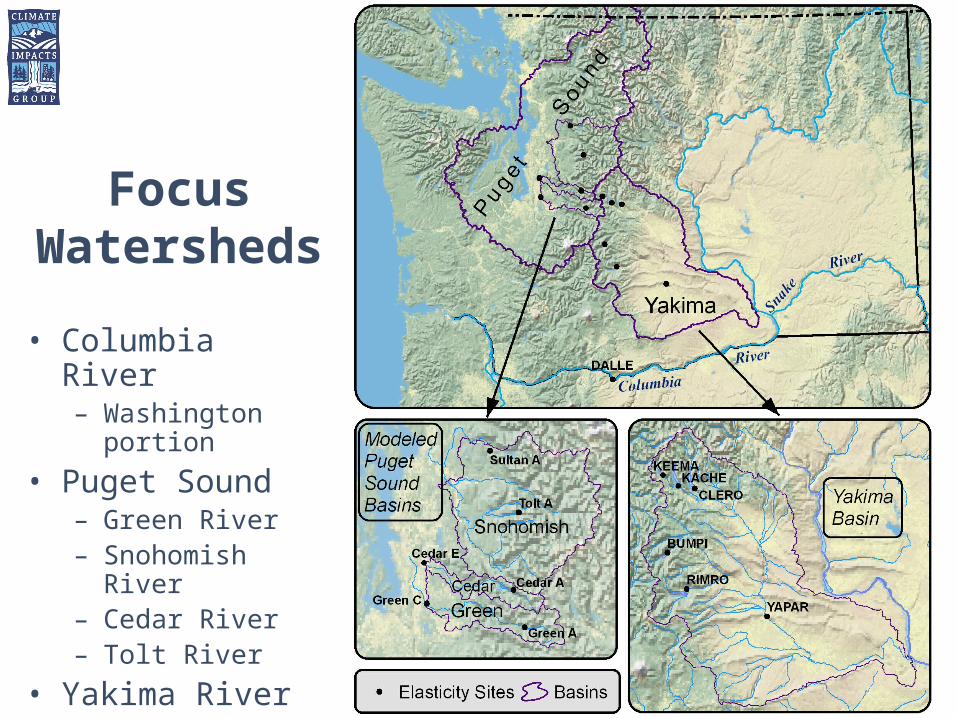
Focus Watersheds
• Columbia River– Washington portion
• Puget Sound– Green River– Snohomish River– Cedar River– Tolt River
• Yakima River
Implications of 21st century climate changeon Washington’s watersheds
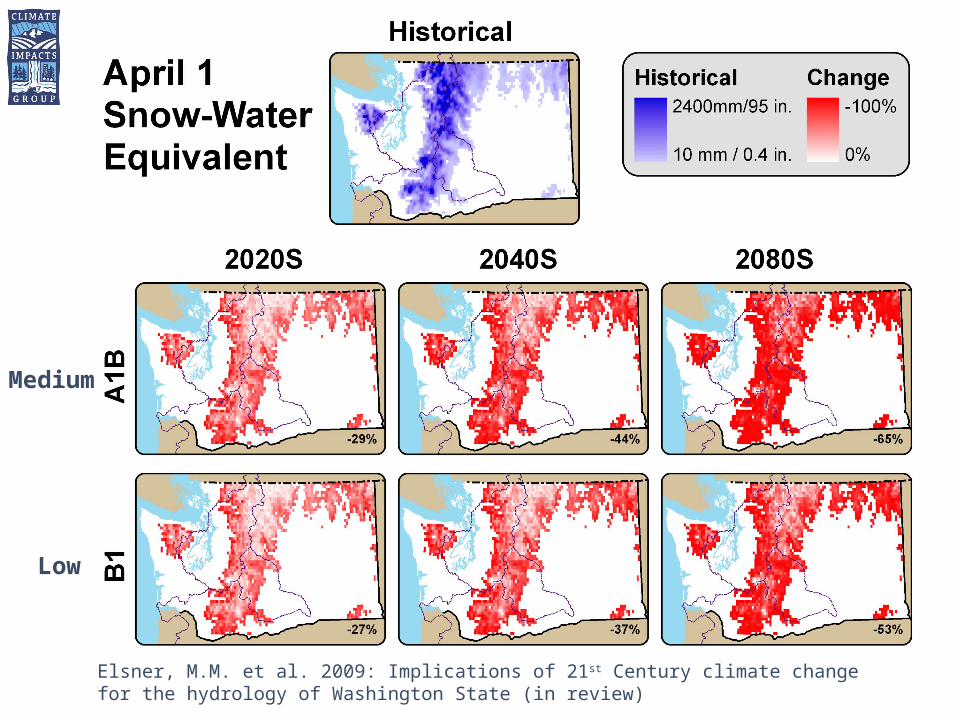
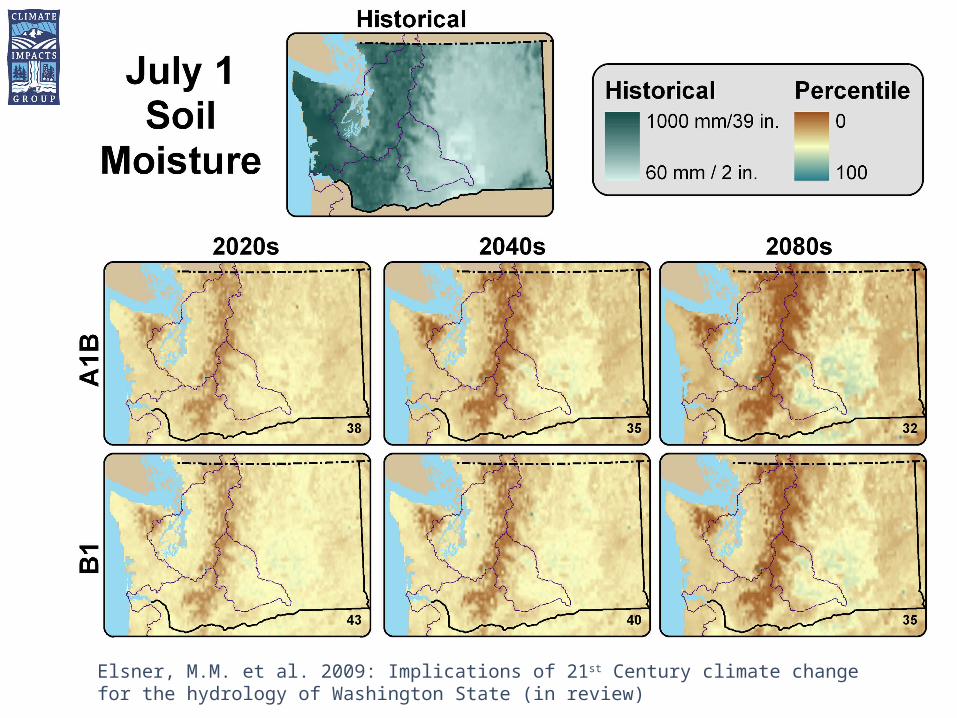
Elsner, M.M. et al. 2009: Implications of 21st Century climate change for the hydrology of Washington State (in review)
Low
Medium
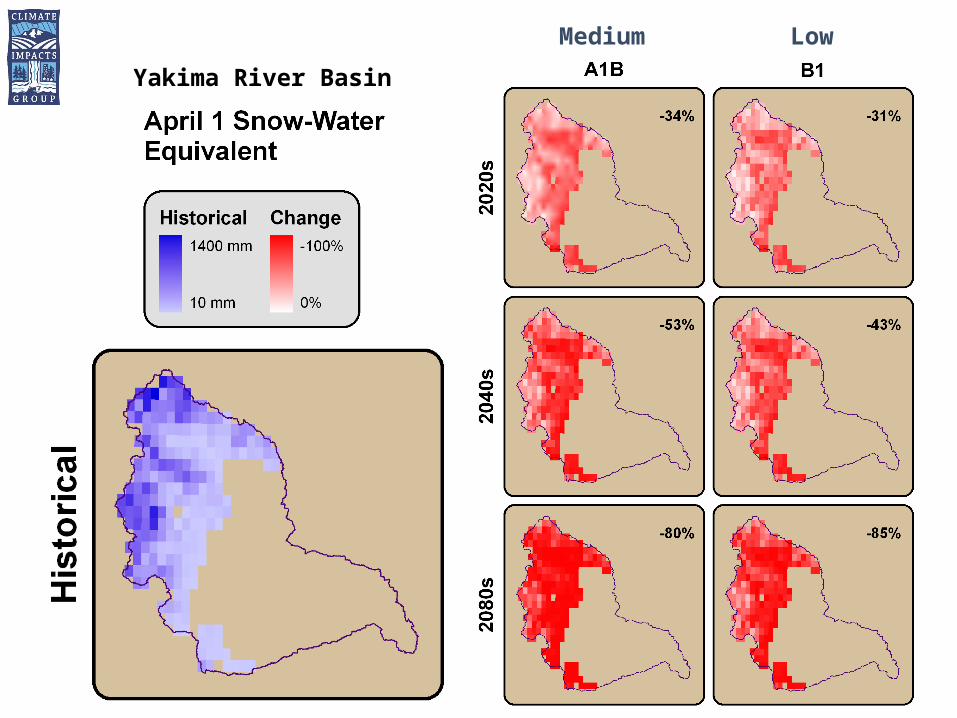
Yakima River Basin
LowMedium
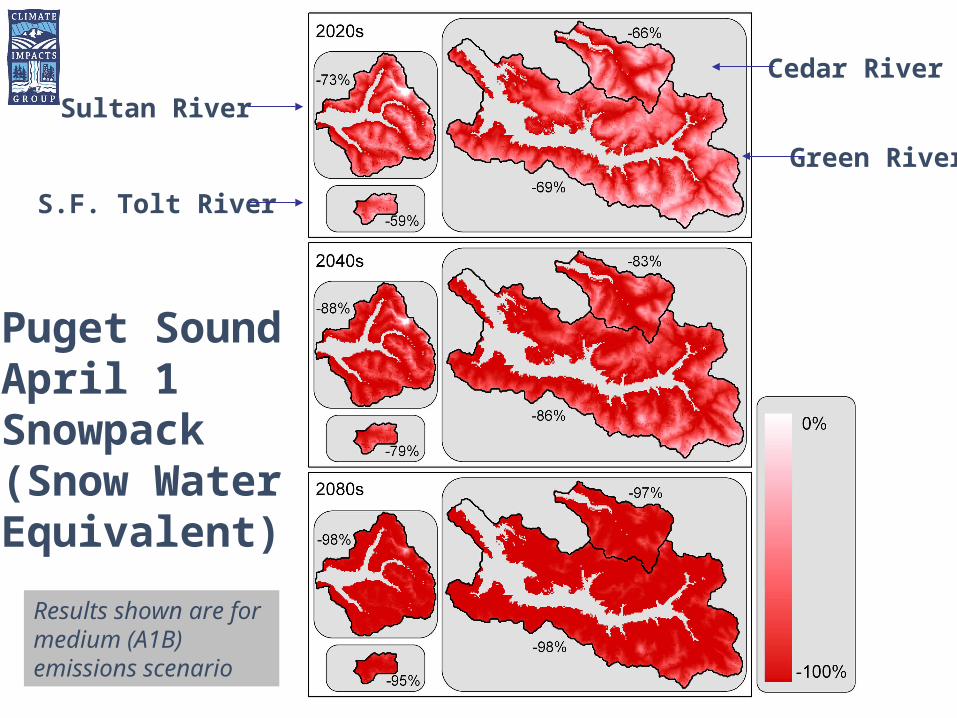
S.F. Tolt River
Green River
Sultan RiverCedar River
Puget SoundApril 1Snowpack(Snow Water Equivalent)
Results shown are for medium (A1B) emissions scenario
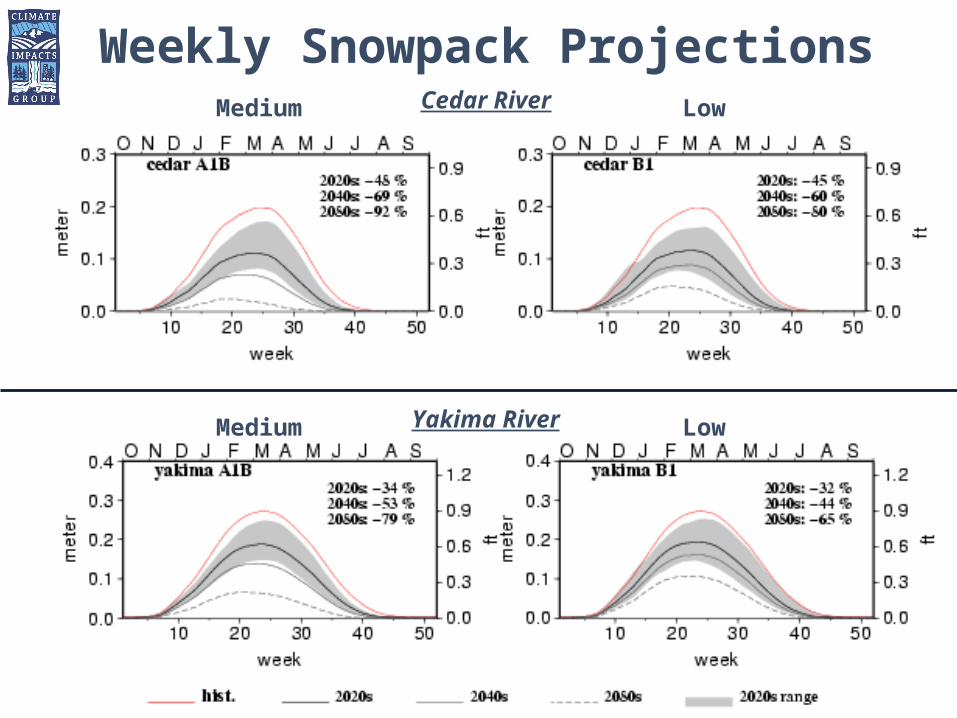
Weekly Snowpack ProjectionsCedar River
Yakima River
LowMedium
LowMedium
Elsner, M.M. et al. 2009: Implications of 21st Century climate change for the hydrology of Washington State (in review)
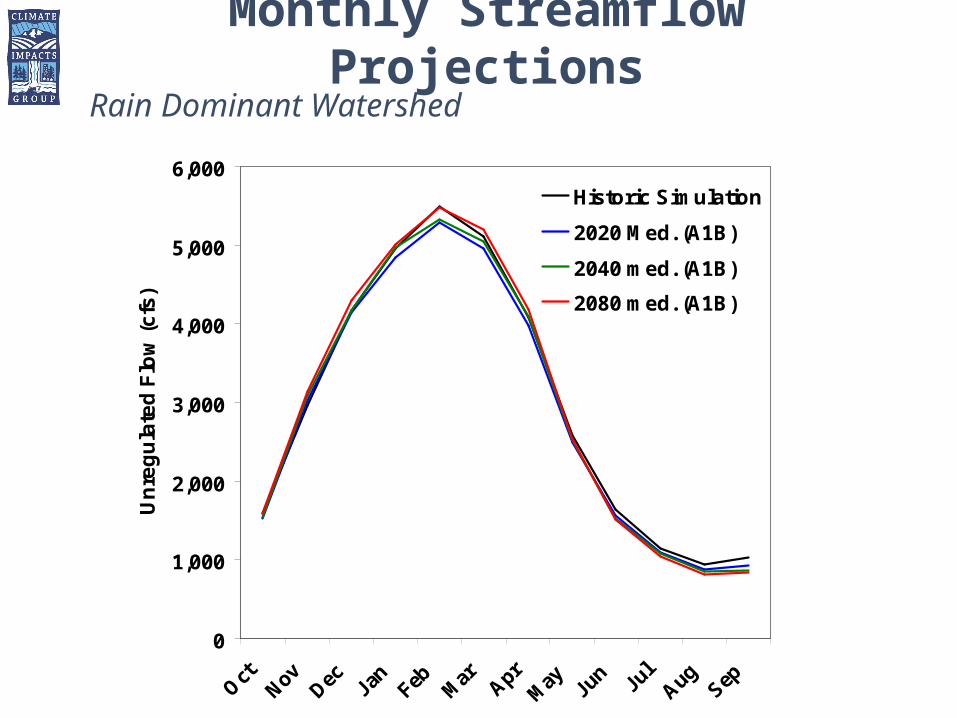
Rain Dominant Watershed
0
1,000
2,000
3,000
4,000
5,000
6,000
OctNov Dec Ja
nFeb M
ar AprM
ay Jun Ju
lAug Sep
Un
reg
ula
ted
Flo
w (
cfs
)
Historic Simulation
2020 Med. (A1B)
2040 med. (A1B)
2080 med. (A1B)
Chehalis River (at Porter)
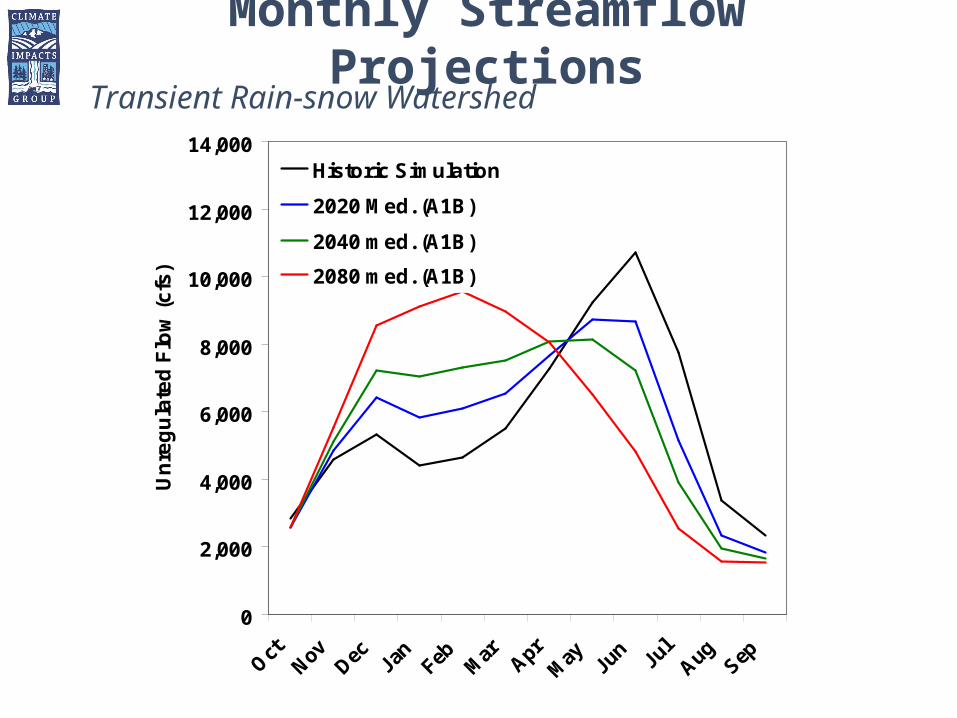
Monthly Streamflow Projections
0
2,000
4,000
6,000
8,000
10,000
12,000
14,000
OctNov Dec Ja
nFeb M
ar AprM
ay Jun Ju
lAug Sep
Un
reg
ula
ted
Flo
w (
cfs
)Historic Simulation
2020 Med. (A1B)
2040 med. (A1B)
2080 med. (A1B)
Yakima River (at Parker)
Transient Rain-snow Watershed
Monthly Streamflow Projections
0
50,000
100,000
150,000
200,000
250,000
300,000
350,000
400,000
450,000
OctNov
Dec Jan
Feb Mar Apr
May Ju
nJu
lAug
Sep
Un
reg
ula
ted
Flo
w (
cfs)
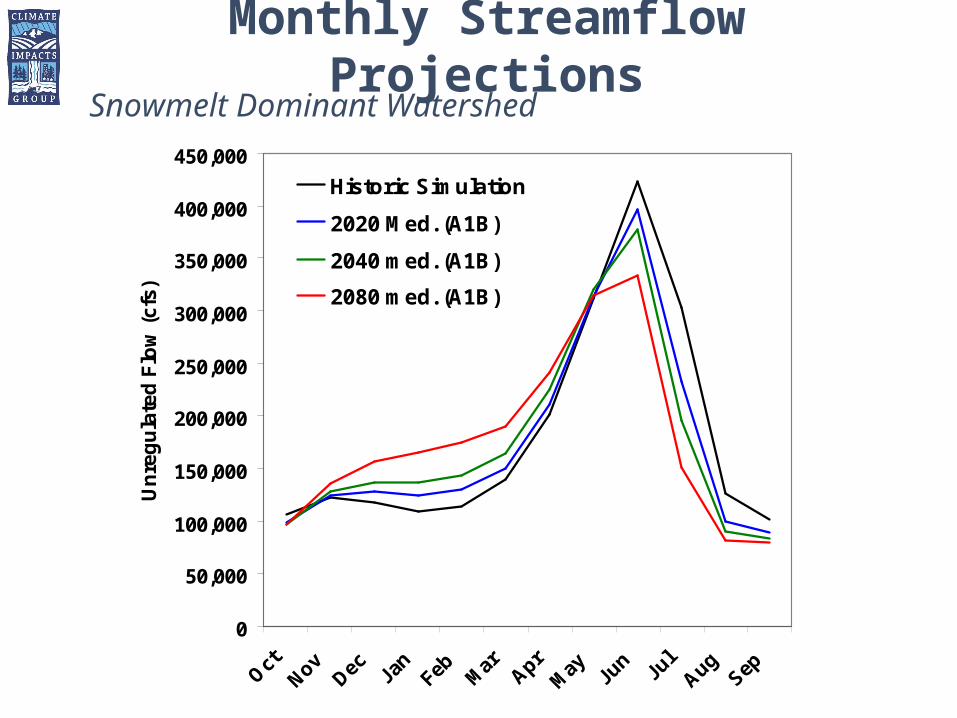
Historic Simulation
2020 Med. (A1B)
2040 med. (A1B)
2080 med. (A1B)
Columbia River (The Dalles)
Snowmelt Dominant Watershed
Monthly Streamflow Projections
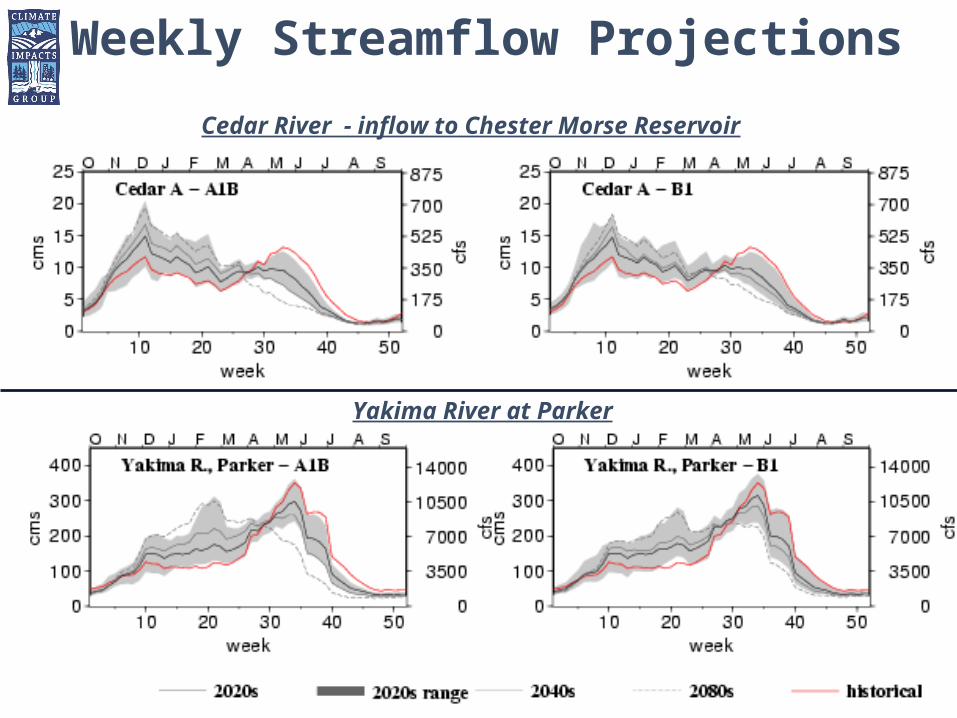
Cedar River - inflow to Chester Morse Reservoir
Weekly Streamflow Projections
Yakima River at Parker
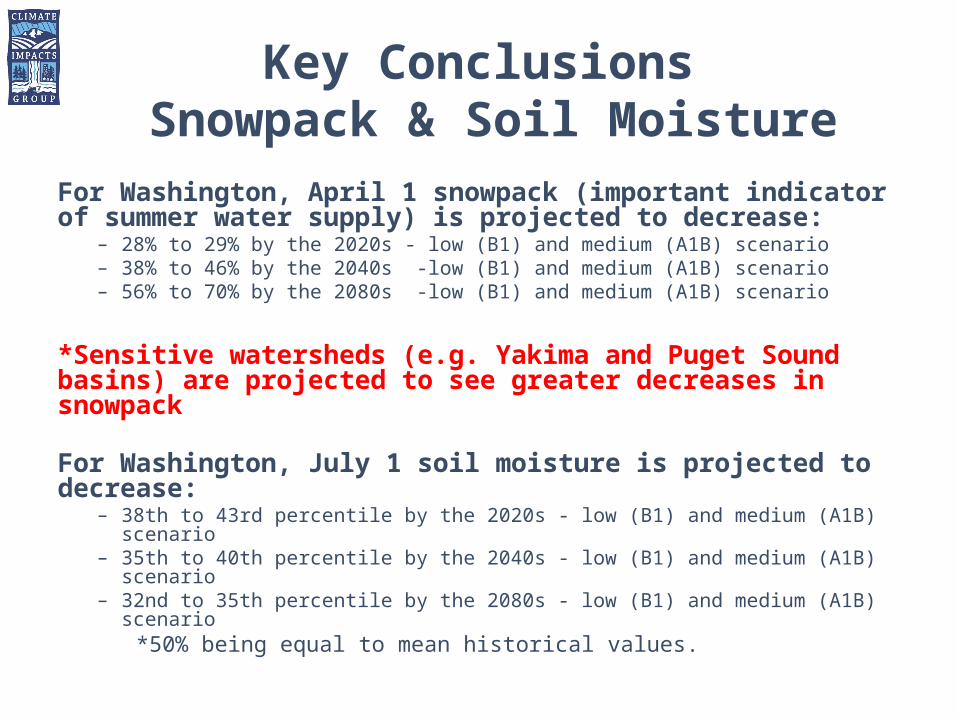
Key Conclusions Snowpack & Soil Moisture
For Washington, April 1 snowpack (important indicator of summer water supply) is projected to decrease:
– 28% to 29% by the 2020s - low (B1) and medium (A1B) scenario– 38% to 46% by the 2040s -low (B1) and medium (A1B) scenario– 56% to 70% by the 2080s -low (B1) and medium (A1B) scenario
*Sensitive watersheds (e.g. Yakima and Puget Sound basins) are projected to see greater decreases in snowpack
For Washington, July 1 soil moisture is projected to decrease:– 38th to 43rd percentile by the 2020s - low (B1) and medium (A1B) scenario– 35th to 40th percentile by the 2040s - low (B1) and medium (A1B) scenario– 32nd to 35th percentile by the 2080s - low (B1) and medium (A1B) scenario
*50% being equal to mean historical values.
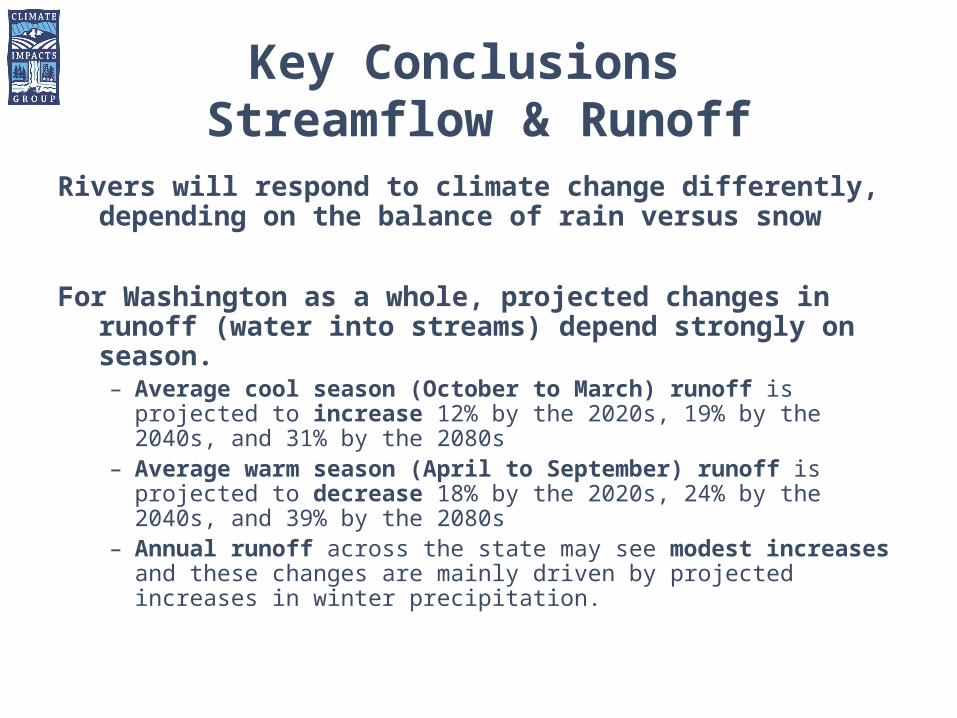
Key Conclusions Streamflow & Runoff
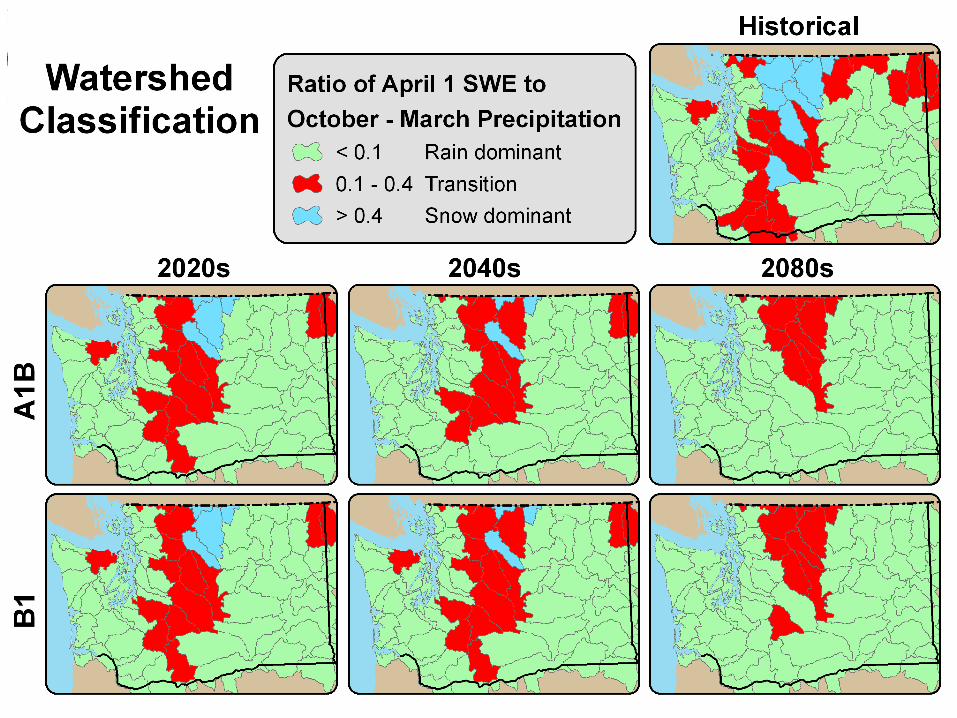
Rivers will respond to climate change differently, depending on the balance of rain versus snow
For Washington as a whole, projected changes in runoff (water into streams) depend strongly on season. – Average cool season (October to March) runoff is projected to
increase 12% by the 2020s, 19% by the 2040s, and 31% by the 2080s– Average warm season (April to September) runoff is projected to
decrease 18% by the 2020s, 24% by the 2040s, and 39% by the 2080s– Annual runoff across the state may see modest increases and these
changes are mainly driven by projected increases in winter precipitation.

The Climate Impacts Groupwww.cses.washington.ed/cig
Marketa McGuire [email protected]
For more information:
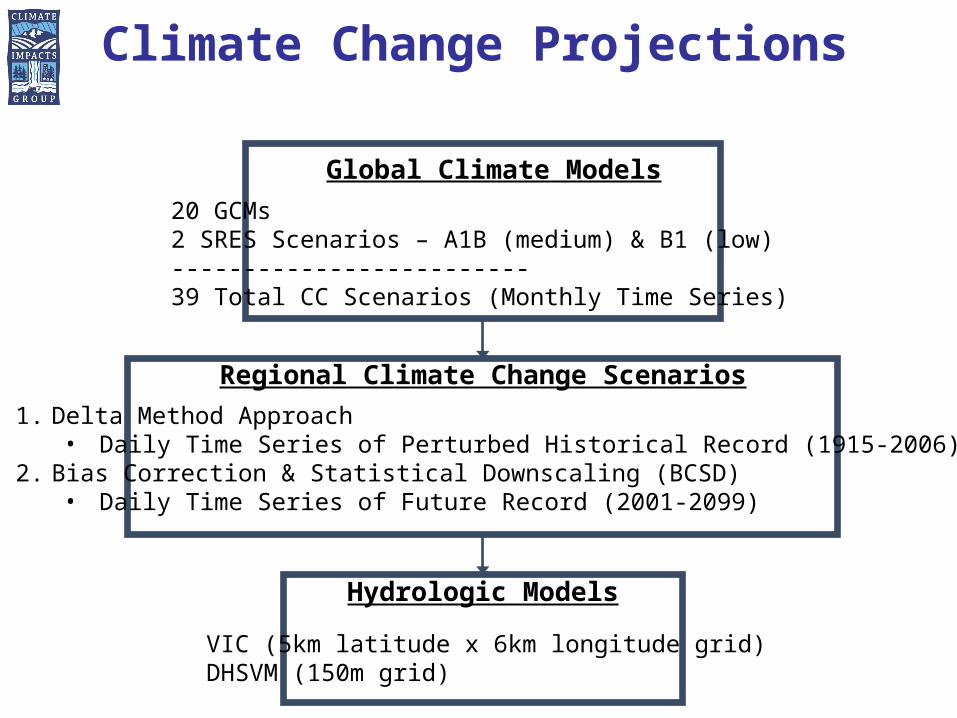
Climate Change Projections
Hydrologic Models
Regional Climate Change Scenarios
20 GCMs2 SRES Scenarios – A1B (medium) & B1 (low)-------------------------39 Total CC Scenarios (Monthly Time Series)
Global Climate Models
1. Delta Method Approach• Daily Time Series of Perturbed Historical Record (1915-2006)
2. Bias Correction & Statistical Downscaling (BCSD)• Daily Time Series of Future Record (2001-2099)
VIC (5km latitude x 6km longitude grid)DHSVM (150m grid)
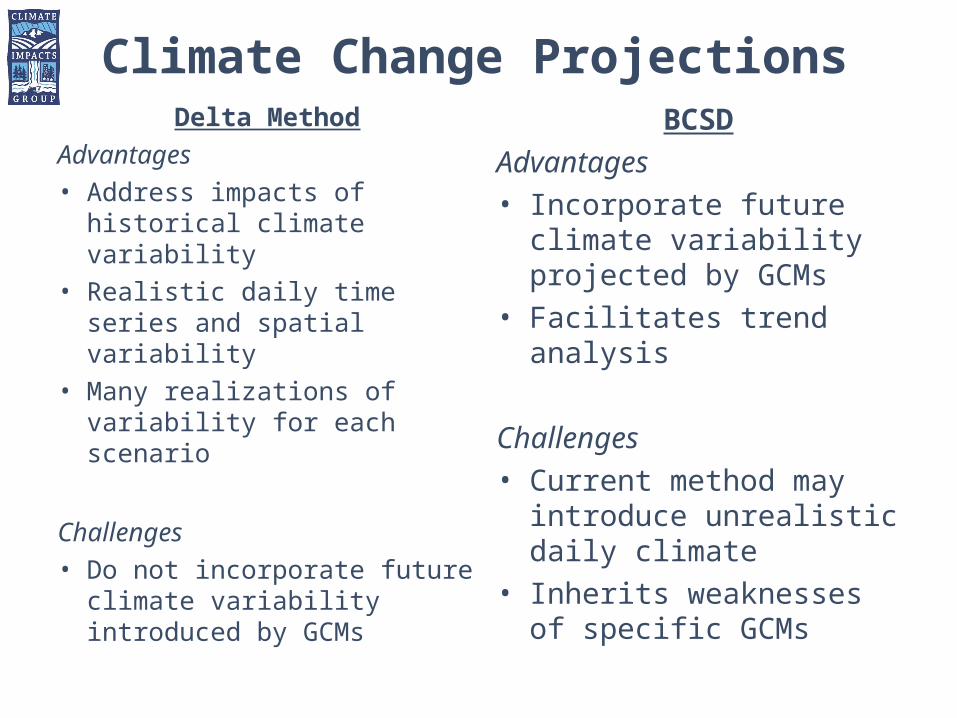
Delta MethodAdvantages• Address impacts of historical
climate variability• Realistic daily time series and
spatial variability• Many realizations of
variability for each scenario
Challenges• Do not incorporate future
climate variability introduced by GCMs
BCSDAdvantages• Incorporate future climate
variability projected by GCMs
• Facilitates trend analysis
Challenges• Current method may
introduce unrealistic daily climate
• Inherits weaknesses of specific GCMs
Climate Change Projections
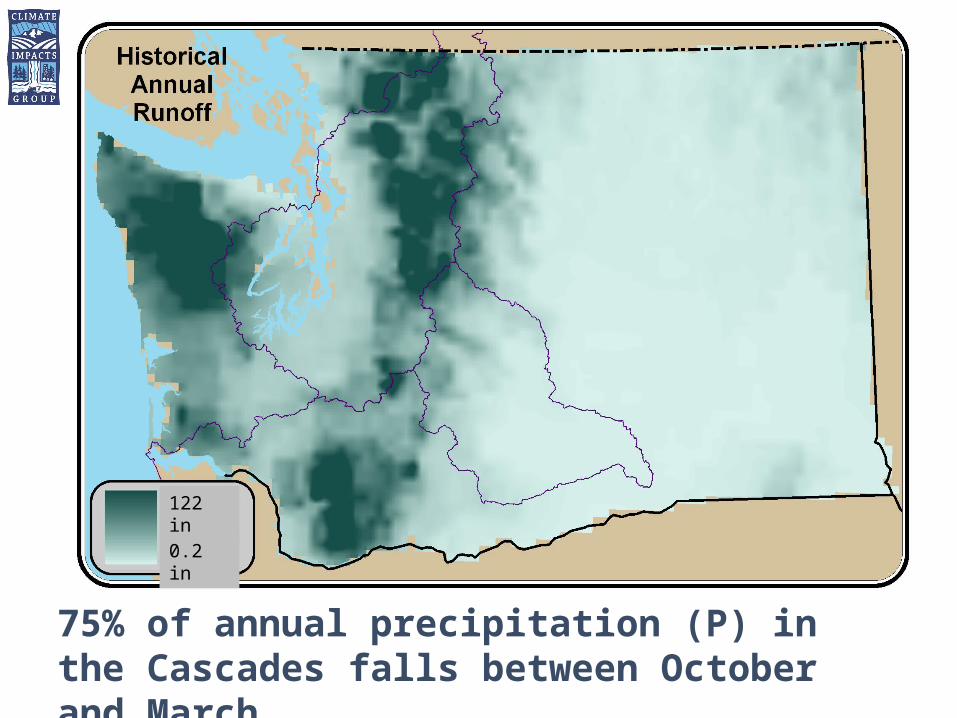
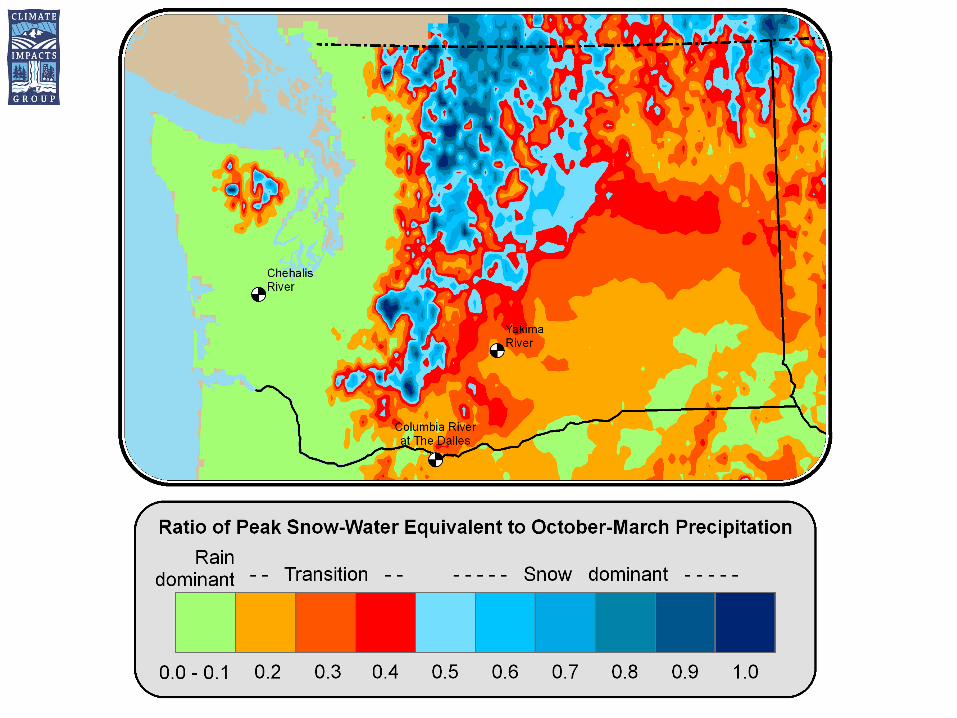
122 in
0.2 in
75% of annual precipitation (P) in the Cascades falls between October and March