washoe county school district
TRANSCRIPT

Washoe County School DistrictComprehensive
Annual Financial Report
Fiscal Year Ended June 30, 2009
Prepared By:Business & Financial Services Division
Gary Kraemer, CPA Thomas Ciesynski, CPA ChiefFinancialOfficer ChiefAccountant
Michael Schroeder, CPA Gail Carson SeniorBudgetAnalyst SeniorAccountant
Rob Luna Lisa Woods GrantFiscalAdministrator SeniorAccountant
Cheryl Hong Stephen Ashorn BudgetAnalyst BondAccountant
Richard Odynski Tracy Hodge BudgetAnalyst GrantAccountant

Washoe County School DistrictSuperintendent & Board of Trustees
Estela GutierrezBoard of Trustees
Vice President
Scott KelleyBoard of Trustees
Member
Paul DuganSuperintendent
Ken GreinBoard of Trustees
Member
Dan CarneBoard of Trustees
Member
Barbara McLauryBoard of Trustees
Member
Nancy HollingerBoard of Trustees
Member
Barbara ClarkBoard of Trustees
President

WASHOE COUNTY SCHOOL DISTRICT
COMPREHENSIVE ANNUAL FINANCIAL REPORT FISCAL YEAR ENDED JUNE 30, 2009
TABLE OF CONTENTS
PAGE NO. I. INTRODUCTORY SECTION Letter of Transmittal i-v List of Principal Officials vi Organizational Chart vii Certificate of Excellence in Financial Reporting viii II. FINANCIAL SECTION Independent Auditor's Report 1-2 Management’s Discussion and Analysis 3-16 Basic Financial Statements: Government-wide Financial Statements: Statement of Net Assets 17 Statement of Activities 18 Fund Financial Statements: Governmental Funds: Balance Sheet 19-20 Reconciliation of the Governmental Funds Balance Sheet to the Statement of Net Assets 21 Statement of Revenues, Expenditures and Changes in Fund Balances 22-25 Reconciliation of the Governmental Funds Statement of Revenues, Expenditures and Changes in Fund Balance to the Statement of Activities 26 Statement of Revenues, Expenditures and Changes in Fund Balances – Budget and Actual General Fund 27 Major Special Revenue Fund: Special Education 28 Proprietary Funds: Statement of Net Assets 29 Statement of Revenues, Expenses and Changes in Net Assets 30 Statement of Cash Flows 31 Fiduciary Funds: Statement of Fiduciary Net Assets 32 Statement of Changes in Fiduciary Net Assets 33

WASHOE COUNTY SCHOOL DISTRICT
COMPREHENSIVE ANNUAL FINANCIAL REPORT FISCAL YEAR ENDED JUNE 30, 2009
TABLE OF CONTENTS
Notes to Financial Statements 34-63 Required Supplementary Information:
Schedules of Funding Progress and Schedules of Employer Contributions 64 Combining and Individual Fund Statements and Schedules: Nonmajor Governmental Funds: Combining Balance Sheet 65 Combining Statement of Revenues, Expenditures and Changes in Fund Balances 66 Governmental Funds: Comparative Balance Sheet – General Fund 67 Schedules of Revenues, Expenditures and Changes in Fund Balances – Budget and Actual General Fund 68-72 Special Revenue Funds: Major Special Revenue Fund: Special Education 73-74 Special Revenue Funds: Nonmajor Special Revenue Funds: Combining Balance Sheet 75-79 Combining Statement of Revenues, Expenditures and Changes in Fund Balance 80-84 Schedule of Revenues, Expenditures and Changes in Fund Balance - Budget and Actual Title I 85 Title V 86 Indian Education 87 Federal Special Education 88 Vocational Education 89 Special Grants 90 Family Resource Centers 91 Adult Education 92 Class Size Reduction 93 Drug Free Schools 94 Early Childhood 95 Special State Appropriations 96
WASHOE COUNTY SCHOOL DISTRICT
COMPREHENSIVE ANNUAL FINANCIAL REPORT FISCAL YEAR ENDED JUNE 30, 2009
TABLE OF CONTENTS
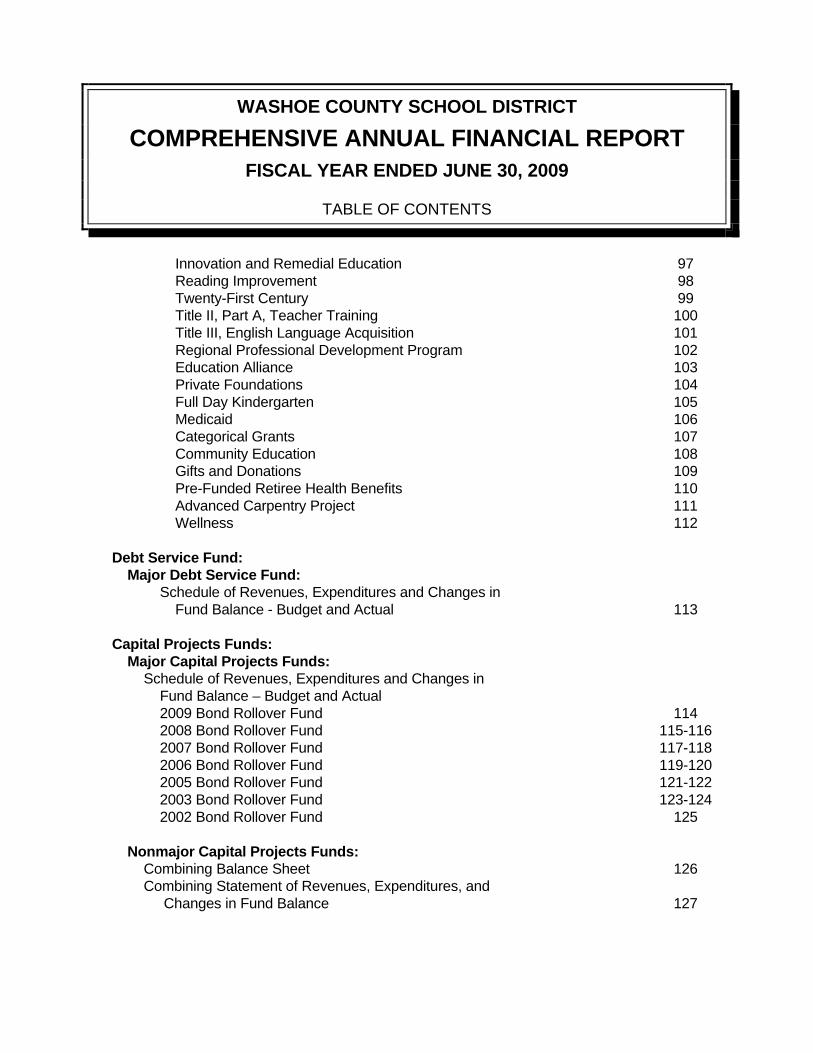
Innovation and Remedial Education 97 Reading Improvement 98 Twenty-First Century 99 Title II, Part A, Teacher Training 100 Title III, English Language Acquisition 101 Regional Professional Development Program 102 Education Alliance 103 Private Foundations 104 Full Day Kindergarten 105 Medicaid 106 Categorical Grants 107 Community Education 108 Gifts and Donations 109 Pre-Funded Retiree Health Benefits 110 Advanced Carpentry Project 111 Wellness 112 Debt Service Fund: Major Debt Service Fund: Schedule of Revenues, Expenditures and Changes in Fund Balance - Budget and Actual 113 Capital Projects Funds: Major Capital Projects Funds: Schedule of Revenues, Expenditures and Changes in Fund Balance – Budget and Actual 2009 Bond Rollover Fund 114 2008 Bond Rollover Fund 115-116 2007 Bond Rollover Fund 117-118 2006 Bond Rollover Fund 119-120 2005 Bond Rollover Fund 121-122 2003 Bond Rollover Fund 123-124 2002 Bond Rollover Fund 125 Nonmajor Capital Projects Funds: Combining Balance Sheet 126 Combining Statement of Revenues, Expenditures, and Changes in Fund Balance 127

WASHOE COUNTY SCHOOL DISTRICT
COMPREHENSIVE ANNUAL FINANCIAL REPORT FISCAL YEAR ENDED JUNE 30, 2009
TABLE OF CONTENTS
Schedule of Revenues, Expenditures and Changes in Fund Balance - Budget and Actual Government Services Tax Fund 128-129 1999 Bond Fund 130 Building and Sites Fund 131 1998 Bond Extraordinary Maintenance Fund 132 Proprietary Funds: Nutrition Services Enterprise Fund: Statement of Net Assets 133 Schedule of Revenues, Expenses, and Changes in Net Assets – Budget and Actual 134 Schedule of Cash Flows – Budget and Actual 135 Internal Service Funds: Combining Statement of Net Assets 136 Combining Statement of Revenues, Expenses, and Changes in Net Assets 137 Combining Statement of Cash Flows 138 Insurance Fund - Property and Casualty: Schedule of Revenues, Expenses and Changes in Net Assets - Budget and Actual 139 Schedule of Cash Flows - Budget and Actual 140 Insurance Fund - Health Insurance: Schedule of Revenues, Expenses and Changes in Net Assets - Budget and Actual 141 Schedule of Cash Flows - Budget and Actual 142 Insurance Fund - Workers’ Compensation: Schedule of Revenues, Expenses and Changes in Net Assets - Budget and Actual 143 Schedule of Cash Flows - Budget and Actual 144 Fiduciary Funds: Other Postemployment Benefits (OPEB) Trust Fund: Statement of Net Assets 145 Schedule of Changes in Plan Net Assets 146 Combining Statement of Changes in Assets and Liabilities 147 Student Activity Funds Schedule of Cash Receipts and Disbursements 148-149

WASHOE COUNTY SCHOOL DISTRICT
COMPREHENSIVE ANNUAL FINANCIAL REPORT FISCAL YEAR ENDED JUNE 30, 2009
TABLE OF CONTENTS
Capital Assets Used in the Operation of Governmental Funds: Schedule by Source 150 Schedule by Function and Activity 151 Schedule of Changes by Function and Activity 152 III. STATISTICAL SECTION - Unaudited Financial Trends: 1.1 Net Assets by Component, Last Eight Fiscal Years 153-154 1.2 Changes in Net Assets, Last Eight Fiscal Years 155-156 1.3 Fund Balances of Governmental Funds, Last Ten Fiscal Years 157-158 1.4 Changes in Fund Balances of Governmental Funds, Last Eight Fiscal Years 159-160 1.5 Major Governmental Revenues by Source, Last Ten Fiscal Years 161-162
Revenue Capacity: 2.1 Principal Property Taxpayers, Current Year and Nine Years Ago 163 2.2 Property Tax Rates Direct and Overlapping Governments,
Last Ten Fiscal Years 164-165 2.3 Assessed and Estimated Actual Value of Taxable Property, Last Ten Fiscal Years 166-167
2.4 Property Tax Levies and Collections, Last Ten Fiscal Years 168-169 2.5 Taxable Sales 170
Debt Capacity: 3.1 Ratios of Outstanding Debt by Type, Last Ten Fiscal Years 171 3.2 Legal Debt Margin Information, Last Ten Fiscal Years 172 3.3 General Obligation Direct and Overlapping Debt, As of June 30, 2008 173
Demographic and Economic Information: 4.1 Demographic and Economic Statistics, Last Ten Fiscal Years 174-175 4.2 Principal Employers, Current Year and Nine Years Ago 176
Operating Information: 5.1 Operating Statistics, Last Ten Fiscal Years 177-178 5.2 Teacher Salary Schedules, Last Ten Fiscal Years 179 5.3 District Full Time Equivalent Employees by Function, Last Ten Fiscal Years 180-181 5.4 Capital Asset Information, Last Ten Fiscal Years 182-183
WASHOE COUNTY SCHOOL DISTRICT
COMPREHENSIVE ANNUAL FINANCIAL REPORT FISCAL YEAR ENDED JUNE 30, 2009
TABLE OF CONTENTS
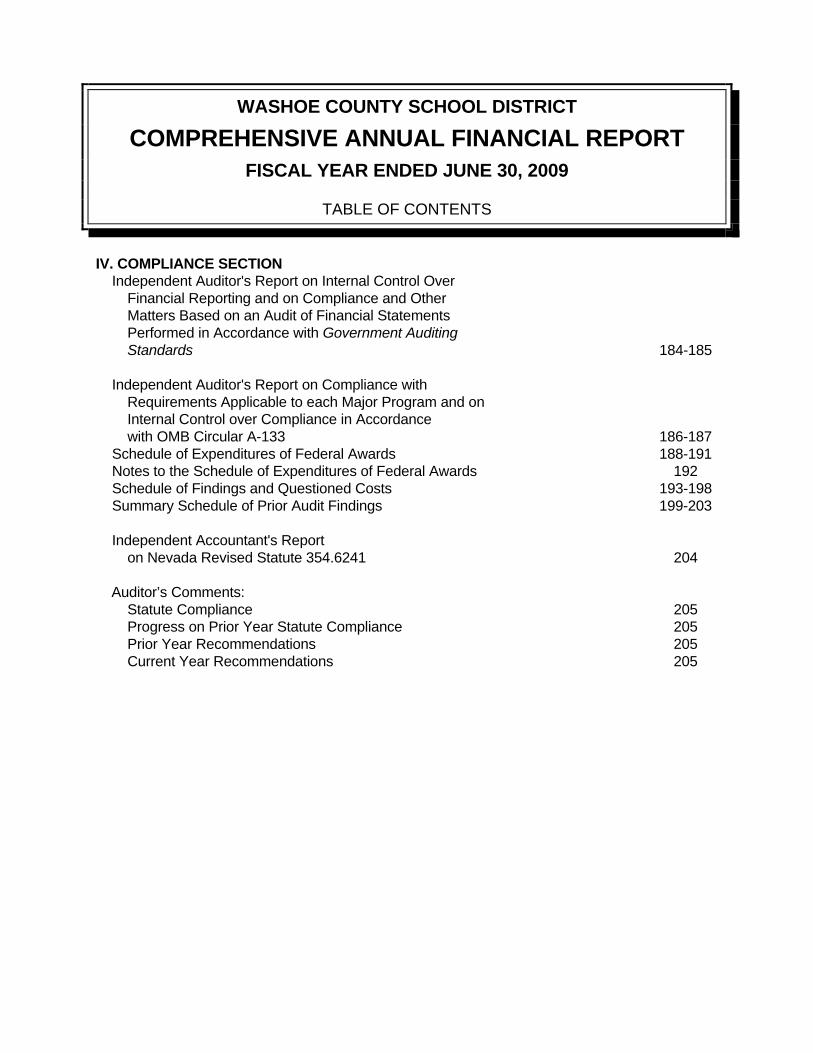
IV. COMPLIANCE SECTION Independent Auditor's Report on Internal Control Over Financial Reporting and on Compliance and Other Matters Based on an Audit of Financial Statements Performed in Accordance with Government Auditing Standards 184-185 Independent Auditor's Report on Compliance with Requirements Applicable to each Major Program and on Internal Control over Compliance in Accordance with OMB Circular A-133 186-187 Schedule of Expenditures of Federal Awards 188-191 Notes to the Schedule of Expenditures of Federal Awards 192 Schedule of Findings and Questioned Costs 193-198 Summary Schedule of Prior Audit Findings 199-203 Independent Accountant's Report on Nevada Revised Statute 354.6241 204 Auditor’s Comments: Statute Compliance 205 Progress on Prior Year Statute Compliance 205 Prior Year Recommendations 205 Current Year Recommendations 205

IntroductorySection
ComprehensiveAnnual
Financial Report

Introductory Section Letter of Transmittal
Board of Trustees and
Administrative Officials Organizational Chart
Certificate of Achievement for
Excellence in Financial Reporting


vi
Washoe County School District Reno, Nevada
District Officials For Fiscal Year Ended June 30, 2009
Board of Trustees
Barbara Clark
President
Estela Gutierrez Nancy Hollinger Vice President Member Dan Carne Scott Kelley Member Member Ken Grein Barbara McLaury Member Member
Administrative Officials
Paul Dugan Gary Kraemer, CPA Superintendent Chief Financial Officer Business & Financial Services Rick Harris Deputy Superintendent Elisabeth Noonan, Ed.D. Superintendent Rick Borba Elementary Education Superintendent Secondary Education


FinancialSection
ComprehensiveAnnual
Financial Report
Financial Section Independent Auditor’s Report
Management’s Discussion and Analysis


WASHOE COUNTY SCHOOL DISTRICT MANAGEMENT’S DISCUSSION AND ANALYSIS FOR THE FISCAL YEAR ENDED JUNE 30, 2009
3
Washoe County School District’s discussion and analysis is designed to (a) assist the reader in focusing on significant financial issues, (b) provide an overview of the District’s financial activities, (c) identify changes in the District’s financial position (its ability to address subsequent years’ challenges), (d) identify any material deviations from the financial plan (the approved budget), and (e) identify individual fund issues or concerns.
We encourage readers to read this information in conjunction with the transmittal letter, financial statements and notes to gain a more complete picture of the information presented.
Financial Highlights
Government-wide net assets increased by $33.5 million to $352.2 million.
Unrestricted net assets increased or improved by $8.7 million to $35.4 million.
The District’s total revenues increased by $17.2 million to $614.7 million. The most significant revenues are local school support taxes (sales tax) at $120.4 million, property taxes (Ad Valorem) at $170.3 million and state aid at $143.1 million.
The District’s total expenses increased by $26.5 million to $581.2 million. The most significant expenses were in regular instruction at $255 million, operation and maintenance at $50.2 million and special education instruction at $51.1 million.
Net capital assets increased to $617.3 million. Major additions include $25.9 million for school renewals, $32.5 million for Depoali Middle School, $7.4 million for paving and site improvements, $3.5 million for machinery and equipment, $5 million for Incline Elementary School, $6.9 million for Academy of Arts, Careers and Technology (AACT) and $1.5 million for energy, technology and copier upgrades. Depreciation expense totaling $18.7 million is included in the government-wide statements.
The District’s general obligation bonds payable increased by $15.1 million or 3%. This is the result of the issuance of $45 million in bond rollover debt and $29.9 million of debt payments.
The District maintained an Aa3 bond rating with a stable outlook from Moody’s Investor Service, and an AA rating with a stable outlook from Standard and Poor’s Corporation. Fitch Ratings maintained an AA- rating but has a negative outlook due to the uncertainty of the State's budget situation when the rating was done.
Government-wide Financial Statements
The government-wide financial statements are designed to provide an overview of the District’s finances in a manner similar to a private-sector business.
The statement of net assets presents information on all of the District’s assets and liabilities, with the difference between the two reported as net assets. Over time, increases or decreases in net assets may serve as a useful indicator of whether the financial position of the District is improving or deteriorating.
The statement of activities presents information showing how the District’s net assets changed during the most recent fiscal year. All changes in net assets are reported as soon as the underlying event giving rise to the change occurs, regardless of the timing of the related cash flows. Thus, revenues and expenses are reported in the statement for some items that will only result in cash flows in future fiscal periods.
Both of the government-wide financial statements distinguish functions that are supported by taxes and intergovernmental revenues (governmental activities) from other functions that are

WASHOE COUNTY SCHOOL DISTRICT MANAGEMENT’S DISCUSSION AND ANALYSIS FOR THE FISCAL YEAR ENDED JUNE 30, 2009
4
intended to recover all or a significant portion of their costs through user fees and charges (business-type activities).
Fund Financial Statements
A fund is a grouping of related accounts that is used to maintain control over resources that have been segregated for specific activities or objectives. The District’s funds can be divided into three categories: governmental funds, proprietary funds and fiduciary funds. Governmental funds are used to account for essentially the same functions reported as governmental activities in the government-wide statements described above. However, unlike the government-wide financial statements, governmental fund financial statements focus on near-term inflows and outflows of spendable resources, as well as on balances of spendable resources available at the end of the fiscal year. Such information may be useful in evaluating a government’s near-term financing requirements. To provide a better understanding of the relationship between the fund statements and the government-wide statements, both the governmental fund balance sheet and governmental fund statement of revenues, expenditures and changes in fund balances provide reconciliations between the two statement types. The focus of the governmental fund statements is on major funds. The District has 40 individual governmental funds of which the general, special education, debt service, 2009 bond rollover, 2008 bond rollover, 2007 bond rollover, 2006 bond rollover, 2005 bond rollover, 2003 bond rollover and 2002 bond rollover funds are considered major. These funds are disclosed separately in the governmental fund balance sheet and/or in the governmental fund statement of revenues, expenditures and changes in fund balances. The remaining 30 nonmajor governmental funds are combined into a single aggregated presentation in these statements. Individual fund data for each of these nonmajor funds is reported in combining statements in the supplementary information section of this report. Proprietary funds are comprised of enterprise funds and internal service funds. Enterprise funds are used to report an activity where a fee is charged to external users. The District’s sole enterprise fund, the Nutrition Services Enterprise Fund, is used to account for the nutrition services operation of the District. Internal service funds are used to accumulate and allocate costs internally among the District’s various programs and functions. The District uses three internal service funds to account for its self-insurance of property and casualty, employees’ health care and workers’ compensation. Because internal service fund operations primarily benefit governmental funds, they are included in the governmental fund activities column in the government-wide statements. All three internal service funds are combined into a single, aggregated presentation in the proprietary fund financial statements along with the sole enterprise fund in a separate column. Individual fund data for the internal service funds and the enterprise fund is provided in the combining statements in the supplementary information section of this report. Fiduciary funds account for resources held for other governments or individuals outside of the District. As their resources do not support District activities, they are not included in the government-wide statements. The District has three agency funds: the Student Activities Fund for schools in the district, an 80/5 Salary Plan for employees, and the Nevada Interscholastic Athletic Association for all school districts in Nevada. Additionally, the District has two trust funds: the Private Purpose Scholarship Trust Fund and the Other Postemployment Benefits (OPEB) Trust Fund. Additional information can be found on the OPEB Trust Fund in Note 9 on pages 55 through 60 of this report.

WASHOE COUNTY SCHOOL DISTRICT MANAGEMENT’S DISCUSSION AND ANALYSIS FOR THE FISCAL YEAR ENDED JUNE 30, 2009
5
Notes to the Financial Statements The notes provide required disclosure and information necessary to understand the District’s activities. Other In addition to the basic financial statements and accompanying notes, this report presents certain required supplementary information concerning the District’s General and Special Education funds. Required supplementary information can be found on pages 27 and 28 of this report. Supplementary information, including combining and individual fund statements and schedules providing budget to actual and prior year comparisons, are presented after the government-wide financial statements. These schedules test compliance with budgetary constraints and management directives to enhance accountability at the fund and function level. Statistical information is provided on a ten-year basis, as available, for trend and historical analysis.
GOVERNMENT-WIDE FINANCIAL ANALYSIS In order to enhance analysis, comparative information is provided for assets, liabilities, net assets, revenues and expenses.
WASHOE COUNTY SCHOOL DISTRICT’S NET ASSETS
2009 2008 2009 2008 2009 2008Assets
Current and other assets $ 395,509,133 $ 400,639,990 $ 4,365,762 $ 3,743,489 $ 399,874,895 $ 404,383,479 Net capital assets 616,856,451 562,266,548 396,799 404,802 617,253,250 562,671,350
Total assets 1,012,365,584 962,906,538 4,762,561 4,148,291 1,017,128,145 967,054,829 Liabilities
Current liabilities 128,885,044 117,551,627 1,061,136 1,029,639 129,946,180 118,581,266 Long-term liabilities 534,975,304 529,785,767 - - 534,975,304 529,785,767
Total liabilities 663,860,348 647,337,394 1,061,136 1,029,639 664,921,484 648,367,033 Net Assets
Invested in capital assets, net of related debt 174,502,710 162,631,890 396,799 404,802 174,899,509 163,036,692 Restricted 141,926,769 128,996,995 - - 141,926,769 128,996,995 Unrestricted 32,075,757 23,940,259 3,304,626 2,713,850 35,380,383 26,654,109
Total net assets $ 348,505,236 $ 315,569,144 $ 3,701,425 $ 3,118,652 $ 352,206,661 $ 318,687,796
Business-type activities TotalGovernmental activities
For more detailed information see the government-wide statement of net assets and the notes to the financial statements.
Net Assets: The District’s assets exceeded liabilities by $352.2 million at June 30, 2009. The largest portion of net assets (49.7%) reflects its investment in capital assets (e.g., land, buildings, equipment and construction in progress) less any outstanding related debt used to acquire those assets. The District uses these capital assets to provide services to citizens; therefore, they are not available for future spending. Although the investment in capital assets is reported net of related debt, the resources needed to repay this debt must be provided from other sources, since capital assets cannot be used to liquidate these liabilities.
WASHOE COUNTY SCHOOL DISTRICT MANAGEMENT’S DISCUSSION AND ANALYSIS FOR THE FISCAL YEAR ENDED JUNE 30, 2009
6
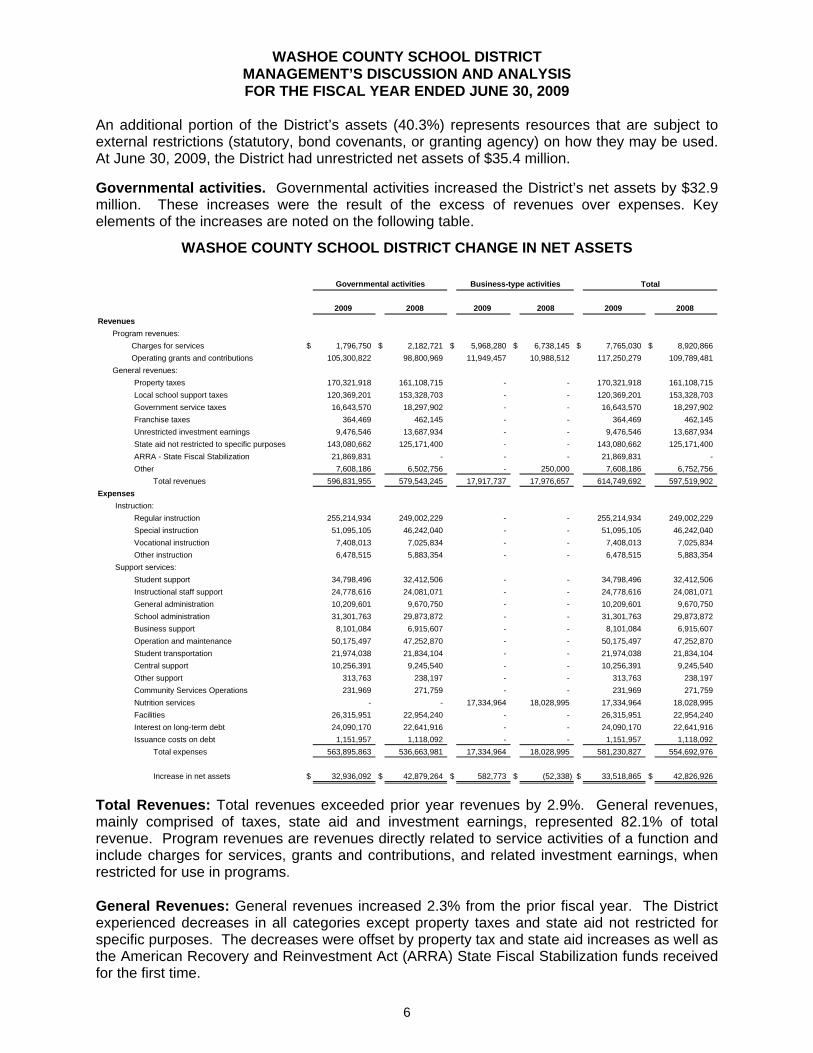
An additional portion of the District’s assets (40.3%) represents resources that are subject to external restrictions (statutory, bond covenants, or granting agency) on how they may be used. At June 30, 2009, the District had unrestricted net assets of $35.4 million.
Governmental activities. Governmental activities increased the District’s net assets by $32.9 million. These increases were the result of the excess of revenues over expenses. Key elements of the increases are noted on the following table.
WASHOE COUNTY SCHOOL DISTRICT CHANGE IN NET ASSETS
2009 2008 2009 2008 2009 2008Revenues
Program revenues:Charges for services $ 1,796,750 $ 2,182,721 $ 5,968,280 $ 6,738,145 $ 7,765,030 $ 8,920,866 Operating grants and contributions 105,300,822 98,800,969 11,949,457 10,988,512 117,250,279 109,789,481
General revenues:Property taxes 170,321,918 161,108,715 - - 170,321,918 161,108,715 Local school support taxes 120,369,201 153,328,703 - - 120,369,201 153,328,703 Government service taxes 16,643,570 18,297,902 - - 16,643,570 18,297,902 Franchise taxes 364,469 462,145 - - 364,469 462,145 Unrestricted investment earnings 9,476,546 13,687,934 - - 9,476,546 13,687,934 State aid not restricted to specific purposes 143,080,662 125,171,400 - - 143,080,662 125,171,400 ARRA - State Fiscal Stabilization 21,869,831 - - - 21,869,831 - Other 7,608,186 6,502,756 - 250,000 7,608,186 6,752,756
Total revenues 596,831,955 579,543,245 17,917,737 17,976,657 614,749,692 597,519,902 Expenses
Instruction:Regular instruction 255,214,934 249,002,229 - - 255,214,934 249,002,229 Special instruction 51,095,105 46,242,040 - - 51,095,105 46,242,040 Vocational instruction 7,408,013 7,025,834 - - 7,408,013 7,025,834 Other instruction 6,478,515 5,883,354 - - 6,478,515 5,883,354
Support services:Student support 34,798,496 32,412,506 - - 34,798,496 32,412,506 Instructional staff support 24,778,616 24,081,071 - - 24,778,616 24,081,071 General administration 10,209,601 9,670,750 - - 10,209,601 9,670,750 School administration 31,301,763 29,873,872 - - 31,301,763 29,873,872 Business support 8,101,084 6,915,607 - - 8,101,084 6,915,607 Operation and maintenance 50,175,497 47,252,870 - - 50,175,497 47,252,870 Student transportation 21,974,038 21,834,104 - - 21,974,038 21,834,104 Central support 10,256,391 9,245,540 - - 10,256,391 9,245,540 Other support 313,763 238,197 - - 313,763 238,197 Community Services Operations 231,969 271,759 - - 231,969 271,759 Nutrition services - - 17,334,964 18,028,995 17,334,964 18,028,995 Facilities 26,315,951 22,954,240 - - 26,315,951 22,954,240 Interest on long-term debt 24,090,170 22,641,916 - - 24,090,170 22,641,916 Issuance costs on debt 1,151,957 1,118,092 - - 1,151,957 1,118,092
Total expenses 563,895,863 536,663,981 17,334,964 18,028,995 581,230,827 554,692,976
Increase in net assets $ 32,936,092 $ 42,879,264 $ 582,773 $ (52,338) $ 33,518,865 $ 42,826,926
TotalGovernmental activities Business-type activities
Total Revenues: Total revenues exceeded prior year revenues by 2.9%. General revenues, mainly comprised of taxes, state aid and investment earnings, represented 82.1% of total revenue. Program revenues are revenues directly related to service activities of a function and include charges for services, grants and contributions, and related investment earnings, when restricted for use in programs.
General Revenues: General revenues increased 2.3% from the prior fiscal year. The District experienced decreases in all categories except property taxes and state aid not restricted for specific purposes. The decreases were offset by property tax and state aid increases as well as the American Recovery and Reinvestment Act (ARRA) State Fiscal Stabilization funds received for the first time.
WASHOE COUNTY SCHOOL DISTRICT MANAGEMENT’S DISCUSSION AND ANALYSIS FOR THE FISCAL YEAR ENDED JUNE 30, 2009
7
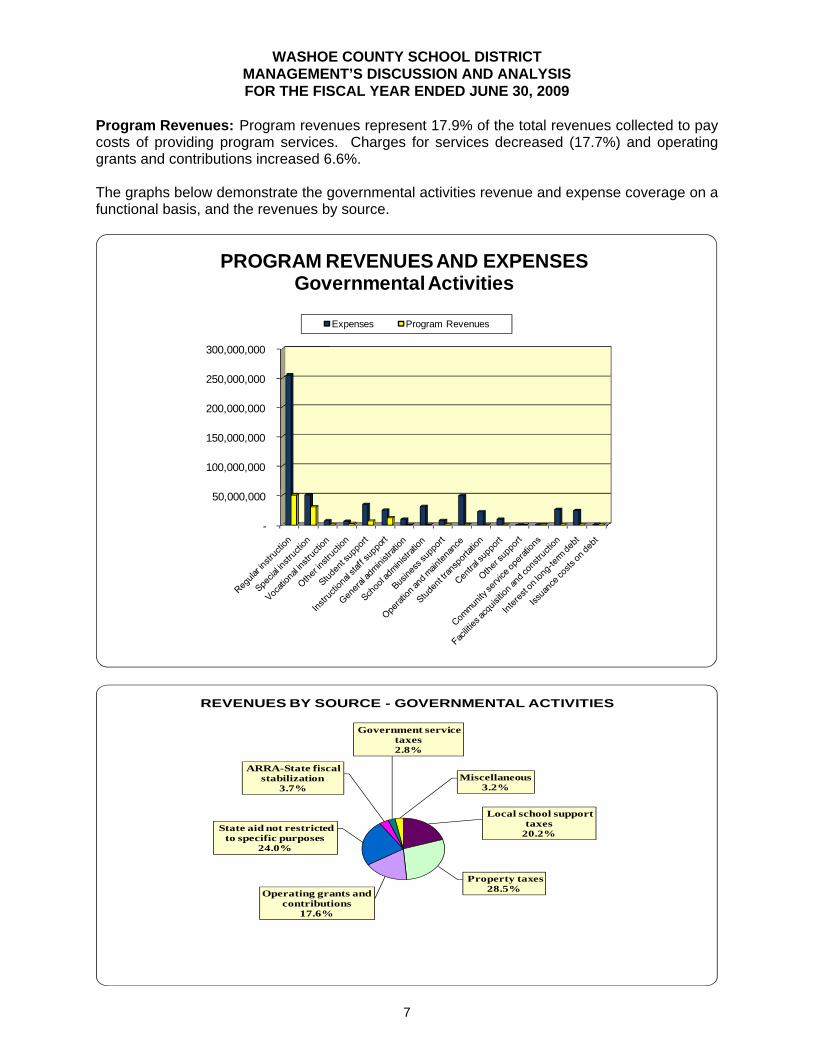
Program Revenues: Program revenues represent 17.9% of the total revenues collected to pay costs of providing program services. Charges for services decreased (17.7%) and operating grants and contributions increased 6.6%. The graphs below demonstrate the governmental activities revenue and expense coverage on a functional basis, and the revenues by source.
-
50,000,000
100,000,000
150,000,000
200,000,000
250,000,000
300,000,000
PROGRAM REVENUES AND EXPENSESGovernmental Activities
Expenses Program Revenues
Local school support taxes
20.2%
Property taxes 28.5%Operating grants and
contributions17.6%
State aid not restricted to specific purposes
24.0%
ARRA-State fiscal stabilization
3.7%
Government service taxes 2.8%
Miscellaneous3.2%
REVENUES BY SOURCE - GOVERNMENTAL ACTIVITIES

WASHOE COUNTY SCHOOL DISTRICT MANAGEMENT’S DISCUSSION AND ANALYSIS FOR THE FISCAL YEAR ENDED JUNE 30, 2009
8
The largest and main revenue sources for the District are property taxes (Ad Valorem), local school support taxes and state aid, which comprise 72.7% of total revenues.
Ad Valorem taxes increased 5.7% from the prior year due to increased tax collections and increases in assessed valuations.
Local school support taxes decreased (21.5%) due to declines in taxable sales.
State revenue, as provided in the Nevada Plan (State aid guaranteed funding), increased 14.3%. The increased state aid results from lower than anticipated increases in school support tax offset partially by increased property taxes, which increases the contribution required by the state.
Business-type activities. Business-type activities consist solely of the District’s Nutrition Services Enterprise Fund. In the current fiscal year this activity increased net assets by $582,773. Nutrition services charges and federal subsidies, including contributions of commodity food products, account for 100% of revenues received by business-type activities, with student charges representing 33.3% and federal subsidies accounting for 66.7%. The majority of expenses in the business-type activities are for food purchases and salary expenses to maintain the District’s nutrition services program. The increased net assets resulted from lower operating expenses, primarily decreased food costs, and increased federal subsidies during the year.

WASHOE COUNTY SCHOOL DISTRICT MANAGEMENT’S DISCUSSION AND ANALYSIS FOR THE FISCAL YEAR ENDED JUNE 30, 2009
9
FINANCIAL ANALYSIS OF THE DISTRICT’S MAJOR FUNDS
The Washoe County School District uses fund accounting and budgetary integration to ensure and demonstrate compliance with finance-related legal requirements. Governmental Funds: The focus of the Washoe County School District’s governmental funds is to provide information on current inflows, outflows, and balances of spendable resources. Such information is useful in assessing the District’s current funding requirements. In particular, unreserved fund balance may serve as a useful measure of net resources available for spending at the end of the fiscal year.
As of the current fiscal year, the District’s governmental funds reported combined ending fund balances of $248.2 million, a decrease of $(19.2) million over the prior year. Of this total, $141.4 million is unreserved and approximately $4.9 million, or 4%, constitutes unreserved and undesignated fund balance, which is available for spending at the District’s discretion within the respective fund. The District has $136.5 million, or 96%, unreserved and designated fund balances for subsequent year items. The remainder of fund balance is reserved to indicate that it is not available for spending because it has already been committed to: (1) $29.4 million for construction contracts and encumbrances (contracts or purchase orders of the prior period), (2) $72.7 million to pay debt service and sinking fund, (3) $3.6 million for capital projects and (4) $1.1 million for inventories.
In 1993 the State Legislature enacted legislation that required the special education program (previously accounted for in the General Fund) to be accounted for in a separate special revenue fund. Because of its size and relationship to the General Fund, it is included in the analysis below.
GENERAL AND SPECIAL EDUCATION FUNDS EXPENDITURES BY TYPE
2009 2008
Salaries 278,333,432$ 264,300,082$ Benefits 108,150,458 100,718,993 Purchased Services 18,304,565 19,377,477 Supplies 24,278,881 29,436,234 Property 515,337 3,472,149 Other 373,963 277,732
Totals 429,956,636$ 417,582,667$

WASHOE COUNTY SCHOOL DISTRICT MANAGEMENT’S DISCUSSION AND ANALYSIS FOR THE FISCAL YEAR ENDED JUNE 30, 2009
10
Salaries comprise 64.7% of total expenditures. School districts by their nature are labor intensive.
Employee benefits average 38.9% of salaries and 25.2% of total expenditures. Benefits include contributions on the behalf of employees for retirement (Public Employees’ Retirement), health insurance, Medicare, old age survivor’s disability insurance (part-time employees), life insurance, workers’ compensation and OPEB.
Purchased services, supplies and property comprise 10.1% of total expenditures. Details regarding variances on a fund level are available in separate reports.
The General Fund is the primary operating fund of the District. At the end of the current fiscal year, unreserved fund balance of the General Fund was $53.2 million compared to $46.5 million in the prior year. The total fund balance was $56.8 million compared to $48.2 million in the prior year. As a measure of the General Fund’s liquidity, it may be useful to compare both unreserved fund balance and total fund balance to total fund expenditures. Unreserved fund balance represents 14.2% of total fund expenditures while total fund balance represents 15.1% of that same amount.
The unreserved fund balance of the General Fund increased $6.7 million. Key factors in this change are as follows:
Total revenues of $418.3 million exceeded prior year revenue by $8.9 million or 2.2%,
primarily due to increases in state aid 14.3% and property tax 4.7%. Revenues were also increased due to the first time receipt of $21.9 million of ARRA funding provided to stabilize state education funding. Offsetting these increases are decreases in school support taxes (21.5%), earnings on investments (53.4%) and government services taxes (9%).
Total expenditures of $375.5 million exceeded the prior year by $6 million or 1.6%. Salaries
increased 4.6% as a result of District growth and movement on the salary schedules. Additionally, the District is in the second year of a four-year salary contract with all bargaining groups which provided a cost of living increase during the fiscal year. Employee benefits exceeded the previous year by 4.9% due to rates (i.e. retirement, Medicare,

WASHOE COUNTY SCHOOL DISTRICT MANAGEMENT’S DISCUSSION AND ANALYSIS FOR THE FISCAL YEAR ENDED JUNE 30, 2009
11
workers’ compensation and OPEB) applied to increasing salaries, and a 12% rate increase in health insurance costs.
Operating (non-salary) categories decreased by $(8.9) million or (17.3%) from the prior year.
The majority of the decreases are attributable to reduced expenditure for textbooks, instructional supplies, bus purchases, gasoline and property/casualty insurance. Due to economic factors, the State reduced the District’s funding by $9.8 million. A large portion of this reduced funding was related to textbooks and instructional supplies and the District therefore reduced those expenditures by $5.1 million. In addition the District cancelled the bus purchase program for the year resulting in a reduction of expenditures from the prior year of $3.1 million. Also, gasoline prices were substantially less than the prior year resulting in an expenditure decrease of $.8 million and property/casualty insurance costs were $.4 million less.
The excess of revenues over expenditures was $42.8 million. Transfers to other funds were $37.2 million. Significant transfers included $31.6 million to the Special Education Fund, $3.9 million to the Debt Service Fund and $1.7 million to the Health Insurance Fund.
The Special Education Fund accounts for resources (state-aid and transfers from the General Fund) used to provide special education to eligible students. This fund has no fund balance as the District only transfers the amount needed to cover expenditures not covered by State funding. Resources and expenditures totaled $54.5 million, which exceeded the prior year by $6.4 million or 13.3%. All fund resources were from State aid of $22.9 million and transfers from the General Fund of $31.6 million.
The Debt Service Fund has a total fund balance of $72.7 million, all of which is reserved for the payment of debt service. The fund balance increased by $9.6 million primarily as a result of increased property tax and investment revenues.
Bond Rollover Funds allow the District to issue an estimated $300-600 million in voter-approved rollover bonds between 2002 and 2012. These rollover bonds will partially allow the District to provide for the upkeep of existing facilities and add new schools to address increases in student enrollment. These bonds will be used for improvements (including technology infrastructure upgrades) to older, existing schools along with the construction of new elementary and middle schools and the build-out of high schools. Individual rollover funds are as follows: The 2002 Bond Rollover Fund was issued for $25.7 million and was primarily dedicated to the construction of Shaw Middle School which opened in August 2004. An additional $.6 million in interest earnings was used for construction of Cold Springs Middle School. During FY 08/09, an additional allocation of $30,795 was awarded to and expended by Cold Springs Middle School. All remaining funds were utilized for miscellaneous capital renewal projects. There is no fund balance in this fund at June 30, 2009. The 2003 Bond Rollover Fund was issued for $55.8 million and was primarily dedicated to the construction of Cold Springs Middle School, Sepulveda Elementary School, various school renewal projects, acquisition of site and water rights, and information technology projects. During FY 08/09 $1.7 million was spent for design/construction of Depoali Middle School, school renewal projects, and information technology projects. There is no fund balance in this fund at June 30, 2009. The 2005 Bond Rollover Fund bond issuance for $66 million was primarily dedicated to design/construction of Hall and Sepulveda Elementary Schools; building additions to North

WASHOE COUNTY SCHOOL DISTRICT MANAGEMENT’S DISCUSSION AND ANALYSIS FOR THE FISCAL YEAR ENDED JUNE 30, 2009
12
Valleys High School, Spanish Springs High School, and Echo Loder Elementary School; site and water rights acquisition (all 100% expended); various school renewal projects (92% expended); and information technology projects (92% expended). During the current fiscal year $3.57 million was spent for the design/construction of Depoali Middle School (97% expended), redesign/replacement of Reno High School’s electrical system (100% complete) and for a high school/middle school needs assessment study. Other expenditures for various school renewal and information technology projects totaled $1.74 million. This fund’s ending fund balance on June 30, 2009 is $1.3 million and consists of unspent bond proceeds and investment income. The 2006 Bond Rollover Fund bond issuance for $30 million will be used primarily for the renovation of existing District facilities and the construction of Depoali Middle School. The facility renovations/upgrades include re-roofing, re-paving, re-carpeting, etc.; transportation yard improvements and technology related projects. During FY 08/09 $8.3 million was spent for design/construction of Depoali Middle School (75% expended), facility renewal projects (95% expended), information technology projects (77% expended) and transportation yard improvements (100% expended). This fund’s ending fund balance on June 30, 2009 is $5.6 million and consists of unspent bond proceeds and investment income. The 2007 Bond Rollover Fund issuance for $65 million will be used primarily for construction of Depoali Middle School, the continued renovation of the District’s existing facilities, acquisition of mobile classrooms, and various technology upgrades. During FY 08/09 $29.4 million was spent for design/construction of Depoali Middle School (95% expended), and $3.3 million was spent for elementary school revitalization (100% expended), high school security cameras (51% expended), information technology projects (23% expended) and bond administrative costs (89% expended). This fund’s ending fund balance on June 30, 2009 is $24.6 million and consists of unspent bond proceeds and investment income. The 2008 Bond Rollover Fund was issued in March 2008 for $55 million and will be used primarily for construction of Depoali Middle School, completion of the Incline Elementary School addition, acquisition of mobile classrooms, and various school renewal and information technology projects. During FY 08/09 $15 million was expended for design/construction of Depoali Middle School (35% expended), Incline Elementary School addition (77% expended), Academy of Arts, Careers and Technology (55% expended) and acquisition of mobile classrooms (94% expended). An additional $13.1 million was expended for various capital renewal projects which included re-roofing and re-paving projects, HVAC, and fire alarm and technology upgrades. This fund’s ending fund balance on June 30, 2009 is $25.9 million and consists of unspent bond proceeds and investment income. The 2009 Bond Rollover Fund issuance in February 2009 for $45 million will be used primarily for revitalization of existing elementary schools, upgrades to information technology hardware/software, and capital renewal projects such as re-roofing and re-paving. Funds will also be used for curriculum materials, furniture, fixtures and equipment at Academy of Arts, Careers and Technology. During FY 08/09 $3.35 million was expended for revitalization of the first group of elementary schools (21% expended), upgrades to elementary school information technology infrastructure (42% expended) and re-roofing and re-paving activities (29% and 43% expended, respectively). This fund’s ending fund balance on June 30, 2009 is $42.1 million and consists of unspent bond proceeds and investment income. Proprietary Funds: The proprietary fund statements provide the same type of information found in the government-wide financial statements, but in more detail.

WASHOE COUNTY SCHOOL DISTRICT MANAGEMENT’S DISCUSSION AND ANALYSIS FOR THE FISCAL YEAR ENDED JUNE 30, 2009
13
The District’s self-insured Property and Casualty, Health Insurance, and Workers’ Compensation Internal Service Funds have a combined Net Asset balance of $34.6 million. The Health Insurance Fund has a Net Asset balance of $23.5 million compared to $20.9 million in the prior year; the Property and Casualty Fund has a balance of $5.2 million compared to a balance in the prior year of $4.5 million; and the Workers’ Compensation Fund finished the year with a balance of $5.9 million compared to $4.8 million in the prior year. Insurance funds, by their nature, are very difficult to forecast. As a result, the District continues to work to maintain the proper reserves in these funds. The District’s Nutrition Services Enterprise Fund has a Net Asset balance of $3.7 million compared to $3.1 million in the prior year. The factors concerning the finances in this fund were addressed in the discussion of the District’s business-type activities. GENERAL FUND BUDGETARY HIGHLIGHTS Prior to the beginning of the fiscal year, the District adopts its original budget on or before June 8. The District is required to amend the budget by January 1 of the fiscal year to reflect the official enrollment count. During the year, the Chief Financial Officer is authorized to transfer appropriations between accounts and funds, subject to the subsequent approval by the Board of Trustees. The District may also augment the budget by a majority vote of the Board if anticipated resources actually available during the year exceed those estimated. The final budget for the District was approved on May 27, 2008. The total budget was $456.3 million and represented a $30 million increase over the prior year. The majority of the increase ($17.8 million) was due to a per pupil funding increase through the State Distributive School Account of $315 per pupil. Other major increases were from property tax (ad valorem tax) of $6.1 million and opening fund balance of $6.5 million. These new sources in the final budget provided increases to salaries and benefits of $27.5 million (for step increases, a 4% cost of living increase, growth and a 12% health insurance increase); increases for utilities of $1.5 million; and an increase to contingency accounts and ending fund balance of $1 million. The District augmented the budget by $11.3 million on December 16, 2008. Although there was an increase of $21.5 million for the actual opening fund balance in excess of the final budget ($12.9 million unreserved and $8.6 million from reserved/designated), the District had to reduce the DSA apportionment by $10.2 million ($7.6 million for budget reductions passed down by the State and $2.6 million related to a decrease in enrollment). The unreserved opening fund balance increase was used to establish a designation for property tax refunds of $6 million and the remaining $6.2 million was put into the ending fund balance. The $8.6 million reserved/designated balance was used to fund prior year encumbrances and designations for expenditures ($1.8 million) and designations for general supply carryover ($6.8 million). The DSA reduction of $10.2 million was offset by reducing expenditures by $4.5 million, reducing the transfer to the pre-funded retiree health benefits fund by $3 million, utilizing $.6 million from the contingency account, and reducing ending fund balance by $2.1 million. In addition, $.9 million of the contingency account was used to fund budget priorities. The District approved a final revision of the budget on June 23, 2009. The revisions did not change the total revenues for the District but ARRA State Fiscal Stabilization funding of $21.9 million was substituted for DSA funding by the State. Appropriations were reduced to recognize

WASHOE COUNTY SCHOOL DISTRICT MANAGEMENT’S DISCUSSION AND ANALYSIS FOR THE FISCAL YEAR ENDED JUNE 30, 2009
14
salary and operating savings and allocate those savings to OPEB costs and ending fund balance designations. $16.3 million in recognized savings was used to provide for $3 million in OPEB costs, $1 million for ending fund balance, and designations for computer refresh ($1.7 million), budget uncertainties ($5.6 million), and special education maintenance of effort ($5 million). The final revised budget also reflected transfers to allocate the District’s costs related to funding OPEB. The entire OPEB annual required contribution of $12.3 million was funded as of June 30, 2009.
ORIGINAL FINAL DIFFERENCEREVENUES Local sources $ 283,662,154 $ 259,357,020 $ (24,305,134) State sources 145,479,916 137,642,199 (7,837,717) Federal sources 530,000 22,399,831 21,869,831 Other sources 5,000 5,000 -
Total revenues 429,677,070 419,404,050 (10,273,020)
OTHER FINANCING SOURCES FUND BALANCE, July 1 27,486,323 48,227,132 20,740,809
TOTAL SOURCES $ 457,163,393 $ 467,631,182 $ 10,467,789
EXPENDITURES Current: Regular programs $ 215,438,417 $ 211,876,910 $ (3,561,507) Vocational programs 9,450,813 7,539,216 (1,911,597) Other instructional programs 4,587,787 4,767,176 179,389 Undistributed expenditures: Student support 25,264,095 26,946,845 1,682,750 Instructional staff support 11,581,914 12,075,315 493,401 General administration 9,192,460 9,441,393 248,933 School administration 30,705,866 31,222,963 517,097 Business support 5,806,279 5,400,224 (406,055) Operation and maintenance 51,638,486 52,773,162 1,134,676 Student transportation 16,284,922 14,641,260 (1,643,662) Central support services 10,149,561 10,241,081 91,520
Total expenditures 390,100,600 386,925,545 (3,175,055)
OTHER FINANCING USES Contingency 3,052,087 - (3,052,087) Transfers out 45,987,888 38,477,165 (7,510,723)
Total other financing uses 49,039,975 38,477,165 (10,562,810)
FUND BALANCE, June 30 18,022,818 42,228,472 24,205,654
TOTAL APPLICATIONS $ 457,163,393 $ 467,631,182 $ 10,467,789
GENERAL FUND BUDGET ADJUSTMENTS
2009 BUDGET
Actual expenditures were 97% of the final budget and all functions are within the appropriate budgetary authority.

WASHOE COUNTY SCHOOL DISTRICT MANAGEMENT’S DISCUSSION AND ANALYSIS FOR THE FISCAL YEAR ENDED JUNE 30, 2009
15
CAPITAL ASSETS AND DEBT ADMINISTRATION
Capital Assets. The District’s investment in capital assets for its governmental and business-type activities as of June 30, 2009 amounts to $617.3 million (net of accumulated depreciation). This investment in capital assets includes land, buildings, improvements other than buildings, machinery and equipment, and construction in progress. The total increase in the District’s net capital assets for the current fiscal year was 9.7%. The major capital additions this fiscal year included: School Renewals $ 25.9 million Incline Elementary $ 5.0 million Depoali Middle School 32.5 Machinery/Equipment 3.5 Paving and Site Improvements 7.4 Washoe High School 1.9 Academy of Arts, Careers and Energy/Technology 1.5 Technology 6.9 Additional information on the District’s capital assets can be found in Note 5 on pages 48-49 of this report.
WASHOE COUNTY SCHOOL DISTRICT CAPITAL ASSETS (Net of Depreciation)
Governmental Activities:
2009 2008
Land 37,359,073$ 37,030,472$ Construction in progress 71,029,583 24,728,594Buildings 473,461,008 471,351,668Improvements other than buildings 15,695,440 8,863,722Machinery and equipment 19,311,347 20,292,092
Total 616,856,451$ 562,266,548$
Business-type Activities:
Machinery and equipment 396,799$ 404,802$
WASHOE COUNTY SCHOOL DISTRICT OUTSTANDING DEBT 2009 2008 General Obligation Bonds $ 515,520,000 $ 500,380,000Capital Lease Obligations 11,238,848 14,126,238 Qualified Zone Academy Bonds 7,268,997 7,268,997
Total $ 534,027,845 $ 521,775,235 The District’s outstanding debt increased by $12.3 million during the current fiscal year primarily due to the issuance of the new rollover bonds netted with the effects of planned principal payments. The District did not add any capital leases during the year.
State statute (NRS 387.400) limits the amount of general obligation debt a school district may issue to 15% of its total assessed valuation. The current limitation for the Washoe County

WASHOE COUNTY SCHOOL DISTRICT MANAGEMENT’S DISCUSSION AND ANALYSIS FOR THE FISCAL YEAR ENDED JUNE 30, 2009
16
School District is $2.06 billion, which is significantly in excess of the District’s outstanding general obligation debt. Additional information on the District’s long-term debt can be found in Note 6 on pages 49-52 of this report. ECONOMIC FACTORS AND NEXT YEAR’S BUDGET The Washoe County School District is the second largest county school district in the State of Nevada. The District’s funding primarily comes from sales taxes, property taxes, and state support and government services taxes. The State funding is approved by the Legislature and is calculated after considering all other District revenues. The State revenue is expressed as a guaranteed per pupil amount which includes the sales tax revenue and 1/3 of the property tax revenue with the balance based on a contribution from the State. By guaranteeing a per pupil amount the State has provided stability to the amount of revenue the District can expect for general operating purposes. Due to the downturn in the economy the District’s General Fund will see a revenue decrease for the next fiscal year versus the fiscal year 2008-09 final budget of $2.9 million. The guaranteed basic support per pupil revenue as provided through the State’s Distributive School Account (DSA) will decrease by $96 per pupil to $5,350 resulting in a $5.9 million decrease in revenue. An enrollment decrease will result in decreased DSA funding of $2.9 million. Declining property taxes will result in decreased revenues of $3.4 million for the 2/3 portion outside of the DSA calculation. Earnings on investments are expected to decrease $2.1 million and Government Services Tax will decrease by $1.7 million while other revenues will increase by $1.7 million. The net decrease in these revenues of $14.3 million is offset by an increase in a transfer from the Pre-Funded Health Insurance Benefits Fund of $6.5 million and an increase in Unreserved Opening Fund Balance of $4.9 million. Despite the reduction of funding, the District is able to continue all existing General Fund programs and provide for increases related to salary roll-ups, retirement contribution increases, utilities, and other operating increases. This was accomplished by decreasing expenditures for health insurance, worker’s compensation and property/casualty insurance premiums (as the District is self-funded for those programs and sufficient reserves exist to provide for those decreases); freezing the hiring for a number of open positions; use of contingency accounts; use of stimulus funding related to special education maintenance of effort; reducing operating budgets; and reducing unreserved ending fund balance. Many other State funded programs were eliminated or reduced due to the economic downturn. Eliminated programs were remediation and innovation grants and teacher signing bonuses. Reduced programs were incentives for licensed educational personnel; education technology; class-size reduction and full-day kindergarten. Further legislative mandated budget reductions may be forthcoming depending on the status of the economic progression throughout the next fiscal year.
REQUESTS FOR INFORMATION
This report is designed to provide a general overview of the Washoe County School District’s finances for all interested parties. Questions concerning the information provided in this report or requests for additional financial information should be addressed to Gary S. Kraemer, Chief Financial Officer, P.O. Box 30425, Reno, NV 89520-3425. Effective January 1, 2010 this report will also be available on the web site at www.washoe.k12.nv.us.

Basic Financial Statements Government-wide Financial Statements
• Statement of Net Assets • Statement of Activities
Fund Financial Statements
• Governmental Funds • Proprietary Funds • Fiduciary Funds

GOVERNMENTAL BUSINESS-TYPEACTIVITIES ACTIVITIES TOTAL
ASSETSCurrent assets
Cash and investments $ 309,653,109 $ 2,055,508 $ 311,708,617 Receivables Property taxes 7,880,607 - 7,880,607 Interest 444,805 - 444,805 Grants 4,511,314 - 4,511,314 Miscellaneous 2,128,444 1,727,832 3,856,276 Due from other governments 44,763,577 - 44,763,577 Inventories 1,096,435 582,057 1,678,492 Deferred charges 13,097,446 365 13,097,811
Total current assets 383,575,737 4,365,762 387,941,499
Noncurrent assetsRestricted cash 3,491,782 - 3,491,782 Other postemployment benefits asset 8,441,614 - 8,441,614 Capital assets Land and construction in progress 108,388,656 - 108,388,656 Other capital assets, net of depreciation 508,467,795 396,799 508,864,594
Total noncurrent assets 628,789,847 396,799 629,186,646
Total assets 1,012,365,584 4,762,561 1,017,128,145
LIABILITIES Current liabilities
Accounts payable 5,706,535 232,206 5,938,741 Accrued liabilities 50,519,125 584,118 51,103,243 Construction contracts payable 12,754,652 - 12,754,652 Interest payable 2,242,787 - 2,242,787 Due to other governments 327,155 - 327,155 Unearned revenue 1,689,979 244,812 1,934,791 Current portion of long-term obligations 55,644,811 - 55,644,811
Total current liabilities 128,885,044 1,061,136 129,946,180
Noncurrent liabilitiesGeneral obligation bonds payable 515,520,000 - 515,520,000 Deferred premiums 12,711,585 - 12,711,585 Arbitrage payable 748,959 - 748,959 Capital leases payable 18,507,845 - 18,507,845 Accrued compensated absences 26,435,533 - 26,435,533 Accrued early separation incentive stipends 1,114,473 - 1,114,473 Accrued self-insurance pending claims 15,066,574 - 15,066,574 Other postemployment benefits liability 515,146 - 515,146 Less: current portion of long-term obligations (55,644,811) - (55,644,811)
Total noncurrent liabilities 534,975,304 - 534,975,304
Total liabilities 663,860,348 1,061,136 664,921,484
NET ASSETSInvested in capital assets, net of related debt 174,502,710 396,799 174,899,509 Restricted for Debt service 72,378,158 - 72,378,158 Capital projects 15,884,749 - 15,884,749 Special revenue 11,089,587 - 11,089,587 Other postemployment benefits 7,926,468 - 7,926,468 Self-insurance activities 34,647,807 - 34,647,807 Unrestricted 32,075,757 3,304,626 35,380,383
Total net assets $ 348,505,236 $ 3,701,425 $ 352,206,661
The notes to the financial statements are an integral part of this statement.
WASHOE COUNTY SCHOOL DISTRICTSTATEMENT OF NET ASSETS
JUNE 30, 2009
17

OPERATINGCHARGES FOR GRANTS AND GOVERNMENTAL BUSINESS-TYPE
FUNCTIONS/PROGRAMS EXPENSES SERVICES CONTRIBUTIONS ACTIVITIES ACTIVITIES TOTAL
Governmental activities:Instruction
Regular instruction $ 255,214,934 $ - $ 50,822,577 $ (204,392,357) $ - $ (204,392,357) Special instruction 51,095,105 - 30,441,127 (20,653,978) - (20,653,978) Vocational instruction 7,408,013 - - (7,408,013) - (7,408,013) Other instruction 6,478,515 1,038,137 2,037,813 (3,402,565) - (3,402,565)
Total instruction 320,196,567 1,038,137 83,301,517 (235,856,913) - (235,856,913)
Support servicesStudent support 34,798,496 - 7,015,809 (27,782,687) - (27,782,687) Instructional staff support 24,778,616 390,408 12,319,389 (12,068,819) - (12,068,819) General administration 10,209,601 - 617,646 (9,591,955) - (9,591,955) School administration 31,301,763 162,438 469,890 (30,669,435) - (30,669,435) Business support 8,101,084 - - (8,101,084) - (8,101,084) Operation and maintenance 50,175,497 - 211,740 (49,963,757) - (49,963,757) Student transportation 21,974,038 - 361,087 (21,612,951) - (21,612,951) Central support 10,256,391 - 103,524 (10,152,867) - (10,152,867) Other support 313,763 - 900,220 586,457 - 586,457 Community service operations 231,969 205,767 - (26,202) - (26,202) Facilities 26,315,951 - - (26,315,951) - (26,315,951) Interest on long-term debt 24,090,170 - - (24,090,170) - (24,090,170) Amortization of issuance costs on debt 1,151,957 - - (1,151,957) - (1,151,957)
Total support services 243,699,296 758,613 21,999,305 (220,941,378) - (220,941,378)
Total governmental activities 563,895,863 1,796,750 105,300,822 (456,798,291) - (456,798,291)
Business-type activities:Nutrition services 17,334,964 5,968,280 11,949,457 - 582,773 582,773
Total business-type activities 17,334,964 5,968,280 11,949,457 - 582,773 582,773
Total school district $ 581,230,827 $ 7,765,030 $ 117,250,279 (456,798,291) 582,773 (456,215,518)
General revenues:Property taxes, levied for general purposes 111,438,047 - 111,438,047 Property taxes, levied for debt service 58,883,871 - 58,883,871 Local school support taxes 120,369,201 - 120,369,201 ARRA-State fiscal stabilization 21,869,831 - 21,869,831 Government service taxes for general purposes 13,219,509 - 13,219,509 Government service taxes for capital purposes 3,424,061 - 3,424,061 Franchise taxes 364,469 - 364,469 Unrestricted investment earnings 9,476,546 - 9,476,546 Gain on the sale of assets 844,462 - 844,462 State aid not restricted to specific purposes 143,080,662 - 143,080,662 Other local sources 6,464,426 - 6,464,426 Federal aid not restricted to specific purposes 299,298 - 299,298
Total general revenues 489,734,383 - 489,734,383
Change in net assets 32,936,092 582,773 33,518,865
NET ASSETS - July 1 315,569,144 3,118,652 318,687,796
NET ASSETS - June 30 $ 348,505,236 $ 3,701,425 $ 352,206,661
The notes to the financial statements are an integral part of this statement.
AND CHANGES IN NET ASSETSNET (EXPENSES) REVENUES
PROGRAM REVENUES
WASHOE COUNTY SCHOOL DISTRICTSTATEMENT OF ACTIVITIES
FOR THE YEAR ENDED JUNE 30, 2009
18

SPECIAL DEBT 2009 BONDGENERAL EDUCATION SERVICE ROLLOVER
FUND FUND FUND FUND
ASSETSCash and investments $ 47,025,543 $ 4,781,905 $ 68,863,165 $ 44,457,969 Receivables Property taxes 6,375,414 - 1,505,193 - Interest 18,379 - 381,452 13,367 Grants - - - - Miscellaneous 1,392,351 14,728 - - Due from other funds 1,306,920 - - - Due from other governments 42,564,266 1,907,463 - - Inventories 1,096,435 - - - Cash and investments - restricted - - 3,491,782 -
Total assets $ 99,779,308 $ 6,704,096 $ 74,241,592 $ 44,471,336
LIABILITIES Accounts payable $ 3,377,298 $ 39,550 $ 2,500 $ 94,597 Accrued liabilities 36,089,607 6,664,546 4,008 - Construction contracts payable - - - 2,285,579 Due to other funds - - - - Due to other governments 261,000 - - - Deferred revenues 3,246,362 - 1,505,193 -
Total liabilities 42,974,267 6,704,096 1,511,701 2,380,176
FUND BALANCESReserved for Encumbrances 2,528,563 - - 1,413,002 Inventories 1,096,435 - - - Construction contracts - - - 6,850,163 Capital projects - - - - Debt service - - 69,238,109 - Sinking fund - - 3,491,782 - Unreserved, reported in General fund 53,180,043 - - - Special revenue funds - - - - Capital projects funds - - - 33,827,995
Total fund balances 56,805,041 - 72,729,891 42,091,160
Total liabilities and fund balances $ 99,779,308 $ 6,704,096 $ 74,241,592 $ 44,471,336
The notes to the financial statements are an integral part of this statement.
WASHOE COUNTY SCHOOL DISTRICTGOVERNMENTAL FUNDS
BALANCE SHEETJUNE 30, 2009
19
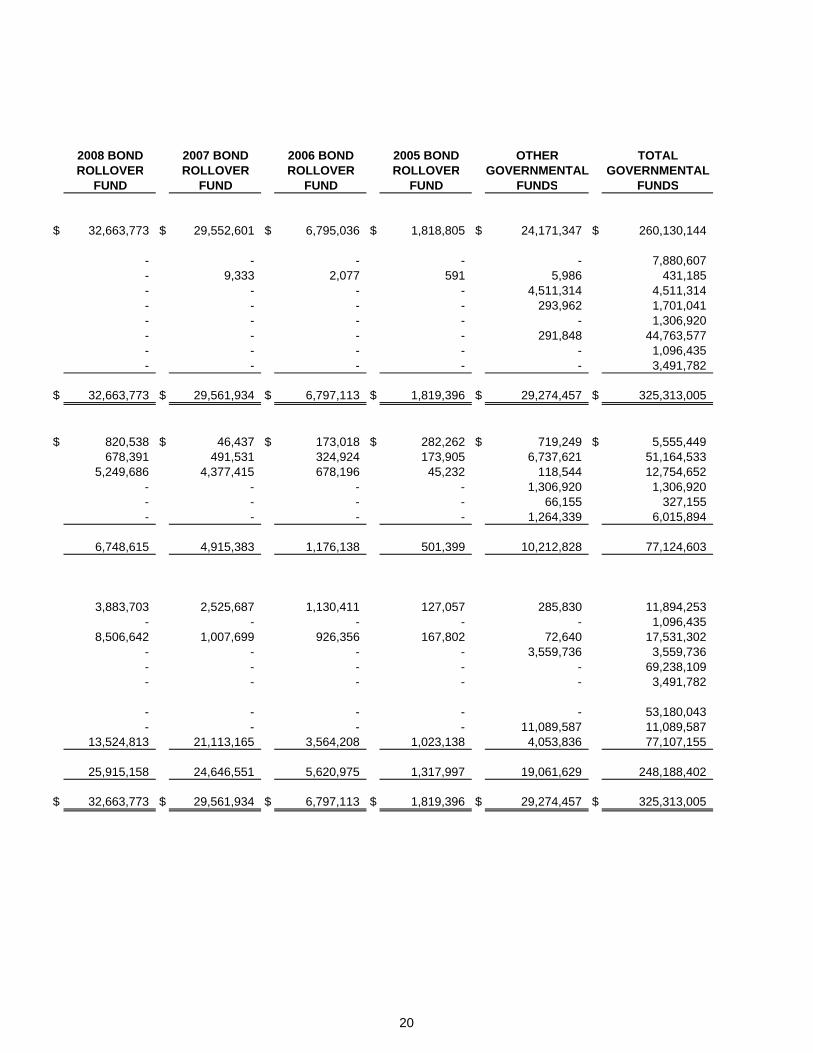
2008 BOND 2007 BOND 2006 BOND 2005 BOND OTHER TOTALROLLOVER ROLLOVER ROLLOVER ROLLOVER GOVERNMENTAL GOVERNMENTAL
FUND FUND FUND FUND FUNDS FUNDS
$ 32,663,773 $ 29,552,601 $ 6,795,036 $ 1,818,805 $ 24,171,347 $ 260,130,144
- - - - - 7,880,607 - 9,333 2,077 591 5,986 431,185 - - - - 4,511,314 4,511,314 - - - - 293,962 1,701,041 - - - - - 1,306,920 - - - - 291,848 44,763,577 - - - - - 1,096,435 - - - - - 3,491,782
$ 32,663,773 $ 29,561,934 $ 6,797,113 $ 1,819,396 $ 29,274,457 $ 325,313,005
$ 820,538 $ 46,437 $ 173,018 $ 282,262 $ 719,249 $ 5,555,449 678,391 491,531 324,924 173,905 6,737,621 51,164,533
5,249,686 4,377,415 678,196 45,232 118,544 12,754,652 - - - - 1,306,920 1,306,920 - - - - 66,155 327,155 - - - - 1,264,339 6,015,894
6,748,615 4,915,383 1,176,138 501,399 10,212,828 77,124,603
3,883,703 2,525,687 1,130,411 127,057 285,830 11,894,253 - - - - - 1,096,435
8,506,642 1,007,699 926,356 167,802 72,640 17,531,302 - - - - 3,559,736 3,559,736 - - - - - 69,238,109 - - - - - 3,491,782
- - - - - 53,180,043 - - - - 11,089,587 11,089,587
13,524,813 21,113,165 3,564,208 1,023,138 4,053,836 77,107,155
25,915,158 24,646,551 5,620,975 1,317,997 19,061,629 248,188,402
$ 32,663,773 $ 29,561,934 $ 6,797,113 $ 1,819,396 $ 29,274,457 $ 325,313,005
20

Total Fund Balances for Governmental Funds $ 248,188,402
Amounts reported for governmental activities in the statement of net assets are different because:
Capital assets used in governmental activities are not financial resources and therefore are not reported in the governmental funds.
Land and construction in progress $ 108,388,656 Capital assets subject to depreciation 715,258,827 Less accumulated depreciation (206,796,062)
616,851,421 Other assets used in governmental activities are not financialresources and therefore are not reported in the governmental funds.
Deferred debt charges 12,583,420 Debt issuance costs 6,245,771 Less accumulated amortization (5,731,745)
13,097,446
Other postemployment benefits net asset (liability) is not a financial resource and therefore is not reported in the governmental funds. 7,926,468
Long-term liabilities, including bonds payable are not due and payable in the current period and therefore are not reportedin the governmental funds.
Governmental bonds payable (515,520,000) Bond premium (18,732,355) Less accumulated amortization 6,020,770 Capital leases payable (18,507,845) Compensated absences (26,435,533) Early separation incentive stipends (1,114,473)
(574,289,436)
Interest payable (2,242,787)
Deferred revenue represents amounts that were not available to fund currentexpenditures and therefore is not reported in the governmental funds. 4,325,915
Internal service funds are used by management to charge the costs ofcertain activities to individual funds. Net assets of the internal service funds are reported with governmental activities. 34,647,807
Total Net Assets of Governmental Activities $ 348,505,236
The notes to the financial statements are an integral part of this statement.
WASHOE COUNTY SCHOOL DISTRICTRECONCILIATION OF THE GOVERNMENTAL FUNDS BALANCE SHEET
TO THE STATEMENT OF NET ASSETSJUNE 30, 2009
21

SPECIAL DEBT 2009 BOND 2008 BONDGENERAL EDUCATION SERVICE ROLLOVER ROLLOVER
FUND FUND FUND FUND FUND
REVENUESLocal sources $ 251,687,260 $ - $ 62,415,178 $ 104,223 $ 1,022,156 State sources 143,541,679 22,892,682 - - - Federal sources 22,814,646 - - - - Other sources 245,070 - - - -
Total revenues 418,288,655 22,892,682 62,415,178 104,223 1,022,156
EXPENDITURESCurrent
Regular programs 206,770,100 - - - - Special programs - 44,744,223 - - - Vocational programs 7,501,464 - - - - Other instructional programs 4,408,490 - - - - Adult education programs - - - - - Community service programs - - - - - Undistributed expenditures
Student support 26,175,307 1,829,898 - - - Instructional staff support 11,620,405 968,848 - - - General administration 9,203,762 - - - - School administration 30,645,463 322,109 - - - Business support 5,129,516 - - - 689,713 Operation and maintenance 50,304,444 59,453 - - - Student transportation 13,945,480 6,570,749 - - - Central support 9,756,925 - - - - Other support - - - - - Community service operations - - - - -
Capital outlay - - - 2,721,894 27,474,042 Debt service
Principal - - 32,747,389 - - Interest - - 24,035,406 - - Bond issuance costs - - - 629,331 - Other - - 11,698 - -
Total expenditures 375,461,356 54,495,280 56,794,493 3,351,225 28,163,755
Excess (deficiency) of revenues over expenditures 42,827,299 (31,602,598) 5,620,685 (3,247,002) (27,141,599)
FOR THE YEAR ENDED JUNE 30, 2009
WASHOE COUNTY SCHOOL DISTRICTGOVERNMENTAL FUNDS
STATEMENT OF REVENUES, EXPENDITURES,AND CHANGES IN FUND BALANCES
22
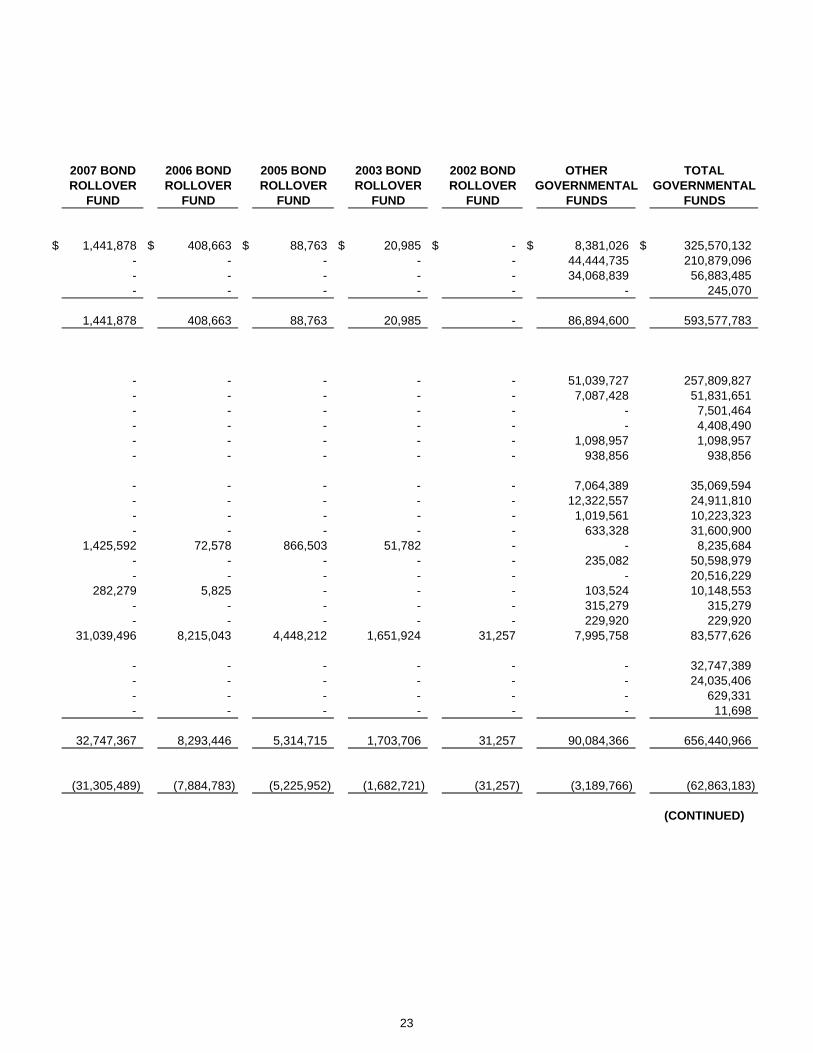
2007 BOND 2006 BOND 2005 BOND 2003 BOND 2002 BOND OTHER TOTALROLLOVER ROLLOVER ROLLOVER ROLLOVER ROLLOVER GOVERNMENTAL GOVERNMENTAL
FUND FUND FUND FUND FUND FUNDS FUNDS
$ 1,441,878 $ 408,663 $ 88,763 $ 20,985 $ - $ 8,381,026 $ 325,570,132 - - - - - 44,444,735 210,879,096 - - - - - 34,068,839 56,883,485 - - - - - - 245,070
1,441,878 408,663 88,763 20,985 - 86,894,600 593,577,783
- - - - - 51,039,727 257,809,827 - - - - - 7,087,428 51,831,651 - - - - - - 7,501,464 - - - - - - 4,408,490 - - - - - 1,098,957 1,098,957 - - - - - 938,856 938,856
- - - - - 7,064,389 35,069,594 - - - - - 12,322,557 24,911,810 - - - - - 1,019,561 10,223,323 - - - - - 633,328 31,600,900
1,425,592 72,578 866,503 51,782 - - 8,235,684 - - - - - 235,082 50,598,979 - - - - - - 20,516,229
282,279 5,825 - - - 103,524 10,148,553 - - - - - 315,279 315,279 - - - - - 229,920 229,920
31,039,496 8,215,043 4,448,212 1,651,924 31,257 7,995,758 83,577,626
- - - - - - 32,747,389 - - - - - - 24,035,406 - - - - - - 629,331 - - - - - - 11,698
32,747,367 8,293,446 5,314,715 1,703,706 31,257 90,084,366 656,440,966
(31,305,489) (7,884,783) (5,225,952) (1,682,721) (31,257) (3,189,766) (62,863,183)
(CONTINUED)
23

SPECIAL DEBT 2009 BOND 2008 BONDGENERAL EDUCATION SERVICE ROLLOVER ROLLOVER
FUND FUND FUND FUND FUND
FOR THE YEAR ENDED JUNE 30, 2009
WASHOE COUNTY SCHOOL DISTRICTGOVERNMENTAL FUNDS
STATEMENT OF REVENUES, EXPENDITURES,AND CHANGES IN FUND BALANCES
OTHER FINANCING SOURCES (USES)Bonds issued - - - 45,000,000 - Bond premiums - - - 338,162 - Transfers in 3,000,000 31,602,598 3,939,027 - - Transfers out (37,249,390) - - - -
Total other financing sources (uses) (34,249,390) 31,602,598 3,939,027 45,338,162 -
Net change in fund balances 8,577,909 - 9,559,712 42,091,160 (27,141,599)
FUND BALANCE, July 1 48,227,132 - 63,170,179 - 53,056,757
FUND BALANCE, June 30 $ 56,805,041 $ - $ 72,729,891 $ 42,091,160 $ 25,915,158
The notes to the financial statements are an integral part of this statement.
24

2007 BOND 2006 BOND 2005 BOND 2003 BOND 2002 BOND OTHER TOTALROLLOVER ROLLOVER ROLLOVER ROLLOVER ROLLOVER GOVERNMENTAL GOVERNMENTAL
FUND FUND FUND FUND FUND FUNDS FUNDS
- - - - - - 45,000,000 - - - - - - 338,162 - - - - - 38,860 38,580,485 - - - - - (3,038,860) (40,288,250)
- - - - - (3,000,000) 43,630,397
(31,305,489) (7,884,783) (5,225,952) (1,682,721) (31,257) (6,189,766) (19,232,786)
55,952,040 13,505,758 6,543,949 1,682,721 31,257 25,251,395 267,421,188
$ 24,646,551 $ 5,620,975 $ 1,317,997 $ - $ - $ 19,061,629 $ 248,188,402
25

Net Change in Fund Balances - Governmental Funds $ (19,232,786)
Amounts reported for governmental activities in the statement of activities are different because:
Capital outlays to purchase or build capital assets are reported in governmental funds asexpenditures. However, for governmental activities those costs are shown in the statement of net assets and allocated over their estimated useful lives as annual depreciation expenses in the statement of activities.
Expenditures for capital assets $ 73,219,024 Less current year depreciation (18,596,895)
54,622,129
Repayment of debt principal is an expenditure in the governmental funds, but it reduceslong-term liabilities in the statement of net assets and does not affect the statement of activities. 32,747,389
Interest on long-term debt in the statement of activities differs from the amount reported in thegovernmental funds because interest is recorded as an expenditure in the funds when it is dueand thus requires current financial resources. In the statement of activities, however, interest expense is recognized as the interest accrues, regardless of when it is due. (54,764)
Because some property taxes will not be collected in time to pay for obligations of the current period, they are not considered available revenues in the governmental funds and are insteadreported as deferred revenues. The changes in deferred revenue are accounted for as revenue in the statement of activities. 2,178,589
In the statement of activities, only the gain or loss on the sale of capital assets is reported, whereas in the governmental funds, the entire proceeds from the sale increase financial resources. Thus, the change in net assets differs from the change in fund balances by the net book value of the assets sold. (37,256)
Issuance of long-term debt (e.g. refunding debt) provides current financial resources to the governmental funds, while the repayment of the principal consumes the current financial resources of governmental funds. The net effect of these transactions are deferred and amortized in the statement of activities.
Bonds issued (45,000,000)
Costs associated with the issuance of long-term debt and any discount or premium realized at thetime of incurring debt are recognized as an expenditure and other financing source or userespectively in the governmental funds. These items are accrued and deferred in the statement of activities and amortized over the life of the new debt.
Debt issuance costs 629,331 Current year amortization of debt issuance costs and charges (1,151,957)
(522,626)
Current year bond premiums (338,162) Current year amortization of bond premiums 1,075,583
737,421
Some expenses reported in the statement of activities do not require the use of currentfinancial resources and therefore are not reported as expenditures in governmental funds.
Change in long-term early separation incentive stipends 571,106 Change in long-term compensated absences (2,429,909) Change in other postemployment benefits net asset 4,870,866
3,012,063
Internal service funds are used by management to charge the costs of certain insuranceactivities to individual funds. The change in net assets of the internal service funds is reported with governmental activities. 4,485,933
Change in Net Assets of Governmental Activities $ 32,936,092
The notes to the financial statements are an integral part of this statement.
WASHOE COUNTY SCHOOL DISTRICTRECONCILIATION OF THE GOVERNMENTAL FUNDS STATEMENT OF REVENUES, EXPENDITURES
AND CHANGES IN FUND BALANCES TO THE STATEMENT OF ACTIVITIESFOR THE YEAR ENDED JUNE 30, 2009
26

VARIANCE TOORIGINAL FINAL ACTUAL FINAL BUDGET
REVENUESLocal sources $ 283,662,154 $ 259,357,020 $ 251,687,260 $ (7,669,760) State sources 145,479,916 137,642,199 143,541,679 5,899,480 Federal sources 530,000 22,399,831 22,814,646 414,815 Other sources 5,000 5,000 245,070 240,070
Total revenues 429,677,070 419,404,050 418,288,655 (1,115,395)
EXPENDITURESCurrent
Regular programs 215,438,417 211,876,910 206,770,100 5,106,810 Vocational programs 9,450,813 7,539,216 7,501,464 37,752 Other instructional programs 4,587,787 4,767,176 4,408,490 358,686 Undistributed expenditures
Student support 25,264,095 26,946,845 26,175,307 771,538 Instructional staff support 11,581,914 12,075,315 11,620,405 454,910 General administration 9,192,460 9,441,393 9,203,762 237,631 School administration 30,705,866 31,222,963 30,645,463 577,500 Business support 5,806,279 5,400,224 5,129,516 270,708 Operation and maintenance 51,638,486 52,773,162 50,304,444 2,468,718 Student transportation 16,284,922 14,641,260 13,945,480 695,780 Central support 10,149,561 10,241,081 9,756,925 484,156
Total expenditures 390,100,600 386,925,545 375,461,356 11,464,189
Excess of revenues over expenditures 39,576,470 32,478,505 42,827,299 10,348,794
OTHER FINANCING SOURCES (USES)Contingency (3,052,087) - - - Transfers in - - 3,000,000 3,000,000 Transfers out (45,987,888) (38,477,165) (37,249,390) 1,227,775
Total other financing sources (uses) (49,039,975) (38,477,165) (34,249,390) 4,227,775
Net change in fund balance (9,463,505) (5,998,660) 8,577,909 14,576,569
FUND BALANCE, July 1 27,486,323 48,227,132 48,227,132 -
FUND BALANCE, June 30 $ 18,022,818 $ 42,228,472 $ 56,805,041 $ 14,576,569
The notes to the financial statements are an integral part of this statement.
FOR THE YEAR ENDED JUNE 30, 2009
BUDGET
WASHOE COUNTY SCHOOL DISTRICTGENERAL FUND
STATEMENT OF REVENUES, EXPENDITURESAND CHANGES IN FUND BALANCE - BUDGET AND ACTUAL
27

VARIANCE TOORIGINAL FINAL ACTUAL FINAL BUDGET
REVENUESState sources $ 22,908,933 $ 22,908,933 $ 22,892,682 $ (16,251)
EXPENDITURESCurrent
Special programs 47,314,532 44,926,986 44,744,223 182,763 Undistributed expenditures
Student support 1,615,070 2,233,713 1,829,898 403,815 Instructional staff support 882,150 1,035,906 968,848 67,058 School administration 302,767 323,240 322,109 1,131 Operation and maintenance 60,889 65,115 59,453 5,662 Student transportation 6,265,621 6,845,346 6,570,749 274,597
Total expenditures 56,441,029 55,430,306 54,495,280 935,026
Excess (deficiency) of revenues over expenditures (33,532,096) (32,521,373) (31,602,598) 918,775
OTHER FINANCING SOURCES Transfers in 33,532,096 32,521,373 31,602,598 (918,775)
Net change in fund balance - - - -
FUND BALANCE, July 1 - - - -
FUND BALANCE, June 30 $ - $ - $ - $ -
The notes to the financial statements are an integral part of this statement.
STATEMENT OF REVENUES, EXPENDITURESAND CHANGES IN FUND BALANCE - BUDGET AND ACTUAL
BUDGET
WASHOE COUNTY SCHOOL DISTRICTSPECIAL EDUCATION - SPECIAL REVENUE FUND
FOR THE YEAR ENDED JUNE 30, 2009
28

BUSINESS-TYPE GOVERNMENTALACTIVITIES ACTIVITIES
NUTRITION SERVICES INTERNAL SERVICEENTERPRISE FUND FUNDS
ASSETSCurrent assets
Cash and investments $ 2,055,508 $ 49,522,965 Accounts receivable 1,727,832 427,403 Interest receivable - 13,620 Inventories 582,057 - Prepaids 365 -
Total current assets 4,365,762 49,963,988
Capital assetsMachinery and equipment 1,674,222 5,295 Less: Allowance for depreciation (1,277,423) (265)
Total capital assets 396,799 5,030
Total assets 4,762,561 49,969,018
LIABILITIES Current liabilities
Accounts payable 232,206 151,086 Accrued liabilities 584,118 103,551 Pending claims - 10,619,280 Unearned revenue 244,812 -
Total current liabilities 1,061,136 10,873,917
Noncurrent liabilitiesPending claims - 4,447,294
Total liabilities 1,061,136 15,321,211
NET ASSETSInvested in capital assets 396,799 5,030 Unrestricted 3,304,626 34,642,777
Total net assets $ 3,701,425 $ 34,647,807
The notes to the financial statements are an integral part of this statement.
WASHOE COUNTY SCHOOL DISTRICTPROPRIETARY FUNDS
STATEMENT OF NET ASSETSJUNE 30, 2009
29

BUSINESS-TYPE GOVERNMENTALACTIVITIES ACTIVITIES
NUTRITION SERVICES INTERNAL SERVICEENTERPRISE FUND FUNDS
OPERATING REVENUESCharges for services $ 5,968,280 $ 65,018,657
OPERATING EXPENSESFood and supplies 7,886,203 - Salaries and benefits 7,924,465 117,498 Employee benefits - 53,386,581 Claims and services - 9,351,433 Purchased services 1,008,293 - Depreciation 106,177 265 Other 409,826 -
Total operating expenses 17,334,964 62,855,777
Operating income (loss) (11,366,684) 2,162,880
NONOPERATING REVENUESFederal subsidies 10,786,143 - Commodity revenue 1,075,525 - State matching funds 87,789 - Earnings on investments - 615,288
Total nonoperating revenues 11,949,457 615,288
Income before transfers 582,773 2,778,168
TRANSFERS Transfers in - 1,707,765
Change in net assets 582,773 4,485,933
NET ASSETS - July 1 3,118,652 30,161,874
NET ASSETS - June 30 $ 3,701,425 $ 34,647,807
The notes to the financial statements are an integral part of this statement.
FOR THE YEAR ENDED JUNE 30, 2009
WASHOE COUNTY SCHOOL DISTRICTPROPRIETARY FUNDS
STATEMENT OF REVENUES, EXPENSES ANDCHANGES IN NET ASSETS
30

BUSINESS-TYPE GOVERNMENTALACTIVITIES ACTIVITIES
NUTRITION SERVICES INTERNAL SERVICEENTERPRISE FUND FUNDS
INCREASE (DECREASE) IN CASH AND CASH EQUIVALENTS Cash flows from operating activities Cash received for services $ 4,812,817 $ 65,201,360 Cash paid for salaries and benefits (7,924,465) (117,498) Cash payments for employee benefits - (53,386,581) Cash payments for claims and services - (8,157,598) Cash paid for food and supplies (6,642,589) - Cash payments for purchased services (1,008,293) - Cash payments for other (409,826) -
Net cash provided (used) by operating activities (11,172,356) 3,539,683
Cash flows from capital and related financing activities Purchase of equipment (98,174) (5,295)
Cash flows from noncapital financing activities Federal reimbursements 10,786,143 - State matching funds 87,789 - Transfer from General Fund - 1,707,765
Net cash provided by noncapital financing activities 10,873,932 1,707,765
Cash flows from investing activities Interest received on investments - 615,288
Net increase (decrease) in cash and cash equivalents (396,598) 5,857,441
Cash and investments, beginning of year 2,452,106 43,665,524
Cash and investments, end of year $ 2,055,508 $ 49,522,965
RECONCILIATION OF OPERATING INCOME (LOSS) TO NET CASH PROVIDED (USED) BY OPERATIONS
Operating income (loss) $ (11,366,684) $ 2,162,880
Adjustments to reconcile operating income (loss) to net cash provided (used) by operations Depreciation 106,177 265 Commodity revenue 1,075,525 -
Changes in assets and liabilities Accounts receivable (1,105,277) 226,915 Inventories 86,391 - Prepaids 15 - Accounts payable 381 (82,833) Accrued liabilities 81,302 71,852 Pending claims - 1,204,816 Unearned revenue (50,186) (44,212) Total adjustments 194,328 1,376,803
Net cash provided (used) by operations $ (11,172,356) $ 3,539,683
The notes to the financial statements are an integral part of this statement.
WASHOE COUNTY SCHOOL DISTRICTPROPRIETARY FUNDS
STATEMENT OF CASH FLOWSFOR THE YEAR ENDED JUNE 30, 2009
31
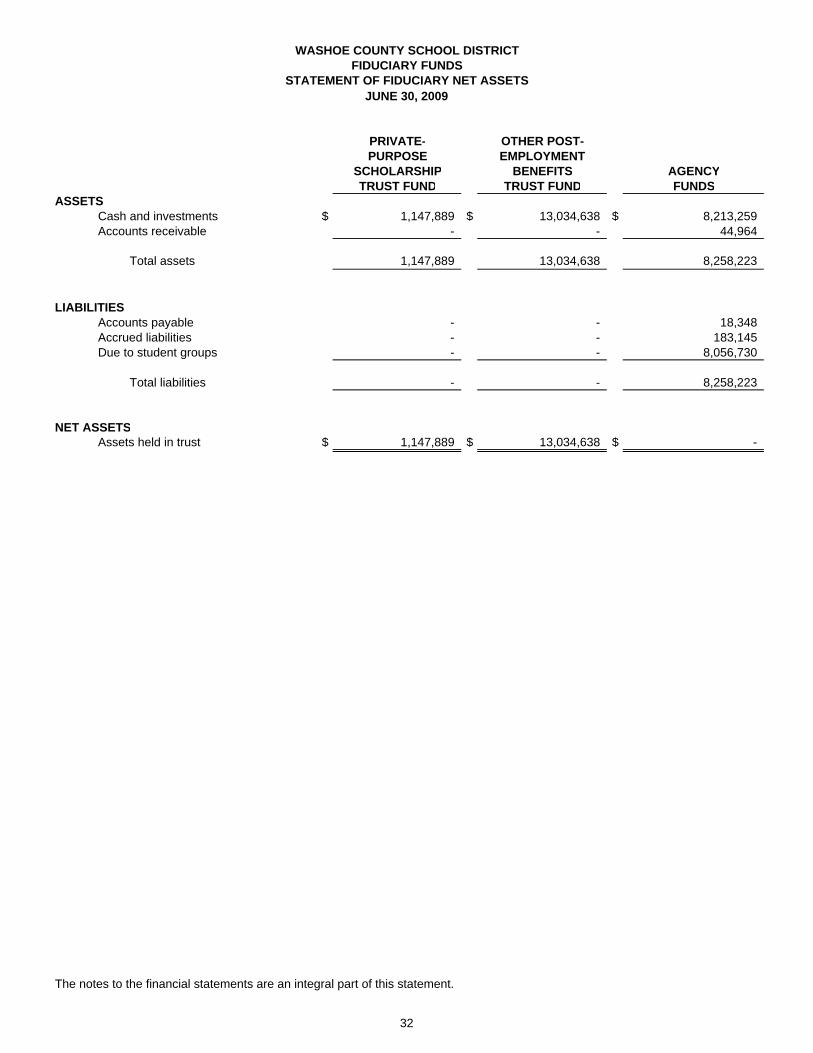
PRIVATE- OTHER POST-PURPOSE EMPLOYMENT
SCHOLARSHIP BENEFITS AGENCYTRUST FUND TRUST FUND FUNDS
ASSETSCash and investments $ 1,147,889 $ 13,034,638 $ 8,213,259 Accounts receivable - - 44,964
Total assets 1,147,889 13,034,638 8,258,223
LIABILITIES Accounts payable - - 18,348 Accrued liabilities - - 183,145 Due to student groups - - 8,056,730
Total liabilities - - 8,258,223
NET ASSETSAssets held in trust $ 1,147,889 $ 13,034,638 $ -
The notes to the financial statements are an integral part of this statement.
WASHOE COUNTY SCHOOL DISTRICTFIDUCIARY FUNDS
STATEMENT OF FIDUCIARY NET ASSETSJUNE 30, 2009
32

PRIVATE- OTHER POST-PURPOSE EMPLOYMENT
SCHOLARSHIP BENEFITSTRUST FUND TRUST FUND
ADDITIONSContributions by employer $ - $ 6,500,000 Earnings on investments 17,287 1,007,001 Adjustment to fair market value - (2,321,241) Donations 224,776 -
Total additions 242,063 5,185,760
DEDUCTIONSBenefits 214,180 -
Change in net assets 27,883 5,185,760
NET ASSETS - July 1 1,120,006 7,848,878
NET ASSETS - June 30 $ 1,147,889 $ 13,034,638
The notes to the financial statements are an integral part of this statement.
WASHOE COUNTY SCHOOL DISTRICTFIDUCIARY FUNDS
STATEMENT OF CHANGES IN FIDUCIARY NET ASSETSFOR THE YEAR ENDED JUNE 30, 2009
33

Notes to Financial Statements The notes provide required disclosure and information necessary to understand the District’s activities.

WASHOE COUNTY SCHOOL DISTRICT NOTES TO FINANCIAL STATEMENTS
JUNE 30, 2009
34
NOTE 1 – Summary of Significant Accounting Policies: The accompanying financial statements of the Washoe County School District, Washoe
County, Nevada (the "District") have been prepared in accordance with accounting principles generally accepted in the United States of America (GAAP), as applied to governmental units. The Governmental Accounting Standards Board (GASB) is the standard-setting body for governmental accounting and financial reporting. The GASB periodically updates its codification of existing Government and Financial Reporting Standards which, along with subsequent GASB pronouncements (Statements and Interpretations), constitutes GAAP for governmental units.
Reporting Entity: The District is organized under terms of legislation enacted in 1956 creating the countywide
school districts. The governing board consists of seven members elected by the voters in the district for four-year terms, and has authority to adopt and administer budgets. The District receives funding from Local, State, and Federal government sources and must comply with the related requirements of these funding source entities. However, the District is not included in any other governmental “reporting entity,” since trustees are elected by the public, it is a legally separate government and it is fiscally independent of any other governmental entity. In addition, the District is not financially accountable for any other entity.
Basic Financial Statements – Government-Wide Statements: The basic financial statements include both government-wide (based on the District as a
whole) and fund financial statements. The reporting focus is on either the District as a whole or major individual funds and nonmajor funds in the aggregate (within the fund financial statements).
The government-wide financial statements (the Statement of Net Assets and the Statement
of Activities) report information on all of the nonfiduciary activities of the District. Governmental activities, which normally are supported by taxes and intergovernmental revenues, are reported separately from business-type activities, which rely to a significant extent on fees and charges for support. For the most part, the effect of interfund activity has been removed from these statements. Interfund activities relating to services provided and used between functions are not eliminated. Elimination of these charges would distort the direct costs and program revenues reported for the various functions concerned.
In the government-wide Statement of Net Assets, the consolidated financial position of the
District is presented at year-end, in separate columns, for both governmental and business-type activities, and is reflected on a full accrual, economic resource basis that recognizes all long-term assets and receivables as well as long-term debt and obligations. The District’s net assets are reported in three parts – invested in capital assets, net of related debt; restricted net assets; and unrestricted net assets. The District first utilizes restricted resources to finance qualifying activities, then unrestricted resources, as they are needed.
The government-wide Statement of Activities reports both the gross and net cost of each of
the District’s functions. The functions are also supported by the general government

WASHOE COUNTY SCHOOL DISTRICT NOTES TO FINANCIAL STATEMENTS
JUNE 30, 2009
35
revenues (Ad Valorem taxes, School support taxes, Distributive School funds, Government Services Tax and interest income not legally restricted for specific programs, etc.). The Statement of Activities reduces gross expenses (including depreciation) by related program revenues and operating grants. Program revenues include operating grants and contributions and investment earnings legally restricted to support a specific program. Program revenue must be directly associated with the function. Operating grants include operating-specific and discretionary grants. The net costs (by function) are normally covered by general revenue.
Basic Financial Statements – Fund Financial Statements: The financial transactions of the District are reported in individual funds in the fund financial
statements. Each fund is accounted for by providing a separate set of self-balancing accounts that comprise its assets, liabilities, fund equity, revenues and expenditures/expenses. District resources are allocated to and accounted for in individual funds based upon the purposes for which they are intended and the means by which spending activities are controlled. Separate financial statements are provided for governmental funds, proprietary funds, and fiduciary funds, even though the latter are excluded from the government-wide financial statements.
The emphasis in the fund financial statements is on the major funds in the governmental
and business-type activity categories. Nonmajor governmental funds are summarized into a single column. GASB Statement No. 34 sets forth criteria for the determination of major funds. District management may electively add funds as major funds when it is determined the funds have specific community or management focus. Major individual governmental and business-type funds are reported as separate columns in the fund financial statements.
The focus of the governmental funds’ measurement in the fund statements is upon
determination of financial position and changes in financial position (sources, uses, and balances of financial resources) rather than upon net income.
The focus for proprietary fund measurement is upon determination of operating income,
changes in net assets, financial position, and cash flows. Proprietary funds distinguish operating revenues and expenses from non-operating items. Operating revenues and expenses generally result from providing services and producing and delivering goods in connection with a proprietary fund’s principal ongoing operations. All revenues and expenses not meeting this definition are reported as non-operating revenues and expenses. The generally accepted accounting principles applicable are those similar to businesses in the private sector.
The District’s internal service funds are presented in the proprietary fund’s financial
statements. Because the principal users of the internal services are the District’s governmental activities, the financial statements of the internal service funds are consolidated into the governmental column when presented in the government-wide financial statements. To the extent possible, the costs of these services are reported in the appropriate functional activity. The District’s fiduciary funds are presented in the fiduciary fund financial statements by type. Since, by definition, these assets are held for the benefit of third parties and cannot

WASHOE COUNTY SCHOOL DISTRICT NOTES TO FINANCIAL STATEMENTS
JUNE 30, 2009
36
be used to address activities or obligations of the District, these funds are not incorporated into the government-wide statements.
The District uses the following funds:
Major Funds:
Governmental Funds:
• General Fund - The General Fund is the general operating fund of the District and accounts for all revenues and expenditures of the District not encompassed within other funds. All general tax revenues and other receipts that are not allocated by law or contractual agreement to some other fund are accounted for in this fund. General operating expenditures and the capital improvement costs that are not paid through other funds are paid from the General Fund.
• Special Education Fund - The Special Education Fund accounts for
transactions of the District relating to educational services provided to children with special needs supported by state and local sources.
• Debt Service Fund - The Debt Service Fund accounts for the resources
accumulated and payments made for principal and interest on long-term general obligation debt, capital leases and other debt of governmental activities.
• 2002 Bond Rollover Fund - The 2002 Bond Rollover Fund accounts for the
2002 Bond Rollover proceeds. The proceeds were primarily used to build a middle school.
• 2003 Bond Rollover Fund - The 2003 Bond Rollover Fund accounts for the
2003 Bond Rollover proceeds. The proceeds were used to build a new middle school and a new elementary school and to fund school renewal and information technology projects.
• 2005 Bond Rollover Fund - The 2005 Bond Rollover Fund accounts for the
2005 Bond Rollover proceeds. The proceeds are being used for the completion of one middle school and one elementary school, the expansion of two high schools and one elementary school, the construction of one new elementary school, and to fund school renewal and information technology projects.
• 2006 Bond Rollover Fund - The 2006 Bond Rollover Fund accounts for the
2006 Bond Rollover proceeds. The proceeds are being used for site and water rights acquisition, advanced planning and technology costs, school renewal projects and transportation yard improvements.
• 2007 Bond Rollover Fund - The 2007 Bond Rollover Fund accounts for the
2007 Bond Rollover proceeds. The proceeds are being used for new school
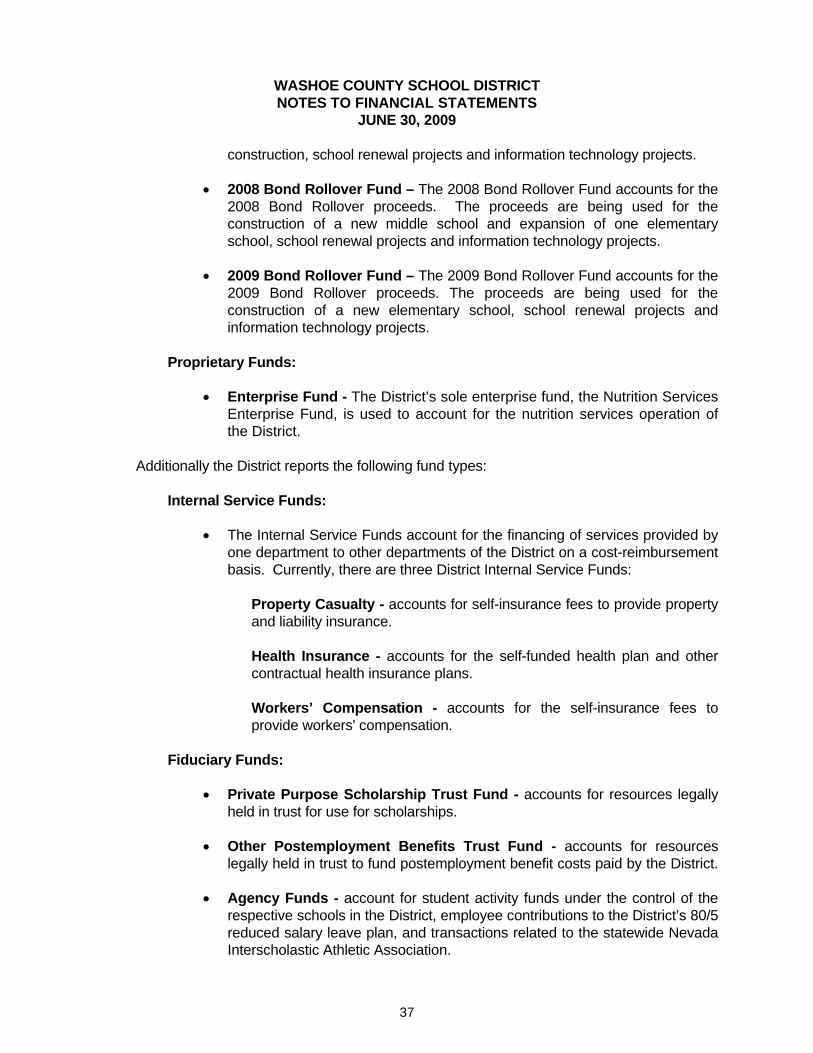
WASHOE COUNTY SCHOOL DISTRICT NOTES TO FINANCIAL STATEMENTS
JUNE 30, 2009
37
construction, school renewal projects and information technology projects. • 2008 Bond Rollover Fund – The 2008 Bond Rollover Fund accounts for the
2008 Bond Rollover proceeds. The proceeds are being used for the construction of a new middle school and expansion of one elementary school, school renewal projects and information technology projects.
• 2009 Bond Rollover Fund – The 2009 Bond Rollover Fund accounts for the
2009 Bond Rollover proceeds. The proceeds are being used for the construction of a new elementary school, school renewal projects and information technology projects.
Proprietary Funds:
• Enterprise Fund - The District’s sole enterprise fund, the Nutrition Services Enterprise Fund, is used to account for the nutrition services operation of the District.
Additionally the District reports the following fund types:
Internal Service Funds:
• The Internal Service Funds account for the financing of services provided by
one department to other departments of the District on a cost-reimbursement basis. Currently, there are three District Internal Service Funds:
Property Casualty - accounts for self-insurance fees to provide property and liability insurance. Health Insurance - accounts for the self-funded health plan and other contractual health insurance plans. Workers’ Compensation - accounts for the self-insurance fees to provide workers' compensation.
Fiduciary Funds:
• Private Purpose Scholarship Trust Fund - accounts for resources legally
held in trust for use for scholarships. • Other Postemployment Benefits Trust Fund - accounts for resources
legally held in trust to fund postemployment benefit costs paid by the District.
• Agency Funds - account for student activity funds under the control of the respective schools in the District, employee contributions to the District’s 80/5 reduced salary leave plan, and transactions related to the statewide Nevada Interscholastic Athletic Association.
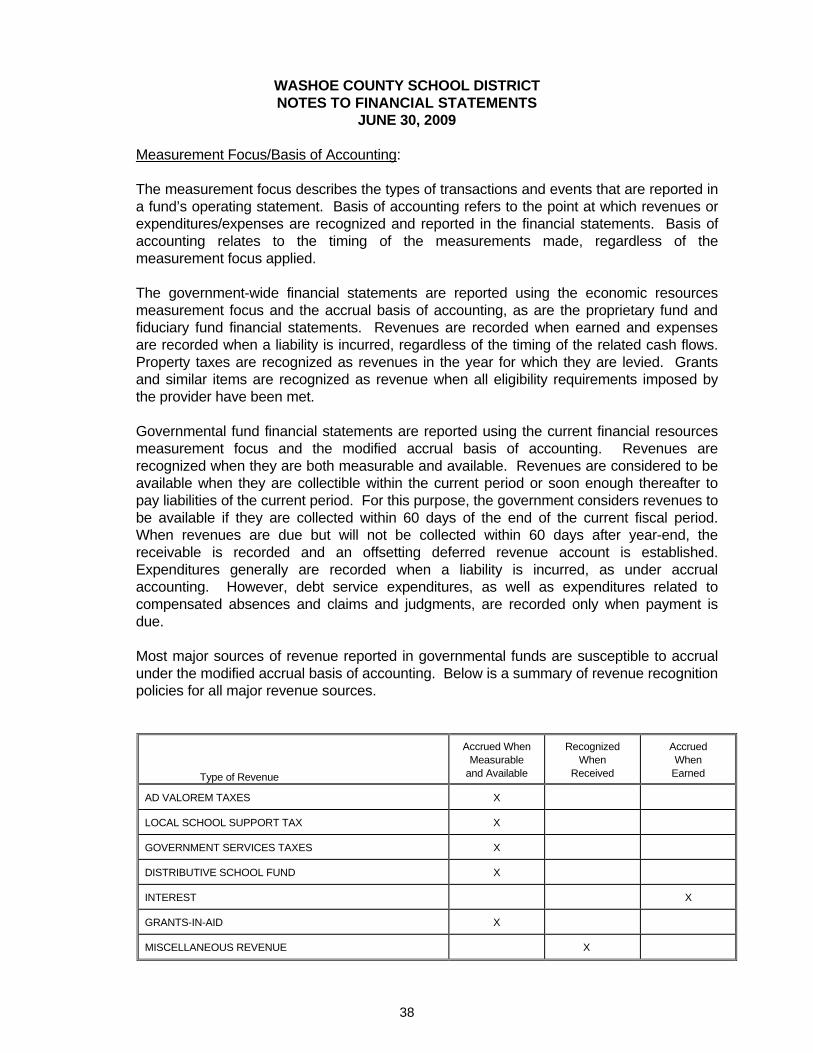
WASHOE COUNTY SCHOOL DISTRICT NOTES TO FINANCIAL STATEMENTS
JUNE 30, 2009
38
Measurement Focus/Basis of Accounting:
The measurement focus describes the types of transactions and events that are reported in a fund’s operating statement. Basis of accounting refers to the point at which revenues or expenditures/expenses are recognized and reported in the financial statements. Basis of accounting relates to the timing of the measurements made, regardless of the measurement focus applied.
The government-wide financial statements are reported using the economic resources
measurement focus and the accrual basis of accounting, as are the proprietary fund and fiduciary fund financial statements. Revenues are recorded when earned and expenses are recorded when a liability is incurred, regardless of the timing of the related cash flows. Property taxes are recognized as revenues in the year for which they are levied. Grants and similar items are recognized as revenue when all eligibility requirements imposed by the provider have been met.
Governmental fund financial statements are reported using the current financial resources
measurement focus and the modified accrual basis of accounting. Revenues are recognized when they are both measurable and available. Revenues are considered to be available when they are collectible within the current period or soon enough thereafter to pay liabilities of the current period. For this purpose, the government considers revenues to be available if they are collected within 60 days of the end of the current fiscal period. When revenues are due but will not be collected within 60 days after year-end, the receivable is recorded and an offsetting deferred revenue account is established. Expenditures generally are recorded when a liability is incurred, as under accrual accounting. However, debt service expenditures, as well as expenditures related to compensated absences and claims and judgments, are recorded only when payment is due.
Most major sources of revenue reported in governmental funds are susceptible to accrual
under the modified accrual basis of accounting. Below is a summary of revenue recognition policies for all major revenue sources.
Type of Revenue
Accrued When Measurable
and Available
Recognized When
Received
Accrued When
Earned
AD VALOREM TAXES X
LOCAL SCHOOL SUPPORT TAX X
GOVERNMENT SERVICES TAXES X
DISTRIBUTIVE SCHOOL FUND X
INTEREST X
GRANTS-IN-AID X
MISCELLANEOUS REVENUE X

WASHOE COUNTY SCHOOL DISTRICT NOTES TO FINANCIAL STATEMENTS
JUNE 30, 2009
39
Proprietary Funds: Proprietary Funds are accounted for on a flow of economic resources measurement focus
and use the accrual basis of accounting. Under this method, revenues are recorded when earned and expenses are recorded at the time liabilities are incurred. Accrued liabilities include provisions for claims reported and claims incurred but not reported. The provision for reported claims is determined by estimating the amount which will ultimately be paid. The provision for claims incurred but not yet reported is estimated based on District experience since the inception of the program.
Private-sector standards of accounting and financial reporting issued prior to December 1,
1989, generally are followed in both the government-wide and proprietary fund financial statements to the extent that those standards do not conflict with or contradict guidance of the Governmental Accounting Standards Board. Governments also have the option of following subsequent private-sector guidance for their business-type activities and enterprise funds, subject to this same limitation. The District has elected not to follow subsequent private-sector guidance.
Fiduciary Funds: The accounting records for the Private Purpose Scholarship Trust Fund and the Other
Postemployment Benefits Trust Fund are maintained on the economic resources measurement focus and accrual basis of accounting. Contributions are recognized in the Other Postemployment Benefits Trust Fund in the period in which the contributions are due and the District has made a formal commitment to provide the contributions. Benefits and refunds are recognized when due and payable in accordance with the terms of each plan. The accounting records for the agency funds do not have a measurement focus and are maintained on the accrual basis of accounting.
Property Taxes:
All real property in Washoe County is assigned a parcel number in accordance with state law,
with each parcel being subject to physical reappraisal every five years. A factoring system is used to adjust the appraised value during the years between physical appraisals. The valuation of the property and its improvements is being assessed at 35 percent of “taxable value” as defined by statute. The amount of tax levied is developed by multiplying the assessed value by the tax rate applicable to the area in which the property is located. The maximum tax rate was established in the State Constitution at $5 per $100 of assessed valuation; however, as a result of legislative action the tax rate has been further limited to $3.64 per $100 of assessed value except in cases of severe financial emergency as defined in NRS 354.705.
Taxes on real property are a lien on the property and attach on July 1 (the levy date) of the
year for which the taxes are levied. Taxes may be paid in four installments payable on the third Monday in August and the first
Mondays in October, January, and March to the Treasurer of Washoe County in which the District is located. Penalties are assessed if a taxpayer fails to pay an installment within ten days of the installment due date. After a two-year waiting period, if taxes remain unpaid, a

WASHOE COUNTY SCHOOL DISTRICT NOTES TO FINANCIAL STATEMENTS
JUNE 30, 2009
40
tax deed is issued conveying the property to the County with a lien for back taxes and accumulated charges. Redemption may be made by the owner and such persons as described by statute by paying all back taxes and accumulated penalties, interest, and costs before sale.
Secured roll property taxes receivable reflect only those taxes receivable from the last two
delinquent roll years. Delinquent taxes from all roll years prior to fiscal year 2007-08 have been written off.
Budgets and Budgetary Accounting: The District follows these procedures in establishing the budgetary data reflected in the
financial statements: (1) Prior to April 15, the Superintendent submits to the Board of
Trustees and to both the Nevada Department of Taxation and Department of Education a tentative budget for the fiscal year commencing the following July 1. The tentative budget includes proposed expenditures and the means of financing them.
(2) Prior to the third Wednesday in May, a minimum of seven days
notice of public hearing on the final budget is published in a local newspaper. Public hearings are conducted prior to the adoption of the budget to obtain taxpayer comments.
(3) On or before June 8, the budget is legally adopted by a majority
vote of the Board of Trustees.
(4) On or before January 1, the Board of Trustees adopts an amended final budget reflecting any adjustments necessary as a result of the complete count of students.
(5) NRS provides that the Board of Trustees may augment the budget
at any time by a majority vote of the Board providing the Board publishes notice of intention to act in a newspaper of general circulation in the county at least three days before the date set for adoption of the resolution.
(6) The legal level of budgetary control is at the function level for the
General Fund, Special Revenue and Capital Projects Funds, and the sum of operating and non-operating expenses in the Enterprise and Internal Service Funds. State statute does not require that debt service payments be limited by the budget.
(7) The Chief Financial Officer is authorized to transfer appropriations
within and between funds if amounts do not exceed the original budget. The Board of Trustees is advised of the transfer and the transfer is recorded in the minutes. Augmentations in excess of the original budget require approval from the Board of Trustees.

WASHOE COUNTY SCHOOL DISTRICT NOTES TO FINANCIAL STATEMENTS
JUNE 30, 2009
41
(8) Formal budgetary integration is employed as a management control device for the General Fund, Special Revenue Funds, Debt Service Fund, Enterprise Fund, Internal Service Funds and Capital Projects Funds. Such funds have legally adopted annual budgets which lapse at year-end. The ensuing year's budget is augmented to provide for the payment of prior year encumbrances. The prior year encumbrances, where applicable, have been included in the Original Budget column of the financial statements.
(9) All budgets are adopted on a basis consistent with accounting
principles generally accepted in the United States of America for all funds except for the Private Purpose Scholarship Trust Fund, the Other Postemployment Benefits Trust Fund, and Agency Funds, which do not require budgets.
All budgets presented in the accompanying supplementary information reflect the original budget and final budget (which has been adjusted for legally authorized revisions of the annual budgets during the year). Appropriations, except encumbrances and unexpended grant appropriations, lapse at the end of each fiscal year.
Cash and Investments: Cash balances from all funds are combined and, to the extent practicable, invested as
permitted by law. The District voluntarily participates in the State of Nevada Local Government Investment Pool (LGIP) and Washoe County’s external investment pool. Interest earned on investments is allocated to certain funds pursuant to Nevada Revised Statutes.
Investments are carried at fair value as determined by quoted market prices, net of accrued
interest as provided by the pool sponsors. Pursuant to NRS 355.170 and 355.175, the District may invest in the following types of
securities:
• United States bonds and debentures maturing within ten (10) years from the date of purchase.
• Certain farm loan bonds. • Securities of the United States Treasury, United States Postal Service, or the
Federal National Mortgage Association maturing within ten (10) years from the date of purchase.
• Negotiable certificates of deposit from commercial banks and insured savings and
loan associations, and credit unions. • Certain securities issued by local governments of the State of Nevada.

WASHOE COUNTY SCHOOL DISTRICT NOTES TO FINANCIAL STATEMENTS
JUNE 30, 2009
42
• Certain bankers' acceptances, commercial paper issued by a corporation organized and operating in the United States, and money market mutual funds.
• Certain obligations of state and local governments. • State of Nevada Local Government Investment Pool. • Certain “AAA” rated mutual funds that invest in federal securities. • Other securities expressly provided by other statutes, including repurchase
agreements, collateralized investment contracts, and investment in the Retirement Benefits Investment Fund.
Statements of Cash Flows: For purposes of the statements of cash flows, the District considers all short-term highly
liquid instruments purchased with an original maturity of three months or less to be cash equivalents.
Inventories: Inventories for the General Fund and the Nutrition Services Enterprise Fund are maintained
on a consumption basis of accounting, where items are purchased for inventory and charged to the budgetary accounts as the items are consumed. Inventories are stated at cost for the General Fund and the lower of cost or market for the Nutrition Services Enterprise Fund, using the first-in, first-out (FIFO) method of valuation.
Capital Assets:
Capital assets, including land, buildings, machinery and equipment, are reported in the government-wide financial statements. The District defines capital assets as assets with an initial, individual cost of more than $5,000 and an estimated useful life in excess of one year. If purchased or constructed, all capital assets are recorded at historical cost or estimated historical cost. Donated capital assets are valued at their estimated fair value as of the date of donation. The costs of normal maintenance and repairs that do not add to the value of the asset or materially extend the assets’ lives are not capitalized. Major outlays for capital assets and improvements are capitalized as projects are constructed.
Capital assets are depreciated using the straight-line method over the following estimated useful lives:
YEARS Building/Land Improvements 7 - 50 Vehicles/Buses 8 - 10 Machinery and Equipment 5 - 20
Allowance for Uncollectible Receivables: The District has not established an allowance for uncollectible receivables since prior
experience has shown that uncollectible receivables are not significant.

WASHOE COUNTY SCHOOL DISTRICT NOTES TO FINANCIAL STATEMENTS
JUNE 30, 2009
43
Accrued Liabilities: Accrued liabilities consist principally of teacher, administrator, and other District employee
salaries and benefits relating to the school program year ended June 30, 2009, but not yet paid.
Expenditures: Expenditure data is characterized by major program classifications pursuant to the
provisions of the Handbook II (Revised) Accounting System established by the Nevada Department of Education. Below is a brief description of these program classifications.
Regular programs are activities designed to provide elementary and secondary students
with learning experiences to prepare them as citizens, family members, and non-vocational workers.
Special programs are activities designed primarily to serve students having special needs. Special programs include services for the gifted and talented, mentally challenged, physically handicapped, emotionally disturbed, culturally different, learning disabled, bilingual, and special programs for other types of students at all levels.
Vocational programs are learning experiences that provide individuals with the opportunity to develop the necessary knowledge, skills, and attitudes needed for occupational employment. Other instructional programs are activities that provide elementary and secondary students with learning experiences in school-sponsored activities, athletics, and summer school. Adult education programs are learning experiences designed to develop knowledge and skills to meet intermediate and long-range educational objectives for adults who, having completed or interrupted formal schooling, have accepted adult roles and responsibilities. Community service programs are activities not directly related to the provision of educational services in the District. These include services such as community recreation programs, civic activities, public libraries, programs of custody and care of children and community welfare activities provided by the District for the community as a whole or some segment of the community. Undistributed expenditures are charges not readily assignable to a specific program. Student and instructional staff support and overall general and administrative costs are classified as undistributed expenditures. Also included are costs of operating, maintaining, and constructing the physical facilities of the District.
Compensated Absences: Teachers and certain hourly employees do not receive vacation leave. For other District
employees, vacation leave is earned at rates dependent on length of employment and can be accumulated to specific maximum days/hours. Employees are allowed to accumulate up to 190 sick days for future use. The District pays limited accumulated sick leave benefits

WASHOE COUNTY SCHOOL DISTRICT NOTES TO FINANCIAL STATEMENTS
JUNE 30, 2009
44
to certain employees upon retirement. In proprietary funds, compensated absences are recorded when the liabilities are incurred. In governmental funds, the current portion is recorded as a payroll expenditure. The current portion is defined as those benefits expected to be paid in the subsequent twelve months. The estimated long-term liability for compensated absences is accounted for in the government-wide financial statements.
Use of Estimates:
The preparation of financial statements in conformity with United States generally accepted accounting principles requires management to make estimates and assumptions that affect certain reported amounts and disclosures. Accordingly, actual results could differ from these estimates.
Comparative Data: Comparative total data for the prior years has been presented to provide an understanding
of the changes in the financial position and operations. It has been provided to add comparability but is not considered full disclosures of transactions for fiscal year 2008. Such information can only be obtained by referring to the audited financial statement for that year.
NOTE 2 – Compliance with Nevada Revised Statutes and Nevada Administrative Code: The District conformed to all significant statutory constraints on its financial administration
during the year. NOTE 3 – Cash and Investments:
The District maintains a cash and investment pool that is available for use by all funds. At June 30, 2009 this pool is displayed by major and other governmental funds on the Governmental Funds Balance Sheet and on the Enterprise Fund Statement of Net Assets as "Cash and Investments." As of June 30, 2009, the District had the following amounts reported as cash and investments: Government-Wide Balances:
Pooled Cash $ 2,581,935 Investments 312,618,464 315,200,399 Fiduciary Funds Balances: Pooled Cash 1,304,418 Cash held by Student Activity Agency Fund 3,805,665 Cash held by OPEB Trust Fund 25,164 Investments 17,260,539 22,395,786 Total Pooled Cash and Investments $ 337,596,185

WASHOE COUNTY SCHOOL DISTRICT NOTES TO FINANCIAL STATEMENTS
JUNE 30, 2009
45
Except for financial reporting purposes, the cash and investments balances in the Fiduciary Funds are not normally considered part of the District’s pooled cash and investments. These amounts represent cash and investments held in an agency capacity by the District and cannot be used in the District’s normal operations. As of June 30, 2009, the District had the following investments and maturities: Government-Wide Balances:
Fair Value Less than 1 1 to 4 4 to 6 6 to 10
Investments:Money Market Mutual Fund 16,560,255$ 16,560,255$ -$ -$ -$ State of Nevada Local Government
Investment Pool 182,633,935 182,633,935 * - - - State of Nevada Local Government
Investment Pool-Workers Comp 2,164,546 2,164,546 * - - - Washoe County Investment Pool 68,592,240 23,169,810 37,142,418 2,842,012 5,438,000 U.S. Treasuries 2,551,408 362,154 2,189,254 - - U.S. Agencies 33,707,884 16,106,143 16,219,940 871,379 510,422 Asset-Backed Corporate Securities 1,437,019 204,492 1,232,527 - - Corporate Securities 4,058,435 1,332,986 2,725,449 - - Government Guaranteed - Corp 400,610 - 400,610 - - Certificates of Deposit 512,132 512,132 - - -
Total Investments 312,618,464$ 243,046,453$ 59,910,198$ 3,713,391$ 5,948,422$
Fiduciary Fund Balances:
Fair Value
Investments:Retirement Benefits Investment
Fund 13,009,474 **State of Nevada Local Government
Investment Pool 4,251,065$ *
17,260,539$
* Average weighted maturity of 65 days.** Maturities range from December 2009 to December 2046.
Investment Maturities (In Years)
Interest Rate Risk. Interest rate risk is the risk of possible reduction in the value of a security, especially a bond, resulting from a rise in interest rates. To limit exposure to interest rate risk, Nevada Statutes and the District’s investment policy limits bankers’ acceptances to 180 days maturities, repurchase agreements to 90 days, U.S. Treasuries and Agencies to less than 10 years, and commercial paper to 270 days maturities. The District’s investment in U.S. Agencies consists of securities issued by the Federal National Mortgage Association, Federal Home Loan Mortgage Corporation, Federal Farm Credit Bank, and Federal Home Loans Bank. Since investments in these agencies are in many cases backed by assets such as mortgages they are subject to prepayment risk. The District’s investments in mortgage-backed securities are also subject to prepayment risk. Credit Risk. Credit risk is the risk that an issuer or other counterparty to an investment will not fulfill its obligation and is a function of the credit quality ratings of its investments. The State of Nevada LGIP, the Washoe County Investment Pool, and the Retirement Benefits Investment Fund are unrated external investment pools. Nevada Statutes and the District’s investment policy limit investment in money market mutual funds and asset-backed securities to the “AAA” rating (or equivalent) by a nationally recognized statistical rating organization. All of the District’s money market mutual funds and asset-backed securities investments are rated by nationally recognized statistical rating organizations as “AAA”.

WASHOE COUNTY SCHOOL DISTRICT NOTES TO FINANCIAL STATEMENTS
JUNE 30, 2009
46
Concentration of Credit Risk. To limit exposure to concentrations of credit risk, the District’s investment policy limits investment in bankers’ acceptance notes to 15%, repurchase agreements to 25%, commercial paper to 20%, and money market mutual funds to 25%, of the entire portfolio on the date of purchase. Custodial Credit Risk - Deposits. Custodial credit risk is the risk that in the event of a bank failure, the District’s deposits may not be returned. The District’s bank deposits are generally covered by FDIC insurance and are collateralized by the Office of the State Treasurer/ Nevada Collateral Pool.
The State of Nevada Local Government Investment Pool is an external pool administered by the State Treasurer, with oversight by the State of Nevada Board of Finance. Investment in the Local Government Investment Pool is carried at fair value, which is the same as the value of the pool shares.
The Washoe County Board of Commissioners administers and is responsible for the Washoe County Investment Pool in accordance with NRS 355.175. The external investment pool is not registered with the SEC as an investment company. Bank of New York determines the fair value of the investment pool monthly. Washoe County has not provided or obtained any legally binding guarantees during the year to support the value of shares. Each participant’s share is equal to their original investment plus or minus monthly allocation of interest income, realized and unrealized gains and losses. The Retirement Benefits Investment Fund (RBIF) is an external pool administered by a board that consists of the same Governor appointed individuals who serve on the Public Employees’ Retirement Board. The board is responsible for administering the Pool in accordance with NRS 355.220(2). The external investment pool is not registered with the SEC as an investment company. Bank of New York Mellon determines the fair value of the investment pool monthly. Each participant acts as fiduciary for its particular share of the Pool. RBIF allocates earnings (which include realized and unrealized gain or loss, interest, and other income) and expenses (both administrative and investment) to each participant according to their proportional share in the Pool.
NOTE 4 – Interfund Balances and Transfers: Interfund receivable/payable balances at June 30, 2009 are as follows:
Receivable Fund Payable Fund Amount
General Fund - major fund Other Governmental Funds 1,306,920$
Total 1,306,920$
The purpose of the interfund balance listed above is to address nonmajor Special Revenue Funds which are reimbursement-type funds that would otherwise have negative cash balances at the end of the year. Interfund transfers are reported as other financing sources or uses, as appropriate, in all funds other than Proprietary Funds, where they are reported as transfers.

WASHOE COUNTY SCHOOL DISTRICT NOTES TO FINANCIAL STATEMENTS
JUNE 30, 2009
47
Transfers between funds during the year ended June 30, 2009, are as follows:
Special Other InternalGeneral Education Debt Service Governmental Service
Fund Fund Fund Funds Fund TotalTransfers Out:General Fund -$ 31,602,598$ 3,939,027$ -$ 1,707,765$ 37,249,390$ Other Governmental Funds 3,000,000 - - 38,860 - 3,038,860
Total 3,000,000$ 31,602,598$ 3,939,027$ 38,860$ 1,707,765$ 40,288,250$
Transfers In:
Special Education Fund - The transfer to the Special Education Fund from the General Fund is to supplement State funds received for Special Education. Debt Service Fund - The transfer to the Debt Service Fund from the General Fund is for non-general obligation debt. Other Governmental Funds - The $3,000,000 transfer from the Pre-Funded Retiree Health Benefits Fund to the General Fund is to cover OPEB costs. The $38,860 transfer from Advanced Carpentry Project Fund closes this fund to the Building and Sites Fund. Internal Service Funds - The transfer to the Health Insurance Fund from the General Fund is to cover retiree health care costs.

WASHOE COUNTY SCHOOL DISTRICT NOTES TO FINANCIAL STATEMENTS
JUNE 30, 2009
48
NOTE 5 – Capital Assets:
Capital asset activity for the year ended June 30, 2009 was as follows:
July 1, 2008 June 30,2009Balance Increases Decreases Balance
Governmental Activities
Land 37,030,472$ 351,327 (22,726) 37,359,073$ Construction in progress 24,728,594 69,536,783 (23,235,794) 71,029,583
depreciated 61,759,066 69,888,110 (23,258,520) 108,388,656
Other capital assetsBuildings 629,660,141 15,869,222 - 645,529,363 Improvements other than buildings 10,182,196 7,365,672 - 17,547,868 Machinery and equipment 49,322,620 3,359,835 (495,565) 52,186,890
Total capital assets being depreciated 689,164,957 26,594,729 (495,565) 715,264,121
Total capital assets 750,924,023 96,482,839 (23,754,085) 823,652,777
Less accumulated depreciation for:Buildings (158,308,473) (13,759,882) - (172,068,355) Improvements other than buildings (1,318,474) (533,954) - (1,852,428) Machinery and equipment (29,030,528) (4,303,324) 458,309 (32,875,543)
Total accumulated depreciation (188,657,475) (18,597,160) 458,309 (206,796,326)
Governmental activities capitalassets, net 562,266,548$ 77,885,679 (23,295,776) 616,856,451$
Business-Type ActivitiesMachinery and equipment 1,576,048$ 98,174 - 1,674,222$
Less accumulated depreciation: (1,171,246) (106,177) - (1,277,423)
Business-Type Activities capitalassets, net 404,802$ (8,003) - 396,799$
Capital assets, not being depreciated
Total capital assets not being

WASHOE COUNTY SCHOOL DISTRICT NOTES TO FINANCIAL STATEMENTS
JUNE 30, 2009
49
Depreciation was charged to the functions/programs of the District as follows:
Governmental activities:Instruction 727,840$ Student support 124,560Instructional staff support 49,423General administration 19,914School administration 4,580Business support 66,027Operation/maintenance 401,832Student transportation 1,827,049Central support 229,637Other support 504Facilities 1,597
15,144,197Total governmental activities depreciation expense 18,597,160$
Business-type activities:Nutrition services operations 106,177$
Total business-type activities depreciation expense 106,177$
Machinery and equipment include equipment under capital leases, which consist of school buses and electrical retrofit with an aggregate carrying value of $15,245,176 at June 30, 2009 (see Note 6).
NOTE 6 – General Long-Term Obligations:
Bonds Issued: On February 18, 2009, Washoe County School District issued $45,000,000 in General Obligation School Improvement Bonds, Series 2009. The proceeds of the 2009 Bonds will be used for constructing, improving and equipping school facilities.

WASHOE COUNTY SCHOOL DISTRICT NOTES TO FINANCIAL STATEMENTS
JUNE 30, 2009
50
General long-term debt consists of the following at June 30, 2009:
Date Date of Interest Amount BalanceSeries Issued Maturity Rate (%) Issued June 30, 2009
2001A 05/01/01 06/01/20 4.25-5.25% 73,865,000 48,035,000$ 2002B 08/01/02 06/01/20 3.00-5.50% 68,940,000 68,160,0002003A 03/01/03 06/01/23 2.00-4.625% 27,770,000 17,605,0002003B 03/01/03 06/01/11 2.50-4.40% 8,230,000 2,415,0002003C 12/01/03 06/01/24 2.75-5.00% 55,000,000 34,315,0002004B 09/01/04 06/01/15 5.000% 22,970,000 22,970,0002005A 03/24/05 06/01/25 4.00-5.00% 66,000,000 42,125,0002005B 01/05/06 06/01/20 3.950% 29,820,000 29,590,0002006 04/05/06 06/01/26 4.00-5.50% 30,000,000 29,520,000
2007A 01/04/07 04/01/13 4.010% 24,190,000 19,975,0002007B 02/01/07 06/01/25 3.895% 42,395,000 41,985,0002007C 05/01/07 06/01/27 3.250-5.250% 65,000,000 62,000,0002008 03/20/08 06/01/28 4.00-5.00% 55,000,000 51,825,0002009 02/18/09 06/01/29 2.00-5.00% 45,000,000 45,000,000
Total 515,520,000$
General Obligation Bonds
Summary of general obligation bond debt service requirements to maturity:
TotalPrincipal Interest Requirements
30,945,000$ 23,831,171$ 54,776,171$ 31,945,000 21,950,958 53,895,958 32,405,000 20,527,850 52,932,850 35,770,000 19,036,023 54,806,023 32,765,000 17,363,717 50,128,717
168,170,000 64,546,000 232,716,000 128,415,000 28,612,371 157,027,371 55,105,000 5,345,711 60,450,711
515,520,000$ 201,213,801$ 716,733,801$
2020-20242025-2029
Total
20102011201220132014
2015-2019
Year(s) Ending June 30
Arbitrage Liability:
The District has determined it is liable to the Federal government (pursuant to federal tax laws) for arbitrage rebate on the proceeds of various capital project bond issues. The revenue reduction method of reporting is used whereby arbitrage rebate is recorded as a reduction of interest income. As of June 30, 2009, the liability has been estimated to be $748,959 and is reported as a noncurrent liability on the Statement of Net Assets (included in the balance of the current portion of long-term obligations). The arbitrage liability will be liquidated through the fund where excess investment earnings were earned.

WASHOE COUNTY SCHOOL DISTRICT NOTES TO FINANCIAL STATEMENTS
JUNE 30, 2009
51
Prior Years’ Advance Refundings:
In prior years, the District defeased certain general obligation debt by placing the proceeds of new bonds in an irrevocable trust to provide for all future debt service payments on the bonds refunded. Accordingly, the trust account assets and the liability for the defeased bonds are not included in the District’s financial statements. As of June 30, 2009, $163,445,000 of bonds outstanding are considered defeased.
Capital Lease Obligations:
The District has various capital leases on school buses, automobiles, educational software, and energy conservation projects. As of June 30, 2009, the assets acquired through capital leases are as follows:
Machinery and Equipment $ 23,519,787 Less: Accumulated amortization (8,274,611)
Total $ 15,245,176
The future minimum lease obligations and the net present value of these minimum lease payments are as follows:
Year Ending June 30,
2010 $ 3,200,669 2011 2,934,767 2012 1,961,961 2013 1,415,015
2014 3,817,786 2015-2019 7,402,822
Total minimum lease payments 20,733,020 Less: amount representing interest (2,225,175)
Present value of minimum lease payments $ 18,507,845
Lease payments are made by General Fund transfers to the Debt Service Fund.

WASHOE COUNTY SCHOOL DISTRICT NOTES TO FINANCIAL STATEMENTS
JUNE 30, 2009
52
Changes in General Long-Term Obligations:
Balance Balance Due WithinJuly 1, 2008 Additions Reductions June 30, 2009 One Year
General obligation bonds 500,380,000$ 45,000,000$ 29,860,000$ 515,520,000$ 30,945,000$
Deferred amounts forissuance of premium 13,449,006 338,162 1,075,583 12,711,585 1,086,376
Arbitrage payable 748,959 - - 748,959 -
Capital lease obligations 21,395,235 - 2,887,390 18,507,845 2,664,116$
Compensated absences 24,005,625 22,933,843 20,503,935 26,435,533 20,503,935
Early separation incentive pay 1,685,579 - 571,106 1,114,473 445,384
Other post-employmentbenefits liability 248,864 1,610,000 1,343,718 515,146 -
Total 561,913,268$ 69,882,005$ 56,241,732$ 575,553,541$ 55,644,811$
The liabilities for compensated absences and early separation incentive stipends are typically liquidated through the General Fund. Capital leases are generally liquidated through transfers from the General Fund to the Debt Service Fund.
The District was, in accordance with Nevada Revised Statute 387.400, within the legal debt limit at June 30, 2009.
NOTE 7 – Fund Balance/Net Assets - Restrictions, Reservations, Designations:
Government-Wide Financial Statements:
The government-wide Statement of Net Assets utilizes a net asset presentation. Net assets are categorized as investment in capital assets, net of related debt, restricted and unrestricted. Related debt is the debt outstanding that relates to the acquisition, construction, or improvement of capital assets.
Restricted assets are assets that have third-party (statutory, bond covenant or granting agency) limitation on their use. Restricted assets are classified by function, debt service, projects, or claims.
The restriction for debt service represents assets legally restricted by statute or bond covenants for future debt service requirements of both principal and interest. The amount restricted for capital projects consists of unspent grants, donations, and debt proceeds with third party restrictions for use on specific projects or programs. Net assets restricted for self-insurance activities represent the net assets of the self-insurance funds, which are legally restricted for the purposes for which the funds were established. Net assets restricted for other postemployment benefits represent amounts placed in trust to fund other postemployment benefits.
Unrestricted net assets represent available financial resources of the District.

WASHOE COUNTY SCHOOL DISTRICT NOTES TO FINANCIAL STATEMENTS
JUNE 30, 2009
53
Fund Financial Statements:
The District records the portion of fund balance, which is legally segregated for a specific future purpose as a reserve.
Following is a list of all reserves used by the District and a description of each:
(1) Reserved for Encumbrances: An account used to segregate a portion of fund balance for the amount of purchase orders, contracts, and other commitments which have been initiated but for which vendor performance has not been completed as of June 30.
(2) Reserved for Inventories: An account used to segregate the portion of fund
balance which is comprised of inventory and, as such, is not available for other discretionary expenditures.
(3) Reserved for Construction Contracts: An account used to segregate the
portion of fund balance for the amount of construction contracts for which the District is committed, but the capital project is not yet complete.
(4) Reserved for Capital Projects: An account used to segregate the portion of
fund balance for the amount of capital projects which the District has planned. (5) Reserved for Debt Service: An account used to segregate the fund balance
for Debt Service Fund resources which is legally restricted to the payment of long-term debt principal and interest amounts maturing in future years.
(6) Reserved for Sinking Fund: An account used to segregate the portion of fund
balance to redeem qualified zone academy bonds before or at their maturity.
Designations of fund balances are not legally required but are segregated for a specific purpose. The District records the following designations of unreserved fund balances:
(1) Designated for subsequent year's expenditures: This amount is the budgeted
opening fund balance for the forthcoming year. Amounts in excess of the budgeted opening fund balance are shown as undesignated. The designated for subsequent year's expenditures is included in the unreserved fund balance on the balance sheet. Amounts included are as follows:
General Fund $ 23,017,105 Special Revenue Funds $ 1,478,104
(2) Designated for repayment carryover of general supply appropriations: This account was established in 1992, and allows schools, divisions, and departments to carry over from year to year an amount not to exceed 8% of their total appropriations for the just completed fiscal year. These balances will augment 2009/2010 appropriations. The designated amount of $5,793,126 is presented in the General Fund.

WASHOE COUNTY SCHOOL DISTRICT NOTES TO FINANCIAL STATEMENTS
JUNE 30, 2009
54
(3) Designated for computer refresh: This balance is designated for the purchase of computers used for instructional purposes. The designated amount of $1,700,000 is presented in the General Fund.
(4) Designated for budget uncertainties: This balance is designated as a carry
forward for budget uncertainties relating to the economic downturn and the high likelihood of additional budget reductions being made by the State of Nevada. The designated amount of $11,669,812 is presented in the General Fund.
(5) Designated for Special Education maintenance of effort (MOE): This balance
is designated as a carry forward to fiscal year 2010-2011 from fiscal year 2009-2010 in anticipation of American Recovery and Reinvestment Act (ARRA) funding ending, thereby helping the District to maintain its effort regarding special education as required by the federal government. The designated amount of $5,000,000 is presented in the General Fund.
(6) Designated for Incline Village property tax: This balance is designated for
pending refunds to Incline Village taxpayers resulting from the Incline Village property tax lawsuit. The designated amount of $6,000,000 is presented in the General Fund.
(7) Designated for retiree health benefits: This balance is designated to fund the
cost of postemployment health benefits. The designated amount of $8,715,334 is included in the Pre-Funded Retiree Health Benefits special revenue fund.
NOTE 8 – Defined Benefit Pension Plan: Plan Description. Washoe County School District contributes to the Public Employees
Retirement System of the State of Nevada (PERS), a cost sharing, multiple employer, defined benefit plan administered by the Public Employees Retirement System of the State of Nevada. PERS provides retirement benefits, disability benefits, and death benefits, including annual cost of living adjustments, to plan members and their beneficiaries. Chapter 286 of the Nevada Revised Statutes establishes the benefit provisions provided to the participants of PERS. These benefit provisions may only be amended through legislation. The Public Employees Retirement System of the State of Nevada issues a publicly available financial report that includes financial statements and required supplementary information for PERS. That report may be obtained by writing to the Public Employees Retirement System of the State of Nevada, 693 West Nye Lane, Carson City, NV 89703-1599 or by calling (775) 687-4200.
Funding Policy. Benefits for plan members are funded under one of two methods.
Under the employer pay contribution plan, the District is required to contribute all amounts due under the plan. The rate for those contributions was 20.50% for regular members and 33.50% for police on all covered payroll.

WASHOE COUNTY SCHOOL DISTRICT NOTES TO FINANCIAL STATEMENTS
JUNE 30, 2009
55
The second funding mechanism for providing benefits is the employer/employee paid contribution plan. Under this method, employees are required to contribute a percentage of their compensation to the plan, while the District is required to match that contribution. The rate for regular employees under this plan was 10.50%.
The contribution requirements of plan members and the District are established by
Chapter 286 of the Nevada Revised Statutes and may only be amended through legislation.
The District's contribution rates and amounts on all covered payroll which are equal to
the required contributions for the last three years are as follows: Employee/ Employer Pay Employer Pay Total Police Employer Fiscal Year Regular Members Regular Contribution 2008-09 20.50% 33.50% 10.50% $ 59,157,102 2007-08 20.50% 33.50% 10.50% $ 55,682,810 2006-07 19.75% 32.00% 10.50% $ 50,926,425 NOTE 9 – Postemployment Benefits Other Than Pensions: From an accrual accounting perspective, the cost of postemployment healthcare and life
insurance benefits, like the cost of pension benefits, generally should be associated with the periods in which the cost occurs, rather than in the future year when it will be paid. In adopting prospectively Governmental Accounting Standards Board Statement No. 45 Accounting and Financial Reporting by Employers for Postemployment Benefits Other Than Pensions during the fiscal year ended June 30, 2009, the District recognizes the cost of postemployment healthcare and life insurance in the year when the employee services are received, reports the accumulated liability from prior years, and provides information useful in assessing potential demands on the District’s future cash flows. The annual funding, if paid on an ongoing basis, is projected to cover normal costs each year and to amortize any unfunded actuarial liabilities (or funding excess) over a period not to exceed thirty years.
Plan Descriptions: The District contributes to a single-employer defined benefit healthcare plan, Washoe
County School District Retiree Health Benefits Plan (WCSDRHP) and an agent multiple employer defined benefit healthcare plan, Nevada Public Employees’ Benefits Plan (NPEBP). Each plan provides medical benefits to eligible retired District employees and beneficiaries. The District also sponsors one single-employer defined benefit life insurance plan, WCSD Retiree Life Insurance Plan, which provides various levels of life insurance, at a blended rate, to eligible retired employees at the reduced blended rate cost.
Benefit provisions for WCSDRHP and the WCSD Retiree Life Insurance Plan are
established pursuant to NRS 287.023 and amended through negotiations between the District and the respective associations. NRS 288.150 assigns the authority to establish benefit provisions to the Board of Trustees. Benefit provisions for NPEBP are established
WASHOE COUNTY SCHOOL DISTRICT NOTES TO FINANCIAL STATEMENTS
JUNE 30, 2009
56
pursuant to NRS 287.023 and subject to amendment by the State of Nevada each biennium.
The WCSDRHP explicitly subsidizes medical premiums pursuant to the contracts
negotiated with various bargaining units for employees who retire from the District with at least 15 years of service. However, classified employees hired after June 30, 1999, certified employees who retire after August 31, 2006, and administrative employees who retire after June 30, 2006 are not eligible for explicit premium subsidies. The District’s cost for providing explicit subsidies is capped for the different groups at various percentages of General Fund property tax revenues, which is projected to grow 5.5% annually and was $1.7 million for fiscal year 2008-2009. However, under NRS 287.023, eligible retirees are eligible to participate in the plan with blended rates, thereby benefitting from an implicit subsidy. Retirees are required to contribute up to $6,846 per year for medical, dental and vision coverage, based on their gross PERS income, the number of years since their retirement and the number of years of service with the District. The District reimburses up to 100% of the amount of validated claims for medical and dental costs incurred by pre-Medicare retirees. The District serves as a secondary carrier for retirees eligible for Medicare. Expenditures for postemployment health care benefits are recognized as retirees report claims.
Any employee who has Basic Life and Accidental Death and Disability (AD&D) insurance
while active and retires from the District while drawing PERS at the time of his/her retirement is eligible to continue this benefit at retirement regardless of the number of years of service with the District. All future eligible retirees (not available to spouses of retirees) can receive the following Basic Life and AD&D benefit:
• Administrative - $200,000 • Certified - $40,000 • Classified - $40,000 • Confidential Classified (as defined by the District) - $50,000
This benefit is reduced 50% at age 70. The amount of the benefit is dependent on when an employee retired and is subject to coverage adjustments based on premium rate changes and bargaining results.
In the prior fiscal year, under the NPEBP plan, pursuant to NRS 287.023, retirees had the
option to participate in the District’s program for postemployment health care benefits or to join the Public Employees’ Benefit Program (PEBP) offered by the State of Nevada. Senate Bill No. 544 no longer allows District retirees not receiving PEBPs benefits as of November 30, 2008 to participate in NPEBP. For the remaining eligible retirees, local governments are required to pay the same portion of cost of coverage for those persons joining PEBP that the State of Nevada pays for those persons retired from state service who have continued to participate in the plan. As of June 30, 2009, 1,438 retirees were utilizing this benefit. The subsidy paid directly to PEPBs by the District for this coverage for the year ended June 30, 2009 was $6,478,344. Amounts contributed by retirees are paid directly to the State of Nevada and, as such, are not available.

WASHOE COUNTY SCHOOL DISTRICT NOTES TO FINANCIAL STATEMENTS
JUNE 30, 2009
57
Funding Policy and Annual OPEB Cost: For WCSDRHP, contribution requirements of the plan members and the District are
established and may be amended through negotiations between the District and the associations. The required contribution is based on projected pay-as-you-go financing requirements, with an additional amount to prefund benefits as determined in actuarial studies contracted for by the District. For fiscal year 2008-09, the District paid net medical claims of $3,537,179 out of the self-insured Health Insurance Fund for WCSDRHP retirees (approximately 55 percent of total costs) and an additional $2,283,019 was paid to prefund benefits. Plan member retirees receiving benefits contributed $2,921,881 or approximately 45 percent of the total costs for retirees, through their required contribution to the Health Insurance Fund.
For NPEBP, contribution requirements of the plan members and the District are established
and may be amended by the state legislature. The required contribution is based on projected pay-as-you-go financing requirements, with an additional amount to prefund benefits as determined in actuarial studies contracted for by the District. For fiscal year 2008-09, the District contributed $6,478,344 to NPEBP for current premiums and an additional $3,481,604 to prefund benefits. Information on plan members’ contributions to NPEBPs is unavailable. NRS 287.023 sunsetted the option to join PEBPs for District employees who were not receiving PEPBs benefits by November 30, 2008.
For WCSD Retiree Life Insurance Plan, contribution requirements of the plan members and
the District are established and may be amended through negotiations between the District and the associations. Retirees pay 100% of the pay-as-you-go premiums based on a blended rate that blends active participants and retirees. The District’s contribution requirements for retirees relate to the implicit subsidy that results from using the blended rates and is determined in actuarial studies contracted for by the District. For fiscal year 2008-09, the District contributed $608,341 for current premiums for retirees (approximately 74 percent of total costs) and paid $735,377 to the OPEB Trust Fund for retirees to prefund benefits. Plan member retirees receiving life insurance coverage contributed $215,034 or approximately 26 percent of the total costs for retirees, through their required contribution to the Health Insurance Fund.
The number of participants as of April 1, 2008, the actuarial valuation date, as updated on July 7, 2009, follows. The NPEBP retiree census is based on PEBP billing information as of January 2009. The active census is as of March 2008 and the census for the retirees enrolled in the District’s plan is as of April 2008. Both of these censuses are adjusted for participants choosing the PEPB option and found on the January 2009 PEPB billing information.

WASHOE COUNTY SCHOOL DISTRICT NOTES TO FINANCIAL STATEMENTS
JUNE 30, 2009
58
Active
WCSD Retiree Life Insurance
Plan
WCSDRHP
NPEBP
Medical Plan Active employees 6,081 Retirees enrolled in Washoe Plans
1,609
790
Retirees enrolled in NPEPBs
1,438
The District’s annual OPEB cost, the percentage of annual OPEB cost contributed to the plans, and the net OPEB obligations (assets), by plan, for fiscal year 2009 and the preceding year were as follows:
Fiscal Year Ended
Annual OPEB Cost
Employer Contributions
Percentage of Annual OPEB
Cost Contributed
Net OPEB Obligation
(Asset) WCSDRHP 6/30/09 $5,514,000 $5,820,198 105.55% $(2,086,024)WCSDRHP 6/30/08 $4,798,000 $6,577,826 137.10% $(1,779,826) NPEBP 6/30/09 $5,129,000 $9,959,948 194.19% $(6,355,590)NPEBP 6/30/08 $7,062,000 $8,586,642 121.59% $(1,524,642) WCSD Retiree Life Insurance Plan
6/30/09 $1,610,000 $1,343,718
83.46% $515,146
WCSD Retiree Life Insurance Plan
6/30/08 $1,620,000 $1,371,136
84.64% $248,864
Combined Totals 6/30/09 $12,253,000 $17,123,864 Combined Totals 6/30/08 $13,480,000 $16,535,604 Note that fiscal year 2007-08 was the first year of implementation; therefore, only one of the prior two years was available for disclosure.

WASHOE COUNTY SCHOOL DISTRICT NOTES TO FINANCIAL STATEMENTS
JUNE 30, 2009
59
The net OPEB obligation (asset) (NOPEBO) as of June 30, 2009, was calculated as follows:
WCSDRHP
NPEBP
WCSD Retiree Life Insurance
Plan
Totals Annual required contribution $5,559,000 $5,168,000 $1,604,000 $12,331,000Interest on the beginning net OPEB obligation (142,000) (122,000)
20,000 (244,000)
ARC Adjustment 97,000 83,000 (14,000) 166,000Annual OPEB cost 5,514,000 5,129,000 1,610,000 12,253,000Contributions made 5,820,198 9,959,948 1,343,718 17,123,864Increase (decrease) in net OPEB obligation (306,198) (4,830,948)
266,282 (4,870,864)
Net OPEB obligation (asset), beginning of year (1,779,826) (1,524,642)
248,864 (3,055,604)
Net OPEB obligation (asset), end of year $(2,086,024) $(6,355,590)
$515,146 $(7,926,468)
Funded Status and Funding Progress: The funded status of the plans as of the most recent actuarial valuation was as follows:
WCSDRHP
NPEBP
WCSD Retiree Life Insurance
Plan
Totals Accrued actuarial liability (a) $50,980,000 $119,644,000 $18,140,000 $188,764,000Actuarial value of plan assets (b) $2,119,768 $4,974,842 $754,268 $7,848,878Unfunded actuarial accrued liability (a) - (b)
$48,860,232 $114,669,158 $17,385,732 $180,915,122
Funded ratio (b) / (a) 4,16% 4.16% 4.16% 4.16% Covered payroll (c) $283 million $283 million
$283 million $283 million
Unfunded actuarial accrued liability as a percentage of covered payroll ([(a) – (b)] / (c))
17.27%
40.52% 6.14% 63.93% Actuarial valuations involve estimates of the value of reported amounts and assumptions
about the probability of events in the future. Amounts determined regarding the funded status of the plan and the annual required contributions of the employer are subject to continual revision as actual results are compared to past expectations and new estimates are made about the future. The required schedules of funding progress and employer contributions presented as required supplementary information provide current year information (and will provide multiyear trend information, when available, that shows whether the actuarial value of plan assets is increasing or decreasing over time relative to the actuarial accrued liability for benefits).

WASHOE COUNTY SCHOOL DISTRICT NOTES TO FINANCIAL STATEMENTS
JUNE 30, 2009
60
Actuarial Methods and Assumptions: Projections of benefits are based on the substantive plan (the plan as understood by the
employer and plan members) and include the types of benefits in force at the valuation date and the pattern of sharing benefits between the District and the plan members at that point.
Actuarial calculations reflect long-term perspective and employ methods and assumptions
that are designed to reduce short-term volatility in actuarial accrued liabilities and the actuarial value of assets. Significant methods and assumptions were as follows:
WCSDRHP
NPEBP WCSD Retiree Life
Insurance Plan Actuarial valuation date 4/1/08 4/1/08 4/1/08 Actuarial cost method Projected unit credit Projected unit credit Projected unit credit Amortization method
Level percentage of pay, open
Level percentage of pay, closed
Level percentage of pay, open
Remaining amortization period 30 years 30 years 30 years Asset valuation method Market value Market value Market value Actuarial assumptions: Investment rate of return Projected salary increases Healthcare inflation rate* *Decreasing .5% each year until ultimate trend rate of 6.0% is reached
8.0%
4.0%
11.0%
8.0%
4.0%
11.0%
8.0%
4.0%
11.0%
NOTE 10 – Risk Management: The District is exposed to various risks of losses related to torts; theft of, damage to, and
destruction of assets; errors and omissions; injuries to employees; and natural disasters. The District reports all of its risk management activities in the Internal Service Funds in accordance with Governmental Accounting Standards Board Statements Number 10 and 30.
Claims expenses and liabilities are reported when it is probable that a loss has occurred
and the amount of that loss can be reasonably estimated. These losses include an estimate of claims that have been incurred but not reported. Because actual claims liabilities depend on such complex factors as inflation, changes in legal doctrines, and damage awards, the process used in computing claims liability does not necessarily result in an exact amount. Claims liabilities are re-evaluated annually by an outside actuary who takes into consideration recently settled claims, the frequency of claims, and other economic and social factors. Liabilities for incurred losses to be settled by fixed or reasonably determinable payments over a long period of time are reported at their present value using the expected future investment yield of 4.0 percent.

WASHOE COUNTY SCHOOL DISTRICT NOTES TO FINANCIAL STATEMENTS
JUNE 30, 2009
61
At June 30, 2009, the amount of this liability was $15,066,574. This liability is determined by actuaries using all available information. Changes in the reported liability since July 1, 2007 are as follows:
Property & Health Workers'Casualty Insurance Compensation Total
Claims liability, July 1, 2007 2,811,000$ 6,268,163$ 3,548,000$ 12,627,163$
Current year claims and changes in estimates 816,716 46,546,617 2,941,169 50,304,502
Claims payments (947,716) (45,657,022) (2,465,169) (49,069,907)
Claims liability, June 30, 2008 2,680,000 7,157,758 4,024,000 13,861,758
Current year claims and changes in estimates 1,745,421 50,353,533 2,663,916 54,762,870
Claims payments (1,816,421) (49,600,717) (2,140,916) (53,558,054)
Claims liability, June 30, 2009 2,609,000$ 7,910,574$ 4,547,000$ 15,066,574$
Due within one year 1,171,842$ 7,910,574$ 1,536,864$ 10,619,280$
At June 30, 2009, the Internal Service Funds held $49,522,964 in cash and investments available for payment of these claims. The District combines both self-insurance and commercial insurance to protect against risks. There was no significant reduction in those insurance coverages purchased by the District from the previous year. Settled claims have not exceeded the commercial coverage in any of the past three years. The following is a detail of coverage:
General Liability, Property and Casualty Insurance - The District is self-insured
for individual losses up to a maximum of $50,000 for damage to real and personal property, and $300,000 for general liability and automobile incidents resulting in bodily injury and/or property damage claims. The District has insurance for losses above $50,000 and $300,000, respectively, with maximum annual coverage of approximately $500,000,000 for property damage, coverage of $4,000,000 per occurrence for crime, and $10,000,000 per occurrence for wrongful acts of the Board of Trustees, and general and automobile liability.
Health Insurance - The District is self-insured for health insurance claims up to
$300,000 per calendar year per employee with a lifetime maximum of $2,000,000 per employee.
Workers’ Compensation Insurance - The District is self-insured for individual
workers’ compensation claims up to $500,000 for each accident. Accidents in

WASHOE COUNTY SCHOOL DISTRICT NOTES TO FINANCIAL STATEMENTS
JUNE 30, 2009
62
excess of $500,000 are covered by excess insurance up to State statutory limits. The District maintains an account with a market value of $2,164,546 as of June 30, 2009 to meet its State of Nevada security deposit requirement.
The Property and Casualty, Health Insurance and Workers’ Compensation Funds charge the District's insured funds monthly premiums.
NOTE 11 – Commitments and Contingencies: Construction Commitments: As of June 30, 2009, the District had the following commitments with respect to
unfinished capital projects:
Remaining
Construction Expected Date Capital Project Description Commitment of CompletionAACT Projects 4,965,898$ December 2009Accounting Software Upgrade 8,514$ June 2012ADA Retrofit Projects 7,323$ December 2009Bleachers Replacement Projects 335,020$ December 2009Erosion Control Projects 590,821$ March 2010CCTV Projects 121,807$ December 2009Depoali Middle School Projects 1,009,254$ March 2010Electrical System Projects 132,110$ March 2010Flooring Upgrades 481,139$ March 2010Fire Alarm Upgrades 587,211$ March 2010Heating/Cooling System Projects 91,697$ March 2010Incline Elementary School Projects 110,932$ December 2009Infrastructure Improvements 1,378,285$ March 2010Miscellaneous Capital Renewal Projects 8,031$ December 2009La Pasada Elementary School 526,769$ December 2009Repaving Projects 685,116$ September 2009Reroofing Projects 1,174,286$ September 2009Revitalization Projects 5,286,615$ March 2010Site Improvement Projects 30,474$ September 2009
17,531,302$
This remaining construction commitment is included in the reserve for construction contracts on the Governmental Funds Balance Sheet.
Currently, no additional financing is required to complete construction in progress at
June 30, 2009. Litigation: The District is a defendant in various legal actions. The amount of liability or loss, if
any, arising from such legal actions cannot be reasonably estimated at the present

WASHOE COUNTY SCHOOL DISTRICT NOTES TO FINANCIAL STATEMENTS
JUNE 30, 2009
63
time. It is the opinion of management and legal counsel of the District that none of these cases would have a material impact upon the financial condition of the District.
NOTE 12 – Subsequent Events: The District receives a portion of the property tax revenues collected in Washoe
County. On July 20, 2009, the Nevada State Board of Equalization issued a verbal decision that nearly 9,000 Incline Village/Crystal Bay property owners were entitled to have their fiscal year 2007 property values rolled back to fiscal year 2003 property values which would result in property tax refunds. A written decision was to follow the State Board of Equalization's verbal decision within 60 days, and upon issuance of the written decision the County would have 30 days to appeal. On October 6, 2009, prior to the release of the written decision and the County's ability to appeal, a District Court decision was handed down ordering the Washoe County Treasurer to issue refunds to the affected property owners. As of the issuance of this report, the fiscal impact of the District Court order could not be estimated due to the complexity of Nevada property tax law and any legal remedies available to the County had yet to be determined. Therefore, the impact on the District’s financial condition cannot be reasonably estimated.

WASHOE COUNTY SCHOOL DISTRICT REQUIRED SUPPLEMENTARY INFORMATION
JUNE 30, 2009
64
Actuarial Valuation
Date
Actuarial Value of
Assets (a)
Actuarial Accrued
Liability (AAL) - Projected Unit
Credit (b)
Unfunded AAL (UAAL) (b - a)
Funded Ratio (a / b)
Covered Payroll (c)
UAAL as a Percentage of Covered
Payroll ([b-a] / c)
WCSDRHP6/30/08 4/1/2008 2,119,768$ 50,980,000$ 48,860,232$ 4.16 % 283,000,000$ 17.27 %
NPEBP6/30/08 4/1/2008 4,974,842$ 119,644,000$ 114,669,158$ 4.16 % 283,000,000$ 40.52 %
WCSD Retiree Life Insurance Plan
6/30/08 4/1/2008 754,268$ 18,140,000$ 17,385,732$ 4.16 % 283,000,000$ 6.14 %
Schedule of Funding Progress
Year Ended June 30,
Annual OPEB Cost
Percentage Contributed
WCSDRHP 2008 4,798,000$ 137.10 %2009 5,514,000$ 105.55 %
NPEBP 2008 7,062,000$ 121.59 %2009 5,129,000$ 194.19 %
WCSD Retiree Life Insurance Plan 2008 1,620,000$ 84.64 %
2009 1,610,000$ 83.46 %
Schedule of Employer Contributions

Nonmajor Governmental Funds
Combining Balance Sheet
Combining Statement of Revenues,
Expenditures and Changes in Fund Balance

SPECIAL CAPITAL REVENUE PROJECTS
FUNDS FUNDS TOTAL
ASSETSCash and investments $ 15,985,497 $ 8,185,850 $ 24,171,347 Receivables Accrued interest 3,557 2,429 5,986 Grants 4,511,314 - 4,511,314 Miscellaneous 293,962 - 293,962 Due from other governments - 291,848 291,848
Total assets $ 20,794,330 $ 8,480,127 $ 29,274,457
LIABILITIES Accounts payable $ 489,545 $ 229,704 $ 719,249 Accrued liabilities 6,577,784 159,837 6,737,621 Construction contracts payable - 118,544 118,544 Due to other funds 1,306,920 - 1,306,920 Due to other governments 66,155 - 66,155 Deferred revenues 1,264,339 - 1,264,339
Total liabilities 9,704,743 508,085 10,212,828
FUND BALANCESReserved for Encumbrances - 285,830 285,830 Construction contracts - 72,640 72,640 Capital projects - 3,559,736 3,559,736 Unreserved Designated for subsequent year's expenditures 1,478,104 - 1,478,104 Designated for retiree health benefits 8,715,334 - 8,715,334 Undesignated 896,149 4,053,836 4,949,985
Total fund balances 11,089,587 7,972,042 19,061,629
Total liabilities and fund balances $ 20,794,330 $ 8,480,127 $ 29,274,457
WASHOE COUNTY SCHOOL DISTRICTNONMAJOR GOVERNMENTAL FUNDS
COMBINING BALANCE SHEETJUNE 30, 2009
65

SPECIAL CAPITALREVENUE PROJECTS
FUNDS FUNDS TOTAL
REVENUESLocal sources $ 4,001,776 $ 4,379,250 $ 8,381,026 State sources 44,444,735 - 44,444,735 Federal sources 34,068,839 - 34,068,839
Total revenues 82,515,350 4,379,250 86,894,600
EXPENDITURESCurrent
Regular programs 51,039,727 - 51,039,727 Special programs 7,087,428 - 7,087,428 Adult education programs 1,098,957 - 1,098,957 Community service programs 938,856 - 938,856 Undistributed expenditures
Student support 7,064,389 - 7,064,389 Instructional staff support 12,322,557 - 12,322,557 General administration 1,019,561 - 1,019,561 School administration 633,328 - 633,328 Operation and maintenance 235,082 - 235,082 Central support 103,524 - 103,524 Other support 315,279 - 315,279 Community service programs 229,920 - 229,920
Capital outlay 584,941 7,410,817 7,995,758
Total expenditures 82,673,549 7,410,817 90,084,366
Excess (deficiency) of revenues over expenditures (158,199) (3,031,567) (3,189,766)
OTHER FINANCING SOURCES (USES)Transfers in - 38,860 38,860 Transfers out (3,038,860) - (3,038,860)
Total other financing sources (uses) (3,038,860) 38,860 (3,000,000)
Net change in fund balances (3,197,059) (2,992,707) (6,189,766)
FUND BALANCE, July 1 14,286,646 10,964,749 25,251,395
FUND BALANCE, June 30 $ 11,089,587 $ 7,972,042 $ 19,061,629
FOR THE YEAR ENDED JUNE 30, 2009
WASHOE COUNTY SCHOOL DISTRICTNONMAJOR GOVERNMENTAL FUNDS
COMBINING STATEMENT OF REVENUES, EXPENDITURES,AND CHANGES IN FUND BALANCES
66

General Fund To account for resources traditionally associated with governments which are not required to be accounted for in other funds.

2009 2008ASSETS
Cash and investments $ 47,025,543 $ 53,767,504 Receivables Property taxes 6,375,414 2,983,932 Interest 18,379 127,470 Miscellaneous 1,392,351 732,794 Due from other funds 1,306,920 3,225,326 Due from other governments 42,564,266 29,363,092 Inventories 1,096,435 917,241
Total assets $ 99,779,308 $ 91,117,359
LIABILITIES Accounts payable $ 3,377,298 $ 4,782,618 Accrued liabilities 36,089,607 35,997,881 Due to other governments 261,000 261,000 Deferred revenues 3,246,362 1,848,728
Total liabilities 42,974,267 42,890,227
FUND BALANCESReserved for Encumbrances 2,528,563 794,255 Inventories 1,096,435 917,241
Unreserved Designated for subsequent year's expenditures 23,017,105 18,107,494 Designated for repayment carryover of general supply appropriations 5,793,126 6,848,650 Designated for negotiated employee contracts - 5,126,000 Designated for computer refresh 1,700,000 1,700,000 Designated for utilities - 1,000,000 Designated for budget uncertainties 11,669,812 - Designated for Special Education MOE 5,000,000 - Designated for expenditures - 831,021 Designated for Incline Village property tax 6,000,000 - Undesignated - 12,902,471
Total fund balances 56,805,041 48,227,132
Total liabilities and fund balances $ 99,779,308 $ 91,117,359
(WITH COMPARATIVE TOTALS FOR JUNE 30, 2008)
WASHOE COUNTY SCHOOL DISTRICTCOMPARATIVE BALANCE SHEET
GENERAL FUNDJUNE 30, 2009
67

2008VARIANCE TO
ORIGINAL FINAL ACTUAL FINAL BUDGET ACTUAL REVENUES Local sources $ 283,662,154 $ 259,357,020 $ 251,687,260 $ (7,669,760) $ 283,053,724 State sources 145,479,916 137,642,199 143,541,679 5,899,480 125,502,463 Federal sources 530,000 22,399,831 22,814,646 414,815 520,616 Other sources 5,000 5,000 245,070 240,070 281,635
Total revenues 429,677,070 419,404,050 418,288,655 (1,115,395) 409,358,438
EXPENDITURES Current
Regular programs 215,438,417 211,876,910 206,770,100 5,106,810 203,912,732 Vocational programs 9,450,813 7,539,216 7,501,464 37,752 7,103,556 Other instructional programs 4,587,787 4,767,176 4,408,490 358,686 3,839,555 Undistributed expenditures Student support 25,264,095 26,946,845 26,175,307 771,538 24,680,324 Instructional staff support 11,581,914 12,075,315 11,620,405 454,910 12,314,879 General administration 9,192,460 9,441,393 9,203,762 237,631 9,220,284 School administration 30,705,866 31,222,963 30,645,463 577,500 29,379,410 Business support 5,806,279 5,400,224 5,129,516 270,708 5,066,050 Operation and maintenance 51,638,486 52,773,162 50,304,444 2,468,718 47,345,718 Student transportation 16,284,922 14,641,260 13,945,480 695,780 17,977,598 Central support 10,149,561 10,241,081 9,756,925 484,156 8,635,206
Total expenditures 390,100,600 386,925,545 375,461,356 11,464,189 369,475,312
Excess of revenues over expenditures 39,576,470 32,478,505 42,827,299 10,348,794 39,883,126
OTHER FINANCING SOURCES (USES)Capital leases - - - - 1,995,000 Contingency (3,052,087) - - - - Transfers in - - 3,000,000 3,000,000 2,045,888 Transfers out (45,987,888) (38,477,165) (37,249,390) 1,227,775 (33,457,897)
Total other financing sources (uses) (49,039,975) (38,477,165) (34,249,390) 4,227,775 (29,417,009)
Net change in fund balances (9,463,505) (5,998,660) 8,577,909 14,576,569 10,466,117
FUND BALANCE, July 1 27,486,323 48,227,132 48,227,132 - 37,761,015
FUND BALANCE, June 30 $ 18,022,818 $ 42,228,472 $ 56,805,041 $ 14,576,569 $ 48,227,132
FOR THE YEAR ENDED JUNE 30, 2009(WITH COMPARATIVE ACTUAL AMOUNTS FOR THE YEAR ENDED JUNE 30, 2008)
2009 BUDGET 2009
WASHOE COUNTY SCHOOL DISTRICTGENERAL FUND
SCHEDULE OF REVENUES, EXPENDITURESAND CHANGES IN FUND BALANCE - BUDGET AND ACTUAL
68

2008VARIANCE TO
ORIGINAL FINAL ACTUAL FINAL BUDGET ACTUAL REVENUES Local sources
Ad Valorem taxes $ 110,595,495 $ 110,595,495 $ 110,021,656 $ (573,839) $ 105,044,775 School support taxes 150,664,882 126,359,748 120,369,201 (5,990,547) 153,328,703 Franchise taxes 240,000 240,000 364,469 124,469 462,145 Government services tax 14,671,662 14,671,662 13,219,509 (1,452,153) 14,533,686 Revenue in lieu of taxes 200,000 200,000 224,718 24,718 230,473 Tuition - regular day school 422,000 422,000 340,039 (81,961) 408,349 Tuition - summer school 575,000 575,000 698,098 123,098 875,341 Earnings on investments 2,783,115 2,783,115 1,674,868 (1,108,247) 3,593,870 Refunds - - 31,259 31,259 56,783 Indirect costs 1,185,000 1,185,000 1,754,621 569,621 1,684,697 Transportation 350,000 350,000 361,087 11,087 328,403 Reimbursements 1,255,000 1,255,000 1,555,305 300,305 1,538,881 Grant administration 300,000 300,000 283,111 (16,889) 282,750 Other 420,000 420,000 789,319 369,319 684,868
Total local sources 283,662,154 259,357,020 251,687,260 (7,669,760) 283,053,724
State sourcesDistributive school fund 145,479,916 137,642,199 143,080,662 5,438,463 125,171,400 Special appropriations - - 461,017 461,017 331,063
Total state sources 145,479,916 137,642,199 143,541,679 5,899,480 125,502,463
Federal sourcesForest reserve 5,000 5,000 30,837 25,837 6,286 ARRA State Fiscal Stabilization - 21,869,831 21,869,831 - - Impact Aid 160,000 160,000 268,461 108,461 - Revenue in lieu of taxes, P.L. 81-874 - - - - 192,488 E-Rate refund 365,000 365,000 645,517 280,517 321,842
Total federal sources 530,000 22,399,831 22,814,646 414,815 520,616
Other sources 5,000 5,000 245,070 240,070 281,635
Total revenues 429,677,070 419,404,050 418,288,655 (1,115,395) 409,358,438
EXPENDITURES Current
Regular programs Instruction
Salaries 144,393,910 144,592,685 143,633,976 958,709 137,413,969 Benefits 56,829,052 55,547,935 55,064,979 482,956 52,579,175 Purchased services 1,488,054 1,395,774 1,195,739 200,035 1,886,411 Supplies 12,598,658 10,175,861 6,847,832 3,328,029 11,950,268 Property 107,273 145,720 72 145,648 51,678 Other 21,470 18,935 27,502 (8,567) 31,231
Total regular programs 215,438,417 211,876,910 206,770,100 5,106,810 203,912,732
(CONTINUED)
AND CHANGES IN FUND BALANCE - BUDGET AND ACTUAL
2009 BUDGET
WASHOE COUNTY SCHOOL DISTRICT
SCHEDULE OF REVENUES, EXPENDITURES
FOR THE YEAR ENDED JUNE 30, 2009
GENERAL FUND
(WITH COMPARATIVE ACTUAL AMOUNTS FOR THE YEAR ENDED JUNE 30, 2008)
2009
69

2008VARIANCE TO
ORIGINAL FINAL ACTUAL FINAL BUDGET ACTUAL
AND CHANGES IN FUND BALANCE - BUDGET AND ACTUAL
2009 BUDGET
WASHOE COUNTY SCHOOL DISTRICT
SCHEDULE OF REVENUES, EXPENDITURES
FOR THE YEAR ENDED JUNE 30, 2009
GENERAL FUND
(WITH COMPARATIVE ACTUAL AMOUNTS FOR THE YEAR ENDED JUNE 30, 2008)
2009
Vocational programs Instruction
Salaries $ 6,802,729 $ 5,252,569 $ 5,264,681 $ (12,112) $ 4,937,506 Benefits 2,448,946 2,094,017 2,079,674 14,343 1,954,981 Purchased services 60,195 59,895 49,698 10,197 54,830 Supplies 138,493 132,285 106,276 26,009 154,470 Other 450 450 1,135 (685) 1,769
Total vocational programs 9,450,813 7,539,216 7,501,464 37,752 7,103,556
Other instructional programs Summer school
Salaries 1,070,131 734,759 760,248 (25,489) 754,340 Benefits 46,538 46,054 17,613 28,441 23,840 Purchased services 13,500 13,600 5,739 7,861 18,570 Supplies 17,256 262,683 193,951 68,732 18,186 Property - - 6,037 (6,037) -
Total summer school 1,147,425 1,057,096 983,588 73,508 814,936
AthleticsSalaries 2,283,811 2,233,268 2,009,771 223,497 1,782,915 Benefits 216,563 348,066 344,471 3,595 284,916 Purchased services 772,783 992,785 980,955 11,830 880,749 Supplies 73,205 41,961 12,477 29,484 16,746 Other 94,000 94,000 77,228 16,772 59,293
Total athletics 3,440,362 3,710,080 3,424,902 285,178 3,024,619
Total other instructional programs 4,587,787 4,767,176 4,408,490 358,686 3,839,555
Undistributed expenditures Student support
Salaries 17,813,702 18,091,297 17,905,508 185,789 16,870,304 Benefits 6,152,394 7,071,281 7,001,630 69,651 6,601,492 Purchased services 978,934 1,077,436 835,507 241,929 796,163 Supplies 310,565 689,231 432,577 256,654 413,564 Property 1,350 10,450 - 10,450 - Other 7,150 7,150 85 7,065 (1,199)
Total student support 25,264,095 26,946,845 26,175,307 771,538 24,680,324
Instructional staff supportSalaries 7,654,801 7,424,013 7,512,691 (88,678) 8,103,245 Benefits 2,605,258 2,823,580 2,813,542 10,038 2,930,021 Purchased services 711,235 934,837 708,181 226,656 708,658 Supplies 580,966 881,633 567,244 314,389 545,775 Property 24,454 10,112 1,482 8,630 - Other 5,200 1,140 17,265 (16,125) 27,180
Total instructional staff support 11,581,914 12,075,315 11,620,405 454,910 12,314,879
(CONTINUED)70

2008VARIANCE TO
ORIGINAL FINAL ACTUAL FINAL BUDGET ACTUAL
AND CHANGES IN FUND BALANCE - BUDGET AND ACTUAL
2009 BUDGET
WASHOE COUNTY SCHOOL DISTRICT
SCHEDULE OF REVENUES, EXPENDITURES
FOR THE YEAR ENDED JUNE 30, 2009
GENERAL FUND
(WITH COMPARATIVE ACTUAL AMOUNTS FOR THE YEAR ENDED JUNE 30, 2008)
2009
General administrationSalaries $ 2,826,573 $ 2,687,620 $ 2,746,407 $ (58,787) $ 2,506,001 Benefits 1,123,289 1,343,890 1,355,734 (11,844) 1,130,079 Purchased services 5,018,600 4,860,590 4,874,455 (13,865) 5,403,349 Supplies 180,672 505,967 107,033 398,934 112,918 Property 3,000 3,000 15,388 (12,388) 6,128 Other 40,326 40,326 104,745 (64,419) 61,809
Total general administration 9,192,460 9,441,393 9,203,762 237,631 9,220,284
School administrationSalaries 23,189,531 22,753,104 22,531,707 221,397 21,335,937 Benefits 7,033,675 7,985,443 7,898,347 87,096 7,736,558 Purchased services 306,554 305,728 103,968 201,760 188,646 Supplies 152,106 154,688 94,225 60,463 98,594 Property 15,600 15,600 6,000 9,600 12,261 Other 8,400 8,400 11,216 (2,816) 7,414
Total school administration 30,705,866 31,222,963 30,645,463 577,500 29,379,410
Business supportSalaries 3,874,955 3,551,725 3,569,412 (17,687) 3,512,668 Benefits 1,293,055 1,177,881 1,325,683 (147,802) 1,344,405 Purchased services 485,232 310,056 214,475 95,581 408,108 Supplies 141,773 322,038 4,307 317,731 (206,471) Property 5,764 30,764 5,735 25,029 - Other 5,500 7,760 9,904 (2,144) 7,340
Total business support 5,806,279 5,400,224 5,129,516 270,708 5,066,050
Operation and maintenanceSalaries 21,951,817 21,149,533 20,956,567 192,966 19,829,086 Benefits 8,108,583 9,433,276 9,341,684 91,592 8,584,363 Purchased services 6,654,201 6,919,464 6,593,832 325,632 6,257,544 Supplies 14,540,086 14,695,090 12,908,184 1,786,906 12,421,978 Property 183,091 375,091 388,041 (12,950) 188,097 Other 200,708 200,708 116,136 84,572 64,650
Total operation and maintenance 51,638,486 52,773,162 50,304,444 2,468,718 47,345,718
Student transportationSalaries 8,418,135 7,730,039 7,739,945 (9,906) 7,795,845 Benefits 3,150,755 3,569,747 3,601,677 (31,930) 3,452,266 Purchased services 730,431 649,045 558,709 90,336 679,111 Supplies 3,355,601 2,622,806 2,007,467 615,339 2,839,582 Property 625,000 64,623 35,995 28,628 3,207,700 Other 5,000 5,000 1,687 3,313 3,094
Total student transportation 16,284,922 14,641,260 13,945,480 695,780 17,977,598
(CONTINUED)
71

2008VARIANCE TO
ORIGINAL FINAL ACTUAL FINAL BUDGET ACTUAL
AND CHANGES IN FUND BALANCE - BUDGET AND ACTUAL
2009 BUDGET
WASHOE COUNTY SCHOOL DISTRICT
SCHEDULE OF REVENUES, EXPENDITURES
FOR THE YEAR ENDED JUNE 30, 2009
GENERAL FUND
(WITH COMPARATIVE ACTUAL AMOUNTS FOR THE YEAR ENDED JUNE 30, 2008)
2009
Central supportSalaries $ 6,017,613 $ 5,758,101 $ 5,687,940 $ 70,161 $ 4,953,465 Benefits 1,772,598 1,885,584 1,872,870 12,714 1,751,261 Purchased services 1,598,375 1,598,059 1,812,985 (214,926) 1,727,060 Supplies 710,959 950,944 321,168 629,776 182,858 Property 45,176 43,553 56,587 (13,034) 6,661 Other 4,840 4,840 5,375 (535) 13,901
Total central support 10,149,561 10,241,081 9,756,925 484,156 8,635,206
Total undistributed expenditures 160,623,583 162,742,243 156,781,302 5,960,941 154,619,469
Total expenditures 390,100,600 386,925,545 375,461,356 11,464,189 369,475,312
Excess of revenues over expenditures 39,576,470 32,478,505 42,827,299 10,348,794 39,883,126
OTHER FINANCING SOURCES (USES)Capital leases - - - - 1,995,000 Contingency (3,052,087) - - - - Transfers in - - 3,000,000 3,000,000 2,045,888 Transfers out (45,987,888) (38,477,165) (37,249,390) 1,227,775 (33,457,897)
Total other financing sources (uses) (49,039,975) (38,477,165) (34,249,390) 4,227,775 (29,417,009)
Net change in fund balances (9,463,505) (5,998,660) 8,577,909 14,576,569 10,466,117
FUND BALANCE, July 1 27,486,323 48,227,132 48,227,132 - 37,761,015
FUND BALANCE, June 30 $ 18,022,818 $ 42,228,472 $ 56,805,041 $ 14,576,569 $ 48,227,132
72

Special Revenue Funds To account for the proceeds of specific revenue sources (other than for private-purpose trust or major capital projects) that are legally restricted to expenditure for particular purposes. This includes federal, state and local programs. The Special Education Fund is used to account for transactions of the District relating to educational services provided to children with special needs.

2008VARIANCE TO
ORIGINAL FINAL ACTUAL FINAL BUDGET ACTUAL REVENUES
Distributive school account $ 22,908,933 $ 22,908,933 $ 22,892,682 $ (16,251) $ 21,029,346
EXPENDITURES Current
Special programsInstructionSalaries 35,305,141 31,893,563 31,878,753 14,810 29,453,579 Benefits 11,906,236 12,904,574 12,741,853 162,721 10,470,115 Purchased services 60,900 60,900 36,740 24,160 45,902 Supplies 38,442 64,136 85,192 (21,056) 82,111 Property 2,000 2,000 - 2,000 (376) Other 1,813 1,813 1,685 128 1,250
Total special programs 47,314,532 44,926,986 44,744,223 182,763 40,052,581
Undistributed expenditures Student support
Salaries 1,310,510 1,674,045 1,396,384 277,661 862,040 Benefits 224,560 479,668 433,514 46,154 208,324 Purchased services 65,000 65,000 - 65,000 18,242 Supplies 15,000 15,000 - 15,000 44,174
Total student support 1,615,070 2,233,713 1,829,898 403,815 1,132,780
Instructional staff supportSalaries 572,973 645,033 629,638 15,395 609,174 Benefits 173,327 235,473 228,348 7,125 194,128 Purchased services 125,750 125,300 99,727 25,573 90,693 Supplies 10,100 30,100 11,135 18,965 10,790
Total instructional staff support 882,150 1,035,906 968,848 67,058 904,785
School administrationSalaries 232,369 246,757 246,610 147 217,198 Benefits 70,398 76,108 75,499 609 63,716 Purchased services - 375 - 375 -
Total school administration 302,767 323,240 322,109 1,131 280,914
Operation and maintenance Salaries 44,539 44,761 40,489 4,272 38,139 Benefits 16,350 20,354 18,964 1,390 15,574
Total operation and maintenance 60,889 65,115 59,453 5,662 53,713
(CONTINUED)
AND CHANGES IN FUND BALANCE - BUDGET AND ACTUAL
WASHOE COUNTY SCHOOL DISTRICT
SCHEDULE OF REVENUES, EXPENDITURES
FOR THE YEAR ENDED JUNE 30, 2009
SPECIAL EDUCATION - SPECIAL REVENUE FUND
(WITH COMPARATIVE ACTUAL AMOUNTS FOR THE YEAR ENDED JUNE 30, 2008)
2009 BUDGET 2009
73

2008VARIANCE TO
ORIGINAL FINAL ACTUAL FINAL BUDGET ACTUAL
AND CHANGES IN FUND BALANCE - BUDGET AND ACTUAL
WASHOE COUNTY SCHOOL DISTRICT
SCHEDULE OF REVENUES, EXPENDITURES
FOR THE YEAR ENDED JUNE 30, 2009
SPECIAL EDUCATION - SPECIAL REVENUE FUND
(WITH COMPARATIVE ACTUAL AMOUNTS FOR THE YEAR ENDED JUNE 30, 2008)
2009 BUDGET 2009
Student transportationSalaries $ 3,815,250 $ 4,000,010 $ 3,822,705 $ 177,305 $ 3,324,671 Benefits 1,624,331 2,019,296 1,934,376 84,920 1,393,779 Purchased services 358,000 358,000 233,855 124,145 213,441 Supplies 468,040 468,040 579,813 (111,773) 750,691
Total student transportation 6,265,621 6,845,346 6,570,749 274,597 5,682,582
Total undistributed expenditures 9,126,497 10,503,320 9,751,057 752,263 8,054,774
Total expenditures 56,441,029 55,430,306 54,495,280 935,026 48,107,355
Excess (deficiency) of revenues over expenditures (33,532,096) (32,521,373) (31,602,598) 918,775 (27,078,009)
OTHER FINANCING SOURCESTransfers in 33,532,096 32,521,373 31,602,598 (918,775) 27,078,009
Net change in fund balance - - - - -
FUND BALANCE, July 1 - - - - -
FUND BALANCE, June 30 $ - $ - $ - $ - $ -
74

FEDERAL FAMILY SPECIAL VOCATIONAL SPECIAL RESOURCE
TITLE I TITLE V ED EDUCATION GRANTS CENTERS
ASSETSCash and investments $ - $ - $ 24,061 $ - $ 349 $ - Receivables
Interest - - - - - - Grants 997,120 86,466 635,482 164,480 769,722 126,376 Miscellaneous 124 - 1,342 - - -
Total assets $ 997,244 $ 86,466 $ 660,885 $ 164,480 $ 770,071 $ 126,376
LIABILITIESAccounts payable $ 81,815 $ 316 $ 4,922 $ 35,017 $ 90,101 $ 935 Accrued liabilities 363,236 49,078 449,012 38,339 174,419 42,420 Due to other funds 552,193 37,072 - 91,124 234,425 59,190 Due to other governments - - - - 66,155 - Deferred revenues - - 206,951 - 204,971 23,831
Total liabilities 997,244 86,466 660,885 164,480 770,071 126,376
FUND BALANCEUnreserved
Designated for subsequent year's expenditures - - - - - - Designated for retiree health benefits - - - - - - Undesignated - - - - - -
Total fund balance - - - - - -
Total liabilities and fund balance $ 997,244 $ 86,466 $ 660,885 $ 164,480 $ 770,071 $ 126,376
WASHOE COUNTY SCHOOL DISTRICTNONMAJOR SPECIAL REVENUE FUNDS
(Page 1 of 3)JUNE 30, 2009
COMBINING BALANCE SHEET
75

CLASS DRUG SPECIAL INNOVATIONADULT SIZE FREE EARLY STATE & REMEDIAL READING
EDUCATION REDUCTION SCHOOLS CHILDHOOD APPROPRIATIONS EDUCATION IMPROVEMENT
$ 222,710 $ 2,404,641 $ 615 $ 82,704 $ - $ 978,206 $ -
- - - - - - - - - 17,019 25,596 581,218 - 262,093 - - - - - 257 -
$ 222,710 $ 2,404,641 $ 17,634 $ 108,300 $ 581,218 $ 978,463 $ 262,093
$ - $ - $ 3,168 $ 40 $ - $ 6,816 $ 32,961 126,749 2,404,641 8,834 107,064 556,803 957,236 151,188
- - 5,632 - 24,415 - 77,944 - - - - - - -
95,961 - - 1,196 - 14,411 -
222,710 2,404,641 17,634 108,300 581,218 978,463 262,093
- - - - - - -
- - - - - - - - - - - - - -
- - - - - - -
$ 222,710 $ 2,404,641 $ 17,634 $ 108,300 $ 581,218 $ 978,463 $ 262,093
(CONTINUED)
76

TITLE II TITLE III REGIONALPART A ENGLISH PROFESSIONAL
TWENTY-FIRST TEACHER LANGUAGE DEVELOPMENT EDUCATIONCENTURY TRAINING ACQUISITION PROGRAM ALLIANCE
ASSETSCash and investments $ 92,125 $ - $ - $ 308,748 $ 75,844 Receivables
Interest - - - - - Grants 324,762 195,925 122,119 - 110,898 Miscellaneous - - - - -
Total assets $ 416,887 $ 195,925 $ 122,119 $ 308,748 $ 186,742
LIABILITIESAccounts payable $ 61,428 $ 13,588 $ 431 $ 2,298 $ 60,267 Accrued liabilities 62,086 59,874 81,510 222,559 24,328 Due to other funds - 122,463 40,178 - - Due to other governments - - - - - Deferred revenues 293,373 - - 83,891 102,147
Total liabilities 416,887 195,925 122,119 308,748 186,742
FUND BALANCEUnreserved
Designated for subsequent year's expenditures - - - - -
Designated for retiree health benefits - - - - -
Undesignated - - - - -
Total fund balance - - - - -
Total liabilities and fund balance $ 416,887 $ 195,925 $ 122,119 $ 308,748 $ 186,742
WASHOE COUNTY SCHOOL DISTRICTNONMAJOR SPECIAL REVENUE FUNDS
COMBINING BALANCE SHEET
(Page 2 of 3)JUNE 30, 2009
77

GIFTSPRIVATE FULL DAY CATEGORICAL COMMUNITY AND
FOUNDATIONS KINDERGARTEN MEDICAID GRANTS EDUCATION DONATIONS
$ 211,990 $ 587,141 $ 653,591 $ - $ 242,958 $ 841,357
- - - - - - 92,038 - - - - -
- - 192,817 98,982 - 440
$ 304,028 $ 587,141 $ 846,408 $ 98,982 $ 242,958 $ 841,797
$ 55,518 $ - $ 16,294 $ - $ 1,598 $ 16,074 10,903 587,141 27,666 36,698 13,725 14,773
- - - 62,284 - - - - - - - -
237,607 - - - - -
304,028 587,141 43,960 98,982 15,323 30,847
- - 339,000 - 17,143 810,950
- - - - - - - - 463,448 - 210,492 -
- - 802,448 - 227,635 810,950
$ 304,028 $ 587,141 $ 846,408 $ 98,982 $ 242,958 $ 841,797
(CONTINUED)
78

PRE-FUNDEDRETIREEHEALTH
BENEFITS WELLNESS TOTAL
ASSETSCash and investments $ 8,711,972 $ 546,485 $ 15,985,497 Receivables
Interest 3,362 195 3,557 Grants - - 4,511,314 Miscellaneous - - 293,962
Total assets $ 8,715,334 $ 546,680 $ 20,794,330
LIABILITIESAccounts payable $ - $ 5,958 $ 489,545 Accrued liabilities - 7,502 6,577,784 Due to other funds - - 1,306,920 Due to other governments - - 66,155 Deferred revenues - - 1,264,339
Total liabilities - 13,460 9,704,743
FUND BALANCEUnreserved
Designated for subsequent year's expenditures - 311,011 1,478,104 Designated for retiree health benefits 8,715,334 - 8,715,334 Undesignated - 222,209 896,149
Total fund balance 8,715,334 533,220 11,089,587
Total liabilities and fund balance $ 8,715,334 $ 546,680 $ 20,794,330
JUNE 30, 2009COMBINING BALANCE SHEET
(Page 3 of 3)
WASHOE COUNTY SCHOOL DISTRICTNONMAJOR SPECIAL REVENUE FUNDS
79

FEDERALSPECIAL VOCATIONAL SPECIAL
TITLE I TITLE V ED EDUCATION GRANTS
REVENUESLocal sources $ - $ - $ - $ - $ 6,891 State sources - - - - 257,630 Federal sources 10,427,028 690,239 10,269,522 681,724 3,619,329
Total revenues 10,427,028 690,239 10,269,522 681,724 3,883,850
EXPENDITURES Current
Regular programs 7,733,411 587,699 - - 866,760 Special programs - - 6,845,153 - - Adult education programs - - - - - Community service programs - - - - - Undistributed expenditures
Student support 174,033 - 3,279,111 639,724 1,247,940 Instructional staff support 2,318,741 102,540 145,258 42,000 1,566,479 General administration - - - - - School administration - - - - - Operation and maintenance - - - - - Central support - - - - 101,632 Other support 200,843 - - - 101,039 Community service programs - - - - -
Capital outlay - - - - -
Total expenditures 10,427,028 690,239 10,269,522 681,724 3,883,850
Excess (deficiency) of revenues over expenditures - - - - -
OTHER FINANCING (USES)Transfers out - - - - -
Net change in fund balances - - - - -
FUND BALANCE, July 1 - - - - -
FUND BALANCE, June 30 $ - $ - $ - $ - $ -
(Page 1 of 3)
AND CHANGES IN FUND BALANCEFOR THE YEAR ENDED JUNE 30, 2009
WASHOE COUNTY SCHOOL DISTRICTNONMAJOR SPECIAL REVENUE FUNDS
COMBINING STATEMENT OF REVENUES, EXPENDITURES,
80

FAMILY CLASS DRUG SPECIAL INNOVATIONRESOURCE ADULT SIZE FREE EARLY STATE & REMEDIALCENTERS EDUCATION REDUCTION SCHOOLS CHILDHOOD APPROPRIATIONS EDUCATION
$ 61,152 $ - $ - $ - $ - $ - $ - 514,413 2,043,353 21,115,648 - 804,777 3,379,718 8,812,432 363,291 - - 148,400 242,276 - -
938,856 2,043,353 21,115,648 148,400 1,047,053 3,379,718 8,812,432
- - 21,115,648 - 624,664 3,379,718 5,007,566 - - - - 242,275 - - - 1,098,957 - - - - -
938,856 - - - - - -
- 262,766 - - - - - - - - 148,400 180,114 - 3,187,220 - - - - - - 617,646 - 469,890 - - - - - - 211,740 - - - - - - - - - - - - - - - - - - - - - - - - - - - - - - - - -
938,856 2,043,353 21,115,648 148,400 1,047,053 3,379,718 8,812,432
- - - - - - -
- - - - - - -
- - - - - - -
- - - - - - -
$ - $ - $ - $ - $ - $ - $ -
(CONTINUED)
81

TITLE II TITLE III REGIONALPART A ENGLISH PROFESSIONAL
READING TWENTY-FIRST TEACHER LANGUAGE DEVELOPMENTIMPROVEMENT CENTURY TRAINING ACQUISITION PROGRAM
REVENUESLocal sources $ - $ 319,421 $ - $ - $ - State sources - - - - 2,597,472 Federal sources 1,711,625 2,311,498 1,259,840 1,017,048 -
Total revenues 1,711,625 2,630,919 1,259,840 1,017,048 2,597,472
EXPENDITURES Current
Regular programs 1,308,444 1,937,334 - 962,201 - Special programs - - - - - Adult education programs - - - - - Community service programs - - - - - Undistributed expenditures
Student support 403,181 - - - - Instructional staff support - 693,585 1,259,840 54,847 2,597,472 General administration - - - - - School administration - - - - - Operation and maintenance - - - - - Central support - - - - - Other support - - - - - Community service programs - - - - -
Capital outlay - - - - -
Total expenditures 1,711,625 2,630,919 1,259,840 1,017,048 2,597,472
Excess (deficiency) of revenues over expenditures - - - - -
OTHER FINANCING (USES)Transfers out - - - - -
Net change in fund balances - - - - -
FUND BALANCE, July 1 - - - - -
FUND BALANCE, June 30 $ - $ - $ - $ - $ -
FOR THE YEAR ENDED JUNE 30, 2009(Page 2 of 3)
COMBINING STATEMENT OF REVENUES, EXPENDITURES,AND CHANGES IN FUND BALANCE
WASHOE COUNTY SCHOOL DISTRICTNONMAJOR SPECIAL REVENUE FUNDS
82

LEDUCATION PRIVATE FULL DAY CATEGORICAL COMMUNITYALLIANCE FOUNDATIONS KINDERGARTEN MEDICAID GRANTS EDUCATION
$ 422,967 $ 1,076,986 $ - $ - $ 695,807 $ 368,205 - - 4,919,292 - - -
623,848 - - 703,171 - -
1,046,815 1,076,986 4,919,292 703,171 695,807 368,205
345,213 757,862 4,919,292 273,169 669,297 - - - - - - - - - - - - - - - - - - -
676,078 306,466 - 75,090 - - 12,127 10,766 - - 3,168 -
- - - - - - - - - - - 163,438 - - - - 23,342 - - 1,892 - - - -
13,397 - - - - - - - - - - 229,920 - - - - - -
1,046,815 1,076,986 4,919,292 348,259 695,807 393,358
- - - 354,912 - (25,153)
- - - - - -
- - - 354,912 - (25,153)
- - - 447,536 - 252,788
$ - $ - $ - $ 802,448 $ - $ 227,635
(CONTINUED)
83

PRE-FUNDEDGIFTS RETIREEAND HEALTH ADVANCED
DONATIONS BENEFITS CARPENTRY WELLNESS TOTAL
REVENUESLocal sources $ 489,238 $ 170,701 $ - $ 390,408 $ 4,001,776 State sources - - - - 44,444,735 Federal sources - - - - 34,068,839
Total revenues 489,238 170,701 - 390,408 82,515,350
EXPENDITURES Current
Regular programs 551,449 - - - 51,039,727 Special programs - - - - 7,087,428 Adult education programs - - - - 1,098,957 Community service programs - - - - 938,856 Undistributed expenditures
Student support - - - - 7,064,389 Instructional staff support - - - - 12,322,557 General administration - - - 401,915 1,019,561 School administration - - - - 633,328 Operation and maintenance - - - - 235,082 Central support - - - - 103,524 Other support - - - - 315,279 Community service programs - - - - 229,920
Capital outlay 584,941 - - - 584,941
Total expenditures 1,136,390 - - 401,915 82,673,549
Excess (deficiency) of revenues over expenditures (647,152) 170,701 - (11,507) (158,199)
OTHER FINANCING (USES)Transfers out - (3,000,000) (38,860) - (3,038,860)
Net change in fund balances (647,152) (2,829,299) (38,860) (11,507) (3,197,059)
FUND BALANCE, July 1 1,458,102 11,544,633 38,860 544,727 14,286,646 -
FUND BALANCE, June 30 $ 810,950 $ 8,715,334 $ - $ 533,220 $ 11,089,587
FOR THE YEAR ENDED JUNE 30, 2009(Page 3 of 3)
COMBINING STATEMENT OF REVENUES, EXPENDITURES,AND CHANGES IN FUND BALANCE
WASHOE COUNTY SCHOOL DISTRICTNONMAJOR SPECIAL REVENUE FUNDS
84

WASHOE COUNTY SCHOOL DISTRICTTITLE I - SPECIAL REVENUE FUND
SCHEDULE OF REVENUES, EXPENDITURES
FOR THE YEAR ENDED JUNE 30, 2009
2008VARIANCE TO
ORIGINAL FINAL ACTUAL FINAL BUDGET ACTUAL REVENUES Federal sources
Title I $ 10,322,344 $ 11,361,814 $ 10,427,028 $ (934,786) $ 10,599,430
EXPENDITURES Current
Regular programs Instruction
Salaries 3,495,330 3,669,654 3,447,152 222,502 3,306,433 Benefits 1,118,506 1,463,248 1,374,621 88,627 1,130,690 Purchased services 1,804,227 2,120,636 2,044,248 76,388 1,936,948 Supplies 1,068,603 757,987 728,784 29,203 1,148,213 Property 48,419 - - - 47,238 Other 152,395 140,022 138,606 1,416 148,405
Total regular programs 7,687,480 8,151,547 7,733,411 418,136 7,717,927
Undistributed expenditures Student support
Purchased services 79,032 174,033 174,033 - 77,104
Instructional staff supportSalaries 1,014,363 1,553,545 1,235,679 317,866 1,152,450 Benefits 254,307 288,475 244,719 43,756 239,064 Purchased services 480,566 410,577 342,559 68,018 545,516 Supplies 217,007 179,821 123,578 56,243 245,767 Property 8,871 - - - 8,379 Other 348,510 394,956 372,206 22,750 383,777
Total instructional staff support 2,323,624 2,827,374 2,318,741 508,633 2,574,953
Other supportSalaries 96,778 106,267 104,707 1,560 93,493 Benefits 30,969 33,547 31,603 1,944 27,814 Purchased services 63,201 19,050 16,607 2,443 66,071 Supplies 41,003 49,896 47,826 2,070 42,032 Other 257 100 100 - 36
Total other support 232,208 208,860 200,843 8,017 229,446
Total undistributed expenditures 2,634,864 3,210,267 2,693,617 516,650 2,881,503
Total expenditures 10,322,344 11,361,814 10,427,028 934,786 10,599,430
Net change in fund balances - - - - -
FUND BALANCE, July 1 - - - - -
FUND BALANCE, June 30 $ - $ - $ - $ - $ -
AND CHANGES IN FUND BALANCE - BUDGET AND ACTUAL
(WITH COMPARATIVE ACTUAL AMOUNTS FOR THE YEAR ENDED JUNE 30, 2008)
2009 BUDGET 2009
85
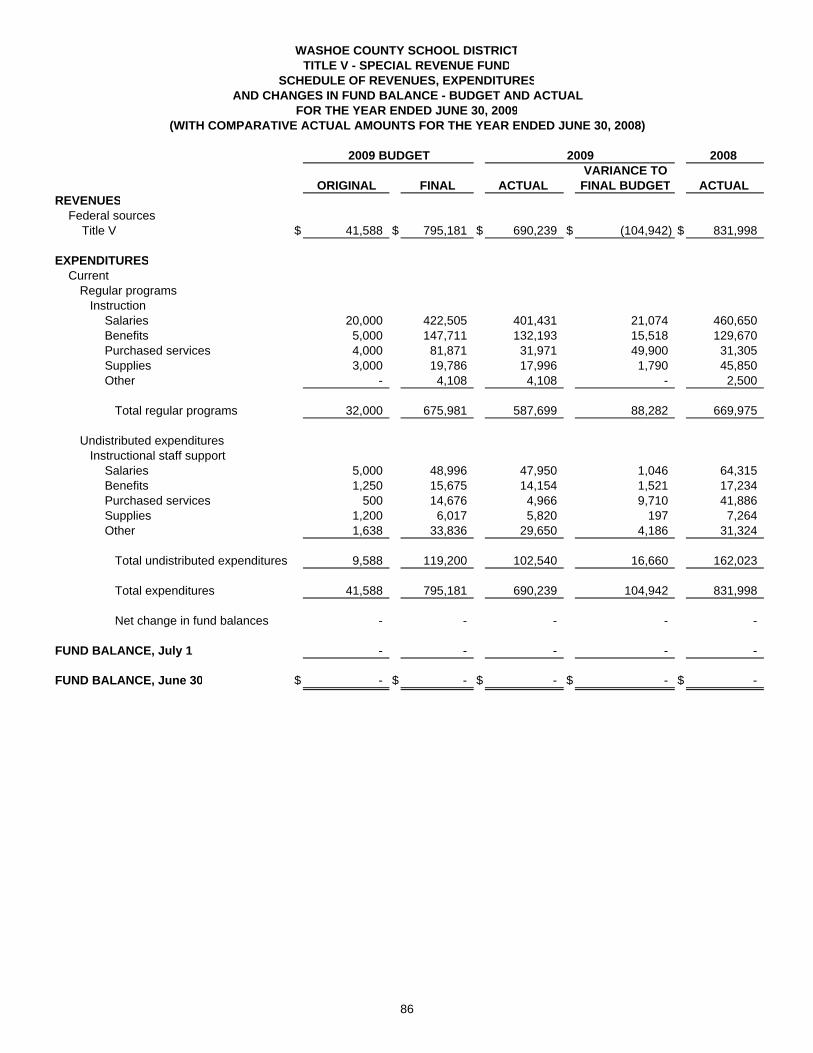
WASHOE COUNTY SCHOOL DISTRICTTITLE V - SPECIAL REVENUE FUND
SCHEDULE OF REVENUES, EXPENDITURES
FOR THE YEAR ENDED JUNE 30, 2009
2008VARIANCE TO
ORIGINAL FINAL ACTUAL FINAL BUDGET ACTUAL REVENUES Federal sources Title V $ 41,588 $ 795,181 $ 690,239 $ (104,942) $ 831,998
EXPENDITURES Current
Regular programs Instruction
Salaries 20,000 422,505 401,431 21,074 460,650 Benefits 5,000 147,711 132,193 15,518 129,670 Purchased services 4,000 81,871 31,971 49,900 31,305 Supplies 3,000 19,786 17,996 1,790 45,850 Other - 4,108 4,108 - 2,500
Total regular programs 32,000 675,981 587,699 88,282 669,975
Undistributed expenditures Instructional staff support
Salaries 5,000 48,996 47,950 1,046 64,315 Benefits 1,250 15,675 14,154 1,521 17,234 Purchased services 500 14,676 4,966 9,710 41,886 Supplies 1,200 6,017 5,820 197 7,264 Other 1,638 33,836 29,650 4,186 31,324
Total undistributed expenditures 9,588 119,200 102,540 16,660 162,023
Total expenditures 41,588 795,181 690,239 104,942 831,998
Net change in fund balances - - - - -
FUND BALANCE, July 1 - - - - -
FUND BALANCE, June 30 $ - $ - $ - $ - $ -
AND CHANGES IN FUND BALANCE - BUDGET AND ACTUAL
(WITH COMPARATIVE ACTUAL AMOUNTS FOR THE YEAR ENDED JUNE 30, 2008)
2009 BUDGET 2009
86

WASHOE COUNTY SCHOOL DISTRICTINDIAN EDUCATION - SPECIAL REVENUE FUND
SCHEDULE OF REVENUES, EXPENDITURES
FOR THE YEAR ENDED JUNE 30, 2009
2008VARIANCE TO
ORIGINAL FINAL ACTUAL FINAL BUDGET ACTUAL REVENUES Federal sources Title VII - Indian education program $ - $ - $ - $ - $ 23,902
EXPENDITURES Current
Regular programs Instruction
Salaries - - - - 3,690 Benefits - - - - 90 Purchased services - - - - 9,868 Supplies - - - - 9,357
Total regular programs - - - - 23,005
Undistributed expenditures Instructional staff support
Other - - - - 897
Total expenditures - - - - 23,902
Net change in fund balances - - - - -
FUND BALANCE, July 1 - - - - -
FUND BALANCE, June 30 $ - $ - $ - $ - $ -
AND CHANGES IN FUND BALANCE - BUDGET AND ACTUAL
(WITH COMPARATIVE ACTUAL AMOUNTS FOR THE YEAR ENDED JUNE 30, 2008)
2009 BUDGET 2009
87

WASHOE COUNTY SCHOOL DISTRICTFEDERAL SPECIAL EDUCATION - SPECIAL REVENUE FUND
SCHEDULE OF REVENUES, EXPENDITURES
FOR THE YEAR ENDED JUNE 30, 2009
2008VARIANCE TO
ORIGINAL FINAL ACTUAL FINAL BUDGET ACTUAL REVENUES Federal sources
Education of the handicapped $ 10,921,713 $ 10,495,259 $ 10,269,522 $ (225,737) $ 9,676,711
EXPENDITURES Current
Special programs Instruction
Salaries 5,508,184 4,978,745 5,031,186 (52,441) 4,905,626 Benefits 1,665,143 1,866,408 1,813,967 52,441 1,579,995
Total special programs 7,173,327 6,845,153 6,845,153 - 6,485,621
Undistributed expenditures Student support
Salaries 1,243,657 1,065,017 1,058,038 6,979 1,148,280 Benefits 338,646 387,051 394,030 (6,979) 359,946 Purchased services 738,474 763,587 603,209 160,378 521,148 Supplies 375,500 240,758 240,185 573 236,428 Property 55,825 9,995 9,995 - 15,281 Other 903,308 1,019,654 973,654 46,000 814,963
Total student support 3,655,410 3,486,062 3,279,111 206,951 3,096,046
Instructional staff supportSalaries 56,403 21,475 6,513 14,962 51,820 Benefits 20,474 1,690 452 1,238 19,386 Purchased services 7,105 136,738 134,816 1,922 14,004 Supplies 5,583 - - - 6,268 Other 3,411 4,141 3,477 664 3,566
Total instructional staff support 92,976 164,044 145,258 18,786 95,044
Total undistributed expenditures 3,748,386 3,650,106 3,424,369 225,737 3,191,090
Total expenditures 10,921,713 10,495,259 10,269,522 225,737 9,676,711
Net change in fund balances - - - - -
FUND BALANCE, July 1 - - - - -
FUND BALANCE, June 30 $ - $ - $ - $ - $ -
AND CHANGES IN FUND BALANCE - BUDGET AND ACTUAL
(WITH COMPARATIVE ACTUAL AMOUNTS FOR THE YEAR ENDED JUNE 30, 2008)
2009 BUDGET 2009
88

WASHOE COUNTY SCHOOL DISTRICTVOCATIONAL EDUCATION - SPECIAL REVENUE FUND
SCHEDULE OF REVENUES, EXPENDITURES
FOR THE YEAR ENDED JUNE 30, 2009
2008VARIANCE TO
ORIGINAL FINAL ACTUAL FINAL BUDGET ACTUAL REVENUES State sources
Vocational education $ 751,216 $ - $ - $ - $ 720,666 Federal sources
Vocational education 675,382 687,700 681,724 (5,976) 728,838
Total revenues 1,426,598 687,700 681,724 (5,976) 1,449,504
EXPENDITURES Current
Undistributed expenditures Student support
Salaries 14,630 176,013 174,728 1,285 10,661 Benefits 416 49,216 48,616 600 195 Purchased services 102,727 196,451 194,200 2,251 102,099 Supplies 555,355 168,999 168,970 29 551,364 Property 13,489 30,543 30,543 - 18,220 Other 48,781 24,478 22,667 1,811 38,128
Total student support 735,398 645,700 639,724 5,976 720,667
Instructional staff supportSalaries 193,971 - - - 184,036 Benefits 22,766 - - - 46,179 Purchased services 186,328 42,000 42,000 - 229,336 Supplies 214,178 - - - 186,240 Property 53,822 - - - 61,634 Other 20,135 - - - 21,412
Total instructional staff support 691,200 42,000 42,000 - 728,837
Total expenditures 1,426,598 687,700 681,724 5,976 1,449,504
Net change in fund balances - - - - -
FUND BALANCE, July 1 - - - - -
FUND BALANCE, June 30 $ - $ - $ - $ - $ -
AND CHANGES IN FUND BALANCE - BUDGET AND ACTUAL
(WITH COMPARATIVE ACTUAL AMOUNTS FOR THE YEAR ENDED JUNE 30, 2008)
2009 BUDGET 2009
89

WASHOE COUNTY SCHOOL DISTRICTSPECIAL GRANTS - SPECIAL REVENUE FUNDSCHEDULE OF REVENUES, EXPENDITURES
FOR THE YEAR ENDED JUNE 30, 2009
2008VARIANCE TO
ORIGINAL FINAL ACTUAL FINAL BUDGET ACTUAL REVENUES Local sources $ 5,325 $ 7,257 $ 6,891 $ (366) $ 52,221 State sources 371,274 250,747 257,630 6,883 322,450 Federal sources 4,335,229 4,439,017 3,619,329 (819,688) 4,239,448
Total revenues 4,711,828 4,697,021 3,883,850 (813,171) 4,614,119
EXPENDITURES Current
Regular programs Instruction
Salaries 801,276 475,296 401,257 74,039 760,585 Benefits 214,962 128,183 110,548 17,635 182,218 Purchased services 311,659 78,040 67,610 10,430 301,698 Supplies 338,064 357,540 211,090 146,450 340,988 Property - - - - 14,657 Other 268,243 77,731 76,255 1,476 245,996
Total regular programs 1,934,204 1,116,790 866,760 250,030 1,846,142
Undistributed expenditures Student support
Salaries 391,041 601,945 539,374 62,571 422,199 Benefits 107,785 206,909 183,973 22,936 102,971 Purchased services 236,335 289,633 278,412 11,221 238,358 Supplies 126,934 190,345 189,390 955 147,253 Property 33,289 9,000 8,993 7 32,477 Other 341,144 51,285 47,798 3,487 400,214 -
Total student support 1,236,528 1,349,117 1,247,940 101,177 1,343,472
Instructional staff supportSalaries 479,900 768,976 695,251 73,725 490,649 Benefits 130,625 196,736 184,302 12,434 113,096 Purchased services 544,109 371,858 322,200 49,658 413,017 Supplies 247,715 323,796 313,418 10,378 305,347 Other 71,428 56,545 51,308 5,237 51,202
Total instructional staff support 1,473,777 1,717,911 1,566,479 151,432 1,373,311
Central supportSalaries - - - - 4,396 Benefits - - - - 57 Purchased services - 340,727 90,601 250,126 45,704 Other - 21,288 11,031 10,257 1,037
Total central support - 362,015 101,632 260,383 51,194
Other supportSalaries 4,260 61,350 34,279 27,071 - Benefits 62 29,011 20,220 8,791 - Purchased services 57,400 8,001 3,597 4,404 - Supplies 3,075 39,876 29,993 9,883 - Property - 12,950 12,950 - - Other 2,522 - - - -
Total other support 67,319 151,188 101,039 50,149 -
Total undistributed expenditures 2,777,624 3,580,231 3,017,090 563,141 2,767,977
Total expenditures 4,711,828 4,697,021 3,883,850 813,171 4,614,119
Net change in fund balances - - - - -
FUND BALANCE, July 1 - - - - -
FUND BALANCE, June 30 $ - $ - $ - $ - $ -
AND CHANGES IN FUND BALANCE - BUDGET AND ACTUAL
(WITH COMPARATIVE ACTUAL AMOUNTS FOR THE YEAR ENDED JUNE 30, 2008)
2009 BUDGET 2009
90

WASHOE COUNTY SCHOOL DISTRICTFAMILY RESOURCE CENTERS - SPECIAL REVENUE FUND
SCHEDULE OF REVENUES, EXPENDITURES
FOR THE YEAR ENDED JUNE 30, 2009
2008VARIANCE TO
ORIGINAL FINAL ACTUAL FINAL BUDGET ACTUAL REVENUES
Local sources $ 95,850 $ 63,697 $ 61,152 $ (2,545) $ 58,070 State sources 415,276 433,888 514,413 80,525 435,197 Federal sources 452,775 468,602 363,291 (105,311) 447,556
Total revenues 963,901 966,187 938,856 (27,331) 940,823
EXPENDITURES Current
Community service programsSalaries 536,385 581,800 580,629 1,171 565,560 Benefits 183,187 192,271 191,709 562 167,899 Purchased services 120,139 92,617 92,311 306 99,702 Supplies 32,971 17,900 17,900 - 33,551 Property 13,068 - - - 12,779 Other 78,151 81,599 56,307 25,292 61,332
Total expenditures 963,901 966,187 938,856 27,331 940,823
Net change in fund balances - - - - -
FUND BALANCE, July 1 - - - - -
FUND BALANCE, June 30 $ - $ - $ - $ - $ -
AND CHANGES IN FUND BALANCE - BUDGET AND ACTUAL
(WITH COMPARATIVE ACTUAL AMOUNTS FOR THE YEAR ENDED JUNE 30, 2008)
2009 BUDGET 2009
91

WASHOE COUNTY SCHOOL DISTRICTADULT EDUCATION - SPECIAL REVENUE FUND
SCHEDULE OF REVENUES, EXPENDITURES
FOR THE YEAR ENDED JUNE 30, 2009
2008VARIANCE TO
ORIGINAL FINAL ACTUAL FINAL BUDGET ACTUAL REVENUES State sources
High school diploma program $ 2,149,347 $ 2,129,554 $ 2,043,353 $ (86,201) $ 1,976,734
EXPENDITURES Current
Adult education programs Instruction
Salaries 800,845 770,091 797,570 (27,479) 878,782 Benefits 137,835 157,570 135,535 22,035 140,784 Purchased services 56,915 23,400 14,494 8,906 40,716 Supplies 162,897 174,693 151,358 23,335 107,778
Total adult education programs 1,158,492 1,125,754 1,098,957 26,797 1,168,060
Undistributed expenditures Student support
Salaries 223,050 204,177 197,852 6,325 209,529 Benefits 66,537 77,108 64,914 12,194 63,029
Total student support 289,587 281,285 262,766 18,519 272,558
School administrationSalaries 272,163 304,603 285,988 18,615 212,092 Benefits 88,387 112,805 103,424 9,381 70,045 Purchased services - 200 - 200 76,141 Other 69,457 87,735 80,478 7,257 -
Total school administration 430,007 505,343 469,890 35,453 358,278
Operation and maintenance Salaries 51,222 59,327 55,184 4,143 53,490 Benefits 19,561 24,288 23,185 1,103 19,376 Purchased services 200,478 133,557 133,371 186 104,972
Total operation and maintenance 271,261 217,172 211,740 5,432 177,838
Total undistributed expenditures 990,855 1,003,800 944,396 59,404 808,674
Total expenditures 2,149,347 2,129,554 2,043,353 86,201 1,976,734
Net change in fund balances - - - - -
FUND BALANCE, July 1 - - - - -
FUND BALANCE, June 30 $ - $ - $ - $ - $ -
AND CHANGES IN FUND BALANCE - BUDGET AND ACTUAL
(WITH COMPARATIVE ACTUAL AMOUNTS FOR THE YEAR ENDED JUNE 30, 2008)
2009 BUDGET 2009
92

2008VARIANCE TO
ORIGINAL FINAL ACTUAL FINAL BUDGET ACTUAL REVENUES State sources
Special appropriations $ 20,995,813 $ 21,115,648 $ 21,115,648 $ - $ 19,847,843
EXPENDITURES Current
Regular programs Instruction
Salaries 15,660,664 15,277,888 15,469,369 (191,481) 14,671,005 Benefits 5,335,149 5,837,760 5,646,279 191,481 5,176,838
Total expenditures 20,995,813 21,115,648 21,115,648 - 19,847,843
Net change in fund balances - - - - -
FUND BALANCE, July 1 - - - - -
FUND BALANCE, June 30 $ - $ - $ - $ - $ -
WASHOE COUNTY SCHOOL DISTRICTCLASS SIZE REDUCTION - SPECIAL REVENUE FUND
SCHEDULE OF REVENUES, EXPENDITURES
FOR THE YEAR ENDED JUNE 30, 2009AND CHANGES IN FUND BALANCE - BUDGET AND ACTUAL
(WITH COMPARATIVE ACTUAL AMOUNTS FOR THE YEAR ENDED JUNE 30, 2008)
2009 BUDGET 2009
93

WASHOE COUNTY SCHOOL DISTRICTDRUG FREE SCHOOLS - SPECIAL REVENUE FUND
SCHEDULE OF REVENUES, EXPENDITURES
FOR THE YEAR ENDED JUNE 30, 2009
2008VARIANCE TO
ORIGINAL FINAL ACTUAL FINAL BUDGET ACTUAL REVENUES Federal sources
Safe and drug free schools act $ 140,478 $ 165,861 $ 148,400 $ (17,461) $ 168,371
EXPENDITURES Current
Undistributed expenditures Instructional staff support
Salaries 57,621 72,545 70,727 1,818 68,629 Benefits 17,235 26,667 24,536 2,131 21,126 Purchased services 38,297 49,897 39,987 9,910 53,601 Supplies 24,775 13,500 10,240 3,260 21,714 Other 2,550 3,252 2,910 342 3,301
Total undistributed expenditures 140,478 165,861 148,400 17,461 168,371
Net change in fund balances - - - - -
FUND BALANCE, July 1 - - - - -
FUND BALANCE, June 30 $ - $ - $ - $ - $ -
AND CHANGES IN FUND BALANCE - BUDGET AND ACTUAL
(WITH COMPARATIVE ACTUAL AMOUNTS FOR THE YEAR ENDED JUNE 30, 2008)
2009 BUDGET 2009
94

WASHOE COUNTY SCHOOL DISTRICTEARLY CHILDHOOD - SPECIAL REVENUE FUND
SCHEDULE OF REVENUES, EXPENDITURES
FOR THE YEAR ENDED JUNE 30, 2009
2008VARIANCE TO
ORIGINAL FINAL ACTUAL FINAL BUDGET ACTUAL REVENUES State sources $ 730,979 $ 805,973 $ 804,777 $ (1,196) $ 740,651 Federal sources 210,737 254,244 242,276 (11,968) 215,380
Total revenues 941,716 1,060,217 1,047,053 (13,164) 956,031
EXPENDITURES Current
Regular programs Instruction
Salaries 443,733 431,280 432,884 (1,604) 415,347 Benefits 171,971 182,550 180,946 1,604 156,499 Purchased services - 7,150 6,051 1,099 - Supplies - 4,833 4,783 50 -
Total regular programs 615,704 625,813 624,664 1,149 571,846
Special programs Instruction
Salaries 122,475 152,662 151,289 1,373 131,196 Benefits 25,271 36,107 33,459 2,648 26,839
Total instruction 147,746 188,769 184,748 4,021 158,035
Instructional staff supportSalaries 35,132 33,737 28,130 5,607 32,686 Benefits 10,437 10,919 9,049 1,870 9,725 Purchased services 3,075 - - - 1,158 Supplies 6,082 10,806 10,806 - 5,691 Other 7,613 10,013 9,542 471 8,085
Total instructional staff support 62,339 65,475 57,527 7,948 57,345
Total special programs 210,085 254,244 242,275 11,969 215,380
Undistributed expenditures Instructional staff support
Salaries 7,085 7,524 7,524 - 6,652 Purchased services 28,534 89,670 89,670 - 84,290 Other 80,308 82,966 82,920 46 77,863
Total undistributed expenditures 115,927 180,160 180,114 46 168,805
Total expenditures 941,716 1,060,217 1,047,053 13,164 956,031
Net change in fund balances - - - - -
FUND BALANCE, July 1 - - - - -
FUND BALANCE, June 30 $ - $ - $ - $ - $ -
AND CHANGES IN FUND BALANCE - BUDGET AND ACTUAL
(WITH COMPARATIVE ACTUAL AMOUNTS FOR THE YEAR ENDED JUNE 30, 2008)
2009 BUDGET 2009
95

WASHOE COUNTY SCHOOL DISTRICTSPECIAL STATE APPROPRIATIONS - SPECIAL REVENUE FUND
SCHEDULE OF REVENUES, EXPENDITURES
FOR THE YEAR ENDED JUNE 30, 2009
2008VARIANCE TO
ORIGINAL FINAL ACTUAL FINAL BUDGET ACTUAL REVENUES State sources
Special appropriation $ 4,514,535 $ 3,379,718 $ 3,379,718 $ - $ 4,155,664
EXPENDITURES Current
Regular programs Instruction
Salaries 621,960 2,789,868 2,789,868 - 574,556 Benefits 3,892,575 589,850 589,850 - 3,151,829
Total regular programs 4,514,535 3,379,718 3,379,718 - 3,726,385
Capital outlayBuilding acquisition and construction
Purchased services - - - - 400,064 Property - - - - 29,215
Total capital outlay - - - - 429,279
Total expenditures 4,514,535 3,379,718 3,379,718 - 4,155,664
Net change in fund balances - - - - -
FUND BALANCE, July 1 - - - - -
FUND BALANCE, June 30 $ - $ - $ - $ - $ -
AND CHANGES IN FUND BALANCE - BUDGET AND ACTUAL
(WITH COMPARATIVE ACTUAL AMOUNTS FOR THE YEAR ENDED JUNE 30, 2008)
2009 BUDGET 2009
96

WASHOE COUNTY SCHOOL DISTRICTINNOVATION AND REMEDIAL EDUCATION - SPECIAL REVENUE FUND
SCHEDULE OF REVENUES, EXPENDITURES
FOR THE YEAR ENDED JUNE 30, 2009
2008VARIANCE TO
ORIGINAL FINAL ACTUAL FINAL BUDGET ACTUAL REVENUES State sources
Legislative appropriation $ 9,601,035 $ 8,826,604 $ 8,812,432 $ (14,172) $ 4,539,455
EXPENDITURES Current
Regular programs Instruction
Salaries 4,861,186 2,876,050 2,992,733 (116,683) 1,939,633 Benefits 1,363,642 1,123,045 1,003,217 119,828 505,434 Purchased services 52,245 626,958 626,958 - 23,856 Supplies 546,200 288,664 288,664 - 377,165 Other 302,129 95,994 95,994 - 154,738
Total regular programs 7,125,402 5,010,711 5,007,566 3,145 3,000,826
Undistributed expenditures Instructional staff support
Salaries 1,211,718 2,064,082 2,176,336 (112,254) 829,133 Benefits 330,313 841,857 718,576 123,281 251,533 Purchased services 190,671 118,628 118,628 - 106,957 Supplies 34,681 52,326 52,326 - 18,035 Other 205,912 121,354 121,354 - 112,890
Total instructional staff support 1,973,295 3,198,247 3,187,220 11,027 1,318,548
General administrationSalaries 217,171 229,395 226,746 2,649 131,518 Benefits 60,309 112,390 115,039 (2,649) 38,932 Purchased services 160,714 258,794 258,794 - 23,217 Other 64,144 17,067 17,067 - 26,414
Total general administration 502,338 617,646 617,646 - 220,081
Total undistributed expenditures 2,475,633 3,815,893 3,804,866 11,027 1,538,629
Total expenditures 9,601,035 8,826,604 8,812,432 14,172 4,539,455
Net change in fund balances - - - - -
FUND BALANCE, July 1 - - - - -
FUND BALANCE, June 30 $ - $ - $ - $ - $ -
AND CHANGES IN FUND BALANCE - BUDGET AND ACTUAL
(WITH COMPARATIVE ACTUAL AMOUNTS FOR THE YEAR ENDED JUNE 30, 2008)
2009 BUDGET 2009
97

WASHOE COUNTY SCHOOL DISTRICTREADING IMPROVEMENT - SPECIAL REVENUE FUND
SCHEDULE OF REVENUES, EXPENDITURES
FOR THE YEAR ENDED JUNE 30, 2009
2008VARIANCE TO
ORIGINAL FINAL ACTUAL FINAL BUDGET ACTUAL REVENUES Federal sources
Reading grants $ 883,381 $ 1,880,851 $ 1,711,625 $ (169,226) $ 1,147,392
EXPENDITURES Current
Regular programs Instruction
Salaries 415,390 535,593 452,751 82,842 553,727 Benefits 136,191 170,100 150,790 19,310 178,365 Purchased services 6,687 85,828 64,129 21,699 5,171 Supplies 14,024 647,569 640,774 6,795 17,709 Other 3,840 - - - 5,120
Total regular programs 576,132 1,439,090 1,308,444 130,646 760,092
Undistributed expenditures Student support
Salaries 81,038 39,775 36,582 3,193 98,703 Benefits 26,837 3,131 1,608 1,523 31,973 Purchased services 31,830 119,744 98,167 21,577 29,462 Supplies 3,990 37,891 31,266 6,625 5,510 Other 153,592 241,220 235,558 5,662 208,434
Total student support 297,287 441,761 403,181 38,580 374,082
Instructional staff supportSalaries 9,000 - - - 12,180 Benefits 131 - - - 172 Supplies 525 - - - 386 Other 306 - - - 480
Total instructional staff support 9,962 - - - 13,218
Total undistributed expenditures 307,249 441,761 403,181 38,580 387,300
Total expenditures 883,381 1,880,851 1,711,625 169,226 1,147,392
Net change in fund balances - - - - -
FUND BALANCE, July 1 - - - - -
FUND BALANCE, June 30 $ - $ - $ - $ - $ -
AND CHANGES IN FUND BALANCE - BUDGET AND ACTUAL
(WITH COMPARATIVE ACTUAL AMOUNTS FOR THE YEAR ENDED JUNE 30, 2008)
2009 BUDGET 2009
98

WASHOE COUNTY SCHOOL DISTRICTTWENTY-FIRST CENTURY - SPECIAL REVENUE FUND
SCHEDULE OF REVENUES, EXPENDITURESAND CHANGES IN FUND BALANCE - BUDGET AND ACTUAL
FOR THE YEAR ENDED JUNE 30, 2009
2008VARIANCE TO
ORIGINAL FINAL ACTUAL FINAL BUDGET ACTUAL REVENUES Local sources
Contributions $ 161,023 $ 367,018 $ 319,421 $ (47,597) $ 241,026 Federal sources
21st Century 2,168,395 3,170,226 2,311,498 (858,728) 2,057,568
Total revenues 2,329,418 3,537,244 2,630,919 (906,325) 2,298,594
EXPENDITURES Current
Regular programs Instruction
Salaries 1,079,479 1,455,821 1,216,771 239,050 1,145,778 Benefits 172,717 315,893 231,848 84,045 199,366 Purchased services 406,776 479,865 366,318 113,547 287,977 Supplies 124,880 211,580 117,265 94,315 113,667 Other 28,600 10,030 5,132 4,898 18,262
Total regular programs 1,812,452 2,473,189 1,937,334 535,855 1,765,050
Undistributed expenditures Instructional staff support
Salaries 236,064 488,627 429,139 59,488 294,825 Benefits 51,934 136,221 103,204 33,017 63,183 Purchased services 78,033 104,451 49,573 54,878 81,764 Supplies 66,187 219,054 21,417 197,637 21,741 Other 84,748 115,702 90,252 25,450 72,031
Total undistributed expenditures 516,966 1,064,055 693,585 370,470 533,544
Total expenditures 2,329,418 3,537,244 2,630,919 906,325 2,298,594
Net change in fund balances - - - - -
FUND BALANCE, July 1 - - - - -
FUND BALANCE, June 30 $ - $ - $ - $ - $ -
(WITH COMPARATIVE ACTUAL AMOUNTS FOR THE YEAR ENDED JUNE 30, 2008)
2009 BUDGET 2009
99

WASHOE COUNTY SCHOOL DISTRICTTITLE II, PART A, TEACHER TRAINING - SPECIAL REVENUE FUND
SCHEDULE OF REVENUES, EXPENDITURES
FOR THE YEAR ENDED JUNE 30, 2009
2008VARIANCE TO
ORIGINAL FINAL ACTUAL FINAL BUDGET ACTUAL REVENUES Federal sources
Title II, Part A $ 2,025,896 $ 1,470,161 $ 1,259,840 $ (210,321) $ 1,648,999
EXPENDITURES Current
Undistributed expenditures Instructional staff support
Salaries 1,097,985 636,871 529,439 107,432 792,315 Benefits 274,497 138,407 123,499 14,908 215,353 Purchased services 484,958 519,637 470,800 48,837 467,369 Supplies 109,739 113,844 85,381 28,463 108,928 Other 58,717 61,402 50,721 10,681 65,034
Total expenditures 2,025,896 1,470,161 1,259,840 210,321 1,648,999
Net change in fund balances - - - - -
FUND BALANCE, July 1 - - - - -
FUND BALANCE, June 30 $ - $ - $ - $ - $ -
AND CHANGES IN FUND BALANCE - BUDGET AND ACTUAL
(WITH COMPARATIVE ACTUAL AMOUNTS FOR THE YEAR ENDED JUNE 30, 2008)
2009 BUDGET 2009
100

WASHOE COUNTY SCHOOL DISTRICTTITLE III, ENGLISH LANGUAGE ACQUISITION - SPECIAL REVENUE FUND
SCHEDULE OF REVENUES, EXPENDITURES
FOR THE YEAR ENDED JUNE 30, 2009
2008VARIANCE TO
ORIGINAL FINAL ACTUAL FINAL BUDGET ACTUAL REVENUES Federal sources
Title III - English language acquisition $ 873,406 $ 1,060,468 $ 1,017,048 $ (43,420) $ 854,467
EXPENDITURES Current
Regular programs Instruction
Salaries 537,825 567,712 534,392 33,320 519,809 Benefits 177,483 236,831 235,771 1,060 189,457 Purchased services 46,437 97,388 95,664 1,724 45,299 Supplies 57,539 97,826 96,374 1,452 56,134
Total regular programs 819,284 999,757 962,201 37,556 810,699
Undistributed expenditures Instructional staff support
Purchased services 31,478 33,918 31,731 2,187 26,528 Supplies 5,125 6,000 4,173 1,827 1,074 Other 17,519 20,793 18,943 1,850 16,166
Total undistributed expenditures 54,122 60,711 54,847 5,864 43,768
Total expenditures 873,406 1,060,468 1,017,048 43,420 854,467
Net change in fund balances - - - - -
FUND BALANCE, July 1 - - - - -
FUND BALANCE, June 30 $ - $ - $ - $ - $ -
AND CHANGES IN FUND BALANCE - BUDGET AND ACTUAL
(WITH COMPARATIVE ACTUAL AMOUNTS FOR THE YEAR ENDED JUNE 30, 2008)
2009 BUDGET 2009
101

WASHOE COUNTY SCHOOL DISTRICTREGIONAL PROFESSIONAL DEVELOPMENT PROGRAM - SPECIAL REVENUE FUND
SCHEDULE OF REVENUES, EXPENDITURES
FOR THE YEAR ENDED JUNE 30, 2009
2008VARIANCE TO
ORIGINAL FINAL ACTUAL FINAL BUDGET ACTUAL REVENUES State sources
Legislative appropriation $ 2,603,568 $ 2,681,364 $ 2,597,472 $ (83,892) $ 2,322,470
EXPENDITURES Current
Undistributed expenditures Instructional staff support
Salaries 1,547,056 1,447,654 1,443,695 3,959 1,430,805 Benefits 440,113 425,441 429,400 (3,959) 391,227 Purchased services 372,663 487,477 445,141 42,336 283,914 Supplies 146,284 216,276 178,958 37,318 128,942 Property - 6,800 6,792 8 - Other 97,452 97,716 93,486 4,230 87,582
Total expenditures 2,603,568 2,681,364 2,597,472 83,892 2,322,470
Net change in fund balances - - - - -
FUND BALANCE, July 1 - - - - -
FUND BALANCE, June 30 $ - $ - $ - $ - $ -
AND CHANGES IN FUND BALANCE - BUDGET AND ACTUAL
(WITH COMPARATIVE ACTUAL AMOUNTS FOR THE YEAR ENDED JUNE 30, 2008)
2009 BUDGET 2009
102

WASHOE COUNTY SCHOOL DISTRICTEDUCATION ALLIANCE - SPECIAL REVENUE FUND
SCHEDULE OF REVENUES, EXPENDITURES
FOR THE YEAR ENDED JUNE 30, 2009
2008VARIANCE TO
ORIGINAL FINAL ACTUAL FINAL BUDGET ACTUAL REVENUES Local sources $ 280,403 $ 524,615 $ 422,967 $ (101,648) $ 512,969 Federal sources 615,890 742,163 623,848 (118,315) 748,969
Total revenues 896,293 1,266,778 1,046,815 (219,963) 1,261,938
EXPENDITURES Current
Regular programs Instruction
Salaries - 14,157 108 14,049 - Benefits - 10 10 - - Purchased services - 179,214 138,588 40,626 223,455 Supplies - 216,875 4,914 211,961 42,594 Other - 36,000 201,593 (165,593) 146,060
Total regular programs - 446,256 345,213 101,043 412,109
Undistributed expenditures Student support
Salaries 410,385 325,562 288,293 37,269 340,045 Benefits 135,427 121,448 109,934 11,514 110,224 Purchased services 255,403 238,424 179,039 59,385 217,711 Supplies 44,957 23,558 22,444 1,114 62,042 Other 33,179 85,403 76,368 9,035 106,736
Total student support 879,351 794,395 676,078 118,317 836,758
Instructional staff supportPurchased services 3,477 - - - 1,392 Supplies 1,999 - - - 1,451 Other 957 12,127 12,127 - 834
Total instructional staff support 6,433 12,127 12,127 - 3,677
Other supportSalaries 2,130 2,362 2,362 - 1,495 Benefits 179 193 193 - 123 Purchased services 8,200 8,070 7,467 603 7,776 Supplies - 3,375 3,375 - -
Total other support 10,509 14,000 13,397 603 9,394
Total undistributed expenditures 896,293 820,522 701,602 118,920 849,829
Total expenditures 896,293 1,266,778 1,046,815 219,963 1,261,938
Net change in fund balances - - - - -
FUND BALANCE, July 1 - - - - -
FUND BALANCE, June 30 $ - $ - $ - $ - $ -
AND CHANGES IN FUND BALANCE - BUDGET AND ACTUAL
(WITH COMPARATIVE ACTUAL AMOUNTS FOR THE YEAR ENDED JUNE 30, 2008)
2009 BUDGET 2009
103
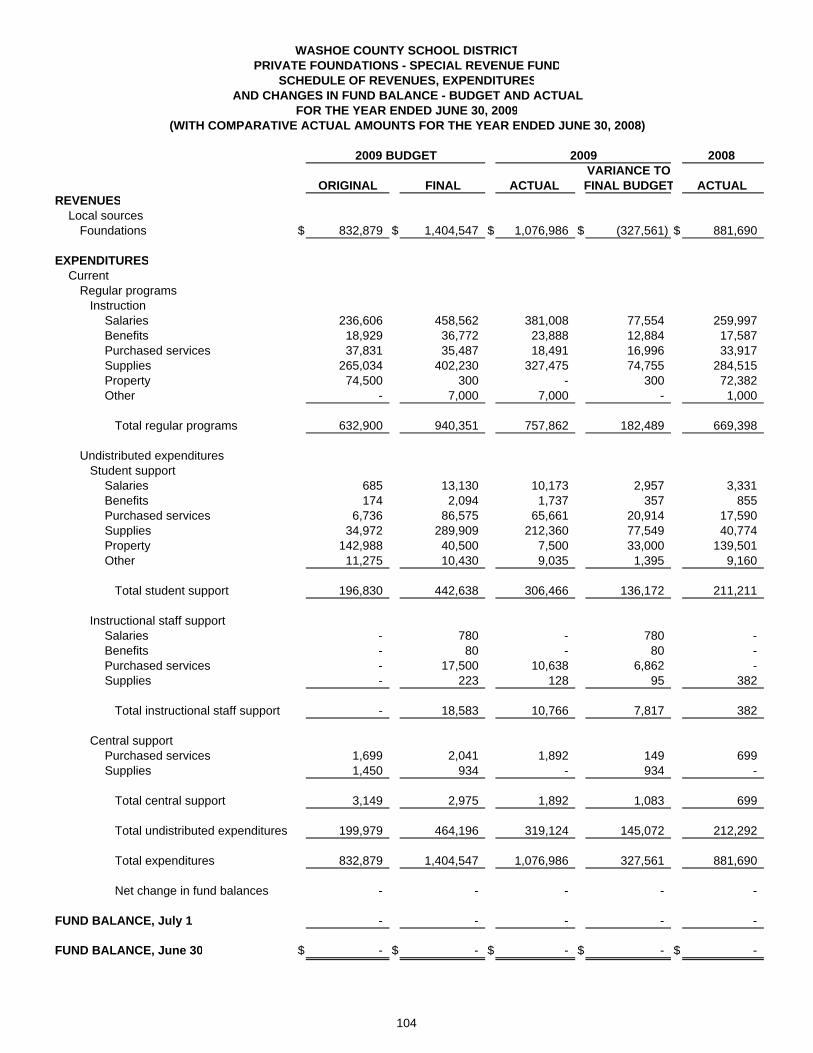
WASHOE COUNTY SCHOOL DISTRICTPRIVATE FOUNDATIONS - SPECIAL REVENUE FUND
SCHEDULE OF REVENUES, EXPENDITURES
FOR THE YEAR ENDED JUNE 30, 2009
2008VARIANCE TO
ORIGINAL FINAL ACTUAL FINAL BUDGET ACTUAL REVENUES Local sources
Foundations $ 832,879 $ 1,404,547 $ 1,076,986 $ (327,561) $ 881,690
EXPENDITURES Current
Regular programs Instruction
Salaries 236,606 458,562 381,008 77,554 259,997 Benefits 18,929 36,772 23,888 12,884 17,587 Purchased services 37,831 35,487 18,491 16,996 33,917 Supplies 265,034 402,230 327,475 74,755 284,515 Property 74,500 300 - 300 72,382 Other - 7,000 7,000 - 1,000
Total regular programs 632,900 940,351 757,862 182,489 669,398
Undistributed expenditures Student support
Salaries 685 13,130 10,173 2,957 3,331 Benefits 174 2,094 1,737 357 855 Purchased services 6,736 86,575 65,661 20,914 17,590 Supplies 34,972 289,909 212,360 77,549 40,774 Property 142,988 40,500 7,500 33,000 139,501 Other 11,275 10,430 9,035 1,395 9,160
Total student support 196,830 442,638 306,466 136,172 211,211
Instructional staff supportSalaries - 780 - 780 - Benefits - 80 - 80 - Purchased services - 17,500 10,638 6,862 - Supplies - 223 128 95 382
Total instructional staff support - 18,583 10,766 7,817 382
Central supportPurchased services 1,699 2,041 1,892 149 699 Supplies 1,450 934 - 934 -
Total central support 3,149 2,975 1,892 1,083 699
Total undistributed expenditures 199,979 464,196 319,124 145,072 212,292
Total expenditures 832,879 1,404,547 1,076,986 327,561 881,690
Net change in fund balances - - - - -
FUND BALANCE, July 1 - - - - -
FUND BALANCE, June 30 $ - $ - $ - $ - $ -
AND CHANGES IN FUND BALANCE - BUDGET AND ACTUAL
(WITH COMPARATIVE ACTUAL AMOUNTS FOR THE YEAR ENDED JUNE 30, 2008)
2009 BUDGET 2009
104

WASHOE COUNTY SCHOOL DISTRICTFULL DAY KINDERGARTEN - SPECIAL REVENUE FUND
SCHEDULE OF REVENUES, EXPENDITURES
FOR THE YEAR ENDED JUNE 30, 2009
2008VARIANCE TO
ORIGINAL FINAL ACTUAL FINAL BUDGET ACTUAL REVENUES State sources
Legislative appropriation $ 4,919,368 $ 4,919,292 $ 4,919,292 $ - $ 4,637,052
EXPENDITURES Current
Regular programs Instruction
Salaries 3,605,530 3,586,095 3,500,083 86,012 3,340,828 Benefits 1,313,838 1,333,197 1,419,209 (86,012) 1,296,224
Total expenditures 4,919,368 4,919,292 4,919,292 - 4,637,052
Net change in fund balances - - - - -
FUND BALANCE, July 1 - - - - -
FUND BALANCE, June 30 $ - $ - $ - $ - $ -
AND CHANGES IN FUND BALANCE - BUDGET AND ACTUAL
(WITH COMPARATIVE ACTUAL AMOUNTS FOR THE YEAR ENDED JUNE 30, 2008)
2009 BUDGET 2009
105
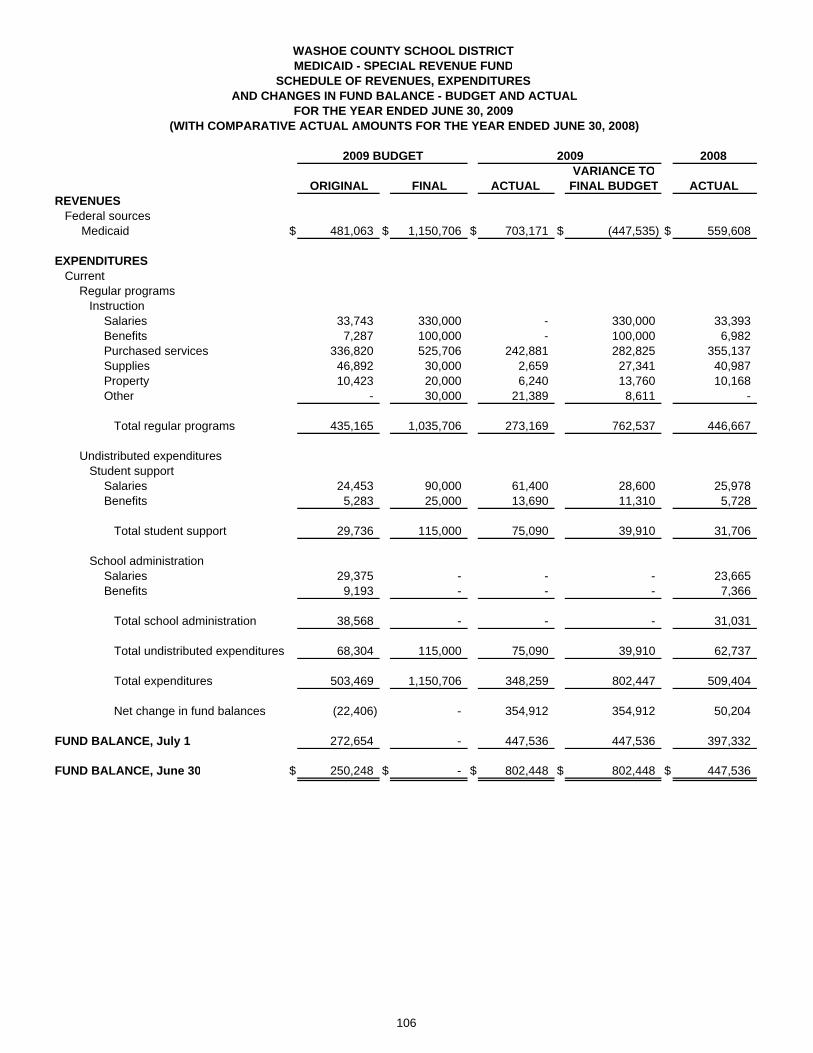
WASHOE COUNTY SCHOOL DISTRICTMEDICAID - SPECIAL REVENUE FUND
SCHEDULE OF REVENUES, EXPENDITURES
FOR THE YEAR ENDED JUNE 30, 2009
2008VARIANCE TO
ORIGINAL FINAL ACTUAL FINAL BUDGET ACTUAL REVENUES Federal sources Medicaid $ 481,063 $ 1,150,706 $ 703,171 $ (447,535) $ 559,608
EXPENDITURES Current
Regular programs Instruction
Salaries 33,743 330,000 - 330,000 33,393 Benefits 7,287 100,000 - 100,000 6,982 Purchased services 336,820 525,706 242,881 282,825 355,137 Supplies 46,892 30,000 2,659 27,341 40,987 Property 10,423 20,000 6,240 13,760 10,168 Other - 30,000 21,389 8,611 -
Total regular programs 435,165 1,035,706 273,169 762,537 446,667
Undistributed expenditures Student support
Salaries 24,453 90,000 61,400 28,600 25,978 Benefits 5,283 25,000 13,690 11,310 5,728
Total student support 29,736 115,000 75,090 39,910 31,706
School administrationSalaries 29,375 - - - 23,665 Benefits 9,193 - - - 7,366
Total school administration 38,568 - - - 31,031
Total undistributed expenditures 68,304 115,000 75,090 39,910 62,737
Total expenditures 503,469 1,150,706 348,259 802,447 509,404
Net change in fund balances (22,406) - 354,912 354,912 50,204
FUND BALANCE, July 1 272,654 - 447,536 447,536 397,332
FUND BALANCE, June 30 $ 250,248 $ - $ 802,448 $ 802,448 $ 447,536
AND CHANGES IN FUND BALANCE - BUDGET AND ACTUAL
(WITH COMPARATIVE ACTUAL AMOUNTS FOR THE YEAR ENDED JUNE 30, 2008)
2009 BUDGET 2009
106

2008VARIANCE TO
ORIGINAL FINAL ACTUAL FINAL BUDGET ACTUAL REVENUES Local sources $ 650,000 $ 702,000 $ 695,807 $ (6,193) $ 550,763
EXPENDITURES Current
Regular programs Instruction
Salaries 523,000 543,000 544,678 (1,678) 438,330 Benefits 100,000 127,000 124,619 2,381 90,139
Total regular programs 623,000 670,000 669,297 703 528,469
Undistributed expenditures Instructional staff support
Salaries 3,000 5,000 2,570 2,430 2,330 Benefits 1,000 1,000 598 402 896
Total instructional staff support 4,000 6,000 3,168 2,832 3,226
Operation and maintenanceSalaries 16,000 19,000 15,829 3,171 13,010 Benefits 7,000 7,000 7,513 (513) 6,058
Total operation and maintenance 23,000 26,000 23,342 2,658 19,068
Total undistributed expenditures 27,000 32,000 26,510 5,490 22,294
Total expenditures 650,000 702,000 695,807 6,193 550,763
Net change in fund balances - - - - -
FUND BALANCE, July 1 - - - - -
FUND BALANCE, June 30 $ - $ - $ - $ - $ -
2009 BUDGET 2009
WASHOE COUNTY SCHOOL DISTRICT
(WITH COMPARATIVE ACTUAL AMOUNTS FOR THE YEAR ENDED JUNE 30, 2008)
CATEGORICAL GRANTS - SPECIAL REVENUE FUNDSCHEDULE OF REVENUES, EXPENDITURES
AND CHANGES IN FUND BALANCE - BUDGET AND ACTUALFOR THE YEAR ENDED JUNE 30, 2009
107

2008VARIANCE TO
ORIGINAL FINAL ACTUAL FINAL BUDGET ACTUAL REVENUES Local sources $ 300,000 $ 300,000 $ 368,205 $ 68,205 $ 378,599
EXPENDITURES Current
Undistributed expenditures School administration
Salaries 130,000 130,000 122,054 7,946 126,040 Benefits 45,000 45,000 41,384 3,616 36,695
Total school administration 175,000 175,000 163,438 11,562 162,735
Community service programsSalaries 130,000 95,102 105,254 (10,152) 150,501 Benefits 9,000 9,000 5,937 3,063 8,080 Purchased services 80,000 114,898 112,062 2,836 103,539 Supplies 10,000 10,000 6,658 3,342 11,233 Other 1,000 1,000 9 991 1,866
Total community service programs 230,000 230,000 229,920 80 275,219
Total expenditures 405,000 405,000 393,358 11,642 437,954
Net change in fund balances (105,000) (105,000) (25,153) 79,847 (59,355)
FUND BALANCE, July 1 122,143 122,143 252,788 130,645 312,143
FUND BALANCE, June 30 $ 17,143 $ 17,143 $ 227,635 $ 210,492 $ 252,788
FOR THE YEAR ENDED JUNE 30, 2009(WITH COMPARATIVE ACTUAL AMOUNTS FOR THE YEAR ENDED JUNE 30, 2008)
2009 BUDGET 2009
WASHOE COUNTY SCHOOL DISTRICTCOMMUNITY EDUCATION - SPECIAL REVENUE FUND
SCHEDULE OF REVENUES, EXPENDITURESAND CHANGES IN FUND BALANCE - BUDGET AND ACTUAL
108

2008VARIANCE TO
ORIGINAL FINAL ACTUAL FINAL BUDGET ACTUAL REVENUES Local sources $ 750,000 $ 777,545 $ 489,238 $ (288,307) $ 1,168,599
EXPENDITURES Current
Regular programs Instruction
Salaries 80,000 107,545 104,397 3,148 79,828 Benefits 10,000 10,000 14,105 (4,105) 4,380 Purchased services 180,000 180,000 185,831 (5,831) 87,617 Supplies 280,000 280,000 230,683 49,317 210,599 Property 180,000 180,000 - 180,000 114,497 Other 20,000 20,000 16,433 3,567 19,741
Total regular programs 750,000 777,545 551,449 226,096 516,662
Capital outlay Site Improvement
Purchased services - 39,825 39,275 550 - Other - - 550 (550) -
Total site improvement - 39,825 39,825 - -
Building ImprovementPurchased services - 546,864 539,088 7,776 19,509 Property - - 553 (553) - Other - - 5,475 (5,475) -
Total building improvement - 546,864 545,116 1,748 19,509
Total capital outlay - 586,689 584,941 1,748 19,509
Total expenditures 750,000 1,364,234 1,136,390 227,844 536,171
Net change in fund balances - (586,689) (647,152) (60,463) 632,428
FUND BALANCE, July 1 376,857 1,458,102 1,458,102 - 825,674
FUND BALANCE, June 30 $ 376,857 $ 871,413 $ 810,950 $ (60,463) $ 1,458,102
FOR THE YEAR ENDED JUNE 30, 2009(WITH COMPARATIVE ACTUAL AMOUNTS FOR THE YEAR ENDED JUNE 30, 2008)
WASHOE COUNTY SCHOOL DISTRICTGIFTS AND DONATIONS - SPECIAL REVENUE FUND
SCHEDULE OF REVENUES, EXPENDITURESAND CHANGES IN FUND BALANCE - BUDGET AND ACTUAL
2009 BUDGET 2009
109
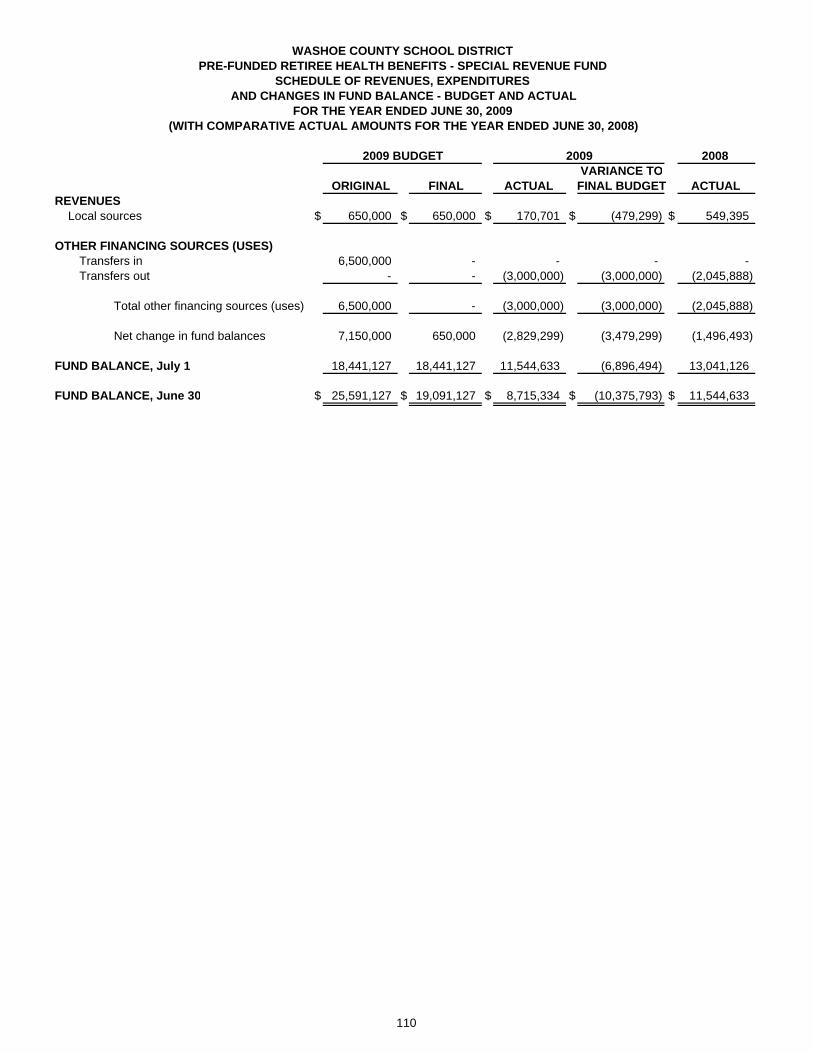
2008VARIANCE TO
ORIGINAL FINAL ACTUAL FINAL BUDGET ACTUAL REVENUES Local sources $ 650,000 $ 650,000 $ 170,701 $ (479,299) $ 549,395
OTHER FINANCING SOURCES (USES)Transfers in 6,500,000 - - - - Transfers out - - (3,000,000) (3,000,000) (2,045,888)
Total other financing sources (uses) 6,500,000 - (3,000,000) (3,000,000) (2,045,888)
Net change in fund balances 7,150,000 650,000 (2,829,299) (3,479,299) (1,496,493)
FUND BALANCE, July 1 18,441,127 18,441,127 11,544,633 (6,896,494) 13,041,126
FUND BALANCE, June 30 $ 25,591,127 $ 19,091,127 $ 8,715,334 $ (10,375,793) $ 11,544,633
2009 BUDGET 2009
WASHOE COUNTY SCHOOL DISTRICT
(WITH COMPARATIVE ACTUAL AMOUNTS FOR THE YEAR ENDED JUNE 30, 2008)
PRE-FUNDED RETIREE HEALTH BENEFITS - SPECIAL REVENUE FUNDSCHEDULE OF REVENUES, EXPENDITURES
AND CHANGES IN FUND BALANCE - BUDGET AND ACTUALFOR THE YEAR ENDED JUNE 30, 2009
110

2008VARIANCE TO
ORIGINAL FINAL ACTUAL FINAL BUDGET ACTUAL EXPENDITURES Current
Regular programs Instruction
Salaries $ - $ - $ - $ - $ 2,061 Benefits - - - - 41 Purchased services - - - - 582 Supplies - - - - 497
Total expenditures - - - - 3,181
OTHER FINANCING (USES)Transfers out - (38,860) (38,860) - -
Net change in fund balances - (38,860) (38,860) - (3,181)
FUND BALANCE, July 1 - 38,860 38,860 - 42,041
FUND BALANCE, June 30 $ - $ - $ - $ - $ 38,860
FOR THE YEAR ENDED JUNE 30, 2009(WITH COMPARATIVE ACTUAL AMOUNTS FOR THE YEAR ENDED JUNE 30, 2008)
WASHOE COUNTY SCHOOL DISTRICTADVANCED CARPENTRY PROJECT - SPECIAL REVENUE FUND
SCHEDULE OF REVENUES, EXPENDITURESAND CHANGES IN FUND BALANCE - BUDGET AND ACTUAL
2009 BUDGET 2009
111

2008VARIANCE TO
ORIGINAL FINAL ACTUAL FINAL BUDGET ACTUAL REVENUES Local sources $ 455,000 $ 455,000 $ 390,408 $ (64,592) $ 520,432
EXPENDITURESUndistributed expenditures General administration
Salaries 85,000 85,000 104,460 (19,460) 67,073 Benefits 343,000 343,000 283,511 59,489 230,912 Purchased services 25,000 25,000 4,410 20,590 18,448 Supplies 1,000 1,000 4,049 (3,049) 30 Property - - 5,062 (5,062) - Other 1,000 1,000 423 577 365
Total expenditures 455,000 455,000 401,915 53,085 316,828
Net change in fund balances - - (11,507) (11,507) 203,604
FUND BALANCE, July 1 311,011 311,011 544,727 233,716 341,123
FUND BALANCE, June 30 $ 311,011 $ 311,011 $ 533,220 $ 222,209 $ 544,727
FOR THE YEAR ENDED JUNE 30, 2009(WITH COMPARATIVE ACTUAL AMOUNTS FOR THE YEAR ENDED JUNE 30, 2008)
WASHOE COUNTY SCHOOL DISTRICTWELLNESS - SPECIAL REVENUE FUND
SCHEDULE OF REVENUES, EXPENDITURESAND CHANGES IN FUND BALANCE - BUDGET AND ACTUAL
2009 BUDGET 2009
112

Debt Service Fund To account for the accumulation of resources for, and the payment of, general long-term debt principal and interest.

2008VARIANCE TO
ORIGINAL FINAL ACTUAL FINAL BUDGET ACTUAL
REVENUES Local sources
Ad valorem taxes $ 57,690,884 $ 57,690,884 $ 58,121,673 $ 430,789 $ 55,343,712 Earnings on investments 1,520,000 1,520,000 2,727,691 1,207,691 2,855,983 Net increase in the fair value of investments - - 1,565,814 1,565,814 834,491
Total revenues 59,210,884 59,210,884 62,415,178 3,204,294 59,034,186
EXPENDITURES Debt service
Principal 32,747,389 32,747,389 32,747,389 - 32,277,384 Interest 24,035,406 24,035,406 24,035,406 - 22,752,490 Other 100,000 100,000 11,698 88,302 14,351
Total expenditures 56,882,795 56,882,795 56,794,493 88,302 55,044,225
Excess of revenues over expenditures 2,328,089 2,328,089 5,620,685 3,292,596 3,989,961
OTHER FINANCING SOURCESTransfers in 3,939,027 3,939,027 3,939,027 - 3,774,276
Net change in fund balances 6,267,116 6,267,116 9,559,712 3,292,596 7,764,237
FUND BALANCE, July 1 62,026,586 62,026,586 63,170,179 1,143,593 55,405,942
FUND BALANCE, June 30 $ 68,293,702 $ 68,293,702 $ 72,729,891 $ 4,436,189 $ 63,170,179
AND CHANGES IN FUND BALANCE - BUDGET AND ACTUAL
(WITH COMPARATIVE ACTUAL AMOUNTS FOR THE YEAR ENDED JUNE 30, 2008)
WASHOE COUNTY SCHOOL DISTRICT
SCHEDULE OF REVENUES, EXPENDITURES
FOR THE YEAR ENDED JUNE 30, 2009
DEBT SERVICE FUND
2009 BUDGET 2009
113

Capital Projects Funds To account for financial resources to be used for the acquisition or construction of major capital facilities (other than those financed by special revenue funds). Individual funds include the following: Government Services Tax Fund: To account for capital projects funded with Government Services Taxes. Capital Projects Funds: To account for costs related to the building and acquisition, construction, and improvements for schools and other District-owned properties. Building and Sites Fund: To account for various other capital projects.

VARIANCE TOORIGINAL FINAL ACTUAL FINAL BUDGET
REVENUES Local sources
Earnings on investments $ - $ - $ 104,223 $ 104,223
EXPENDITURES Current
Undistributed expenditures Business support
Purchased services - 1,370,000 - 1,370,000
Capital outlay, facilities acquisitionand construction: Site improvement
Purchased services - 2,500,000 427,192 2,072,808
Architecture and engineering servicesPurchased services - 2,500,000 525,913 1,974,087
Building improvementSalaries - 10,000 2,361 7,639 Benefits - 5,000 708 4,292 Purchased services - 18,435,000 1,697,154 16,737,846 Property - 750,000 25,917 724,083 Other - 50,000 42,649 7,351
Total building improvement - 19,250,000 1,768,789 17,481,211
Total capital outlay, facilities acquisition and construction - 24,250,000 2,721,894 21,528,106
Debt service Bond issuance costs - 630,000 629,331 669
Total expenditures - 26,250,000 3,351,225 22,898,775
Excess (deficiency) of revenues over expenditures - (26,250,000) (3,247,002) 23,002,998
OTHER FINANCING SOURCESBonds issued - 45,000,000 45,000,000 - Bond premium - 338,162 338,162 -
Total other financing sources - 45,338,162 45,338,162 -
Net change in fund balances - 19,088,162 42,091,160 23,002,998
FUND BALANCE, July 1 - - - -
FUND BALANCE, June 30 $ - $ 19,088,162 $ 42,091,160 $ 23,002,998
WASHOE COUNTY SCHOOL DISTRICT2009 BOND ROLLOVER FUND
SCHEDULE OF REVENUES, EXPENDITURESAND CHANGES IN FUND BALANCE - BUDGET AND ACTUAL
FOR THE YEAR ENDED JUNE 30, 2009
2009 BUDGET 2009
114

2008VARIANCE TO
ORIGINAL FINAL ACTUAL FINAL BUDGET ACTUAL REVENUES Local sources
Earnings on investments $ - $ - $ 1,022,156 $ 1,022,156 $ 385,282
EXPENDITURES Current
Undistributed expenditures Business support
Purchased services - - 182,412 (182,412) - Supplies - - 3,858 (3,858) - Property 4,656,130 4,598,703 503,443 4,095,260 -
Total business support 4,656,130 4,598,703 689,713 3,908,990 -
Capital outlay, facilities acquisitionand construction Site improvement
Salaries - - 3,686 (3,686) - Benefits - - 1,106 (1,106) - Purchased services 2,925,300 5,000,000 3,515,878 1,484,122 536,066 Other - - 1,292 (1,292) -
Total site improvement 2,925,300 5,000,000 3,521,962 1,478,038 536,066
Architecture and engineering servicesSalaries - - 4,468 (4,468) - Benefits - - 1,340 (1,340) - Purchased services 6,210,893 4,500,325 2,553,096 1,947,229 292,859
Total architecture and engineering services 6,210,893 4,500,325 2,558,904 1,941,421 292,859
Building acquisition and constructionSalaries - - 10,944 (10,944) 4,189 Benefits - - 3,283 (3,283) 1,257 Purchased services 13,319,231 19,166,178 12,230,144 6,936,034 510,485 Supplies - 900,000 477,366 422,634 - Property 294,747 2,244,747 1,582,822 661,925 37,545 Other - 25,000 21,022 3,978 481,109
Total building acquisition and construction 13,613,978 22,335,925 14,325,581 8,010,344 1,034,585
Building improvementSalaries - 200,000 150,861 49,139 - Benefits - 50,000 46,314 3,686 - Purchased services 11,763,970 14,613,226 5,600,931 9,012,295 773,283 Supplies - - 51 (51) - Property 388,578 1,638,578 1,161,114 477,464 41,328 Other - 120,000 108,324 11,676 877
Total building improvement 12,152,548 16,621,804 7,067,595 9,554,209 815,488
Total capital outlay, facilities acquisition and construction 34,902,719 48,458,054 27,474,042 20,984,012 2,678,998
(CONTINUED)
WASHOE COUNTY SCHOOL DISTRICT2008 BOND ROLLOVER FUND
SCHEDULE OF REVENUES, EXPENDITURESAND CHANGES IN FUND BALANCE - BUDGET AND ACTUAL
FOR THE YEAR ENDED JUNE 30, 2009
2009 BUDGET 2009
(WITH COMPARATIVE TOTALS FOR THE YEAR ENDED JUNE 30, 2008)
115

2008VARIANCE TO
ORIGINAL FINAL ACTUAL FINAL BUDGET ACTUAL
WASHOE COUNTY SCHOOL DISTRICT2008 BOND ROLLOVER FUND
SCHEDULE OF REVENUES, EXPENDITURESAND CHANGES IN FUND BALANCE - BUDGET AND ACTUAL
FOR THE YEAR ENDED JUNE 30, 2009
2009 BUDGET 2009
(WITH COMPARATIVE TOTALS FOR THE YEAR ENDED JUNE 30, 2008)
Debt service Bond issuance costs - - - - 351,480
Total expenditures 39,558,849 53,056,757 28,163,755 24,893,002 3,030,478
Excess (deficiency) of revenues over expenditures (39,558,849) (53,056,757) (27,141,599) 25,915,158 (2,645,196)
OTHER FINANCING SOURCESBonds issued - - - - 55,000,000 Bond premium - - - - 701,953
Total other financing sources - - - - 55,701,953
Net change in fund balances (39,558,849) (53,056,757) (27,141,599) 25,915,158 53,056,757
FUND BALANCE, July 1 39,558,849 53,056,757 53,056,757 - -
FUND BALANCE, June 30 $ - $ - $ 25,915,158 $ 25,915,158 $ 53,056,757
116

2008VARIANCE TO
ORIGINAL FINAL ACTUAL FINAL BUDGET ACTUAL REVENUES Local sources
Earnings on investments $ - $ - $ 1,441,878 $ 1,441,878 $ 2,749,948
EXPENDITURES Current
Undistributed expenditures Business support
Salaries - 800,000 905,812 (105,812) 976,256 Benefits - 250,000 248,302 1,698 281,592 Purchased services - 100,000 228,944 (128,944) 5,311 Supplies - - 1,976 (1,976) 103 Property - 450,000 37,174 412,826 115,219 Other - - 3,384 (3,384) -
Total business support - 1,600,000 1,425,592 174,408 1,378,481
Central supportSalaries - 150,000 137,513 12,487 26,592 Benefits - 75,000 64,759 10,241 14,046 Purchased services 19,396 100,000 30,718 69,282 95,481 Supplies - - 19,673 (19,673) 38,754 Property - 75,000 29,616 45,384 -
Total central support 19,396 400,000 282,279 117,721 174,873
Total undistributed expenditures 19,396 2,000,000 1,707,871 292,129 1,553,354
Capital outlay, facilities acquisitionand construction Site improvement
Salaries - 25,000 175 24,825 - Benefits - - 52 (52) - Purchased services - 25,000 3,938 21,062 -
Total site improvement - 50,000 4,165 45,835 -
Architecture and engineering servicesSalaries - - 4,791 (4,791) 930 Benefits - - 1,438 (1,438) 279 Purchased services 444,487 350,000 261,431 88,569 1,187,605 Other - - 924 (924) 30,504
Total architecture and engineering services 444,487 350,000 268,584 81,416 1,219,318
Building acquisition and constructionSalaries - - 352 (352) 10,832 Benefits - - 105 (105) 3,250 Purchased services 30,984,449 32,500,000 29,249,736 3,250,264 7,888,060 Property - - - - 28,315
Total building acquisition and construction 30,984,449 32,500,000 29,250,193 3,249,807 7,930,457
(CONTINUED)
WASHOE COUNTY SCHOOL DISTRICT2007 BOND ROLLOVER FUND
SCHEDULE OF REVENUES, EXPENDITURESAND CHANGES IN FUND BALANCE - BUDGET AND ACTUAL
2009 BUDGET 2009
FOR THE YEAR ENDED JUNE 30, 2009(WITH COMPARATIVE TOTALS FOR THE YEAR ENDED JUNE 30, 2008)
117

2008VARIANCE TO
ORIGINAL FINAL ACTUAL FINAL BUDGET ACTUAL
WASHOE COUNTY SCHOOL DISTRICT2007 BOND ROLLOVER FUND
SCHEDULE OF REVENUES, EXPENDITURESAND CHANGES IN FUND BALANCE - BUDGET AND ACTUAL
2009 BUDGET 2009
FOR THE YEAR ENDED JUNE 30, 2009(WITH COMPARATIVE TOTALS FOR THE YEAR ENDED JUNE 30, 2008)
Building improvementSalaries $ - $ - $ 10,247 $ (10,247) $ 5,530 Benefits - - 3,074 (3,074) 1,641 Purchased services 523,510 20,801,470 1,048,665 19,752,805 835,464 Supplies - - 1,917 (1,917) - Property 250,571 250,570 450,511 (199,941) 296,554 Other - - 2,140 (2,140) 30,334
Total building improvement 774,081 21,052,040 1,516,554 19,535,486 1,169,523
Total capital outlay, facilities acquisition and construction 32,203,017 53,952,040 31,039,496 22,912,544 10,319,298
Total expenditures 32,222,413 55,952,040 32,747,367 23,204,673 11,872,652
Net change in fund balances (32,222,413) (55,952,040) (31,305,489) 24,646,551 (9,122,704)
FUND BALANCE, July 1 32,222,413 55,952,040 55,952,040 - 65,074,744
FUND BALANCE, June 30 $ - $ - $ 24,646,551 $ 24,646,551 $ 55,952,040
118

2008VARIANCE TO
ORIGINAL FINAL ACTUAL FINAL BUDGET ACTUAL REVENUES Local sources
Earnings on investments $ - $ - $ 408,663 $ 408,663 $ 790,567
EXPENDITURES Current
Undistributed expenditures Business support
Purchased services 98,090 150,000 72,578 77,422 434,987
Central supportPurchased services - 100,000 5,825 94,175 287,214 Supplies - - - - 9,623 Property - - - - 13,908
Total central support - 100,000 5,825 94,175 310,745
Total undistributed expenditures 98,090 250,000 78,403 171,597 745,732
Capital outlay, facilities acquisitionand construction Land acquisition
Purchased services 24,087 150,000 25,814 124,186 24,980 Other - - - - 553,752
Total land acquisition 24,087 150,000 25,814 124,186 578,732
Site improvementSalaries - - 3,162 (3,162) 19,298 Benefits - - 949 (949) 5,789 Purchased services 534,388 1,500,000 625,283 874,717 620,710
Total site improvement 534,388 1,500,000 629,394 870,606 645,797
Architecture and engineering servicesSalaries - 100,000 49,989 50,011 17,206 Benefits - 50,000 14,997 35,003 5,162 Purchased services 1,382,790 2,500,000 1,319,728 1,180,272 834,380 Other - 50,000 32,136 17,864 12,542
Total architecture and engineering services 1,382,790 2,700,000 1,416,850 1,283,150 869,290
Building acquisition and constructionSalaries - - - - 12,626 Benefits - - - - 3,788 Purchased services - 293,730 37,123 256,607 230,298 Supplies - - - - 522 Property 306,271 206,270 113,706 92,564 18,304 Other - - 2,340 (2,340) 3,825
Total building acquisition and construction 306,271 500,000 153,169 346,831 269,363
(CONTINUED)
WASHOE COUNTY SCHOOL DISTRICT2006 BOND ROLLOVER FUND
SCHEDULE OF REVENUES, EXPENDITURESAND CHANGES IN FUND BALANCE - BUDGET AND ACTUAL
2009 BUDGET 2009
FOR THE YEAR ENDED JUNE 30, 2009(WITH COMPARATIVE TOTALS FOR THE YEAR ENDED JUNE 30, 2008)
119

2008VARIANCE TO
ORIGINAL FINAL ACTUAL FINAL BUDGET ACTUAL
WASHOE COUNTY SCHOOL DISTRICT2006 BOND ROLLOVER FUND
SCHEDULE OF REVENUES, EXPENDITURESAND CHANGES IN FUND BALANCE - BUDGET AND ACTUAL
2009 BUDGET 2009
FOR THE YEAR ENDED JUNE 30, 2009(WITH COMPARATIVE TOTALS FOR THE YEAR ENDED JUNE 30, 2008)
Building improvementSalaries $ - $ - $ 153,822 $ (153,822) $ 339,980 Benefits - - 42,006 (42,006) 92,323 Purchased services 1,583,886 1,383,886 3,248,145 (1,864,259) 3,899,931 Supplies - - 414,218 (414,218) 7,971 Property 245,343 7,021,872 2,116,191 4,905,681 564,845 Other - - 15,434 (15,434) 1,220
Total building improvement 1,829,229 8,405,758 5,989,816 2,415,942 4,906,270
Total capital outlay, facilities acquisition and construction 4,076,765 13,255,758 8,215,043 5,040,715 7,269,452
Total expenditures 4,174,855 13,505,758 8,293,446 5,212,312 8,015,184
Net change in fund balances (4,174,855) (13,505,758) (7,884,783) 5,620,975 (7,224,617)
FUND BALANCE, July 1 4,174,855 13,505,758 13,505,758 - 20,730,375
FUND BALANCE, June 30 $ - $ - $ 5,620,975 $ 5,620,975 $ 13,505,758
120

2008VARIANCE TO
ORIGINAL FINAL ACTUAL FINAL BUDGET ACTUAL REVENUES Local sources Earnings on investments $ - $ 141,359 $ 88,763 $ (52,596) $ 369,097
EXPENDITURES Current
Undistributed expenditures Business support
Salaries - 828,598 535,098 293,500 128,351 Benefits - 205,000 212,001 (7,001) 48,261 Purchased services 31,402 31,402 31,271 131 266,985 Supplies - 110,000 62,876 47,124 22,887 Property - 25,000 25,257 (257) 149,291 Other - - - - 950
Total undistributed expenditures 31,402 1,200,000 866,503 333,497 616,725
Capital outlay, facilities acquisitionand construction Site improvement
Salaries - - - - 809 Benefits - - - - 243 Purchased services - - - - 385,347
Total site improvement - - - - 386,399
Architecture and engineering servicesSalaries - 156,000 140,312 15,688 10,938 Benefits - 50,000 42,994 7,006 3,282 Purchased services 604,191 1,293,999 1,007,806 286,193 1,085,795 Other - - 16 (16) 22,002
Total architecture and engineering services 604,191 1,499,999 1,191,128 308,871 1,122,017
Building acquisition and constructionSalaries - 3,000 1,596 1,404 9,445 Benefits - 500 479 21 2,833 Purchased services 1,323 2,103,824 2,103,168 656 80,529 Supplies - - - - 48,051 Property 423 192,677 - 192,677 17,176
Total building acquisition and construction 1,746 2,300,001 2,105,243 194,758 158,034
(CONTINUED)
WASHOE COUNTY SCHOOL DISTRICT2005 BOND ROLLOVER FUND
SCHEDULE OF REVENUES, EXPENDITURESAND CHANGES IN FUND BALANCE - BUDGET AND ACTUAL
2009 BUDGET 2009
FOR THE YEAR ENDED JUNE 30, 2009(WITH COMPARATIVE ACTUAL AMOUNTS FOR THE YEAR ENDED JUNE 30, 2008)
121

2008VARIANCE TO
ORIGINAL FINAL ACTUAL FINAL BUDGET ACTUAL
WASHOE COUNTY SCHOOL DISTRICT2005 BOND ROLLOVER FUND
SCHEDULE OF REVENUES, EXPENDITURESAND CHANGES IN FUND BALANCE - BUDGET AND ACTUAL
2009 BUDGET 2009
FOR THE YEAR ENDED JUNE 30, 2009(WITH COMPARATIVE ACTUAL AMOUNTS FOR THE YEAR ENDED JUNE 30, 2008)
Building improvementSalaries $ - $ 120,000 $ 18,545 $ 101,455 $ 194,901 Benefits - 10,000 8,661 1,339 69,371 Purchased services 525,157 1,260,584 989,412 271,172 3,365,261 Supplies 1,300 101,300 1,522 99,778 167,144 Property 93,424 193,324 133,653 59,671 1,558,768 Other - 100 48 52 11,874
Total building improvement 619,881 1,685,308 1,151,841 533,467 5,367,319
Total capital outlay, facilities acquisition and construction 1,225,818 5,485,308 4,448,212 1,037,096 7,033,769
Total expenditures 1,257,220 6,685,308 5,314,715 1,370,593 7,650,494
Net change in fund balances (1,257,220) (6,543,949) (5,225,952) 1,317,997 (7,281,397)
FUND BALANCE, July 1 1,257,220 6,543,949 6,543,949 - 13,825,346
FUND BALANCE, June 30 $ - $ - $ 1,317,997 $ 1,317,997 $ 6,543,949
122
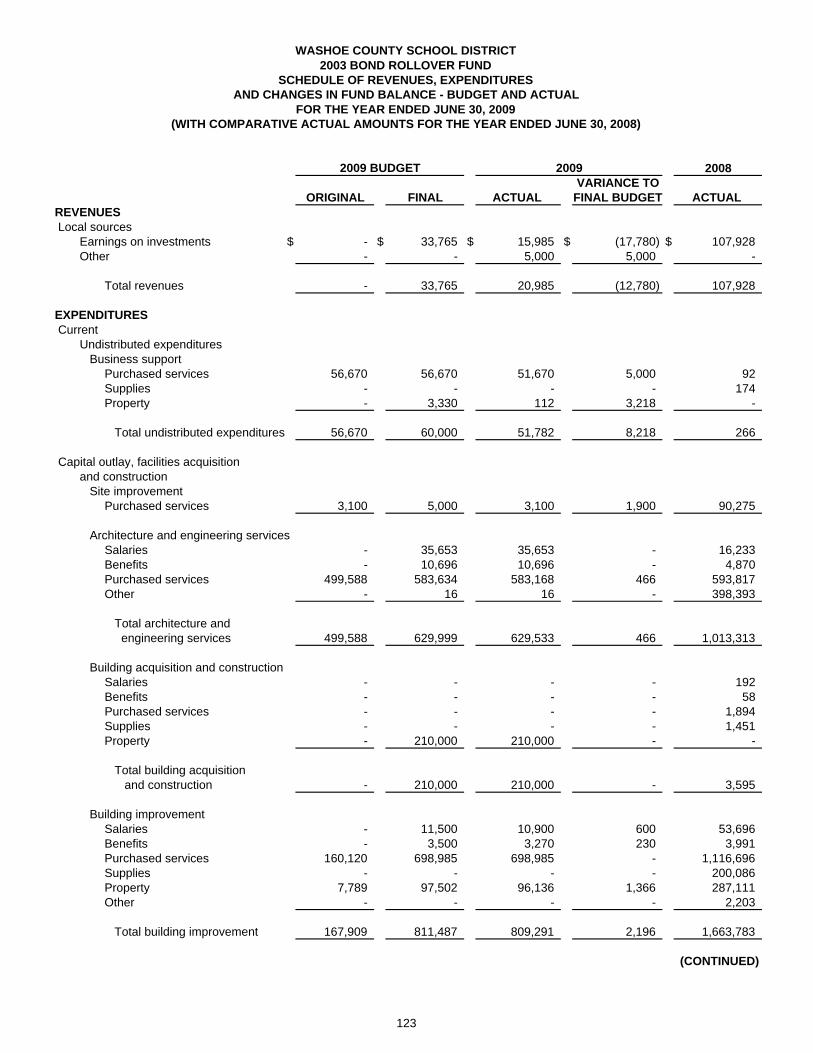
2003 BOND ROLLOVER FUNDSCHEDULE OF REVENUES, EXPENDITURES
FOR THE YEAR ENDED JUNE 30, 2009
2008VARIANCE TO
ORIGINAL FINAL ACTUAL FINAL BUDGET ACTUAL REVENUES Local sources
Earnings on investments $ - $ 33,765 $ 15,985 $ (17,780) $ 107,928 Other - - 5,000 5,000 -
Total revenues - 33,765 20,985 (12,780) 107,928
EXPENDITURES Current
Undistributed expenditures Business support
Purchased services 56,670 56,670 51,670 5,000 92 Supplies - - - - 174 Property - 3,330 112 3,218 -
Total undistributed expenditures 56,670 60,000 51,782 8,218 266
Capital outlay, facilities acquisitionand construction Site improvement
Purchased services 3,100 5,000 3,100 1,900 90,275
Architecture and engineering servicesSalaries - 35,653 35,653 - 16,233 Benefits - 10,696 10,696 - 4,870 Purchased services 499,588 583,634 583,168 466 593,817 Other - 16 16 - 398,393
Total architecture and engineering services 499,588 629,999 629,533 466 1,013,313
Building acquisition and constructionSalaries - - - - 192 Benefits - - - - 58 Purchased services - - - - 1,894 Supplies - - - - 1,451 Property - 210,000 210,000 - -
Total building acquisition and construction - 210,000 210,000 - 3,595
Building improvementSalaries - 11,500 10,900 600 53,696 Benefits - 3,500 3,270 230 3,991 Purchased services 160,120 698,985 698,985 - 1,116,696 Supplies - - - - 200,086 Property 7,789 97,502 96,136 1,366 287,111 Other - - - - 2,203
Total building improvement 167,909 811,487 809,291 2,196 1,663,783
(CONTINUED)
WASHOE COUNTY SCHOOL DISTRICT
2009 BUDGET 2009
AND CHANGES IN FUND BALANCE - BUDGET AND ACTUAL
(WITH COMPARATIVE ACTUAL AMOUNTS FOR THE YEAR ENDED JUNE 30, 2008)
123

2003 BOND ROLLOVER FUNDSCHEDULE OF REVENUES, EXPENDITURES
FOR THE YEAR ENDED JUNE 30, 2009
2008VARIANCE TO
ORIGINAL FINAL ACTUAL FINAL BUDGET ACTUAL
WASHOE COUNTY SCHOOL DISTRICT
2009 BUDGET 2009
AND CHANGES IN FUND BALANCE - BUDGET AND ACTUAL
(WITH COMPARATIVE ACTUAL AMOUNTS FOR THE YEAR ENDED JUNE 30, 2008)
Total capital outlay, facilities acquisition and construction $ 670,597 $ 1,656,486 $ 1,651,924 $ 4,562 $ 2,770,966
Total expenditures 727,267 1,716,486 1,703,706 12,780 2,771,232
Net change in fund balances (727,267) (1,682,721) (1,682,721) - (2,663,304)
FUND BALANCE, July 1 727,267 1,682,721 1,682,721 - 4,346,025
FUND BALANCE, June 30 $ - $ - $ - $ - $ 1,682,721
124

WASHOE COUNTY SCHOOL DISTRICT2002 BOND ROLLOVER FUND
SCHEDULE OF REVENUES, EXPENDITURES
FOR THE YEAR ENDED JUNE 30, 2009
2008VARIANCE TO
ORIGINAL FINAL ACTUAL FINAL BUDGET ACTUAL REVENUES Local sources
Earnings on investments $ - $ - $ - $ - $ 17,663
EXPENDITURES Capital outlay, facilities acquisition
and construction Architecture and engineering services
Purchased services - 15,472 15,472 - 133,810
Building acquisition and constructionSalaries - 940 940 - - Benefits - 283 283 - - Purchased services - 10,875 10,875 - 74
Total building acquisition and construction - 12,098 12,098 - 74
Building improvementPurchased services - 3,533 3,533 - 1,190,893 Supplies - 154 154 - 1,405 Property - - - - 36,050
Total building improvement - 3,687 3,687 - 1,228,348
Total capital outlay, facilities acquisition and construction - 31,257 31,257 - 1,362,232
Net change in fund balances - (31,257) (31,257) - (1,344,569)
FUND BALANCE, July 1 - 31,257 31,257 - 1,375,826
FUND BALANCE, June 30 $ - $ - $ - $ - $ 31,257
AND CHANGES IN FUND BALANCE - BUDGET AND ACTUAL
(WITH COMPARATIVE ACTUAL AMOUNTS FOR THE YEAR ENDED JUNE 30, 2008)
2009 BUDGET 2009
125

GOVERNMENT BUILDINGSERVICES TAX AND SITES
FUND FUND TOTALASSETS
Cash and investments $ 3,723,945 $ 4,461,905 $ 8,185,850 Receivables
Interest 1,093 1,336 2,429 Due from other governments 291,848 - 291,848
Total assets $ 4,016,886 $ 4,463,241 $ 8,480,127
LIABILITIESAccounts payable $ 229,704 $ - $ 229,704 Accrued liabilities 151,684 8,153 159,837 Construction contracts payable 118,544 - 118,544
Total liabilities 499,932 8,153 508,085
FUND BALANCEReserved for
Encumbrances 285,830 - 285,830 Construction contracts 72,640 - 72,640 Capital projects 383,241 3,176,495 3,559,736
UnreservedUndesignated 2,775,243 1,278,593 4,053,836
Total fund balance 3,516,954 4,455,088 7,972,042
Total liabilities and fund balance $ 4,016,886 $ 4,463,241 $ 8,480,127
WASHOE COUNTY SCHOOL DISTRICTNONMAJOR CAPITAL PROJECTS FUNDS
COMBINING BALANCE SHEETJUNE 30, 2009
126
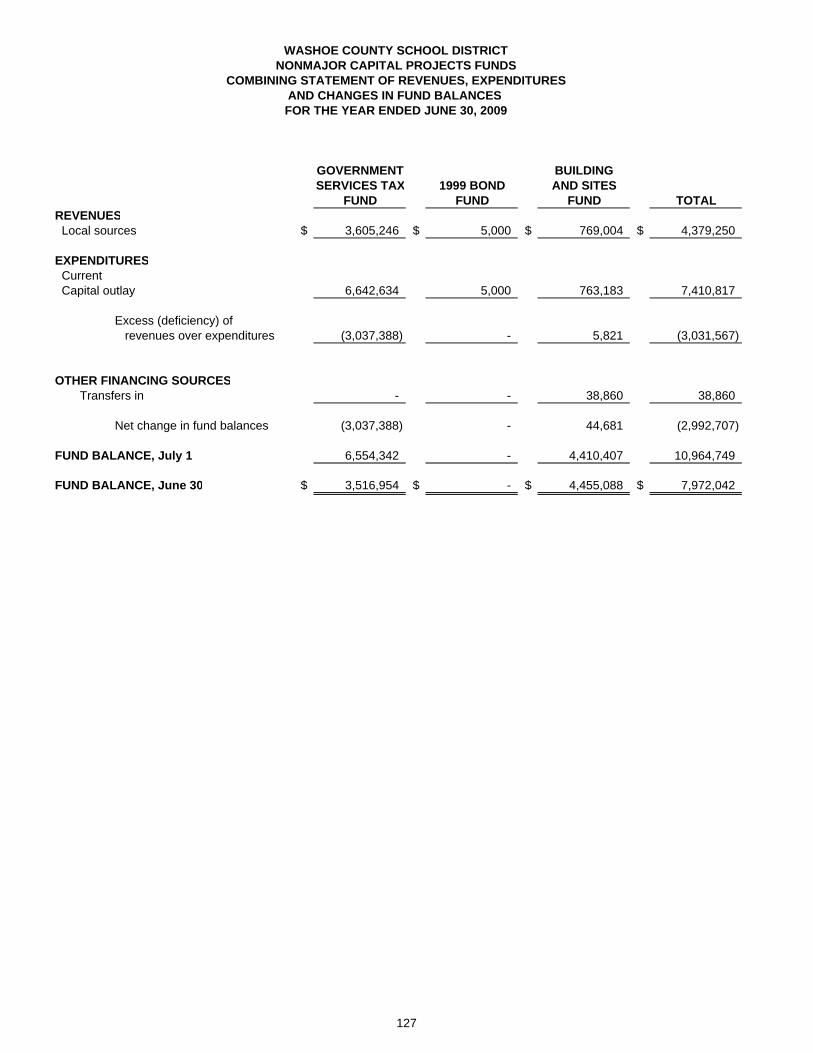
GOVERNMENT BUILDINGSERVICES TAX 1999 BOND AND SITES
FUND FUND FUND TOTALREVENUES Local sources $ 3,605,246 $ 5,000 $ 769,004 $ 4,379,250
EXPENDITURES Current Capital outlay 6,642,634 5,000 763,183 7,410,817
Excess (deficiency) of revenues over expenditures (3,037,388) - 5,821 (3,031,567)
OTHER FINANCING SOURCESTransfers in - - 38,860 38,860
Net change in fund balances (3,037,388) - 44,681 (2,992,707)
FUND BALANCE, July 1 6,554,342 - 4,410,407 10,964,749
FUND BALANCE, June 30 $ 3,516,954 $ - $ 4,455,088 $ 7,972,042
FOR THE YEAR ENDED JUNE 30, 2009
WASHOE COUNTY SCHOOL DISTRICTNONMAJOR CAPITAL PROJECTS FUNDS
COMBINING STATEMENT OF REVENUES, EXPENDITURESAND CHANGES IN FUND BALANCES
127

2008VARIANCE TO
ORIGINAL FINAL ACTUAL FINAL BUDGET ACTUAL REVENUES Local sources
Government services tax $ 3,799,961 $ 3,799,961 $ 3,424,061 $ (375,900) $ 3,764,216 Earnings on investments 10,000 10,000 84,361 74,361 300,943 Other - - 96,824 96,824 821,918
Total revenues 3,809,961 3,809,961 3,605,246 (204,715) 4,887,077
EXPENDITURES Current:
Undistributed expenditures Business support
Bond issuance costs - - - - 16,736
Capital outlay, facilities acquisitionand construction Land acquisition
Property - - - - 25,000
Site improvementSalaries - 1,000 7,900 (6,900) 5,585 Benefits - - 2,370 (2,370) 1,675 Purchased services 1,442,964 1,441,964 729,644 712,320 499,106 Property - - 5,156 (5,156) - Other - - 3,556 (3,556) 1,190
Total site improvement 1,442,964 1,442,964 748,626 694,338 507,556
Architecture and engineering servicesSalaries 334,000 641,500 632,355 9,145 468,638 Benefits 266,000 214,975 209,506 5,469 137,213 Purchased services 834,217 577,742 393,847 183,895 645,305 Other - - 13,711 (13,711) 10,364
Total architecture and engineering services 1,434,217 1,434,217 1,249,419 184,798 1,261,520
Building acquisition and constructionSalaries - - 52,078 (52,078) 889 Benefits - - 15,623 (15,623) 267 Purchased services - 2,290,000 1,575,944 714,056 9,244 Supplies - 10,000 142,856 (132,856) - Property - - 214,350 (214,350) 3,077,923
Total building acquisition and construction - 2,300,000 2,000,851 299,149 3,088,323
(CONTINUED)
WASHOE COUNTY SCHOOL DISTRICTGOVERNMENT SERVICES TAX FUND
SCHEDULE OF REVENUES, EXPENDITURES
FOR THE YEAR ENDED JUNE 30, 2009AND CHANGES IN FUND BALANCE - BUDGET AND ACTUAL
(WITH COMPARATIVE ACTUAL AMOUNTS FOR THE YEAR ENDED JUNE 30, 2008)
2009 BUDGET 2009
128

2008VARIANCE TO
ORIGINAL FINAL ACTUAL FINAL BUDGET ACTUAL
WASHOE COUNTY SCHOOL DISTRICTGOVERNMENT SERVICES TAX FUND
SCHEDULE OF REVENUES, EXPENDITURES
FOR THE YEAR ENDED JUNE 30, 2009AND CHANGES IN FUND BALANCE - BUDGET AND ACTUAL
(WITH COMPARATIVE ACTUAL AMOUNTS FOR THE YEAR ENDED JUNE 30, 2008)
2009 BUDGET 2009
Building improvementSalaries $ - $ 10,500 $ 43,995 $ (33,495) $ 74,346 Benefits - - 13,199 (13,199) 22,262 Purchased services 3,270,753 3,676,735 2,477,685 1,199,050 4,767,049 Supplies 88,391 88,391 53,471 34,920 86,519 Property 24,529 24,529 38,149 (13,620) 251,258 Other - - 17,239 (17,239) 18,167
Total building improvement 3,383,673 3,800,155 2,643,738 1,156,417 5,219,601
Total capital outlay, facilities acquisition and construction 6,260,854 8,977,336 6,642,634 2,334,702 10,102,000
Total expenditures 6,260,854 8,977,336 6,642,634 2,334,702 10,118,736
Excess (deficiency) of revenue over expenditures (2,450,893) (5,167,375) (3,037,388) 2,129,987 (5,231,659)
OTHER FINANCING SOURCESProceeds from capital lease - - - - 1,403,000 Transfers in 59,000 59,000 - (59,000) 309,000
Total other financing sources 59,000 59,000 - (59,000) 1,712,000
Net change in fund balances (2,391,893) (5,108,375) (3,037,388) 2,070,987 (3,519,659)
FUND BALANCE, July 1 2,391,893 6,554,342 6,554,342 - 10,074,001
FUND BALANCE, June 30 $ - $ 1,445,967 $ 3,516,954 $ 2,070,987 $ 6,554,342
129

2008VARIANCE TO
ORIGINAL FINAL ACTUAL FINAL BUDGET ACTUAL REVENUES Local sources
Earnings on investments $ - $ - $ - $ - $ 4,448 Other - 5,000 5,000 - 10
Total revenues - 5,000 5,000 - 4,458
EXPENDITURES Capital outlay, facilities acquisition
and construction Building improvement
Salaries - - - - 14,066 Benefits - - - - 4,220 Purchased services - - - - 35,593 Property - 5,000 5,000 - 5,631 Other - - - - 16
Total building improvement - 5,000 5,000 - 59,526
Net change in fund balances - - - - (55,068)
FUND BALANCE, July 1 - - - - 55,068
FUND BALANCE, June 30 $ - $ - $ - $ - $ -
WASHOE COUNTY SCHOOL DISTRICT1999 BOND FUND
SCHEDULE OF REVENUES, EXPENDITURES
FOR THE YEAR ENDED JUNE 30, 2009AND CHANGES IN FUND BALANCE - BUDGET AND ACTUAL
(WITH COMPARATIVE ACTUAL AMOUNTS FOR THE YEAR ENDED JUNE 30, 2008)
2009 BUDGET 2009
130

2008VARIANCE TO
ORIGINAL FINAL ACTUAL FINAL BUDGET ACTUAL
REVENUES Local sources Rental income $ 30,000 $ 30,000 $ 99,993 $ 69,993 $ 87,497 Earnings on investments 50,000 50,000 67,967 17,967 222,413 Other - - 1,652 1,652 58,906 Sale of property - 410,765 599,392 188,627 340,379
Total revenues 80,000 490,765 769,004 278,239 709,195
EXPENDITURES Capital outlay, facilities acquisition
and construction Land acquisition
Purchased services 3,763 3,763 350 3,413 3,016 Property - 788,737 351,219 437,518 1,313,746 Other - 7,500 5,703 1,797 16
Total land acquisition 3,763 800,000 357,272 442,728 1,316,778
Site improvementPurchased services - 100,000 22,431 77,569 4,875
Architecture and engineering servicesPurchased services 18,433 499,999 301,503 198,496 75,712
Building acquisition and constructionPurchased services - 100,000 - 100,000 -
Building improvementPurchased services 30,000 160,636 45,699 114,937 2,870 Supplies - 31,000 30,036 964 20,453 Property - 33,041 6,242 26,799 -
Total building improvement 30,000 224,677 81,977 142,700 23,323
Total expenditures 52,196 1,724,676 763,183 961,493 1,420,688
Excess (deficiency) of revenues over expenditures 27,804 (1,233,911) 5,821 1,239,732 (711,493)
OTHER FINANCING SOURCESTransfers in - 38,860 38,860 - -
Net change in fund balances 27,804 (1,195,051) 44,681 1,239,732 (711,493)
FUND BALANCE, July 1 3,116,838 4,410,407 4,410,407 - 5,121,900
FUND BALANCE, June 30 $ 3,144,642 $ 3,215,356 $ 4,455,088 $ 1,239,732 $ 4,410,407
WASHOE COUNTY SCHOOL DISTRICT BUILDING AND SITES FUND
2009 BUDGET 2009
SCHEDULE OF REVENUES, EXPENDITURESAND CHANGES IN FUND BALANCE - BUDGET AND ACTUAL
FOR THE YEAR ENDED JUNE 30, 2009(WITH COMPARATIVE ACTUAL AMOUNTS FOR THE YEAR ENDED JUNE 30, 2008)
131

WASHOE COUNTY SCHOOL DISTRICT1998 BOND EXTRAORDINARY MAINTENANCE FUND
2008VARIANCE TO
ORIGINAL FINAL ACTUAL FINAL BUDGET ACTUAL
REVENUES Local sources
Earnings on investments $ - $ - $ - $ - $ 25,072
EXPENDITURES Capital outlay, facilities acquisition, and construction
Building improvementPurchased services - - - - 25,072
Net change in fund balances - - - - -
FUND BALANCE, July 1 - - - - -
FUND BALANCE, June 30 $ - $ - $ - $ - $ -
2009 BUDGET
SCHEDULE OF REVENUES, EXPENDITURESAND CHANGES IN FUND BALANCE - BUDGET AND ACTUAL
FOR THE YEAR ENDED JUNE 30, 2009(WITH COMPARATIVE ACTUAL AMOUNTS FOR THE YEAR ENDED JUNE 30, 2008)
2009
132

Enterprise Fund Nutrition Services Fund: To account for transactions relating to the food services provided to schools and other locations. Financing is provided by user charges and federal subsidies.

ASSETS 2009 2008Current assets
Cash and investments $ 2,055,508 $ 2,452,106 Receivables 1,727,832 622,555 Inventories 582,057 668,448 Prepaids 365 380
Total current assets 4,365,762 3,743,489
Capital assetsMachinery and equipment 1,674,222 1,576,048 Less: Allowance for depreciation (1,277,423) (1,171,246)
Total capital assets 396,799 404,802
Total assets 4,762,561 4,148,291
LIABILITIESCurrent liabilities
Accounts payable 232,206 231,825 Accrued liabilities 584,118 502,816 Unearned revenue 244,812 294,998
Total liabilities 1,061,136 1,029,639
NET ASSETSInvested in capital assets 396,799 404,802 Unrestricted 3,304,626 2,713,850
Total net assets $ 3,701,425 $ 3,118,652
(WITH COMPARATIVE TOTALS FOR JUNE 30, 2008)
WASHOE COUNTY SCHOOL DISTRICTNUTRITION SERVICES ENTERPRISE FUND
STATEMENT OF NET ASSETSJUNE 30, 2009
133

2008VARIANCE TO
ORIGINAL FINAL ACTUAL FINAL BUDGET ACTUAL
OPERATING REVENUESCharges for services $ 7,592,120 $ 7,592,120 $ 5,968,280 $ (1,623,840) $ 6,738,145
OPERATING EXPENSESFood and supplies 8,090,193 9,165,718 7,886,203 1,279,515 8,716,418 Salaries and benefits 8,240,433 8,240,433 7,924,465 315,968 7,749,467 Purchased services 1,014,839 1,014,839 1,008,293 6,546 998,407 Property 11,500 11,500 - 11,500 10,999 Depreciation 106,390 106,390 106,177 213 103,685 Other 435,641 435,641 409,826 25,815 450,019
Total operating expenses 17,898,996 18,974,521 17,334,964 1,639,557 18,028,995
Operating (loss) (10,306,876) (11,382,401) (11,366,684) 15,717 (11,290,850)
NONOPERATING REVENUESFederal subsidies 9,632,591 9,632,591 10,786,143 1,153,552 9,628,040 Commodity revenue - 1,075,525 1,075,525 - 1,109,854 State matching funds - - 87,789 87,789 250,618 Special appropriations 82,433 82,433 - (82,433) -
Total nonoperating revenues 9,715,024 10,790,549 11,949,457 1,158,908 10,988,512
Income (loss) before transfers (591,852) (591,852) 582,773 1,174,625 (302,338)
TRANSFERSTransfers in 250,000 250,000 - (250,000) 250,000
Change in net assets (341,852) (341,852) 582,773 924,625 (52,338)
NET ASSETS - July 1 2,667,971 2,667,971 3,118,652 450,681 3,170,990
NET ASSETS - June 30 $ 2,326,119 $ 2,326,119 $ 3,701,425 $ 1,375,306 $ 3,118,652
2009 BUDGET 2009
FOR THE YEAR ENDED JUNE 30, 2009(WITH COMPARATIVE TOTALS FOR THE YEAR ENDED JUNE 30, 2008)
WASHOE COUNTY SCHOOL DISTRICTNUTRITION SERVICES ENTERPRISE FUND
SCHEDULE OF REVENUES, EXPENSES ANDCHANGES IN NET ASSETS - BUDGET AND ACTUAL
134

2008VARIANCE TO
ORIGINAL FINAL ACTUAL FINAL BUDGET ACTUAL
INCREASE (DECREASE) IN CASH AND INVESTMENTS
Cash flows from operating activitiesCash received for services $ 7,592,120 $ 7,592,120 $ 4,812,817 $ (2,779,303) $ 6,781,160 Cash paid for food and supplies (8,090,193) (8,090,193) (6,642,589) 1,447,604 (7,606,564) Cash paid for salaries and benefits (8,240,433) (8,240,433) (7,924,465) 315,968 (7,749,467) Cash payments for purchased services (1,014,839) (1,014,839) (1,008,293) 6,546 (998,407) Cash payments for property - - - - (10,999) Cash payments for other (435,641) (435,641) (409,826) 25,815 (450,019)
Net cash (used) by operating activities (10,188,986) (10,188,986) (11,172,356) (983,370) (10,034,296)
Cash flows from capital and related financing activities
Purchase of equipment (11,500) (11,500) (98,174) (86,674) (5,242)
Cash flows from noncapital financing activitiesFederal reimbursements 9,632,591 9,632,591 10,786,143 1,153,552 9,628,040 State matching funds - - 87,789 87,789 250,618 State grant funds 82,433 82,433 - (82,433) - Transfer from General Fund 250,000 250,000 - (250,000) 250,000
Net cash provided by noncapital financing activities 9,965,024 9,965,024 10,873,932 908,908 10,128,658
Net increase (decrease) in cash and cash equivalents (235,462) (235,462) (396,598) (161,136) 89,120
Cash and investments, July 1 - - 2,452,106 2,452,106 2,362,986
Cash and investments, June 30 $ (235,462) $ (235,462) $ 2,055,508 $ 2,290,970 $ 2,452,106
RECONCILIATION OF OPERATING (LOSS) TO NET CASH (USED) BY OPERATIONS
Operating (loss) $ (10,306,876) $ (11,382,401) $ (11,366,684) $ 15,717 $ (11,290,850)
Adjustments to reconcile operating (loss) to net cash (used) by operations
Depreciation 106,390 106,390 106,177 (213) 103,685 Commodity revenue - 1,075,525 1,075,525 - 1,109,854
Changes in assets and liabilities: Accounts receivable - - (1,105,277) (1,105,277) (139,769) Inventories - - 86,391 86,391 63,489 Prepaids - - 15 15 (110) Accounts payable - - 381 381 (8,549) Accrued liabilities - - 81,302 81,302 154,812 Unearned revenue - - (50,186) (50,186) (26,858)
Total adjustments 106,390 1,181,915 194,328 (987,587) 1,256,554
Net cash (used) by operations $ (10,200,486) $ (10,200,486) $ (11,172,356) $ (971,870) $ (10,034,296)
2009 BUDGET 2009
(WITH COMPARATIVE ACTUAL AMOUNTS FOR THE YEAR ENDED JUNE 30, 2008)
WASHOE COUNTY SCHOOL DISTRICTNUTRITION SERVICES ENTERPRISE FUND
SCHEDULE OF CASH FLOWS - BUDGET AND ACTUALFOR THE YEAR ENDED JUNE 30, 2009
135

Internal Service Funds To account for transactions relating to risk management services provided to other departments of the District on a cost reimbursement basis. The funds in this category are: Insurance Fund – Property and Casualty: To account for the self-insured property and casualty costs of the District. Insurance Fund – Health Insurance: To account for the self-insured health benefit costs of District employees. Insurance Fund – Workers’ Compensation: To account for the self-insured workers’ compensation costs of the District.

INSURANCE INSURANCE INSURANCEFUND FUND FUND
(PROPERTY (HEALTH (WORKERS'CASUALTY) INSURANCE) COMPENSATION) TOTAL
ASSETS Current assets
Cash and Investments $ 8,051,337 $ 30,998,714 $ 10,472,914 $ 49,522,965 Accounts receivable - 427,403 - 427,403 Interest receivable 2,418 8,124 3,078 13,620
Total current assets 8,053,755 31,434,241 10,475,992 49,963,988
Capital assetsMachinery and equipment 5,295 - - 5,295 Less: Allowance for depreciation (265) - - (265)
Total capital assets 5,030 - - 5,030
Total assets 8,058,785 31,434,241 10,475,992 49,969,018
LIABILITIES Current liabilities
Accounts payable 133,405 11,303 6,378 151,086 Accrued liabilities 78,656 20,521 4,374 103,551 Pending claims 1,171,842 7,910,574 1,536,864 10,619,280
Total current liabilities 1,383,903 7,942,398 1,547,616 10,873,917
Noncurrent liabilities Pending claims 1,437,158 - 3,010,136 4,447,294
Total liabilities 2,821,061 7,942,398 4,557,752 15,321,211
NET ASSETSInvested in capital assets 5,030 - - 5,030 Unrestricted 5,232,694 23,491,843 5,918,240 34,642,777
Total net assets $ 5,237,724 $ 23,491,843 $ 5,918,240 $ 34,647,807
WASHOE COUNTY SCHOOL DISTRICTINTERNAL SERVICE FUNDS
COMBINING STATEMENT OF NET ASSETSJUNE 30, 2009
136
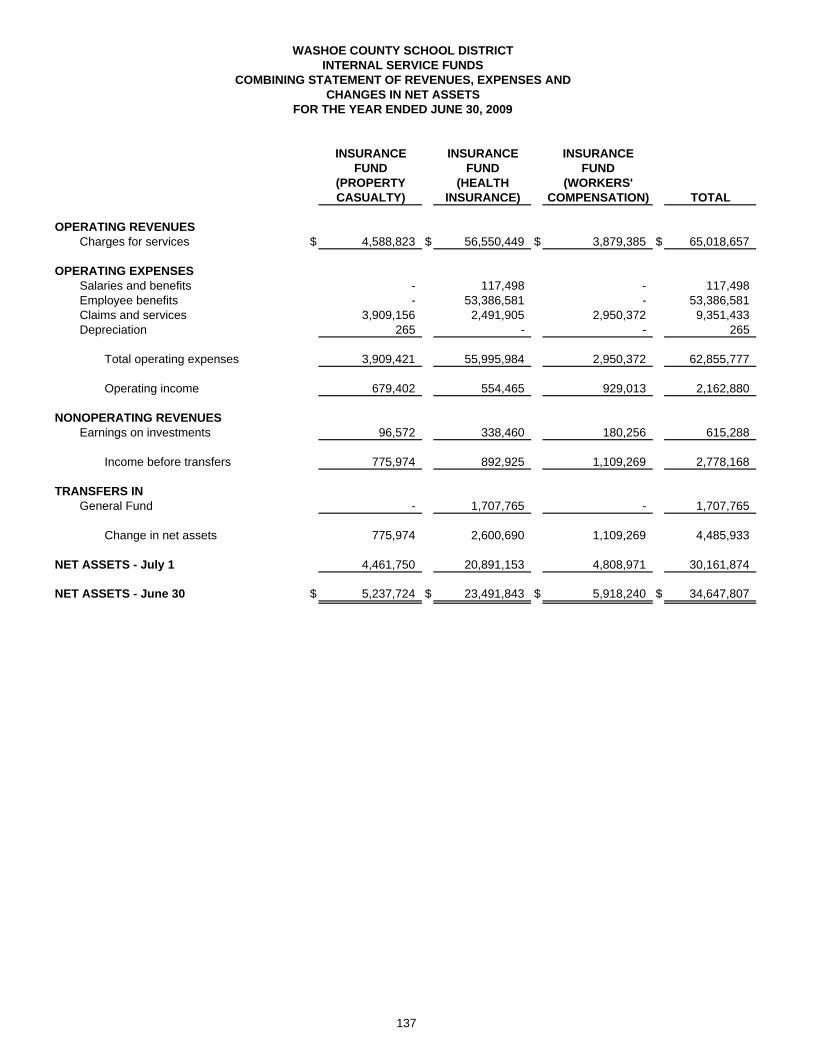
INSURANCE INSURANCE INSURANCEFUND FUND FUND
(PROPERTY (HEALTH (WORKERS'CASUALTY) INSURANCE) COMPENSATION) TOTAL
OPERATING REVENUESCharges for services $ 4,588,823 $ 56,550,449 $ 3,879,385 $ 65,018,657
OPERATING EXPENSESSalaries and benefits - 117,498 - 117,498 Employee benefits - 53,386,581 - 53,386,581 Claims and services 3,909,156 2,491,905 2,950,372 9,351,433 Depreciation 265 - - 265
Total operating expenses 3,909,421 55,995,984 2,950,372 62,855,777
Operating income 679,402 554,465 929,013 2,162,880
NONOPERATING REVENUESEarnings on investments 96,572 338,460 180,256 615,288
Income before transfers 775,974 892,925 1,109,269 2,778,168
TRANSFERS IN General Fund - 1,707,765 - 1,707,765
Change in net assets 775,974 2,600,690 1,109,269 4,485,933
NET ASSETS - July 1 4,461,750 20,891,153 4,808,971 30,161,874
NET ASSETS - June 30 $ 5,237,724 $ 23,491,843 $ 5,918,240 $ 34,647,807
CHANGES IN NET ASSETSFOR THE YEAR ENDED JUNE 30, 2009
WASHOE COUNTY SCHOOL DISTRICTINTERNAL SERVICE FUNDS
COMBINING STATEMENT OF REVENUES, EXPENSES AND
137

INSURANCE INSURANCE INSURANCEFUND FUND FUND
(PROPERTY (HEALTH (WORKERS'CASUALTY) INSURANCE) COMPENSATION) TOTAL
INCREASE (DECREASE) IN CASH AND INVESTMENTS Cash flows from operating activities Cash received for services $ 4,600,211 $ 56,752,924 $ 3,848,225 $ 65,201,360 Cash paid for salaries and benefits - (117,498) - (117,498) Cash payments for employee benefits - (53,386,581) - (53,386,581) Cash payments for claims and services (4,010,364) (1,729,400) (2,417,834) (8,157,598)
Net cash provided by operating activities 589,847 1,519,445 1,430,391 3,539,683
Cash flows from capital and related financing activities Purchase of equipment (5,295) - - (5,295)
Cash flows from noncapital financing activities: Transfer from General Fund - 1,707,765 - 1,707,765
Cash flows from investing activities Interest received on investments 96,572 338,460 180,256 615,288
Net increase in cash and cash equivalents 681,124 3,565,670 1,610,647 5,857,441
Cash and investments, July 1 7,370,213 27,433,044 8,862,267 43,665,524
Cash and investments, June 30 $ 8,051,337 $ 30,998,714 $ 10,472,914 $ 49,522,965
RECONCILIATION OF OPERATING INCOME TO NET CASH PROVIDED BY OPERATIONS
Operating income $ 679,402 $ 554,465 $ 929,013 $ 2,162,880
Adjustments to reconcile operating income to net cash provided by operations Depreciation 265 - - 265
Changes in assets and liabilities Accounts receivable 11,388 202,482 13,045 226,915 Accounts payable (93,073) 3,908 6,332 (82,833) Accrued liabilities 62,865 5,781 3,206 71,852 Pending claims (71,000) 752,816 523,000 1,204,816 Unearned revenue - (7) (44,205) (44,212)
Total adjustments (89,555) 964,980 501,378 1,376,803
Net cash provided by operations $ 589,847 $ 1,519,445 $ 1,430,391 $ 3,539,683
WASHOE COUNTY SCHOOL DISTRICTINTERNAL SERVICE FUNDS
COMBINING STATEMENT OF CASH FLOWSFOR THE YEAR ENDED JUNE 30, 2009
138

2008VARIANCE TO
ORIGINAL FINAL ACTUAL FINAL BUDGET ACTUAL
OPERATING REVENUESCharges for services $ 4,624,881 $ 4,624,881 $ 3,822,713 $ (802,168) $ 4,206,126 Refunds - - 766,110 766,110 5,275
Operating revenues 4,624,881 4,624,881 4,588,823 (36,058) 4,211,401
OPERATING EXPENSESGeneral government
Claims and services 4,716,406 4,716,406 3,909,156 807,250 3,006,303 Depreciation - - 265 (265) -
Total operating expenses 4,716,406 4,716,406 3,909,421 806,985 3,006,303
Operating income (loss) (91,525) (91,525) 679,402 770,927 1,205,098
NONOPERATING REVENUESEarnings on investments 100,000 100,000 96,572 (3,428) 225,883
Change in net assets 8,475 8,475 775,974 767,499 1,430,981
NET ASSETS - July 1 3,328,050 3,328,050 4,461,750 1,133,700 3,030,769
NET ASSETS - June 30 $ 3,336,525 $ 3,336,525 $ 5,237,724 $ 1,901,199 $ 4,461,750
(WITH COMPARATIVE ACTUAL AMOUNTS FOR THE YEAR ENDED JUNE 30, 2008)FOR THE YEAR ENDED JUNE 30, 2009
WASHOE COUNTY SCHOOL DISTRICT
SCHEDULE OF REVENUES, EXPENSES ANDCHANGES IN NET ASSETS- BUDGET AND ACTUAL
INSURANCE FUND - PROPERTY AND CASUALTY
2009 BUDGET 2009
139

WASHOE COUNTY SCHOOL DISTRICTINSURANCE FUND - PROPERTY AND CASUALTY
2008VARIANCE TO
ORIGINAL FINAL ACTUAL FINAL BUDGET ACTUAL
INCREASE (DECREASE) IN CASH AND INVESTMENTS Cash flows from operating activities Cash received for services $ 4,624,881 $ 4,624,881 $ 4,600,211 $ (24,670) $ 4,223,490 Cash payments for claims and services (4,231,508) (4,231,508) (4,010,364) 221,144 (3,135,189)
Net cash provided by operating activities 393,373 393,373 589,847 196,474 1,088,301
Cash flows from capital and related financing activities Purchase of equipment - - (5,295) (5,295) -
Cash flows from investing activities Interest received on investments 100,000 100,000 96,572 (3,428) 225,883
Net increase in cash and cash equivalents 493,373 493,373 681,124 187,751 1,314,184
Cash and investments, July 1 - - 7,370,213 7,370,213 6,056,029
Cash and investments, June 30 $ 493,373 $ 493,373 $ 8,051,337 $ 7,557,964 $ 7,370,213
RECONCILIATION OF OPERATING INCOME (LOSS) TO NET CASH PROVIDED BY OPERATIONS
Operating income (loss) $ (91,525) $ (91,525) $ 679,402 $ 770,927 $ 1,205,098
Adjustments to reconcile operating income (loss) to net cash provided by operations Depreciation - - 265 - -
Changes in assets and liabilities Accounts receivable - - 11,388 11,388 12,089 Accounts payable - - (93,073) (93,073) 184,546 Accrued liabilities - - 62,865 62,865 (182,432) Pending claims 484,898 484,898 (71,000) (555,898) (131,000)
Total adjustments 484,898 484,898 (89,555) (574,453) (116,797)
Net cash provided by operations $ 393,373 $ 393,373 $ 589,847 $ 196,474 $ 1,088,301
20092009 BUDGET
SCHEDULE OF CASH FLOWS - BUDGET AND ACTUALFOR THE YEAR ENDED JUNE 30, 2009
(WITH COMPARATIVE ACTUAL AMOUNTS FOR THE YEAR ENDED JUNE 30, 2008)
140

WASHOE COUNTY SCHOOL DISTRICTINSURANCE FUND - HEALTH INSURANCE
SCHEDULE OF REVENUES, EXPENSES ANDCHANGES IN NET ASSETS - BUDGET AND ACTUAL
2008VARIANCE TO
ORIGINAL FINAL ACTUAL FINAL BUDGET ACTUAL
OPERATING REVENUESCharges for services $ 59,562,991 $ 59,562,991 $ 56,550,449 $ (3,012,542) $ 52,472,831
OPERATING EXPENSESGeneral government
Salaries and benefits 48,184 48,184 117,498 (69,314) 61,677 Employee benefits 57,170,950 57,170,950 53,386,581 3,784,369 49,320,575 Services and supplies 3,806,137 3,806,137 2,491,905 1,314,232 2,466,388
Total operating expenses 61,025,271 61,025,271 55,995,984 5,029,287 51,848,640
Operating income (loss) (1,462,280) (1,462,280) 554,465 2,016,745 624,191
NONOPERATING REVENUESEarnings on investments 958,196 958,196 338,460 (619,736) 835,364
Income (loss) before transfers (504,084) (504,084) 892,925 1,397,009 1,459,555
TRANSFERS IN General fund 1,707,765 1,707,765 1,707,765 - 2,046,612
Change in net assets 1,203,681 1,203,681 2,600,690 1,397,009 3,506,167
NET ASSETS - July 1 21,416,641 21,416,641 20,891,153 (525,488) 17,384,986
NET ASSETS - June 30 $ 22,620,322 $ 22,620,322 $ 23,491,843 $ 871,521 $ 20,891,153
FOR THE YEAR ENDED JUNE 30, 2009(WITH COMPARATIVE ACTUAL AMOUNTS FOR THE YEAR ENDED JUNE 30, 2008)
2009 BUDGET 2009
141

WASHOE COUNTY SCHOOL DISTRICTINSURANCE FUND - HEALTH INSURANCE
SCHEDULE OF CASH FLOWS - BUDGET AND ACTUAL
2008VARIANCE TO
ORIGINAL FINAL ACTUAL FINAL BUDGET ACTUAL
INCREASE (DECREASE) IN CASH AND INVESTMENTS Cash flows from operating activities Cash received for services $ 59,562,991 $ 59,562,991 $ 56,752,924 $ (2,810,067) $ 52,100,530 Cash paid for salaries (48,184) (48,184) (117,498) (69,314) (61,677) Cash payments for employee benefits (56,328,509) (56,328,509) (53,386,581) 2,941,928 (49,320,575) Cash payments for services and supplies (3,806,137) (3,806,137) (1,729,400) 2,076,737 (1,582,013)
Net cash provided (used) by operating activities (619,839) (619,839) 1,519,445 2,139,284 1,136,265
Cash flows from noncapital financing activities Transfer from General Fund 1,707,765 1,707,765 1,707,765 - 2,046,612
Cash flows from investing activities Interest received on investments 958,196 958,196 338,460 (619,736) 835,364
Net increase in cash and cash equivalents 2,046,122 2,046,122 3,565,670 1,519,548 4,018,241
Cash and investments, July 1 27,433,044 27,433,044 27,433,044 - 23,414,803
Cash and investments, June 30 $ 29,479,166 $ 29,479,166 $ 30,998,714 $ 1,519,548 $ 27,433,044
RECONCILIATION OF OPERATING INCOME (LOSS) TO NET CASH PROVIDED (USED) BY OPERATIONS
Operating income (loss) $ (1,462,280) $ (1,462,280) $ 554,465 $ 2,016,745 $ 624,191
Adjustments to reconcile operating income (loss) to net cash provided (used) by operations
Changes in assets and liabilities Accounts receivable - - 202,482 202,482 (372,248) Accounts payable - - 3,908 3,908 (14,479) Accrued liabilities - - 5,781 5,781 9,259 Pending claims 842,441 842,441 752,816 (89,625) 889,595 Unearned revenue - - (7) (7) (53)
Total adjustments 842,441 842,441 964,980 122,539 512,074
Net cash provided (used) by operations $ (619,839) $ (619,839) $ 1,519,445 $ 2,139,284 $ 1,136,265
FOR THE YEAR ENDED JUNE 30, 2009(WITH COMPARATIVE ACTUAL AMOUNTS FOR THE YEAR ENDED JUNE 30, 2008)
2009 BUDGET 2009
142

WASHOE COUNTY SCHOOL DISTRICTINSURANCE FUND - WORKERS' COMPENSATION
SCHEDULE OF REVENUES, EXPENSES ANDCHANGES IN NET ASSETS - BUDGET AND ACTUAL
2008VARIANCE TO
ORIGINAL FINAL ACTUAL FINAL BUDGET ACTUAL
OPERATING REVENUESCharges for services $ 3,470,233 $ 3,470,233 $ 3,879,385 $ 409,152 $ 3,303,842
OPERATING EXPENSESGeneral government
Claims and services 3,479,226 3,479,226 2,950,372 528,854 3,292,369
Operating income (loss) (8,993) (8,993) 929,013 938,006 11,473
NONOPERATING REVENUESEarnings on investments 200,000 200,000 180,256 (19,744) 293,430
Change in net assets 191,007 191,007 1,109,269 918,262 304,903
NET ASSETS - July 1 5,272,332 5,272,332 4,808,971 (463,361) 4,504,068
NET ASSETS - June 30 $ 5,463,339 $ 5,463,339 $ 5,918,240 $ 454,901 $ 4,808,971
FOR THE YEAR ENDED JUNE 30, 2009(WITH COMPARATIVE ACTUAL AMOUNTS FOR THE YEAR ENDED JUNE 30, 2008)
2009 BUDGET 2009
143

WASHOE COUNTY SCHOOL DISTRICTINSURANCE FUND - WORKERS' COMPENSATION
SCHEDULE OF CASH FLOWS - BUDGET AND ACTUAL
2008VARIANCE TO
ORIGINAL FINAL ACTUAL FINAL BUDGET ACTUAL
INCREASE IN CASH AND INVESTMENTS Cash flows from operating activities Cash received for services $ 3,470,233 $ 3,470,233 $ 3,848,225 $ 377,992 $ 3,353,026 Payments for claims and services (2,867,196) (2,867,196) (2,417,834) 449,362 (2,825,571)
Net cash provided by operating activities 603,037 603,037 1,430,391 827,354 527,455
Cash flows from investing activities Interest received on investments 200,000 200,000 180,256 (19,744) 293,430
Net increase in cash and cash equivalents 803,037 803,037 1,610,647 807,610 820,885
Cash and investments, July 1 8,862,267 8,862,267 8,862,267 - 8,041,382
Cash and investments, June 30 $ 9,665,304 $ 9,665,304 $ 10,472,914 $ 807,610 $ 8,862,267
RECONCILIATION OF OPERATING INCOME (LOSS) TO NET CASH PROVIDED BY OPERATIONS
Operating income (loss) $ (8,993) $ (8,993) $ 929,013 $ 938,006 $ 11,473
Adjustments to reconcile operating income (loss) to net cash provided by operations
Changes in assets and liabilities Accounts receivable - - 13,045 13,045 4,979 Accounts payable - - 6,332 6,332 (376) Accrued liabilities - - 3,206 3,206 (8,826) Pending claims 612,030 612,030 523,000 (89,030) 476,000 Unearned revenue - - (44,205) (44,205) 44,205
Total adjustments 612,030 612,030 501,378 (110,652) 515,982
Net cash provided by operations $ 603,037 $ 603,037 $ 1,430,391 $ 827,354 $ 527,455
FOR THE YEAR ENDED JUNE 30, 2009(WITH COMPARATIVE ACTUAL AMOUNTS FOR THE YEAR ENDED JUNE 30, 2008)
2009 BUDGET 2009
144

Fiduciary Funds To account for activities in which the District acts in a trustee capacity or as an agent for individuals, private organizations, other governments, and/or other funds. Agency funds are custodial in nature (assets equal liabilities) and do not involve measurement of results of operations. Individual funds include the following: Other Post-Employment Benefits (OPEB) Trust Fund: To account for funds used to pay for healthcare and life insurance costs for qualified District retirees. Agency Funds: Student Activities Fund: To account for student activity funds under the control of the respective schools in the District. 80/5 Plan Fund: To account for employee contributions to the District’s 80/5 Plan. NIAA Fund: To account for transactions related to the statewide Nevada Interscholastic Athletic Association.

2009 2008ASSETS
Cash and investments $ 13,034,638 $ 7,846,895 Interest receivable - 1,983
Total assets 13,034,638 7,848,878
NET ASSETS HELD IN TRUST FOR OPEB $ 13,034,638 $ 7,848,878
(WITH COMPARATIVE TOTALS FOR JUNE 30, 2008)
WASHOE COUNTY SCHOOL DISTRICTOTHER POSTEMPLOYMENT BENEFITS (OPEB) TRUST FUND
STATEMENT OF PLAN NET ASSETSJUNE 30, 2009
145

2008VARIANCE TO
ORIGINAL FINAL ACTUAL FINAL BUDGET ACTUAL
ADDITIONSContributions by employer $ - $ - $ 6,500,000 $ 6,500,000 $ 7,846,303 Earnings on investments - - 1,007,001 1,007,001 2,575 Adjustment to fair market value - - (2,321,241) (2,321,241) -
Total additions - - 5,185,760 5,185,760 7,848,878
NET ASSETS - July 1 - - 7,848,878 7,848,878 -
NET ASSETS - June 30 $ - $ - $ 13,034,638 $ 13,034,638 $ 7,848,878
(WITH COMPARATIVE TOTALS FOR JUNE 30, 2008)
2009 BUDGET 2009
WASHOE COUNTY SCHOOL DISTRICTOTHER POSTEMPLOYMENT BENEFITS (OPEB) TRUST FUND
SCHEDULE OF CHANGES IN PLAN NET ASSETSFOR THE YEAR ENDED JUNE 30, 2009
146

WASHOE COUNTY SCHOOL DISTRICTAGENCY FUNDS
COMBINING STATEMENT OF CHANGES IN ASSETS AND LIABILITIESFOR THE YEAR ENDED JUNE 30, 2009
JULY 1, 2008 ADDITIONS DEDUCTIONS JUNE 30, 2009
Student Activities
ASSETS Cash and investments $ 8,300,385 $ 15,839,634 $ 16,083,289 $ 8,056,730
LIABILITIES Due to student groups $ 8,300,385 $ 15,839,634 $ 16,083,289 $ 8,056,730
80/5 Salary Plan
ASSETS Cash and investments $ 362,413 $ 51,086 $ 256,970 $ 156,529
LIABILITIES Accrued liabilities $ 362,413 $ 51,086 $ 256,970 $ 156,529
Nevada Interscholastic Athletic Association
ASSETS Cash and investments $ 2,623 $ - $ 2,623 $ - Accounts receivable 16,800 44,964 16,800 44,964 Total assets $ 19,423 $ 44,964 $ 19,423 $ 44,964
.LIABILITIES Accounts payable $ 2,108 $ 18,348 $ 2,108 $ 18,348 Accrued liabilities 17,315 26,616 17,315 26,616 Total liabilities $ 19,423 $ 44,964 $ 19,423 $ 44,964
Totals - All Agency Funds
ASSETS Cash and investments $ 8,665,421 $ 15,890,720 $ 16,342,882 $ 8,213,259 Accounts receivable 16,800 44,964 16,800 44,964
Total assets $ 8,682,221 $ 15,935,684 $ 16,359,682 $ 8,258,223
LIABILITIES Accounts payable $ 2,108 $ 18,348 $ 2,108 $ 18,348 Accrued liabilities 379,728 77,702 274,285 183,145 Due to student groups 8,300,385 15,839,634 16,083,289 8,056,730
Total liabilities $ 8,682,221 $ 15,935,684 $ 16,359,682 $ 8,258,223
147

BALANCE BALANCESCHOOLS JULY 1, 2008 ADDITIONS DEDUCTIONS JUNE 30, 2009
ELEMENTARY SCHOOLSAllen $ 13,526 $ 51,623 $ 53,731 $ 11,418 Anderson 18,185 30,348 28,733 19,800 Beasley 25,741 74,564 73,669 26,636 Beck 13,443 83,101 88,844 7,700 Bennett 42,586 67,956 96,891 13,651 Booth 73,952 46,765 46,177 74,540 Brown 57,578 80,471 80,926 57,123 Cannan 49,161 55,128 61,698 42,591 Caughlin Ranch 30,019 85,130 91,827 23,322 Corbett 31,529 33,201 34,557 30,173 Desert Heights 44,567 57,973 58,244 44,296 Diedrichsen 16,177 63,852 52,238 27,791 Dodson 19,619 27,962 33,343 14,238 Donner Springs 22,668 100,057 100,989 21,736 Double Diamond 51,748 148,400 121,824 78,324 Drake 20,140 21,082 24,015 17,207 Duncan ** 35,053 48,117 47,474 35,696 Dunn 15,402 41,013 40,579 15,836 Elmcrest 9,730 25,507 25,582 9,655 Gomes 53,355 91,966 88,570 56,751 Gomm ** 9,855 169,004 156,549 22,310 Greenbrae 34,822 60,247 72,333 22,736 Hall ** 23,754 66,937 69,143 21,548 Hidden Valley ** 14,400 37,651 38,028 14,023 Huffaker 32,623 146,161 158,657 20,127 Hunsberger 42,564 168,121 162,921 47,764 Hunter Lake 27,288 58,853 62,633 23,508 Incline ** 37,311 98,041 89,096 46,256 Juniper 21,142 86,974 83,077 25,039 Lemmon Valley ** 19,324 82,690 94,520 7,494 Lenz 35,948 91,843 95,862 31,929 Lincoln Park 30,798 49,270 40,748 39,320 Loder 14,574 19,548 23,430 10,692 Mathews 44,320 36,063 51,789 28,594 Maxwell 31,389 45,110 31,104 45,395 Melton 66,349 181,542 164,554 83,337 Mitchell 13,972 31,920 27,272 18,620 Moss ** 17,187 61,408 43,951 34,644 Mount Rose 13,993 29,637 29,614 14,016 Natchez 24,030 18,119 22,800 19,349 Palmer ** 31,598 75,210 69,687 37,121 Peavine 36,318 24,932 32,543 28,707 Picollo 93,592 58,280 94,975 56,897 Pleasant Valley 36,504 85,812 89,280 33,036 Risley 33,098 32,709 33,500 32,307 Sepulveda 24,021 136,072 120,282 39,811 Sierra Vista 2,188 18,786 20,248 726 Silver Lake 53,458 71,333 65,613 59,178 Smith, Alice 62,701 59,877 62,907 59,671 Smith, Kate 16,939 18,535 19,944 15,530 Smithridge 52,503 31,725 35,762 48,466 Spanish Springs 59,814 237,069 232,151 64,732 Stead 46,315 62,262 51,970 56,607 Sun Valley 20,775 34,136 36,810 18,101 Taylor 25,414 172,088 171,127 26,375 Towles 6,644 33,049 31,195 8,498
(CONTINUED)
WASHOE COUNTY SCHOOL DISTRICT
SCHEDULE OF CASH RECEIPTS AND DISBURSEMENTSFOR THE YEAR ENDED JUNE 30, 2009
STUDENT ACTIVITY FUNDS
148

BALANCE BALANCESCHOOLS JULY 1, 2008 ADDITIONS DEDUCTIONS JUNE 30, 2009
WASHOE COUNTY SCHOOL DISTRICT
SCHEDULE OF CASH RECEIPTS AND DISBURSEMENTSFOR THE YEAR ENDED JUNE 30, 2009
STUDENT ACTIVITY FUNDS
ELEMENTARY SCHOOLS (CONTINUED)Van Gorder $ 19,256 $ 126,143 $ 136,707 $ 8,692 Verdi 7,761 45,146 37,432 15,475 Veterans ** 14,004 54,906 40,183 28,727 Warner 29,425 44,579 34,179 39,825 Westergard 31,966 159,960 140,197 51,729 Whitehead 30,114 76,810 77,810 29,114 Winnemucca ** 24,610 155,686 154,209 26,087
Total elementary schools 1,958,840 4,588,460 4,556,703 1,990,597
MIDDLE SCHOOLSBillinghurst 91,230 217,699 246,446 62,483 Clayton 78,027 106,625 90,610 94,042 Cold Springs 53,997 171,501 158,440 67,058 Dilworth 42,327 93,718 86,215 49,830 Incline 72,812 53,894 53,736 72,970 Mendive 104,968 139,558 167,770 76,756 O'Brien 49,132 123,136 115,520 56,748 Pine 120,479 193,443 185,366 128,556 Shaw 61,647 176,971 166,550 72,068 Sparks 57,862 150,331 157,121 51,072 Swope 54,740 215,497 210,073 60,164 Traner 19,320 57,422 53,471 23,271 Vaughn 28,339 69,394 77,107 20,626
Total middle schools 834,880 1,769,189 1,768,425 835,644
HIGH SCHOOLSAcademy of Arts, Careers & Tech 74,012 197,262 163,013 108,261 Damonte Ranch 532,100 891,104 875,014 548,190 Galena 554,935 1,089,721 1,090,432 554,224 Gerlach (1) 43,880 53,223 57,003 40,100 Hug 168,222 332,544 323,333 177,433 Incline ** 364,549 295,470 456,432 203,587 McQueen 683,187 1,409,871 1,453,319 639,739 North Valleys 432,723 522,128 554,508 400,343 Reed 364,214 1,206,983 1,175,341 395,856 Reno ** 824,037 1,332,316 1,454,151 702,202 Spanish Springs 565,377 929,174 869,374 625,177 Sparks 348,780 418,536 463,742 303,574 TMCC 54,948 38,671 43,502 50,117 Washoe 172,224 90,989 105,790 157,423 Wooster 320,517 621,408 634,542 307,383
Total high schools 5,503,705 9,429,400 9,719,496 5,213,609
OTHERAdministration Building 201 5,346 4,438 1,109 Gifted and Talented 1,061 32,081 21,989 11,153 Transportation Employee Fund 1,698 15,158 12,238 4,618
Total other funds 2,960 52,585 38,665 16,880
TOTALS $ 8,300,385 $ 15,839,634 $ 16,083,289 $ 8,056,730
(1) Includes E.M. Johnson Elementary ** Audited by Internal Audit
149

Capital Assets Governmental Funds Schedules of sources, functions and activities of capital assets used in the operation of governmental funds.

2009 2008
Governmental funds capital assets:Land $ 37,359,073 $ 37,030,472 Buildings 645,529,363 629,660,141 Improvements other than buildings 17,547,868 10,182,196 Machinery and equipment 52,181,596 49,322,620 Construction in progress 71,029,583 24,728,594
Total governmental funds capital assets $ 823,647,483 $ 750,924,023
Investments in governmental funds capital assets by source:General fund $ 153,612,517 $ 152,734,649 Special revenue funds 5,944,979 5,884,483 Capital projects funds 662,860,665 591,437,020 Donations 1,229,322 867,871
Total governmental funds capital assets $ 823,647,483 $ 750,924,023
This schedule presents only the capital asset balances related to the governmental funds. Accordingly the capital assetsreported in the internal service funds and the enterprise fund are excluded from the above amounts. Generally, the capitalassets of internal service funds are included as governmental activities in the statement of net assets. The capital assetsof the enterprise fund are reported separately under business-type activities.
(WITH COMPARATIVE TOTALS FOR JUNE 30,2008)
WASHOE COUNTY SCHOOL DISTRICTCAPITAL ASSETS USED IN THE OPERATION OF GOVERNMENTAL FUNDS
SCHEDULE BY SOURCEJUNE 30, 2009
150

IMPROVEMENTS MACHINERY CONSTRUCTIONOTHER THAN AND IN
LAND BUILDINGS BUILDINGS EQUIPMENT PROGRESS TOTAL
General government:
Instruction $ 131,639 $ 253,565 $ 117,353 $ 7,292,803 $ - $ 7,795,360
Student support - - - 985,320 - 985,320
Instructional staff support - - - 713,414 - 713,414
General administration - - - 279,697 - 279,697
School administration - - - 43,779 - 43,779
151 Business administration - - - 959,688 1,249,629 2,209,317
Operation / maintenance - 9,924,637 - 2,197,400 - 12,122,037
Student transportation - - - 25,896,066 - 25,896,066
Central support - - - 1,797,741 60,970 1,858,711
Other support - - - 50,004 - 50,004
Community service operations - - - 12,779 - 12,779
Facilities 37,227,434 635,351,161 17,430,515 11,952,905 69,718,984 771,680,999
Total governmental funds capital assets $ 37,359,073 $ 645,529,363 $ 17,547,868 $ 52,181,596 $ 71,029,583 $ 823,647,483
This schedule presents only the capital asset balances related to the governmental funds. Accordingly the capital assetsreported in the internal service funds are excluded from the above amounts. Generally, the capital assets on internalservice funds are included as governmental activities in the statement of net assets. The capital assets of the enterprise fund are reported separately under business-type activities.
FUNCTION AND ACTIVITY
WASHOE COUNTY SCHOOL DISTRICTCAPITAL ASSETS USED IN THE OPERATION OF GOVERNMENTAL FUNDS
JUNE 30, 2009SCHEDULE BY FUNCTION AND ACTIVITY

GOVERNMENTAL GOVERNMENTALFUNDS CAPITAL FUNDS CAPITAL
ASSETS ASSETSJULY 1, 2008 ADDITIONS DEDUCTIONS JUNE 30, 2009
General Government:
Instruction $ 7,898,623 $ 89,339 $ 192,602 $ 7,795,360
Student support 928,289 57,031 - 985,320
Instructional staff support 704,941 15,274 6,801 713,414
General administration 266,749 20,450 7,502 279,697
152 School administration 43,779 - - 43,779
Business administration 2,093,040 116,277 - 2,209,317
Operation and maintenance 11,749,084 406,553 33,600 12,122,037
Student transportation 25,979,062 35,995 118,991 25,896,066
Central support 1,883,323 56,587 81,199 1,858,711
Other support 37,054 12,950 - 50,004
Community services operations 12,779 - - 12,779
Facilities 699,327,300 72,432,194 78,495 771,680,999
Total governmental funds capital assets $ 750,924,023 $ 73,242,650 $ 519,190 $ 823,647,483
This schedule presents only the capital asset balances related to the governmental funds. Accordingly the capital assetsreported in the internal service funds are excluded from the above amounts. Generally, the capital assets on internalservice funds are included as governmental activities in the statement of net assets. The capital assets of the enterprise fund are reported separately under business-type activities.
FUNCTION AND ACTIVITY
WASHOE COUNTY SCHOOL DISTRICTCAPITAL ASSETS USED IN THE OPERATION OF GOVERNMENTAL FUNDS
FOR THE YEAR ENDED JUNE 30, 2009SCHEDULE OF CHANGES BY FUNCTION AND ACTIVITY

StatisticalSection
ComprehensiveAnnual
Financial Report

Statistical Section This section presents detailed information as a context for understanding what the information in the financial statements, note disclosures and required supplementary information says about the District’s overall financial health. Tables Financial Trends 1.1 – 1.5 Trend information to assist in the understanding of how the District’s financial performance and well- being have changed over time. Revenue Capacity 2.1 – 2.5 Information to assist in the understanding of the District’s most significant local revenue sources, property taxes (ad valorem). Debt Capacity 3.1 – 3.3 Information assessing the affordability of the District’s current levels of outstanding debt and the ability to issue additional debt in the future. Demographic and Economic Information 4.1 – 4.2 Indicators to assist in understanding the environment within which the District’s financial activities take place. Operating Information 5.1 – 5.4 Service and infrastructure data to assist in understanding how the information in the District’s financial report relates to the services and activities provided. Sources: Unless otherwise noted, the information in these tables is derived from the Comprehensive Financial Report for the relevant year.

2002 2003 2004
Governmental activitiesInvested in capital assets, net of related debt $ 99,715,396 $ 103,275,042 $ 116,714,931 Restricted 39,073,756 51,061,565 48,091,851 Unrestricted (14,392,899) (10,712,992) 927,744
Total governmental activities net assets $ 124,396,253 $ 143,623,615 $ 165,734,526
Business-type activitiesInvested in capital assets $ - $ - $ - Unrestricted - - -
Total business-type activities net assets $ - $ - $ -
Primary governmentInvested in capital assets, net of related debt $ 99,715,396 $ 103,275,042 $ 116,714,931 Restricted 39,073,756 51,061,565 48,091,851 Unrestricted (14,392,899) (10,712,992) 927,744
Total primary government net assets $ 124,396,253 $ 143,623,615 $ 165,734,526
NOTE: FY 2001-02 is the first year that District costs have been presented under GASB 34 guidelines. As such, prior years' data in this format is not available.
Source: Washoe County School District Business Office
Fiscal Year Ended June 30,
Washoe County School DistrictNet Assets by Component
Last Eight Fiscal Years(accrual basis of accounting)
153

Table 1.1
2005 2006 2007 2008 2009
$ 127,695,444 $ 136,809,928 $ 146,148,691 $ 162,631,890 $ 174,502,710 59,385,880 70,158,376 98,216,742 128,996,995 141,926,769 14,054,767 25,489,421 28,324,447 23,940,259 32,075,757
$ 201,136,091 $ 232,457,725 $ 272,689,880 $ 315,569,144 $ 348,505,236
$ - $ 542,397 $ 503,245 $ 404,802 $ 396,799 - 3,156,740 2,667,745 2,713,850 3,304,626
$ - $ 3,699,137 $ 3,170,990 $ 3,118,652 $ 3,701,425
$ 127,695,444 $ 137,352,325 $ 146,651,936 $ 163,036,692 $ 174,899,509 59,385,880 70,158,376 98,216,742 128,996,995 141,926,769 14,054,767 28,646,161 30,992,192 26,654,109 35,380,383
$ 201,136,091 $ 236,156,862 $ 275,860,870 $ 318,687,796 $ 352,206,661
154

2002 2003 2004Expenses
Governmental activities $ 383,012,581 $ 389,196,315 $ 416,910,616 Business-type activities - - -
Total primary government expenses $ 383,012,581 $ 389,196,315 $ 416,910,616
Program revenuesGovernmental activities:
Charges for services $ 7,679,075 $ 7,877,036 $ 7,820,959 Operating grants and contributions 68,176,805 71,314,386 75,489,897
Total governmental activities program revenu 75,855,880 79,191,422 83,310,856 Business-type activities:
Charges for services - - - Operating grants and contributions - - -
Total business-type activities revenues - - - Total primary government revenues $ 75,855,880 $ 79,191,422 $ 83,310,856
Net (expense)/revenueGovernmental activities $ (307,156,701) $ (310,004,893) $ (333,599,760) Business-type activities - - -
Total primary government net expense $ (307,156,701) $ (310,004,893) $ (333,599,760)
General revenues and other changes in net assetsGovernmental activities:
Taxes:Property taxes $ 102,617,739 $ 109,768,083 $ 117,819,676 Local school support taxes 112,258,067 116,959,363 128,565,040 Government service taxes 13,015,491 14,230,955 15,817,100 Other local sources 3,324,087 4,406,690 4,476,050 Unrestricted investment earnings 7,363,521 4,912,745 1,672,999
State aid not restricted to specific purposes 75,088,119 78,721,232 87,154,547 ARRA - State Fiscal Stabilization - - - Franchise Taxes 230,353 233,187 205,259
Total governmental activities 313,897,377 329,232,255 355,710,671 Business-type activities:
Transfers - - - Total business-type activities - - -
Total primary government revenues $ 313,897,377 $ 329,232,255 $ 355,710,671
Change in net assetsGovernmental activities $ 6,740,676 $ 19,227,362 $ 22,110,911 Business-type activities - - -
Total primary government $ 6,740,676 $ 19,227,362 $ 22,110,911
NOTE: FY 2001-02 is the first year that District costs have been presented under GASB 34 guidelines. As such, prior years' data in this format is not available.
Source: Washoe County School District Business Office
Washoe County School DistrictChanges in Net AssetsLast Eight Fiscal Years
(accrual basis of accounting)
Fiscal Year Ended June 30,
155

Table 1.2
2005 2006 2007 2008 2009
$ 444,912,093 $ 461,271,112 $ 502,120,005 $ 536,663,981 $ 563,895,863 - 15,603,133 16,973,722 18,028,995 17,334,964
$ 444,912,093 $ 476,874,245 $ 519,093,727 $ 554,692,976 $ 581,230,827
$ 8,314,770 $ 1,805,959 $ 2,215,979 $ 2,182,721 $ 1,796,750 86,721,909 86,523,775 105,380,311 98,800,969 105,300,822 95,036,679 88,329,734 107,596,290 100,983,690 107,097,572
- 6,945,811 6,870,401 6,738,145 5,968,280 - 9,313,397 9,575,174 10,988,512 11,949,457 - 16,259,208 16,445,575 17,726,657 17,917,737
$ 95,036,679 $ 104,588,942 $ 124,041,865 $ 118,710,347 $ 125,015,309
$ (349,875,414) $ (372,941,378) $ (394,523,715) $ (435,680,291) $ (456,798,291) - 656,075 (528,147) (302,338) 582,773
$ (349,875,414) $ (372,285,303) $ (395,051,862) $ (435,982,629) $ (456,215,518)
$ 126,044,207 $ 136,445,205 $ 150,413,632 $ 161,108,715 $ 170,321,918 145,056,434 161,027,372 156,893,557 153,328,703 120,369,201 17,260,710 18,277,143 18,677,186 18,297,902 16,643,570 5,297,089 6,610,442 6,040,636 6,502,756 7,608,186 5,789,233 7,304,748 10,277,185 13,687,934 9,476,546
85,542,351 77,280,007 92,147,678 125,171,400 143,080,662 - - - - 21,869,831
286,955 361,157 305,996 462,145 364,469 385,276,979 407,306,074 434,755,870 478,559,555 489,734,383
- - - 250,000 - - - 250,000 -
$ 385,276,979 $ 407,306,074 $ 434,755,870 $ 478,809,555 $ 489,734,383
$ 35,401,565 $ 34,364,696 $ 40,232,155 $ 42,879,264 $ 32,936,092 - 656,075 (528,147) (52,338) 582,773
$ 35,401,565 $ 35,020,771 $ 39,704,008 $ 42,826,926 $ 33,518,865
156

2000 2001 2002 2003
General fundReserved $ 6,828,924 $ 6,456,853 $ 2,917,834 $ 2,332,785 Unreserved 2,709,944 3,606,244 2,515,484 8,223,279
Total general fund $ 9,538,868 $ 10,063,097 $ 5,433,318 $ 10,556,064
All other governmental fundsReserved $ 84,998,102 $ 41,661,734 $ 75,152,558 $ 54,937,381 Unreserved reported in:
Special revenue funds (691,376) (448,548) 1,294,478 1,714,981 Capital projects funds 106,933,436 93,630,785 28,562,722 34,344,217
Total all other governmental funds $ 191,240,162 $ 134,843,971 $ 105,009,758 $ 90,996,579
Total governmental funds $ 200,779,030 $ 144,907,068 $ 110,443,076 $ 101,552,643
Fluctuations in all other governmental fund balance reserved and unreserved amounts primarily reflectfinancing, construction in progress and completion of large capital projects.
Source: Washoe County School District Business Office
Washoe County School DistrictFund Balances of Governmental Funds
Last Ten Fiscal Years(modified accrual basis of accounting)
Fiscal Year Ended June 30,
157

Table 1.3
2004 2005 2006 2007 2008 2009
$ 6,310,332 $ 1,955,639 $ 2,991,296 $ 2,896,595 $ 1,711,496 $ 3,624,998 12,600,229 22,681,321 28,909,898 34,864,420 46,515,636 53,180,043
$ 18,910,561 $ 24,636,960 $ 31,901,194 $ 37,761,015 $ 48,227,132 $ 56,805,041
$ 46,972,103 $ 76,987,832 $ 67,813,194 $ 66,760,281 $ 121,979,693 $ 103,186,619
4,475,704 7,022,230 9,953,987 14,959,439 14,286,646 11,089,587 63,947,633 93,283,119 54,227,357 109,248,946 82,927,717 77,107,155
$ 115,395,440 $ 177,293,181 $ 131,994,538 $ 190,968,666 $ 219,194,056 $ 191,383,361
$ 134,306,001 $ 201,930,141 $ 163,895,732 $ 228,729,681 $ 267,421,188 $ 248,188,402
158

2002 2003 2004
RevenuesLocal sources $ 245,902,508 $ 258,706,169 $ 277,758,436 State sources 115,513,083 117,830,448 125,302,983 Federal sources 26,831,858 31,007,808 35,131,347 Other sources 1,418,410 1,258,824 2,010
Total revenues 389,665,859 408,803,249 438,194,776
ExpendituresCurrent:
Regular programs 179,366,818 183,529,233 197,968,562 Special programs 29,938,441 31,741,223 34,842,293 Vocational programs 6,564,020 6,169,534 7,293,902 Other instructional programs 2,930,266 2,776,041 2,928,092 Adult education programs 1,090,042 1,420,058 1,369,039 Food service programs 12,576,917 13,507,772 14,009,635 Community service programs 701,908 762,200 813,387 Undistributed expenditures:
Student support 17,842,362 18,343,762 21,396,488 Instructional staff support 13,268,685 15,217,607 15,593,094 General administration 5,502,641 6,027,809 6,240,901 School administration 18,669,539 19,791,036 21,604,444 Business support 3,983,711 4,169,749 4,517,545 Operation and maintenance 35,762,338 33,181,675 34,592,121 Student transportation 12,142,202 12,635,127 12,717,685 Central support 4,678,884 4,900,142 6,235,573 Other support 167,506 332,299 189,113 Community service operations - - -
Capital outlayCapital outlay 40,212,360 53,318,529 36,588,795 Capital outlay below capitalization threshold 5,195,672 3,430,599 2,249,578
Debt service:Principal 20,028,992 22,144,229 23,392,727 Interest 19,892,555 16,422,095 19,474,379 Bond issuance costs - 898,612 693,292 Other 1,105,185 - 9,846
Total expenditures 431,621,044 450,719,331 464,720,491
Excess (deficiency) of revenues over expenditu (41,955,185) (41,916,082) (26,525,715)
Other financing sources (uses)Capital leases 3,945,569 259,770 6,914,598 Refunded capital leases 9,710,001 - - Refunding bonds Issued - - - Payments for refunded capital leases (5,959,017) (2,881,410) - Issuance of refunding bonds 46,939,230 68,940,000 11,820,000 Bonds issued - 36,000,000 55,000,000 Debt premiums - 6,925,688 1,112,967 Payments to refunded bonds escrow agent (46,707,069) (74,464,866) (12,011,244) Transfers in 19,020,755 20,201,851 24,167,589 Transfers out (20,549,591) (21,955,384) (27,904,837)
Total other financing sources (uses) 6,399,878 33,025,649 59,099,073
Net change in fund balances $ (35,555,307) $ (8,890,433) $ 32,573,358
Debt service as a percentage ofnon-capital expenditures 10.48% 9.93% 10.18%
Note: Information prior to 2001-02 not readily available
Source: Washoe County School District Business Office
Fiscal Year Ended June 30,
Washoe County School DistrictChanges in Fund Balances of Governmental Funds
Last Eight Fiscal Years(modified accrual basis of accounting)
159

Table 1.4
2005 2006 2007 2008 2009
$ 309,321,004 $ 332,242,387 $ 345,206,688 $ 357,047,961 $ 325,570,132 129,972,727 130,050,648 163,589,108 186,229,991 210,879,096
40,324,344 31,975,138 32,223,794 34,469,253 56,883,485 37,345 37,224 32,032 281,635 245,070
479,655,420 494,305,397 541,051,622 578,028,840 593,577,783
208,690,609 219,930,930 239,765,677 251,866,060 257,809,827 37,844,397 40,502,495 43,980,533 46,753,582 51,831,651
7,405,722 8,006,895 6,925,974 7,103,556 7,501,464 3,114,088 3,199,927 3,917,914 3,839,555 4,408,490 1,327,449 1,080,063 1,268,709 1,168,060 1,098,957
14,838,211 - - - - 793,625 642,275 854,566 940,823 938,856
25,956,643 27,771,224 28,350,002 32,776,708 35,069,594 16,027,761 18,305,324 21,286,332 24,379,737 24,911,810
6,743,167 7,208,768 8,248,281 9,757,193 10,223,323 22,993,010 24,818,064 26,307,853 30,212,368 31,600,900
6,222,427 6,881,421 7,615,662 7,513,245 8,235,684 37,737,291 41,985,686 45,666,518 47,596,337 50,598,979 19,047,410 16,801,178 19,067,657 23,660,180 20,516,229 7,945,677 7,454,621 8,514,475 9,172,717 10,148,553
132,307 16,851 217,113 238,840 315,279 - - - 275,219 229,920
18,261,546 84,238,853 21,753,919 39,965,163 73,219,024 799,093 2,793,185 6,964,292 3,525,626 10,358,602
25,720,391 26,553,319 29,302,637 32,277,384 32,747,389 19,156,006 20,881,655 20,276,179 22,752,490 24,035,406
547,149 1,710,989 511,796 351,480 629,331 13,738 12,325 14,900 14,351 11,698
481,317,717 560,796,048 540,810,989 596,140,674 656,440,966
(1,662,297) (66,490,651) 240,633 (18,111,834) (62,863,183)
1,019,287 1,005,000 1,705,000 3,398,000 - - - - - - - - 66,585,000 - - - - - - -
22,970,000 29,820,000 - - - 66,000,000 30,000,000 65,000,000 55,000,000 45,000,000 6,792,039 402,898 184,417 701,953 338,162
(25,147,135) (28,475,000) (67,010,175) - - 26,057,411 30,256,343 38,571,267 33,207,173 38,580,485
(28,405,165) (32,154,842) (40,442,193) (35,503,785) (40,288,250) 69,286,437 30,854,399 64,593,316 56,803,341 43,630,397
$ 67,624,140 $ (35,636,252) $ 64,833,949 $ 38,691,507 $ (19,232,786)
9.81% 10.32% 9.65% 9.96% 9.85%
160

General General GeneralFiscal Fund General General Fund FundYear State Fund Fund Government Local School
Ended Distributive Ad Valorem Franchise Services Support TaxJune 30, School Fund Taxes Tax Tax (Sales Tax)
2000 $ 63,148,037 $ 61,583,871 $ 261,743 $ 9,455,201 $ 108,093,526
2001 65,294,451 64,667,692 165,560 9,662,929 110,894,639
2002 75,088,119 67,239,288 230,353 10,338,568 112,258,067
2003 78,721,232 72,277,614 233,187 11,303,671 116,959,363
2004 87,154,547 77,268,419 205,259 12,563,725 128,565,040
2005 85,542,351 82,793,542 286,955 13,709,075 145,056,434
2006 77,280,007 89,351,473 361,157 14,517,247 161,027,372
2007 92,147,678 98,451,752 305,996 14,834,870 156,893,557
2008 125,171,400 105,044,775 462,145 14,533,686 153,328,703
2009 143,080,662 110,021,656 364,469 13,219,509 120,369,201
Source: Washoe County School District Business Office
Washoe County School DistrictMajor Governmental Revenues By Source
Last Ten Fiscal Years(modified accrual basis of accounting)
161

Table 1.5
General SpecialGeneral Fund Debt Capital Revenue Fund
Fund ARRA Service Fund Projects Fund StateInvestment State Fiscal Ad Valorem Government Distributive
Income Stabilization Taxes Services Tax School Fund
$ 1,680,737 $ - $ 32,110,250 $ 2,195,839 $ 12,309,317
1,589,520 - 34,349,012 2,502,729 12,981,481
778,074 - 35,327,857 2,676,923 13,887,475
439,873 - 37,951,688 2,927,284 14,771,785
369,444 - 40,437,409 3,253,375 15,983,978
1,030,943 - 43,304,316 3,551,635 16,881,687
2,554,914 - 46,760,465 3,759,896 18,655,920
3,360,393 - 51,692,753 3,842,316 19,644,528
3,593,870 - 55,343,712 3,764,216 21,029,346
1,674,868 21,869,831 58,121,673 3,424,061 22,892,682
162

Table 2.1
Percent of Percent ofTotal Total
Assessed Assessed Assessed Assessed Taxpayer Valuation Rank Valuation Valuation Rank Valuation
Peppermill Casinos, Inc. $ 110,390 1 0.64% $ 51,896 6 0.60%
Grand Sierra Operating Corporation 79,942 2 0.46% - - -
Circus Circus & Eldorado Joint Venture 61,502 3 0.36% 83,062 2 0.96%
Golden Road Motor Inn, Inc. 41,405 4 0.24% - - -
International Game Technology 40,708 5 0.24% - - -
Prologis NA3 LLC 31,478 6 0.18% - - -
Harrah's Club 29,541 7 0.17% 39,776 10 0.46%
Eldorado Resorts LLC 28,271 8 0.16% 43,066 9 0.50%
PNK (Reno) LLC 28,111 9 0.16% - - -
Reno Retail Company LLC 26,720 10 0.16% - - -
Sierra Pacific Power Company - - - 182,220 1 2.11%
Sparks Nugget Inc. - - 0.00% 67,217 3 0.78%
Dermody Industrial Group - - - 61,331 4 0.71%
Nevada Bell - - - 55,665 5 0.65%
Circus Circus Casinos, Inc. - - - 49,838 7 0.58%
Reno Hilton Resort Corporation - - - 44,936 8 0.52%
SUBTOTAL 478,068 2.78% 679,007 7.87%
All other taxpayers 16,728,943 97.22% 7,944,830 92.13%
TOTAL ASSESSED VALUATION $ 17,207,011 100.00% $ 8,623,837 100.00%
Source: Washoe County Comptroller's Office
Washoe County School District
2009 2000
Washoe County, NevadaPrincipal Property Taxpayers
Current Year and Nine Years Ago(amounts expressed in thousands)
163

2000 2001 2002 2003Washoe County
Operating rate 0.8402 0.8401 0.8567 0.9217Voter approved:
Child protective services 0.0400 0.0400 0.0400 0.0400Regional animal services - - - - Senior services 0.0100 0.0100 0.0100 0.0100Library expansion 0.0200 0.0200 0.0200 0.0200
Legislative overrides:Indigent insurance 0.0150 0.0150 0.0150 0.0150Indigent health 0.0900 0.0900 0.0850 0.0800Capital acquisition 0.0500 0.0500 0.0500 0.0500Youth services 0.0043 0.0044 0.0048 0.0070Detention center 0.0774 0.0774 0.0774 0.0774SCCRT loss - - - - Family court 0.0192 0.0192 0.0192 0.0192AB 104 Fair share tax 0.0272 0.0272 0.0272 0.0272
Debt service 0.0562 0.0562 0.0652 0.0778Total Washoe County direct rate 1.2495 1.2495 1.2705 1.3453
State of Nevada 0.1500 0.1500 0.1500 0.1500Washoe County School District 1.1385 1.1385 1.1385 1.1385
Total, Washoe County unincorporated area 2.5380 2.5380 2.5590 2.6338
CitiesCity of Reno 0.9076 0.9076 0.9556 0.9456City of Sparks 0.8106 0.8106 0.8653 0.9361
Fire DistrictsNorth Lake Tahoe Fire Protection District 0.4964 0.5025 0.5068 0.5101Sierra Fire Protection District 0.3800 0.4200 0.4200 0.4200Truckee Meadows Fire Protection District 0.4813 0.4813 0.4813 0.4813
General Improvement DistrictsIncline Village 0.0588 0.0588 0.0682 0.0695Palomino Valley 0.3600 0.3646 0.3970 0.3965South Truckee Meadows 0.1094 0.1329 0.1216 0.1125
Other Special DistrictsLemmon Valley Underground Water Basin - - - - Sun Valley Water & Sanitation District 0.1004 0.1004 0.1084 0.1137Truckee Meadows Underground Water 0.0005 0.0005 0.0005 0.0005
Source: Washoe County Comptroller's Office
Fiscal Year Ended June 30,
Last Ten Fiscal Years(tax rates per $100 assessed valuation)
Washoe County School DistrictWashoe County, Nevada
Property Tax Rates Direct and Overlapping Governments
164

Table 2.2
2004 2005 2006 2007 2008 2009
0.9167 0.9231 0.9231 0.9401 0.9592 0.9629
0.0400 0.0400 0.0400 0.0400 0.0400 0.04000.0300 0.0300 0.0300 0.0300 0.0300 0.03000.0100 0.0100 0.0100 0.0100 0.0100 0.01000.0200 0.0200 0.0200 0.0200 0.0200 0.0200
0.0000 0.0150 0.0150 0.0150 0.0150 0.01500.0900 0.1000 0.1000 0.0950 0.0800 0.08000.0500 0.0500 0.0500 0.0500 0.0500 0.05000.0084 0.0083 0.0083 0.0077 0.0077 0.00770.0774 0.0774 0.0774 0.0774 0.0774 0.07740.0150 - - - - - 0.0192 0.0192 0.0192 0.0192 0.0192 0.01920.0272 0.0272 0.0272 0.0272 0.0272 0.02720.0778 0.0715 0.0715 0.0601 0.0560 0.05231.3817 1.3917 1.3917 1.3917 1.3917 1.39170.1700 0.1700 0.1700 0.1700 0.1700 0.17001.1385 1.1385 1.1385 1.1385 1.1385 1.13852.6902 2.7002 2.7002 2.7002 2.7002 2.7002
0.9456 0.9456 0.9456 0.9456 0.9456 0.94560.9161 0.9161 0.9161 0.9161 0.9161 0.9161
0.5227 0.4746 0.5118 0.5070 0.5142 0.52260.4200 0.4200 0.4200 0.4200 0.4200 0.52000.4813 0.4713 0.4713 0.4713 0.4713 0.4713
0.0741 0.0730 0.0702 0.0687 0.0711 0.07110.4230 0.4353 0.4168 0.4270 0.4270 0.48850.1007 - - - - -
0.0022 0.0020 0.0019 0.0017 0.0012 - 0.1243 0.1329 0.1329 0.1329 0.1329 0.13290.0004 0.0005 0.0005 0.0004 0.0004 0.0005
165

Fiscal PersonalYear Property
Ended Assessed June 30, Residential Commercial Industrial Other Value
2000 $ 4,899,515 $ 2,188,844 $ 599,318 $ 979,713 $ 554,355
2001 5,345,618 2,224,629 645,829 1,014,684 561,192
2002 5,779,329 2,266,553 716,567 930,450 598,262
2003 6,097,744 1,995,268 690,536 1,130,859 897,928
2004 6,914,968 2,146,658 734,470 1,411,793 632,546
2005 7,359,180 2,401,256 760,477 1,361,320 635,384
2006 8,112,575 2,629,471 805,595 1,490,866 596,491
2007 9,503,764 2,898,745 900,363 1,600,955 703,276
2008 10,767,225 3,317,724 973,242 1,885,497 691,628
2009 12,389,860 3,598,911 1,096,143 2,563,994 539,444
Source: Washoe County Comptroller's Office
Washoe County School DistrictWashoe County, Nevada
Assessed and Estimated Actual Value of Taxable PropertyLast Ten Fiscal Years
Real Property Assessed Property
(amounts expressed in thousands)
166

Table 2.3
Less: Taxable Estimated Assessed Value TotalExempt Assessed Actual To Taxable Direct Property Value Assessed Value Value Tax Rate
$ 1,136,199 $ 8,085,546 $ 23,101,560 $ 35.00% $ 1.2495
1,167,565 8,624,387 24,641,106 35.00% 1.2495
1,194,463 9,096,698 25,990,566 35.00% 1.2705
1,350,371 9,461,964 27,034,183 35.00% 1.3453
1,431,598 10,408,837 29,739,534 35.00% 1.3817
1,501,359 11,016,258 31,475,023 35.00% 1.3917
1,655,650 11,979,348 34,226,709 35.00% 1.3917
1,861,784 13,745,319 39,272,340 35.00% 1.3917
2,529,824 15,105,492 43,158,549 35.00% 1.3917
2,981,341 17,207,011 49,162,889 35.00% 1.3917
Total
167

Fiscal NetYear Secured Current Percent Delinquent
Ended Roll Tax of Levy Tax Total TaxJune 30, Tax Levy Collections Collected Collections Collections
2000 $ 261,772 $ 258,386 98.71% $ 3,345 $ 261,731
2001 273,864 270,702 98.85% 3,121 273,823
2002 291,603 288,340 98.88% 3,214 291,554
2003 320,081 316,661 98.93% 3,376 320,037
2004 348,064 345,198 99.18% 2,808 348,006
2005 372,702 370,001 99.28% 2,636 372,637
2006 404,224 401,305 99.28% 2,759 404,064
2007 446,362 442,446 99.12% 2,303 444,749
2008 480,945 472,860 98.32% - 472,860
2009 514,530 504,268 98.01% - 504,268
Source: Washoe County Comptroller's Office
(dollars expressed in thousands)
Washoe County School DistrictWashoe County, Nevada
Property Tax Levies and CollectionsLast Ten Fiscal Years
168
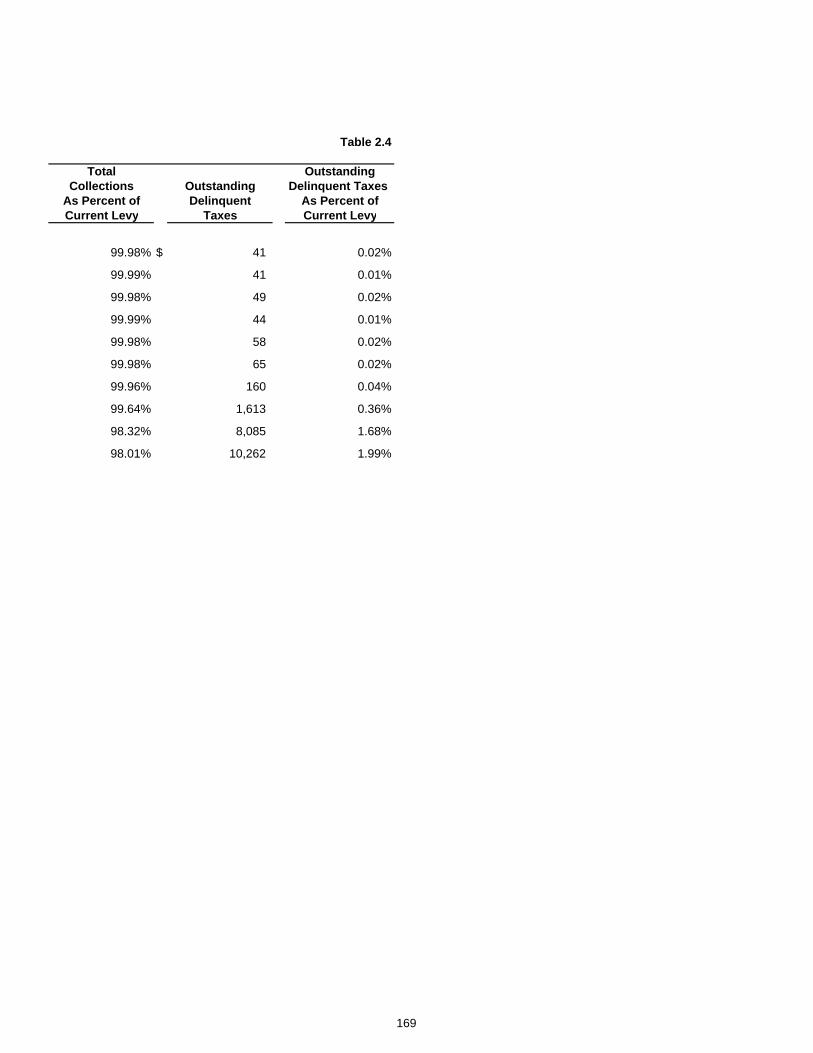
Table 2.4
Total OutstandingCollections Outstanding Delinquent Taxes
As Percent of Delinquent As Percent ofCurrent Levy Taxes Current Levy
99.98% $ 41 0.02%
99.99% 41 0.01%
99.98% 49 0.02%
99.99% 44 0.01%
99.98% 58 0.02%
99.98% 65 0.02%
99.96% 160 0.04%
99.64% 1,613 0.36%
98.32% 8,085 1.68%
98.01% 10,262 1.99%
169

Table 2.5
Fiscal Year Local School
Ended Taxable Support TaxJune 30, Sales Percent Change Rate
2000 $ 4,966,613 6.1% 2.25%
2001 5,194,146 4.6% 2.25%
2002 5,280,706 1.7% 2.25%
2003 5,475,602 3.7% 2.25%
2004 6,003,368 9.6% 2.25%
2005 6,660,263 10.9% 2.25%
2006 7,245,525 8.8% 2.25%
2007 7,202,641 -0.6% 2.25%
2008 6,823,701 -5.3% 2.25%
2009 5,707,762 -16.4% 2.25%
Source: State of Nevada Department of Taxation
(dollars expressed in thousands)
Washoe County School DistrictWashoe County, Nevada
Taxable SalesLast Ten Fiscal Years
170

Table 3.1
Fiscal Year General Percentage Capital Total Percentage
Ended Obligation of Actual Per Lease Primary of Personal PerJune 30, Bonds Property Value (a) Capita (b) Obligations Government Income (b) Capita (b)
2000 $ 372,135,000 4.60% $ 1,115.63 $ 8,508,192 $ 380,643,192 3.09% $ 1,141.13
2001 355,190,000 4.12% 1,005.43 14,692,732 369,882,732 2.81% 1,047.02
2002 355,985,000 3.91% 990.43 21,150,750 377,135,750 2.84% 1,049.28
2003 352,425,000 3.72% 944.25 17,429,798 369,854,798 2.66% 990.95
2004 385,090,000 3.70% 1,004.27 23,131,681 408,221,681 2.63% 1,064.59
2005 427,205,000 3.88% 1,076.51 22,255,576 449,460,576 2.69% 1,132.59
2006 433,985,000 3.62% 1,060.87 21,272,256 455,257,256 2.60% 1,112.87
2007 474,945,000 3.46% 1,136.07 20,709,619 495,654,619 2.70% 1,185.60
2008 500,380,000 3.31% 1,180.61 21,395,235 521,775,235 2.93% 1,231.09
2009 515,520,000 3.00% 1,203.94 18,507,845 534,027,845 2.88% 1,247.16
(a) See Schedule 2.3 for taxable property value(b) See Schedule 4.1 for population and personal income dataSource: Washoe County School District Business Office
Washoe County School DistrictRatios of Outstanding Debt by Type
Last Ten Fiscal Years
Other Governmental Activities DebtGeneral Bonded Debt
171

Table 3.2
Fiscal Total Net Debt Year Legal Applicable to the
Ended Debt Limit for Total Net Debt Debt Limit as a PercentageJune 30, School Districts Applicable to Limit Margin of Debt Limit
2000 $ 1,293,658,033 $ 372,135,000 $ 921,523,033 $ 28.77%2001 1,364,504,640 355,190,000 1,009,314,640 26.03%2002 1,419,154,875 335,985,000 1,083,169,875 23.68%2003 1,561,438,114 352,425,000 1,209,013,114 22.57%2004 1,652,438,739 385,155,000 1,267,283,739 23.31%2005 1,732,291,780 427,205,000 1,305,086,780 24.66%2006 1,900,908,705 433,985,000 1,466,923,705 22.83%2007 2,265,823,871 474,945,000 1,790,878,871 20.96%2008 2,581,051,586 500,380,000 2,080,671,586 19.39%2009 2,580,151,650 515,520,000 2,064,631,650 19.98%
Legal debt margin calculation for fiscal year ended June 30, 2009
Current assessed valuation for 2009/2010 tax year $ 17,729,236,567
Debt limit for school districts - 15% of assessed valuation 2,580,151,650
Total Washoe County School District bonded debt 515,520,000
Legal debt margin $ 2,064,631,650
Note: The statutory debt limit for school districts in the State of Nevada is 15% of the assessed valueof all taxable property in the county as set forth in Chapter 387.400 of the Nevada Revised Statutes.
Source: Washoe County School District Business Office
Washoe County School DistrictLegal Debt Margin Information
Last Ten Fiscal Years
172

Table 3.3
General Present Percent Obligation Self-Supporting Applicable
Debt General To Washoe ApplicableOutstanding Obligation Debt County Net Debt
Direct debt
Washoe County School District $ 515,520 $ - 100% $ 515,520
Overlapping
Washoe County-Governmental Activity Bonds 164,938 - 100% 164,938
Washoe County-Special Assessment Bonds 3,348 3,348 100% -
Reno/Sparks Convention Visitor's Authority 126,905 126,905 100% -
City of Reno 57,690 - 100% 57,690
City of Reno-supported by specific revenues 400,136 400,136 100% -
Reno-Special Assessment Bonds 23,530 23,530 100% -
City of Sparks 7,725 - 100% 7,725
Sparks-Sewer/Utility Bonds 55,347 55,347 100% -
Incline Village General Improvement District 24,409 24,409 100% -
State of Nevada 2,315,460 727,545 11.99% 190,391
Total overlapping debt 3,179,488 1,361,220 420,744
Total direct and overlapping debt $ 3,695,008 $ 1,361,220 $ 936,264
Source: Washoe County Comptroller's Office
(amounts expressed in thousands)
Washoe County School District
General Obligation Direct and Overlapping DebtWashoe County, Nevada
As of June 30, 2009
173

Fiscal Year Per Total
Ended Capita Median School Personal UnemploymentJune 30, Population Income Age Enrollment* Income Rate
2000 333,566 $ 37 37.3 54,121 $ 12,322,546 3.7%
2001 353,271 37 35.6 55,673 13,139,838 4.5%
2002 359,423 37 35.6 57,704 13,273,476 4.9%
2003 373,233 37 35.8 58,908 13,900,375 4.6%
2004 383,453 41 35.1 60,411 15,532,986 4.2%
2005 396,844 42 36.1 62,098 16,700,497 4.0%
2006 409,085 43 36.5 62,390 17,510,758 4.0%
2007 418,061 44 34.5 63,044 18,378,021 4.6%
2008 423,833 42 36.5 63,635 17,803,397 6.8%
2009 428,195 43 36.4 63,297 18,550,337 11.5%
Source: Washoe County Comptroller's Office * Washoe County School District
(dollars expressed in thousands)
Washoe County School DistrictWashoe County, Nevada
Demographic and Economic StatisticsLast Ten Fiscal Years
174

Table 4.1
Total Construction Number of TotalLabor Activity New Family Taxable Gross Income PassengerForce Total Value Units Sales From Gaming Air Traffic
194,700 $ 255,052 1,001 $ 4,957,235 $ 1,111,327 5,951,344
200,500 290,589 1,270 5,194,146 1,113,289 5,332,507
203,300 294,356 1,324 5,292,179 1,049,152 4,485,369
204,700 305,249 1,217 5,481,583 1,032,988 4,514,225
207,900 345,640 1,009 6,023,437 1,011,658 4,918,829
209,500 368,356 1,113 6,687,447 1,016,864 5,097,170
216,600 307,686 851 7,268,593 1,072,937 5,149,700
223,600 225,085 557 7,202,641 1,069,608 5,014,382
225,300 202,519 240 6,823,701 996,614 4,841,257
225,600 85,407 103 5,707,791 867,202 3,979,015
175

Table 4.2
Percent of Percent ofTotal Total
County CountyEmployer Employees Rank Employment Employees Rank Employment
Washoe County School District 8500-8999 1 4.17% 6000-6499 1 3.46%
University of Nevada, Reno 4500-4999 2 2.26% 3000-3499 2 1.80%
Washoe County 3000-3499 3 1.55% 2500-2999 4 1.52%
International Game Technology 2500-2999 4 1.31% - - -
Renown Medical Center 2500-2999 5 1.07% 2000-2499 7 1.29%
Peppermill Hotel Casino - Reno 2000-2499 6 1.07% - - -
Silver Legacy Resort Casino 2000-2499 7 0.83% 2500-2999 5 1.52%
City of Reno 2000-2499 8 0.83% - - -
Atlantis Casino Resort 1500-1999 9 0.83% - - -
St. Mary's 1500-1999 10 0.83% - - -
Reno Hilton - - - 2500-2999 3 1.52%
Eldorado Hotel & Casino - - - 2500-2999 6 1.24%
Sparks Nugget, Inc. - - - 2000-2499 10 1.24%
Circus Circus Casinos, Inc. - Reno - - - 2000-2499 9 1.24%
Harrah's Reno - - - 2000-2499 8 1.24%
Total County covered employment 210,082 180,745
Source: Washoe County Comptroller's Office for all except Washoe County School District
December, 2008 December, 1999
Washoe County School DistrictWashoe County, Nevada
Principal EmployersCurrent Year and Nine Years Ago
176

Fiscal GovernmentalYear Funds Cost Primary Cost
Ended Operating per Percentage Government perJune 30, Enrollment Expenditures Pupil Change Expenses Pupil
2000 54,121 $ 372,303,261 $ 6,879 14.79% $ N/A $ N/A
2001 55,651 423,117,062 7,603 10.52% N/A N/A
2002 57,557 431,621,044 7,499 -1.37% 383,012,581 6,654
2003 58,909 450,719,331 7,651 2.03% 389,196,315 6,607
2004 60,373 464,720,491 7,697 0.61% 416,910,616 6,906
2005 62,073 481,317,717 7,754 0.73% 444,912,093 7,168
2006 62,356 560,796,048 8,993 15.98% 476,874,245 7,648
2007 63,044 540,810,989 8,578 -4.62% 519,093,727 8,234
2008 63,626 596,140,674 9,369 9.22% 554,692,976 8,718
2009 63,297 656,440,966 10,371 10.69% 581,230,827 9,183
(a) Meals served restated in FY09 (and all prior years) to include breakfast and lunch meals.
NOTE: FY 2001-02 is the first year that District costs have been presented under GASB 34 guidelines. As such, prior years' data in this format is not available.
Source: Washoe County School District Business Office
Washoe County School DistrictOperating Statistics
Last Ten Fiscal Years
177

Table 5.1
Number Percentageof Students of Students
Districtwide Pupil- Receiving Receiving TotalPercentage Teaching Teacher Free or Reduced Free or Reduced Meals
Change Staff Ratio Priced Meals Priced Meals Served (a)
N/A N/A N/A 15,184 28.06% 4,447,084
N/A N/A N/A 15,944 28.65% 4,826,853
N/A N/A N/A 18,902 32.84% 4,997,831
-0.72% 3,477 16.9 21,625 36.71% 5,089,614
4.52% 3,487 17.3 17,338 28.72% 5,277,978
3.79% 3,600 17.2 24,403 39.31% 5,321,863
6.70% 3,653 17.1 21,467 34.43% 5,455,734
7.67% 3,806 16.6 23,218 36.83% 5,684,279
5.88% 3,864 16.5 21,244 33.39% 5,946,951
5.33% 3,765 16.8 22,049 34.83% 5,995,436
178

Table 5.2
Fiscal Year
Ended Minimum MaximumJune 30, Salary salary
2000 $ 24,409 $ 52,884
2001 24,675 53,462
2002 24,675 53,462
2003 25,292 54,799
2004 25,924 56,169
2005 26,508 57,435
2006 27,303 59,158
2007 29,588 63,959
2008 30,069 66,487
2009 32,820 70,697
Source: Washoe County School District Human Resources
Washoe County School DistrictTeacher Salary Schedules
Last Ten Fiscal Years
179

2000 2001 2002 2003
FunctionInstruction 3,519 3,648 3,805 3,885Student support 214 227 249 237Instructional staff support 193 205 252 246General administration 37 44 45 44School administration 317 330 339 331Business administration* 77 94 81 77Operations / maintenance 460 466 481 478Student transportation 330 377 410 392Central support 67 68 84 81Other support - - 1 1Nutrition services operations 327 312 330 252Community service operations - - 14 14Land & building acquisition, improvement 9 8 7 8 Total full time equivalent employees 5,550 5,779 6,098 6,046
athletic coaches, or temporary employees.* Business Administration included Central Support for 2009Source: Washoe County School District Business Office
Note: Full time equivalent employees do not include substitutes, student activity workers,
Washoe County School DistrictFull Time Equivalent Employees by Function
Last Ten Years
Fiscal Year Ended June 30,
180

Table 5.3
2004 2005 2006 2007 2008 2009
3,842 3,968 4,070 4,161 4,149 4,260255 300 305 303 327 423226 205 224 240 263 279
40 44 46 47 57 60346 367 383 390 403 371
80 97 114 97 101 198489 495 494 534 562 532318 330 321 338 371 337
78 84 83 88 91 - 2 1 - 1 2 -
252 231 233 253 249 21115 13 12 16 14 17
5 6 13 17 15 175,948 6,141 6,298 6,485 6,604 6,705
181

2000 2001 2002 2003
Elementary SchoolsSites 60 60 60 62Square feet 2,504,749 2,504,749 2,509,069 2,619,151Base capacity 27,781 27,781 28,441 28,441
Middle SchoolsSites 11 11 11 11Square feet 996,480 996,480 1,000,800 1,003,680Base capacity 8,300 8,300 8,300 8,300
High SchoolsSites 11 11 13 13Square feet 1,750,297 1,750,297 2,251,855 2,266,868Base capacity 11,656 11,656 11,656 15,236
AdministrativeSites 7 9 9 9Square feet 88,701 88,701 88,701 88,701
TransportationSites 3 3 3 3Square feet 60,645 60,645 60,645 60,645Buses 276 276 288 288
NutritionSites 1 1 1 1Square feet 24,246 24,246 24,246 24,246
Other (Bullis Curriculum & Instruction Center, Edison Curriculum & InstructionCenter and Plant Facilities)Sites 2 3 3 3Square feet 32,675 127,609 162,275 163,715
* Johnson Elementary, located at Gerlach HS, square footage tracking separated from HS in 2007-08 ** Opportunity School & Academy of Arts, Careers & Technology, square footage tracking separated from Other
in 2007-08^ Includes Picollo which is a K-12 school
Source: Washoe County School District Plant Facilities
Washoe County School DistrictCapital Asset Information
Last Ten Fiscal Years
Fiscal Year Ended June 30,
182

Table 5.4
2004 2005 2006 2007 2008 2009
62 62 62 64 65 * 64 ^2,656,829 2,661,149 2,664,029 2,822,459 2,813,816 2,845,877
29,761 30,080 30,080 31,286 31,286 31,759
11 12 12 13 13 131,005,120 1,128,911 1,128,911 1,266,428 1,258,676 1,259,306
8,300 8,300 9,233 10,279 10,279 10,158
13 14 14 14 16 ** 152,506,623 2,508,063 2,518,197 2,574,892 2,754,294 2,565,478
15,236 16,244 16,244 16,244 16,244 19,394
9 9 9 9 8 888,701 88,701 88,701 88,701 91,981 90,572
3 3 3 3 3 360,645 60,645 60,645 60,645 60,645 48,020
299 254 279 293 300 300
1 1 1 1 1 124,246 24,246 24,246 28,746 28,746 26,997
#
3 3 3 3 3 ** 3163,715 163,715 163,715 163,715 130,045 132,854
183

Compliance & Controls Information required pursuant to the Single
Audit Act Auditor’s comments/reports pursuant to
Nevada Revised Statutes


FEDERAL AGENCY ORCFDA PASS-THROUGH
NUMBER NUMBER
U.S. DEPARTMENT OF EDUCATION
DIRECT PROGRAMS:
Impact Aid PL 81-874 84.041 n/a $ 268,461
Title IX, Indian Education 84.060 S060A081031 294,804
Fund for the Improvement of Education - Teaching American History #2 84.215 U215X070223 299,203 Fund for the Improvement of Education - Elementary US History 84.215 U215X050077 296,872 Fund for the Improvement of Education - Connect Ed 84.215 U215K080160 74,586 Fund for the Improvement of Education - Classroom on Wheels 84.215 U215K080149 100,937
771,598
Total Direct 1,334,863
PASS THROUGH FROM THE STATE OF NEVADA,DEPARTMENT OF EDUCATION:
State Fiscal Stabilization Funds 84.394 n/a 21,869,831
Special Education ClusterPL 108-446 - Individuals with Disabilities Ed Act 84.027 09-2715-16 10,124,264 PL 108-446 - District Improvement 84.027 09-2715-127 88,277 PL 108-446 - Autism Consultant 84.027 09-2715-28 56,981 PL 108-446 - Early Childhood Education 84.173 09-2715-56 242,276
Total Special Education Cluster 10,511,798
Title I Grants to Local Education AgenciesTitle I - Basic 84.010 09-2712-16 9,496,598 Title I - Delinquent 84.010 09-2712-22 174,033 Title I - School Improvement 84.010 2009-2712-88 565,458 Title I - Booth School Improvement 84.010 09-2712-31 31,644 Title I - Cannan School Improvement 84.010 09-2712-31 30,730 Title I - Duncan School Improvement 84.010 09-2712-31 24,778 Title I - Lincoln Park School Improvement 84.010 09-2712-31 32,450 Title I - Loder School Improvement 84.010 09-2712-31 23,015 Title I - Mathews School Improvement 84.010 09-2712-31 35,562 Title I - Mitchell School Improvement 84.010 09-2712-31 29,111 Title I - Kate Smith School Improvement 84.010 09-2712-31 28,843 Title I - Smithridge School Improvement 84.010 09-2712-31 33,722 Title I - Sun Valley School Improvement 84.010 09-2712-31 24,950 Title I - Veterans School Improvement 84.010 09-2712-31 28,186 Title I -Traner School Improvement 84.010 09-2712-31 34,971 Title I - Bailey Charter School Improvement 84.010 09-2712-31 38,250 Title I - Mariposa Academy School Improvement 84.010 09-2712-31 30,000
10,662,301
Title I - Migrant Education 84.011 09-2712-45 43,030
Title I - Even Start State Education Agencies 84.213 09-2712-64 147,909
Career & Technical Education - PL 105-332 - Carl D Perkins Basic/Reserve/NT 84.048 09-2676-16 639,724 Career & Technical Education - PL 105-332 - Carl D Perkins TMCC 84.048 n/a 42,000
681,724
Safe and Drug-Free Schools and Communities State Grants 84.186 09-2605-16 148,400
Education For Homeless Children and Youth - McKinney Homeless Assistance 84.196 09-2709-04 110,242
(CONTINUED)
GRANTOR/PROGRAM TITLE EXPENDITURES
WASHOE COUNTY SCHOOL DISTRICTSCHEDULE OF EXPENDITURES OF FEDERAL AWARDS
FOR THE YEAR ENDED JUNE 30, 2009
FEDERAL GRANTOR/PASS-THROUGH FEDERAL
188

FEDERAL AGENCY ORCFDA PASS-THROUGH
NUMBER NUMBERGRANTOR/PROGRAM TITLE EXPENDITURES
WASHOE COUNTY SCHOOL DISTRICTSCHEDULE OF EXPENDITURES OF FEDERAL AWARDS
FOR THE YEAR ENDED JUNE 30, 2009
FEDERAL GRANTOR/PASS-THROUGH FEDERAL
21st Century Community Learning Centers, District 84.287 09-2709-56 $ 274,571 21st Century Community Learning Centers, Allen ES 84.287 09-2709-56 93,061 21st Century Community Learning Centers, Booth ES 84.287 09-2709-56 87,433 21st Century Community Learning Centers, Cannan ES 84.287 09-2709-56 79,554 21st Century Community Learning Centers, Desert Heights ES 84.287 09-2709-56 96,161 21st Century Community Learning Centers, Duncan ES 84.287 09-2709-56 89,802 21st Century Community Learning Centers, Greenbrae ES 84.287 09-2709-56 87,662 21st Century Community Learning Centers, Lincoln Park ES ES 84.287 09-2709-56 106,942 21st Century Community Learning Centers, Loder ES 84.287 09-2709-56 75,173 21st Century Community Learning Centers, Mathews ES 84.287 09-2709-56 80,994 21st Century Community Learning Centers, Maxwell ES 84.287 09-2709-56 109,629 21st Century Community Learning Centers, Mitchell ES 84.287 09-2709-56 110,707 21st Century Community Learning Centers, Natchez ES 84.287 09-2709-56 86,766 21st Century Community Learning Centers, Donner Springs ES 84.287 09-2709-56 82,992 21st Century Community Learning Centers, Risley ES 84.287 09-2709-56 82,971 21st Century Community Learning Centers, Kate Smith ES 84.287 09-2709-56 75,527 21st Century Community Learning Centers, Sun Valley ES 84.287 09-2709-56 120,005 21st Century Community Learning Centers, Warner ES 84.287 09-2709-56 104,765 21st Century Community Learning Centers, Clayton MS 84.287 09-2709-56 67,636 21st Century Community Learning Centers, Dilworth MS 84.287 09-2709-56 70,458 21st Century Community Learning Centers, Pine MS 84.287 09-2709-56 93,496 21st Century Community Learning Centers, Sparks MS 84.287 09-2709-56 82,781 21st Century Community Learning Centers, Traner MS 84.287 09-2709-56 72,724 21st Century Community Learning Centers, Vaughn MS 84.287 09-2709-56 79,689
2,311,499 State Grants For Innovative Programs
Title V, PL 107-110 State Grants For Innovative Programs 84.298 09-2713-22 35,984 Title II, Part A Improving Teacher Quality State Grants (NOTE 1) 84.298 09-2713-36 654,255
690,239
Title II, Part D, Education Technology State Grants - Formula 84.318 09-2713-36 87,008 Title II, Part A Improving Teacher Quality State Grants (NOTE 2) 84.318 09-2713-36 232,957 Title II, Part D, Education Technology State Grants - Competitive 84.318 09-2713-85 277,838 Title IX, Part C, Education Technology State Grants - Tech Plan & Standards 84.318 09-2713-86 59,200
657,003
PL 105-17 Special Education - State Personnel Development - Mentor Teacher Program 84.323 09-2715-94 142,127
Gaining Early Awareness and Readiness for Undergraduate Programs - GEAR UP 34 CRF 964 Hug HS 84.334 09-267816 162,767
Reading First State Grant 84.357 09-2712-57 908,856 Reading First State Grant Targeted Assistance 84.357 09-2712-77 802,769
1,711,625
Title III, English Language Acquisition Grants 84.365 09-2709-66 1,017,048
Title II, Part A Improving Teacher Quality State Grants 84.367 09-2713-36 1,259,840 Title II, Part A International Exchange Pilot 84.367 08-2713-42 994
1,260,834
Total U.S. Department of Education funding passed through the State of Nevada Department of Education 52,128,377
Total U.S. Department of Education 53,463,240
NOTE 1: CFDA 84.298 contains $654,255 transferred from Title IIA to Title V through "No Child Left Behind" transferability provisions.NOTE 2: CFDA 84.318 contains $232,957 transferred from Title IIA to Title IID through "No Child Left Behind" transferability provisions.
(CONTINUED)
189
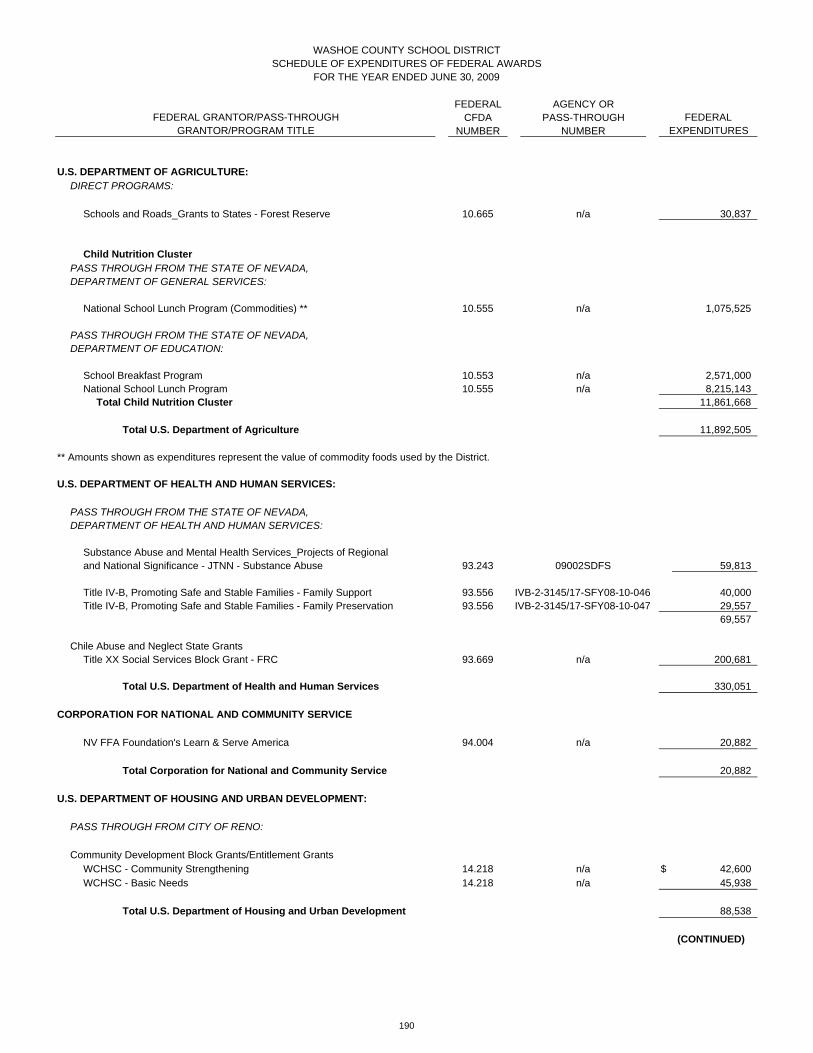
FEDERAL AGENCY ORCFDA PASS-THROUGH
NUMBER NUMBERGRANTOR/PROGRAM TITLE EXPENDITURES
WASHOE COUNTY SCHOOL DISTRICTSCHEDULE OF EXPENDITURES OF FEDERAL AWARDS
FOR THE YEAR ENDED JUNE 30, 2009
FEDERAL GRANTOR/PASS-THROUGH FEDERAL
U.S. DEPARTMENT OF AGRICULTURE:DIRECT PROGRAMS:
Schools and Roads_Grants to States - Forest Reserve 10.665 n/a 30,837
Child Nutrition ClusterPASS THROUGH FROM THE STATE OF NEVADA,DEPARTMENT OF GENERAL SERVICES:
National School Lunch Program (Commodities) ** 10.555 n/a 1,075,525
PASS THROUGH FROM THE STATE OF NEVADA,DEPARTMENT OF EDUCATION:
School Breakfast Program 10.553 n/a 2,571,000 National School Lunch Program 10.555 n/a 8,215,143
Total Child Nutrition Cluster 11,861,668
Total U.S. Department of Agriculture 11,892,505
** Amounts shown as expenditures represent the value of commodity foods used by the District.
U.S. DEPARTMENT OF HEALTH AND HUMAN SERVICES:
PASS THROUGH FROM THE STATE OF NEVADA, DEPARTMENT OF HEALTH AND HUMAN SERVICES:
Substance Abuse and Mental Health Services_Projects of Regional and National Significance - JTNN - Substance Abuse 93.243 09002SDFS 59,813
Title IV-B, Promoting Safe and Stable Families - Family Support 93.556 IVB-2-3145/17-SFY08-10-046 40,000 Title IV-B, Promoting Safe and Stable Families - Family Preservation 93.556 IVB-2-3145/17-SFY08-10-047 29,557
69,557
Chile Abuse and Neglect State GrantsTitle XX Social Services Block Grant - FRC 93.669 n/a 200,681
Total U.S. Department of Health and Human Services 330,051
CORPORATION FOR NATIONAL AND COMMUNITY SERVICE
NV FFA Foundation's Learn & Serve America 94.004 n/a 20,882
Total Corporation for National and Community Service 20,882
U.S. DEPARTMENT OF HOUSING AND URBAN DEVELOPMENT:
PASS THROUGH FROM CITY OF RENO:
Community Development Block Grants/Entitlement GrantsWCHSC - Community Strengthening 14.218 n/a $ 42,600 WCHSC - Basic Needs 14.218 n/a 45,938
Total U.S. Department of Housing and Urban Development 88,538
(CONTINUED)
190

FEDERAL AGENCY ORCFDA PASS-THROUGH
NUMBER NUMBERGRANTOR/PROGRAM TITLE EXPENDITURES
WASHOE COUNTY SCHOOL DISTRICTSCHEDULE OF EXPENDITURES OF FEDERAL AWARDS
FOR THE YEAR ENDED JUNE 30, 2009
FEDERAL GRANTOR/PASS-THROUGH FEDERAL
U.S. DEPARTMENT OF LIBRARIES AND ARCHIVES:
PASS THROUGH FROM THE STATE OF NEVADA, DEPARTMENT OF CULTURAL AFFAIRS:
Grants to StatesLSTA Reading Week Grant 45.310 2008-20-14 5,000 LSTA Natchez Library Grant 45.310 2008-08 4,983 LSTA Warner LibraryGrant 45.310 2008-26 55,593
Total U.S. Department of Libraries and Archives 65,576
U.S. DEPARTMENT OF HOMELAND SECURITY:
DIRECT PROGRAM:
DIRECT - FRC Coalition Emergency Food & Shelter 97.024 589600-012 4,515
Total U.S. Department of Homeland Security 4,515
U.S. DEPARTMENT OF TRANSPORTATION:
PASS THROUGH FROM THE STATE OF NEVADA,DEPARTMENT OF TRANSPORTATION:
Safe Routes to School 20.205 n/a 45,043
PASS THROUGH FROM WASHOE COUNTY,DEPARTMENT OF PUBLIC WORKS:
Safe Routes to School 20.205 n/a 55,002
Total U.S. Department of Transportation 100,045
LIBRARY OF CONGRESS:
PASS THROUGH FROM THE UNIVERSITY OFNORTHERN COLORADO, COLLEGE OF EDUCATION
American History; Primary Sources Regional Program 42.Unknown P0007352 5,360
Total Library of Congress 5,360
TOTAL EXPENDITURES OF FEDERAL AWARDS $ 65,970,712
191

WASHOE COUNTY SCHOOL DISTRICT NOTES TO THE SCHEDULE OF EXPENDITURES OF FEDERAL AWARDS
FOR THE YEAR ENDED JUNE 30, 2009
192
NOTE 1 – Reporting Entity: The accompanying Schedule of Expenditures of Federal Awards presents the expenditure activity of all Federal award programs of the Washoe County School District (the “District”) for the year ended June 30, 2009. The District’s reporting entity is defined in Note 1 to its basic financial statements. All expenditures of Federal awards received directly from Federal agencies as well as Federal awards passed through other government and not-for-profit agencies are included in the Schedule of Expenditures of Federal Awards. NOTE 2 – Basis of Accounting: The accompanying Schedule of Expenditures of Federal Awards is prepared on the modified accrual basis of accounting. NOTE 3 – Relationship to the Basic Financial Statements: Expenditures of Federal awards have been included in the individual funds of the District as follows:
General Fund $21,888,604 Special Revenue Funds 32,220,440 Enterprise Fund – Nutrition Services 11,861,668 $65,970,712

WASHOE COUNTY SCHOOL DISTRICT SCHEDULE OF FINDINGS AND QUESTIONED COSTS
FOR THE YEAR ENDED JUNE 30, 2009
193
Summary of Auditor’s Results: • Kafoury, Armstrong & Co. issued an unqualified opinion on the basic financial statements of
Washoe County School District for the year ended June 30, 2009.
• Two significant deficiencies were identified during the audit of the financial statements as reported in the Independent Auditor’s Report on Internal Control Over Financial Reporting and on Compliance and Other Matters Based on an Audit of Financial Statements Performed in Accordance with Government Auditing Standards. The deficiencies were not considered material weaknesses.
• The audit disclosed no instances of noncompliance which were material to the financial
statements of Washoe County School District. • No significant deficiencies in the internal control over major Federal award programs were
disclosed during the audit as reported in the Independent Auditor’s Report on Compliance with Requirements Applicable to Each Major Federal Program and on Internal Control Over Compliance in Accordance with OMB Circular A-133.
• Kafoury, Armstrong & Co. issued an unqualified opinion on compliance for major Federal
programs of Washoe County School District. • An audit finding relative to a major Federal award program for the Washoe County School
District, which is required to be reported under section .510(a) of OMB Circular A-133 is included on the following pages.
• Washoe County School District had five major programs for the year ended June 30, 2009, as
follows:
CFDA Number
Program Name
84.394 State Fiscal Stabilization Fund (SFSF) Cluster - Education State Grants, Recovery Act (Education Stabilization Fund)
84.215 Fund For The Improvement Of Education 84.010 Title I, Part A Cluster - Grants to Local Education Agencies 84.287 Twenty-First Century Community Learning Centers 84.367 Improving Teacher Quality State Grants
• The dollar threshold used for distinguishing between Type A and Type B programs for the year
ended June 30, 2009, was $1,979,121.
• Washoe County School District qualified as a low risk auditee for the year ended June 30, 2009 under the criteria set forth in section .530 of OMB Circular A-133.

WASHOE COUNTY SCHOOL DISTRICT SCHEDULE OF FINDINGS AND QUESTIONED COSTS
FOR THE YEAR ENDED JUNE 30, 2009
194
Findings Relating to the Financial Statement Audit Reported in Accordance With Generally Accepted Governmental Auditing Standards (GAGAS): Finding 09-1 Significant Deficiency: Accounts Payable: Criteria and Condition: Segregation of duties is one of the key elements of a system of
internal control over accounts payable. Duties within an accounts payable department should be segregated to ensure that the ability to create a vendor is separate from the ability to process a disbursement and authorize the bank to fund the disbursement.
We noted that there was a lack of segregation in duties within the
District’s accounts payable department whereby the same individual had the ability to create a vendor, process a disbursement, and also transmit the check data to the District’s bank, thereby authorizing the bank to fund the disbursement (check).
Effect: Unauthorized accounts payable transactions could have occurred
in the District’s accounts payable system. Cause: The accounts payable department did not segregate the vendor
setup and accounts payable processing functions. Recommendation: We recommend the District segregate duties within the accounts
payable department to separate the vendor setup and accounts payable processing functions.
Management’s Response: Duties were segregated in June 2009 with the implementation of
the accounts payable system upgrade. The individual concerned no longer has rights to add or change a vendor or distribute an accounts payable batch. The rights to upload check data to the bank now requires the individual’s supervisor’s approval.

WASHOE COUNTY SCHOOL DISTRICT SCHEDULE OF FINDINGS AND QUESTIONED COSTS
FOR THE YEAR ENDED JUNE 30, 2009
195
Finding 09-2 Significant Deficiency: Information Technology: Criteria and Condition: The District depends heavily on information technology systems
and any disruption caused by a disaster could result in operating difficulties. Managing the changes to the information technology environment is necessary to ensure changes occur effectively and to prevent unauthorized changes. The location of the District’s datacenter is crucial to the security of the information technology environment.
We noted that while the District’s information technology staff continues to make advancements in developing a comprehensive disaster recovery plan and a comprehensive change management policy, neither were fully implemented at June 30, 2009. In addition, while an offsite backup datacenter is currently under construction, the current location of the District’s datacenter has several deficiencies that put the District at risk in the event of a catastrophe such as a fire or flood.
Effect: The District’s information technology systems are at higher risk. Cause: The District has not fully implemented a comprehensive disaster
recovery plan or a comprehensive change management policy for the information technology environment. In addition, the District’s datacenter resides in a facility with inherent deficiencies and the backup datacenter is not completely operational.
Recommendation: We recommend the District continue its efforts to implement a
comprehensive disaster recovery plan, a comprehensive change management policy and relocate the datacenter to a different, more secure location.
Management’s Response: The information technology department has completed the
disaster recovery plan and the change management policy, which will be implemented in the next two months. The datacenter is also in the later stages of construction and should be operational this fiscal year.

WASHOE COUNTY SCHOOL DISTRICT SCHEDULE OF FINDINGS AND QUESTIONED COSTS
FOR THE YEAR ENDED JUNE 30, 2009
196
Findings and Questioned Costs for Major Federal Award Programs: Finding 09-3: U.S. Department of Education; passed through from the Nevada Department of Education: Title I Grants to Local Education Agencies, CFDA #84.010 Grant Award Number: Affects grant award number 09-2712-16 included under CFDA
84.010 on the Schedule of Expenditures of Federal Awards. Criteria and Condition: The OMB Circular A-133 Compliance Supplement states that non-
federal entities must follow procedures to minimize the time elapsing between the transfer of funds from the pass-through entity and their disbursement.
While reviewing the accounting treatment of costs for providing
school-choice transportation, we noted that the District posted one journal entry in the amount of $378,729 in November 2008 to transfer the full amount of the estimated costs to provide those services for the year from the Transportation Department to a Title I expenditure account. Subsequently, a Request for Funds was submitted in December 2008, and the Request included the full amount of the transportation costs that had been recorded in the Title I expenditure account. As the full amount for the fiscal year was included, the Request for Funds included amounts for school-choice transportation costs that had not yet been incurred and earned.
Questioned Costs: None. Context: The condition above appears to be a systemic problem. The
District ordinarily draws funds on an after-the fact basis and routinely has a receivable balance throughout the year. These expenditure amounts are for costs transferred from another fund rather than for amounts expended through the normal transaction cycle, which are generally paid out when posted to the accounting system.
Effect: The District was reimbursed for expenses it had not yet incurred
and may have earned interest on the advanced funds. Cause: The District did not have policies and procedures in place
regarding the transfer of the school-choice transportation costs from the Transportation Department to the Title I grant expenditure account to ensure amounts were drawn only for immediate cash needs.

WASHOE COUNTY SCHOOL DISTRICT SCHEDULE OF FINDINGS AND QUESTIONED COSTS
FOR THE YEAR ENDED JUNE 30, 2009
197
Recommendation: We recommend the District implement procedures over the transfer of costs related to school-choice transportation from the Transportation Department to the Title I grant to ensure amounts are recorded on a periodic, after-the-fact, basis to avoid drawing funds in advance.
Management’s Response: See management’s response on page 198.


WASHOE COUNTY SCHOOL DISTRICT SUMMARY SCHEDULE OF PRIOR YEAR FINDINGS AND QUESTIONED COSTS
FOR THE YEAR ENDED JUNE 30, 2009
199
Findings Relating to the Financial Statements Reported in Accordance to GAGAS: Finding 08-1 Significant Deficiency: Finding Summary: We noted that there was a lack of segregation in duties within the
District’s payroll department whereby the same individual had the ability to both process a manual payroll check and also transmit the payroll check data to the District’s bank, thereby authorizing the bank to fund the check. Also, while testing a sample of payroll transactions, we noted that for two amounts the number of hours paid did not agree to the number of hours noted on the supporting timesheet.
Management’s Response: The payroll department has now segregated the duties noted in
this finding. The payroll supervisor or the PERS technician will issue manual checks. The payroll coordinator will upload the check into bank portal. In the event the payroll coordinator is out of the office, the payroll supervisor will handle the banking transaction and the PERS Technician will handle the check writing.
To address the issue on the sample testing, the payroll department is currently reviewing the batch proof process and will update this area as needed to eliminate these errors.
Finding Status: The Payroll Department has now segregated the duties
associated with the processing of a manual check. The PERS Technician or the Payroll Supervisor issues a manual check. The Payroll Coordinator documents the manual check and uploads the check into the bank portal. In the event the Payroll Coordinator is out of the office, the Payroll Supervisor will handle the documentation and banking transaction and the PERS Technician will issue the manual check. Documentation of the manual check is then forwarded to the Accountant for review and documentation to accompany the monthly bank reconciliation. To address the issue on the sample testing, the Payroll Department in March 2009 provided timekeepers with formatted and protected electronic timesheet files with written instructions. The use of this protected file eliminates errors in the total hours on submitted timesheets. In April 2009, the Payroll Coordinator attended a school secretaries training to review the use of the electronic timesheet files and there was a good understanding of how this tool was to be used. The Payroll Department continues

WASHOE COUNTY SCHOOL DISTRICT SUMMARY SCHEDULE OF PRIOR YEAR FINDINGS AND QUESTIONED COSTS
FOR THE YEAR ENDED JUNE 30, 2009
200
to provide instruction to timekeepers on the use of this tool as needed. The use of the electronic timesheets is now a requirement and the Payroll Department will not accept timesheets that were not prepared using the electronic timesheet file provided. The District’s IFAS development team has started working on the set up for Time Cards On-line. This project will eventually allow timekeepers to enter time cards on-line and certify (electronically sign) time card entry for use by the Payroll Department in preparing payroll. This project will be set up and tested in phases to included testing and evaluation input by the Payroll Department.
Finding 08-2 Significant Deficiency: Finding Summary: The District depends heavily on information technology systems
and any disruption caused by a disaster could result in operating difficulties. Managing the changes to the information technology environment is necessary to ensure changes occur effectively and to prevent unauthorized changes. The location of the District’s datacenter is crucial to the security of the information technology environment.
We noted that while the District’s information technology staff has made significant advancements in developing a comprehensive disaster recovery plan and a comprehensive change management policy, neither were fully implemented at June 30, 2008. In addition, while an offsite backup datacenter is currently under construction, the current location of the District’s datacenter has several deficiencies that put the District at risk in the event of a catastrophe such as a fire or flood.
Management’s Response: We concur with the findings and recommendations. The District
has committed to establishing a backup site at the Corporate Way facility which is currently being remodeled. The Board of Trustees has allocated funding for Phase One (of three) hardware and software for this facility. A Comprehensive Disaster Recovery plan and a Change Management policy are currently being processed for inclusion as Continuous Systems Improvement (CSI) procedures.
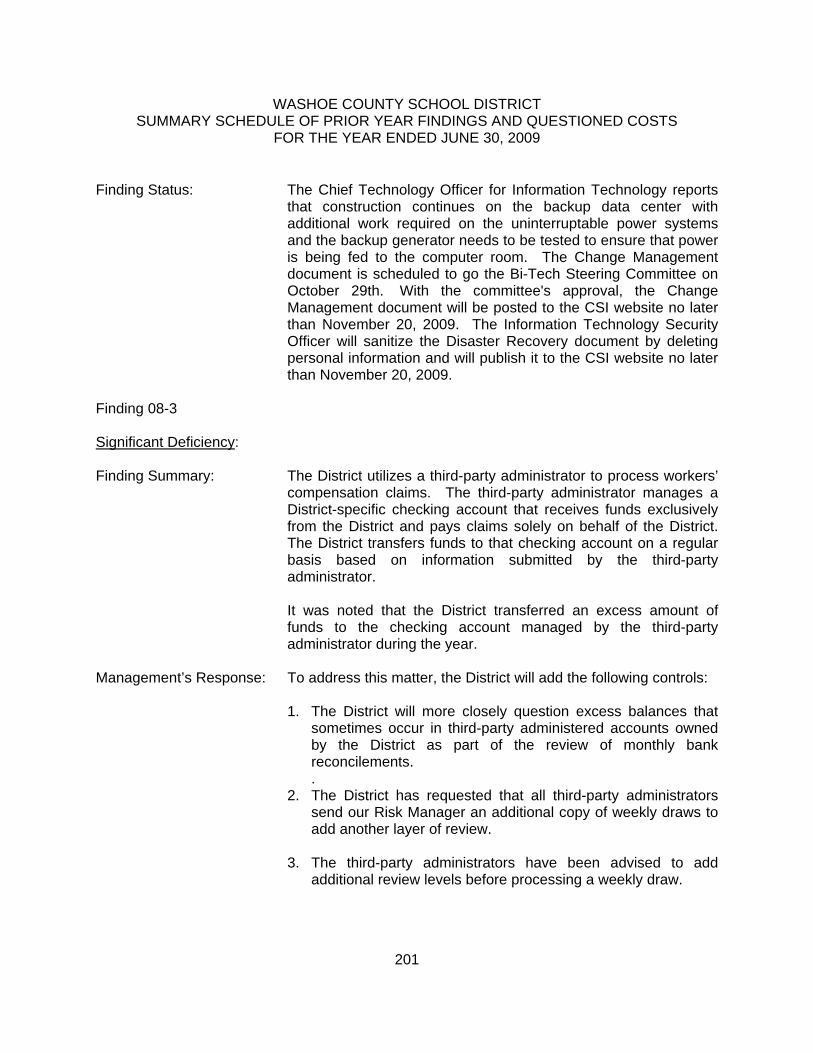
WASHOE COUNTY SCHOOL DISTRICT SUMMARY SCHEDULE OF PRIOR YEAR FINDINGS AND QUESTIONED COSTS
FOR THE YEAR ENDED JUNE 30, 2009
201
Finding Status: The Chief Technology Officer for Information Technology reports that construction continues on the backup data center with additional work required on the uninterruptable power systems and the backup generator needs to be tested to ensure that power is being fed to the computer room. The Change Management document is scheduled to go the Bi-Tech Steering Committee on October 29th. With the committee's approval, the Change Management document will be posted to the CSI website no later than November 20, 2009. The Information Technology Security Officer will sanitize the Disaster Recovery document by deleting personal information and will publish it to the CSI website no later than November 20, 2009.
Finding 08-3 Significant Deficiency: Finding Summary: The District utilizes a third-party administrator to process workers’
compensation claims. The third-party administrator manages a District-specific checking account that receives funds exclusively from the District and pays claims solely on behalf of the District. The District transfers funds to that checking account on a regular basis based on information submitted by the third-party administrator.
It was noted that the District transferred an excess amount of
funds to the checking account managed by the third-party administrator during the year.
Management’s Response: To address this matter, the District will add the following controls: 1. The District will more closely question excess balances that
sometimes occur in third-party administered accounts owned by the District as part of the review of monthly bank reconcilements. .
2. The District has requested that all third-party administrators send our Risk Manager an additional copy of weekly draws to add another layer of review.
3. The third-party administrators have been advised to add additional review levels before processing a weekly draw.

WASHOE COUNTY SCHOOL DISTRICT SUMMARY SCHEDULE OF PRIOR YEAR FINDINGS AND QUESTIONED COSTS
FOR THE YEAR ENDED JUNE 30, 2009
202
4. As part of the year-end close, all third-party administrators will be required to submit a fiscal year statement of draws by June 30th which District staff will validate against the general ledger.
5. Finally, the District will post the June 30th book balance for
each District owned third-party administrator account into the general ledger as part of the year-end close.
Finding Status: All five controls outlined in Management’s Response in last year’s
audit were implemented in FY09. The addition of these controls for all Third Party Administrators has helped prevent the duplication of funds from being transferred into these respective checking accounts for claims.
Prior Year Findings and Questioned Costs for Federal Awards: Finding 08-4: U.S. Department of Education: Program: Fund For The Improvement Of Education, CFDA #84.215 Finding Summary: The OMB Circular A-133 Compliance Supplement states that non-
federal entities are prohibited from contracting with or making subawards under covered transactions to parties that are suspended or debarred or whose principals are suspended or debarred.
While reviewing a contract with a vendor that was funded under
the District’s Fund For The Improvement of Education - Character Education Program, it was noted that the contract did not contain a certification from the contractor that they were not suspended or debarred. In addition, there was no evidence that the District had taken steps to ensure the contractor was not suspended or debarred.
Management’s Response: In response to Finding 08-4, Washoe County School District
(WCSD) has implemented the following two corrective action procedures:
1) A Debarment Certification clause has been added to the
WCSD standard Independent Contractor form. This will ensure all Independent Contractors have certified they are not debarred/suspended from receiving federal funds.

WASHOE COUNTY SCHOOL DISTRICT SUMMARY SCHEDULE OF PRIOR YEAR FINDINGS AND QUESTIONED COSTS
FOR THE YEAR ENDED JUNE 30, 2009
203
2) A Debarment Certification form will be signed and kept on file before WCSD disburses state or federal funds to subgrantees. This would apply to Charter Schools (and other applicable organization) who receive state or federal funding to run their own programs through WCSD, as opposed to a contract to perform services for WCSD, which is covered in 1), above.
Finding Status: Corrective action has been fully implemented.