waste 4 fuel visual waste characterisation assessment · waste 4 fuel visual waste characterisation...
TRANSCRIPT

Waste 4 Fuel Visual Waste Characterisation Assessment Environment Agency
14 February 2014

Waste 4 Fuel Visual Waste Characterisation Assessment
Atkins Waste 4 Fuel | Revision 2.0 | 14 February 2014 2
Notice
This document and its contents have been prepared and are intended solely for the Environment Agency ’s information and use in relation to the Visual Waste Characterisation Assessment.
Atkins assumes no responsibility to any other party in respect of or arising out of or in connection with this document and/or its contents.
This document has 38 pages including the cover.
Document history
Job number: Document ref:
Revision Purpose description Originated Checked Reviewed Authorised Date
Rev 1.0 Draft GW JF JE JAS 17/01/14
Rev 2.0 Final GW JF JE JAS 14/02/14

Waste 4 Fuel Visual Waste Characterisation Assessment
Atkins Waste 4 Fuel | Revision 2.0 | 14 February 2014 3
Table of contents
Chapter Pages
1. Introduction 4 1.1. Background 4 1.2. Purpose of Report 4
2. Methodology 5 2.1. Waste Categories 6
3. Results 8 3.1. Assessment 8 3.2. Limitations 8
4. Conclusion 17
Appendices 18
Appendix A. Site Location 19
Appendix B. Site Plan 21
Appendix C. Photographs 23
Appendix D. Sampling Form 36
Tables Table 1. Material Categories 6 Table 2. Sample Results % Volume 9 Table 3. Average % Volume of Waste in Samples Assessed 17
Figures Figure 1. Sample Range % Volume 11 Figure 2. Average % Volume of Waste in Samples Assessed 12 Figure 3. Sample Observations 13
Waste 4 Fuel Visual Waste Characterisation Assessment
Atkins Waste 4 Fuel | Revision 2.0 | 14 February 2014 4
1. Introduction
1.1. Background Waste 4 Fuel currently operate a Waste Transfer Station (WTS) located at Cornwall Drive, Orpington, BR5 3JB. It is understood that the site operates under Permit number: EAWML/103312 and receives and transfers general skip waste, with a storage capacity of 5,000 tonnes per annum (plus a 10% excess) and an annual throughput of 150,000 tonnes. Following concern over the sites operation and a number of fires the site has been subject to an environmental permit suspension notice and all combustible waste is to be removed by the 1
st of May 2014. The site location is shown in Appendix A.
To further understand the volume and type of waste remaining the Environment Agency has appointed Atkins to undertake an assessment of the material currently contained within the site. The goal of the assessment was to: 1. Topographically survey the site to determine volume of waste residing within the limits of the site
boundary;
2. Visually characterise the waste to determine approximate composition i.e. volume of plastic, wood, rubble etc; and
3. Undertake ambient air sampling at the site boundary and at residential properties to determine concentrations of an extensive suite of organic compounds associated with the products of combustion and the potential risk to members of the public.
1.2. Purpose of Report The purpose of this report is to summarise the results of the visual waste characterisation undertaken during the site visit on the 19
th December 2013, item 2 of the above. All other aspects of work will be summarised in
separate reports.

Waste 4 Fuel Visual Waste Characterisation Assessment
Atkins Waste 4 Fuel | Revision 2.0 | 14 February 2014 5
2. Methodology
Two Atkins site engineers visited the Waste 4 Fuel site on Thursday the 19th of December 2013 for the
purpose of undertaking the visual waste characterisation. In order to conduct the visual assessment Atkins engineers proposed to extract a minimum of eight samples from the waste stockpile.
A random sampling approach was adopted throughout the sampling exercise although every effort was made to take samples across the length and breadth of the stockpile to capture older and newer deposits of waste.
Due to access constraints it was not possible to sample waste buried deeper in the stockpile. As a result all samples were taken from the stockpile edge and top which were accessible by the site excavator. As each sample was taken the approximate location was recorded, these are identified on the sample plan included within Appendix B.
Waste 4 Fuel provided Atkins with access to their excavator and driver to assist with obtaining the samples. A sample storage area was defined within the site to conduct the sampling (see Appendix B).
In order to undertake the sampling the following assessment methodology was followed.
Atkins directed the Waste 4 Fuel site excavator to an approximate and accessible sampling point. The driver was then instructed to take a single bucket load of waste and to deposit the chosen sample at the designated sample storage area. This process was repeated until a select number of samples were taken and which could fit within the sampling space allocated.
Once deposited to the tipping floor each sample was given a unique sample ID and the length, width and height recorded on the visual sample form (shown in Appendix D) to provide an estimate of volume;
Each sample was then evenly distributed over the sampling area using a hand shovel so as to ensure materials could be easily viewed and characterised;
Photographs of every sample were taken to provide a visual record; these images can be seen in Appendix C.
Both Atkins site engineers then visually estimated the volumetric composition of the waste’s main categories and subcategories through the following steps:
− The presence of each material observed was recorded onto the sample form. The perimeter of the sample was walked around to ensure that the waste was fairly assessed and material categories present were identified.
− The composition by volume of each major material category was estimated beginning with the category identified to be present in the largest volume. The process was then repeated for the next most common category.
− Each major material category identified was subsequently broken down into its subcategories. For example the major category Textiles was made of the subcategories Clothing, Carpet, Mattresses and Other. As for the major categories the total of the subcategories were estimated to collectively total 100 percent.
− All data was subsequently checked and discussed.
Once characterisation was complete the samples were set aside and new samples taken whereupon the process was repeated until all the samples were assessed. The remainder of the waste was removed following characterisation where it was then deposited back to the main waste stockpile by the excavator.

Waste 4 Fuel Visual Waste Characterisation Assessment
Atkins Waste 4 Fuel | Revision 2.0 | 14 February 2014 6
2.1. Waste Categories The major waste categories were defined based on the principle components expected within a municipal waste stream i.e. paper, cardboard, plastics, organic, metals etc. Subcategories were defined based on commonly expected materials within each major category. An example sub category of the Paper category for example would be Newspapers, Magazines, and Books etc. Table 1 details the list of wastes which were assessed during the sampling.
Table 1. Material Categories
Major Categories Subcategories
Paper
Newspapers, Magazines, Books etc.
Paper packaging
Other papers
Cardboard
Corrugated cardboard
Non-corrugated cardboard
Plastics
Rigid Plastic
Film Plastic
Plastic Strapping
Polystyrene Packaging
Organic
Food waste
Green/ garden waste
Wood
Furniture
Pallets, Crates
Other Untreated Wood
Other Painted, Stained Wood
Metals
Scrap metal
Food and beverage cans
Aerosol cans
Other metals
Glass
Bottles & Jars
Other Glass
Textiles
Clothing, Shoes, Bags, Sheets, Curtains etc.
Carpets
Mattresses
Other
Rubber
Tyres
Other Rubber

Waste 4 Fuel Visual Waste Characterisation Assessment
Atkins Waste 4 Fuel | Revision 2.0 | 14 February 2014 7
Major Categories Subcategories
Aggregate
Brick, Rubble, Masonry, Ceramic, Porcelain etc.
Rock, Gravel
Gypsum
Plasterboard
Other Gypsum
Fines
Dirt, Sand, Soil
WEEE
White Goods
Other WEEE
Hazardous
Light bulbs
Batteries
Gas Canisters
Solvents, petrol, oil, chemicals etc.
Other Hazardous

Waste 4 Fuel Visual Waste Characterisation Assessment
Atkins Waste 4 Fuel | Revision 2.0 | 14 February 2014 8
3. Results
3.1. Assessment
On the day of the analysis Atkins engineers characterised a total of ten samples. At certain points of the day sampling was restricted due to the need to wait for the excavator on site to finish clearing waste which was newly delivered.
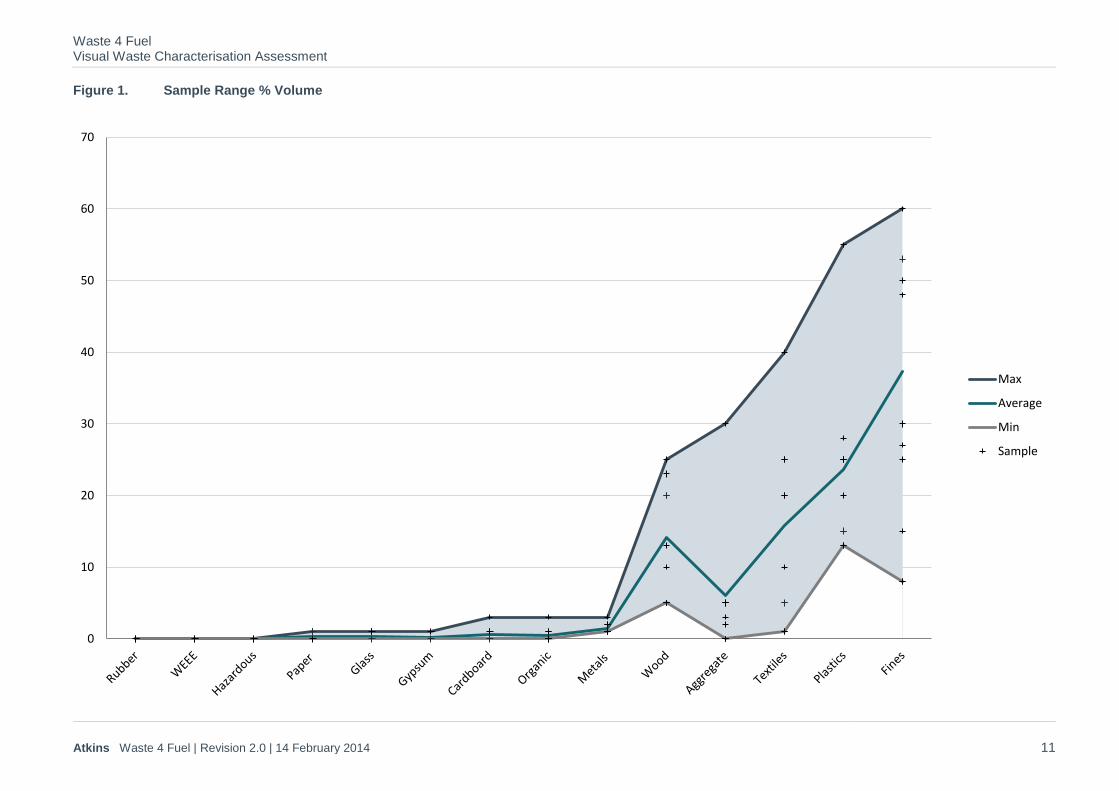
The results of the assessment are detailed in Table 2 with the minimum, maximum and average values recorded across the range of samples shown in Figure 1 (page 11). The overall average composition by volume determined from the samples assessed is shown in Figure 2. Example images of the samples and components assessed are shown in Figure 3 whilst all the photographs taken are contained in Appendix C.
It was clear from the samples that the waste materials identified were consistent with the information provided to Atkins by Waste 4 Fuel. Namely that the majority of waste appeared to originate from house clearances or building activities. Several of the samples contained ‘builders bags’ large bulk waste bags for containing assorted, but principally building related wastes. None of the samples assessed were seen to contain organic household food related waste. The highest recorded wastes in the overall average across the samples included 24% of plastics, with frequent plastic sheeting, 14% wood and 16% textiles which included carpets and/ or underlay in almost every sample, a mattress and tent on one occasion, and shed felt on two occasions. Other occasional materials included aggregates such as brick, rubble, masonry or ceramic tiles at 6%, although one instance of 30% was recorded. Rare instances of metals were observed although these were likely to have been limited because of possible extraction by the pre-sort process before the waste was deposited to the stockpile. This was evident by the large quantity of metal which was seen accumulating in one of the pre-sort bunkers.
By far the most common material recorded in all the samples were ‘fines’. This category was used to define much of the indistinguishable proportion of waste which comprised of what appeared to be small particles of decomposed waste, potentially comprising of wood and soil like matter, and which was present in many of the samples. It was difficult to assess this waste to determine its constituents. The overall average across the samples was almost 40% making this the largest proportion by volume of all the categories used, with a maximum of 60% recorded in one sample and 8% in the lowest. Many of the samples assessed appeared to be ‘older waste’ and in an advanced state of decomposition which would account for the higher volume of this material. It is considered likely that much of the stockpile could comprise of this type of material as waste has decomposed and broken up over time.
Looking to the greater stockpile it was observed that much of the material was consistent with what was sampled as can be seen in Appendix C. The surface was covered in loose plastic sheeting, and the stockpile appeared to contain a high volume of plastic and wood. Other materials noted include items of furniture such as sofas and mattresses.
No hazardous waste was observed in the samples assessed. It was however observed during the unloading of an incoming refuse vehicle that a gas canister was found and removed by one of the members of site staff. Whilst likely to be empty this was stored appropriately in a secure cage, a demonstration of good practice management of the incoming waste. Numerous large print cartridges, such as may be used in large office printers, were spread across the lower areas of the site occasionally in high volume. A number of these were cracked and leaking their contents. Such inks have the potential to contain solvents, heavy metals and volatile organic compounds (VOCs) although the quantity of ink did not appear to be significant.
3.2. Limitations It should be noted that this assessment can provide an indication of the waste composition only, and as determined from the samples which were taken. It is possible that other waste components may exist within the stockpile which were not captured by the samples taken. In order to provide a holistic and more robust view of the stockpile a detailed sampling strategy would be required. This would involve a significantly greater number of samples to achieve statistically suitable levels of accuracy and precision and a thorough analysis of each sample, including measurement of categories according to mass.

Waste 4 Fuel Visual Waste Characterisation Assessment
Atkins Waste 4 Fuel | Revision 2.0 | 14 February 2014 9
Table 2. Sample Results % Volume
Sample No. 1 2 3 4 5 6 7 8 9 10
Average Date: 19/12/13 19/12/13 19/12/13 19/12/13 19/12/13 19/12/13 19/12/13 19/12/13 19/12/13 19/12/13
Time: 9.45 10.07 10.38 11.03 13.22 13.43 14.08 14.22 14.42 15.06
Volume (m3) 1.20 1.80 1.20 1.70 1.60 1.30 1.60 1.00 1.70 0.90 1.40
MSW Component Volume (%)
Paper 0.00 0.00 0.00 0.00 1.00 0.00 1.00 0.00 1.00 0.00 0.30
Newspapers, Magazines, Books etc. 0.00 0.00 0.00 0.00 0.00 0.00 0.00 0.00 0.00 0.00 0.00
Paper packaging 0.00 0.00 0.00 0.00 0.00 0.00 0.00 0.00 0.00 0.00 0.00
Other papers 0.00 0.00 0.00 0.00 1.00 0.00 1.00 0.00 1.00 0.00 0.30
Cardboard 0.00 1.00 0.00 0.00 1.00 3.00 0.00 0.00 0.00 1.00 0.60
Corrugated cardboard 0.00 1.00 0.00 0.00 0.00 0.00 0.00 0.00 0.00 1.00 0.20
Non-corrugated cardboard 0.00 0.00 0.00 0.00 1.00 3.00 0.00 0.00 0.00 0.00 0.40
Plastics 15.00 20.00 15.00 28.00 25.00 55.00 25.00 25.00 15.00 13.00 23.60
Rigid Plastic 5.00 5.00 2.00 9.00 7.00 5.00 7.00 3.00 3.00 3.00 4.90
Film Plastic 9.00 15.00 10.00 18.00 17.00 40.00 17.00 22.00 12.00 10.00 17.00
Plastic Strapping 1.00 0.00 3.00 1.00 0.00 0.00 1.00 0.00 0.00 0.00 0.60
Polystyrene Packaging 0.00 0.00 0.00 0.00 1.00 10.00 0.00 0.00 0.00 0.00 1.10
Organic 0.00 0.00 0.00 1.00 0.00 3.00 0.00 1.00 0.00 0.00 0.50
Food waste 0.00 0.00 0.00 0.00 0.00 0.00 0.00 0.00 0.00 0.00 0.00
Green/ garden waste 0.00 0.00 0.00 1.00 0.00 3.00 0.00 1.00 0.00 0.00 0.50
Wood 15.00 10.00 13.00 5.00 5.00 5.00 25.00 20.00 20.00 23.00 14.10
Furniture 0.00 0.00 0.00 0.00 0.00 0.00 0.00 3.00 0.00 0.00 0.30
Pallets, Crates 0.00 0.00 0.00 0.00 0.00 0.00 0.00 17.00 0.00 0.00 1.70
Other Untreated Wood 7.50 10.00 13.00 0.00 5.00 0.00 0.00 0.00 0.00 0.00 3.55
Other Painted, Stained Wood 7.50 0.00 0.00 5.00 0.00 5.00 25.00 0.00 20.00 23.00 8.55
Metals 1.00 2.00 1.00 1.00 2.00 1.00 3.00 1.00 1.00 1.00 1.40
Scrap metal 0.00 0.00 0.00 0.00 0.00 0.00 0.00 0.00 0.00 0.00 0.00
Food and beverage cans 0.00 0.00 1.00 1.00 0.00 1.00 0.00 1.00 1.00 1.00 0.60
Aerosol cans 0.00 2.00 0.00 0.00 1.00 0.00 0.00 0.00 0.00 0.00 0.30
Other metals 1.00 0.00 0.00 0.00 1.00 0.00 3.00 0.00 0.00 0.00 0.50
Glass 0.00 0.00 0.00 0.00 1.00 0.00 0.00 1.00 0.00 1.00 0.30
Bottles & Jars 0.00 0.00 0.00 0.00 0.00 0.00 0.00 0.00 0.00 0.00 0.00
Other Glass 0.00 0.00 0.00 0.00 1.00 0.00 0.00 1.00 0.00 1.00 0.30
Textiles 7.00 5.00 20.00 40.00 10.00 25.00 1.00 20.00 5.00 25.00 15.80
Clothing, Shoes, Bags, Sheets, etc. 7.00 2.50 3.00 5.00 2.00 8.00 1.00 3.00 4.00 3.00 3.85
Carpets 0.00 2.50 10.00 15.00 8.00 3.00 0.00 17.00 1.00 15.00 7.15
Mattresses 0.00 0.00 0.00 20.00 0.00 0.00 0.00 0.00 0.00 0.00 2.00
Other 0.00 0.00 7.00 0.00 0.00 14.00 0.00 0.00 0.00 7.00 2.80

Waste 4 Fuel Visual Waste Characterisation Assessment
Atkins Waste 4 Fuel | Revision 2.0 | 14 February 2014 10
Sample No. 1 2 3 4 5 6 7 8 9 10
Average Date: 19/12/13 19/12/13 19/12/13 19/12/13 19/12/13 19/12/13 19/12/13 19/12/13 19/12/13 19/12/13
Time: 9.45 10.07 10.38 11.03 13.22 13.43 14.08 14.22 14.42 15.06
Volume (m3) 1.20 1.80 1.20 1.70 1.60 1.30 1.60 1.00 1.70 0.90 1.40
MSW Component Volume (%)
Rubber 0.00 0.00 0.00 0.00 0.00 0.00 0.00 0.00 0.00 0.00 0.00
Tyres 0.00 0.00 0.00 0.00 0.00 0.00 0.00 0.00 0.00 0.00 0.00
Other Rubber 0.00 0.00 0.00 0.00 0.00 0.00 0.00 0.00 0.00 0.00 0.00
Aggregate 5.00 2.00 3.00 0.00 5.00 0.00 30.00 5.00 5.00 5.00 6.00
Brick, Rubble, Masonry, Ceramic, etc. 5.00 2.00 3.00 0.00 5.00 0.00 30.00 5.00 5.00 5.00 6.00
Rock, Gravel 0.00 0.00 0.00 0.00 0.00 0.00 0.00 0.00 0.00 0.00 0.00
Gypsum 0.00 0.00 0.00 0.00 0.00 0.00 0.00 0.00 0.00 1.00 0.10
Plasterboard 0.00 0.00 0.00 0.00 0.00 0.00 0.00 0.00 0.00 1.00 0.10
Other Gypsum 0.00 0.00 0.00 0.00 0.00 0.00 0.00 0.00 0.00 0.00 0.00
Fines 57.00 60.00 48.00 25.00 50.00 8.00 15.00 27.00 53.00 30.00 37.30
Dirt, Sand, Soil 57.00 60.00 48.00 25.00 50.00 8.00 15.00 27.00 53.00 30.00 37.30
WEEE 0.00 0.00 0.00 0.00 0.00 0.00 0.00 0.00 0.00 0.00 0.00
White Goods 0.00 0.00 0.00 0.00 0.00 0.00 0.00 0.00 0.00 0.00 0.00
Other WEEE 0.00 0.00 0.00 0.00 0.00 0.00 0.00 0.00 0.00 0.00 0.00
Hazardous 0.00 0.00 0.00 0.00 0.00 0.00 0.00 0.00 0.00 0.00 0.00
Light bulbs 0.00 0.00 0.00 0.00 0.00 0.00 0.00 0.00 0.00 0.00 0.00
Batteries 0.00 0.00 0.00 0.00 0.00 0.00 0.00 0.00 0.00 0.00 0.00
Gas Canisters 0.00 0.00 0.00 0.00 0.00 0.00 0.00 0.00 0.00 0.00 0.00
Solvents, petrol, oil, chemicals etc. 0.00 0.00 0.00 0.00 0.00 0.00 0.00 0.00 0.00 0.00 0.00
Other Hazardous 0.00 0.00 0.00 0.00 0.00 0.00 0.00 0.00 0.00 0.00 0.00
Total 100.00 100.00 100.00 100.00 100.00 100.00 100.00 100.00 100.00 100.00 100.00
Waste 4 Fuel Visual Waste Characterisation Assessment
Atkins Waste 4 Fuel | Revision 2.0 | 14 February 2014 11
Figure 1. Sample Range % Volume
0
10
20
30
40
50
60
70
Max
Average
Min
Sample

Waste 4 Fuel Visual Waste Characterisation Assessment
Atkins Waste 4 Fuel | Revision 2.0 | 14 February 2014 12
Figure 2. Average % Volume of Waste in Samples Assessed
Paper <1%
Cardboard 1%
Plastics 24%
Organic 1%
Wood 14%
Metals 1%
Glass <1% Textiles
16%
Aggregate 6%
Gypsum <1%
Fines 37%

Waste 4 Fuel Visual Waste Characterisation Assessment
Atkins Waste 4 Fuel | Revision 2.0 | 14 February 2014 13
Figure 3. Sample Observations
Sample 1
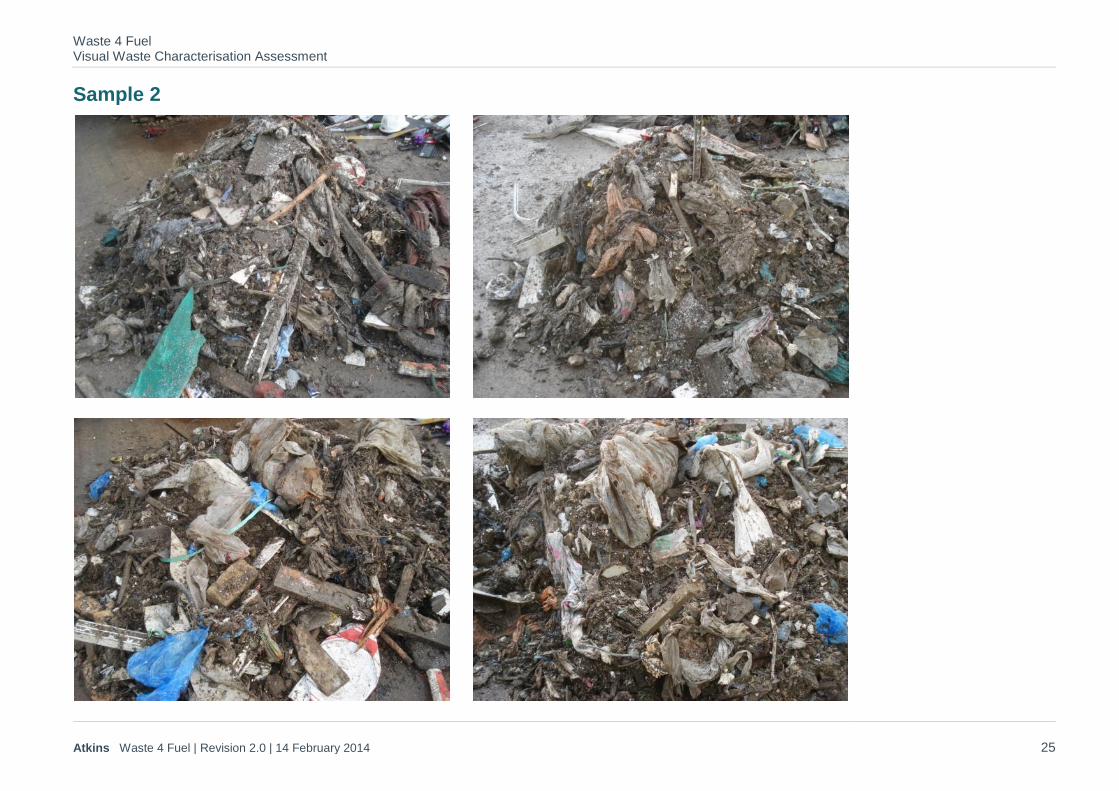
Sample 2
High volume of fines; decomposed materials and woody debris.
Plastic sheeting
Wood
Builders bag
Wood
Plastic bags
Plastic sheeting
Sample 3 Carpet
Aggregate
Wood
Plastic bags/ sheeting
High volume of fines; decomposed materials and woody debris.
High volume of fines; decomposed materials and woody debris.

Waste 4 Fuel Visual Waste Characterisation Assessment
Atkins Waste 4 Fuel | Revision 2.0 | 14 February 2014 14
Sample 4
Sample 5
Sample 6
Carpet
Plastic piping
Car bumper
Plastic Sheeting
Builders bag
Plastic container
Plastic Sheeting Aggregate
Dense plastic
Cardboard
Tent
Plastic garden fencing
Plastic bags/ sheeting
Green waste
Insulation
Bitumen roof felt
High volume of fines; decomposed materials and woody debris.

Waste 4 Fuel Visual Waste Characterisation Assessment
Atkins Waste 4 Fuel | Revision 2.0 | 14 February 2014 15
Sample 7
Sample 8
Sample 9
Wood
Aggregate
Dense plastic
Plastic bags/ sheeting
Carpet
Plastic bags/ sheeting
Carpet
Plastic bags/ sheeting
Underlay
Dense plastic
Metal
High volume of fines; decomposed materials and woody debris.

Waste 4 Fuel Visual Waste Characterisation Assessment
Atkins Waste 4 Fuel | Revision 2.0 | 14 February 2014 16
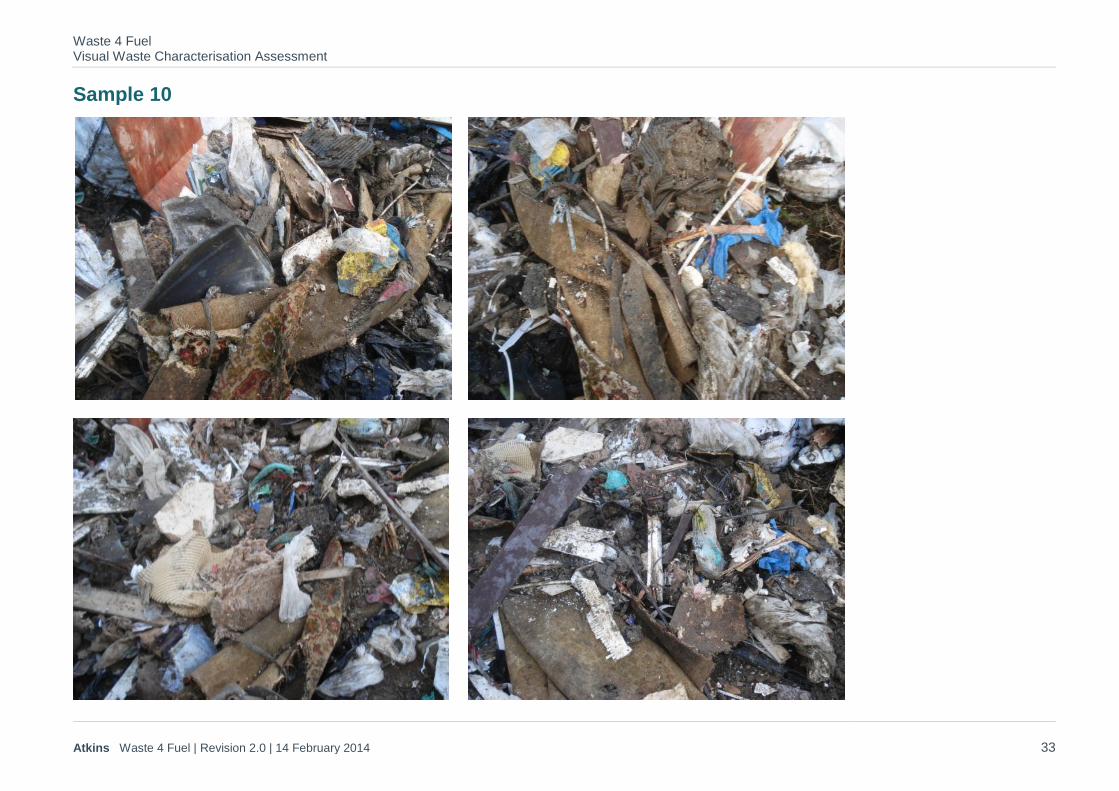
Sample 10
High volume of fines; decomposed materials and woody debris.
Plastic bags/ sheeting
Builders bag

Waste 4 Fuel Visual Waste Characterisation Assessment
Atkins Waste 4 Fuel | Revision 2.0 | 14 February 2014 17
4. Conclusion
Table 3 provides the overall average waste composition assessed.
It can be concluded that much of the waste assessed was consistent with the type of material which may arise from house clearance activities or associated building works, as was noted to be the source of much of the waste by Waste 4 Fuel. The vast majority of waste assessed contained high volumes of fines with an average of almost 40%. The fines were composed of smaller particles of waste which appeared to be degraded and of a woody, soil based nature, although much of this material was hard to classify in itself. It could be assumed that a reasonable proportion of the stockpile is comprised of this type of material.
The other dominant categories of waste were plastics; averaging 24%, with a high volume of plastic sheeting type wastes, textiles; averaging 16%, principally carpets, clothing, a mattress and similar materials, and wood at 14%. Infrequent observations of materials such as paper, cardboard, glass and metal were found. The lack of metal is felt to be likely due to the pre-sort and metal removing process used before waste is deposited to the stockpile.
Table 3. Average % Volume of Waste in Samples Assessed
Waste Component Average Max Min
Paper 0.3 1 0
Cardboard 0.6 3 0
Plastics 23.6 55 13
Organic 0.5 3 0
Wood 14.1 25 5
Metals 1.4 3 1
Glass 0.3 1 0
Textiles 15.8 40 1
Rubber 0 0 0
Aggregate 6 30 0
Gypsum 0.1 1 0
Fines 37.3 60 8
WEEE 0 0 0
Hazardous 0 0 0
Total 100
Whilst no hazardous waste was noted within the samples assessed a gas bottle was seen to be removed from an incoming refuse vehicle. Whilst likely to be empty this was stored appropriately in a secure cage, a demonstration of good practice management of the incoming waste. Numerous large print cartridges were spread across the lower areas of the site occasionally leaking their contents; although the quantity of ink did not appear to be significant. Such inks may be solvent based and contain heavy metals and volatile organic compounds (VOCs). It should also be generally noted that the majority of waste was of a combustible nature, as apparent from the recent fires which have occurred within the site.
As aforementioned the assessment can provide a guideline of the waste composition only, and as determined from the samples which were taken. In order to provide a holistic and more detailed view of the stockpile, a more robust sampling strategy involving a greater number of samples to achieve statistically suitable levels of accuracy and precision would be required.

Appendices

Waste 4 Fuel Visual Waste Characterisation Assessment
Atkins Waste 4 Fuel | Revision 2.0 | 14 February 2014 19
Appendix A. Site Location

Waste 4 Fuel Visual Waste Characterisation Assessment
Atkins Waste 4 Fuel | Revision 2.0 | 14 February 2014 20
Site Location

Waste 4 Fuel Visual Waste Characterisation Assessment
Atkins Waste 4 Fuel | Revision 2.0 | 14 February 2014
Appendix B. Site Plan

Waste 4 Fuel Visual Waste Characterisation Assessment
Atkins Waste 4 Fuel | Revision 2.0 | 14 February 2014 22
Sample Locations
1
2
3 4
5 6
7 8
9
10
0
Mechanical Sorting/ Material Stockpiles
Cabins
Weighbridge
Sampling Area

Waste 4 Fuel Visual Waste Characterisation Assessment
Atkins Waste 4 Fuel | Revision 2.0 | 14 February 2014
Appendix C. Photographs

Waste 4 Fuel Visual Waste Characterisation Assessment
Atkins Waste 4 Fuel | Revision 2.0 | 14 February 2014 24
Sample 1
Waste 4 Fuel Visual Waste Characterisation Assessment
Atkins Waste 4 Fuel | Revision 2.0 | 14 February 2014 25
Sample 2

Waste 4 Fuel Visual Waste Characterisation Assessment
Atkins Waste 4 Fuel | Revision 2.0 | 14 February 2014 26
Sample 3

Waste 4 Fuel Visual Waste Characterisation Assessment
Atkins Waste 4 Fuel | Revision 2.0 | 14 February 2014 27
Sample 4

Waste 4 Fuel Visual Waste Characterisation Assessment
Atkins Waste 4 Fuel | Revision 2.0 | 14 February 2014 28
Sample 5

Waste 4 Fuel Visual Waste Characterisation Assessment
Atkins Waste 4 Fuel | Revision 2.0 | 14 February 2014 29
Sample 6

Waste 4 Fuel Visual Waste Characterisation Assessment
Atkins Waste 4 Fuel | Revision 2.0 | 14 February 2014 30
Sample 7

Waste 4 Fuel Visual Waste Characterisation Assessment
Atkins Waste 4 Fuel | Revision 2.0 | 14 February 2014 31
Sample 8

Waste 4 Fuel Visual Waste Characterisation Assessment
Atkins Waste 4 Fuel | Revision 2.0 | 14 February 2014 32
Sample 9
Waste 4 Fuel Visual Waste Characterisation Assessment
Atkins Waste 4 Fuel | Revision 2.0 | 14 February 2014 33
Sample 10

Waste 4 Fuel Visual Waste Characterisation Assessment
Atkins Waste 4 Fuel | Revision 2.0 | 14 February 2014 34
Excavator Sampling

Waste 4 Fuel Visual Waste Characterisation Assessment
Atkins Waste 4 Fuel | Revision 2.0 | 14 February 2014 35
Stockpile

Waste 4 Fuel Visual Waste Characterisation Assessment
Atkins Waste 4 Fuel | Revision 2.0 | 14 February 2014
Appendix D. Sampling Form

Date: Length (cm)
Time: Width (cm)
Sample No. Height (cm)
Your Initials Volume (m3) (L x W x H)
Paper
Newspapers, Magazines, Books etc.
Paper packaging
Other papers
Cardboard
Corrugated cardboard
Non-corrugated cardboard
Plastics
Rigid Plastic
Film Plastic
Plastic Strapping
Polystyrene Packaging
Organic
Food waste
Green/ garden waste
Wood
Furniture
Pallets, Crates
Other Untreated Wood
Other Painted, Stained Wood
Metals
Scrap metal
Food and beverage cans
Aerosol cans
Other metals
Glass
Bottles & Jars
Other Glass
Textiles
Clothing, Shoes, Bags, Sheets, Curtains etc.
Carpets
Mattresses
Rubber
Tyres
Other Rubber
Aggregate
Brick, Rubble, Masonary, Ceramic, Porcelain etc.
Rock, Gravel
Gypsum
Plasterboard
Other Gypsum
Fines
Dirt, Sand, Soil
WEEE
White Goods
Other WEEE
Hazardous
Light bulbs
Batteries
Gas Canisters
Solvents, petrol, oil, chemicals etc.
Other Hazardous
Notes:
Total
Sample Details Volume Measurement
Sample Location
(i.e. lower/ upper part of stockpile, south/ north/ central etc.)
Mark on Plan
Present Volume (%)MSW Component Comments

© Atkins Ltd except where stated otherwise. The Atkins logo, ‘Carbon Critical Design’ and the strapline ‘Plan Design Enable’ are trademarks of Atkins Ltd.
Atkins Woodcote Grove Ashley Road Epsom Surrey KT18 5BW Telephone: +44 (0)1372 726140 Email: [email protected]