waste-to-energy: hawaii and guam energy … · the united states government ... nrel would also...
TRANSCRIPT

NREL is a national laboratory of the U.S. Department of Energy Office of Energy Efficiency & Renewable Energy Operated by the Alliance for Sustainable Energy, LLC
This report is available at no cost from the National Renewable Energy Laboratory (NREL) at www.nrel.gov/publications.
Contract No. DE-AC36-8GO28308
National Renewable Energy Laboratory 15013 Denver West Parkway Golden, CO 80401 303-275-3000 • www.nrel.gov
Waste-to-Energy Hawaii and Guam Energy Improvement Technology Demonstration Project J. Davis, R. Gelman, G. Tomberlin, and R. Bain National Renewable Energy Laboratory
Technical Report NREL/TP-7A40-60868 March 2014
Produced under direction of Naval Facilities Engineering Command (NAVFAC) by the National Renewable Energy Laboratory (NREL) under Interagency Agreement 11-01829 and Task Nos. WFK3.6000 and WFK3.6020.
NREL is a national laboratory of the U.S. Department of Energy Office of Energy Efficiency & Renewable Energy Operated by the Alliance for Sustainable Energy, LLC
This report is available at no cost from the National Renewable Energy Laboratory (NREL) at www.nrel.gov/publications.
Contract No. DE-AC36-8GO28308
National Renewable Energy Laboratory 15013 Denver West Parkway Golden, CO 80401 303-275-3000 • www.nrel.gov
Waste-to-Energy Hawaii and Guam Energy Improvement Technology Demonstration Project J. Davis, R. Gelman, G. Tomberlin, and R. Bain National Renewable Energy Laboratory
Prepared under Task Nos. WFK3.6000 and WFK3.6020
Technical Report NREL/TP-7A40-60868 March 2014
NOTICE This manuscript has been authored by employees of the Alliance for Sustainable Energy, LLC (“Alliance”) under Contract No. DE-AC36-08GO28308 with the U.S. Department of Energy (“DOE”). This report was prepared as an account of work sponsored by an agency of the United States government. Neither the United States government nor any agency thereof, nor any of their employees, makes any warranty, express or implied, or assumes any legal liability or responsibility for the accuracy, completeness, or usefulness of any information, apparatus, product, or process disclosed, or represents that its use would not infringe privately owned rights. Reference herein to any specific commercial product, process, or service by trade name, trademark, manufacturer, or otherwise does not necessarily constitute or imply its endorsement, recommendation, or favoring by the United States government or any agency thereof. The views and opinions of authors expressed herein do not necessarily state or reflect those of the United States government or any agency thereof.
Printed on paper containing at least 50% wastepaper, including 10% post consumer waste.
iii
Acknowledgements The National Renewable Energy Laboratory (NREL) is grateful for the significant efforts expended by the Naval Facilities Engineering Command (NAVFAC) Headquarters and the Pacific and Hawaii teams in preparation for deploying this waste-to-energy (WTE) system to the Joint Base Pearl Harbor-Hickam, Hawaii.
NREL would also like to thank several Army organizations for their critical role in enabling and supporting this project. We are grateful to the Army Research Laboratory for allowing the WTE system to be used for this demonstration, to the Natick Soldier Research Development and Engineering Center for their role in developing and funding part of the system, and to the U.S. Army Installation Management Command, Pacific for facilitating the initial discussions regarding the project.
We would also like to express our sincere gratitude to the staff of the Hickam Commissary and the Defense Commissary Agency headquarters for their motivation to implement this project. While the project did not make it to the field demonstration phase, the progress made during the year and a half of discussions between stakeholders would not have been possible without the support of all participants mentioned above.
This report is available at no cost from the National Renewable Energy Laboratory (NREL) at www.nrel.gov/publications.

iv
List of Abbreviations and Acronyms ARL Army Research Laboratory
Btu British thermal unit
CF capacity factor
CO carbon monoxide
CPC Community Power Corporation
DAG Defense Acquisition Guidebook
DECA Defense Commissary Agency
DOD U.S. Department of Defense
DOE U.S. Department of Energy
EPA U.S. Environmental Protection Agency
EROI energy return on investment
ESTCP Environmental Security Technology Certification Program
FY fiscal year
GEM Green Energy Machine
H2S hydrogen sulfide
HECO Hawaii Electric Company
HEDWEC high-energy densification waste-to-energy conversion
HHV higher heating value
IBC International Building Code
IC internal combustion
IPT Integrated Product Team
JPBHH Joint Base Pearl Harbor-Hickam
kg kilogram
kW kilowatt
kWe kilowatts electric
This report is available at no cost from the National Renewable Energy Laboratory (NREL) at www.nrel.gov/publications.
v
kWth kilowatts thermal
m3 cubic meter
MOA memorandum of agreement
MPM material processing module
MSW municipal solid waste
MTBF mean time between failures
MTTR mean time to repair
NASA U.S. National Aeronautics and Space Administration
NAVFAC Naval Facilities Engineering Command
NEPA National Environmental Policy Act
NFPA National Fire Protection Association
Nm3/hr normal cubic meters per hour
NOx nitrogen oxide
NREL National Renewable Energy Laboratory
NSRDEC Natick Soldier Research Development and Engineering Center
O&M operation and maintenance
OPNAVINST Office of the Chief of Naval Operations Instruction
PE professional engineer
PM particle matter
PUC Public Utility Commission
scf standard cubic feet
SO2 sulfur dioxide
SOx sulfur oxides
TCLP toxicity characteristic leaching procedure
TRL technology readiness level
UFGS Unified Facilities Guide Specifications
This report is available at no cost from the National Renewable Energy Laboratory (NREL) at www.nrel.gov/publications.
vi
UFC Unified Facilities Criteria
WWTP wastewater treatment plant
WTE waste-to-energy
This report is available at no cost from the National Renewable Energy Laboratory (NREL) at www.nrel.gov/publications.

vii
Executive Summary The National Renewable Energy Laboratory (NREL) and the U.S. Navy have worked together to demonstrate new or leading-edge commercial energy technologies whose deployment will support the U.S. Department of Defense (DOD) in meeting its energy efficiency and renewable energy goals while enhancing installation energy security. This is consistent with the 2010 Quadrennial Defense Review report1 that encourages the use of “military installations as a test bed to demonstrate and create a market for innovative energy efficiency and renewable energy technologies coming out of the private sector and DOD and Department of Energy laboratories,” as well as the July 2010 memorandum of understanding between DOD and the U.S. Department of Energy (DOE) that documents the intent to “maximize DOD access to DOE technical expertise and assistance through cooperation in the deployment and pilot testing of emerging energy technologies.”
As part of this joint initiative, a promising waste-to-energy (WTE) technology was selected for demonstration at the Hickam Commissary aboard the Joint Base Pearl Harbor-Hickam (JBPHH), Hawaii. The WTE technology chosen is called high-energy densification waste-to-energy conversion (HEDWEC). HEDWEC technology is the result of significant U.S. Army investment in the development of WTE technology for forward operating bases. For example, the high cost of transporting fuel combined with the impractical and hazardous practice of solid waste disposal in burn pits or burn boxes led Natick Soldier Research Development and Engineering Center to initiate a WTE program in 2004. Several years of development and further support from the Army Research Laboratory resulted in HEDWEC’s completion in 2010.
The technology provider, Community Power Corporation (CPC), developed HEDWEC from existing biomass gasification technology called BioMax, which had been successfully operated using biomass feedstock for over 10,000 hours of operating time. Gasification of certain biomass feedstocks is a relatively mature technology, with existing commercial applications around the world. Even more so, WTE using combustion is a mature technology, with hundreds of existing facilities operating around the world. The use of gasification to process municipal solid waste (MSW), however, is a WTE application that is not yet proven in commercial applications.
In the final stages of development for HEDWEC, CPC visited several remote locations that it believed would be good locations for demonstrating HEDWEC. With support from the U.S. Army and the Defense Commissary Agency (DeCA), and in coordination with Naval Facilities Engineering Command (NAVFAC) Hawaii, CPC proposed a concept for demonstrating HEDWEC at the Hickam Commissary. During initial scoping meetings for the Navy-NREL technology demonstration initiative, the Navy-NREL team identified the commissary project as a candidate for the Hawaii-Guam demonstration initiative. After conducting an initial viability assessment, the project was selected to be included in the program and an Integrated Product Team (IPT) was established to implement the concept.
The project was designed to use residual organic materials at the Hickam Commissary as feedstock, or fuel, for the HEDWEC system. DeCA routinely incurs high costs for disposal of these materials, estimated at $88,000 in 2010. Based on CPC’s past success with biomass feedstocks, such as woodchips or nut shells, the proposed concept involved processing the heterogeneous residual materials at the commissary to make them similar to the homogenous biomass feedstocks on which HEDWEC’s predecessor WTE systems have operated successfully. The proposed materials included butcher scraps,
1 For more information, see: www.defense.gov/qdr/.
This report is available at no cost from the National Renewable Energy Laboratory (NREL) at www.nrel.gov/publications.
viii
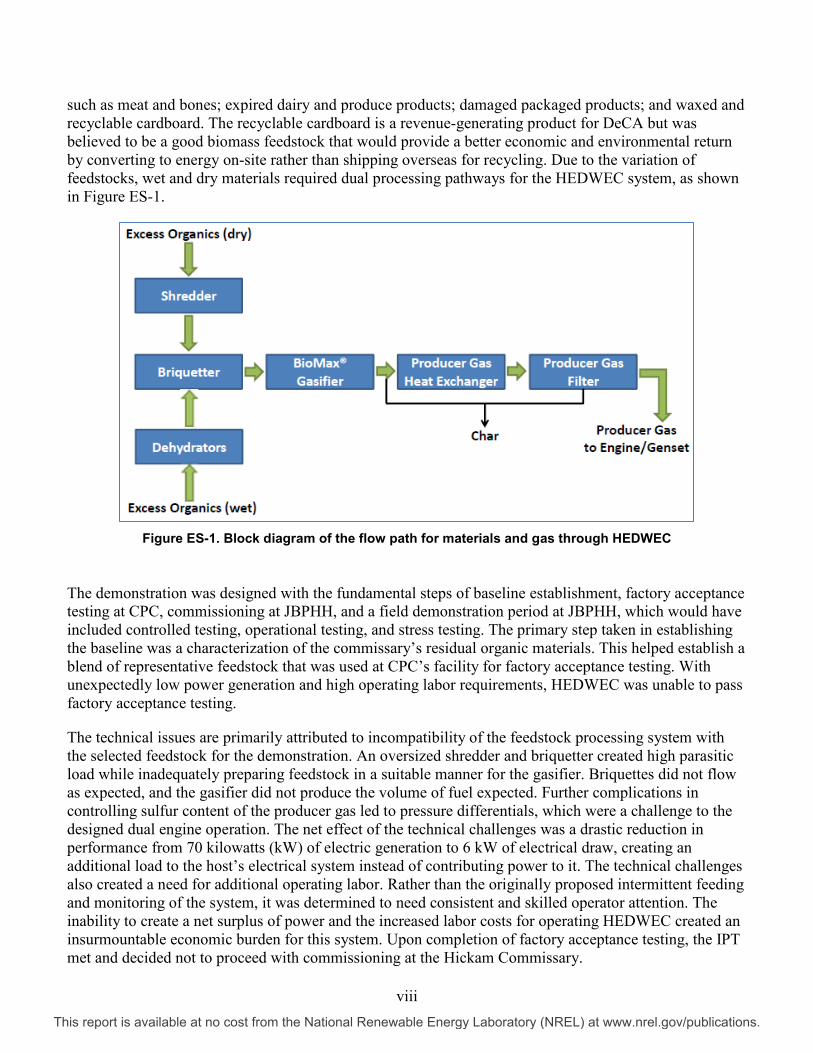
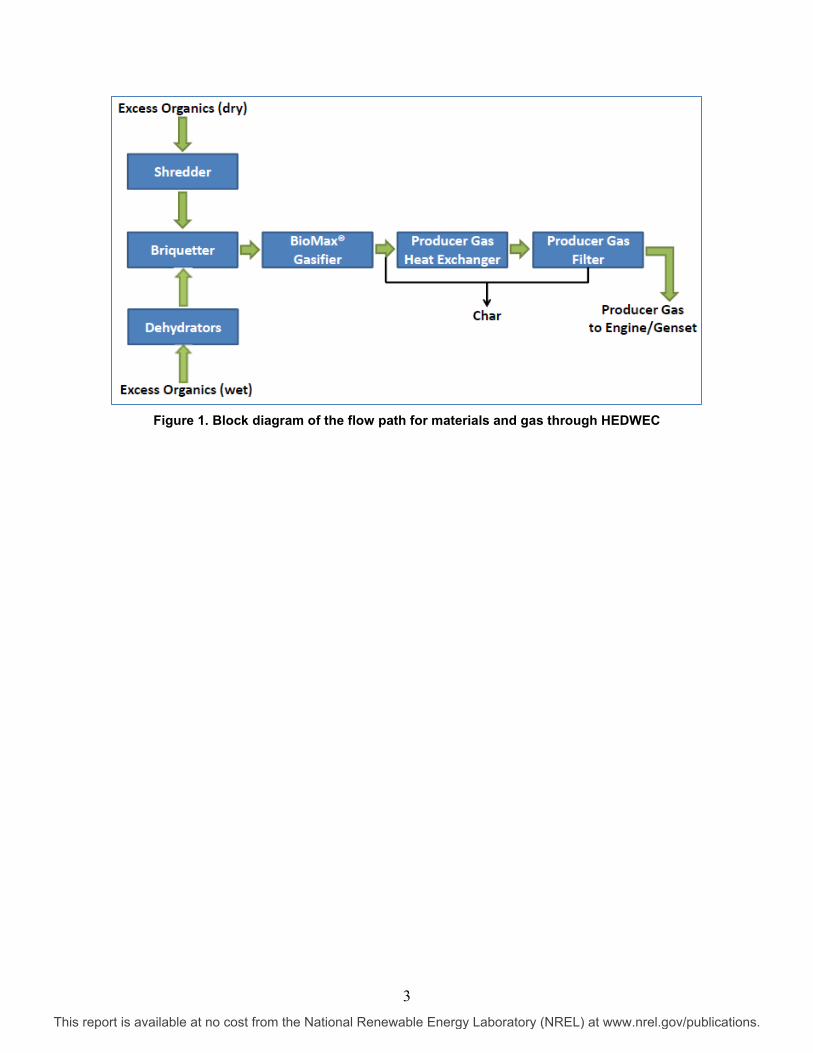
such as meat and bones; expired dairy and produce products; damaged packaged products; and waxed and recyclable cardboard. The recyclable cardboard is a revenue-generating product for DeCA but was believed to be a good biomass feedstock that would provide a better economic and environmental return by converting to energy on-site rather than shipping overseas for recycling. Due to the variation of feedstocks, wet and dry materials required dual processing pathways for the HEDWEC system, as shown in Figure ES-1.
Figure ES-1. Block diagram of the flow path for materials and gas through HEDWEC
The demonstration was designed with the fundamental steps of baseline establishment, factory acceptance testing at CPC, commissioning at JBPHH, and a field demonstration period at JBPHH, which would have included controlled testing, operational testing, and stress testing. The primary step taken in establishing the baseline was a characterization of the commissary’s residual organic materials. This helped establish a blend of representative feedstock that was used at CPC’s facility for factory acceptance testing. With unexpectedly low power generation and high operating labor requirements, HEDWEC was unable to pass factory acceptance testing.
The technical issues are primarily attributed to incompatibility of the feedstock processing system with the selected feedstock for the demonstration. An oversized shredder and briquetter created high parasitic load while inadequately preparing feedstock in a suitable manner for the gasifier. Briquettes did not flow as expected, and the gasifier did not produce the volume of fuel expected. Further complications in controlling sulfur content of the producer gas led to pressure differentials, which were a challenge to the designed dual engine operation. The net effect of the technical challenges was a drastic reduction in performance from 70 kilowatts (kW) of electric generation to 6 kW of electrical draw, creating an additional load to the host’s electrical system instead of contributing power to it. The technical challenges also created a need for additional operating labor. Rather than the originally proposed intermittent feeding and monitoring of the system, it was determined to need consistent and skilled operator attention. The inability to create a net surplus of power and the increased labor costs for operating HEDWEC created an insurmountable economic burden for this system. Upon completion of factory acceptance testing, the IPT met and decided not to proceed with commissioning at the Hickam Commissary.
This report is available at no cost from the National Renewable Energy Laboratory (NREL) at www.nrel.gov/publications.

ix
Even though HEDWEC did not ship or undergo the controlled, operational, or stress testing components of the field demonstration at JBPHH, significant lessons were learned regarding deployment of small-scale WTE projects to DOD installations. Those lessons learned are as follows:
• The U.S. Environmental Protection Agency (EPA) does not offer air emissions permit guidance for the syngas-fired engines that are typically used in a system such as HEDWEC. This complicates air permitting discussions with state and local environmental regulatory agencies. Further outreach and education regarding these systems with the EPA would streamline future installations of WTE gasification systems.
• There is no clear guidance for setbacks applying to modular syngas-fired engine-generator sets. The presence of carbon monoxide in the syngas alarmed U.S. Navy safety representatives. Early discussions regarding the operation of systems like HEDWEC and installed safety features should be held with appropriate safety personnel to establish required setbacks or implementation of safety features.
• From a general perspective, gasification systems must go through extensive testing using representative feedstocks to validate performance prior to field demonstration. Prior performance using different feedstocks is not a reliable indicator of system performance.
• Older facilities, such as the Hickam Commissary, may not have current electrical drawings and circuit load information necessary for interconnection of distributed generation devices, such as HEDWEC. Efforts should be made early in the development of a project to evaluate available electrical information and identify new information that must be attained.
• Technology providers inexperienced with military construction and site restrictions may face a challenge with understanding compliance requirements. This is particularly likely if their past deployments were conducted in programs that did not require full compliance with these specifications.
The administrative and operational challenges encountered during this demonstration pose significant challenges to small-scale WTE gasification technology (defined as less than 10 tons per day in this report). Other systems were identified in this range and seem to have high potential for success, yet these systems must be further validated to operate adequately in representative environments. NREL could not find any other small-scale WTE gasification systems in the United States utilizing true waste material feedstock in a commercial application.
Many of the challenges of small-scale WTE relate to the feedstock preparation needed to create a more homogeneous fuel. This issue is not as critical in larger systems because the fluctuations are less prevalent at higher volumes and more processing options exist at these scales. Larger-scale systems, from approximately 30-100 tons per day, may be suitable for larger DOD installations, which typically have this volume of feedstock available. Various research efforts into WTE systems of this scale have been conducted in the past and have found dozens of candidate technologies. NREL is not aware, however, of any true gasification WTE systems currently operating with raw municipal solid waste at any scale within the United States. Further validation of these larger technologies is necessary, and at costs of over $6 per watt,2 these multi-megawatt systems will cost tens of millions of dollars to procure for demonstration.
2 Estimate from Jerry Davis of NREL after researching the small-scale WTE industry, presented July 13, 2011. Presentation available online at: www1.eere.energy.gov/hydrogenandfuelcells/pdfs/wte_dod-doe_wkshp71311_davis.pdf.
This report is available at no cost from the National Renewable Energy Laboratory (NREL) at www.nrel.gov/publications.

x
Large municipalities, such as New York City3 and the County of Los Angeles,4 are currently leading the evaluation of these larger WTE systems.
NREL assesses the technology readiness level (TRL) of small-scale WTE gasification to be in the TRL 6-7 range, with this HEDWEC application at TRL 6. NREL recommends a “partner” strategy, per the guidelines in the Defense Acquisition Guidebook, to advance the technology to higher TRLs. It is unlikely the TRL of small-scale WTE gasification systems will advance without support from the DOD or another federal agency. For larger gasification systems, more options exist, and these are progressing faster toward commercial viability. However, cost issues lead NREL to recommend the DOD establish a “watch” strategy and track the development of these technologies by other organizations.
3 For more information, refer to an online press release at: www.nyc.gov/portal/site/nycgov/menuitem.c0935b9a57bb4ef3daf2f1c701c789a0/index.jsp?pageID=mayor_press_release&catID=1194&doc_name=http%3A%2F%2Fwww.nyc.gov%2Fhtml%2Fom%2Fhtml%2F2012a%2Fpr077-12.html&cc=unused1978&rc=1194&ndi=1. 4 For more information, refer to Los Angeles County’s outreach site at: www.socalconversion.org/.
This report is available at no cost from the National Renewable Energy Laboratory (NREL) at www.nrel.gov/publications.

xi
Table of Contents Acknowledgements ................................................................................................................................... iii List of Abbreviations and Acronyms ....................................................................................................... iv Executive Summary .................................................................................................................................. vii List of Figures .......................................................................................................................................... xiii List of Tables ............................................................................................................................................ xiii 1 Introduction ........................................................................................................................................... 1 2 Demonstration Objective ..................................................................................................................... 2
2.1 System Description ....................................................................................................................... 2 3 Demonstration Design ......................................................................................................................... 4
3.1 Baseline Establishment ................................................................................................................. 4 3.2 Factory Acceptance Testing (Community Power Corporation Location) ..................................... 4 3.3 Itemized Performance Objectives ................................................................................................. 5 3.4 Performance Objective Descriptions ............................................................................................. 8
4 Technical Performance Analysis and Assessment ........................................................................ 10 4.1 Baseline Results .......................................................................................................................... 13 4.2 Technical Performance Results—Factory Acceptance ............................................................... 14 4.3 Technical Challenges .................................................................................................................. 19
5 Economic Performance Analysis and Assessment ........................................................................ 21 5.1 Dehydrator-Only Operation ........................................................................................................ 22
6 Project Management Considerations ............................................................................................... 24 6.1 Lessons Learned Overview ......................................................................................................... 25 6.2 Site Approval, National Environmental Policy Act, and DD1391.............................................. 26 6.3 Contracts and Procurement ......................................................................................................... 28 6.4 Design ......................................................................................................................................... 29
6.4.1 Anti-Terrorism and Force Protection ............................................................................. 29 6.4.2 Fire Protection ................................................................................................................ 29 6.4.3 Gasoline Storage ............................................................................................................ 30 6.4.4 Other Safety ................................................................................................................... 30 6.4.5 Unified Facilities Guide Specifications ......................................................................... 31
6.5 Installation and Construction ...................................................................................................... 31 6.5.1 Air Permitting ................................................................................................................ 31
6.6 Operation and Maintenance ........................................................................................................ 36 6.6.1 Factory Acceptance Testing ........................................................................................... 36
6.7 Training ....................................................................................................................................... 36 7 Commercial Readiness Qualitative Assessment ............................................................................ 37 8 Recommended Next Steps ................................................................................................................ 39 Appendix A: Memorandum of Agreement .............................................................................................. 40 Appendix B: High-Energy Densification Waste-to-Energy Conversion Interconnection Drawings 48 Appendix C: Options to Improve the Commercial Viability of High-Energy Densification Waste-to-Energy
Conversion .......................................................................................................................................... 50 Ash Issues ............................................................................................................................................. 50 Material Flow ....................................................................................................................................... 51 Emissions Controls ............................................................................................................................... 51
Appendix D: Biomass/Waste-to-Energy Industry Assessment ........................................................... 52 Technology Barriers ............................................................................................................................. 52 Institutional Barriers ............................................................................................................................. 55
Regulatory ................................................................................................................................... 55 Financial ...................................................................................................................................... 56 Infrastructural .............................................................................................................................. 57 Perceptual .................................................................................................................................... 57
Additional Barriers ............................................................................................................................... 58 Policy ........................................................................................................................................ 58
This report is available at no cost from the National Renewable Energy Laboratory (NREL) at www.nrel.gov/publications.
xii
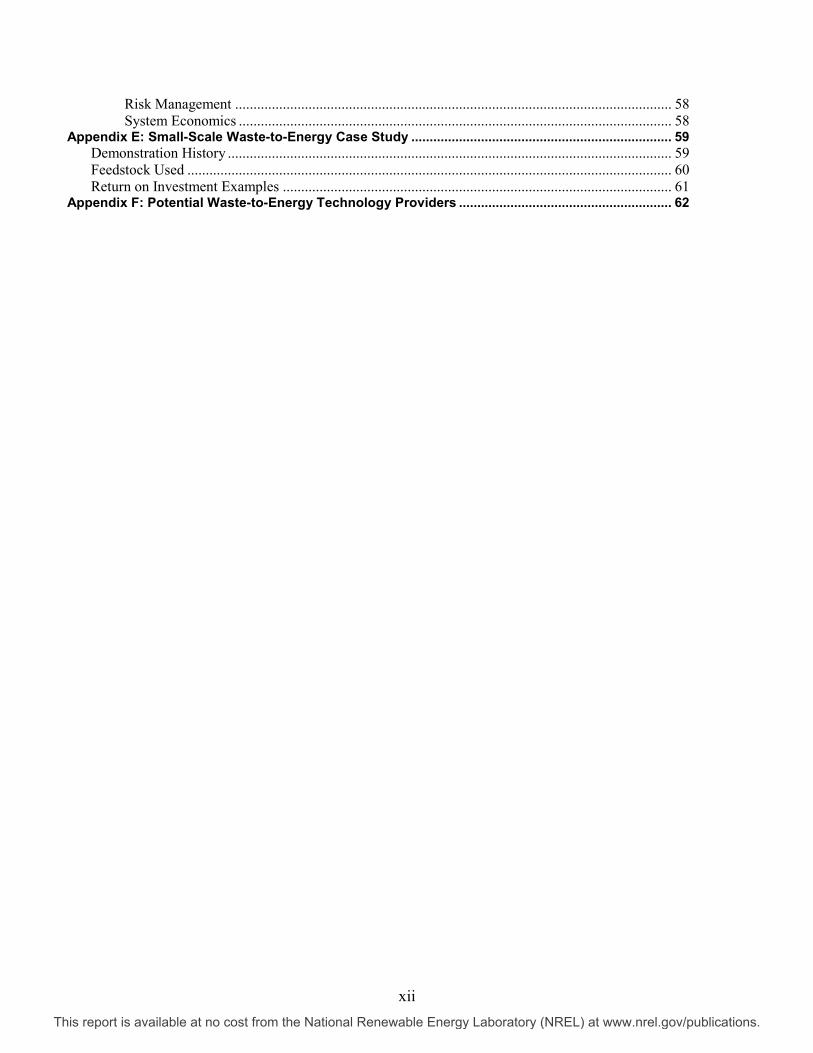
Risk Management ....................................................................................................................... 58 System Economics ...................................................................................................................... 58
Appendix E: Small-Scale Waste-to-Energy Case Study ....................................................................... 59 Demonstration History ......................................................................................................................... 59 Feedstock Used .................................................................................................................................... 60 Return on Investment Examples .......................................................................................................... 61
Appendix F: Potential Waste-to-Energy Technology Providers .......................................................... 62
This report is available at no cost from the National Renewable Energy Laboratory (NREL) at www.nrel.gov/publications.
xiii
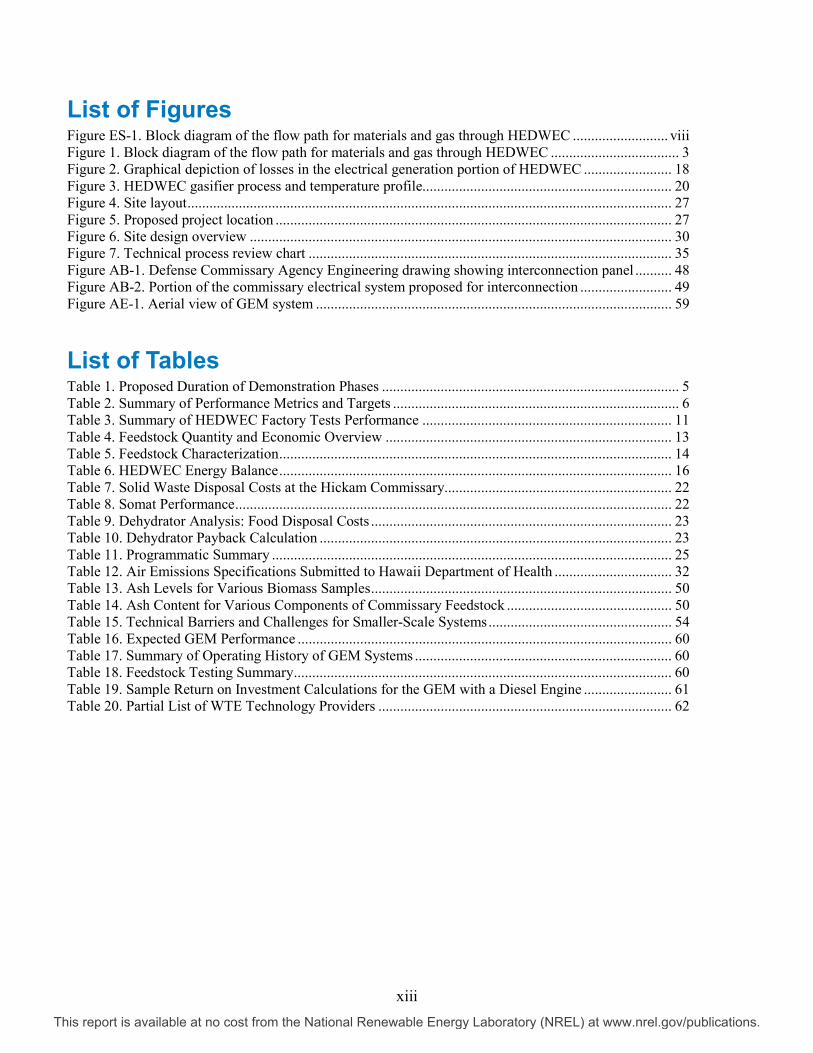
List of Figures Figure ES-1. Block diagram of the flow path for materials and gas through HEDWEC .......................... viii Figure 1. Block diagram of the flow path for materials and gas through HEDWEC ................................... 3 Figure 2. Graphical depiction of losses in the electrical generation portion of HEDWEC ........................ 18 Figure 3. HEDWEC gasifier process and temperature profile.................................................................... 20 Figure 4. Site layout .................................................................................................................................... 27 Figure 5. Proposed project location ............................................................................................................ 27 Figure 6. Site design overview ................................................................................................................... 30 Figure 7. Technical process review chart ................................................................................................... 35 Figure AB-1. Defense Commissary Agency Engineering drawing showing interconnection panel .......... 48 Figure AB-2. Portion of the commissary electrical system proposed for interconnection ......................... 49 Figure AE-1. Aerial view of GEM system ................................................................................................. 59
List of Tables Table 1. Proposed Duration of Demonstration Phases ................................................................................. 5 Table 2. Summary of Performance Metrics and Targets .............................................................................. 6 Table 3. Summary of HEDWEC Factory Tests Performance .................................................................... 11 Table 4. Feedstock Quantity and Economic Overview .............................................................................. 13 Table 5. Feedstock Characterization ........................................................................................................... 14 Table 6. HEDWEC Energy Balance ........................................................................................................... 16 Table 7. Solid Waste Disposal Costs at the Hickam Commissary.............................................................. 22 Table 8. Somat Performance ....................................................................................................................... 22 Table 9. Dehydrator Analysis: Food Disposal Costs .................................................................................. 23 Table 10. Dehydrator Payback Calculation ................................................................................................ 23 Table 11. Programmatic Summary ............................................................................................................. 25 Table 12. Air Emissions Specifications Submitted to Hawaii Department of Health ................................ 32 Table 13. Ash Levels for Various Biomass Samples .................................................................................. 50 Table 14. Ash Content for Various Components of Commissary Feedstock ............................................. 50 Table 15. Technical Barriers and Challenges for Smaller-Scale Systems .................................................. 54 Table 16. Expected GEM Performance ...................................................................................................... 60 Table 17. Summary of Operating History of GEM Systems ...................................................................... 60 Table 18. Feedstock Testing Summary ....................................................................................................... 60 Table 19. Sample Return on Investment Calculations for the GEM with a Diesel Engine ........................ 61 Table 20. Partial List of WTE Technology Providers ................................................................................ 62
This report is available at no cost from the National Renewable Energy Laboratory (NREL) at www.nrel.gov/publications.

1
1 Introduction In order to meet its energy goals, the U.S. Department of Defense (DOD) has partnered with the Department of Energy’s (DOE’s) National Renewable Energy Laboratory to rapidly demonstrate and deploy cost-effective renewable energy and energy efficiency technologies. The waste-to-energy (WTE) system explored in this report is one of several demonstrations of new or underutilized commercial energy technologies selected for demonstration. The proposed high-energy densification waste-to-energy conversion (HEDWEC) WTE demonstration concept originated several years ago in discussions between the U.S. Army, the Defense Commissary Agency (DeCA), Naval Facilities Engineering Command (NAVFAC) Hawaii, and Community Power Corporation (CPC) stakeholders.
HEDWEC technology is the result of significant U.S. Army investment in the development of WTE technology for forward operating bases. The high cost of transporting fuel combined with the impractical and hazardous practice of solid waste disposal in burn pits or burn boxes led Natick Soldier Research Development and Engineering Center (NSRDEC) to initiate a WTE program in 2004. NSRDEC has explored or considered several different types of WTE processes from biological (composting, fermentation, and biodigestors) to thermochemical (pyrolysis, plasma, supercritical water, and downdraft and updraft gasifiers) and has concluded that downdraft gasifiers offer the best combination of size, lack of complexity, and life-cycle cost for small-scale WTE (<10 ton/day). HEDWEC is the latest technology to be investigated under this program and was developed with funds from the Army Research Laboratory (ARL), which authorized use of the system for this demonstration. In addition to ARL’s in-kind contribution of HEDWEC for this demonstration, NSRDEC directly funded CPC for procurement of a unique, spark-ignited, engine-generator to enable interconnection of the system to the grid.
As the technology developer and manufacturer for HEDWEC, CPC conducted site visits to remote locations around the world to identify potential sources of feedstock for such a system. Considering the high costs of energy and solid waste disposal for remote locations, CPC identified DOD sites on Hawaii as candidates. Through connections made in Hawaii, CPC met representatives from the Hickam Commissary and began discussing the use of organic waste materials as feedstock for HEDWEC.
DeCA operates 247 commissaries at DOD installations around the world. Solid waste disposal costs at these sites are significant, and even more so at remote and island locations. In 2010, DeCA paid nearly half a million dollars for disposal of solid waste at its stores on Hawaii, with over $88,000 of this cost attributed to the Hickam Commissary waste stream. In 2011, DeCA conducted a waste characterization study and estimated 70% of the waste material to be compostable or convertible into energy. These materials include dairy products, meats, breads, fruits, vegetables, waxed boxes, and small amounts of wood. In an effort to reduce these disposal costs, DeCA began exploring alternative options for use of its solid waste, including the discussion with CPC to install and operate a gasifier at the Hickam Commissary.
As the Facilities Engineering Command responsible for Joint Base Pearl Harbor-Hickam (JBPHH) and the Hickam Commissary, the NAVFAC Hawaii energy management team was made aware of this project. When NAVFAC Headquarters, NAVFAC Pacific, and NREL originally met to evaluate WTE project ideas, NAVFAC Hawaii brought this project to the group’s attention, and it was selected for participation in this program.
This report is available at no cost from the National Renewable Energy Laboratory (NREL) at www.nrel.gov/publications.

2
2 Demonstration Objective Small-scale (up to 10 tons per day) waste-to-energy systems hold promise to convert expensive-to-dispose of waste materials into useful energy. This is especially true in locations with high tipping (trash disposal) fees, such as islands and densely populated areas.
The objective of this project was to demonstrate and validate the performance of a HEDWEC 70-kilowatt (kW) modular biopower waste-to-energy system as a representative small-scale WTE system. The project proposed the use of HEDWEC to convert a variety of low-value, organic, nonhazardous surplus materials from the Hickam Commissary JBPHH to on-site power. The project was designed to test and document the operational viability, emissions performance, and economics of the HEDWEC system for this type of application. While the project was not fully executed, it provided insight into the current state of the small-scale WTE industry.
2.1 System Description The conversion process to create energy from the surplus organic materials (feedstock) requires several interlinked processes. Figure 1 illustrates the various steps, from shredding the excess organic materials to making a synthetic fuel gas (syngas) used to produce electricity and heat in engine/gensets. The very wet organics are first dehydrated so that the overall mixture will have between 10% to 15% moisture. The excess organic material is then shredded and formed into briquettes, which are fed to the gasifier. The miscellaneous organics are gasified to form syngas in the HEDWEC gasifier. The downdraft gasifier is designed to convert organic materials into syngas and a small amount of solid char/ash. The tars and most of the char formed during thermal decomposition of the organic materials near the entrance of the gasifier are converted to syngas in the lower section of the gasifier.
The system employs a heat exchanger to cool the syngas leaving the gasifier to 110°C and a filter to remove char and soot. The gasifier and gas cleanup operate under negative (sub-atmospheric) pressure to preclude the possibility of fugitive emissions from the gasification equipment. This is an important safety feature due to the health hazards of the carbon monoxide (CO) in the syngas. Downstream of the gas cooling and filtering equipment, the pressure of the gas is raised to atmospheric pressure. The gas is then mixed with combustion air before reaching a set of two stationary spark ignition engines. There it is combusted, resulting in exhaust gases having low levels of residual carbon monoxide, volatile organics, particle matter (PM), sulfur dioxide (SO2), and nitrogen oxide (NOx). Emissions were expected to be below the criteria outlined in 40 Code of Federal Regulations (CFR) 60, Subpart JJJJ, Standards of Performance for Stationary Spark Ignition Internal Combustion Engines, as presented in Table 12. The landfill gas criteria from 40 CFR 60, Subpart JJJJ were used because this guidance does not yet address syngas-fueled fueled engines.
This report is available at no cost from the National Renewable Energy Laboratory (NREL) at www.nrel.gov/publications.
3
Figure 1. Block diagram of the flow path for materials and gas through HEDWEC
This report is available at no cost from the National Renewable Energy Laboratory (NREL) at www.nrel.gov/publications.
4
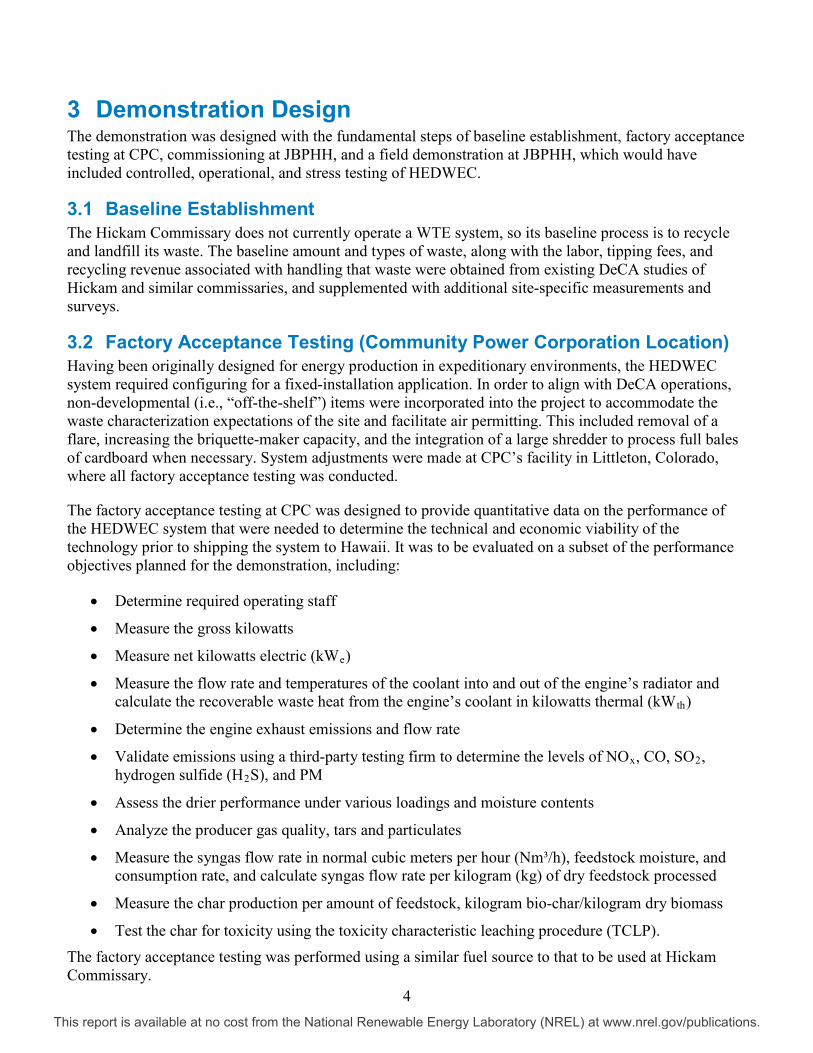
3 Demonstration Design The demonstration was designed with the fundamental steps of baseline establishment, factory acceptance testing at CPC, commissioning at JBPHH, and a field demonstration at JBPHH, which would have included controlled, operational, and stress testing of HEDWEC.
3.1 Baseline Establishment The Hickam Commissary does not currently operate a WTE system, so its baseline process is to recycle and landfill its waste. The baseline amount and types of waste, along with the labor, tipping fees, and recycling revenue associated with handling that waste were obtained from existing DeCA studies of Hickam and similar commissaries, and supplemented with additional site-specific measurements and surveys.
3.2 Factory Acceptance Testing (Community Power Corporation Location) Having been originally designed for energy production in expeditionary environments, the HEDWEC system required configuring for a fixed-installation application. In order to align with DeCA operations, non-developmental (i.e., “off-the-shelf”) items were incorporated into the project to accommodate the waste characterization expectations of the site and facilitate air permitting. This included removal of a flare, increasing the briquette-maker capacity, and the integration of a large shredder to process full bales of cardboard when necessary. System adjustments were made at CPC’s facility in Littleton, Colorado, where all factory acceptance testing was conducted.
The factory acceptance testing at CPC was designed to provide quantitative data on the performance of the HEDWEC system that were needed to determine the technical and economic viability of the technology prior to shipping the system to Hawaii. It was to be evaluated on a subset of the performance objectives planned for the demonstration, including:
• Determine required operating staff
• Measure the gross kilowatts
• Measure net kilowatts electric (kWe)
• Measure the flow rate and temperatures of the coolant into and out of the engine’s radiator and calculate the recoverable waste heat from the engine’s coolant in kilowatts thermal (kWth)
• Determine the engine exhaust emissions and flow rate
• Validate emissions using a third-party testing firm to determine the levels of NOx, CO, SO2, hydrogen sulfide (H2S), and PM
• Assess the drier performance under various loadings and moisture contents
• Analyze the producer gas quality, tars and particulates
• Measure the syngas flow rate in normal cubic meters per hour (Nm³/h), feedstock moisture, and consumption rate, and calculate syngas flow rate per kilogram (kg) of dry feedstock processed
• Measure the char production per amount of feedstock, kilogram bio-char/kilogram dry biomass
• Test the char for toxicity using the toxicity characteristic leaching procedure (TCLP). The factory acceptance testing was performed using a similar fuel source to that to be used at Hickam Commissary.
This report is available at no cost from the National Renewable Energy Laboratory (NREL) at www.nrel.gov/publications.
5
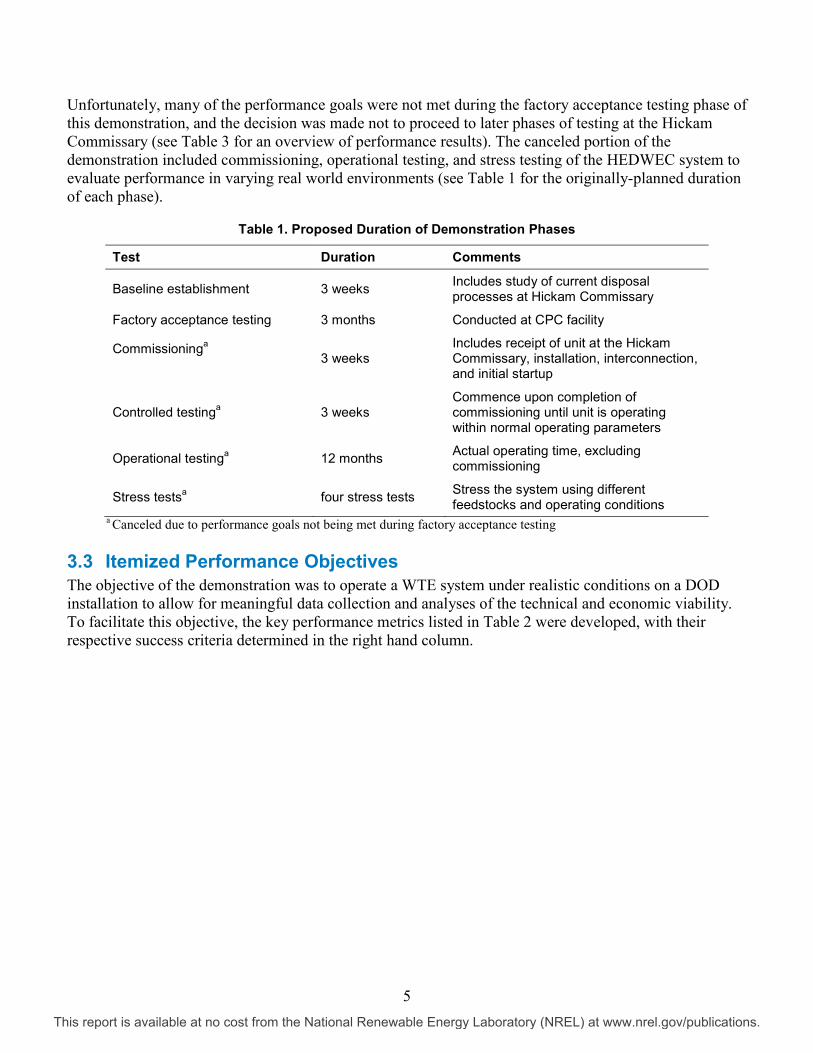
Unfortunately, many of the performance goals were not met during the factory acceptance testing phase of this demonstration, and the decision was made not to proceed to later phases of testing at the Hickam Commissary (see Table 3 for an overview of performance results). The canceled portion of the demonstration included commissioning, operational testing, and stress testing of the HEDWEC system to evaluate performance in varying real world environments (see Table 1 for the originally-planned duration of each phase).
Table 1. Proposed Duration of Demonstration Phases
Test Duration Comments
Baseline establishment 3 weeks Includes study of current disposal processes at Hickam Commissary
Factory acceptance testing 3 months Conducted at CPC facility
Commissioninga
3 weeks
Includes receipt of unit at the Hickam Commissary, installation, interconnection, and initial startup
Controlled testinga 3 weeks Commence upon completion of commissioning until unit is operating within normal operating parameters
Operational testinga 12 months Actual operating time, excluding commissioning
Stress testsa four stress tests Stress the system using different feedstocks and operating conditions
a Canceled due to performance goals not being met during factory acceptance testing
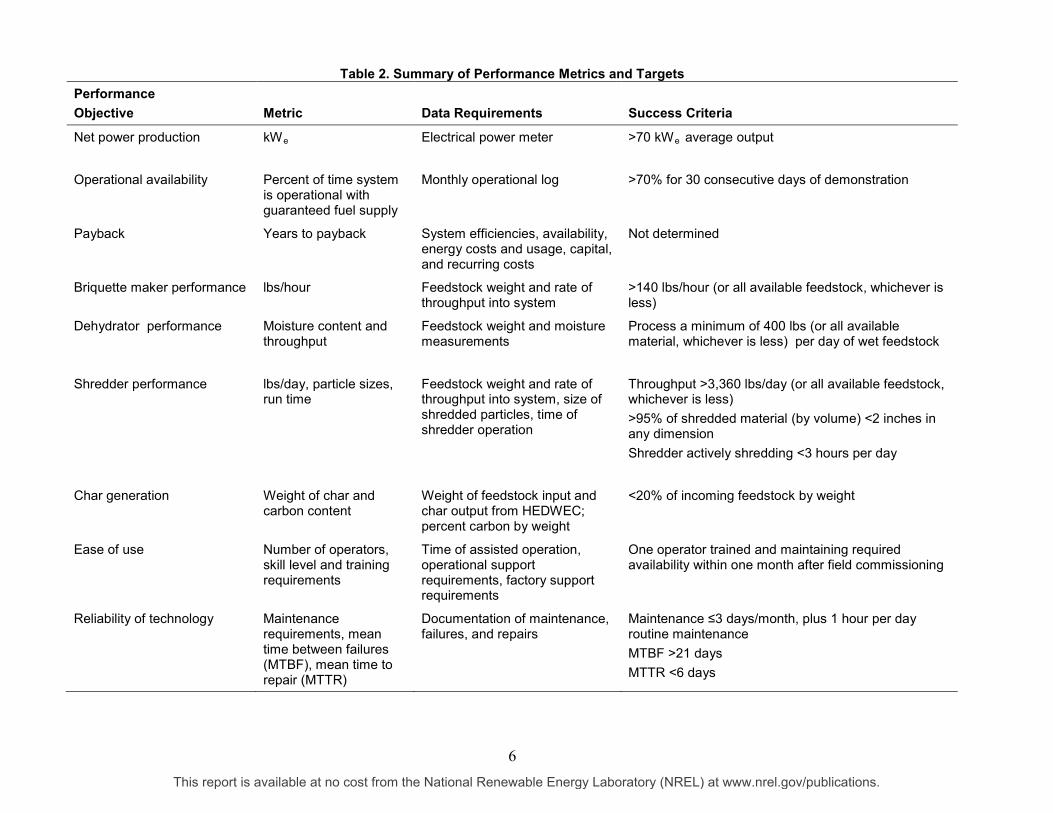
3.3 Itemized Performance Objectives The objective of the demonstration was to operate a WTE system under realistic conditions on a DOD installation to allow for meaningful data collection and analyses of the technical and economic viability. To facilitate this objective, the key performance metrics listed in Table 2 were developed, with their respective success criteria determined in the right hand column.
This report is available at no cost from the National Renewable Energy Laboratory (NREL) at www.nrel.gov/publications.
6
Table 2. Summary of Performance Metrics and Targets Performance Objective
Metric
Data Requirements
Success Criteria
Net power production kWe Electrical power meter >70 kWe average output
Operational availability Percent of time system is operational with guaranteed fuel supply
Monthly operational log >70% for 30 consecutive days of demonstration
Payback Years to payback System efficiencies, availability, energy costs and usage, capital, and recurring costs
Not determined
Briquette maker performance lbs/hour Feedstock weight and rate of throughput into system
>140 lbs/hour (or all available feedstock, whichever is less)
Dehydrator performance Moisture content and throughput
Feedstock weight and moisture measurements
Process a minimum of 400 lbs (or all available material, whichever is less) per day of wet feedstock
Shredder performance lbs/day, particle sizes, run time
Feedstock weight and rate of throughput into system, size of shredded particles, time of shredder operation
Throughput >3,360 lbs/day (or all available feedstock, whichever is less) >95% of shredded material (by volume) <2 inches in any dimension Shredder actively shredding <3 hours per day
Char generation Weight of char and carbon content
Weight of feedstock input and char output from HEDWEC; percent carbon by weight
<20% of incoming feedstock by weight
Ease of use Number of operators, skill level and training requirements
Time of assisted operation, operational support requirements, factory support requirements
One operator trained and maintaining required availability within one month after field commissioning
Reliability of technology Maintenance requirements, mean time between failures (MTBF), mean time to repair (MTTR)
Documentation of maintenance, failures, and repairs
Maintenance ≤3 days/month, plus 1 hour per day routine maintenance MTBF >21 days MTTR <6 days
This report is available at no cost from the National Renewable Energy Laboratory (NREL) at www.nrel.gov/publications.
7
Performance Objective
Metric
Data Requirements
Success Criteria
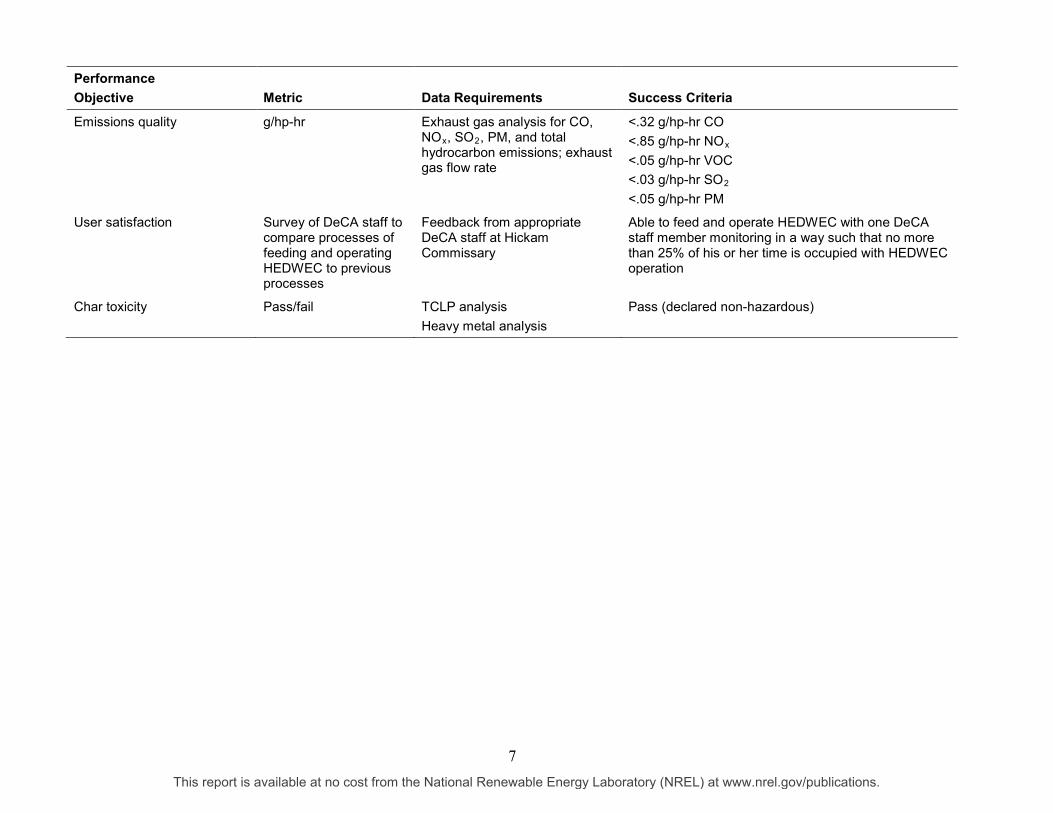
Emissions quality g/hp-hr Exhaust gas analysis for CO, NOx, SO2, PM, and total hydrocarbon emissions; exhaust gas flow rate
<.32 g/hp-hr CO <.85 g/hp-hr NOx <.05 g/hp-hr VOC <.03 g/hp-hr SO2 <.05 g/hp-hr PM
User satisfaction Survey of DeCA staff to compare processes of feeding and operating HEDWEC to previous processes
Feedback from appropriate DeCA staff at Hickam Commissary
Able to feed and operate HEDWEC with one DeCA staff member monitoring in a way such that no more than 25% of his or her time is occupied with HEDWEC operation
Char toxicity Pass/fail TCLP analysis Heavy metal analysis
Pass (declared non-hazardous)
This report is available at no cost from the National Renewable Energy Laboratory (NREL) at www.nrel.gov/publications.

8
3.4 Performance Objective Descriptions The follow items describe the performance objectives used in this demonstration:
• Net power and heat production. The goal was to produce the maximum amount of net power and calculate the recoverable waste heat from the HEDWEC system (theoretically calculated for waste heat, since there was no actual load at the commissary). The net power exported from the system was monitored with a power meter. The recovered waste heat in kilowatts thermal was calculated from the flow rate of engine coolant water and the change in temperature of the water as it passed through the heat exchanger. The minimum expectation was to deliver 70 kWe while generating 88 kWth (300,000 British thermal units [Btu]/hr) of heat. Potential heat recovery from the engine exhaust gas was not considered during this project.
• Operational availability. To have the maximum beneficial presence in the field, the HEDWEC system must be operated on a continuous 24/7 basis with a minimal amount of down time for maintenance and repair. Previous experience has shown that after the first few months of the deployment of a new system, monthly operational availability can average over 70%. A log of gasifier operational time and of down time was to be maintained to establish the monthly availability of this new HEDWEC system. The goal was to achieve a minimum of 70% operational availability for 30 consecutive days of demonstration.
• Payback. An economic model was developed using the U.S. Navy’s energy return on investment (eROI) tool. A specific payback goal was not determined for this project.
• Briquette maker performance. To support the overall throughput of fuel needed to generate 70 kWe, approximately 140 pounds per hour of briquettes are needed. For the purposes of this demonstration, input feedstock was to be weighed to determine the throughput of the briquette maker.
• Dehydrator performance. The HEDWEC dehydrators were sized to process all allowable wet food wastes from the commissary. Throughput, cycle times, and ease of operation were to be evaluated to determine if the dehydrators were optimum to meet the performance specifications of the project, which included processing up to 400 pounds per day of wet feedstock. The effluent of the dehydrators was also to be tested to ensure it could be processed at the JBPHH wastewater treatment plant.
• Shredder performance. To provide an adequate amount of fuel for the generation of 70 kWe by HEDWEC, it was expected that at least 3,360 pounds per day of material sized to a specification that can easily be processed by HEDWEC’s briquette maker were necessary. For purposes of this demonstration, the weight of feedstock fed into the system was to be used to determine throughput. To minimize parasitic loads and duration of noise, the time of active shredding was to be scheduled for several daytime batches and be tracked and logged by the HEDWEC system operator. CPC had planned to document noise levels during shredding operations at 10-foot, 25-foot, and 50-foot distances using industry-accepted test equipment.
• Char generation. The amount of residual char material was to be weighed and correlated to the weight of input feedstock for the operating period in which the char was created. The goal was to have residual char weighing less than 20% of the input materials’ dry weight.
• Ease of use. With the exception of the feedstock processing module, HEDWEC systems are fully automated, allowing for unattended operation. Labor requirements to feed excess organic materials into HEDWEC were to be documented. These labor requirements were to be compared
This report is available at no cost from the National Renewable Energy Laboratory (NREL) at www.nrel.gov/publications.

9
to business-as-usual solid waste handling and disposal requirements to determine the incremental increase (or decrease) of labor requirements for commissary staff.
• Reliability. The reliability of the system was to be measured by the mean time between maintenance or repair of the subsystems that require shutting down the HEDWEC system. A log would have been maintained of every component failure or subsystem requiring maintenance to determine the robustness of the system and to identify subsystems in need of improvement. Continuous gasifier operation for over 21 days between system maintenance, an average of 3 days or less per month down time for maintenance, and an average “mean time to repair” of 6 days or less would have been needed to achieve the minimum operational availability of 70% and the ease-of-use objectives.
• Emissions quality. It is imperative that a system such as HEDWEC operate in an environmentally compliant manner with minimal emissions of NOx, CO, H2S, SO2, PM, and hydrocarbons. To measure these low levels of emissions accurately requires specialized equipment, best maintained by a dedicated outside subcontractor. An outside environmental contractor was to be utilized to measure the key pollutants during the commissioning period at Hickam Commissary. Uncertified measuring devices were to be used on a continuous basis to ensure the unit emissions were within an acceptable range.
• User satisfaction. Feedback would have been solicited from the staff of the Hickam Commissary to determine if they were satisfied with 1) the ability to safely and efficiently transfer materials to HEDWEC, 2) on-site storage of materials, 3) aesthetic impact of the system, 4) additional noise created by the system, and 5) other impacts of utilizing HEDWEC. The objective was for the system to be operated reliably with one commissary staff member who committed no more than 25% of his or her time to operating the HEDWEC system for transferring feedstock materials to HEDWEC and performing other duties associated with HEDWEC operation (e.g., char disposal).
• Char toxicity. The most significant byproduct from the HEDWEC gasification systems is char produced from the feedstock. Char generated during the field demonstration was to be tested using standard U.S. Environmental Protection Agency (EPA) tests for heavy metals and leaching (TCLP), to determine if it could be handled and disposed of as nonhazardous material, allowing disposal in the on-site commissary dumpster. Other byproducts, including dehydrator effluent and carbon from the sulfur mitigation system, were identified during factory acceptance testing, but plans for further testing and handling of these byproducts were not developed.
This report is available at no cost from the National Renewable Energy Laboratory (NREL) at www.nrel.gov/publications.

10
4 Technical Performance Analysis and Assessment The HEDWEC technical performance during its factory acceptance testing did not show sufficient promise to warrant conducting the demonstration at JBPHH. The data and assessments in this section are derived from the baseline data gathered by DeCA and NREL, and the factory acceptance tests performed by CPC at their test facility. Table 3 is an overview of the itemized performance objectives for the demonstration test and an assessment of whether they met the respective targets as part of the factory test. The most significant shortfalls of performance targets were in the net power production and ease of use categories. Net power production was -6 kW (acting as a load on the host electrical system) and the operating labor requirements were much greater than originally anticipated. Due to recurring issues with feedstock flow through the system, constant operator intervention was required by a technician familiar with HEDWEC’s operation.
This report is available at no cost from the National Renewable Energy Laboratory (NREL) at www.nrel.gov/publications.

11
Table 3. Summary of HEDWEC Factory Tests Performance
Performance Objective
Metric Success Criteria Test Performance Final Baseline Test
Criteria Pass/Fail
Net power production kWe
>70 kWe average output
-6 kW average output
Fail, negative output
Operational availability
Percent of time system is operational with guaranteed fuel supply
>70% for 30 consecutive days of demonstration 8-hour baseline test N/A
Payback Years to payback TBD TBD N/A
Briquette maker performance lbs/hr >140 lbs/hr 133 lbs/hr Fail
Dehydrator performance Moisture content and throughput Process a minimum of 400
lbs per day of wet feedstock
156 lbs per 17-hour cycle per machine; estimated 440 lbs per day
Pass
Shredder performance lbs/day, particle sizes, run time
Throughput >3,360lbs/day; shredder actively shredding <3 hours per day
Performance not reported N/A
Char generation Weight of char and carbon content
<20% of incoming feedstock by weight
Char yield 12% Carbon content not reported
Conditional pass
Ease of use Number of operators, skill level and training requirements
One operator trained and maintaining required availability within one month after field commissioning
24 hour/day technician coverage needed Fail
Reliability of technology
Maintenance requirements, mean time between failures, mean time to repair
Maintenance ≤3 days/month, plus 1 hour per day routine maintenance MTBF >21 days MTTR <6 days
N/A (unit did not get field tested) N/A
Emissions quality g/hp-hr <.32 g/hp-hr CO <.85 g/hp-hr NOx <.05 g/hp-hr VOC
Not tested TBD
This report is available at no cost from the National Renewable Energy Laboratory (NREL) at www.nrel.gov/publications.

12
Performance Objective
Metric Success Criteria Test Performance Final Baseline Test
Criteria Pass/Fail
<.03 g/hp-hr SO2 <.05 g/hp-hr PM
User satisfaction
Survey of DeCA staff to compare processes of feeding and operating HEDWEC to previous processes
Able to feed and operate HEDWEC with one DeCA staff member monitoring in a way such that no more than 25% of his or her time is occupied with HEDWEC operation
N/A (unit did not get field tested) N/A
Char toxicity Pass/fail Pass (declared non-hazardous) Not tested TBD
This report is available at no cost from the National Renewable Energy Laboratory (NREL) at www.nrel.gov/publications.
13
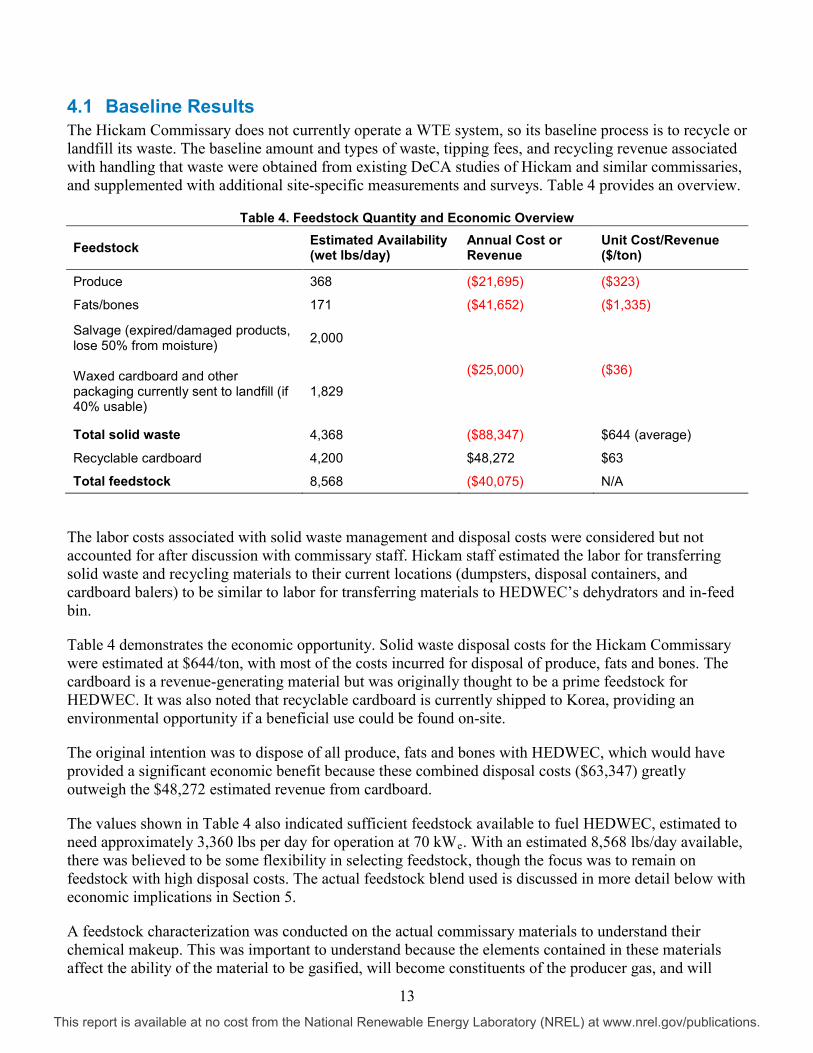
4.1 Baseline Results The Hickam Commissary does not currently operate a WTE system, so its baseline process is to recycle or landfill its waste. The baseline amount and types of waste, tipping fees, and recycling revenue associated with handling that waste were obtained from existing DeCA studies of Hickam and similar commissaries, and supplemented with additional site-specific measurements and surveys. Table 4 provides an overview.
Table 4. Feedstock Quantity and Economic Overview
Feedstock Estimated Availability (wet lbs/day)
Annual Cost or Revenue
Unit Cost/Revenue ($/ton)
Produce 368 ($21,695) ($323)
Fats/bones 171 ($41,652) ($1,335)
Salvage (expired/damaged products, lose 50% from moisture) 2,000
($25,000) ($36) Waxed cardboard and other packaging currently sent to landfill (if 40% usable)
1,829
Total solid waste 4,368 ($88,347) $644 (average)
Recyclable cardboard 4,200 $48,272 $63
Total feedstock 8,568 ($40,075) N/A
The labor costs associated with solid waste management and disposal costs were considered but not accounted for after discussion with commissary staff. Hickam staff estimated the labor for transferring solid waste and recycling materials to their current locations (dumpsters, disposal containers, and cardboard balers) to be similar to labor for transferring materials to HEDWEC’s dehydrators and in-feed bin.
Table 4 demonstrates the economic opportunity. Solid waste disposal costs for the Hickam Commissary were estimated at $644/ton, with most of the costs incurred for disposal of produce, fats and bones. The cardboard is a revenue-generating material but was originally thought to be a prime feedstock for HEDWEC. It was also noted that recyclable cardboard is currently shipped to Korea, providing an environmental opportunity if a beneficial use could be found on-site.
The original intention was to dispose of all produce, fats and bones with HEDWEC, which would have provided a significant economic benefit because these combined disposal costs ($63,347) greatly outweigh the $48,272 estimated revenue from cardboard.
The values shown in Table 4 also indicated sufficient feedstock available to fuel HEDWEC, estimated to need approximately 3,360 lbs per day for operation at 70 kWe. With an estimated 8,568 lbs/day available, there was believed to be some flexibility in selecting feedstock, though the focus was to remain on feedstock with high disposal costs. The actual feedstock blend used is discussed in more detail below with economic implications in Section 5.
A feedstock characterization was conducted on the actual commissary materials to understand their chemical makeup. This was important to understand because the elements contained in these materials affect the ability of the material to be gasified, will become constituents of the producer gas, and will
This report is available at no cost from the National Renewable Energy Laboratory (NREL) at www.nrel.gov/publications.

14
influence the products of the final combustion process if they are not filtered out. The results of these analyses are presented in Table 5.
Table 5. Feedstock Characterization
As Discarded Moisture
Dry Basis Elemental Composition (%)
Component C H O N S Ashes HHV (dry)
HHV (wet)
Produce 78.29 49.18 6.64 37.58 1.69 0.02 4.89 4,594
2,855
Fat/bone 38.74 59.59 9.47 24.65 1.02 0.19 5.08 16,110
8,651
Salvage 29.00 73.14 11.54 14.82 0.43 0.07 0.00 11,295
6,065
Waxed cardboard 5.20 43.73 5.70 44.93 0.09 0.21 5.34 7,823
7,158
Unwaxed cardboard 5.20 43.73 5.70 44.93 0.09 0.21 5.34 7,950
7,527
Final waste stream (as received) 14.54 42.20 5.84 33.26 0.23 0.15 3.78 ----- 7,002
Final waste stream (dry basis) 0.00 49.38 6.83 38.92 0.27 0.17 4.42 8,520 -----
The high ash content of the feedstock, relative to the typical woody biomass feedstock used in HEDWEC’s predecessors, created issues that will be discussed further below and in later sections of this report.
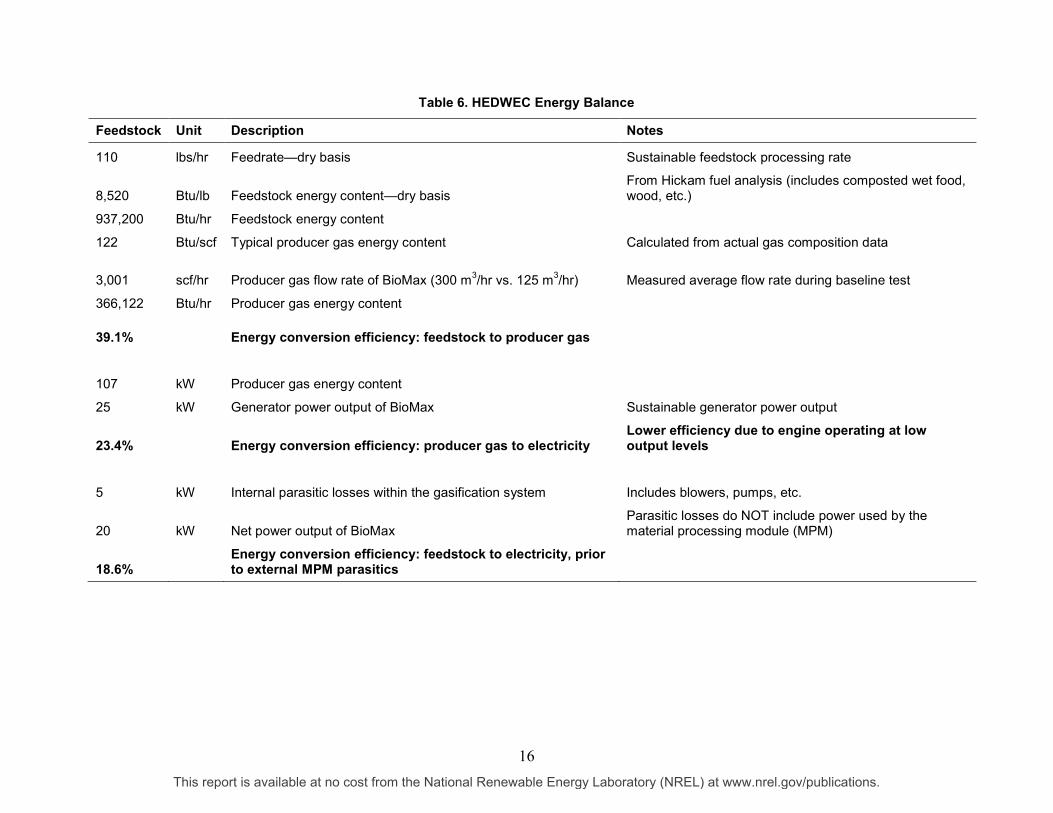
4.2 Technical Performance Results—Factory Acceptance CPC completed its 8-hour factory acceptance test at its facility on April 11, 2013. The results of this test run are summarized in Table 6. The feedstock mixture was based on representative feedstock available at the Hickam Commissary. The feedstock included 69% dry cardboard, 15% broken pallets (from salvage waste), 8% waxed cardboard, and 8% dehydrated organic material (wet basis—produce, meats, fats, bones). The HEDWEC system processed 133 pounds of waste per hour during the 8-hour test. As previously noted, the goal was for the HEDWEC system to be able to process 140 pounds of waste per hour (3,360 pounds per day) as measured by throughput through the shredder and briquette maker in the front-end feedstock processing module. While this front-end feedstock processing system is sized for 200 pounds per hour, the HEDWEC system had trouble maintaining this rate. Char ash production was 16 pounds per hour. This was more than expected for the unit (CPC estimated 4 pounds per hour based on other systems), but is below the 20% (by weight) threshold established as the level of success for this project.
The elapsed time for the final baseline test was 9 hours, with actual run time of 8 hours and 50 minutes. The average generator power output was 29 kW, while the goal was 70 kW. Due to parasitic loads, the net electrical generation was negative 6.5 kW, meaning the system was an additional 6.5 kW load when
This report is available at no cost from the National Renewable Energy Laboratory (NREL) at www.nrel.gov/publications.

15
viewed as a whole. Including the theoretical thermal generation, however, the system was estimated to have a net energy output of 48.9 kW. Table 6 identifies the measured energy balance for electrical generation and theoretical for the heat generation.
This report is available at no cost from the National Renewable Energy Laboratory (NREL) at www.nrel.gov/publications.
16
Table 6. HEDWEC Energy Balance
Feedstock Unit Description Notes
110 lbs/hr Feedrate—dry basis Sustainable feedstock processing rate
8,520 Btu/lb Feedstock energy content—dry basis From Hickam fuel analysis (includes composted wet food, wood, etc.)
937,200 Btu/hr Feedstock energy content
122 Btu/scf Typical producer gas energy content Calculated from actual gas composition data
3,001 scf/hr Producer gas flow rate of BioMax (300 m3/hr vs. 125 m3/hr) Measured average flow rate during baseline test
366,122 Btu/hr Producer gas energy content
39.1%
Energy conversion efficiency: feedstock to producer gas
107 kW Producer gas energy content
25 kW Generator power output of BioMax Sustainable generator power output
23.4%
Energy conversion efficiency: producer gas to electricity Lower efficiency due to engine operating at low output levels
5 kW Internal parasitic losses within the gasification system Includes blowers, pumps, etc.
20 kW Net power output of BioMax Parasitic losses do NOT include power used by the material processing module (MPM)
18.6%
Energy conversion efficiency: feedstock to electricity, prior to external MPM parasitics
This report is available at no cost from the National Renewable Energy Laboratory (NREL) at www.nrel.gov/publications.

17
Parasitic Loads (average power draw based on duty cycles)
6.0 kW Dehydrators
3.5 kW Shredder components
16.5 kW Briquetter components
0.6 kW Accessory lights
26.5 kW Total external MPM parasitics
(6.5) kW Net electric output of HEDWEC system
Overall Energy Calculations
274.6 kW Feedstock equivalent kW
(6.5) kW Net electric output of HEDWEC system
N/A
Net overall electric efficiency
18.0 kW Recoverable exhaust gas available energy (500°C to 200°C) Estimated from heat transfer calculations using exhaust and engine jacket as heat sources
37.4 kW Recoverable engine block available energy (500°C to 200°C) 55.4 kW Total thermal output of HEDWEC system
48.9 kW Net electrical and thermal output of HEDWEC system
17.8% Net overall electric and thermal efficiency
This report is available at no cost from the National Renewable Energy Laboratory (NREL) at www.nrel.gov/publications.
18
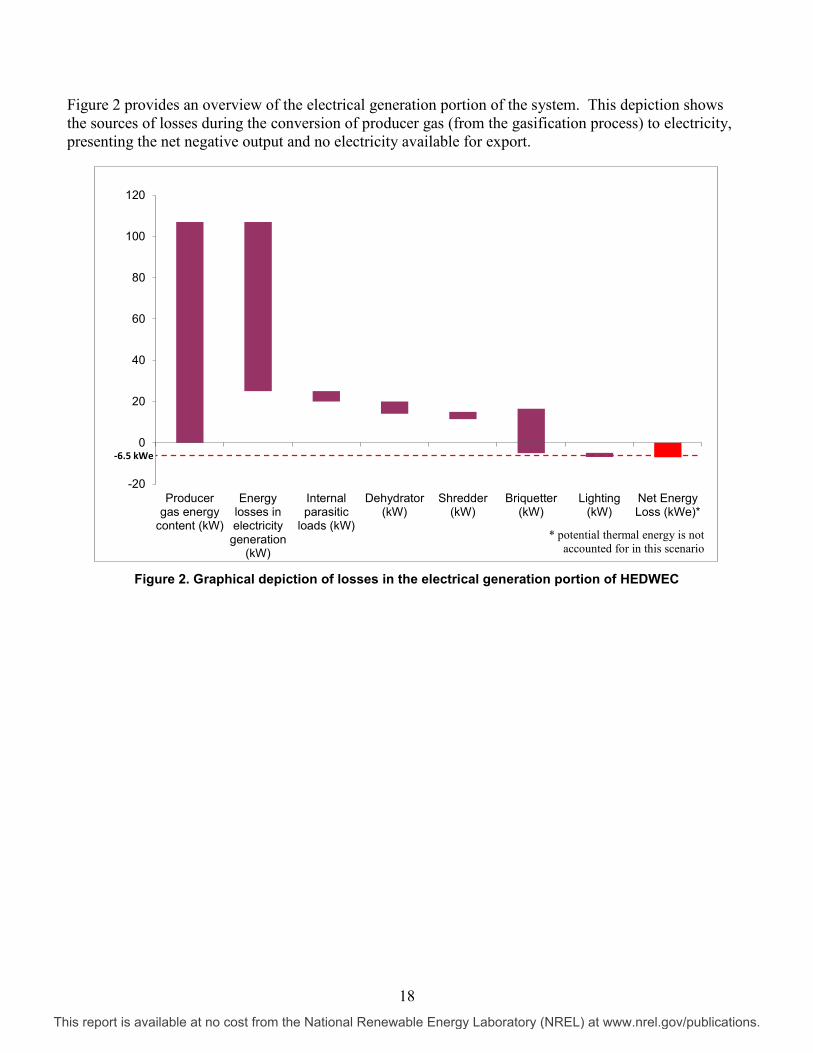
Figure 2 provides an overview of the electrical generation portion of the system. This depiction shows the sources of losses during the conversion of producer gas (from the gasification process) to electricity, presenting the net negative output and no electricity available for export.
Figure 2. Graphical depiction of losses in the electrical generation portion of HEDWEC
-20
0
20
40
60
80
100
120
Producergas energy
content (kW)
Energylosses inelectricity
generation(kW)
Internalparasitic
loads (kW)
Dehydrator(kW)
Shredder(kW)
Briquetter(kW)
Lighting(kW)
Net EnergyLoss (kWe)*
-6.5 kWe
* potential thermal energy is not accounted for in this scenario
This report is available at no cost from the National Renewable Energy Laboratory (NREL) at www.nrel.gov/publications.

19
4.3 Technical Challenges CPC and NREL believed cardboard feedstock would be a good fuel for HEDWEC because the system evolved from a biomass-fueled gasifier system that had been successfully deployed in the past. This was not the case, however. Unforeseen issues with cardboard feedstock, as well as other unanticipated issues, created significant technical challenges for the system.
• Shredder. The commissary compresses cardboard into 700-pound bales, which are stacked on a loading dock to await pickup by a recycler. To minimize disruption to the current operations, a shredder was selected that could receive and process entire bales. This added significant parasitic load to the system. The high surge current for starting the shredder also created a challenge for the installation design, which is further discussed in Section 6.
• Briquette maker. A typical challenge for small-scale gasifiers is the need for energy densification to allow storage of a surge capacity, as well as to maximize Btu input into the gasifier. HEDWEC utilized a briquette maker for this purpose. The size of the briquette maker was increased from 1 ½ inches to 2 inches during the initial phases of this project to increase the energy input into the gasifier. This, however, had the unintended consequence of incomplete gasification of the larger briquettes, with a partially successful mitigation measure proposed to shorten the length of the briquette. As noted in the energy balance of Table 6, the briquette-maker also added a significant parasitic load to the system.
• Component integration. The shredder and briquette maker, also called the “front end” of a system like HEDWEC, are key components of the feedstock processing module. While these components are commercially proven to operate effectively for other applications, the particular items selected for HEDWEC had not been integrated into a WTE system before. The integration of the controls for these items was more complicated than anticipated, and the alignment of their respective performance with other HEDWEC components was not ideal. For example, the capacity of the shredder was much higher than necessary (to support processing of full bales, as discussed). To minimize parasitic load, the intention was to use operator monitoring to cycle the shredder and minimize runtime. This is a viable strategy but requires additional operator monitoring, and any labor increase for a small-scale system like HEDWEC has detrimental effects.
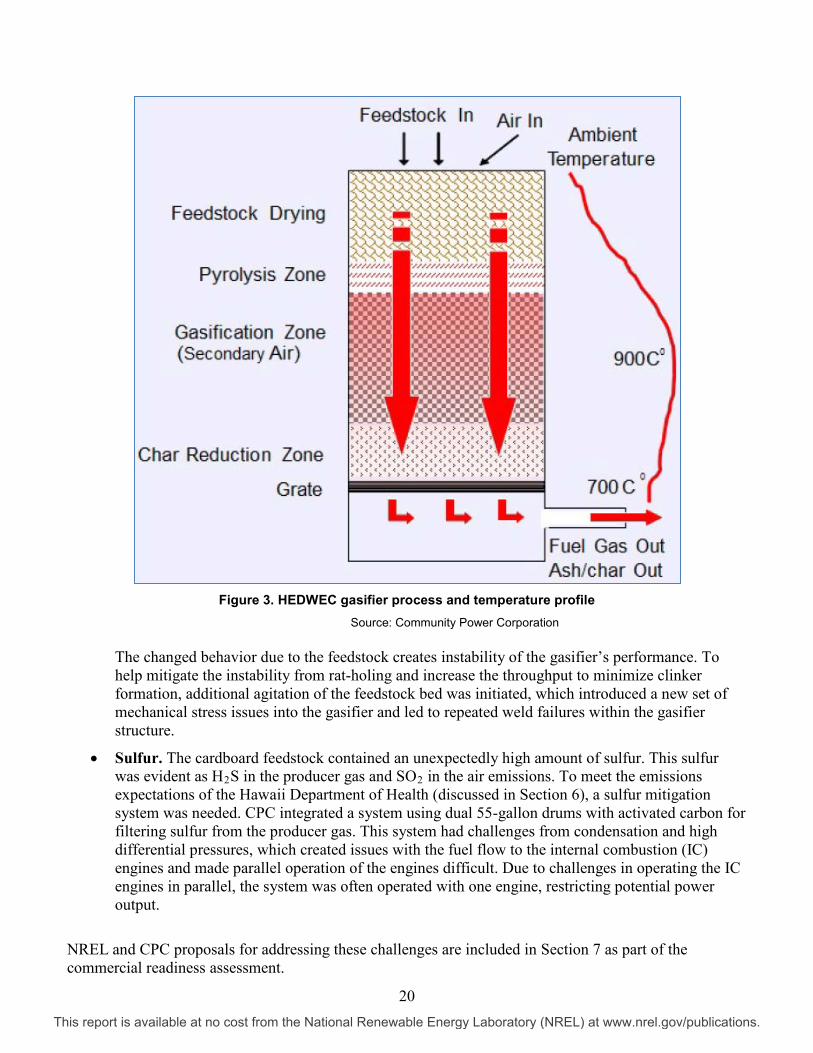
• Gasifier. The combination of the cardboard-based fuel and new briquette size contributed to gasification challenges. High ash content of the feedstock (see Table 5) contributed to the formation of “clinkers,” vitrified noncombustible material that form into clumps and must be removed from the gasifier prior to further operation. To mitigate this issue, the rate at which feedstock was passed through the gasifier was increased, which decreased the ability of the system to gasify the material and lowered the conversion efficiency. The increased briquette size also contributed to poor flow through the gasifier and further affected the performance of the gasifier. Poor flow contributed to “rat-holing,” or gaps in the fuel bed that allow producer gas to flow directly through, which can combust prematurely. This alters the gasifier’s performance from the typical profile shown in Figure 3.
This report is available at no cost from the National Renewable Energy Laboratory (NREL) at www.nrel.gov/publications.
20
Figure 3. HEDWEC gasifier process and temperature profile
Source: Community Power Corporation The changed behavior due to the feedstock creates instability of the gasifier’s performance. To help mitigate the instability from rat-holing and increase the throughput to minimize clinker formation, additional agitation of the feedstock bed was initiated, which introduced a new set of mechanical stress issues into the gasifier and led to repeated weld failures within the gasifier structure.
• Sulfur. The cardboard feedstock contained an unexpectedly high amount of sulfur. This sulfur was evident as H2S in the producer gas and SO2 in the air emissions. To meet the emissions expectations of the Hawaii Department of Health (discussed in Section 6), a sulfur mitigation system was needed. CPC integrated a system using dual 55-gallon drums with activated carbon for filtering sulfur from the producer gas. This system had challenges from condensation and high differential pressures, which created issues with the fuel flow to the internal combustion (IC) engines and made parallel operation of the engines difficult. Due to challenges in operating the IC engines in parallel, the system was often operated with one engine, restricting potential power output.
NREL and CPC proposals for addressing these challenges are included in Section 7 as part of the commercial readiness assessment.
This report is available at no cost from the National Renewable Energy Laboratory (NREL) at www.nrel.gov/publications.
21
5 Economic Performance Analysis and Assessment The poor technical performance of HEDWEC also translated into poor economic performance for the proposed application at the Hickam Commissary. Based on factory acceptance testing, HEDWEC had a negative return on investment because its net increase in electricity consumption and large operating costs overshadowed estimated solid waste disposal savings. The system was originally designed for use in expeditionary environments, such as DOD’s forward operating bases. As such, some of the operating characteristics may provide benefit in an expeditionary environment but were found not to be viable for operating at a fixed installation, such as JBPHH. The unexpectedly low power generation, high amount of dedicated labor, and need for skilled operators were primary factors leading to the early termination of the HEDWEC demonstration. Mitigating factors to increase power generation and lower labor requirements for future iterations of this technology will be discussed in later sections of this report.
The original economic assessment conducted using eROI and in support of the Form 1391 application showed a strong economic return for the U.S. Navy. This return was driven by three key features of the project:
• No capital cost for the original HEDWEC unit provided by the U.S. Army. The 1391 estimated a total U.S. Navy cost of $24,000 for the project to account for installation and contingency costs.
• Estimated electrical savings of $140,000 per year were projected. The assumptions for these savings were 100 kW net electric output, a capacity factor (online time) of 80%, and electricity costs of $0.20/kWh.
• Estimated solid waste disposal cost savings of $15,075. This estimate was derived from a total solid waste disposal cost savings of $63,347 with an adjustment to account for $48,272 of lost revenue from cardboard recycling.
The actual performance of the HEDWEC system affected the electrical savings opportunity significantly. As described in Table 6 of Section 4, the system was estimated to be a 6 kW load on the commissary rather than a 100 kW generation source. With electricity costs projected to increase at JBPHH as high as $.59/kWh in fiscal year 2014, the value of on-site generation becomes significantly greater. Unfortunately, in the case of HEDWEC, the electric cost to operate the system becomes significantly higher.
After factory acceptance testing, the capacity factor (CF) for HEDWEC was revised to 55%. Using this and the 6 kW net load, the electricity cost to operate HEDWEC can be derived using the equation below.
8,760 hours per year * .55 * 6 kW * $.59/kWh = $17,056 per year
This estimate negates the $15,075 per year economic opportunity in solid waste disposal costs. Operation and maintenance (O&M) costs were estimated to be approximately $100-150 per megawatt-hour of generation, based on input from CPC and NREL experience with other WTE systems. For a 70-kW system operating at 55% CF, this results in approximately $37,000-$50,000 annual O&M costs. CPC estimated the cost to manufacture HEDWEC at $1.8 million, though this does not consider an economy of scale possibly afforded by a rollout of these systems. The capital and O&M costs are not investigated in detail because these would simply apply an additional burden to the already unfavorable business case for the HEDWEC system.
This report is available at no cost from the National Renewable Energy Laboratory (NREL) at www.nrel.gov/publications.

22
5.1 Dehydrator-Only Operation The majority of the economic benefit of reduced solid waste disposal costs is provided by the HEDWEC’s dehydrators, which can operate independently of the HEDWEC system. To help evaluate the potential benefits, the commissary’s solid waste disposal costs are broken down into dollars per pound and dollars per ton in Table 7. Of note, the average $644 per ton for residual organics is nearly 15 times the average tipping fee in the United States.
Table 7. Solid Waste Disposal Costs at the Hickam Commissarya
Feedstock Estimated Availability (wet lbs/daya)
Annual Cost or Revenue
Unit Cost/Revenue ($/lb)
Unit Cost/Revenue ($/ton)
Residual organics 539 ($63,347) ($0.32) ($644)
Recyclable cardboard 4,200 $48,272 $0.03 $63
Total feedstock 8,568 ($15,075.00) ($0.29) ($581.01) a See Table 4 for more detail regarding the breakout of residual organics
To consider the economic benefit of operating these independently at the Hickam Commissary, the dehydrators’ technical performance must be considered as well. Table 8 provides an overview of CPC’s observations on the Somat-brand dehydrators’ performance during factory acceptance testing.
Table 8. Somat Performance
Somat Factory CPC Test
Attribute UOM Specification Results
Input capacity lbs 110-220 156
Average reduction rate % 83-93 60
Treatment time hrs 12-18 17
Using CPC’s observations of the dehydrator, the economic assessment of using the dehydrators as stand-alone units is evaluated in Tables 9 and 10. Scenarios are presented for three different rates of electricity.
This report is available at no cost from the National Renewable Energy Laboratory (NREL) at www.nrel.gov/publications.
23
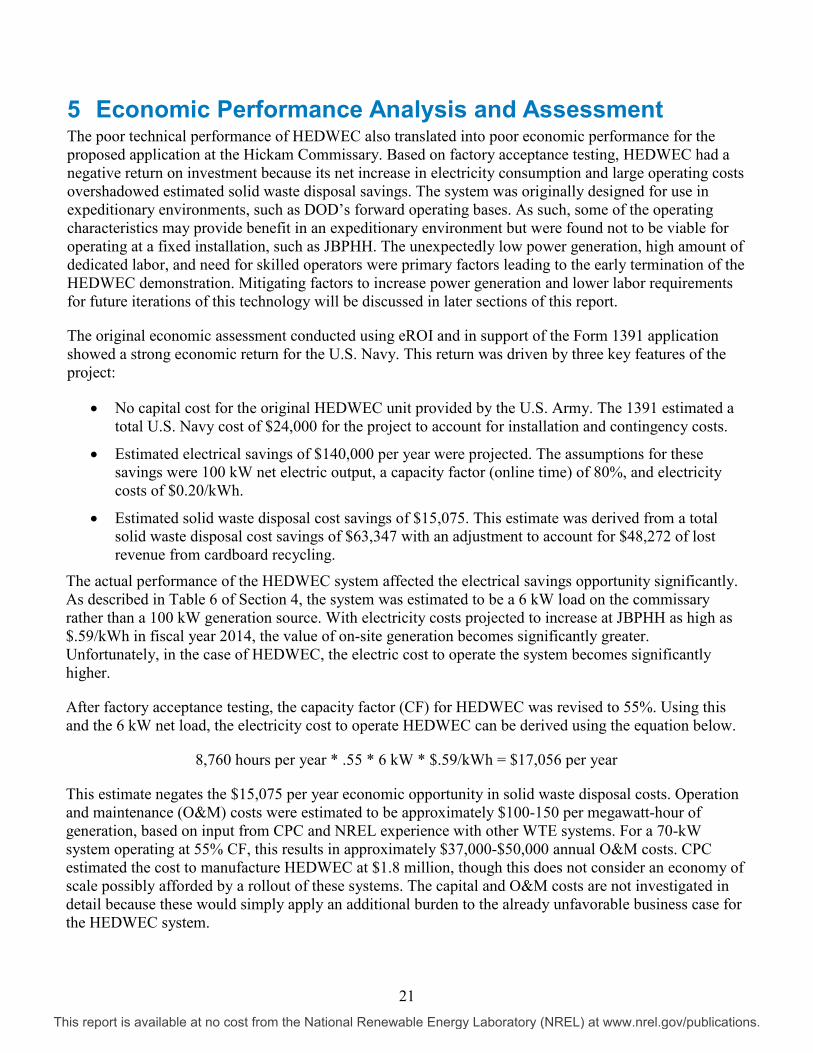
Table 9. Dehydrator Analysis: Food Disposal Costsa
Electricity rate ($/kWh) $0.59 $0.40 $0.30
Power (kW) 3 3 3
Cycle time (hrs) 17 17 17
Cost per cycle $30.09 $20.40 $15.30
Capacity (lbs) 150 150 150
Reduction factor (%) 60% 60% 60%
Net reduction (lbs) 90 90 90
$ per lb $0.33 $0.23 $0.17 a Simplified calculation does not include maintenance costs and assumes no increase in labor costs
Table 10. Dehydrator Payback Calculation Capital cost $26,040.00 $26,040.00 $26,040.00
Pounds of organics per year 196,735 196,735 196,735
Annual savings ($)a ($945.51) $10,858.59 $17,941.05
Simple payback (yrs) N/A 2.4 1.5 a Savings calculated using $ per lb disposal costs from Tables 7 and 9, with the assumption of 60% reduction in weight from dehydration
The current business case for the dehydrators as independent units is much stronger than the business case for HEDWEC as a complete system at this time. To improve the economics for HEDWEC, significantly higher electrical generation is required, as well as lower operating labor requirements. It is unclear if HEDWEC’s technical and economic performance is attributed to issues with the project’s design (e.g., feedstock selection and choice of an expeditionary system) or is indicative of the state of the small-scale WTE gasification industry. This uncertainty will be addressed in later sections of this report.
This report is available at no cost from the National Renewable Energy Laboratory (NREL) at www.nrel.gov/publications.

24
6 Project Management Considerations This project required a relatively high degree of project management activity. Implementation of a small-scale gasification system at a general access military facility presented significant administrative and permitting activity, in addition to a focus on quality assurance and site safety. As a partnership between multiple elements of the DOD in concert with NREL, this project also required a unique level of coordination between each partners’ expectations and requirements.
A key emphasis of the Integrated Product Team’s (IPT’s) management approach was to perform a “deep dive” evaluation of the system prior to deployment at JBPHH. The WTE unit intended to be demonstrated was developed for expeditionary operations, and developed using funds and personnel outside the purview of the NAVFAC/NREL initiative. The IPT had limited knowledge of the unit’s development history and past performance, with these unknowns presenting inherent risks. Therefore, prior to deploying the system in a high traffic, open access environment, such as the Hickam Commissary, the IPT required significant pre-shipment evaluation and understanding of system design, technical performance, quality, and safety.
From a programmatic standpoint, the project established a successful network of communication between the key stakeholders. These included technical and project management representatives from the U.S. Navy, NREL, DeCA, the U.S. Army, and CPC. The roles of NREL, DeCA, and the U.S. Army participants were defined and formalized in a memorandum of agreement (MOA), fully signed and enacted on Sept. 10, 2012, and included as Appendix A in this report. NAVFAC did not sign this MOA, as it served as a subordinate agreement to the NAVFAC/NREL MOA, signed on June 19, 2012. It clarified the roles of NAVFAC and NREL in execution of the overall joint initiative. Although the project did not reach the field demonstration phase, the active participation of all key stakeholders was critical to addressing the technical and administrative duties mentioned above. Further, the use of factory acceptance testing under representative operational circumstances, as well as the insertion of a stage gate between this testing and field implementation, provided highly beneficial information to the IPT to determine an appropriate course for the project. Structuring the project in this way saved a significant amount of money by identifying critical performance issues leading to the early termination of the demonstration.
Table 11 provides a summary of programmatic elements of this project and a high-level timeline of events.
This report is available at no cost from the National Renewable Energy Laboratory (NREL) at www.nrel.gov/publications.
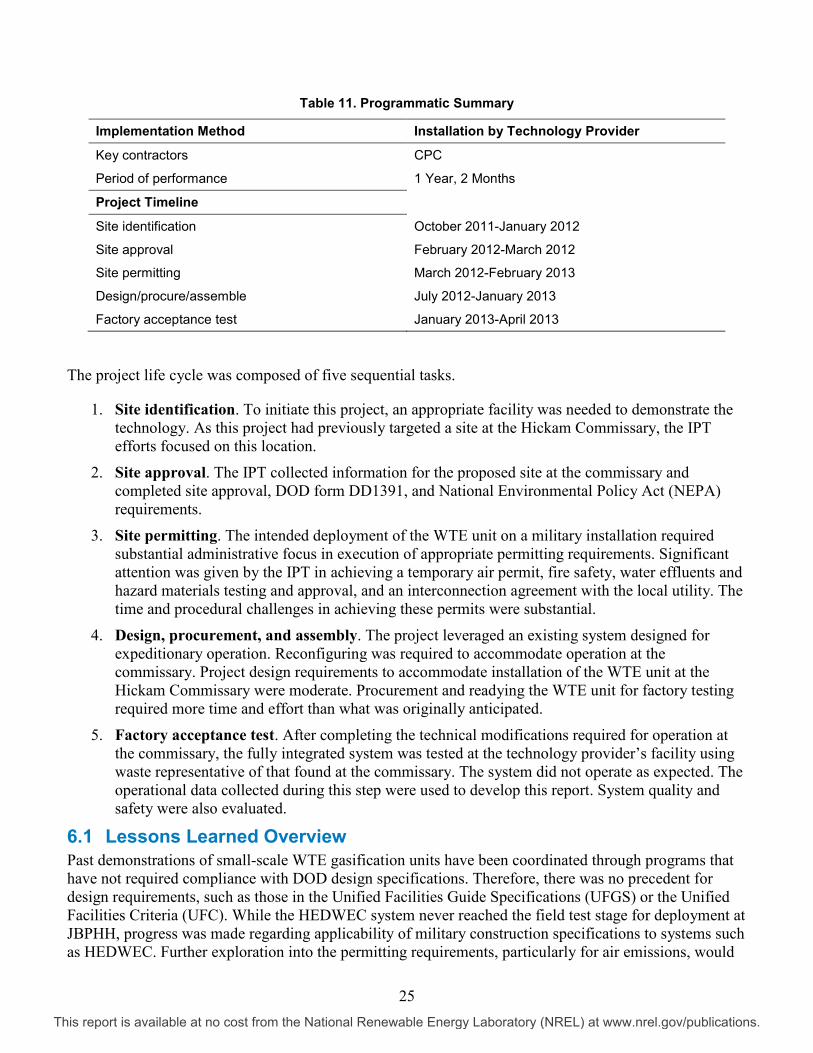
25
Table 11. Programmatic Summary
Implementation Method Installation by Technology Provider
Key contractors CPC
Period of performance 1 Year, 2 Months
Project Timeline
Site identification October 2011-January 2012
Site approval February 2012-March 2012
Site permitting March 2012-February 2013
Design/procure/assemble July 2012-January 2013
Factory acceptance test January 2013-April 2013
The project life cycle was composed of five sequential tasks.
1. Site identification. To initiate this project, an appropriate facility was needed to demonstrate the technology. As this project had previously targeted a site at the Hickam Commissary, the IPT efforts focused on this location.
2. Site approval. The IPT collected information for the proposed site at the commissary and completed site approval, DOD form DD1391, and National Environmental Policy Act (NEPA) requirements.
3. Site permitting. The intended deployment of the WTE unit on a military installation required substantial administrative focus in execution of appropriate permitting requirements. Significant attention was given by the IPT in achieving a temporary air permit, fire safety, water effluents and hazard materials testing and approval, and an interconnection agreement with the local utility. The time and procedural challenges in achieving these permits were substantial.
4. Design, procurement, and assembly. The project leveraged an existing system designed for expeditionary operation. Reconfiguring was required to accommodate operation at the commissary. Project design requirements to accommodate installation of the WTE unit at the Hickam Commissary were moderate. Procurement and readying the WTE unit for factory testing required more time and effort than what was originally anticipated.
5. Factory acceptance test. After completing the technical modifications required for operation at the commissary, the fully integrated system was tested at the technology provider’s facility using waste representative of that found at the commissary. The system did not operate as expected. The operational data collected during this step were used to develop this report. System quality and safety were also evaluated.
6.1 Lessons Learned Overview Past demonstrations of small-scale WTE gasification units have been coordinated through programs that have not required compliance with DOD design specifications. Therefore, there was no precedent for design requirements, such as those in the Unified Facilities Guide Specifications (UFGS) or the Unified Facilities Criteria (UFC). While the HEDWEC system never reached the field test stage for deployment at JBPHH, progress was made regarding applicability of military construction specifications to systems such as HEDWEC. Further exploration into the permitting requirements, particularly for air emissions, would
This report is available at no cost from the National Renewable Energy Laboratory (NREL) at www.nrel.gov/publications.
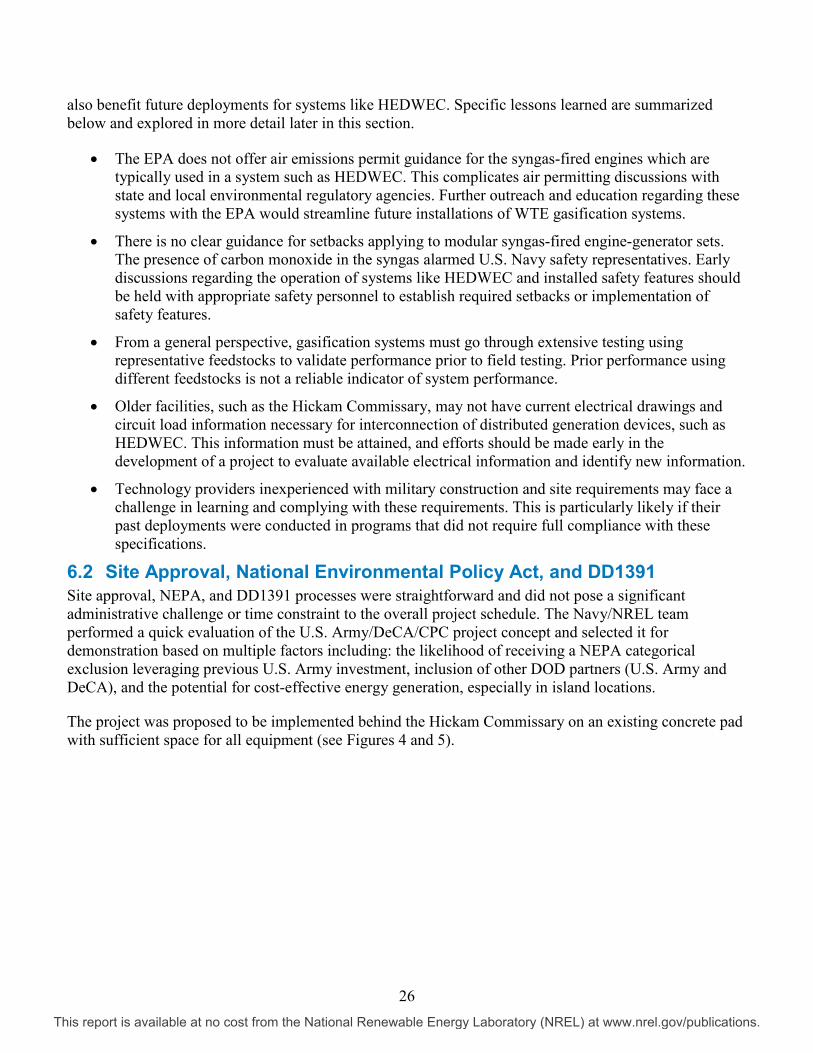
26
also benefit future deployments for systems like HEDWEC. Specific lessons learned are summarized below and explored in more detail later in this section.
• The EPA does not offer air emissions permit guidance for the syngas-fired engines which are typically used in a system such as HEDWEC. This complicates air permitting discussions with state and local environmental regulatory agencies. Further outreach and education regarding these systems with the EPA would streamline future installations of WTE gasification systems.
• There is no clear guidance for setbacks applying to modular syngas-fired engine-generator sets. The presence of carbon monoxide in the syngas alarmed U.S. Navy safety representatives. Early discussions regarding the operation of systems like HEDWEC and installed safety features should be held with appropriate safety personnel to establish required setbacks or implementation of safety features.
• From a general perspective, gasification systems must go through extensive testing using representative feedstocks to validate performance prior to field testing. Prior performance using different feedstocks is not a reliable indicator of system performance.
• Older facilities, such as the Hickam Commissary, may not have current electrical drawings and circuit load information necessary for interconnection of distributed generation devices, such as HEDWEC. This information must be attained, and efforts should be made early in the development of a project to evaluate available electrical information and identify new information.
• Technology providers inexperienced with military construction and site requirements may face a challenge in learning and complying with these requirements. This is particularly likely if their past deployments were conducted in programs that did not require full compliance with these specifications.
6.2 Site Approval, National Environmental Policy Act, and DD1391 Site approval, NEPA, and DD1391 processes were straightforward and did not pose a significant administrative challenge or time constraint to the overall project schedule. The Navy/NREL team performed a quick evaluation of the U.S. Army/DeCA/CPC project concept and selected it for demonstration based on multiple factors including: the likelihood of receiving a NEPA categorical exclusion leveraging previous U.S. Army investment, inclusion of other DOD partners (U.S. Army and DeCA), and the potential for cost-effective energy generation, especially in island locations.
The project was proposed to be implemented behind the Hickam Commissary on an existing concrete pad with sufficient space for all equipment (see Figures 4 and 5).
This report is available at no cost from the National Renewable Energy Laboratory (NREL) at www.nrel.gov/publications.
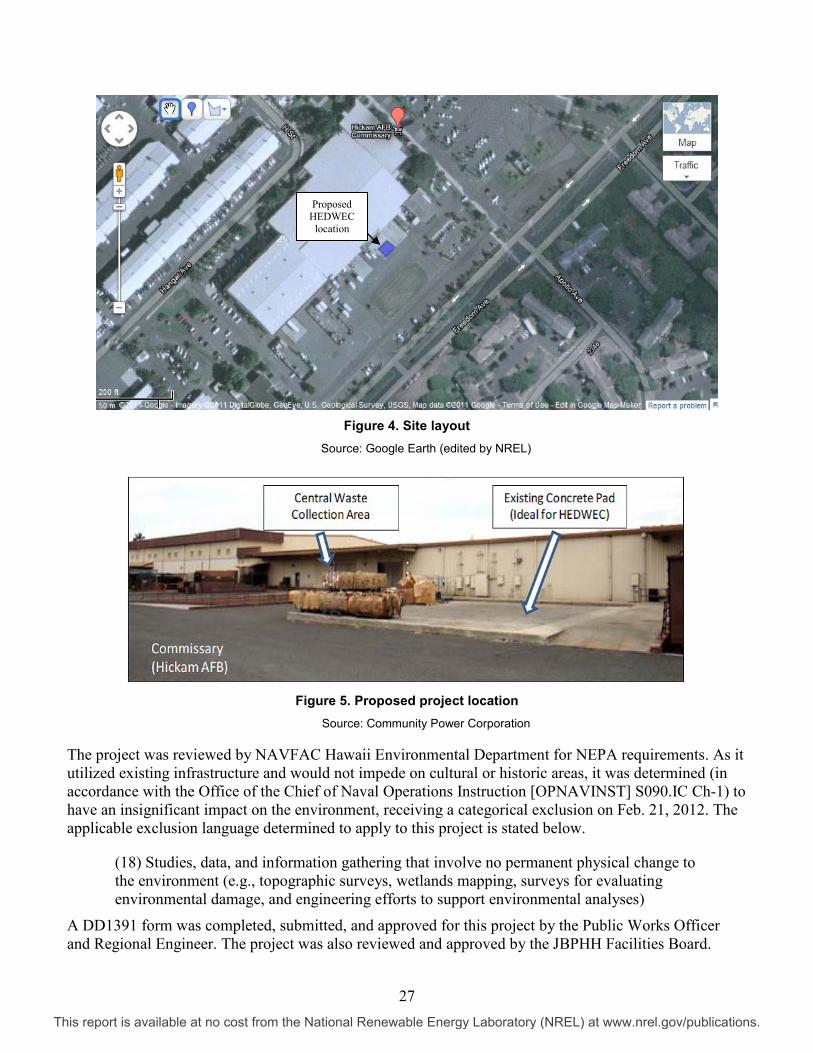
27
Figure 4. Site layout
Source: Google Earth (edited by NREL)
Figure 5. Proposed project location
Source: Community Power Corporation
The project was reviewed by NAVFAC Hawaii Environmental Department for NEPA requirements. As it utilized existing infrastructure and would not impede on cultural or historic areas, it was determined (in accordance with the Office of the Chief of Naval Operations Instruction [OPNAVINST] S090.IC Ch-1) to have an insignificant impact on the environment, receiving a categorical exclusion on Feb. 21, 2012. The applicable exclusion language determined to apply to this project is stated below.
(18) Studies, data, and information gathering that involve no permanent physical change to the environment (e.g., topographic surveys, wetlands mapping, surveys for evaluating environmental damage, and engineering efforts to support environmental analyses)
A DD1391 form was completed, submitted, and approved for this project by the Public Works Officer and Regional Engineer. The project was also reviewed and approved by the JBPHH Facilities Board.
Proposed HEDWEC
location
Proposed HEDWEC
location
This report is available at no cost from the National Renewable Energy Laboratory (NREL) at www.nrel.gov/publications.
28
6.3 Contracts and Procurement The implementation strategy for this project leveraged the expertise of the original developer of the HEDWEC system, CPC. Under contract to NREL, CPC was assigned a broad range of project responsibilities. They were required to configure the HEDWEC system for application to this project, evaluate system performance at their own facilities, ship the unit to JBPHH, perform site project design and installation, and demonstrate (operate) the system at JBPHH over a prescribed number of months. In general terms, CPC served as the technology provider, installation contractor, and service operator.
The implementation approach chosen assigned the majority of project responsibilities to the technology provider. This is in contrast to a more distributed model with separate contracts assigned for technology procurement, site design and installation, and technology operation. Rationale for the approach used was based on three factors:
• Consistency with future deployments. For this initiative, the objective was not only to evaluate the performance of the technology, but also the effectiveness of the most likely implementation strategy in further, non-demonstration deployments in a military environment. For near term deployments of this technology offering, the provider will likely play a significant role in site installation and operation and maintenance. The contracting model utilized was structured to be consistent with this near-term implementation strategy for future WTE units. Pending further validation of this technology, a longer-term strategy may entail direct government purchase of WTE systems or use of private sector investment through mechanisms, such as energy savings performance contracts. Upon validation, a small-scale WTE system will be acquired in a similar manner to acquisition for other renewable technologies, such as solar photovoltaic or wind technologies. For WTE, however, feedstock must also be considered to ensure sufficient fuel for the system is secured for the duration of the project. In the case of a third-party financed project, the third party will be responsible for securing sufficient feedstock.
• Likelihood of project success. The implementation approach demonstrated must also be chosen to ensure its key performers can succeed under the conditions ascribed by the project. The IPT’s initial assumption was the site-related requirements of the project were marginal. Additionally, CPC had previous success performing in a similar role on a prior Office of the Secretary of Defense (OSD)/Environmental Security Technology Certification Program (ESTCP) biomass gasification project. Implementation under the chosen model was therefore viewed as achievable and not placing undue burden on project execution.
• Unique qualifications of technology provider. In contributing the HEDWEC system to this demonstration, the ARL provided a unique, cost-savings opportunity to the U.S. Navy/NREL initiative. The system as provided was, however, a demonstration unit developed for operational energy applications. CPC, the original developer of the HEDWEC system, was uniquely qualified to configure and operate the system for application to the Hickam Commissary.
This approach to project implementation worked well with regards to configuring, testing, and evaluating the HEDWEC system for application at the Hickam Commissary. These activities were performed effectively and within a reasonable timeline. As these project elements were technology-centric, these results were to be expected because they aligned well with CPC’s core capabilities.
Conversely, the team struggled with executing site-related design and permitting requirements. This was largely attributable to CPC’s inexperience with NAVFAC UFC/UFGS and JBPHH-specific requirements. These requirements, although minimal from the perspective of a NAVFAC construction activity, proved more extensive and challenging than CPC had initially realized. The “learning curve” for bringing CPC
This report is available at no cost from the National Renewable Energy Laboratory (NREL) at www.nrel.gov/publications.

29
up to speed was substantial, requiring more time and resources than expected while yielding frustration for both contractor and client.
Ultimately, the project’s approach to implementation was reasonably structured to facilitate near-term deployments of the technology. This evaluation, however, is skewed by the technology provider’s shortage of experience with and understanding of military construction and site requirements. Having now gained valuable experience from this demonstration, CPC is likely in a better position to fully execute follow-on demonstration and deployment activities. Further deployments should therefore not be affected by similar programmatic challenges.
The CPC subcontract was structured in three phases:
• Phase 1. Baseline testing at CPC’s facility (also called factory acceptance testing)
• Phase 2. Field demonstration at Hickam Commissary
• Phase 3. Performance assessment and final reporting.
The contract included an “off-ramp” provision to allow transition directly from Phase 1 to Phase 3 if the initial testing was not successful. This provision proved useful for this demonstration, as HEDWEC did not achieve performance goals during testing at CPC.
Another contractual vehicle used for this demonstration was the MOA (previously addressed in this section). Two key concepts of the MOA which were necessary in allowing the demonstration to proceed were: 1) Army allowing the HEDWEC unit to be used for this purpose and, 2) DeCA allowing recyclable cardboard to be used as feedstock. The recyclable cardboard is a revenue-generating product for DeCA and an initial economic analysis showed higher value in on-site generation to electricity than recycling in foreign markets. This was later found to be inaccurate based on actual performance of the system but was initially a significant determining factor in feedstock availability for the demonstration.
6.4 Design As discussed in previous sections, the majority of the technology was designed by CPC under a contract with the U.S. Army, with refinements made prior to execution of the NREL subcontract. Most of the design work for this demonstration related to site design and dealing with uncertainties associated with the technology’s installation on a DOD site.
6.4.1 Anti-Terrorism and Force Protection NAVFAC Pacific Safety reviewed photographs of the technology and proposed site. As there would only be one operator and no work was to be done to the adjacent commissary building, Anti-terrorism and Force Protection requirements were not triggered.
6.4.2 Fire Protection NAVFAC Pacific Safety expressed concern for the presence of carbon monoxide in the syngas fuel mixture used by HEDWEC. A detailed and extensive exchange between NAVFAC Pacific and NREL resulted in several questions about how HEDWEC should be categorized. Specifically, questions revolved around the separation distance required between HEDWEC and the commissary building.
Due to the containerization of the system, HEDWEC could be considered a structure and subject to guidance on relocatable buildings from OPNAVINST 11010.33C, which refers to fire protection
This report is available at no cost from the National Renewable Energy Laboratory (NREL) at www.nrel.gov/publications.

30
requirements of the UFC and International Building Code (IBC). Per the IBC, 40 feet of separation is required between containerized structures and adjacent buildings.
The separation distance is determined by evaluating the type of construction, function, occupancy, presence of hazardous materials, and categorization as a building or a structure. UFC 3-600-1 and the National Fire Protection Association standards also provide guidance for separation and fire safety requirements. Conventional energy generation equipment has its own sections in these documents. The unique nature of HEDWEC resulted in an extensive exchange to determine which fire safety specifications should apply. Also compounding the issue was the limited space available on the existing concrete pad proposed to be used for the demonstration. Ultimately, it was determined the HEDWEC system could be placed on the existing pad while maintaining a 40-foot separation distance from the commissary, though there remained uncertainty about the exact classification of the system and relevant safety requirements. Forty feet was determined to be a conservatively safe distance; while this space is available at the Hickam Commissary, it may not be available at future sites. For this technology to be deployed at other locations, further exploration should be conducted to classify systems such as HEDWEC to help determine applicable fire safety requirements. Figure 6 shows an animated rendition of the proposed layout of HEDWEC at the edge of the concrete pad. A portion of the shredder had to be shortened to meet the separation requirements from the commissary building (upper right portion of image).
Figure 6. Site design overview
Source: Community Power Corporation
6.4.3 Gasoline Storage A mid-project design change required a small amount of gasoline (<10 gallons) to be stored at the project site. This change was reviewed by NAVFAC Pacific, and no additional guidance was given.
6.4.4 Other Safety As a result of an incident at CPC’s test site in Colorado, CPC’s parent company Afognak Native Corporation conducted an investigation into the safety of HEDWEC’s design. The report concluded the
This report is available at no cost from the National Renewable Energy Laboratory (NREL) at www.nrel.gov/publications.
31
root causes of the incident were deviation from, or lack of, proper safety procedures, and that there were no safety issues inherent to the system’s design.
As gasification WTE technology matures, it is likely to become more prevalent at DOD installations. The risks inherent with this technology are similar to other thermochemical energy generation technologies, such as diesel generators. For example, hazardous chemicals, such as CO, and high temperatures are likely to be a part of the energy generation process. While the CPC incident investigation found no issues in the design of the safety, it is a reminder to ensure proper safety procedures are in place prior to assembling, installing, or operating gasification WTE systems. It may even be prudent to have an industrial hygienist conduct an inspection of the system design prior to installation at the host facility.
6.4.5 Unified Facilities Guide Specifications CPC staff encountered a great deal of confusion when trying to determine which UFGS specifications would apply to the HEDWEC demonstration. CPC hired two different professional engineers registered with the state of Hawaii, but neither was familiar with the UFGS specifications. Several months were spent evaluating and contemplating these specifications. The demonstration portion of the project was canceled before the UFGS specifications were determined. A lesson learned from this activity is to ensure technology providers who are unfamiliar with military requirements are properly informed of their importance and significance. Additionally, such providers would benefit from securing assistance from firms familiar with the UFGS specifications, preferably when estimating their costs for a project on a DOD site.
6.5 Installation and Construction Several aspects of this technology were reviewed for compliance with regulatory requirements. These included air emissions, solid waste handling, ash disposal, hazardous materials handling, and water discharge. Also, because it would be interconnected with the Hickam Commissary, an interconnection agreement with Hawaii Electric Company (HECO) was required. Prior to shipping, the technology underwent testing at the manufacturer’s facility to verify performance. HEDWEC was unable to successfully complete this factory acceptance testing, at which point installation and construction activities ceased.
6.5.1 Air Permitting Due to EPA’s lack of guidance for permitting air emissions of syngas-fired engines, the permitting pathway for a system like HEDWEC does not yet have a clear precedent, making the process very challenging. The IPT evaluated several options for permitting the air emissions and ultimately opted to pursue an exemption for the purposes of this demonstration, which was approved by the Hawaii Department of Health March 12, 2012, after nearly five months of evaluation by the IPT.
Gasification-based technologies, such as HEDWEC, are mistaken for incinerators by regulatory authorities who simply understand it as a heat-based process consuming residual solid materials as feedstock. Classification as an incinerator automatically triggers a complex permitting pathway under the EPA’s Title V permit program. Attaining a Title V permit can take from 18-24 months, and entails extensive monitoring and reporting requirements. The emissions for a system like HEDWEC come from the engine’s exhaust. EPA offers specific guidance for permitting engine exhaust emissions from stationary spark-ignited internal combustion engines such as that used in the HEDWEC system. If the engine can be proven to meet requirements, the permit is much easier to attain and maintain.
This report is available at no cost from the National Renewable Energy Laboratory (NREL) at www.nrel.gov/publications.
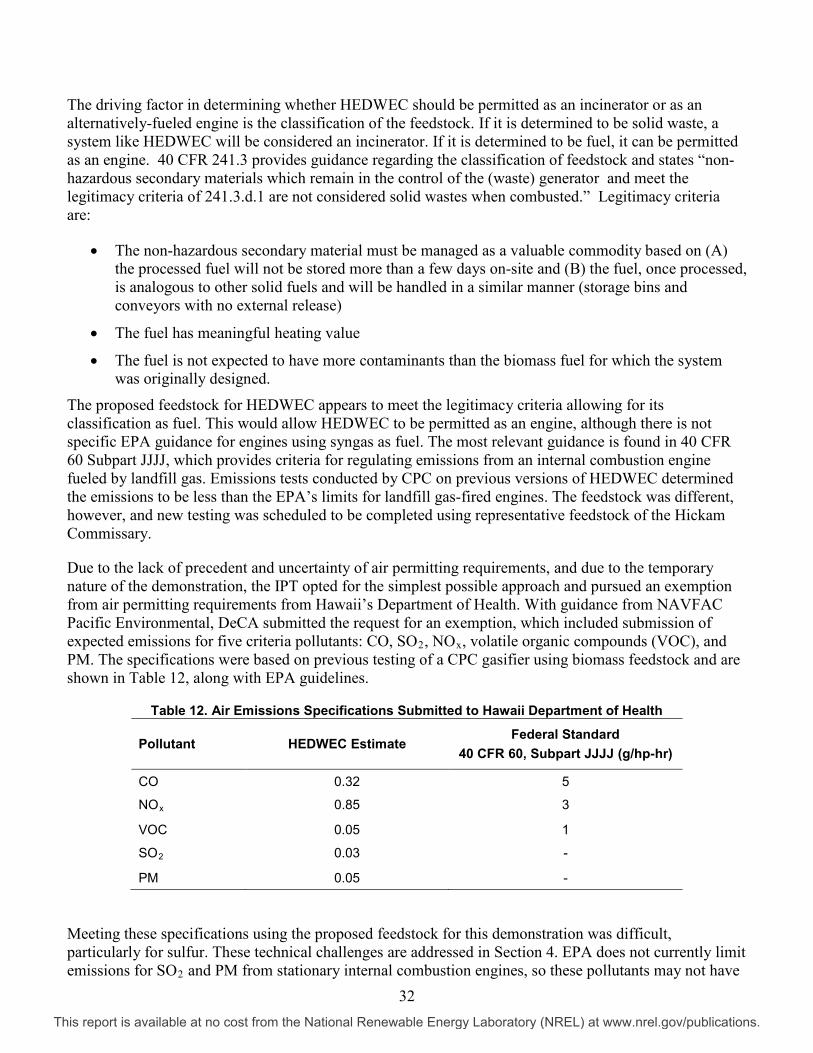
32
The driving factor in determining whether HEDWEC should be permitted as an incinerator or as an alternatively-fueled engine is the classification of the feedstock. If it is determined to be solid waste, a system like HEDWEC will be considered an incinerator. If it is determined to be fuel, it can be permitted as an engine. 40 CFR 241.3 provides guidance regarding the classification of feedstock and states “non-hazardous secondary materials which remain in the control of the (waste) generator and meet the legitimacy criteria of 241.3.d.1 are not considered solid wastes when combusted.” Legitimacy criteria are:
• The non-hazardous secondary material must be managed as a valuable commodity based on (A) the processed fuel will not be stored more than a few days on-site and (B) the fuel, once processed, is analogous to other solid fuels and will be handled in a similar manner (storage bins and conveyors with no external release)
• The fuel has meaningful heating value
• The fuel is not expected to have more contaminants than the biomass fuel for which the system was originally designed.
The proposed feedstock for HEDWEC appears to meet the legitimacy criteria allowing for its classification as fuel. This would allow HEDWEC to be permitted as an engine, although there is not specific EPA guidance for engines using syngas as fuel. The most relevant guidance is found in 40 CFR 60 Subpart JJJJ, which provides criteria for regulating emissions from an internal combustion engine fueled by landfill gas. Emissions tests conducted by CPC on previous versions of HEDWEC determined the emissions to be less than the EPA’s limits for landfill gas-fired engines. The feedstock was different, however, and new testing was scheduled to be completed using representative feedstock of the Hickam Commissary.
Due to the lack of precedent and uncertainty of air permitting requirements, and due to the temporary nature of the demonstration, the IPT opted for the simplest possible approach and pursued an exemption from air permitting requirements from Hawaii’s Department of Health. With guidance from NAVFAC Pacific Environmental, DeCA submitted the request for an exemption, which included submission of expected emissions for five criteria pollutants: CO, SO2, NOx, volatile organic compounds (VOC), and PM. The specifications were based on previous testing of a CPC gasifier using biomass feedstock and are shown in Table 12, along with EPA guidelines.
Table 12. Air Emissions Specifications Submitted to Hawaii Department of Health
Pollutant HEDWEC Estimate Federal Standard 40 CFR 60, Subpart JJJJ (g/hp-hr)
CO 0.32 5 NOx 0.85 3
VOC 0.05 1 SO2 0.03 -
PM 0.05 -
Meeting these specifications using the proposed feedstock for this demonstration was difficult, particularly for sulfur. These technical challenges are addressed in Section 4. EPA does not currently limit emissions for SO2 and PM from stationary internal combustion engines, so these pollutants may not have
This report is available at no cost from the National Renewable Energy Laboratory (NREL) at www.nrel.gov/publications.

33
to be reported to attain an operating permit in the future. For the purpose of attaining the exemption, however, the IPT opted to report all available air emissions information.
This request for an exemption was approved within a month of submission, and the entire process took approximately five months to review options and attain the exemption. Further investigation into classification of the system was suspended. A later objective for this demonstration was to reach out to the Hawaii Department of Health and the EPA to discuss classification of systems like HEDWEC. More detailed discussion in this area would be beneficial to establishing a predictable permitting pathway for systems like this in the future.
Other Permits Several other permits were considered for this demonstration.
• Solid waste permit. For this project, it was determined that a single source exemption would apply because all materials were proposed to come from the Hickam Commissary, and no outside materials would be received.
• Wastewater discharge permit. HEDWEC has no water effluent from its gasification process, but the dehydrators used for processing of wet feedstock do have effluent. A discussion was held with the JBPHH Wastewater Treatment Plant (WWTP) operator, and concern was expressed for grease in the dehydrator effluent, which might be present from meat products. Prior to discharge of effluent into the drains of the commissary, effluent from the dehydrator must be tested and verified to meet all specifications of the WWTP. This test must be done using actual materials from Hickam Commissary after the unit is physically onboard JBPHH. The test could not be done at CPC’s facility in preparation. As the unit did not ship to JBPHH, the effluent was not tested to determine if discharge to the WWTP would be an issue.
In future projects producing residual water, consideration must be given for the specifications of the WWTP. The test results from the effluent take several days to receive, so existing disposal methods of high moisture materials must remain in place while the dehydrator effluent is verified to be suitable for discharge.
• Hazardous materials (HAZMAT). HEDWEC produces ash as a residual byproduct at a rate of approximately 15 lbs/hr. Onboard JBPHH, up to 55 gallons of potentially hazardous waste can be stored for up to three days while HAZMAT testing is conducted. For the ash, a TCLP must be conducted using representative feedstock to verify the ash is not hazardous. In previous operations, residual ash was tested to be free of toxic metals using the TCLP, but this test would have to be replicated for HEDWEC while on-site at the Hickam Commissary and using actual commissary feedstock. At maximum production, HEDWEC would take several days to generate 55 gallons of ash. In theory, this would allow sufficient time to get results from the TCLP. Pending a successful (negative) TCLP, the ash can be disposed of in a conventional landfill via a typical dumpster. If the TCLP were to be positive, ash must be handled as HAZMAT and disposed of accordingly. With the termination of this demonstration, actual ash was not tested.
Interconnection Development of the interconnection agreement application for this project was an unexpectedly challenging process, requiring the coordination of multiple parties. The key aspects of the interconnection are listed below.
This report is available at no cost from the National Renewable Energy Laboratory (NREL) at www.nrel.gov/publications.
34
• Interconnection point. Development of the electrical interconnection drawing package began with collaboration between NREL, CPC, and DeCA Engineering to determine the potential load of HEDWEC (during startup) and interconnection point. CPC estimated the load at 150 amps and DeCA Engineering identified an existing manual transfer switch (previously installed for a backup diesel generator) as a good interconnection point. A simplified electrical drawing of HEDWEC’s interconnection to the commissary distribution system (recreated from a DeCA Engineering drawing) is provided in Appendix B.
• Utility process review. NREL and CPC held discussions with NAVFAC and HECO to review the utility process. Figure 7 shows a flow chart, provided by HECO, showing the steps necessary for the Hawaii Public Utility Commission (PUC) interconnection process. This figure is extracted from Rule 14H, which outlines the interconnection process.
The process is fairly straightforward but requires analysis at each step. This analysis requires the vendor to verify that its technology can meet the performance specifications laid out in Rule 14H. It also requires support from the host to determine how the distributed generator’s capacity compares to loads on the circuit and other existing on-site generation (distributed generation is to be <15% of a circuit’s total load).
For this demonstration project, the generation of HEDWEC was not expected to leave the commissary’s distribution system. Average load at the commissary is over 400 kW, and the peak generation expected during early phases of this demonstration was 70 kW. CPC reviewed the performance specifications of the interconnection agreement and compiled technical documentation for HEDWEC to submit with the interconnection package.
Also needed for the interconnection application was a drawing package stamped by a professional engineer. Typically, HECO requires the drawing to show the complete electrical pathway between the distributed generator and HECO’s system. This would have included the commissary distribution system, commissary transformer, and the appropriate Hickam circuit to the HECO transformer. Due to the relatively small size of the generator compared to the commissary load, HECO authorized a drawing just to the commissary transformer. This proved to be much more challenging than expected, however, because the commissary did not have current electrical drawings.
This report is available at no cost from the National Renewable Energy Laboratory (NREL) at www.nrel.gov/publications.

35
Figure 7. Technical process review chart
Source: Hawaiian Electric Company
This report is available at no cost from the National Renewable Energy Laboratory (NREL) at www.nrel.gov/publications.
36
• Commissary drawings. Hickam Commissary did not have accurate drawings or electrical information for CPC’s professional engineer (PE) to review. The commissary had an electrical upgrade for its refrigeration system that included a significant addition to its main switchgear. Neither the commissary nor DeCA Engineering had access to load information for this portion of the electrical system, to which HEDWEC was proposed for interconnection. Appendix B contains a partial drawing of the commissary’s electrical distribution system, with comments from CPC’s PE regarding load monitoring. A complicating factor in this effort was a revised estimate by CPC that HEDWEC would need 600 amps of available capacity for startup. This figure was driven by the new shredder and briquette maker installed for feedstock processing. With little electrical information available from the commissary and a significantly higher capacity requested for interconnection, CPC coordinated monitoring of the interconnection circuit to determine the existing electrical load and available capacity. This occurred over a 30-day period to meet the requests of CPC’s PE.
• NAVFAC Hawaii review. It took approximately six months of time for the project team to identify all requirements and provide materials for the interconnection application. The majority of this time was spent in developing electrical drawings. All HECO requirements were believed to have been met when the interconnection application package was submitted to NAVFAC Pacific. Per a relatively new step in this process, NAVFAC Hawaii commenced a technical review of the package, required before submitting to HECO. Upon receipt of the HECO interconnection application form, NAVFAC Hawaii requested a new interconnection application form to be filled out. This form had several differences from the HECO form, most notably requiring the completion of an arc flash analysis for the commissary distribution system. CPC’s PE estimated the cost for this analysis at $30,000 and a time frame of 90 days to complete. This is very important lesson learned, as the requirement was not stated in the HECO interconnection application but entails significant time and expense that must be planned into the project. The arc flash analysis was not completed for this project due to its early termination.
6.6 Operation and Maintenance 6.6.1 Factory Acceptance Testing During factory acceptance testing, CPC determined the level of skill and the time needed for operating HEDWEC would be much higher than previously expected. This was a primary contributing factor in terminating the demonstration. Originally, the expectation was for 10-12 minutes per hour for an operator to feed materials into the system, check for system alarms and occasionally empty the ash container. Issues with material flow and system malfunctions created a need for continuous monitoring of the system by a skilled technician who could troubleshoot recurring issues.
6.7 Training Little training was actually conducted as part of this demonstration project. The original intent was for CPC to develop a training plan for Hickam Commissary staff who would serve as operators for HEDWEC. With the termination of the project prior to shipping, no training for commissary staff was conducted.
CPC did identify courses needed by its field supervisor prior to commencing the demonstration. These included safety and quality control courses. The courses were not taken by CPC staff, however, due to uncertainty and eventual termination of the field demonstration aboard JBPHH.
This report is available at no cost from the National Renewable Energy Laboratory (NREL) at www.nrel.gov/publications.

37
7 Commercial Readiness Qualitative Assessment As discussed in Sections 4 and 5, the current HEDWEC system was determined not to be ideal for application in using the proposed feedstock at the Hickam Commissary. Technical recommendations for improving the performance of the HEDWEC system are discussed in Appendix C. Appendix D is a general assessment of the current technical and institutional barriers challenging the WTE and biomass industry.
The objective of this particular demonstration was to evaluate the performance of a small-scale gasification system using solid waste materials that would be typical at a U.S. Navy installation. While HEDWEC’s predecessors have proven to operate successfully using homogeneous biomass feedstocks (e.g., walnut shells) in other applications, these feedstocks are not readily available at most U.S. Navy installations, and therefore, were not relevant to this project. HEDWEC’s transition from biomass to other solid waste materials was found to be more difficult than anticipated and is a theme demonstrated by other technologies that have tried to make similar feedstock transitions. NREL could not find any small-scale WTE gasification systems in the United States utilizing true waste material feedstock in a commercial application.
During the course of this project, other technologies were identified that will compete with HEDWEC to establish themselves as the first commercially ready, small-scale gasifier capable of using solid waste materials (ideally unprocessed municipal solid waste).
The first is the Green Energy Machine (GEM), developed by MSW Power in the previously mentioned NSRDEC program, which also developed HEDWEC. Versions of GEM have been demonstrated twice. GEM is reported to have successfully operated using solid waste materials found at forward-operating bases (food waste, paper, cardboard, and plastic) in 2012 at Edwards Air Force Base under the ESTCP.5 Next, it was demonstrated in 2013 at a correctional institute in Massachusetts using the same types of feedstock (food waste, paper, cardboard, and plastic) from the institute’s dining facility. The gasification approach of GEM is similar to HEDWEC in that they both process feedstock by shredding and compressing it, and then feed it into a downdraft gasifier (air flowing down in the same direction as the flow of feedstock) to create syngas. GEM mixes the wet and dry feedstock before shredding, and uses waste heat to drive excess moisture from the feedstock before gasification. GEM uses the syngas differently, however, by feeding it into a diesel engine-generator set to offset diesel fuel consumption. So, GEM requires a continuous (but small) supply of diesel throughout its operation, while HEDWEC uses gasoline only during startup and shutdown. Similar to HEDWEC, GEM consumes 2-3 tons per day of mixed wet and dry waste and produces a net 70 kW electrical output. More information was provided by MSW Power regarding the technology and is provided in Appendix E.
Another small-scale gasification technology has been developed by Sierra Energy and is beginning a demonstration phase at Fort Hunter Liggett under the ESTCP program. Sierra’s technology is a gasifier reactor derived from blast furnace technology. It differs from HEDWEC and GEM in that it 1) is an updraft gasifier (oxygen and steam flowing upward, against the flow of feedstock), 2) operates at higher temperatures, creating slag from inert materials instead of ash, 3) consumes more feedstock, approximately 12 tons per day, and 4) is projected to generate more electricity at 400 kW net output. The
5 The final ESTCP report indicated a 13-year simple payback if the system had been operated at full capacity. The report is available online at: www.serdp.org/Program-Areas/Energy-and-Water/Energy/Distributed-Generation/EW-200932/EW-200932/(language)/eng-US.
This report is available at no cost from the National Renewable Energy Laboratory (NREL) at www.nrel.gov/publications.

38
creation of slag is an advantage because it essentially cools to stone and captures any hazardous materials introduced with the feedstock within it. The use of syngas is expected to be similar to HEDWEC and GEM in that it will be used as a fuel for a distributed generator, though the exact method is not yet known by NREL. The demonstration is expected to be operating early in 2014.
Many challenges exist in using MSW as feedstock, though most relate to the ability of the system to process the feedstock in a way that makes it suitable for use in downstream gasification and energy conversion processes. The feedstock processing challenges become less of an issue at larger scales because the fluctuations are less prevalent at higher volumes. Also, industry’s past focus on large systems has created more options for commercially available feedstock-processing components. As part of an evaluation of WTE gasification systems suitable for a waste stream of 30 tons per day, NREL received responses from nine technology providers claiming to have viable systems. This list is provided in Appendix F.
The BioEnergy Producers Organization maintains a database of non-incineration WTE technologies (gasification, pyrolysis, anaerobic digestion) and has identified over 50 possible technology providers around the world. In 2010, staff from NAVFAC Southwest visited several large-scale gasification WTE operations in Europe, Asia, and Australia to evaluate the state of the industry. The findings from this trip, as well as a broad assessment of the WTE industry, were published by NAVFAC Engineering Services Center in 2011.6 In addition, several large municipalities, including the City and County of Los Angeles7 and New York City8 have conducted evaluations of large-scale, non-incineration WTE technologies and identified several options.
Larger-scale gasification WTE options were not evaluated during this project but appear to be closer to commercial viability for operation in the United States. From past research, NREL has estimated waste streams at DOD installations in a typical range of 10-30 tons per day, with some as high as several hundred tons per day at fleet homeports, such as Norfolk, Virginia, or San Diego, California. There could be a fit in utilizing the larger WTE gasification systems for the larger installation waste streams. While many of the larger-scale systems are moving forward at a faster pace than their small-scale counterparts, NREL is not aware of any true gasification system that is currently operating commercially on raw MSW at any scale in the United States. Because of this, the larger-scale systems will also need further performance validation. For the U.S. Navy, however, demonstration of these larger systems may be cost-prohibitive. At over $6 million per megawatt, procurement of these multi-megawatt systems will cost tens of millions of dollars, which does not include other installation and operating costs associated with a demonstration.
HEDWEC represents the most challenging segment (<10 tons per day) of the challenging WTE gasification industry. Systems like this may be viable for use in expeditionary environments or locations with extraordinarily high disposal costs for solid wastes. Evaluating larger WTE technologies, which are still sized appropriately for DOD installation waste streams, would open up new options but at much higher validation costs. 6 For more information, see: Tseng, E. Initiation Decision Report (IDR): Waste to Clean Energy. Port Hueneme, California: Naval Facilities Engineering Command, September 20, 2011. http://dpw.lacounty.gov/epd/conversiontechnology/download/NAVFAC_CT_Report.pdf. 7 Los Angeles County maintains an outreach and educational WTE website at: www.socalconversion.org/. 8 A copy of the press release regarding New York City’s WTE initiatives is available online at: www.nyc.gov/portal/site/nycgov/menuitem.c0935b9a57bb4ef3daf2f1c701c789a0/index.jsp?pageID=mayor_press_release&catID=1194&doc_name=http%3A%2F%2Fwww.nyc.gov%2Fhtml%2Fom%2Fhtml%2F2012a%2Fpr077-12.html&cc=unused1978&rc=1194&ndi=1.
This report is available at no cost from the National Renewable Energy Laboratory (NREL) at www.nrel.gov/publications.
39
8 Recommended Next Steps The WTE industry has received a lot of attention in recent years, and the pace of innovation will be rapid. Within DOD, this is particularly true for the small-scale WTE industry for which DOD sees application at forward-operating bases. An example of this focused attention is the formation of the Joint Deployable Waste-to-Energy Working Group, chaired by U.S. Pacific Command. The intention of the group is to develop specifications for small-scale deployable WTE systems. At larger scales, municipalities, such as Los Angeles and New York City, are likely to lead in the implementation of WTE technology. The WTE systems evaluated by these municipalities may be a fit for the largest U.S. Navy installations producing over 100 tons per day.
Given the technology readiness descriptions from the Defense Acquisition Guidebook (DAG), NREL believes the HEDWEC system to have a technology readiness level (TRL) of six. The feedstock processing component of this system is not yet ready for field testing in a representative environment, as determined during the course of this project. That said, the challenges identified during this project may be mitigated by revisiting the equipment selected for processing feedstock. Shredders and densification equipment (the briquette maker in the current version for HEDWEC) are commercial technology. Pairing this equipment with the right selection of feedstock may mitigate issues identified during this project.
The DOD’s renewable energy and waste reduction goals, as well as the liabilities of solid waste disposal in expeditionary environments, make it a key beneficiary to the development of small-scale WTE. It is unlikely the technology will advance to higher TRLs without DOD’s direct support. Because of the huge potential for the U.S. Navy to benefit from small-scale WTE, NREL recommends a “partner” strategy, per the DAG, for this technology. NREL further recommends the U.S. Navy maintain participation in appropriate DOD working groups and task forces focused on small-scale WTE gasification. This is appropriate for technologies focused on waste streams of 2-30 tons per day, a range that would likely find a suitable volume of solid waste feedstock at nearly all U.S. Navy installations. For larger systems capable of processing 30-300 tons per day, development will likely be led by large municipalities, and NREL recommends the U.S. Navy establish a “watch” strategy to track progress of these technologies, which might be a fit for larger U.S. Navy installations.
This report is available at no cost from the National Renewable Energy Laboratory (NREL) at www.nrel.gov/publications.
40
Appendix A: Memorandum of Agreement
This report is available at no cost from the National Renewable Energy Laboratory (NREL) at www.nrel.gov/publications.
41
This report is available at no cost from the National Renewable Energy Laboratory (NREL) at www.nrel.gov/publications.

42
This report is available at no cost from the National Renewable Energy Laboratory (NREL) at www.nrel.gov/publications.
43
This report is available at no cost from the National Renewable Energy Laboratory (NREL) at www.nrel.gov/publications.

44
This report is available at no cost from the National Renewable Energy Laboratory (NREL) at www.nrel.gov/publications.
45
This report is available at no cost from the National Renewable Energy Laboratory (NREL) at www.nrel.gov/publications.
46
This report is available at no cost from the National Renewable Energy Laboratory (NREL) at www.nrel.gov/publications.

47
This report is available at no cost from the National Renewable Energy Laboratory (NREL) at www.nrel.gov/publications.
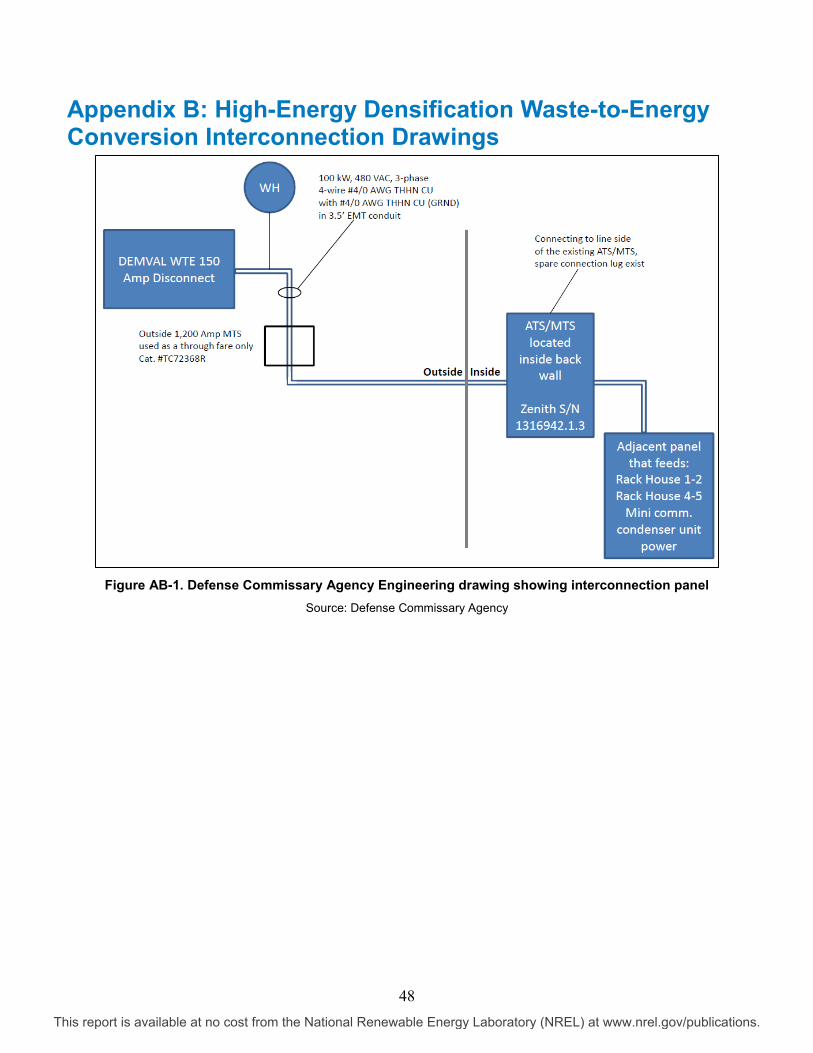
48
Appendix B: High-Energy Densification Waste-to-Energy Conversion Interconnection Drawings
Figure AB-1. Defense Commissary Agency Engineering drawing showing interconnection panel
Source: Defense Commissary Agency
This report is available at no cost from the National Renewable Energy Laboratory (NREL) at www.nrel.gov/publications.

49
Figure AB-2. Portion of the commissary electrical system proposed for interconnection (with CPC comments)
Source: Defense Commissary Agency
This report is available at no cost from the National Renewable Energy Laboratory (NREL) at www.nrel.gov/publications.
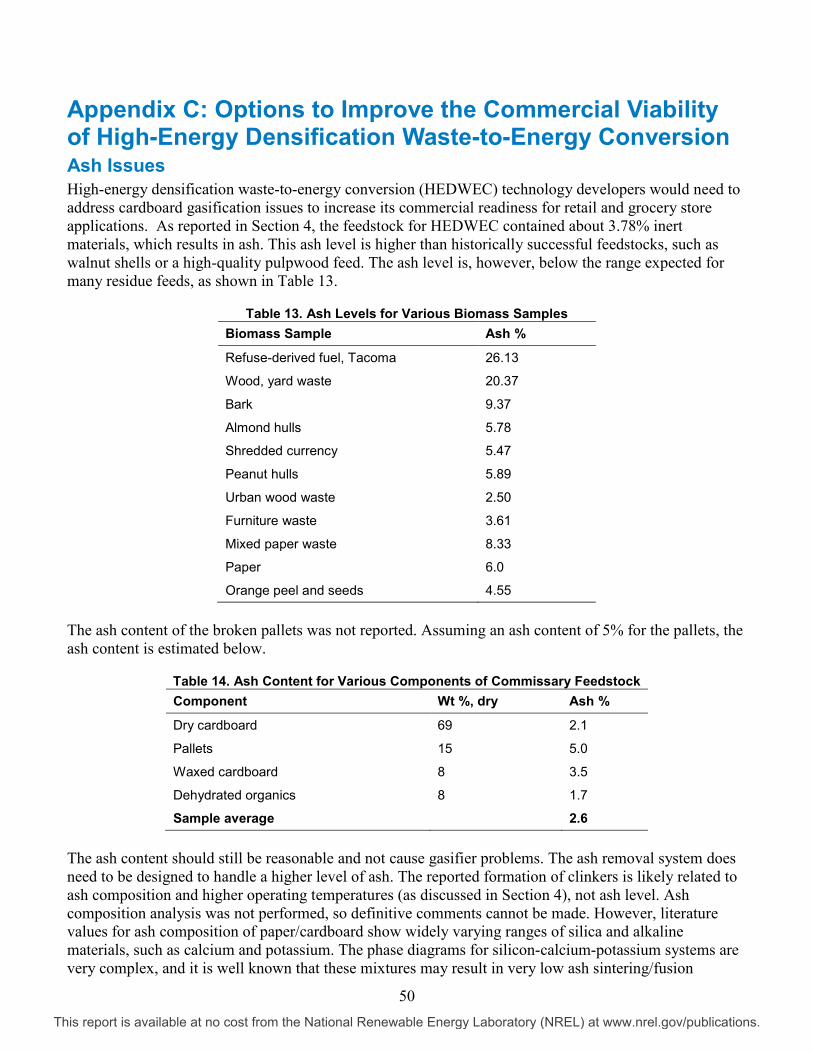
50
Appendix C: Options to Improve the Commercial Viability of High-Energy Densification Waste-to-Energy Conversion Ash Issues High-energy densification waste-to-energy conversion (HEDWEC) technology developers would need to address cardboard gasification issues to increase its commercial readiness for retail and grocery store applications. As reported in Section 4, the feedstock for HEDWEC contained about 3.78% inert materials, which results in ash. This ash level is higher than historically successful feedstocks, such as walnut shells or a high-quality pulpwood feed. The ash level is, however, below the range expected for many residue feeds, as shown in Table 13.
Table 13. Ash Levels for Various Biomass Samples Biomass Sample Ash %
Refuse-derived fuel, Tacoma 26.13
Wood, yard waste 20.37
Bark 9.37
Almond hulls 5.78
Shredded currency 5.47
Peanut hulls 5.89
Urban wood waste 2.50
Furniture waste 3.61
Mixed paper waste 8.33
Paper 6.0
Orange peel and seeds 4.55
The ash content of the broken pallets was not reported. Assuming an ash content of 5% for the pallets, the ash content is estimated below.
Table 14. Ash Content for Various Components of Commissary Feedstock Component Wt %, dry Ash %
Dry cardboard 69 2.1
Pallets 15 5.0
Waxed cardboard 8 3.5
Dehydrated organics 8 1.7
Sample average 2.6
The ash content should still be reasonable and not cause gasifier problems. The ash removal system does need to be designed to handle a higher level of ash. The reported formation of clinkers is likely related to ash composition and higher operating temperatures (as discussed in Section 4), not ash level. Ash composition analysis was not performed, so definitive comments cannot be made. However, literature values for ash composition of paper/cardboard show widely varying ranges of silica and alkaline materials, such as calcium and potassium. The phase diagrams for silicon-calcium-potassium systems are very complex, and it is well known that these mixtures may result in very low ash sintering/fusion
This report is available at no cost from the National Renewable Energy Laboratory (NREL) at www.nrel.gov/publications.

51
temperatures and contribute to clinker formation. If the actual sintering problem is alkali related, there are additives (e.g., magnesia) that can be added to the feed to raise the sintering temperature.
If gasifier performance relative to earlier feedstocks, such as walnut shells, had remained constant, then char yield should have only increased by 2%-3%. Instead it has increased by a factor of four, from 4% to about 16%. This issue was believed to be caused by complications from increased briquette size, as discussed in Section 4. Potential fixes might involve smaller diameter briquettes with lower specific gravity (less densification).
Material Flow The material flow through the HEDWEC system created issues in two primary ways. First, the briquettes did not flow through the gasifier in the same way as biomass feedstocks previously used in similar systems. This, and the different constituents of the feedstock, created instability and high temperatures. To mitigate high temperatures, the feed rate into the gasifier was lowered. The side effect of this was lowered production of syngas, which resulted in a lower volume of fuel available for the engines and lower power generation.
The second issue associated with the flow of feedstocks was the formation of clinkers, which was attributed to a relatively low melting point of the ash contained in the cardboard. The residence time of materials in the gasifier was decreased by increasing mechanical agitation to move material through more rapidly. This placed additional mechanical stresses on components’ welds and resulted in repeated weld failures. Modifying the briquetting process to improve gas flow through the gasifier is likely to reduce the frequency of mechanical shaking required. That, along with changes in shaker welding, should improve shaker operation.
Emissions Controls The sulfur mitigation system was a prototype system and created issues due to pressure buildup in the system, which affected operations of the internal combustion engines. Community Power Corporation (CPC) designed a new system for sulfur mitigation, using four drums instead of two, in its plans for the next version of HEDWEC. This will allow for higher throughput of syngas through the sulfur mitigation system. CPC also has more heavily insulated containers and more precise heating of the sulfur mitigation system to help reduce the condensation in the system that was experienced during HEDWEC testing.
This report is available at no cost from the National Renewable Energy Laboratory (NREL) at www.nrel.gov/publications.
52
Appendix D: Biomass/Waste-to-Energy Industry Assessment An overview of sector barriers to gasification development and commercialization is examined below. The discussion begins with an analysis of technology barriers that must be overcome to achieve successful technology pathways leading to the commercialization of biomass conversion and feedstock technologies. Next, an examination of institutional barriers is presented that encompasses the underlying policies, regulations, market development, and education needed to ensure the success of gasification applications, such as combined heat and power (CHP).
Technology Barriers Biomass is a very desirable fuel and feedstock because it is renewable, sustainable, and clean (generally does not contain many pollutant-forming species, such as sulfur, nitrogen, and heavy metals). Biomass is also widely available throughout the world and amenable to conversion to a wide variety of useful forms. However, biomass, more so than virtually any other fuel or energy source, varies considerably in its elemental composition, energy content, and physical characteristics. Biomass includes woody and herbaceous materials and residues, as well as the biogenic fraction of waste materials, such as municipal solid waste, cardboard, paper, and food wastes. It also contains species, such as alkali metals that, while not considered pollutants, often cause mechanical problems in conversion systems, such as deposition and corrosion of heat transfer surfaces and mechanical system internals. As such, it presents considerable technical challenges at virtually all phases of conversion to useful energy forms and products. These technical challenges were evaluated by the U.S. Department of Energy (DOE) as part of development of a biopower technical strategy,9 and are reproduced below.
Technical challenges and barriers to developing and deploying small-scale biotechnology systems are shown in Table 15. The top priorities were identified as fuel and feedstock quality, cost, and availability; finding users for cogenerated waste heat; and the lack of demonstrated, cost-effective, small-scale gasifiers.
• Waste heat utilization. The most critical barrier is the difficulty in finding users for cogenerated heat in close proximity to the source. Finding a use for waste heat is needed to justify the implementation of more efficient CHP systems. The infrastructure for utilizing (transporting) heat may also be lacking, and it may be difficult to integrate waste heat with existing systems.
• Fuel quality and handling. The high cost and uncertain availability of biomass feedstocks are challenging for small-scale, as well as large-scale users. There is still significant uncertainty about how to handle biomass feedstocks (preprocess, store, convey), and how to ensure that a consistent quality of supply is maintainable year-round.
• Small-scale gasification. Gasification systems for use at smaller scales are not yet commercially available. While this technology has significant potential, new scalable designs will be needed to integrate with the unique requirements of small-scale power. Emissions data for operating gasifiers is lacking, which creates concerns for environmental compliance and permitting. In addition, current synthesis gas cleanup technologies are insufficient, particularly with regard to
9 Biopower Technical Strategy Workshop Summary Report. Washington, D.C.: U.S. Department of Energy, Energy Efficiency & Renewable Energy, 2010. www1.eere.energy.gov/bioenergy/pdfs/biopower_workshop_report_december_2010.pdf.
This report is available at no cost from the National Renewable Energy Laboratory (NREL) at www.nrel.gov/publications.
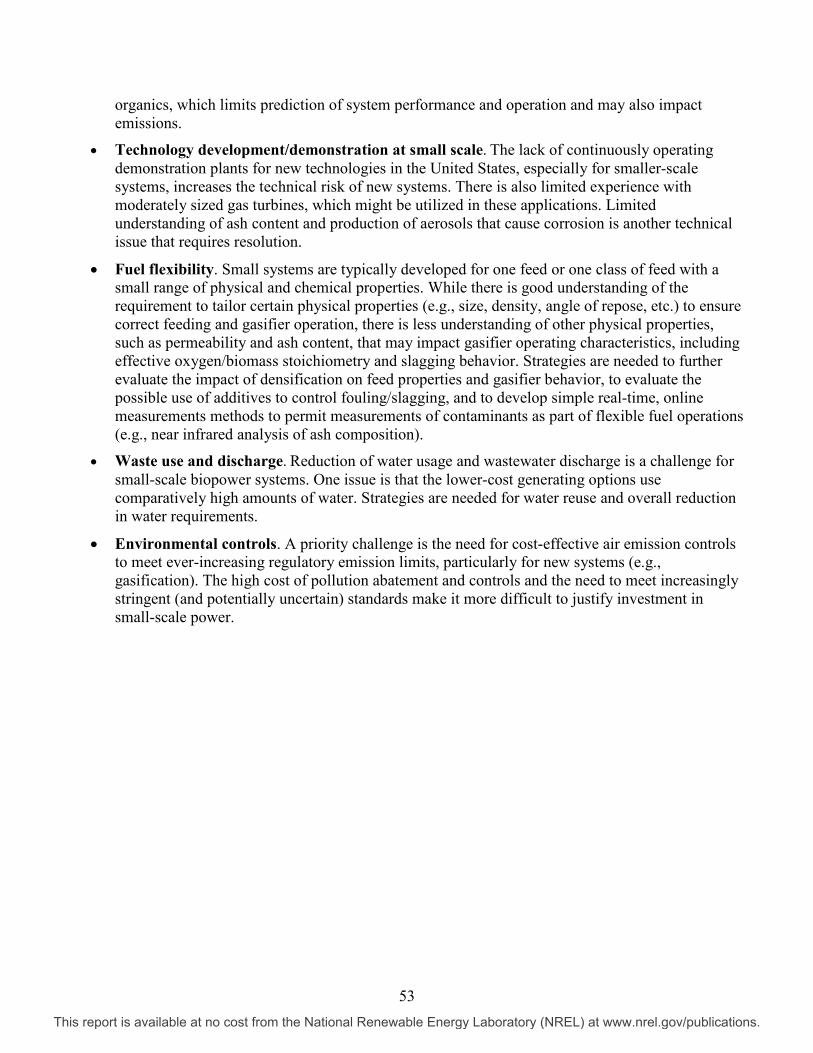
53
organics, which limits prediction of system performance and operation and may also impact emissions.
• Technology development/demonstration at small scale. The lack of continuously operating demonstration plants for new technologies in the United States, especially for smaller-scale systems, increases the technical risk of new systems. There is also limited experience with moderately sized gas turbines, which might be utilized in these applications. Limited understanding of ash content and production of aerosols that cause corrosion is another technical issue that requires resolution.
• Fuel flexibility. Small systems are typically developed for one feed or one class of feed with a small range of physical and chemical properties. While there is good understanding of the requirement to tailor certain physical properties (e.g., size, density, angle of repose, etc.) to ensure correct feeding and gasifier operation, there is less understanding of other physical properties, such as permeability and ash content, that may impact gasifier operating characteristics, including effective oxygen/biomass stoichiometry and slagging behavior. Strategies are needed to further evaluate the impact of densification on feed properties and gasifier behavior, to evaluate the possible use of additives to control fouling/slagging, and to develop simple real-time, online measurements methods to permit measurements of contaminants as part of flexible fuel operations (e.g., near infrared analysis of ash composition).
• Waste use and discharge. Reduction of water usage and wastewater discharge is a challenge for small-scale biopower systems. One issue is that the lower-cost generating options use comparatively high amounts of water. Strategies are needed for water reuse and overall reduction in water requirements.
• Environmental controls. A priority challenge is the need for cost-effective air emission controls to meet ever-increasing regulatory emission limits, particularly for new systems (e.g., gasification). The high cost of pollution abatement and controls and the need to meet increasingly stringent (and potentially uncertain) standards make it more difficult to justify investment in small-scale power.
This report is available at no cost from the National Renewable Energy Laboratory (NREL) at www.nrel.gov/publications.

54
Table 15. Technical Barriers and Challenges for Smaller-Scale Systemsa Waste Heat Utilization
High priority Lack of customer for waste heat generated by CHP in close proximity to the source
Medium priority Difficult integration of adsorption/absorption chillers with CHP
Lower priority Lack of infrastructure for using heat from CHP
Fuel Quality and Handling
High priority High cost and availability of biomass feedstock
Medium priority Feedstock handling (conditioning, preprocessing, collection, conveyance to boiler)
Lower priority Inconsistent quality of fuel supply Ability to identify/understand fuel type and treatment needed (wet/dry, chips/grinding) Lack of feedstock standardization
Small-Scale Gasification
High priority Lack of cost-effective small gasifiers
Medium priority Lack of good emissions data for gasification systems Inefficient gasification clean up, particularly for organics
Lower priority Concerns over impact of syngas quality on internal combustion engines, boilers, and pipelines Lack of reliable, cost-effective system for syngas clean up Tar and particulate control technologies do not scale down easily or cost-effectively
Technology Development/Demonstration at Small Scale
High priority Lack of continuously operating demonstration plants for new technologies in the U.S. Ash and aerosol issues, including slagging and fouling Lack of experience with moderate-sized gas turbines
Medium priority
Uncertainty of overall system availability and impact on profitability Need for new “clean” high-efficiency technologies for CHP applications (e.g., low nitrogen oxide and sulfur oxide, pre-vaporized liquid biofuel combustion) Lack of cost-effective downstream unit operations for anaerobic digestion Lack of cost-effective, scaled-down reactor designs Lack of technological flexibility to adjust to natural fuel quality
Lower priority Insufficient data/understanding of combusting, gasifying, and feeding lignin residuals from ethanol facilities and the difference from raw biomass (e.g., particle size increase contaminants)
Water Use and Discharge
This report is available at no cost from the National Renewable Energy Laboratory (NREL) at www.nrel.gov/publications.

55
Medium priority Reduction of water usage and wastewater discharge Excessive water use with low-cost generating options
Lower priority “Mining the Pressate” (e.g., nitrogen) Handling effluent remediation (e.g., to a wastewater treatment plant for reuse)
Environmental Controls
High priority Economic air emission controls to meet ever increasing regulatory emission limits
Lower priority Lack of emission controls to meet requirements in non-attainment areas a Unless otherwise noted, barriers and priority activities are generally associated with CHP applications.
Institutional Barriers The commercial development of renewable energy technologies can be impeded by barriers that do not involve technical aspects of a given technology. Technological progress that improves performance or increases system efficiencies can open doors to deployment; however, market issues ultimately depend on overcoming the institutional challenges these technologies will face. It can be far more difficult to put into place the necessary institutional mechanisms that will drive these commercial efforts. The keys to the successful implementation of energy technologies, and in particular, biopower technologies, are overcoming issues that can be categorized as the following:
• Regulatory
• Financial
• Infrastructural
• Perceptual. These categories were first developed in The Potential of Renewable Energy: An Interlaboratory White Paper, by INEEL et al, prepared for DOE in March 1990.
Additional non-technical barriers identified by DOE in 2010 include:
• Policy
• Risk management
• Scalability.
Regulatory Through the regulatory process, governments direct activities in the broader societal interest. Regulations usually pertain to two broad issues: (1) markets, and (2) health, safety, and environmental protection. Regulatory factors can create technology development opportunities that would not exist in unregulated environments. Within the United States, for example, the passage of the Public Utilities Regulatory Policy Act (PURPA) in 1978 required electric utilities to buy power from independent power producers and was designed to encourage small-scale electric power production from renewables, cogeneration, and energy
This report is available at no cost from the National Renewable Energy Laboratory (NREL) at www.nrel.gov/publications.
56
conservation. This law has been considered by some analysts to be “the single most important spur to creation of a commercial renewable power market ... .”10 During the 1980s, biomass power capacity rapidly expanded as a result of laws mandating that utilities purchase power from suppliers under contracts based on avoided power generation costs (as specified under PURPA). These contractual prices were substantially higher than current wholesale power prices, and permitted biomass projects to be financed and operated at a profit.
In the 1990s, changes in the electric power industry due to massive restructuring resulted in lower avoided costs, and as present contracts are concluded, this biomass generation could be at risk. The closing of high-cost power plants and the introduction of high-efficiency natural gas facilities are also putting considerable downward pressure on electricity prices.
Although this situation presents challenges, the restructuring of the power industry is also providing new opportunities for biopower. Markets are developing for “green power,” where electricity from selected generation sources can be sold at higher prices (typically 1-2 cents per kilowatt-hour). Through consumer choice, green markets offer opportunities to expand the use and future development of renewable technologies. Increased biopower is also being encouraged through renewable portfolio standards and other incentives established by state regulatory agencies.11 These standards require utilities to provide certain percentages of power, typically 5%-10%, from renewable sources. Despite this progress, state and market incentives for biopower only exist in certain states, and federal, state, and municipal policies and definitions with regard to green power and qualifying biopower technologies (e.g., some states and municipalities only include landfill gas) need to be harmonized to create a robust portfolio standard. This could lead to increased acceptance of biopower and the resulting grassroots demand for increased deployment.
In the United States today, there exists a very dynamic environment that involves the regulation of emissions. The regulations that control the release of oxides of sulfur (SOx) and nitrogen (NOx) are rapidly tightening under a variety of cap and trading schemes now being proposed for pollutants, particularly for NOx. These regulations may work as a potential boon to biopower because biopower technologies, such as cofiring, improve utilities’ emissions profiles in SOx and NOx. However, in some instances, the U.S. Environmental Protection Agency regulations and policies discourage existing coal plants from cofiring by opening them up to new source reviews if they modify their existing plants to accept biomass. There is a need to reduce regulatory uncertainty related to new source reviews and emissions. This is a critical issue because there are more than 200 companies outside the wood products and food industries that generate biopower in the United States. Where power producers have access to very low-cost biomass supplies, cofiring is an attractive option for power companies to save fuel costs and earn emissions credits.
In the future, the potential regulation of greenhouse gas emissions may result in a particular advantage for the carbon dioxide neutral biopower technology.
Financial Financial constraints pertain to the availability and cost of a project and to the overall financial attractiveness of renewable energy technologies. Capital markets generally perceive the deployment of emerging technologies as involving more risk than established technologies. The higher the risk, the 10 Silverman, M. and Worthman, S. “The Future of Renewable Energy Industries.” The Electricity Journal, March 1995. 11 For more information, see the Database of State Incentives for Renewables & Efficiency: www.dsireusa.org/.
This report is available at no cost from the National Renewable Energy Laboratory (NREL) at www.nrel.gov/publications.

57
higher the rate of return demanded on capital, thus impacting the rate of investment in these new, emerging technologies.
Tax incentives for renewable energy technologies have been passed by Congress to promote the deployment of renewable energy generation. Federal incentives include the Modified Accelerated Cost-Recovery System for certain property, the business energy investment tax credit, the renewable electricity production tax credit, and interconnection standards for small generators.
Infrastructural Infrastructure is a general term for the entire energy service production and delivery system. It involves decisions made by a broad range of players, including consumers; energy service providers such as utilities; fuel suppliers; and others. The nature of the biomass technology requires the need for infrastructure for the supply of feedstocks and for distributing products.
Unlike fossil fuels, such as coal and natural gas, which have a highly developed and sophisticated infrastructure in the United States via railroad transportation and pipelines, a similar infrastructure does not currently exist for biofuels.
At this time, the biomass supplies are dominated by low-cost residue streams. The residue stream consists of materials derived from self-generated residues by industries that process biomass for fiber or food uses (such as paper mills, lumber mills, sugar mills, etc.) or other economic activities (agriculture, urban construction and demolition, rate of waste generation, etc.). The quality, quantity, and cost of these resources continually vary in response to economic growth rates, discount factors, and regulation, (e.g., the regulation of landfill activity and policies toward recycling).
Another problem associated with the technology infrastructure concerns the 50-mile supply radius for the economic collection and transportation of fuel. In the future, the development of new technology that allows for the conversion of biomass into a liquid may allow for the feedstock to be transported more cost-effectively at greater distances. In the meantime, small modular systems are being looked at for distributed applications. The systems are less than 5 megawatts and can be transported directly to the feedstock production site.
Perceptual There is a lack of familiarity with biomass power technologies by the public, government, and industry decision-makers. Many people still do not know what the term “biomass” means, let alone understand some of the benefits and new technology developments associated with biomass. In addition, some environmental groups do not view biomass as a “green” technology. Awareness of biomass tends to be associated with liquid fuels, wood stoves, and concerns over emissions with the combustion of wood than with biomass as an alternative energy technology. Less is known by the public and others about the low emissions, high efficiency, and environmental benefits offered with state-of-the-art biomass power systems. There are also concerns related to harvesting of trees as well as the need for sustainable supply. These unfavorable perceptions translate into financial costs and risks to any biomass project. Only with considerable education efforts and demonstration that environmental concerns are being accounted for can the risks of nonacceptance be overcome.
WTE systems also suffer from a link in some people’s minds to the waste incinerators used in previous decades. While modern WTE systems include multiple advanced technologies to control emissions, the
This report is available at no cost from the National Renewable Energy Laboratory (NREL) at www.nrel.gov/publications.

58
connection to previous, environmentally questionable solid-waste incinerators is a barrier to many WTE projects in the United States and elsewhere.12
Additional Barriers Nontechnical barriers identified by DOE in the areas of policy, risk management, and economics as reported are given below.
Policy Policy issues are generally related to a lack of uniform legislation to support deployment of small-scale biomass power plants. A key issue is uncertainty over carbon legislation and production incentives (renewable energy credits). A key barrier is the shortage of consistent regulations for small-scale biomass systems. Large regulatory risks when combined with financial risk can stifle innovation, as well as investment.
Risk Management It is often challenging to make the business case for small-scale systems and clear financial hurdles, which creates high risk and makes investment in these systems less appealing. Business models, a long-term outlook, and market data for biopower systems, particularly on a small scale, are inadequate, which reduces attractiveness as an investment. Adequate price supports for “green” electricity, which could reduce risk, are lacking. A contributing factor is the lack of investors who understand and appreciate the benefits of CHP for small scale applications. Return on investment for an energy project is often viewed differently than other projects (e.g., higher risk factors) and may be harder to justify, especially if energy prices are low.
System Economics The limiting and high cost structure for small-scale systems was identified as one of the most important barriers. In most utility markets, small-scale CHP may have much lower cost-effectiveness than large utilities. Capital expenses and operating costs may also be higher per megawatt.
12 The Clean Air Act of 1970 and subsequent amendments in 1990 established a regulatory framework that has resulted in significantly lower air emissions from modern combustion-based WTE facilities than their predecessors.
This report is available at no cost from the National Renewable Energy Laboratory (NREL) at www.nrel.gov/publications.

59
Appendix E: Small-Scale Waste-to-Energy Case Study In assessing the state of the small-scale gasification industry, NREL became aware of another technology provider that had conducted recent demonstrations, MSW Power. MSW Power has developed a system called the Green Energy Machine (GEM) and shared analyses of GEM’s performance in recent demonstrations. GEM operates similarly to HEDWEC, but instead of using the syngas to fire an internal combustion engine, it feeds the syngas into a diesel engine to offset diesel fuel consumption.
Figure AE-1. Aerial view of GEM system
Source: MSW Power
Demonstration History The GEM case study included the following demonstrations:
• Edwards Air Force Base system in operation from June 20, 2012 to Sept. 22, 2012
• Second generation GEM operating in Plymouth, Massachusetts, Dec. 3, 2012 to June 22, 2013.
Table 16 is a summary of GEM performance expectations developed after the completion of recent field tests. Table 17 provides the actual GEM performance results observed during these field tests.
This report is available at no cost from the National Renewable Energy Laboratory (NREL) at www.nrel.gov/publications.

60
Table 16. Expected GEM Performance Parameter Expected Performance
Run time (annual) 7,488
Waste processed (tons/day) 3
Electricity generated (kWh gross) 90-100
Heat generated (MBtu/hr) with genset .614
Heat generated (MBtu/hr) with boiler 1.2
Ash disposed (%) 5.6 Source: MSW Power
Table 17. Summary of Operating History of GEM Systems Parameter Combined Performance Data
Run time (hours) 5,444
Waste processed (tons) 525
Electricity generated (kWh) 167 k
Heat generated (MBtu) 676.9 M
Ash disposed (%) 5.6 Source: MSW Power
Feedstock Used Table 18 provides an overview of the feedstock used during various stages of testing for GEM.
Table 18. Feedstock Testing Summarya
Incoming Composition Calorimetric Value (pellets at 10% moisture)
Waste Source Paper/Cardboard Plastic Food Other Moisture Content
Btu/lb Bulk Density (lbs/ft3)
R&D testing 42% 16% 44% 0% 22% 8,990 32
Coffee roaster 28% 21% 50% 1% 15% 11,190 33
State college 41% 29% 27% 3% 31% 8,133 27
State prison 23% 22% 46% 9% 52% 9,572 27
Car manufacturer 33% 28% 31% 4% 27% 8,854 29
Edwards AFB 29% 18% 30% 23% 47% 9,178 30 Source: MSW Power a The values presented are averages. Variations occur with every batch of waste. Lowest moisture content received was 5%, and the highest was 66%. Lowest higher heating value was 6,500 and the highest was 11,190 (as shown).
This report is available at no cost from the National Renewable Energy Laboratory (NREL) at www.nrel.gov/publications.

61
Return on Investment Examples Table 19 provides the economic opportunities projected by MSW Power. These projections have not been validated by NREL.
Table 19. Sample Return on Investment Calculations for the GEM with a Diesel Enginea
Investment = $1.1 M Scenario 1 Scenario 2
Unit Price Average Annual Savings
Unit Price Average Annual Savings
Electricity (kWh) $0.27 $141K $0.14 $80K
Heat (MBtu) $15 $74K $10 $54K
Waste disposal (tons) $125 $109K $80 $76K
Other net savings (Costs) ($54K) ($76K)
Total $269K $134K Source: MSW Power a This is based on a modified diesel genset scenario only. The “other net savings” include maintenance, consumables, and diesel fuel costs.
This report is available at no cost from the National Renewable Energy Laboratory (NREL) at www.nrel.gov/publications.

62
Appendix F: Potential Waste-to-Energy Technology Providers Table 20. Partial List of WTE Technology Providers
Company Contact Technology Notes
AlternNRG-Westinghouse Plasma Corp.
Mark A. Wright 770-696-7698 [email protected]
Plasma arc gasification
• Biomass facility operating in Pennsylvania • WTE facilities operating in Japan and India
Biomass Energy Systems, Inc. (BESI)
Tony Calenda 100 Overlook Center 2nd Floor Princeton, NJ 08540 321-795-3107 [email protected]
Rotary kiln gasification
• Operating a 100 TPD unit in South Korea, fueled by industrial waste (mainly fabric, wood, plastic, packaging materials)
International Environmental Solutions (IES)
Karen Bertram 714-372-2272 [email protected]
Horizontal auger-fed gasification
• Operating 30 TPD unit in Mecca, CA • Finalist for LA County WTE projects
Organic Energy Gasification
Jan d'Ailly 32 Academy Crescent Waterloo, Ontario, N2L 5H7 519-884-9170 [email protected]
Low-temperature gasification
• WTE facilities operating in Ontario, Canada, since 2001
• 25 TPD and 50 TPD modules • 94.9% conversion claim • Performance guarantee offered • $7-$9 million turnkey installation and
$700K-$900K O&M costs estimated
Plasma Power LLC
James Juranitch 730 W. McNabb Rd Ft. Lauderdale, FL 33309 262-443-9100 [email protected]
Plasma arc gasification
• 250 TPD WTE facility operating in Iowa • 20 TPD WTE facility in planning stages in
Florida • WTE facilities operating in Europe and
Asia • Capital cost of $19 million and O&M costs
of $237K estimated
This report is available at no cost from the National Renewable Energy Laboratory (NREL) at www.nrel.gov/publications.
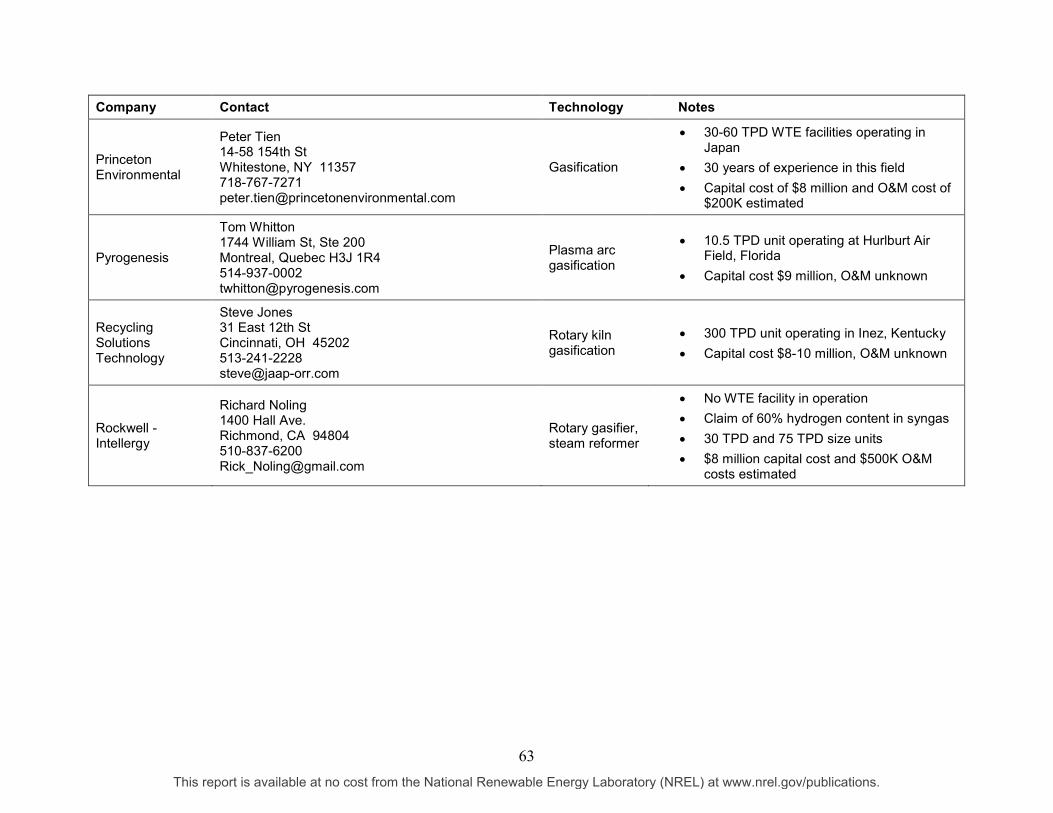
63
Company Contact Technology Notes
Princeton Environmental
Peter Tien 14-58 154th St Whitestone, NY 11357 718-767-7271 [email protected]
Gasification
• 30-60 TPD WTE facilities operating in Japan
• 30 years of experience in this field • Capital cost of $8 million and O&M cost of
$200K estimated
Pyrogenesis
Tom Whitton 1744 William St, Ste 200 Montreal, Quebec H3J 1R4 514-937-0002 [email protected]
Plasma arc gasification
• 10.5 TPD unit operating at Hurlburt Air Field, Florida
• Capital cost $9 million, O&M unknown
Recycling Solutions Technology
Steve Jones 31 East 12th St Cincinnati, OH 45202 513-241-2228 [email protected]
Rotary kiln gasification
• 300 TPD unit operating in Inez, Kentucky • Capital cost $8-10 million, O&M unknown
Rockwell - Intellergy
Richard Noling 1400 Hall Ave. Richmond, CA 94804 510-837-6200 [email protected]
Rotary gasifier, steam reformer
• No WTE facility in operation • Claim of 60% hydrogen content in syngas • 30 TPD and 75 TPD size units • $8 million capital cost and $500K O&M
costs estimated
This report is available at no cost from the National Renewable Energy Laboratory (NREL) at www.nrel.gov/publications.