water conservation quantitative research report summary
TRANSCRIPT

Printed on recycled-content paper
Water Conservation Quantitative Research Report Summary

Printed on recycled-content paper
Report Summary Contents
Executive Summary 1
Conclusions 2
Research Objectives 2
Research Methodology 2
Detailed Findings: 2
Opinions About Amount of Water Available Now and in the Future 3
Importance of Water Conservation and Funding 4
Awareness and Support of Efforts to Conserve Water 5
Meeting Water Needs: Who Is Responsible and Are They Doing Enough? 7
Identifying Users of Water and Source of Drinking Water 9
Consumer Conservation Behavior 10
Profile of Texans Most Likely to Be Persuaded 12
Biggest Environmental Problem in Texas 12
Top of Mind Responses About Water in Texas 13
Satisfaction with Water Quality 13
Appendix:
Preliminary Message Testing 14
Total Number of Interviews by Water Region 17

Printed on recycled-content paper
Executive Summary
The primary findings from this report are listed below.
Our research found that 98 percent of respondents believe water conservation is important. Water conservation as an issue has almost universal support among Texans.
Only 28 percent of Texans definitely know the natural source for their drinking water.
Nearly half (48 percent) of respondents believe there will probably not be enough water or that Texas will experience a considerable shortage of water within the next 25 years.
More than half of the respondents (54 percent) do not believe the Texas state government is doing enough about water conservation. Thirty-one percent believe it is doing enough and 15 percent aren’t sure.
Seventy-one percent believe statewide funding should be used to implement water conservation strategies.
Nine out of 10 respondents indicate they presently conserve water, and 72 percent believe they could do more.
Eighty-seven percent feel it would be beneficial to Texas residents to increase their awareness of water conservation through a campaign similar to “Don’t Mess with Texas.”
Page 1 of 17

Printed on recycled-content paper
Conclusions
Timing is right to elevate the water conservation dialog on a statewide basis. Water conservation behavior is bi-partisan and shows little variance by region, ideology or gender. Income is more of a predictor, with those earning more than $50,000 per year being most likely to conserve.
The study shows a clear potential for increasing water conservation among a willing public. This potential can be maximized through selected key messages and a statewide campaign. Very strong support exists for funding water conservation awareness in all regions of Texas across all demographic and ideological lines.
Research Objectives
The primary objectives of this research were to measure attitudes and perceptions among the general public about water conservation, to benchmark water conservation behavior and to evaluate the potential effectiveness of selected messages.
Research Methodology
EnviroMedia commissioned Baselice and Associates to conduct a representative statewide telephone poll drawn from a random sample of 1,228 consumers from August 1 through 7, 2004. The confidence interval of these results is plus or minus 3 percent. (For the breakdown of interviews by water region, see map on page 17.)The survey instrument is included at the end of this section.
Detailed Findings
The following section of the report summarizes responses to questions asked in the survey.
Complete cross tabulations are found on the CD-ROM (disk) at end of this report.
Page 2 of 17

Printed on recycled-content paper
Opinions About Amount of Water Available Now and in the Future
Seventy-eight percent of respondents believe their area has enough water now while 22 percent believe their area does not or they are unsure. However, opinions are almost evenly mixed when asked whether there will be enough water in their area in the future. Forty-five percent believe water supply will be enough and 48 percent do not. Twenty-two percent believe there will be a considerable shortage of water.
Page 3 of 17

Printed on recycled-content paper
Importance of Water Conservation and Funding
Ninety-eight percent of Texans in this survey feel that water conservation is important, with 86 percent feeling strongly about it.
Further, 71 percent believe statewide funding should be provided to implement water conservation strategies.
Page 4 of 17

Printed on recycled-content paper
Awareness and Support of Efforts to Conserve Water
Despite their strong feelings about the importance of water conservation, very few respondents are aware of ongoing efforts in Texas.
Only 17 percent have read or heard anything about any State of Texas plans for water. Nearly half (46 percent) are aware of local efforts to conserve water.
Page 5 of 17

Printed on recycled-content paper
Twenty percent of respondents are aware of any local water conservation groups, and only 18 percent of those could actually name any specific group.
Similarly, only 20 percent were aware of any slogans or ads about water conservation and 14 percent of these could name one specifically.
Page 6 of 17

Printed on recycled-content paper
Ninety-one percent of respondents are aware of the litter prevention commercials known as “Don’t Mess with Texas.” Eighty-seven percent believe a similar campaign for water conservation would be beneficial, and 66 percent of those feel strongly about it.
Meeting Water Needs: Who Is Responsible and Are They Doing Enough?
State government, consumers and local government are the top three groups that respondents look to for ensuring Texas has enough water.
Page 7 of 17

Printed on recycled-content paper
Forty-six percent feel the state government is not doing enough to conserve water. Sixty-two percent of respondents believe it is not doing enough to educate the public on ways to conserve water. Clearly a desire is prevalent to see the state take action in terms of education and in conservation itself.
A greater percentage of respondents feel their local water supplier is doing enough.
Page 8 of 17

Printed on recycled-content paper
Identifying Users of Water and Source of Drinking Water
When asked who uses the most water, 30 percent of respondents named consumers, followed by large businesses and private resorts and golf courses at about 20 percent each.
Nearly half (42 percent) of respondents cannot identify the source of their own drinking water.
Page 9 of 17

Printed on recycled-content paper
Consumer Conservation Behavior
An overwhelming number of respondents (90 percent) report that they conserve water now, and 72 percent believe they could do more to conserve water.
Nearly a third conserve every chance they get, 61 percent conserve some or most of the time and only 7 percent say rarely or never.
Page 10 of 17

Printed on recycled-content paper
The most frequently reported conservation actions are changing water habits (i.e., hand watering outdoors, watering less frequently), reducing personal water use (i.e., reducing length of shower, turning off faucet when brushing teeth) and waiting to run appliances until they are full.
Page 11 of 17

Printed on recycled-content paper
Profile of Texans Most Likely to Be Persuaded
Part of the research task was focused on identifying segments of the Texas population that are most likely to be persuaded to increase their water conservation behaviors. Our findings indicate that people with medium to higher annual household incomes of over $50,000, with a lawn, living outside of East Texas can be considered “most likely” to take more water conserving actions. East Texas receives more rain than the rest of the state and thus is not as inherently concerned about water as other Texas regions.
The research does not indicate significant differences in opinions in other regions, in political ideology or gender. Water conservation is truly an issue embraced almost universally by Texas citizens.
Biggest Environmental Problem in Texas
Respondents in this survey named air quality as Texas’ biggest environmental problem (43 percent). Water pollution (11 percent) and water conservation (7 percent) rank a distant second and third. While air pollution is the predominant environmental concern in the state, a clear majority of Texans of all types want the state to do more to ensure the availability of clean water for their future.
Page 12 of 17
Printed on recycled-content paper
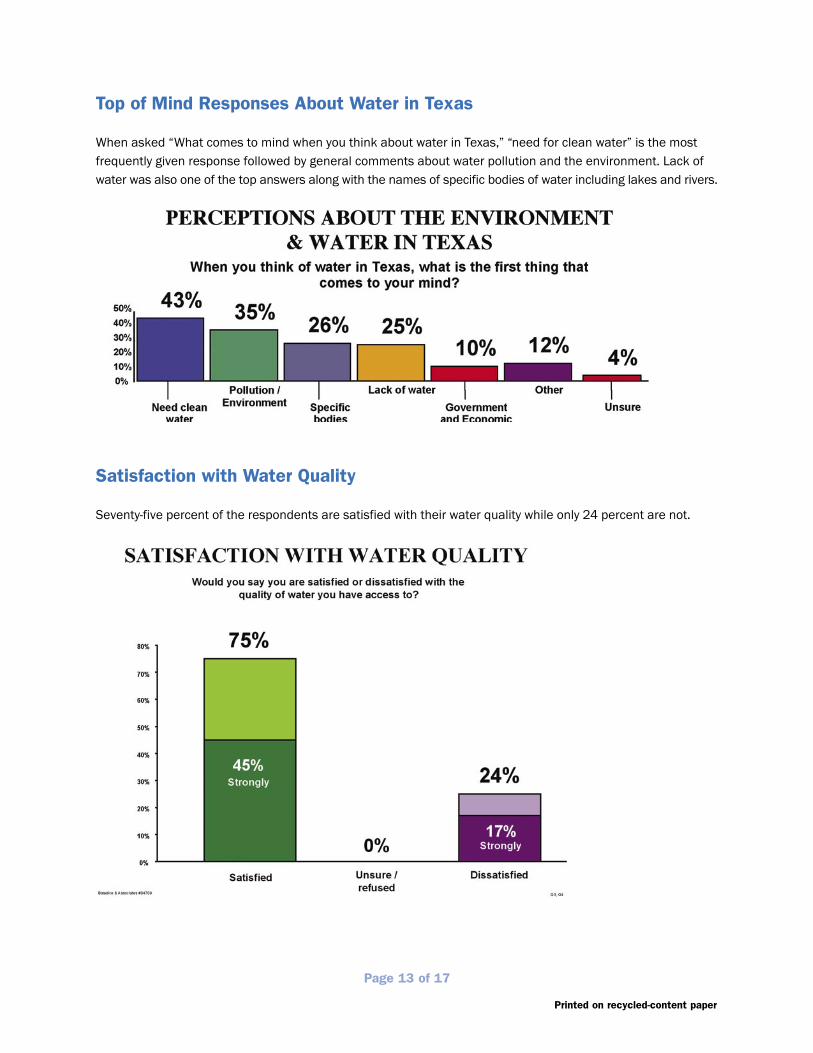
Top of Mind Responses About Water in Texas
When asked “What comes to mind when you think about water in Texas,” “need for clean water” is the most frequently given response followed by general comments about water pollution and the environment. Lack of water was also one of the top answers along with the names of specific bodies of water including lakes and rivers.
Satisfaction with Water Quality
Seventy-five percent of the respondents are satisfied with their water quality while only 24 percent are not.
Page 13 of 17

Printed on recycled-content paper
APPENDIX:
Preliminary Message Testing
Any exposure is helpful for water conservation. After learning more about water conservation and hearing some ideas, eight out of nine (87 percent) respondents are more likely to conserve water.
Overall, the most persuasive messages were that “water conservation is good for the environment” and “being made aware of ways that neighbors can encourage one another to conserve water.” This “neighbors” message was most persuasive for women respondents. Male respondents were most persuaded by being made aware of the threat of not having enough water. Receiving savings on their water bill was also an effective message.
The following table shows the messages tested in this survey and their relative effectiveness with the overall sample as well as with a number of key subgroups.
Page 14 of 17

Printed on recycled-content paper
Figure 1: Message Testing
Page 15 of 17

Printed on recycled-content paper
Figure 1: Message Testing, continued
Page 16 of 17

Printed on recycled-content paper
Page 17 of 17
Figure 2: Actual Number of Interviews Conducted