water flows in the murray-darling basin: observed versus ...achieved and changes to river flows...
TRANSCRIPT

Water Flows in the Murray-Darling Basin: Observed versus expected
Technical Report
February 2019
WENTWORTH GROUP OF CONCERNED SCIENTISTS
ISBN: 978-0-9944577-5-2
WENTWORTH GROUP OF CONCERNED SCIENTISTS Mr Peter Cosier, Convenor, Wentworth Group of Concerned Scientists.
Prof Tim Flannery FAA, Palaeontologist and Writer · Chief Councillor, Australian Climate Council · 2007 Australian of the Year.
Dr Terry Hillman AM, Ecologist · Former Member, Murray-Darling Basin Sustainable Rivers Audit.
Prof Lesley Hughes, Ecologist · Macquarie University · Councillor, Australian Climate Council · Lead Author, Intergovernmental Panel on Climate Change, Working Group II.
Prof David Karoly, Former Professor of Atmospheric Science, University of Melbourne · Former Member, Climate Change Authority.
Prof David Lindenmayer AO, Landscape Ecologist · Fenner School of Environment and Society, Australian National University.
Mr David Papps, Zoologist · Former Commonwealth Environmental Water Holder · Former Vice-President, Ramsar Convention Standing Committee.
Prof Jamie Pittock, Environmental Scientist · Fenner School of Environment and Society, Australian National University.
Prof Hugh Possingham FNAS FAA, Professor of Ecology at The University of Queensland, Australia.
Mr Rob Purves AM, Businessman · Director, Purves Environmental Fund · President, WWF Australia.
Dr Denis Saunders AM, Ecologist · Chair, Sara Halvedene Foundation · Editor, Pacific Conservation Biology · Former Chief Research Scientist, CSIRO.
Ms Anna Skarbek, Investment Banker and Lawyer · CEO ClimateWorks Australia · Director Clean Energy Finance Corporation · Former Director, Carbon Market Institute.
Prof Bruce Thom AM, FIAG, FTSE, Geographer · Chair, 2001 Australian State of the Environment Report.
Mr Martijn Wilder AM, Partner, Baker McKenzie · Chairman, Low Carbon Australia · Director, Clean Energy Finance Corporation · Director, WWF Australia · Director, the Climate Council.
IN ASSOCIATION WITH
Dr Paul Carlile, Hydrologist · Environmental Consultant.
Dr Eytan Rocheta, Environmental Engineer · Policy Analyst, Wentworth Group of Concerned Scientists.
Dr Celine Steinfeld, Geographer · Policy Analyst, Wentworth Group of Concerned Scientists.
Karen Grogan, Director, Wentworth Group of Concerned Scientists.
Nadeem Samnakay, Policy Analyst, Wentworth Group of Concerned Scientists.
ACKNOWLEDGEMENTS The Wentworth Group acknowledges State and Commonwealth government agencies who collected and made available data used in this report. We thank the Purves Environmental Fund, the Australian Environmental Grantmakers Network, and The Ian Potter Foundation for their ongoing financial support.
www.wentworthgroup.org

Table of Contents
Executive Summary 2
Introduction 6
Overarching Method 8
Test locations 9
Lower Murray Riverland-Chowilla Hydrological Indicator Site 11
Barwon-Darling Hydrological Indicator Site at Wilcannia 18
Conclusion 26
Recommendations 28
References 29
Appendix A – Historical gauged inflows and storage levels used for analysis of flows
achieved at the South Australian border and the Riverland Chowilla hydrological indicator
sites. 30
Appendix B – Historical gauged inflows used for analysis of flows achieved at the Wilcannia
hydrological indicator site 31
Appendix C – Constraints Management 32
Appendix D – Basin Watering Strategy expected outcomes potentially no longer possible
within current operational flow constraints 35
Appendix E – Analysis using four wetness classes instead of three 36
2
Executive Summary
This report outlines the Murray-Darling Basin Authority (MDBA) environmental flow indicators that have been
achieved and changes to river flows observed at two key locations among the 124 Basin Plan Hydrologic Indicator
Sites since 2010. The year 2010 is seen as a reasonable starting point given at least 1,000 gigalitres (GL) of water
recovery for the Basin Plan had been achieved and you would expect to see at least some improvement in river
flows or achievement of environmental indicators. Results are generated by obtaining actual river flows from 2010
to 2018 at two key hydrological indicator sites and determining achievement of MDBA environmental flow
indicators. It is noted that the nine years of flow data used in this assessment are not fully representative of the
entire variability in the observed record of Basin flows.
This nine year observed timeframe is then compared to environmental flow indicators and river flows achieved:
Prior to the Basin Plan using MDBA modelled Baseline conditions; and
Post the Basin Plan using MDBA modelled Basin Plan conditions following Sustainable Diversion Limits
(SDL) adjustment.
Ideally this comparison would be far simpler, more robust and significantly enhance MDBA effectiveness reporting
if the MDBA’s Baseline model (including all State valley baseline models) were updated annually and compared to
actual flows achieved in the river each year to determine what changes can be attributable to the Basin Plan as
opposed to the weather. This comparison would also inform what impact the movement of irrigation entitlements
to the environment (i.e. Commonwealth Environmental Water Holder) was having on dam spill behaviour.
Currently reporting on the effectiveness of the Basin Plan water reform is the responsibility of the MDBA while the
Commonwealth Environmental Water Holder (CEWH) is obligated to report on the effective use of a government
asset, namely the water purchased for use under the Basin Plan. Despite these responsibilities and the hydrological
valley modelling capabilities developed over decades, no one is checking what impact CEWH use of the
environmental water portfolio is having on dam storage spill behaviour in regulated valleys (predominately in the
Southern Basin) where approximately 85% of the water recovery under the Basin Plan has taken place.
Previously this environmental water was held by irrigators who received the same allocations against their water
entitlements but rarely used all the water allocated to them and only used their water in spring/summer. This
resulted in some of the allocated water remaining in storage where it may enhance some future flood when dams
later fill and spill. Now a significant portion of this previous irrigation water is owned by the CEWH who is under
significant pressure to show it can use water allocated to it but without the necessary tools to deliver it effectively
when the environment expects it (i.e. winter/spring). CEWH is being prevented from delivering environmental
water when it is needed ecologically because of ‘constraints’, including the risk of managed flows flooding non-
government land and because the river channels are largely full of water being delivered to irrigators at key times.
These required delivery tools include:
A real Constraints Management Strategy that provides the ability to deliver higher flows than prior to the
Basin Plan (Current state water plan proposals do not do this despite the MDBA Constraints Management
Strategy); and
An ability to deliver environmental water from storage on top of unregulated flows (‘natural’ small floods,
as required as part of SDL adjustment in chapter 7.15 of the Basin Plan 2012).
These tools are requirements of the Basin Plan and are essential for it to be successful. The Basin Plan ability to
influence environmental outcomes is largely driven by environmental water recovery and policies that enable
effective use of environmental water such as the relaxation of operational flow delivery constraints. Hence the
agreement of Basin governments to the Basin Plan, included a Constraints Management Strategy to enable the
effective delivery of environmental water to wetlands and low-mid level floodplains. To date no operational river
flow constraints have been relaxed under the Basin Plan.
Without these tools it is likely the CEWH is being forced to deliver water from storage all year round at flow rates
that always remain in the river channel (so do not inundate floodplain wetlands), with the result being that more
of the allocated water is being used and is no longer remaining in storage. This could be mitigating some future

3
small flood that would otherwise have occurred. The behaviour of the CEWH in using its water portfolio should be
modelled by the MDBA over the past 100 years of climate and compared to pre-Basin Plan (Baseline) models to
see if these smaller, environmentally beneficial flood events are in danger of being reduced. If this is a result of the
Basin Plan then no managed environmental watering events will compensate the environment for lost floods and
the health of the Basin will further deteriorate. Obviously large flood events will still occur regardless of CEWH
behaviour.
The MDBA employed valley hydrological models to determine Sustainable Diversion Limits, SDL adjustments and
expected changes to the hydrology of the river as a result of water recovery compared to a Baseline model (pre-
Basin Plan model). These same models should be used to determine what improvements have been the result of
the Basin Plan as opposed to changes simply the result of the climate experienced. This would be easy to achieve
if the MDBA gained support from Basin States to update each year the Baseline (pre-Basin Plan) models which
currently run from 1895 to 2009 with the rainfall, evaporation and storage levels that actually occurred. It would
then be possible to obtain a reasonable estimate of the flow that would have eventuated in each river system
without the Basin Plan (the counter factual). This can then be compared to the river gauge of actual flow to
determine any significant improvements as a result of the Basin Plan.
In the absence of this counter factual modelling by the MDBA, environmental outcomes are limited to site based
observations where the assumption is that water was applied therefore any positive ecological response is the
result of the Basin Plan. This does not allow Basin wide analysis of any ecological improvements or any comparison
with what would have occurred without the Basin Plan.
While it is understood the CEWH does do some counter factual modelling on the Murray River it is uncertain what
changes to the Baseline model have been made and whether any such changes are appropriate. For instance, have
The Living Murray (TLM) works (approved prior to the Basin Plan) and TLM water recovery (water purchased or
recovered prior to the Basin Plan) been included in the Baseline model?
Despite the absence of transparent counter factual modelling throughout the Basin, this study compares actual
river flows and achievement of MDBA environmental flow indicators from 2010-2018 with that achieved based on
MDBA modelling of the Basin Plan prior to 2010. This is done by obtaining average modelled values during years
with similar catchment wetness or water availability to that observed annually from 2010-2018. This analysis has
been completed at two key locations used by the MDBA among the 124 hydrological indicator sites which are
indicative of the health of wider river reaches. The same analysis could be extended to include all hydrological
indicator sites in the Basin. The two sites chosen for this initial study were:
1. The Riverland-Chowilla site based on flow to South Australia and indicative of the health of the South
Australian Murray River, wetlands and flood dependent vegetation.
2. Wilcannia which is indicative of the environmental flow requirements from Wilcannia on the Darling to
Weir 32 at Menindee Lakes. This includes the Talyawalka Anabranch and associated wetlands. Wilcannia
is an important hydrological indicator site for characterising the health of the Barwon-Darling system
upstream of Menindee Lakes.
A healthy river system depends on a variety of low flows at high frequency and high flows of lower frequency. High
flows are needed, say, once every ten years to inundate the highest-level floodplains to keep black box eucalypt
floodplain forests in good condition. Lower flows might be needed every 2-5 years to wet the lower elevation
floodplain to keep red gum forests and fish populations in billabongs healthy. Scientists estimated the different
flows needed at different points along the rivers that were adopted in the Basin Plan as flow indicators. These
indicators are expressed as mega/million litres of water per day (ML/d) and the yearly frequency that these flows
are needed.

4
Key findings from the analysis undertaken at these two sites were:
The Riverland-Chowilla hydrological indicator site based on flow to South Australia
1. None of the MDBA environmental flow indicators at the Riverland-Chowilla hydrological indicator site
have been met in the observed record since 2010 to the frequencies required to sustain the health of
water dependent ecosystems contained in the Lower Murray River (Table 3). For high flow indicators the
results are significantly worse than were experienced on average prior to the Basin Plan. This is despite
the period from 2010-2018 classed as being medium to wet years. This is likely to have had an adverse
impact on river, wetland and floodplain ecology which depend on at least one moderate flood every ten
years. While much of the Riverland-Chowilla hydrological indicator site can be watered with
environmental works, most of the remaining floodplain in South Australia cannot.
2. The Basin Plan expected that at least 40% (or approximately 45,000 ha) of wetlands and flood-dependent
vegetation in South Australia would be maintained without a Constraints Management Strategy and 75%
(or approximately 82,000 ha) with a Constraints Management Strategy (Refer Appendix C). As no flow
indicators in Table 3 are being achieved this means that the only portion of this floodplain that will be
maintained will be the Chowilla environmental works area of approximately 9,000 ha. However even this
cannot be attributable to the Basin Plan as these works were built and paid for prior to the Basin Plan
through The Living Murray initiative. Also the Chowilla environmental works area only represents:
a. Approximately 10% of the floodplain expected to be actively managed and inundated by the Basin
Plan with a Constraints Management Strategy; or
b. Approximately 20% of the area of floodplain expected to be actively managed and inundated by the
Basin Plan without a Constraints Management Strategy.
3. Based on observed Flow to South Australia since 2010 actual achievement of the Riverland-Chowilla
environmental flow indicator of 40,000 ML/d for 30 days between June and December is only met when
catchment wetness is above 2 to 2.5 (i.e. a medium to wet year) (Table 4).
4. Based on MDBA Basin Plan modelling, the MDBA expected slightly more occurrences of events of 40,000
ML/d lasting 7 days, during periods of medium or even low catchment water availability (Figure 6).
5. Given water availability has been relatively high since 2010 (i.e. 4 out of 8 years have a wetness score
above 2), the inability to achieve environmental flow indicators or improve on pre-Basin Plan outcomes
in the observations over the past 8-10 years is concerning (Table 4, Figure 6).
6. The results shown in Table 5, Figure 7 and Figure 8 show that observed annual average, flow to South
Australia from 2010-2018 are lower than even pre-Basin Plan (Baseline) modelled flows for dry wetness
classes and below what the Basin Plan expected for all wetness classes.
7. It can be seen in Figure 9 and Figure 10 that observed flows to South Australia are up to 60% less than
expected under the Basin Plan and that flows expected under the Basin Plan are only achieved in 3 out of
8 years.
Wilcannia hydrological indicator site
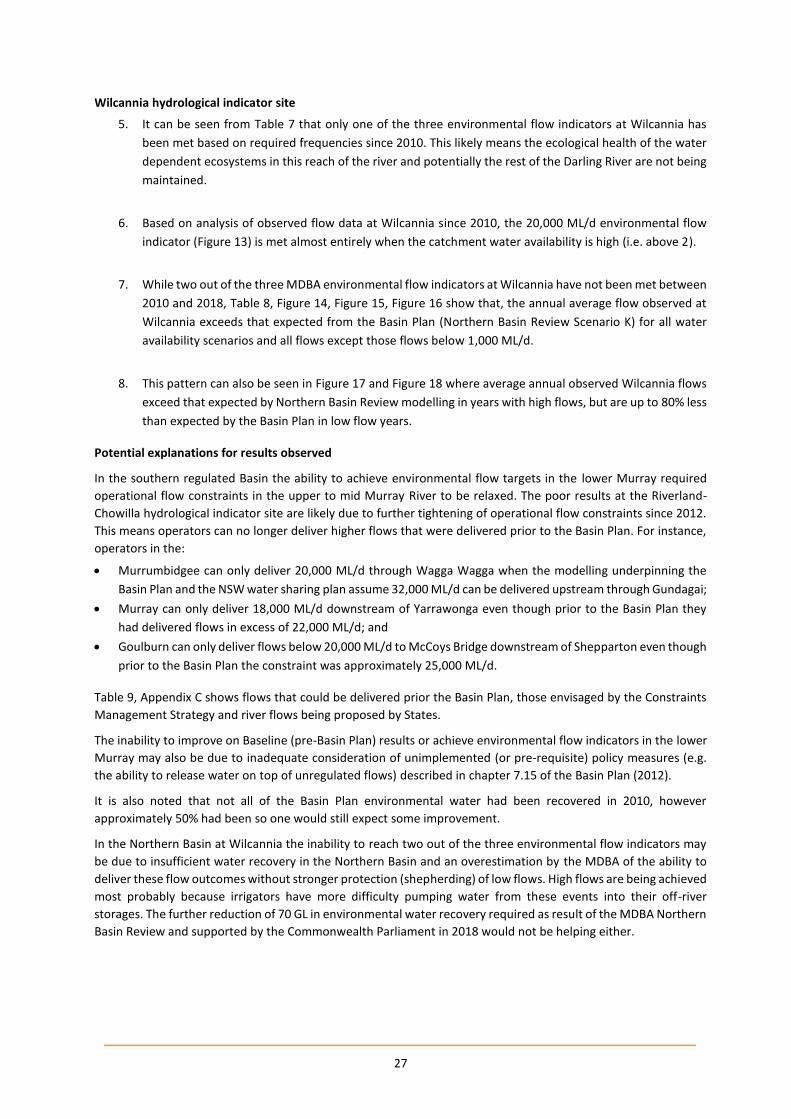
1. It can be seen from Table 7 that only one of the three environmental flow indicators at Wilcannia has
been met based on required frequencies since 2010. This likely means the ecological health of the water
dependent ecosystems in this reach of the river and potentially the rest of the Darling River are not being
maintained.

5
2. Based on analysis of observed flow data at Wilcannia since 2010, the 20,000 ML/d environmental flow
indicator (Figure 13) is met almost entirely when the catchment water availability is high (i.e. above 2).
3. While two out of the three MDBA environmental flow indicators at Wilcannia have not been met between
2010 and 2018, Table 8, Figure 14, Figure 15, Figure 16 show that, the annual average flow observed at
Wilcannia exceeds that expected from the Basin Plan (NBR Scenario K) for all water availability scenarios
and all flows except those flows below 1,000 ML/d.
4. This pattern can also be seen in Figure 17 and Figure 18 where average annual observed Wilcannia flows
exceed that expected by Northern Basin Review modelling in years with high flows, but are up to 80% less
than expected by the Basin Plan in low flow years.
Potential explanations for results observed
In the southern regulated Basin the ability to achieve environmental flow targets in the lower Murray required
operational flow constraints in the upper to mid Murray River to be relaxed. The poor results at the Riverland-
Chowilla hydrological indicator site are likely due to tightening operational flow constraints since 2012. This means
operators can no longer deliver higher flows that were delivered prior to the Basin Plan. For instance, operators in
the:
Murrumbidgee can only deliver 20,000 ML/d through Wagga Wagga when the modelling underpinning
the Basin Plan and the NSW water sharing plan assume 32,000 ML/d can be delivered upstream through
Gundagai;
Murray can only deliver 18,000 ML/d downstream of Yarrawonga even though prior to the Basin Plan they
had delivered flows in excess of 22,000 ML/d; and
Goulburn can only deliver flows below 20,000 ML/d to McCoys Bridge downstream of Shepparton even
though prior to the Basin Plan the constraint was approximately 25,000 ML/d.
The inability to improve on Baseline (pre-Basin Plan) results or achieve environmental flow indicators in the lower
Murray may also be due to poor implementation of unimplemented policy measures (e.g. the ability to release
water on top of unregulated flows). These policy measures are also referred to as pre-requisite policy measures
and are described in Chapter 7.15 of the Basin Plan (2012). Other reasons for the poor environmental flow results
may include any or all of the following:
Models overestimate flows;
Changes in irrigation and environmental water demand since models were calibrated; or
Lack of protection of e-water.
It could also be said that not all of the Basin Plan environmental water had been recovered in 2010, however
approximately 50% had been so you would still expect some improvement. We note that full implementation of
the Basin Plan has not been completed.
In the Northern Basin at Wilcannia at least the inability to hit two out of the three environmental flow indicators
may be due to insufficient water recovery in the Northern Basin and an overestimation by the MDBA of the ability
to deliver these flow outcomes without stronger protection of low flows. High flows are being achieved most
probably because irrigators have more difficulty pumping water from these events into their off-river storages.
The further reduction of 70 GL in environmental water recovery required as result of the MDBA Northern Basin
Review and supported by the Commonwealth Parliament in 2018 would not be helping either.

6
Introduction
The Basin Plan represents an attempt by State and Federal governments to restore the environmental health of
the Murray-Darling Basin following decades of over-allocation of water to consumptive users.
Under the Basin Plan, targets for reduction in consumptive water use are from 13,623 gigalitres (GL) to a
Sustainable Diversion Limit (SDL) of 10,873 GL per year, measured as a long-term annual average. This represents
a 2,750 GL increase in the long-term annual average volume of environmental water by 2019. In addition, Basin
governments agreed to recover an additional 450 GL of environmental water through efficiency measures (e.g. on-
farm efficiency) as long as such measures resulted in neutral or better socio-economic outcomes. This brings the
total water recovery target recommended by the Murray-Darling Basin Authority (MDBA) and agreed under the
Basin Plan to 3,200 GL. As of 30 November 2018 approximately 2,117 GL of the 2,750 GL had been recovered and
none of the 450 GL efficiency water (DAWR, 2018).
It can be seen in Figure 1 and Table 1 below that the majority of water recovery under the Basin Plan occurred
prior to 2012. Using the information in Figure 1 and Table 2 it can be estimated that nearly half of the
environmental water had been recovered prior to 2010 (Figure 2). It is therefore reasonable to expect that some
significant improvements in ecological outcomes and hydrological connectivity should have resulted since 2010.
Figure 1 : Annual expenditure on environmental water recovery under the Basin Plan since 2007 (DAWR, 2017).
Table 1 : Progress of environmental water recovery in the Murray-Darling Basin.

7
Figure 2 : Water recovery under the Basin Plan between 2007 and 2018.
The Basin Plan not only sets out the amount of environmental water recovery through a reduction in consumptive
extraction, thus setting a sustainable diversion limit but also a process to be followed by the MDBA to determine
the effectiveness of the Basin Plan (chapter 13, Basin Plan, 2012). While the Commonwealth Environmental Water
Holder (CEWH) is focussed on reporting where delivery of its held environmental water occurred taking into
account the Basin Watering Strategy and Long-Term Watering Plans, it is the MDBA which is required to undertake
10 yearly reviews of the Basin Plan and periodic, 5 yearly Basin Plan effectiveness reporting.
Chapter 13 of the Basin Plan sets the requirements for reporting the effectiveness of the Basin Plan. Some of the
key evaluation questions required by chapter 13 of the Basin Plan include:
Box 1: Reporting the effectiveness of the Basin Plan (Basin Plan, 2012) (a) to what extent has the intended purpose of the Basin Plan set out in section 20 of the Act been achieved?
(b) to what extent have the objectives, targets and outcomes set out in the Basin Plan been achieved?
(c) how has the Basin Plan contributed to changes to the environmental, social and economic conditions in the Murray-Darling Basin?
(d) what, if any, unanticipated outcomes have resulted from the implementation of the Basin Plan?
(e) how could the effectiveness of the Basin Plan be improved?
(f) to what extent were the actions required by the Basin Plan suited to meeting the objectives of the Basin Plan?
(g) to what extent has the program for monitoring and evaluating the effectiveness of the Basin Plan contributed
to adaptive management and improving the available scientific knowledge of the Murray-Darling Basin?
Chapter 8 of the Basin Plan (2012) sets out how environmental watering requirements of environmental assets
and ecosystem functions will be determined. For instance, s8.51 (2) states environmental watering requirements
must be expressed, where relevant, in the following terms:
(a) a flow threshold or total flow volume;
(b) the required duration for that flow threshold, or the duration over which the volume should be
delivered (as the case requires);
(c) the required timing of the flow event;
(d) the required frequency of the flow event;
(e) the maximum period between flow events;
(f) the extent and thresholds for any groundwater dependency;
0
500
1,000
1,500
2,000
2,500
2005 2010 2015 2020
Wat
er R
eco
very
(G
L)
Year

8
(g) the required inundation depth at the site.
This is exactly the formulation used by the MDBA to determine an Environmentally Sustainable Level of Take
through the use of environmental flow indicators at 124 hydrological indicator sites designed to describe
environmental water needs throughout the Basin. This approach was also used to inform the setting of Sustainable
Diversion Limits in each valley and the setting of in-valley and downstream environmental water requirements
(MDBA, 2011, 2012, 2017b). It would seem logical that these same environmental flow indicators would be used
to determine if the Basin Plan has resulted in improvements compared to what would have occurred without the
Basin Plan (i.e. the counter factual). However, the MDBA’s 2017 effectiveness reporting does not do this even
though Schedule 7 of the Basin Plan requires the MDBA to measure and report on where improvements have been
achieved. This reporting is required to include improvements in the following (Basin Plan, 2012):
Hydrologic connectivity between the river and floodplain and between hydrologically connected valleys;
river, floodplain and wetland types including the condition of priority environmental assets and priority
ecosystem functions;
Condition of the Coorong and Lower Lakes ecosystems and Murray Mouth opening regime;
Condition, diversity, extent and contiguousness of native water-dependent vegetation;
Recruitment and populations of native water-dependent species, including vegetation, birds, fish and
macroinvertebrates;
The community structure of water-dependent ecosystems.
The MDBA employed valley hydrological models to determine Sustainable Diversion Limits, SDL adjustments and
expected changes to the hydrology of the river as a result of water recovery compared to a Baseline model (pre-
Basin Plan model). These same models should be used to determine what improvements have been the result of
the Basin Plan, as opposed to changes as a result of the climate experienced since the last review. This would be
easy to achieve if the MDBA gained support from Basin States to update the Baseline (pre-Basin Plan) models
which currently run from 1895 to 2009. If this model was updated annually with the rainfall, evaporation and
storage levels that actually occurred, then a reasonable estimate of the flow that would have eventuated in each
river system without the Basin Plan (the counter factual) would be possible. This can then be compared to the
river gauge of actual flow to determine any significant improvements as a result of the Basin Plan.
In the absence of this counter factual modelling by the MDBA environmental outcomes are limited to site based
observations where the assumption is that water was applied therefore any positive ecological response is the
result of the Basin Plan. This does not allow Basin wide analysis of any ecological improvements or any comparison
with what would have occurred without the Basin Plan.
The analysis undertaken here looks at the observed flow that arrived at key locations and translates them into the
achievement or not of MDBA ecological flow indicators targets. This and other changes in river flows are compared
to similar climate periods between 1895 and 2009 already modelled by the MDBA to determine if the outcomes
expected by the Basin Plan are being achieved. The two key locations examined represent key ecological targets
indicative of the health of longer river reaches in the Murray and Barwon-Darling river systems consistent with the
MDBA’s own Environmentally Sustainable Level of Take methodology (MDBA, 2011).
Overarching Method
This report outlines the hydrological and MDBA environmental flow indicators that have been achieved at two key
locations by the Basin Plan since 2010. The year 2010 is seen as a reasonable starting point as this was when at
least 50% of the water recovery for the Basin Plan had been achieved. Results are generated by obtaining observed
river flows from 2010 at key hydrological indicator sites and determining achievement of MDBA environmental
flow indicators. This is then compared to environmental flow indicators and river flows achieved:
Prior to the Basin Plan as represented by MDBA modelling of Baseline or pre-Basin Plan conditions using
climatic conditions from 1895-2009; and
Post the Basin Plan as represented by MDBA modelling of Basin Plan conditions using climatic conditions
from 1895-2009.

9
The post-Basin Plan model run includes an adjustment to the Sustainable Diversion Limit of 605 GL through the
addition of supply measures that are supposed to enable the same environmental outcomes as 2,750 GL but with
less water (i.e. 2,145 GL of environmental water recovery rather than 2,750 GL).
Without Baseline model output from 2010-2018 comparisons are made between pre- and post-Basin Plan
modelling periods which had similar annual catchment wetness.
For example specific steps in the analysis were as follows:
1. Choose a target stream gauge or hydrological indicator site (e.g. Riverland-Chowilla) and obtain observed
daily flow time series.
2. Determine the achievement of the MDBA’s environmental flow indicators (refer MDBA, 2011, 2012) at
target location based on observed flow data since 2010.
3. Compare what has actually been achieved between 2010-2018 to target frequencies expected based on
modelled output by the MDBA post-Basin Plan (MDBA, 2017b).
4. Obtain daily modelled streamflow for target location based on Baseline (pre-Basin Plan), Basin Plan (post-
Basin Plan) and Without Development (WOD) model runs. These models run over 114 years of climate
data from 1895 to 2009 but have not been updated to model the period from 2010 to 2018.
5. Determine and obtain upstream water availability drivers for target location in terms of daily inflows from
major upstream tributaries, and daily storages levels from major upstream dams. These are used as a
surrogate for the water available in each upstream catchment and are drivers of flow volumes at the
target location. Water availability drivers are obtained for the years 1970-2018. The year 1970 is the first
where most water availability drivers have data available.
6. Sort water availability driver values from lowest to highest (as percentiles) based on the average daily
values over the water year.
7. Water availability or catchment wetness classes are then applied such that:
a. All values below the 33rd percentile represent dry conditions in terms of water availability are
assigned a value of 1;
b. All values greater than the 33rd percentile but less than the 66th percentile in terms of water
availability are assigned a value of 2; and
c. All values greater than the 66th percentile represent wet conditions in terms of water availability
are assigned a value of 3.
8. Calculate average wetness value using all water availability drivers for each target location for each water
year to determine an overall wetness score.
9. The observed wetness value for each water year after 2010 is then taken one at a time. This value is used
to compile a list of years between 1970-2009 that have an identical wetness value. Then calculate the
average, minimum and maximum modelled flows from 1970-2009 simulated during the same wetness
class.
10. Some results were also produced using four wetness classes as shown in Appendix E.
Test locations
Hydrological indicator sites are 124 sites where the environmental flow requirements for that reach of the river or
floodplain wetland have been chosen by the MDBA. Hydrological indicator sites generally define environmental
water requirements of the river, wetlands and floodplain in the river reach.
For this study, two key locations have been chosen (Figure 3). These represent MDBA hydrological indicator sites
modelled using the MDBA Environmentally Sustainable Level of Take methodology (MDBA, 2011). The hydrological
indicator sites examined were:
1. Riverland‐Chowilla Floodplain indicator site where flows on the River Murray are indicative of wetland
and floodplain outcomes in South Australia.
10
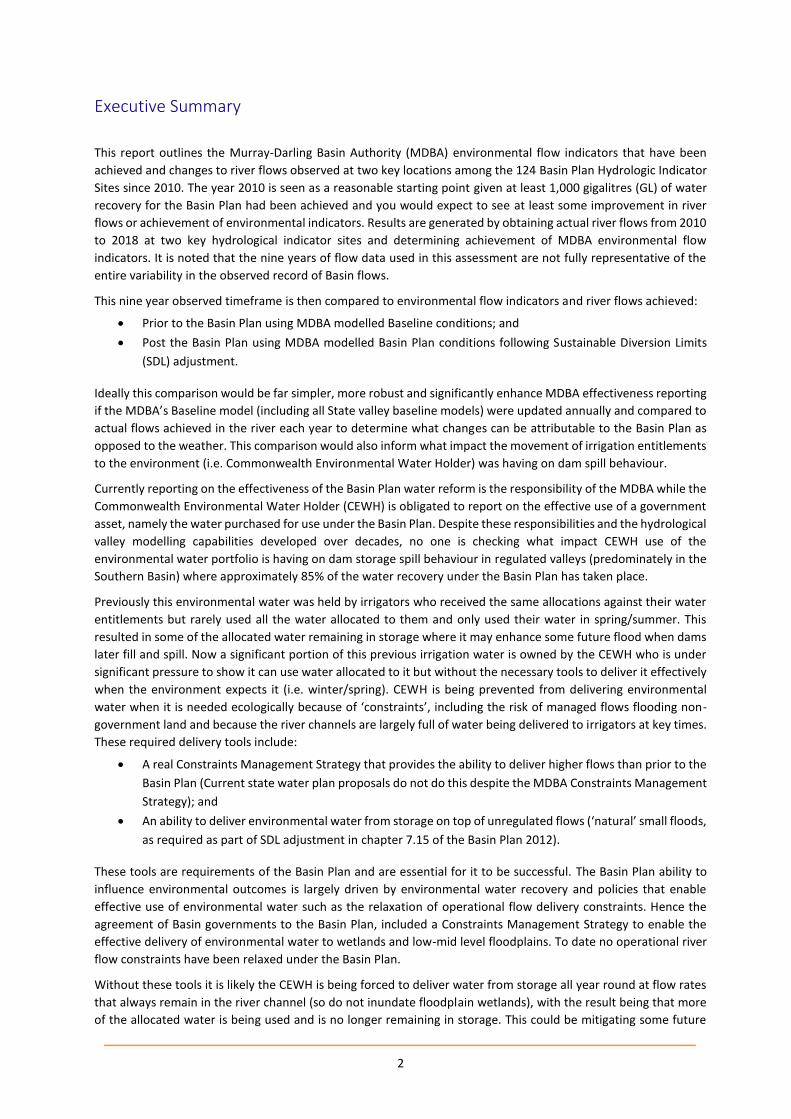
2. Flows at Wilcannia on the lower Barwon-Darling used by the MDBA as an indicator of the environmental
outcomes achieved between Louth and Wilcannia on the Darling River. The Wilcannia hydrological
indicator site is also used here as an indicator of environmental outcomes likely in the Darling between
Bourke and Wilcannia.
Figure 3: Map of Basin showing location of the Wilcannia on the Darling River above Menindee Lakes and
Chowilla on the Murray River near the South Australian border.
These two river systems exhibit notable differences in their flow characteristics:
The Southern Basin (i.e. the Murray, Goulburn, Murrumbidgee and Darling below Menindee) is
traditionally recognised as having a winter/spring dominated flow regime. Though this has changed in
recent decades through changes in climate. It is highly regulated with major dams capturing most
substantial inflows. Water is allocated to water entitlement holders based predominately on dam storage
levels, with the bulk of this demand coming in the warmer summer months. The ability of the CEWH to
achieve environmental flow targets is largely dependent on its ability to supplement existing flows in the
river with additional releases from storage.
The Northern Basin experiences significantly more variability in inflows than the Southern Basin, and
inflows are influenced by monsoonal climate over the summer months. The Northern Basin upstream of
Menindee lakes is largely unregulated (e.g. the Barwon-Darling) with most water license holders being

11
allowed to pump water from the river, when the river is flowing at a particular rate. In these systems the
environmental water holder relies on other water entitlement holders to not pump the water purchased
for the environment. However, as neither New South Wales nor Queensland have changed pumping
thresholds to protect environmental releases since the purchase by the CEWH, irrigators can legally pump
environmental water on an event by event basis. This is more likely to be noticed at low flows when a
substantial portion of the flow can be captured by irrigators.
Lower Murray Riverland-Chowilla Hydrological Indicator Site
The environmental flow indicators used by the MDBA to
determine if ecological characteristics of the Murray
River, wetlands and floodplains in South Australia will
be maintained are described in Table 2 below. Here the
relatively well known environmental water
requirements of the Riverland‐Chowilla Floodplain
indicator site are assumed by the MDBA to be an
indicator of the environmental flow requirements
between Lock 10 to the Lower Lakes. This section of the
Murray River contains large areas of wetlands,
billabongs and flood dependent vegetation. The
achievement of the Riverland-Chowilla indicator site is
calculated based on the flow achieved at the South
Australian border. The flow requirements
(environmental flow indicators) are measured based on
particular volume of water (ML/d), frequency (% of years), duration (number of consecutive days) and timing (time
of year e.g. June to December) requirements. These requirements align with environmental watering needs and
are calculated based on water years which span 1895-2009.
The frequency requirement is described as a range between a high uncertainty of environmental values being
maintained and a low uncertainty of environmental values being maintained.
The location of the Riverland-Chowilla hydrological indicator site is shown in Figure 4 and while this site can be
watered with environmental works at lower flows than indicated in Table 2, the remaining wetlands and floodplain
of the Murray River in South Australia cannot. These environmental works, infrastructure used to take water out
of the river channel and put it on areas of floodplain wetlands without the river spilling over the bank, include
pumps, channels and levee banks. In fact, all environmental works on the Murray River only allow for watering of
approximately 25% of flood dependent wetlands and vegetation (and creates other problems, such as for fish
movement), and so the achievement of the Basin Plan environmental flow indicators is still vitally important.
Box 2: Flow Targets
The flow targets examined in this report were set by the MDBA in 2011 as part of the Environmentally Sustainable Level of Take methodology which formed the basis for the SDL. They also informed the Basin Watering Strategy which describes the environmental watering requirements that guide the CEWH.
These targets were used to develop water recovery amounts and should therefore be used to evaluate the Plan’s effectiveness in delivering these amounts. To date, neither the MDBA nor the CEWH have used these targets in their effectiveness reporting.

12
Figure 4: Location and extent of the Riverland‐Chowilla Floodplain hydrologic indicator site (MDBA, 2012).
Table 2: Site‐specific ecological targets and associated flow indicators for the Riverland‐Chowilla Floodplain
(MDBA, 2011).
Table 3 shows the achievement of environmental flow indicators at the Riverland-Chowilla hydrological indicator
site based on the following information:
1. Environmental flow indicator targets established by the MDBA in 2011;
2. Modelled achievement of flow indicators as estimated by the MDBA following SDL adjustment modelling
of a 605 GL decrease in environmental water recovery with supply measures fully implemented;

13
3. Modelled achievement of flow indicators as estimated by the MDBA based on modelling Baseline (pre-
Basin Plan) conditions; and
4. Achievement of flow indicators since 2010 based on actual river gauged flow.
It can be seen that none of the environmental flow indicators at the Riverland-Chowilla hydrological indicator site
have been met since 2010 in the observed record. For high flow indicators the results are significantly worse than
was experienced on average prior to the Basin Plan. This is likely to have had an adverse impact on river, wetland
and floodplain ecology which depend on at least one moderate flood every ten years. While much of the Riverland-
Chowilla hydrological indicator site can be watered with environmental works, most of the remaining floodplain
in South Australia cannot.
Table 3: Outcomes for environmental flow indicators at the Riverland-Chowilla hydrological indicator site as
expected by the Basin Plan following SDL adjustment and historically since 2010.
Given the results in Table 3, the expected maintenance of most water dependent ecosystems connected to the
Murray River in South Australia will not be possible. The area of inundation expected by the MDBA is presented in
Figure 20 in Appendix C. The Basin Plan expected that at least 40% (or approximately 45,000 ha) of wetlands and
flood-dependent vegetation in South Australia would be maintained without a Constraints Management Strategy
and 75% (or approximately 82,000 ha) with a Constraints Management Strategy. As no flow indicators in Table 3
are being achieved this means that the only portion of this floodplain that will be maintained will be the Chowilla
environmental works area of approximately 9,000 ha. This achievement is due purely to the works implemented
under The Living Murray initiative and not directly related to the Basin Plan. Noting that 9,000 ha only represents
about 10% of the floodplain being actively managed assuming a Constraints Management Strategy were in place,
or only 20% actively managed in the absence of relaxed constraints.
Riverland Chowilla Hydrological Indicator Site based on ---> Flow to SA
Flow
indicator
Flow
magnitude
(ML/d)
Duration
(days)
Min
Duration
Start
month
End
month
Low
Uncertainty
Target Freq
(% years)
High
Uncertainty
Target Freq
(% years)
Basin Plan
SDL
Adjustment
model result
(% years
achieved)
Baseline
(pre-Basin
Plan) %
years
achieved)
Actual Result
2010-2018
1 20,000 60 60 Aug Dec 80 72 77 43 50
2 40,000 30 7 Jun Dec 70 50 51 37 37.5
3 40,000 90 7 Jun Dec 50 33 34 22 0
4 60,000 60 7 Jun Dec 33 25 26 12 0
5 80,000 30 7 Jun May 25 17 14 10 0
6 100,000 21 1 Jun May 17 13 6 6 0
7 125,000 7 1 Jun May 13 10 5 4 0
Achieves High Uncertainty Frequency
Fails to meet environmental flow indicator
Not actively targeted by the Basin Plan

14
It is important to consider the results in Table 3 given relative water availability from 2010 to 2018 (i.e. actual
result) compared to water availability of the period modelled by the MDBA. At first glance the period between
2010-2018 would appear relatively wet given the high river flows experienced in 2011, 2012 and 2016. In order to
better compare the Basin Plan modelled result against the actual environmental flow results from 2010 to 2018,
water availability was characterised by calculating the average wetness score from 1970 to 2018 using historical
gauge data of key inflows and dam storage levels as previously described in Section 3. The sites used to do this are
contained in Appendix A and Appendix B.
The result is a time series of wetness scores for each water year since 1970. This could be extended back to 1895
using MDBA modelled inflows and storage levels however these were not available at the time of this study. The
annual average wetness scores from 1970 can be seen in Figure 5. It can be seen that the lowest values occur over
the period of the Millennium Drought between 2001-2009. Despite extremely low storage levels at the end of the
Millennium Drought, storages refilled quickly with some large flows (floods) experienced in 2010/11, 2011/12 and
2016/17.
Figure 5: Average annual wetness scores calculated using actual inflow and storage data from 1970-2018.
In Table 4 actual achievement of the Riverland-Chowilla environmental flow indicator of 40,000 ML/d for 30 days
between June and December (flow indicator 2 in Table 3) has been calculated from river gauge data from 2010 to
2018. According to Table 2 (MDBA, 2012), this indicator can be met by combining 7 day events that add up to 30
days over the water year. It can be seen in Table 4 based on river gauged flow from 2008 that this indicator is only
met from 2010-2018 when catchment wetness is above 2 to 2.5 (i.e. relatively wet).

15
Table 4: Achievement of Riverland-Chowilla 40,000 ML/d for 30 days environmental flow indicators based on
gauged river flows across the South Australia border versus water availability score.
Using this information it was possible to plot achievement of flow indicators during both modelled periods (1970-
2009) and observed periods (2010-2018) based on the wetness score for that water year. Figure 6 below plots flow
events of 40,000 ML/d (flow indicators 2 & 3 in Table 3) to South Australia that lasted 7 days against the wetness
class for that year. Figure 6 shows that the MDBA expected more of these events would be achieved during periods
of medium or even low catchment water availability. Given water availability has been relatively high since 2010
(i.e. 6 out of 8 years have a wetness score above 2), the inability to achieve environmental flow indicators or
improve on pre-Basin Plan outcomes in the observed record over the past 8-10 years is concerning.
Figure 6: Number of 40,000 ML/d flow events lasting 7 days at the Riverland-Chowilla site based on MDBA Basin
Plan modelling (1970-2009) and actual achievement from 2010-2018 versus water availability or catchment
wetness.
Another way to examine the data is to calculate the annual average, minimum and maximum modelled and
observed flow values for each wetness class. The results are shown in Table 5 with all average values plotted in
Figure 7. The data was also examined using four water availability classes (Figure 8). It can be seen that observed
annual average flows to South Australia from 2010-2018 are lower than even pre-Basin Plan (Baseline) modelled
flows during years that are relatively dry (low wetness score).
Year
Number
of 7 day
events
Years
with 30
day event
Water
Availability
(1-3)
2008/09 0 0 1.1
2009/10 0 0 1.1
2010/11 5 1 2.8
2011/12 1 0 2.3
2012/13 7 1 2.1
2013/14 0 0 1.7
2014/15 0 0 1.4
2015/16 0 0 1.2
2016/17 9 1 2.6
2017/18 0 0 1.6
16
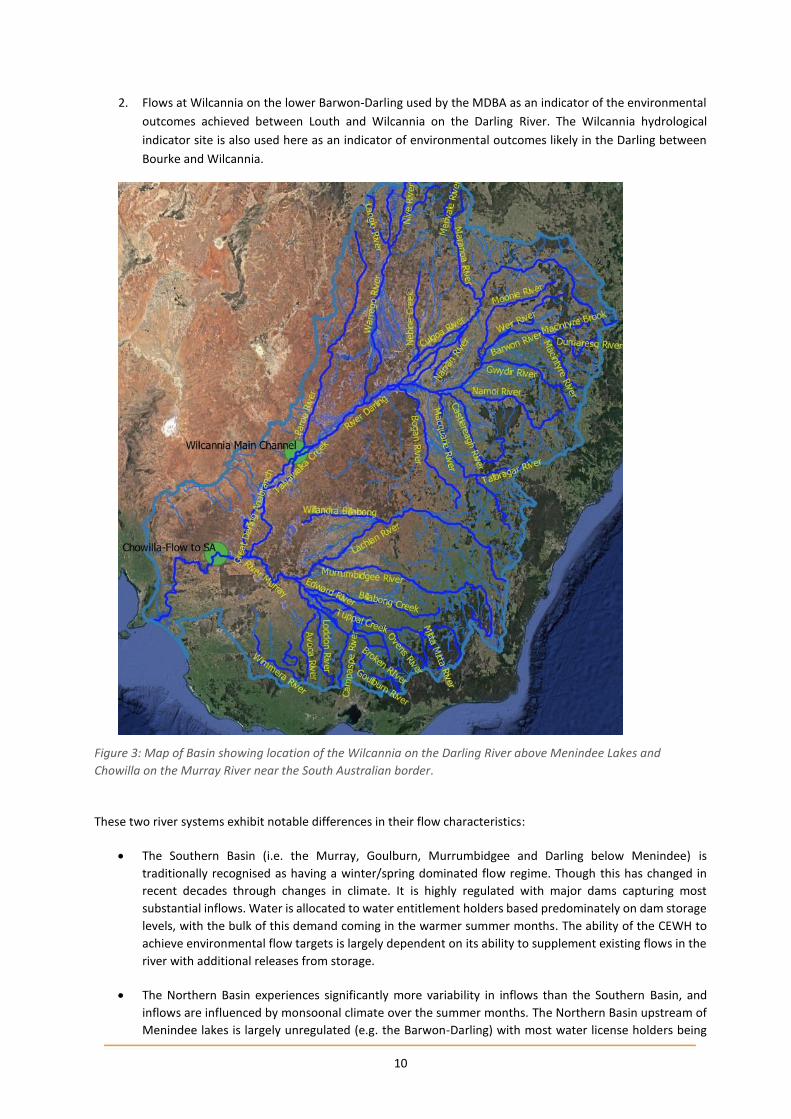
Also, observed annual average flow to South Australia from 2010-2018 are lower than those flows expected by the
Basin Plan for years in all wetness categories. It is important to note here that the maximum and minimum values
are based on the annual average values for each year not the daily values. Therefore flows higher or lower than
this may exist on a daily basis.
Table 5: Annual average, minimum and maximum modelled (1970-2009) and observed (2010-2018) flow to South
Australia values calculated for each wetness class.
Figure 7: Average annual Flow to South Australia values comparing observed river flows from 2010-2018 against
modelled Basin Plan flows during years with the same wetness score. Upstream water availability drivers are split
into three classes.
Wetness
ClassAverage Min Max Average Min Max Average Min Max Average Min Max
1 7974 1908 12992 6158 786 9009 16055 3760 26854 5136 3089 7864
2 19333 11225 29152 15629 7179 25154 33015 21117 47269 16476 7455 28077
3 37254 25379 63714 33607 18587 63834 53233 44063 74457 32612 25142 40081
Basin Plan Modelled Flow to SABaseline (pre-Basin Plan)
Modelled Flow to SAWOD Modelled Flow to SA Observed Flow to SA
17
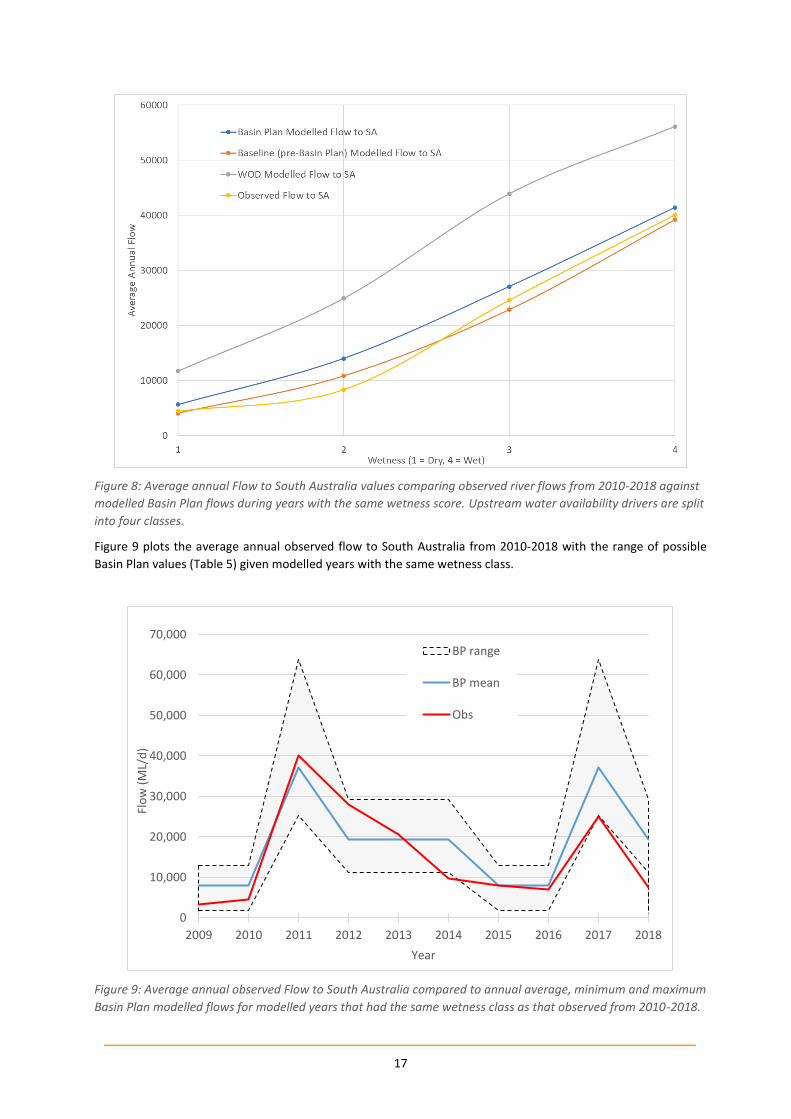
Figure 8: Average annual Flow to South Australia values comparing observed river flows from 2010-2018 against
modelled Basin Plan flows during years with the same wetness score. Upstream water availability drivers are split
into four classes.
Figure 9 plots the average annual observed flow to South Australia from 2010-2018 with the range of possible
Basin Plan values (Table 5) given modelled years with the same wetness class.
Figure 9: Average annual observed Flow to South Australia compared to annual average, minimum and maximum
Basin Plan modelled flows for modelled years that had the same wetness class as that observed from 2010-2018.
0
10,000
20,000
30,000
40,000
50,000
60,000
70,000
2009 2010 2011 2012 2013 2014 2015 2016 2017 2018
Flo
w (
ML/
d)
Year
BP range
BP mean
Obs
18
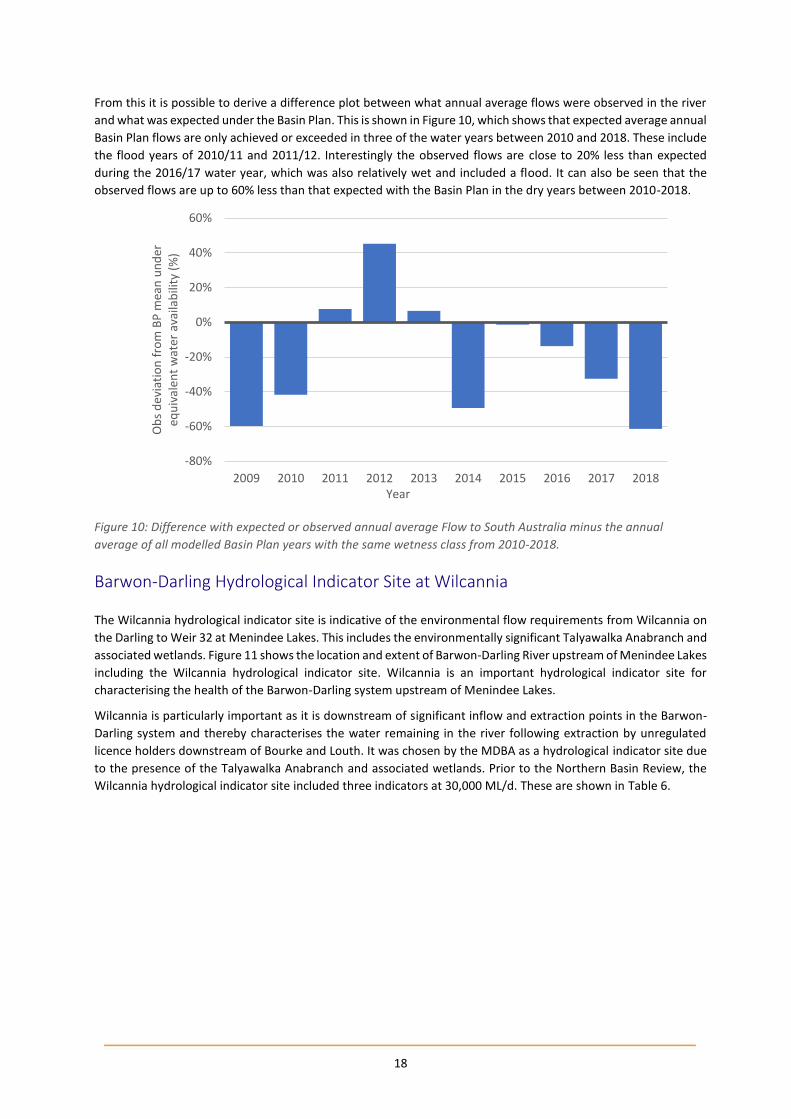
From this it is possible to derive a difference plot between what annual average flows were observed in the river
and what was expected under the Basin Plan. This is shown in Figure 10, which shows that expected average annual
Basin Plan flows are only achieved or exceeded in three of the water years between 2010 and 2018. These include
the flood years of 2010/11 and 2011/12. Interestingly the observed flows are close to 20% less than expected
during the 2016/17 water year, which was also relatively wet and included a flood. It can also be seen that the
observed flows are up to 60% less than that expected with the Basin Plan in the dry years between 2010-2018.
Figure 10: Difference with expected or observed annual average Flow to South Australia minus the annual
average of all modelled Basin Plan years with the same wetness class from 2010-2018.
Barwon-Darling Hydrological Indicator Site at Wilcannia
The Wilcannia hydrological indicator site is indicative of the environmental flow requirements from Wilcannia on
the Darling to Weir 32 at Menindee Lakes. This includes the environmentally significant Talyawalka Anabranch and
associated wetlands. Figure 11 shows the location and extent of Barwon-Darling River upstream of Menindee Lakes
including the Wilcannia hydrological indicator site. Wilcannia is an important hydrological indicator site for
characterising the health of the Barwon-Darling system upstream of Menindee Lakes.
Wilcannia is particularly important as it is downstream of significant inflow and extraction points in the Barwon-
Darling system and thereby characterises the water remaining in the river following extraction by unregulated
licence holders downstream of Bourke and Louth. It was chosen by the MDBA as a hydrological indicator site due
to the presence of the Talyawalka Anabranch and associated wetlands. Prior to the Northern Basin Review, the
Wilcannia hydrological indicator site included three indicators at 30,000 ML/d. These are shown in Table 6.
-80%
-60%
-40%
-20%
0%
20%
40%
60%
2009 2010 2011 2012 2013 2014 2015 2016 2017 2018
Ob
s d
evia
tio
n f
rom
BP
mea
n u
nd
ereq
uiv
alen
t w
ater
ava
ilab
ility
(%
)
Year

19
Figure 11: Location and extent of Barwon-Darling River upstream of Menindee Lakes including the Wilcannia
Hydrological Indicator Site (MDBA, 2012b).
Table 6: Wilcannia environmental flow indicators prior to the Northern Basin Review.
These indicators have been subsequently updated from 2018 as part of the Northern Basin Review amendments
to include a small fresh and large fresh at 20,000 ML/d while removing two of the 30,000 ML/d flow indicators
(MDBA, 2016a).
The current list of environmental flow indicators for Wilcannia were taken from the MDBA’s Northern Basin Review
of environmental water requirements (MDBA, 2016a) and is shown in Table 7. Table 7 also includes results in terms
of the frequency these indicators are met based on:
Modelled Baseline (pre-Basin Plan over the last 114 years);
Modelled Basin Plan with a 320 GL reduction in diversion in the Northern Basin; and
Actual results based on river gauge data since 2010.

20
It can be seen from Table 7 that only one out of three environmental flow indicators at Wilcannia has been met
based on required frequencies since 2010.
Table 7: Wilcannia environmental flow targets and achievement under MDBA's Northern Basin Review modelling
compared to achievement based on recorded flow from 2008 to 2018 (MDBA, 2017c).
Figure 12 shows the number of 7 day events at 6,000 ML/d against the water availability or wetness each year. It
can be seen that this indicator is met during a range of water availability scores although predominately when
wetness is above 2, whereas the 20,000 ML/d indicator (Figure 13) is met almost entirely when the catchment
water availability is above 2.
Wilcannia Environmental Flow Indicators
Low
Uncertainty
Target Freq
(% years)
High
Uncertainty
Target Freq
(% years)
Baseline-
Pre-Basin
Plan
modelled
Northern
Basin Review
Scenario J -
321 recovery
Actual
Result
2010-2018
Annual flow volume of 2,350 GL measured when flow is above 30,000
ML/d at Wilcannia on the Darling River (outer floodplain) (frequency
results shown as percent of years with at least one event)
10 7 3 7 0
6,000 ML/d for 7 days any time of the year at Wilcannia on the
Darling River (small fresh - short duration) (frequency results shown
as percent of years with at least one event)
60 45 42 48 50
20,000 ML/d for 7 days any time of the year at Wilcannia on the
Darling River (large fresh – short duration) (frequency results shown
as percent of years with at least one event)
60 45 39 45 37.5

21
Figure 12: Achievement of MDBA environmental flow indicator of 6,000 ML/d for 7 days (the environmental
requirement is for this to occur twice a year) at Wilcannia versus water availability score.
Figure 13: Achievement of MDBA environmental flow indicator of 20,000 ML/d for 7 days at Wilcannia (the
environmental requirement is for this to occur once a year) versus water availability score.
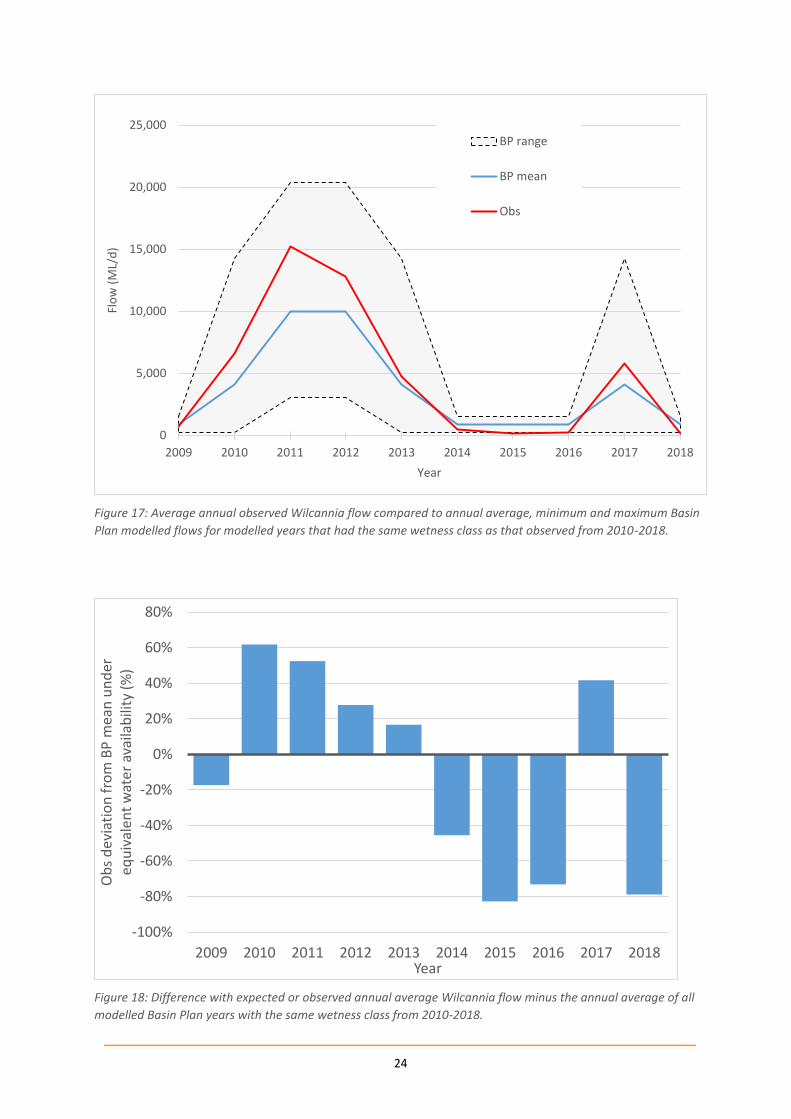
While two out of the three MDBA environmental flow indicators have not been met between 2010 and 2018, the
annual average flow observed at Wilcannia exceeds that expected from the Basin Plan (Northern Basin Review
Scenario K) for all water availability scenarios except dry or low flow conditions (Table 8, Figures 14, 15 and 16).

22
The results reflect that observed flows at Wilcannia are below that expected by the Basin Plan when flows are
below 1,000 ML/d (emphasised in Figure 16). This pattern can also be seen in Figure 17 and 18 where average
annual observed Wilcannia flows exceed that expected by Northern Basin Review modelling in years with high
flows (wet years), but are as much as 80% less than expected in low flow years (dry years). The annual average
observed flows are also lower than modelled pre-Basin Plan (Baseline) during low flow years (Figure 15).
These results suggest evidence that low flows in the Darling system are heavily influenced by extraction for
consumptive purposes. Of the total flow volume, proportionately larger volumes of low flows are captured by
irrigators, and the lack of protection of environmental flows means that small events are unable to achieve
environmental objectives in dry years. Further exploration is required of this issue given known uncertainties in
the Barwon-Darling model at low flows.
Table 8: Annual average, minimum and maximum modelled (1970-2009) and observed (2010-2018) Wilcannia
flows calculated for each wetness class.
Figure 14: Average annual Wilcannia flow values comparing observed river flows from 2010-2018 against
modelled Basin Plan flows during years with the same wetness score. Upstream water availability drivers are split
into three classes.
Wetness
Class
Average Min Max Average Min Max Average Min Max Average Min Max
1 854 246 1502 687 157 1229 2662 345 5002 638 13 1144
2 4082 185 14276 3731 168 13592 6732 674 18621 4857 399 16762
3 9991 3045 20408 9422 2656 19439 14222 5846 27616 12683 3833 27638
NBR Scenario K - Modelled
Wilcannia Flow
Baseline (pre-Basin Plan)
Modelled Wilcannia FlowWOD Modelled Wilcannia Flow Observed Wilcannia Flow

23
Figure 15: Average annual Wilcannia flow values comparing observed river flows from 2010-2018 against
modelled Basin Plan flows during years with the same wetness score. Upstream water availability drivers are split
into four classes.
Figure 16: Average annual Wilcannia flow values comparing observed river flows from 2010-2018 against
modelled Basin Plan flows during years with the same wetness score. Upstream water availability drivers are split
into four classes (zoomed to drier water availability).
24
Figure 17: Average annual observed Wilcannia flow compared to annual average, minimum and maximum Basin
Plan modelled flows for modelled years that had the same wetness class as that observed from 2010-2018.
Figure 18: Difference with expected or observed annual average Wilcannia flow minus the annual average of all
modelled Basin Plan years with the same wetness class from 2010-2018.
0
5,000
10,000
15,000
20,000
25,000
2009 2010 2011 2012 2013 2014 2015 2016 2017 2018
Flo
w (
ML/
d)
Year
BP range
BP mean
Obs
-100%
-80%
-60%
-40%
-20%
0%
20%
40%
60%
80%
2009 2010 2011 2012 2013 2014 2015 2016 2017 2018
Ob
s d
evia
tio
n f
rom
BP
mea
n u
nd
ereq
uiv
alen
t w
ater
ava
ilab
ility
(%
)
Year

25
Figure 19: Average annual observed Wilcannia flow compared to annual average, minimum and maximum
Baseline (pre-Basin Plan) modelled flows for modelled years that had the same wetness class as that observed
from 2010-2018.
From the volume of environmental water recovered to date, the observed flows should be close to the expected
values and larger than the baseline. However, from Figure 20, we see that in both wet and dry years this is generally
not the case. In most instances the observed flow is less than expected (and even less than the baseline in several
cases). Wilcannia in wet years provides the only exception that the observed flow is greater than expected and
this is caused by large flows due to natural flood events.
Figure 20: Average daily expected flows (ML/d) over 2010-2018 at (a) Chowilla and (b) Wilcannia compared with
baseline and observed, separated into dry and wet years.
These results show that Basin Plan implementation has not improved the flow regimes in the rivers as were
expected in the modelling. Additionally, in most cases the observed flows are similar to or below the baseline
model results, meaning that instead of recording an improvement in the river flows, there has actually been a
decline.
A caveat of this figure is that it only shows a single average value for annual flows in wet and dry years, and has
excluded years with a wetness class identified as 2. This collapses the variability shown in the previous figures in
this report. Additionally there are uneven number of years in the wet and dry classes for each site.
0
5,000
10,000
15,000
20,000
25,000
2009 2010 2011 2012 2013 2014 2015 2016 2017 2018
Flo
w (
ML/
d)
Year
BL range
BL mean
Obs
0 10,000 20,000 30,000 40,000
Observed
Baseline
Expected
Observed
Baseline
Expected
Flow (ML/d)
(a) Chowilla
Wet years
Dry years
0 5,000 10,000 15,000
Observed
Baseline
Expected
Observed
Baseline
Expected
Flow (ML/d)
(b) Wilcannia
Dry years
Wet years

26
It is noted here that in wet years, there is generally a large volume of water for all users. The Basin Plan needs to
ensure environmental water is increased, when compared to historical practices, in dry years, when water
resources are scarce. Current levels of environmental water should be impacting on the observed ‘dry-year’ flows
and making these closer to the expected results.
Conclusion
Key findings from this analysis of the two hydrological indicator sites are as follows:
The Riverland-Chowilla hydrological indicator site based on flow to South Australia
1. None of the MDBA environmental flow indicators at the Riverland-Chowilla hydrological indicator site
have been met in the observed record since 2010, when assessed against the frequencies required to
sustain the health of water dependent ecosystems contained in the lower Murray River (Table 3). For high
flow indicators, the results are significantly worse than were experienced on average prior to the Basin
Plan. This is despite the period from 2010-2018 classed as being medium to wet years. This is likely to
have had an adverse impact on river, wetland and floodplain ecology which depend on at least one
moderate flood every ten years. While much of the Riverland-Chowilla hydrological indicator site can be
watered with environmental works, most of the remaining floodplain in South Australia cannot
2. The Basin Plan expected that at least 40% (or approximately 45,000 ha) of wetlands and flood-dependent
vegetation in South Australia would be maintained without a Constraints Management Strategy and 75%
(or approximately 82,000 ha) with a Constraints Management Strategy (Refer Appendix C). As no flow
indicators in Table 3 are being achieved, this means that the only portion of this floodplain that will be
maintained will be the Chowilla environmental works area of approximately 9,000 ha. This achievement
is due purely to the works implemented under The Living Murray initiative and unrelated to the Basin
Plan. Noting that 9,000 ha only represents about 10% of the floodplain being actively managed assuming
a Constraints Management Strategy were in place, or only 20% actively managed in the absence of relaxed
constraints.
3. Based on observed flow to South Australia since 2010, actual achievement of the Riverland-Chowilla
environmental flow indicator of 40,000 ML/d for 30 days between June and December is only met when
catchment wetness is above 2 to 2.5 (i.e. a medium to wet year) (Table 4).
4. Based on MDBA Basin Plan modelling the MDBA expected slightly more 40,000 ML/d flow events lasting
7 days events to occur during periods of medium or even low catchment water availability (Figure 6).
5. Given water availability has been relatively high since 2010 (i.e. 4 out of 8 years have a wetness score
above 2), the inability to achieve environmental flow indicators or improve on pre-Basin Plan outcomes
in the observed record over the past 8-10 years is concerning (Table 4, Figure 6).
6. The results shown in Table 5, Figure 7 and Figure 8 show that observed annual average flow to South
Australia from 2010-2018 are lower than even pre-Basin Plan (Baseline) modelled flows for dry wetness
classes and below what the Basin Plan expected for all wetness classes.
7. It can be seen in Figure 9 and Figure 10 that observed flows to South Australia are up to 60% less than
expected under the Basin Plan and that flows expected under the Basin Plan are only achieved in 3 out of
8 years.
27
Wilcannia hydrological indicator site
5. It can be seen from Table 7 that only one of the three environmental flow indicators at Wilcannia has
been met based on required frequencies since 2010. This likely means the ecological health of the water
dependent ecosystems in this reach of the river and potentially the rest of the Darling River are not being
maintained.
6. Based on analysis of observed flow data at Wilcannia since 2010, the 20,000 ML/d environmental flow
indicator (Figure 13) is met almost entirely when the catchment water availability is high (i.e. above 2).
7. While two out of the three MDBA environmental flow indicators at Wilcannia have not been met between
2010 and 2018, Table 8, Figure 14, Figure 15, Figure 16 show that, the annual average flow observed at
Wilcannia exceeds that expected from the Basin Plan (Northern Basin Review Scenario K) for all water
availability scenarios and all flows except those flows below 1,000 ML/d.
8. This pattern can also be seen in Figure 17 and Figure 18 where average annual observed Wilcannia flows
exceed that expected by Northern Basin Review modelling in years with high flows, but are up to 80% less
than expected by the Basin Plan in low flow years.
Potential explanations for results observed
In the southern regulated Basin the ability to achieve environmental flow targets in the lower Murray required
operational flow constraints in the upper to mid Murray River to be relaxed. The poor results at the Riverland-
Chowilla hydrological indicator site are likely due to further tightening of operational flow constraints since 2012.
This means operators can no longer deliver higher flows that were delivered prior to the Basin Plan. For instance,
operators in the:
Murrumbidgee can only deliver 20,000 ML/d through Wagga Wagga when the modelling underpinning the
Basin Plan and the NSW water sharing plan assume 32,000 ML/d can be delivered upstream through Gundagai;
Murray can only deliver 18,000 ML/d downstream of Yarrawonga even though prior to the Basin Plan they
had delivered flows in excess of 22,000 ML/d; and
Goulburn can only deliver flows below 20,000 ML/d to McCoys Bridge downstream of Shepparton even though
prior to the Basin Plan the constraint was approximately 25,000 ML/d.
Table 9, Appendix C shows flows that could be delivered prior the Basin Plan, those envisaged by the Constraints
Management Strategy and river flows being proposed by States.
The inability to improve on Baseline (pre-Basin Plan) results or achieve environmental flow indicators in the lower
Murray may also be due to inadequate consideration of unimplemented (or pre-requisite) policy measures (e.g.
the ability to release water on top of unregulated flows) described in chapter 7.15 of the Basin Plan (2012).
It is also noted that not all of the Basin Plan environmental water had been recovered in 2010, however
approximately 50% had been so one would still expect some improvement.
In the Northern Basin at Wilcannia the inability to reach two out of the three environmental flow indicators may
be due to insufficient water recovery in the Northern Basin and an overestimation by the MDBA of the ability to
deliver these flow outcomes without stronger protection (shepherding) of low flows. High flows are being achieved
most probably because irrigators have more difficulty pumping water from these events into their off-river
storages. The further reduction of 70 GL in environmental water recovery required as result of the MDBA Northern
Basin Review and supported by the Commonwealth Parliament in 2018 would not be helping either.

28
Recommendations
As a result of this study, the Wentworth Group of Concerned Scientists has identified the following
recommendations:
1. The MDBA should evaluate the success of water recovery in the Basin Plan using an approach which is
based on the measurement of river flows against expected flows, taking into consideration variable
climate:
a. The preferred method is to update the Baseline (pre-Basin Plan) models in each valley every year
with observed rainfall, evaporation and storage levels. These results provide a simulation of
flows without Basin Plan water recovery and can be directly compared to current observed
gauged flows to achieve the objective above.
b. If the MDBA is unable to undertake the assessment through updating the Baseline models then
an alternative method, such as the one presented here, should be adopted.
c. This evaluation should be conducted at all MDBA hydrological indicator sites, and the model
outputs and results should be made publicly available for independent testing and verification.
d. This assessment should be adopted as a mandatory element of the MDBA’s annual Basin Plan
effectiveness reporting. This should include full investigations if flow parameters are not
achieving expected outcomes. Action should be taken where flows fail to achieve targets.
2. That a single set of flow indicators, reflecting an Environmentally Sustainable Level of Take, are agreed to
by all jurisdictions and used for environmental water planning, management and evaluation.
3. To improve the achievement of all flow indicators at Chowilla we recommend that pre-requisite policy
measures (assumptions made when modelling the Basin Plan) be properly implemented to provide the
ability to maximise the benefits of environmental water at rates supported by a fully implemented
Constraints Management Strategy that enable 80,000 ML/d at Chowilla and into South Australia to be
achieved.
4. To improve the condition of high flow indicators at Chowilla and elsewhere in the Goulburn and
Murrumbidgee we recommend that the Constraints Management Strategy be implemented in full by the
New South Wales and Victorian Governments, which will allow for larger flow volumes during high flow
events. The MDBA should pursue a target of at least 50,000 ML/d downstream of Yarrawonga on the River
Murray, 40,000 ML/d at McCoy’s Bridge on the Goulburn River and 50,000 ML/d at Gundagai on the
Murrumbidgee. The Commonwealth should pursue compulsory implementation if required, as
recommended by the South Australian Royal Commission into the Murray-Darling Basin. Without the
Constraints Management Strategy significant areas of floodplain in all three valleys is likely to perish.
5. To improve low flows at Wilcannia, we recommend greater protections against pumping during periods
of low flows, accompanied by protection of event based environmental flows for environmental use
downstream and across state borders.

29
References
Basin Plan (2012), Amendment to the Water Act 2007 (Cwth)
Commonwealth Government, 2007. Water Act 2007
DAWR 2018. http://www.agriculture.gov.au/SiteCollectionDocuments/water/progress-recovery/surface-water-
recovery.pdf
MDBA (2011) The Proposed “environmentally sustainable level of take” for surface water of the Murray-Darling
Basin: Methods and outcomes, MDBA Publications no: 226/11, Canberra.
MDBA (2012a) Hydrological Modelling to inform the proposed Basin Plan. Methods and Results, MDBA
publication no: 17/12, Canberra
MDBA (2012b) Hydrologic modelling of the relaxation of operational constraints in the southern connected
system: Methods and results, MDBA publication no: 76/12, Canberra
MDBA (2014a) Basin-wide Environmental Watering Strategy, MDBA Publication No 20/14, Canberra
MDBA (2016a) Assessment of environmental water requirements: Barwon–Darling river system. ISBN (online):
978-1-925221-68-8
MDBA (2017a) Basin Plan Evaluation 2017. Published by the Murray–Darling Basin Authority. MDBA publication
no: 52/17
MDBA (2017b) Modelling assessment to determine SDL Adjustment Volume. Published by the Murray–Darling
Basin Authority. MDBA publication no: 35/17
MDBA (2017c) Hydrologic Modelling for the Northern Basin Review – Interim Decision Scenario Addendum.
MDBA publication no.: 47/17
MDFRC (2017) 2015–16 Basin-scale evaluation of Commonwealth environmental water –Hydrology. MDFRC
Publication 142/2017

30
Appendix A – Historical gauged inflows and storage levels used for analysis of flows
achieved at the South Australian border and the Riverland-Chowilla hydrological
indicator sites.
Site
Hume Volume (ML)
402205 KIEWA RIVER @ BANDIANA
403200 OVENS RIVER @ WANGARATTA
406202 CAMPASPE RIVER @ ROCHESTER DS WARANGA
407202 LODDON RIVER @ KERANG
408203 AVOCA RIVER @ QUAMBATOOK
410131 BURRINJUCK
425007 DARLING @ BURTUNDY
Eildon Volume (ML)

31
Appendix B – Historical gauged inflows used for analysis of flows achieved at the
Wilcannia hydrological indicator site
Site
417204A Moonie River @ Fenton
421012 Macquarie @ Carinda
421023 Bogan @ Gongolgon
422204A Culgoa River @ Whyenbah
422209A Bokhara River @ Hebel
423001 Warrego @Fords Bridge
425003 Darling@Bourke Town
Barwon R @ Mungindi
425008 Darling River @ Wilcannia Main Channel
32
Appendix C – Constraints Management
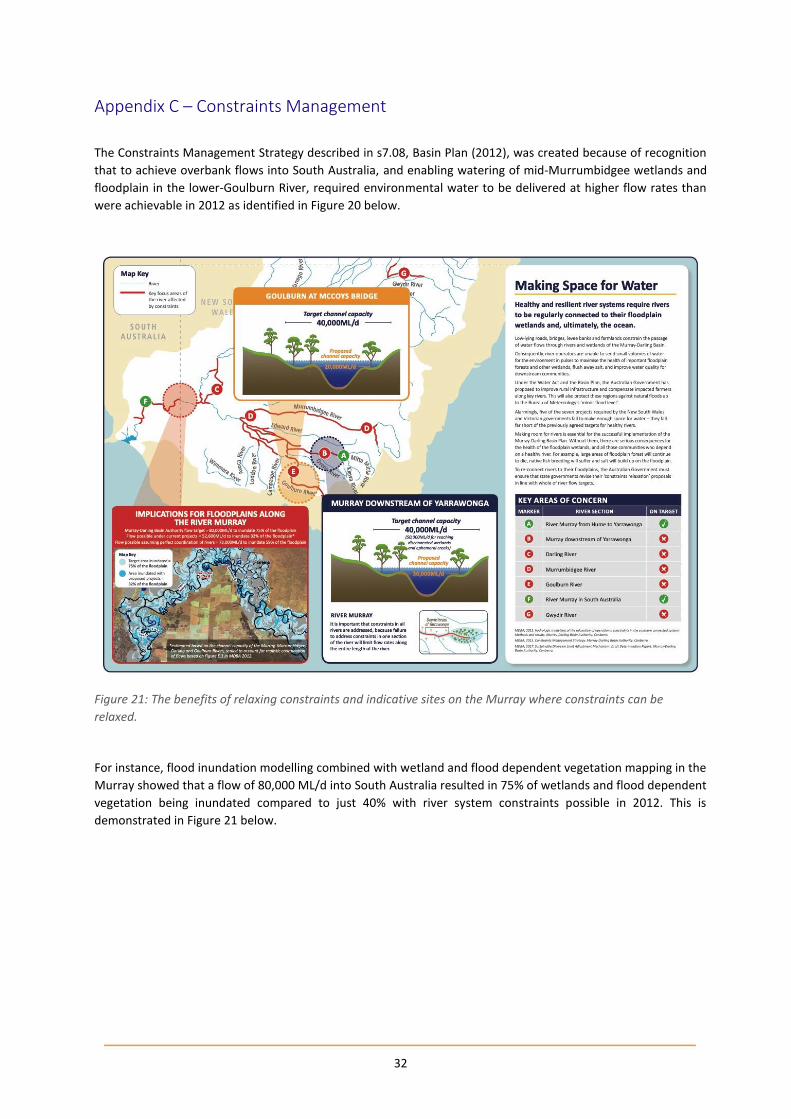
The Constraints Management Strategy described in s7.08, Basin Plan (2012), was created because of recognition
that to achieve overbank flows into South Australia, and enabling watering of mid-Murrumbidgee wetlands and
floodplain in the lower-Goulburn River, required environmental water to be delivered at higher flow rates than
were achievable in 2012 as identified in Figure 20 below.
Figure 21: The benefits of relaxing constraints and indicative sites on the Murray where constraints can be
relaxed.
For instance, flood inundation modelling combined with wetland and flood dependent vegetation mapping in the
Murray showed that a flow of 80,000 ML/d into South Australia resulted in 75% of wetlands and flood dependent
vegetation being inundated compared to just 40% with river system constraints possible in 2012. This is
demonstrated in Figure 21 below.

33
Figure 22: Relationship between inundation of wetlands and flood-dependent vegetation and flow in the Murray
River at the South Australia border (MDBA, 2012b).
Note: The percentage of wetlands and vegetation communities inundated at 60,000 and 80,000 ML/d is expressed
as a percentage of the area inundated at 200,000 ML/d. This does not represent the full extent of the River Murray
floodplain (the 1956 flood event was over 300,000 ML/d); but areas above 200,000 ML/d are inundated very
infrequently (MDBA, 2012b).
The flow rates which can actively be delivered today are less than they were in 2012 due to tightening constraints.
This means that the Basin Plan can achieve less for the environment today than could be achieved with 2,750 GL
of environmental water recovery in 2012.
What may be achieved with the levels of constraint relaxation being proposed by States
The reluctance of jurisdictions to bring forward meaningful constraints proposals significantly above what was
achievable prior to the Basin Plan, means it will be extremely difficult for environmental water holders to deliver
water to the floodplain and many wetlands. For instance, the Basin Watering Strategy identifies quantified
environmental expected outcomes from the Basin Plan (reproduced and modified in Appendix C) that assumed
environmental water could be delivered at 2012 constraint levels.
The level of constraint relaxation being proposed by Victoria (e.g. 25,000 ML/d in lower Goulburn) and NSW (e.g.
30,000 ML/d downstream of Yarrawonga) is not sufficient to achieve the aims of the Constraint Management
Strategy or the outcomes in schedule 5 of the Basin Plan (2012). In some cases, they represent a return to what
could be delivered prior to the Basin Plan. The flow constraints used in modelling to inform the Basin Plan where
based on information received from operators (both state and MDBA operators) and/or those flow rates reported
in the state’s water sharing plans. Table 9 shows the major constraints included in the SDL benchmark model, the
current understanding of constraints, constraint relaxation currently proposed by jurisdictions, and levels of
constraint relaxation in hydrologic modelling of the relaxation of operational constraints in the southern connected
system (MDBA, 2012b). The constraints relaxed modelling done by the MDBA in 2012 was thought to be the
minimum amount necessary to go over-bank in South Australia and achieve some of the outcomes described in
schedule 5 of the Basin Plan (2012).

34
Table 9. Removing physical constraints to permit delivery of water to floodplains and wetlands in the southern
Murray-Darling Basin. Constraints highlighted in red are proposed levels that will fail to meet the Murray-Darling
Basin Authority’s target as specified in the Constraints Management Strategy.
Region Location Pre-Basin Plan: Constraint in 2012 (ML/d)
MDBA Target: In MDBA Constraints Management Strategy (ML/d)
Proposed by States: In business case (ML/d)
Murray Hume to Yarrawonga
25,000 40,000 40,000
Downstream of Yarrawonga
40,000 (but effectively 22,000* due to upstream constraint of 25,000)
40,000 (50,000 for reaching disconnected wetlands and ephemeral creeks)
30,000
Darling Weir 32/Increase Menindee outlet capacity
9,300 18,000 14,000
Darling Anabranch
Water flows into anabranch over 9,300ML/d
Regulator added and closed above 9,300ML/d when environmental water is supplied from Menindee
n/a
Murrumbidgee Gundagai 30,000 50,000 40,000 at Wagga (~30,000 at Gundagai)
Balranald 9,000 13,000 9,000
Goulburn Seymour 12,000 15,000 n/a
McCoys Bridge 20,000 40,000 20,000
Total flow at South Australian border
66,000 **(assuming 26,000 from Goulburn)
111,000 **assuming Menindee allowed 18,000
73,000**
* 10,600 ML/d in regulated periods in summer and in other periods Hume to Yarrawonga constraint of 25,000 ML/d was in
place meaning that flows downstream of Yarrawonga were effectively restricted to 22,000 ML/d.
** This number assumes perfect co-ordination of flows between the Murray, Darling, Goulburn and Murrumbidgee Rivers,
something which is highly unlikely. The 111,000 ML/d target is most likely to achieve the outcomes in schedule 5 of the Basin
Plan (i.e. 80,0000 ML/d).
The total flow into South Australia at the bottom of Table 9 is calculated by adding the maximum flow in the Murray
and the end-of-system flow for the Murrumbidgee, the lower Darling and the Goulburn Rivers. This number
assumes perfect co-ordination of flows between the Murray and tributary flows, something which is highly
unlikely. This is why the levels of constraints relaxation assumed in constraints relaxed modelling done by the
MDBA in 2012 are those most likely to achieve the outcomes in schedule 5 of the Basin Plan (2012).

35
Appendix D – Basin Watering Strategy expected outcomes potentially no longer
possible within current operational flow constraints
Table 10 Summary of quantified environmental expected outcomes that can be achieved beyond 2019.
River flows and connectivity
Vegetation Waterbirds Fish
Improve connections along rivers and between rivers and their floodplains
Maintain the extent and improve the condition
Maintain current species diversity, improve breeding success and numbers
Maintain current species diversity, extend distributions, improve breeding success and numbers
Maintained base flows: at least 60% of natural levels
Improved overall flow: 10% more into the Barwon–Darling 30% more into the River Murray 30–40% more to the Murray mouth
(and it open to the sea 90% of the time)
Maintained connectivity in areas where it is relatively unaffected: between rivers and floodplains in
the Paroo, Moonie, Nebine, Warrego and Ovens
Improved connectivity with bank-full and/or low floodplain flows: by 30–60% in the Murray,
Murrumbidgee, Goulburn and Condamine–Balonne
by 10–20% in remaining catchments
Maintain the Lower Lakes above sea level
Maintenance of the current extent of: about 360,000 hectares
of river red gum; 409,000 ha of black box; 310,000 ha of coolibah forest and woodlands; and existing large communities of lignum
non-woody communities near or in wetlands, streams and on low-lying floodplains
Maintain the current condition of lowland floodplain forests and woodlands of: river red gum black box coolibah
Improved condition of: southern river red gum
Maintained current species diversity of: all current Basin
waterbirds current migratory
shorebirds at the Coorong
Increased abundance: 20–25% increase in
waterbirds by 2024
Improved breeding: up to 50% more breeding
events for colonial nesting waterbird species
a 30–40% increase in nests and broods for other waterbirds
Improved distribution: of key short and long-lived
fish species across the Basin
Improved breeding success for: short-lived species (every 1–2
years) long-lived species in at least
8/10 years at 80% of key sites
mulloway in at least 5/10 years
Improved populations of: short-lived species (numbers
at pre-2007 levels) long-lived species (with a
spread of age classes represented)
Murray cod and golden perch (10–15% more mature fish at key sites)
Improved movement: more native fish using fish
passages

36
Appendix E – Analysis using four wetness classes instead of three
Figure 23: Average annual wetness scores calculated using actual inflow and storage data from 1970-2018 using
four wetness classes (quartiles).
Figure 24: Average annual flow to South Australia values comparing observed river flows from 2010-2018 against
modelled Basin Plan flows during years with the same wetness score. Upstream water availability drivers are split
into four classes.

37
Figure 25: Average annual Wilcannia flow values comparing observed river flows from 2010-2018 against
modelled Basin Plan flows during years with the same wetness score. Upstream water availability drivers are split
into four classes.
Figure 26: Average annual Wilcannia flow values comparing observed river flows from 2010-2018 against
modelled Basin Plan flows during years with the same wetness score. Upstream water availability drivers are split
into four classes (zoomed to drier water availability).