water footprint assessment - esagua€¦ · water footprint assessment. ... supply-chain thinking...
TRANSCRIPT

Water footprint assessmentEvolution of the field and challenges for business
Arjen Y. Hoekstra | www.ayhoekstra.nl

2002 Introduction of the concept & 1st global water footprint assessment2004 2nd global water footprint assessment
2007 Start uptake of the concept by companies, ngo’s, govt’s2008 Foundation of the Water Footprint Network
2011 Publication of the Global Water Footprint Assessment Standard2012 3rd global water footprint assessment2013 Launch of online Water Footprint Assessment Tool
2016 Global water scarcity assessment
Water footprint history
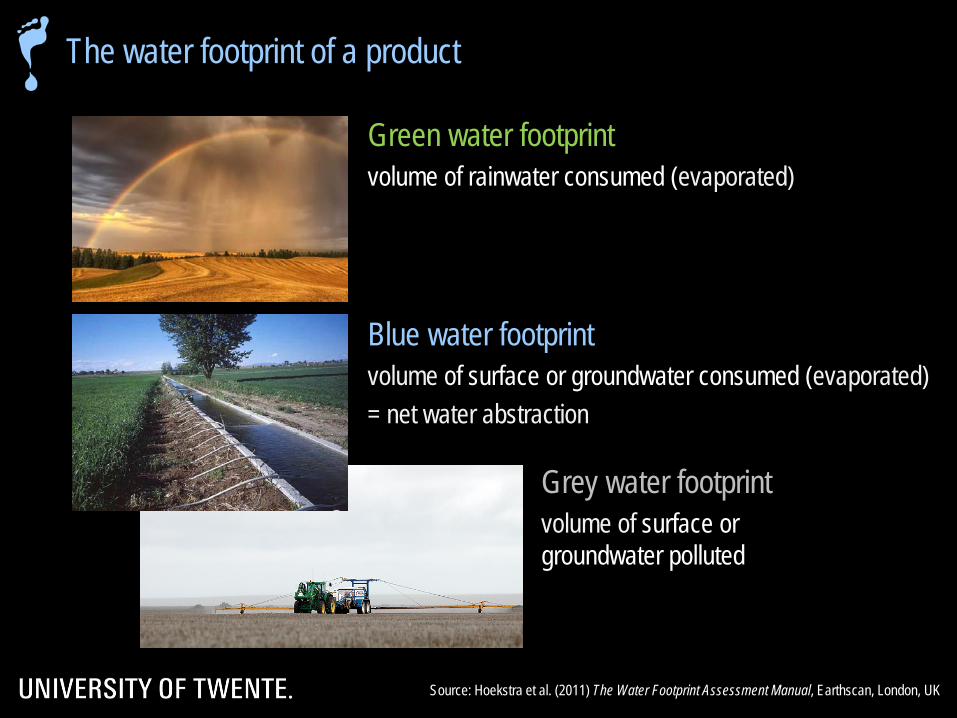
Blue water footprintvolume of surface or groundwater consumed (evaporated)= net water abstraction
The water footprint of a product
Source: Hoekstra et al. (2011) The Water Footprint Assessment Manual, Earthscan, London, UK
Grey water footprintvolume of surface or groundwater polluted
Green water footprintvolume of rainwater consumed (evaporated)

Direct water footprint Indirect water footprint
Green water footprint Green water footprint
Blue water footprint Blue water footprint
Grey water footprint Grey water footprint
Waterconsumption
Water pollution
Gross water withdrawal
Traditionalwater usestatistics
Components of a water footprint
Source: Hoekstra et al. (2011) The Water Footprint Assessment Manual, Earthscan, London, UK
Return flow= Net water withdrawal

Precipitationin a catchment
Environmentalwater needs
Evapotranspiration(green water)
Maximum sustainableGreen WF
Maximumsustainable
blue WF
Environmental water needs
Green wateravailability
Blue wateravailability
Runoff(blue water)
The maximum sustainable green and blue water footprintin relation to the water balance of a catchment area

The green and blue water footprint of growing a crop
WF (m3/kg) =ET (m3/ha)
Crop yield Y (kg/ha)
Measurede.g. statistics
ET over the growing period
Estimatede.g. water balance model
Measurede.g. lysimeter
Estimatede.g. crop growth model

Process
Load = OUT- IN
Substance intake (IN)= Water abstraction volume × cact
Substance output (OUT)= Effluent volume ×ceffl
Freshwater body
Grey water footprint
Source: Hoekstra et al. (2011) The Water Footprint Assessment Manual, Earthscan, London, UK
Critical load = Renewal rate × (cmax - cnat)
Grey water footprint = (Load / Critical load) × Renewal rate
= Load / (cmax - cnat)

The grey water footprint of growing a crop
Grey WF per hectare (m3/ha/y) =Load (kg/ha/y)
(cmax – cnat) (kg/m3)
Grey WF per unit crop (m3/kg) =Grey WF (m3/ha/y)
Y (kg/ha/y)
Leaching or runoff of fertilizer or pesticide to
ground- or surface water

Footprint accounting over supply chains
Source: Hoekstra and Wiedmann (2014) Humanity’s unsustainable environmental footprint, Science

The relation between footprints of different entities
Source: Hoekstra and Wiedmann (2014) Humanity’s unsustainable environmental footprint, Science

Consumption
Export
Production
=+Internalwater
footprint
Water footpr. of national
consumption
External water
footprint
Virtual water budget=
=
+
++ +
= =
=+Virtualwaterexport
Water usefor export
Virtual water import for re-
export
Water footprint
within nation
Virtualwaterimport
Import
National water footprint accounting framework
Source: Hoekstra et al. (2011) The Water Footprint Assessment Manual, Earthscan, London, UK

The average water footprint of a consumer in Spain
Source: Mekonnen & Hoekstra (2011)National Water Footprint Accounts, UNESCO-IHE.
6700 litre/day

WEF’s Global Risk Report 2016
Sustainability of water useWater use efficiencyFair sharing of waterResource security

Source: Mekonnen & Hoekstra (2016)
The blue water footprint of humanity: not sustainable
Blue water scarcity = blue WF / maximum sustainable blue WF
We need to agree on water footprint caps per river basin (specified per month)

Water pollution level = grey WF / maximum sustainable grey WF
Source: Mekonnen & Hoekstra (2015)
The grey water footprint of humanity: not sustainable
Nitrogen

Water pollution level = grey WF / maximum sustainable grey WF
Source: Mekonnen & Hoekstra (2016)
The grey water footprint of humanity: not sustainable
Phosphorus

The water footprint of humanity: not efficient
Spatial differences in the water footprint of wheat
Reduction of water footprints of crops to benchmark levels set by the best 25% of global production,will result in a global water saving of 40%.
Source: Mekonnen & Hoekstra (2014)

Global average water footprint
The water footprint of humanity: not fairly distributed
Source: Hoekstra & Mekonnen (2012) The Water Footprint of Humanity, PNAS

The need for contraction and convergence
Source: Hoekstra (2014) Wise freshwater allocation, UNESCO-IHE

40% of the water footprint of European consumers is outside Europe
soybeancoffee
soybeanwheat
cotton
cotton,industrialproducts
wheat, sunflower seed, cotton, industrial products
soybean,sunflower seed
cottoncoffee
cocoa
cotton
Source: Hoekstra & Mekonnen (2012) The Water Footprint of Humanity, PNAS
The water footprint of humanity: international dependencies
Example European Union

Most of Spain’s unsustainable blue WF islocated in Spain itself, but also in other countries
Source: Hoekstra & Mekonnen (2016)
77% of Spain's global blue WF is in places where WF > Maximum Sustainable WF
Spain
IndiaPakistan
The sustainability of Spain’s global blue water footprint
USA
Morocco
TurkeyFrance
Portugal

Blue water footprint vs. blue water availability
Blue water scarcity
Severe
SignificantModerateLow
Share of natural runoff not consumed
Guadiana basin (Spain)
Environmentalflow requirement
The blue water footprint exceeds blue water availability from May to November.

Water risks for business• Physical risk• Reputational risk• Regulatory risk• Financial risk
Water opportunity for business• frontrunner advantage• corporate image
Corporate social responsibility
Water footprint: why businesses are interested

• From focus on own operations to supply-chain thinking
• From focus on water withdrawals toconsidering consumptive water use
• From securing the ‘right to abstract’ toassessing the actual sustainability of water consumption
• From meeting ‘emission permits’ toassessing the company’s actual contribution to pollution
Water footprint: what’s new for business

Developing a corporate sustainability strategy
Source: White et al. (2014)

Water Footprint Assessment – Examples from business
Jain Irrigation, IndiaWater supply technology
CocaCola, SABMiller, Unilever, NestléFood & Beverage
TATASteel, Automotive, Chemicals, Power
UPMPulp & Paper
C&AApparel

The water footprint of soy milk
Source: Ercin et al. (2012)

The water footprint of soy milk
Source: Ercin et al. (2012)

The water footprint of tea and margarine – Unilever
Source: Jefferies et al. (2012)

The water footprint of tea and margarine – Unilever
Source: Jefferies et al. (2012)

0
50
100
150
200
250
300
350
Net
herla
nds
Fran
ce
Spa
in
Italy
US
A
Rus
sia
Iran
Per
u
US
A
Bra
zil
Indi
a
Pak
ista
n
Cub
a
Fran
ce
US
A
Chi
na
Indi
a
Grey WF
Blue WF
Green WFWat
er fo
otpr
int o
f 0.5
litre
PET
-bot
tle c
ola
(litre
) Cola based on beet sugar Cola based on cane sugarCola basedon HFMS
The water footprint of a 0.5-litre PET bottle cola depending on type and origin of sugar
Source: Hoekstra (2013) The Water Footprint of Modern Consumer Society, Routledge, London, UK

The two separate worlds of water and energy
► The water sector is becoming more energy-intensive
- desalination- pumping deeper groundwater- large-scale (inter-basin) water transfers
► The energy sector is becoming more water-intensive
- shale oil & gas (fracking)- tar sands & oil / kerogen shales- biomass
Source: Hoekstra (2013) The Water Footprint of Modern Consumer Society, Routledge, London, UK

Source: Mekonnen & Hoekstra (2011)
The water efficiency of biofuels

The water efficiency of electricity
Source: Mekonnen, Gerbens-Leenes & Hoekstra (2015)
? ?from fossilto renewable energy

The water footprint of electricity in 2035 – IEA scenarios
Source: Mekonnen, Gerbens-Leenes & Hoekstra (2016)
0
5
10
15
20
25
0
200
400
600
800
1000
1200
1400
1600
Reference (2010) Current policiesscenario
New policiesscenario
450 scenario Efficient worldscenario
Adapted 450scenario
CO
2em
issi
ons
(bill
ion
tonn
e/y)
Con
sum
ptiv
e W
F re
late
d to
ele
ctric
ity a
nd h
eat p
rodu
ctio
n (b
illio
n m
3 /y)
Hydropower Firewood Coal and lignite Nuclear Natural gasOil Geothermal Solar Wind CO2 emissions

► water footprint caps by river basin
► water footprint benchmarks by product
► best available technology and practice► water disclosure► product transparency
► fair water footprint shares by consumer
► national water footprint reduction targets
► coherence between water – energy – food – trade strategies
Wise water governance

Target 6.4Water-use efficiency & water scarcity
Efficiency indicatorper process/product
Sustainability indicatorper river basin
Grey water footprintvs.
benchmark
Consumptive water footprintvs.
benchmark
Total grey water footprintvs.
Maximum sustainable grey WF
Total blue water footprintvs.
Maximum sustainable blue WF
Target 6.3Water pollution
Sustainable development goals – measuring progress

Mission: Promoting sustainable, equitable and efficient water use through development of shared standards on water footprint accounting and guidelines for the reduction and offsetting of impacts of water footprints.
Network: bringing together expertise from academia, businesses, civil society, governments and international organisations.
www.waterfootprint.org
The Water Footprint Network

University of TwenteUNESCO-IHE Institute for Water EducationWorld Business Council for Sustainable DevelopmentInternational Finance Corporation (World Bank Group)WWF – the global conservation organizationWater Neutral FoundationNetherlands Water Partnership
The Water Footprint Network – founding partners (2008)

The Coca-Cola Company UnileverNestléSABMillerAlliance for Water StewardshipGlobal Footprint NetworkThe Nature ConservancyPacific InstituteSwiss Federal Institute of Aquatic Science and TechnologyU.S. Agency for International Development
The Water Footprint Network – first partners joining after launch

• universities & research institutions • governmental institutions • non-governmental organisations • large companies • medium and small companies• sector/branch organisations • consultants• accountants• international institutions
The Water Footprint Network – partners from all continents

www.waterfootprint.org
Water Footprint Assessment Tool

More info: www.ayhoekstra.nlTwitter @AYHoekstra