water intake, water balance, and the elusive daily water ... · nutrients review water intake,...
TRANSCRIPT

nutrients
Review
Water Intake, Water Balance, and the Elusive DailyWater Requirement
Lawrence E. Armstrong 1 and Evan C. Johnson 2,*1 University of Connecticut, Human Performance Laboratory and Department of Nutritional Sciences,
Storrs CT 06269-1110, USA; [email protected] University of Wyoming, Human Integrated Physiology Laboratory, Division of Kinesiology and Health,
Laramie, WY 82071, USA* Correspondence: [email protected]; Tel: +307-766-5282
Received: 13 October 2018; Accepted: 27 November 2018; Published: 5 December 2018�����������������
Abstract: Water is essential for metabolism, substrate transport across membranes, cellular homeostasis,temperature regulation, and circulatory function. Although nutritional and physiological researchteams and professional organizations have described the daily total water intakes (TWI, L/24h) andAdequate Intakes (AI) of children, women, and men, there is no widespread consensus regarding thehuman water requirements of different demographic groups. These requirements remain undefinedbecause of the dynamic complexity inherent in the human water regulatory network, which involvesthe central nervous system and several organ systems, as well as large inter-individual differences.The present review analyzes published evidence that is relevant to these issues and presents a novelapproach to assessing the daily water requirements of individuals in all sex and life-stage groups, as analternative to AI values based on survey data. This empirical method focuses on the intensity of a specificneuroendocrine response (e.g., plasma arginine vasopressin (AVP) concentration) employed by the brainto regulate total body water volume and concentration. We consider this autonomically-controlledneuroendocrine response to be an inherent hydration biomarker and one means by which the brainmaintains good health and optimal function. We also propose that this individualized method defines theelusive state of euhydration (i.e., water balance) and distinguishes it from hypohydration. Using plasmaAVP concentration to analyze multiple published data sets that included both men and women,we determined that a mild neuroendocrine defense of body water commences when TWI is <1.8 L/24h,that 19–71% of adults in various countries consume less than this TWI each day, and consuming lessthan the 24-h water AI may influence the risk of dysfunctional metabolism and chronic diseases.
Keywords: water-electrolyte balance; drinking water; body water; water restriction
1. Introduction
Individuals with a normal POSM (e.g., 285–295 mOsm/kg) may be considered to be normallyhydrated without regard to daily total water intake (TWI; [1]) or urinary biomarkers [2] becausethe brain actively regulates both total body water volume (within 0.5% day-to-day; [3]) and bloodconcentration (within a normal POSM range of 285–295 mOsm/kg; [4]) across a wide range of TWI(women, 1.3–6.1; men, 1.7–7.9 L/24h; [5,6]). Thus, an individual with suboptimal water intake maybe evaluated to be euhydrated due to the defense of POSM through reduced urine production andother compensatory responses. However, there is no widespread consensus regarding a definitionof euhydration. For example, the 2004 U.S. National Academy of Medicine (NAM) publication,which presented dietary reference intakes for water [6], included a lengthy review of water balancestudies and water needs (i.e., using the stable isotope of water D2O) of children and adults (Table 1).However, this report concluded that: (a) individual water requirements can vary greatly on a
Nutrients 2018, 10, 1928; doi:10.3390/nu10121928 www.mdpi.com/journal/nutrients

Nutrients 2018, 10, 1928 2 of 25
day-to-day basis because of differences in physical activity, climates, and dietary contents; and (b) thereis no single daily water requirement for a given person. As a result, Adequate Intake (AI) volumes forwater (i.e., which are not daily water requirements) were developed from median TWI values in theNHANES III survey database [5]. The 2010 European Food Safety Authority (EFSA) panel utilizeda different approach when developing dietary reference intakes [7]. Water AI values for variouslife-stage groups (Table 1) were derived from three factors: observed intakes of European populationgroups, desirable urine osmolality values, and desirable TWI volumes per unit of dietary energy (Kcal)consumed. Similar to the NAM report (above), however, the EFSA report stated that a single waterintake cannot meet the needs of everyone in any population group because the individual need forwater is related to caloric consumption, the concentrating-diluting capacities of the kidneys, and waterlosses via excretion and secretion. This report defined the minimum water requirement in generalterms as the amount of water that equals water losses and prevents adverse effects of insufficient watersuch as dehydration.
Table 1. Comparison of recommended Adequate Intakes a for water, published by European andAmerican health organizations.
Life Stage & Sex Age European Food Safety Authority,Parma, Italy b 2010 (ml/day)
National Academy of Medicine,USA 2004 b (ml/day)
Infants0–6 months 680 via milk 700
6–12 months 800–1,000 800
Children
1–2 years 1100-1200 13002–3 years 13004–8 years 1600 1700
9–13 years, boys 2100 24009–13 years, girls 1900 2100
14–18 years, boys 2500 330014–18 years, girls 2000 2300
AdultsMen 2500 3700Women 2000 2700
Pregnant Women ≥ 19 year 2300 3000Lactating Women ≥ 19 year 2600–2700 3800
Elderly same as adults same as adultsa Adequate Intakes represent an amount that should meet the needs of almost everyone in a specific life-stage groupwho is healthy, consumes an average diet, and performs moderate levels of physical activity [6,7]; b, values refer tototal water intake (TWI = plain water + beverages + food moisture).
Neither the NAM nor the EFSA document presented a method to assess the human waterrequirement of individuals, or (b) neuroendocrine data to support daily AI values for water. However, itis widely accepted that the brain constantly acts to preserve homeostasis via neuroendocrine responseswhich defend set points of body water volume and concentration [8]. In contrast to the methodsused in the NAM and EFSA reports, we propose that minimal/baseline fluid-electrolyte regulatoryresponses by the brain signal body water balance (i.e., euhydration), and that increased neuroendocrineresponses (e.g., plasma AVP levels) represent the threshold at which the brain begins to defend bodywater volume and concentration (i.e., hypohydration). This is important because no measurement orbiomarker has previously been proposed to define a state of euhydration (i.e., often defined loosely asnormal total body water or water balance). Furthermore, we propose that neuroendocrine thresholds,in conjunction with TWI measurements, can reveal the water intake requirement of individuals in aspecific life-stage group when the turnover of body water (e.g., intake versus loss) is relatively constant(i.e., no large activity-induced sweat loss), an average diet is consumed, and ample water is availableto support ad libitum drinking. Sedentary adults whose free-living daily activities include workingin an air-conditioned office and consuming a typical Western diet represent an example of such agroup. We propose this individualized physiological measurement of neuroendocrine responses as amethodological alternative to AI values (Table 1).

Nutrients 2018, 10, 1928 3 of 25
Thus, the primary purpose of the present manuscript is not to modify current AIs but ratherto provide novel additional perspectives regarding 24-h TWI, euhydration, and human waterrequirements. We have analyzed the relationship between 24-h TWI values and their correspondingplasma AVP levels from multiple research studies, and identified a plasma AVP concentration thatapproximates the neuroendocrine response threshold for water regulation in free-living adults.Interestingly, this AVP threshold is exceeded when 24-h TWI is <1.8 L/24h. The second purposeof the present manuscript is to increase awareness of the importance of daily water intake, because aconsiderable percentage of individuals in industrialized countries consume less than the 24-h water AIthat is recommended for their life stage. Evidence for this purpose exists in a growing body of recentepidemiological studies that report statistically significant relationships between chronic low dailywater consumption and disease states or metabolic dysfunction.
Because methods and terminology vary across publications, we emphasize the followingimportant definitions. The term water in beverages refers to water + water in all other fluids (e.g., juice,tea, coffee, milk). The term total water intake refers to water + water in beverages + food moisture(e.g., fruit, soup). Distinct from the term dehydration (i.e., the process of losing water), the termhypohydration is presently defined as a steady-state condition of reduced total body water.
2. Representative Research Evidence
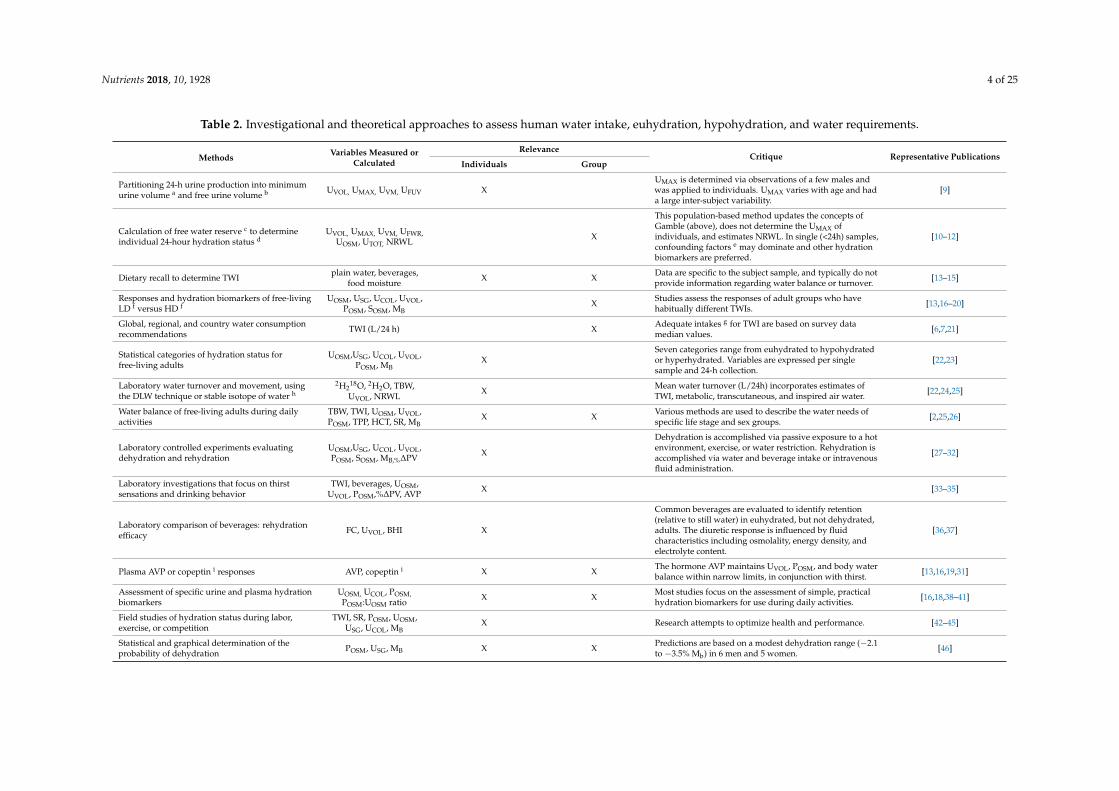
As shown in Table 2, a variety of methods and theoretical approaches have influenced our presentunderstanding and theories regarding human water intake, euhydration, hypohydration, and waterrequirements. The range of measured or calculated variables includes dietary macronutrients, 24-h TWI(defined above), biomarkers of hydration status, water volumes (i.e., consumed, metabolized, excreted,turnover), and fluid-electrolyte regulating hormones. Not all these methods (column 1, Table 2) havecontributed in meaningful ways to organizational recommendations regarding the daily water intakerequired for good health (Table 1). For example, the NAM recommendations [6] include considerationof large non-renal water losses via sweating, during labor or physical activity. This is a primaryreason why 24-h TWI recommendations from European and U.S. organizations differ by 1.1–1.3 L/24h,in specific life stage and sex categories (Table 1). Table 3 describes eight components of 24-h waterbalance, shown as the headings for columns 2-9. All these components interact with each other ina network that includes the central nervous system (CNS), oropharyngeal region, gastrointestinaltract, kidneys, neuroendocrine system, cardiovascular system, skin, and respiratory organs; feedbackfrom one organ system affects all others, directly and/or indirectly. The components of 24-h waterbalance in Table 3 have contributed to international recommendations regarding the daily water intakerequired for good health (Table 1). For example, the NAM recommendations [6] assimilated all waterbalance components in Table 3, and the recommendations of the EFSA (2010) [7] emphasized bothdesirable urine osmolality values and the observed TWI of specific groups.
A review of the hundreds of publications that contributed to our understanding of human waterintake, euhydration, hypohydration, and water requirements is beyond the scope of this manuscript.However, the mean values (Table 3), measured variables, and reference citations (Tables 2 and 3),although not exhaustive, represent the nature and types of meaningful available evidence regardinghuman water needs.
Nutrients 2018, 10, 1928 4 of 25
Table 2. Investigational and theoretical approaches to assess human water intake, euhydration, hypohydration, and water requirements.
Methods Variables Measured orCalculated
RelevanceCritique Representative Publications
Individuals Group
Partitioning 24-h urine production into minimumurine volume a and free urine volume b UVOL, UMAX, UVM, UFUV X
UMAX is determined via observations of a few males andwas applied to individuals. UMAX varies with age and hada large inter-subject variability.
[9]
Calculation of free water reserve c to determineindividual 24-hour hydration status d
UVOL, UMAX, UVM, UFWR,UOSM, UTOT, NRWL X
This population-based method updates the concepts ofGamble (above), does not determine the UMAX ofindividuals, and estimates NRWL. In single (<24h) samples,confounding factors e may dominate and other hydrationbiomarkers are preferred.
[10–12]
Dietary recall to determine TWI plain water, beverages,food moisture X X Data are specific to the subject sample, and typically do not
provide information regarding water balance or turnover. [13–15]
Responses and hydration biomarkers of free-livingLD f versus HD f
UOSM, USG, UCOL, UVOL,POSM, SOSM, MB
X Studies assess the responses of adult groups who havehabitually different TWIs. [13,16–20]
Global, regional, and country water consumptionrecommendations TWI (L/24 h) X Adequate intakes g for TWI are based on survey data
median values. [6,7,21]
Statistical categories of hydration status forfree-living adults
UOSM,USG, UCOL, UVOL,POSM, MB
XSeven categories range from euhydrated to hypohydratedor hyperhydrated. Variables are expressed per singlesample and 24-h collection.
[22,23]
Laboratory water turnover and movement, usingthe DLW technique or stable isotope of water h
2H218O, 2H2O, TBW,UVOL, NRWL
X Mean water turnover (L/24h) incorporates estimates ofTWI, metabolic, transcutaneous, and inspired air water. [22,24,25]
Water balance of free-living adults during dailyactivities
TBW, TWI, UOSM, UVOL,POSM, TPP, HCT, SR, MB
X X Various methods are used to describe the water needs ofspecific life stage and sex groups. [2,25,26]
Laboratory controlled experiments evaluatingdehydration and rehydration
UOSM,USG, UCOL, UVOL,POSM, SOSM, MB,%∆PV X
Dehydration is accomplished via passive exposure to a hotenvironment, exercise, or water restriction. Rehydration isaccomplished via water and beverage intake or intravenousfluid administration.
[27–32]
Laboratory investigations that focus on thirstsensations and drinking behavior
TWI, beverages, UOSM,UVOL, POSM,%∆PV, AVP X [33–35]
Laboratory comparison of beverages: rehydrationefficacy FC, UVOL, BHI X
Common beverages are evaluated to identify retention(relative to still water) in euhydrated, but not dehydrated,adults. The diuretic response is influenced by fluidcharacteristics including osmolality, energy density, andelectrolyte content.
[36,37]
Plasma AVP or copeptin i responses AVP, copeptin i X X The hormone AVP maintains UVOL, POSM, and body waterbalance within narrow limits, in conjunction with thirst. [13,16,19,31]
Assessment of specific urine and plasma hydrationbiomarkers
UOSM, UCOL, POSM,POSM:UOSM ratio X X Most studies focus on the assessment of simple, practical
hydration biomarkers for use during daily activities. [16,18,38–41]
Field studies of hydration status during labor,exercise, or competition
TWI, SR, POSM, UOSM,USG, UCOL, MB
X Research attempts to optimize health and performance. [42–45]
Statistical and graphical determination of theprobability of dehydration POSM, USG, MB X X Predictions are based on a modest dehydration range (−2.1
to −3.5% Mb) in 6 men and 5 women. [46]

Nutrients 2018, 10, 1928 5 of 25
Table 2. Cont.
Methods Variables Measured orCalculated
RelevanceCritique Representative Publications
Individuals Group
Calculated biological variation and diagnosticaccuracy of dehydrationbiomarkers
POSM, SOSM, UOSM, USG,UCOL, MB
X XStatistics evaluate biomarkers, on the basis of a functionallyimportant range of −2.0 to −7.0% Mb, induced in 5 womenand 13 men across x hours.
[47]
Theoretical consideration of intracellular andextracellular dehydration
PNa+, POSM, SOSM, UOSM,USG, UCOL, MB
X Candidate biomarkers of dehydration must considerintracellular, extracellular, and mixed dehydration stimuli. [48]
a, minimum urine volume corresponds to the urine volume necessary to excrete urine solutes at maximum urine osmolality (defined as 1400 mOsm/kg); b, free urine volume is a precursorto the modern concept of free water reserve (see Table 1); c, free water reserve is calculated statistically as the virtual water volume that could be additionally reabsorbed at maximumosmolality, in all but 2% to 3% of healthy subjects at a specific life stage and sex; d, collection of a 24-h urine sample, determination of urine volume and osmolality, and calculationof obligatory and free water volumes allow for the determination of individual 24-h hydration status, determined using statistical confidence intervals (Manz and Wentz, 2005 [11]);e, e.g., meal timing and contents, physical activity; f, LD and HD were defined slightly differently in each study (LD range, 1.0–1.6; HD range, 2.4–3.3 L/24h); g, adequate water intake isnot a requirement, but rather the TWI that meets the needs of almost everyone in a specific life stage and sex group, to prevent deleterious effects of dehydration (i.e., metabolic andfunctional abnormalities); h, the DLW method is theoretically based on the differential turnover kinetics of the stable isotopes of oxygen (18O) and hydrogen (2H). After drinking a knownmass of DLW (2H2
18O), 2H is eliminated from body water as H2O whereas 18O is eliminated as H2O and CO2 (Racette et al., 1994 [49]). The accumulation of a stable isotope of water(2H2O) in plasma, saliva, urine, or sweat determines the rate of water movement throughout the body. i, AVP is difficult to measure because of its brief half-life, whereas plasma copeptinis relatively stable and its concentration is strongly correlated to that of AVP. Abbreviations: AI, adequate intake; AVP, arginine vasopressin; DLW, doubly labeled water; HCT, hematocrit;HD, individuals who habitually consume a high daily water volume; LD, individuals who habitually consume a low daily water volume; MB, body mass; NRWL, non-renal water loss aseccrine sweat, transdermal, respiratory and stool water; SOSM, salivary osmolality; SR, sweat rate measured as MB change; TBW, total body water; TWI, total water intake = (plain water +water in beverages + food moisture); TOSM, tear osmolality; FC, fluid consumed during a defined time period; BHI, beverage hydration index, relative to water;%∆PV, percent change ofplasma volume; TPP, total plasma protein; UCOL, urine color [50]; UFUV, free urine volume; UFWR, free water reserve; UOSM, urine osmolality; UTOT, total excreted osmolar load; USG, urinespecific gravity; UVM, minimal urine volume; UVOL, urine volume; UMAX, maximal urine osmolality produced by the kidneys;.

Nutrients 2018, 10, 1928 6 of 25
Table 3. Dietary, physiological, metabolic, and behavioral components of human 24-h water balance.
Total water intake a
(L/24h)Intracellular metabolic
water production bTotal solute load c
(mOsm/24h)Urine osmolality d
(mOsm/kg)
Maximal renalconcentrating ability
(mOsm/kg)Urine volume (L/24h) Non-renal water
loss (L/24h) eFree water reserve f
(L/24h)
Functions andcharacteristics Contributes to TBW Product of human
metabolism
Metabolized anddigested productsexcreted in urine
Regulates TBW andECV-ICV osmolality
Inherent quality of thekidneys
Regulates TBW andECV-ICV osmolality
Excretory andsecretory processes
Calculated index ofeuhydration, based onpopulation statistics
Influential factors
Meal timing andcontents, idiosyncraticthirst, physical activity,body size, cultural andlearned preferences
Metabolic rate andsubstrates, physicalactivity, dietmacronutrient andenergy content, NESresponses
Metabolic products,dietary contents, bodysize, idiosyncratichunger, learned foodpreferences
TWI, MRCA, soluteload, NRWL, physicalactivity, NES responses
Life-stage group, maleor female sex
TWI, total solute load,NRWL, physicalactivity, NES responses
Diet, ventilatoryrate, physicalactivity, body size
TWI, total solute load,NRWL, physicalactivity
Organs involved GI, CNS, NES, mouthand throat CNS, NES GI, CNS, NES Kidneys, CNS, NES Kidneys, CNS, NES GI, kidneys, CNS, NES Skin, GI, respiratory
organs GI, kidneys, CNS, NES
Conscious orbehavioral influence?
Yes, habitual 24-h waterintake No Yes, solid food
consumptionYes, secondary to TWIand food contents No Yes, secondary to TWI
and food contents
Yes, eccrine sweatloss during labor orexercise
Yes, secondary to waterand food intake
Representative mean,median, or range ofvalues for sedentaryadults
♀, 1.8–2.0 and ♂, 1.9–2.4(FR, UK); ♀&♂, 1.5–2.5(13countries); ♀, 2.3(range: 0.8–4.5) (USA);♂, 3.0 (range: 1.4–7.7)and ♀, 2.5 (range:1.2–4.6) (USA); ♀, 1.9and ♂, 2.3 (GE); ♀&♂,0.2–3.9 (FR) L/24h
♀, 0.2–0.3; ♂, 0.3–0.4; ♂,0.4 L/24h
♀, 669–781 and ♂,915–992 (GE); ♂, 951(USA); ♀&♂, 362–1365(4 countries); ♂, 750(USA); ♀, 752 and ♂,941 (GE) mOsm/24h
♀&♂, 120–1250 (FR);♀&♂, 555 (UK)mOsm/kg
♀&♂, 1430 (UK)mOsm/kg; ♀&♂range,1100–1300 (GE); ♀&♂,1010–1330 (USA)
♀&♂, 0.2–3.9 (FR); ♀&♂,1.9 (n = 8, UK) L/24h
♂, 0.3–0.4 (UK); ♀,0.5–0.7 and ♂,0.7–1.3 (GE) L/24h
♀, 0.4–0.5 and ♂, 0.2–0.3(GE); ♀, 0.5 and ♂, 0.3(GE) L/24h
Reference citations [11,14,15,25,38,51] [25,52,53] [1,11,12,41] [38,54] [1,54,55] [38,54] [1,24] [11]
a, TWI, total water intake = (plain water + water in beverages + food moisture); b, water generated during substrate oxidation; c, greatly influenced by diet composition; d, in a 24-h sample;e, NRWL includes eccrine sweat, transdermal, respiratory and stool water losses; f, FWR = (24-h urine volume, L/day) − (obligatory urine volume, L/day). The latter term is the watervolume necessary to excrete the 24-h solute load, hypothetically calculated as (830 mOsm/kg) − (3–4 mOsm/kg per year > 20 years of age) [1]. Hydration status is inadequate if FWR isnegative. Abbreviations: TBW, total body water; NES, neuroendocrine system (central nervous system + hormones); ECV, extracellular volume; ICV, intracellular volume; MRCA, maximalrenal concentrating ability; CNS, central nervous system (brain + spinal cord); GI, gastrointestinal organs; GE, Germany; FR, France; USA, United States of America.

Nutrients 2018, 10, 1928 7 of 25
3. Why are Human Water Requirements Elusive?
To maintain normal physiological functions (e.g.., blood pressure, pH, internal body temperature)and optimal health, and to deliver essential substances (e.g., oxygen, water, glucose, sodium,potassium) to cells, the CNS and neuroendocrine hormones act constantly to preserve internalhomeostasis via a complex network of many organ and neural systems. Figure 1 presents severalCNS-regulated variables which are relevant to body water balance. Each of these variables issimultaneously: (a) maintained (i.e., within the circulatory system or fluid compartments of the body) ata specific set point (e.g., a threshold beyond which the intensity of neuroendocrine responses increases );and (b) constantly changing throughout the human life span in response to water and food intake, urineproduction, and non-renal water losses. Because of these fluctuations, human body water regulation isalso dynamic. Therefore, we utilize the phrase dynamic complexity to refer to a constantly changing,vastly integrated regulatory mechanism [56]. This dynamic complexity is amplified by interconnectedfluid compartments (i.e., intracellular, interstitial, extracellular, circulatory), organ systems (Table 3),neural plasticity (i.e., adaptations), and interactions of the physical processes (i.e., osmotic and oncoticpressure, simple diffusion, active transport) which govern water and electrolyte movements throughoutthe body.
Nutrients 2018, 10, x FOR PEER REVIEW 7 of 24
3. Why are Human Water Requirements Elusive?
To maintain normal physiological functions (e.g.., blood pressure, pH, internal body
temperature) and optimal health, and to deliver essential substances (e.g., oxygen, water, glucose,
sodium, potassium) to cells, the CNS and neuroendocrine hormones act constantly to preserve
internal homeostasis via a complex network of many organ and neural systems. Figure 1 presents
several CNS-regulated variables which are relevant to body water balance. Each of these variables is
simultaneously: (a) maintained (i.e., within the circulatory system or fluid compartments of the body)
at a specific set point (e.g., a threshold beyond which the intensity of neuroendocrine responses
increases ); and (b) constantly changing throughout the human life span in response to water and
food intake, urine production, and non-renal water losses. Because of these fluctuations, human body
water regulation is also dynamic. Therefore, we utilize the phrase dynamic complexity to refer to a
constantly changing, vastly integrated regulatory mechanism [56]. This dynamic complexity is
amplified by interconnected fluid compartments (i.e., intracellular, interstitial, extracellular,
circulatory), organ systems (Table 3), neural plasticity (i.e., adaptations), and interactions of the
physical processes (i.e., osmotic and oncotic pressure, simple diffusion, active transport) which
govern water and electrolyte movements throughout the body.
Figure 1. Variables that are regulated as part of body water homeostasis.
This dynamic complexity (Table 3, Figure 1) represents the primary reason why the daily water
requirements of humans have not been determined to this date (Table 1). We provide the following
evidence in support of this statement:
The relative influence of physiological processes which maintain water balance (Table 3) varies
with different life scenarios. During sedentary daily activities in a mild environment, renal
responses and thirst are the primary homeostatic regulators. During continuous-intermittent
labor, or prolonged exercise at low intensities (5–18h duration), renal responses and thirst have
minor-to-large effects on water regulation, whereas sweat loss presents the foremost challenge to
homeostasis [56].
Large between- and within-subject variances (i.e., of the variables in Table 3) make it difficult to
determine a water requirement for all persons within a life stage (Table 1). As an example, Figure
2 illustrates the large between-subject variance of habitual TWI that exists in healthy young
women (range, <1.0 to >4.5 L/24h) [13]. A large range of habitual TWI (0.6–5.2 L/24h) has also
been reported for women during pregnancy [57]. Similarly, the third National Health and
Nutrition Examination Survey [5] reported that the 1st decile and 10th decile of the mean TWI
were 1.7–7.9 L/24h for men (n = 3,091) and 1.3–6.1 L/24h for women (n = 2,801). An example of
large within-subject variability is also seen in the day-to-day differences of sweat losses that are
experienced by athletes [24]. Total sweat loss during sedentary work activity (e.g., 8h of computer
programming in an air-conditioned environment) may amount to <0.2 L/24h, whereas the total
sweat volume during a 164-km ultradistance cycling event often exceeds 9 L during a 9-h ride
[42].
Figure 1. Variables that are regulated as part of body water homeostasis.
This dynamic complexity (Table 3, Figure 1) represents the primary reason why the daily waterrequirements of humans have not been determined to this date (Table 1). We provide the followingevidence in support of this statement:
• The relative influence of physiological processes which maintain water balance (Table 3) varieswith different life scenarios. During sedentary daily activities in a mild environment, renalresponses and thirst are the primary homeostatic regulators. During continuous-intermittentlabor, or prolonged exercise at low intensities (5–18h duration), renal responses and thirst haveminor-to-large effects on water regulation, whereas sweat loss presents the foremost challenge tohomeostasis [56].
• Large between- and within-subject variances (i.e., of the variables in Table 3) make it difficultto determine a water requirement for all persons within a life stage (Table 1). As an example,Figure 2 illustrates the large between-subject variance of habitual TWI that exists in healthyyoung women (range, <1.0 to >4.5 L/24h) [13]. A large range of habitual TWI (0.6–5.2 L/24h) hasalso been reported for women during pregnancy [57]. Similarly, the third National Health andNutrition Examination Survey [5] reported that the 1st decile and 10th decile of the mean TWIwere 1.7–7.9 L/24h for men (n = 3,091) and 1.3–6.1 L/24h for women (n = 2,801). An example oflarge within-subject variability is also seen in the day-to-day differences of sweat losses that areexperienced by athletes [24]. Total sweat loss during sedentary work activity (e.g., 8h of computerprogramming in an air-conditioned environment) may amount to <0.2 L/24h, whereas the totalsweat volume during a 164-km ultradistance cycling event often exceeds 9 L during a 9-h ride [42].

Nutrients 2018, 10, 1928 8 of 25
• The 24-h human water requirement varies with anthropomorphic characteristics, especially bodymass. Large individuals require a greater daily TWI than small individuals [6].
• The daily water requirement of any life-stage group is influenced by dietary sodium, protein andtotal solute load, due to individual dietary preferences as well as traditional regional-culturalfoods. For example, large differences of mean urine osmolality (UOSM) have been reportedfor residents of Germany (860 mOsm/kg) and Poland (392 mOsm/kg). These differences areinfluenced by unique regional customs involving beverages (i.e., water, beer, wine) and fooditems [1] and the moisture content of solid foods; the latter factor varies among countries anddemographic groups: the United States, 20–35% [2,51,58,59]; Germany, 27% [10]; the UnitedKingdom, 24–28%; and France, 35–38% [14].
• The principle that both water and beverages contribute to rehydration and the maintenanceof body water has been fundamental in publications involving large populations [11,25], TWIdifferences in various countries [14,15], habitual low and high TWI consumers [16,17], waterAI recommendations [6,7], the health effects of beverage consumption [60], young versus olderadults [61], 12-h or 24-h water restriction [62,63], and experimental interventions which controland modify daily total water intake and beverage types [13,17,36,64]. However, small differencesexist in the percentage of water retained (4-h post consumption), primarily due to beverageosmolality and the content of sodium chloride, protein, and/or energy [36,37].
• Intracellular water volume (~28 L in a 70 kg male) is considerably larger than extracellular watervolume (~14 L) [65]. No hydration assessment technique measures intracellular water content orconcentration directly [27].
• Although some authorities consider plasma osmolality (POSM) to be the best index of euhydrationand hypohydration [2,6], POSM does not assess whole-body hydration validly in all settings,especially when TBW, water intake, and water loss are fluctuating [66]. Furthermore, POSM
may not reflect widely accepted physiologic principles, as shown by decreased POSM (6 out of39 subjects) after losing 3–8% of body mass via sweating [67], and increased POSM at rest (4 out of30 values) 60 min after ingesting 500 ml of water [68]. These findings likely result from the largebetween- and within-subject variance that exists in POSM measurements [56].
• Arginine vasopressin (AVP) is the body’s primary water-regulating hormone. It functions tomaintain body water balance by keeping POSM within narrow limits and allowing the kidneys toalter water excretion in response to the body’s needs, in conjunction with thirst [69]. Dehydrationof a large enough volume to result in increased POSM is a stimulus for the release of AVP. Table 4summarizes research publications that determined the plasma osmotic threshold (i.e., set point)for increased plasma AVP; most of these studies employed intravenous hypertonic saline infusionswith serial blood samples. Across these studies, the mean osmotic threshold values range from280–288 and individual values range from 276–291 mOsm/kg. This large range of POSM valuesillustrates dynamic complexity, in that the network of fluid-regulatory functions, and watermovements between fluid compartments differ across experimental designs and between normalsubjects (see column 1, Table 4). Table 5 further describes the complexity of AVP, in terms of itsbiological functions, factors that influence neurohypohysial AVP release, and diseases which arerelated to AVP dysfunction.
• Thirst is the primary means by which humans sense dehydration and hypohydration.Several factors influence the onset of thirst, including blood pressure, blood volume, AVP, andangiotensin II [8]. The primary stimulus for thirst, however, is POSM. Table 6 summarizes researchstudies which determined the plasma osmotic threshold for the appearance of thirst. Across thesestudies, the mean osmotic threshold values range from 286–298 and individual values range from276–300 mOsm/kg. As with AVP (see previous item), this large range of POSM values illustratesdynamic complexity, in that the network of fluid-regulatory functions and water movementsbetween fluid compartments differ across experimental designs and among normal subjects(Table 6). This range of POSM values also may explain part of the range in habitual TWI (Figure 2).
Nutrients 2018, 10, 1928 9 of 25
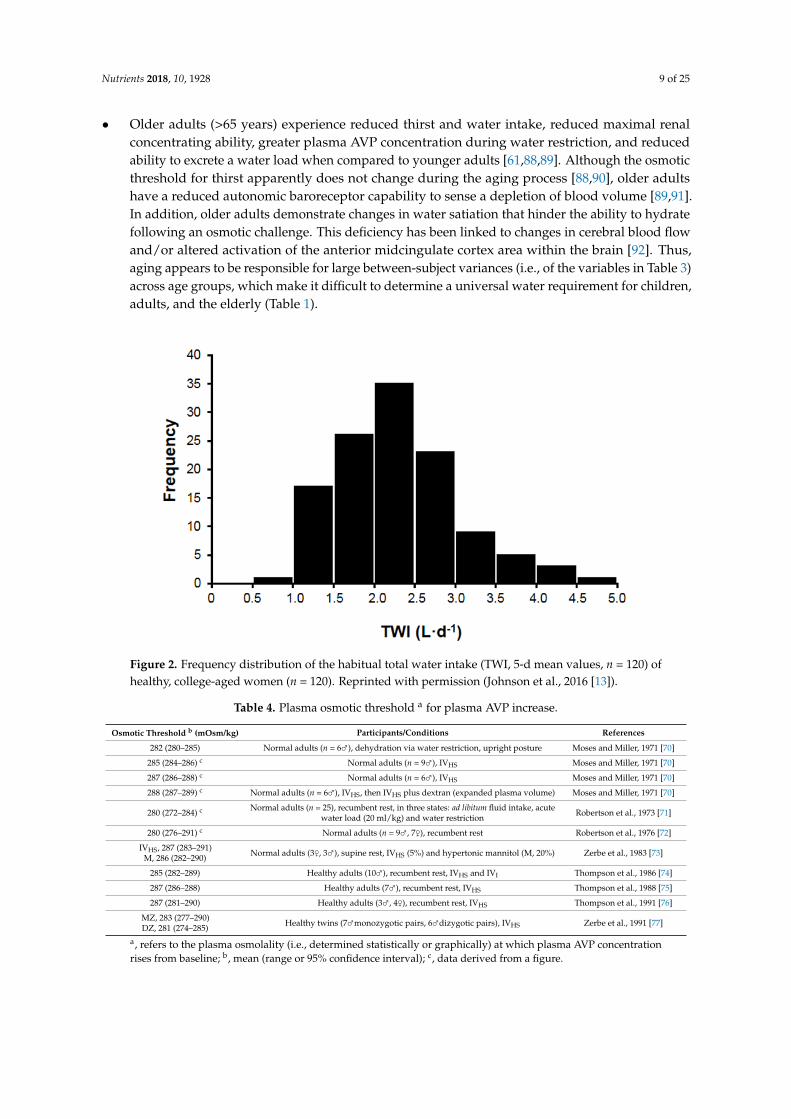
• Older adults (>65 years) experience reduced thirst and water intake, reduced maximal renalconcentrating ability, greater plasma AVP concentration during water restriction, and reducedability to excrete a water load when compared to younger adults [61,88,89]. Although the osmoticthreshold for thirst apparently does not change during the aging process [88,90], older adultshave a reduced autonomic baroreceptor capability to sense a depletion of blood volume [89,91].In addition, older adults demonstrate changes in water satiation that hinder the ability to hydratefollowing an osmotic challenge. This deficiency has been linked to changes in cerebral blood flowand/or altered activation of the anterior midcingulate cortex area within the brain [92]. Thus,aging appears to be responsible for large between-subject variances (i.e., of the variables in Table 3)across age groups, which make it difficult to determine a universal water requirement for children,adults, and the elderly (Table 1).Nutrients 2018, 10, x FOR PEER REVIEW 8 of 24
Figure 2. Frequency distribution of the habitual total water intake (TWI, 5-d mean values, n = 120) of
healthy, college-aged women (n = 120). Reprinted with permission (Johnson et al., 2016 [13]).
The 24-h human water requirement varies with anthropomorphic characteristics, especially body
mass. Large individuals require a greater daily TWI than small individuals [6].
The daily water requirement of any life-stage group is influenced by dietary sodium, protein and
total solute load, due to individual dietary preferences as well as traditional regional-cultural
foods. For example, large differences of mean urine osmolality (UOSM) have been reported for
residents of Germany (860 mOsm/kg) and Poland (392 mOsm/kg). These differences are
influenced by unique regional customs involving beverages (i.e., water, beer, wine) and food
items [1] and the moisture content of solid foods; the latter factor varies among countries and
demographic groups: the United States, 20–35% [2,51,58,59]; Germany, 27% [10]; the United
Kingdom, 24–28%; and France, 35–38% [14].
The principle that both water and beverages contribute to rehydration and the maintenance of
body water has been fundamental in publications involving large populations [11,25], TWI
differences in various countries [14,15], habitual low and high TWI consumers [16,17], water AI
recommendations [6,7], the health effects of beverage consumption [60], young versus older
adults [61], 12-h or 24-h water restriction [62,63], and experimental interventions which control
and modify daily total water intake and beverage types [13,17,36,64]. However, small differences
exist in the percentage of water retained (4-h post consumption), primarily due to beverage
osmolality and the content of sodium chloride, protein, and/or energy [36,37].
Intracellular water volume (~28 L in a 70 kg male) is considerably larger than extracellular water
volume (~14 L) [65]. No hydration assessment technique measures intracellular water content or
concentration directly [27].
Although some authorities consider plasma osmolality (POSM) to be the best index of euhydration
and hypohydration [2,6], POSM does not assess whole-body hydration validly in all settings,
especially when TBW, water intake, and water loss are fluctuating [66]. Furthermore, POSM may
not reflect widely accepted physiologic principles, as shown by decreased POSM (6 out of 39
subjects) after losing 3–8% of body mass via sweating [67], and increased POSM at rest (4 out of 30
values) 60 min after ingesting 500 ml of water [68]. These findings likely result from the large
between- and within-subject variance that exists in POSM measurements [56].
Arginine vasopressin (AVP) is the body’s primary water-regulating hormone. It functions to
maintain body water balance by keeping POSM within narrow limits and allowing the kidneys to
alter water excretion in response to the body’s needs, in conjunction with thirst [69]. Dehydration
Figure 2. Frequency distribution of the habitual total water intake (TWI, 5-d mean values, n = 120) ofhealthy, college-aged women (n = 120). Reprinted with permission (Johnson et al., 2016 [13]).
Table 4. Plasma osmotic threshold a for plasma AVP increase.
Osmotic Threshold b (mOsm/kg) Participants/Conditions References
282 (280–285) Normal adults (n = 6♂), dehydration via water restriction, upright posture Moses and Miller, 1971 [70]
285 (284–286) c Normal adults (n = 9♂), IVHS Moses and Miller, 1971 [70]
287 (286–288) c Normal adults (n = 6♂), IVHS Moses and Miller, 1971 [70]
288 (287–289) c Normal adults (n = 6♂), IVHS, then IVHS plus dextran (expanded plasma volume) Moses and Miller, 1971 [70]
280 (272–284) c Normal adults (n = 25), recumbent rest, in three states: ad libitum fluid intake, acutewater load (20 ml/kg) and water restriction Robertson et al., 1973 [71]
280 (276–291) c Normal adults (n = 9♂, 7♀), recumbent rest Robertson et al., 1976 [72]
IVHS, 287 (283–291)M, 286 (282–290) Normal adults (3♀, 3♂), supine rest, IVHS (5%) and hypertonic mannitol (M, 20%) Zerbe et al., 1983 [73]
285 (282–289) Healthy adults (10♂), recumbent rest, IVHS and IVI Thompson et al., 1986 [74]
287 (286–288) Healthy adults (7♂), recumbent rest, IVHS Thompson et al., 1988 [75]
287 (281–290) Healthy adults (3♂, 4♀), recumbent rest, IVHS Thompson et al., 1991 [76]
MZ, 283 (277–290)DZ, 281 (274–285) Healthy twins (7♂monozygotic pairs, 6♂dizygotic pairs), IVHS Zerbe et al., 1991 [77]
a, refers to the plasma osmolality (i.e., determined statistically or graphically) at which plasma AVP concentrationrises from baseline; b, mean (range or 95% confidence interval); c, data derived from a figure.

Nutrients 2018, 10, 1928 10 of 25
Table 5. Research findings that illustrate the dynamic complexity of AVP, a peptide hormone producedin the hypothalamus a.
Biological functions
Regulates body water and sodium homeostasis by acting on renal nephrons to decrease urine volume andincrease the concentration of urineMaintains plasma osmolality within narrow limitsEncourages vasodilation in vascular smooth muscle cells by inducing NO productionAffects liver metabolism (e.g., gluconeogenesis, glycogenolysis)Stimulates the pancreas to produce either insulin or glucagon, depending on blood glucose concentration
Factors which influence neurohypohysial AVP release and plasma AVP concentration
Plasma osmolalityAngiotensin IIOropharyngeal environmentWater restriction and consumptionOsmolar content of diet, especially sodiumHypoglycemiaBlood volume and pressureUpright postureEmotional stressExerciseCircadian rhythmicityHypoxiaNauseaPain
Diseases and disorders that involve AVP dysfunction
Diabetes insipidus and diabetes mellitusSyndrome of inappropriate ADH excess (SIADH)SepsisSevere bleeding, hemorrhageChronic hypernatremiaPrimary polydipsia syndrome, compulsive water drinkingKallmann’s syndromeAutosomal dominant polycystic kidney disease
a, compiled from: [69,72,78–86].
Table 6. Plasma osmotic threshold a for appearance of the thirst sensation.
Mean (Range b) OsmoticThreshold (mOsm/kg)
Participants/Conditions References
IVHS, 298 (294–300)M, 296 (290–299)
Normal adults (n = 2–5 ♂&♀), supine rest, IVHS (5%) andhypertonic mannitol (M, 20%) Zerbe et al., 1983 [73]
F, 297 (296–298)L, 293 (291–295)
Healthy women (n = 8) were tested in the follicular (F) andluteal (L) phases of the menstrual cycle, IVHS
Spruce et al., 1985 [87]
287 (286–288) Healthy males (n = 7), recumbent rest, IVHS Thompson et al., 1988 [75]
287 (282–291) Healthy adults (3♂, 4♀), recumbent rest, IVHS Thompson et al., 1991 [76]
MZ, 286 (276–293)DZ, 289 (283–296) Healthy twins (7♂monozygotic pairs, 6♂dizygotic pairs), IVHS Zerbe et al., 1991 [77]
a, refers to the plasma osmolality (i.e., determined statistically or graphically) at which thirst is first perceived; b,mean (range or 95% confidence interval); Abbreviations: IVHS, intravenous hypertonic saline; IVI, intravenousisotonic saline.
The preceding points of evidence exemplify the difficulties which the National Academy ofMedicine, USA, and the European Food Safety Authority faced and which prompted them to establishAdequate Intakes (AI), which are not Recommended Dietary Allowances (requiring a higher level ofevidence) or water requirements (Table 1). The NAM assumed the TWI AI volumes to be adequate,based on observed or experimentally determined approximations or estimates of water intake by a

Nutrients 2018, 10, 1928 11 of 25
group of apparently healthy people [6]. The EFSA determined AIs on the basis of population statistics,utilizing calculated ‘free water reserve’ (ml/24h) [12]; this quantity is defined as the difference betweenthe measured urine volume (ml/24h) and the calculated urine volume necessary to excrete all urinesolutes (i.e., obligatory urine volume, mOsm/24-h) at the group mean value of maximum UOSM [1,11].Furthermore, both the NAM and EFSA noted that AI values for water apply only to moderateenvironmental temperatures and moderate physical activity levels, because non-renal water losses viasweating (see column 8 in Table 3) can exceed 8.0 L/24h when exercise-heat stress is extreme [7].
4. A Proposed Method to Assess Daily Water Requirements
We now propose a novel approach to the assessment of the daily water requirement of individualsin all life stages, which was not employed during the development of water AI values (Table 1).This method focuses on the thresholds and intensity of responses within the brain and neuroendocrinesystem (i.e., autonomic nerves and endocrine organs that release hormones to regulate water andelectrolyte balance). Figure 3 provides a graphic representation of this technique. The central dashedline represents the set point (threshold) for each of the five regulated variables listed within the centralrectangle; Tables 4 and 6 present set point values for a plasma AVP increase and the appearance ofthirst. The regions to the left and right of the set point represent a water or sodium deficit, and wateror sodium excess, respectively; the zones farthest to the left and right of the set point represent thegreatest perturbations of each regulated variable due to change forces (e.g., dehydration, drinking, largedietary osmotic load). The block arrows to the left and right of the set point illustrate neuroendocrineresponses which move each regulated variable toward the set point in an effort to restore alteredhomeostasis; examples include release of AVP, angiotension II, aldosterone, atrial natriuretic peptide,as well as blood vessel constriction or dilation, increased thirst, and water consumption (i.e., sensoryand behavioral effects that are influenced by endocrine responses). The strongest neuroendocrineresponses occur at the far left and far right of the threshold (labeled with the words deficit and excess).If all fluid-electrolyte regulatory variables are at or near the set point (or if all neuroendocrine responsesare minimal), a state of euhydration exists because the brain is activating no compensatory responses;in contrast, when responses counteract water loss a state of dehydration or hypohydration exists.Measuring the intensity of neuroendocrine responses and identifying when set points have beenexceeded allow for quantitative comparisons of values during controlled laboratory experiments.Alternatively, the area under the curve (i.e., response intensity plotted versus response duration) couldbe measured.
Figure 4 illustrates this approach to assessing individual daily water needs. In normal subjects,the increase in plasma AVP (panel A) is stimulated primarily by increased POSM. Increasing POSM
signifies increasing perturbation of homeostasis; whereas an increasing plasma AVP concentrationrepresents an increased intensity of neuroendocrine response and indicates that the brain is regulatingbody water via the kidneys. Thus, the data in the upper right quadrants of panel A and panel Bcorrespond to intense neuroendocrine responses and a rigorous defense of total body water; the datain the lower left quadrants correspond to minimal-to-moderate defense of total body water.

Nutrients 2018, 10, 1928 12 of 25
Nutrients 2018, 10, x FOR PEER REVIEW 11 of 24
(Table 1). This method focuses on the thresholds and intensity of responses within the brain and
neuroendocrine system (i.e., autonomic nerves and endocrine organs that release hormones to
regulate water and electrolyte balance). Figure 3 provides a graphic representation of this technique.
The central dashed line represents the set point (threshold) for each of the five regulated variables
listed within the central rectangle; Tables 4 and 6 present set point values for a plasma AVP increase
and the appearance of thirst. The regions to the left and right of the set point represent a water or
sodium deficit, and water or sodium excess, respectively; the zones farthest to the left and right of
the set point represent the greatest perturbations of each regulated variable due to change forces (e.g.,
dehydration, drinking, large dietary osmotic load). The block arrows to the left and right of the set
point illustrate neuroendocrine responses which move each regulated variable toward the set point
in an effort to restore altered homeostasis; examples include release of AVP, angiotension II,
aldosterone, atrial natriuretic peptide, as well as blood vessel constriction or dilation, increased thirst,
and water consumption (i.e., sensory and behavioral effects that are influenced by endocrine
responses). The strongest neuroendocrine responses occur at the far left and far right of the threshold
(labeled with the words deficit and excess). If all fluid-electrolyte regulatory variables are at or near
the set point (or if all neuroendocrine responses are minimal), a state of euhydration exists because
the brain is activating no compensatory responses; in contrast, when responses counteract water loss
a state of dehydration or hypohydration exists. Measuring the intensity of neuroendocrine responses
and identifying when set points have been exceeded allow for quantitative comparisons of values
during controlled laboratory experiments. Alternatively, the area under the curve (i.e., response
intensity plotted versus response duration) could be measured.
Figure 3. A proposed schematic of a method to assess human daily water requirements by measuring
the intensity of neuroendocrine responses that are employed by the brain to defend homeostasis of
body water volume and concentration. These responses and thresholds are inherent hydration
biomarkers, and the means by which the brain maintains good health and optimal function.
Abbreviations: AVP, arginine vasopressin; ANG II, angiotensin II; ALD, aldosterone; ANP, atrial
naturietic peptide.
Figure 4 illustrates this approach to assessing individual daily water needs. In normal subjects,
the increase in plasma AVP (panel A) is stimulated primarily by increased POSM. Increasing POSM
signifies increasing perturbation of homeostasis; whereas an increasing plasma AVP concentration
represents an increased intensity of neuroendocrine response and indicates that the brain is
regulating body water via the kidneys. Thus, the data in the upper right quadrants of panel A and
panel B correspond to intense neuroendocrine responses and a rigorous defense of total body water;
the data in the lower left quadrants correspond to minimal-to-moderate defense of total body water.
Figure 3. A proposed schematic of a method to assess human daily water requirements by measuringthe intensity of neuroendocrine responses that are employed by the brain to defend homeostasis of bodywater volume and concentration. These responses and thresholds are inherent hydration biomarkers,and the means by which the brain maintains good health and optimal function. Abbreviations: AVP,arginine vasopressin; ANG II, angiotensin II; ALD, aldosterone; ANP, atrial naturietic peptide.Nutrients 2018, 10, x FOR PEER REVIEW 12 of 24
Figure 4. The relationship of plasma osmolality to plasma AVP (panel A), and the relationship of
plasma AVP to urine osmolality (panel B). Reprinted with copyright from Robertson et al. [71].
Plasma was collected during recumbent rest in three states of water balance: ad libitum fluid intake,
following an acute water load (20 ml/kg), and after acute periods of fluid restriction. The data
represent healthy adults and patients with diverse types of polyuria (i.e., abnormally large urine
volume and frequency). Dashed lines represent the sensitivity limit of the plasma AVP assay.
In normal adults, an increased intensity of neuroendocrine response (i.e., which defends the
volume and concentration of total body water) results in decreased urine volume and increased urine
osmolality, secondary to increased plasma AVP (Figure 4, panel B). As such, urinary variables (e.g.,
osmolality, specific gravity, 24-h urine volume) have been identified as valid hydration biomarkers
in studies involving free-living pregnant women, nonpregnant women, and men [16,18,38,39,57].
Central, autonomically-controlled changes of plasma AVP concentration (i.e., at the border of
euhydration and mild hypohydration; Figure 3) also act to maintain optimal health and functions in
normal persons. In turn, AVP may be a prognostic indicator of various disease states (Table 7),
including ischemic stroke, myocardial infarction, pneumonia, certain types of cancer, and septic
shock [93–95].
Table 7. Effects of 12-h and 24-h water restriction a on plasma osmolality and AVP concentration.
Participants Experimental design phase Plasma osmolality (mOsm/kg H2O) Plasma AVP (pg/ml) Reference
8 ♀ b
(21–34 year)
Baseline, EU 289 ± 2 1.3 ± 0.6 Davison et al., AJP 1984 [62]
12-h WR c 294 ± 2 2.9 ± 1.2
5 ♂ & 3 ♀ b
(26–50 year)
Baseline, EU 292 ± 1 1.7 ± 0.2 Geelen et al., AJP 1984 [63]
24-h WR c 302 ± 1 3.3 ± 0.5
7 ♂
(20–31 year)
Baseline, EU 288 ± 1 1.0 ± 0.3 Phillips et al., NEJM 1984 [88]
24-h WR c,d 291 ± 1 3.5 ± 0.3
7 ♂
(67–75 year)
Baseline, EU 288 ± 1 1.8 ± 0.3 Phillips et al., NEJM 1984 [88]
24-h WR c,d 296 ± 1 8.3 ± 0.3
a, diets included no water or beverages and dry food items; b, nonpregnant women; c, 24-h total water
intake was not measured; d, body mass loss was 1.8–1.9% of the baseline value; Abbreviations: AVP,
arginine vasopressin; EU, euhydrated; WR, water restriction.
In terms of the water requirements of normal individuals, determining the intensity of the body’s
defense of total body water and tonicity (e.g., measuring changes of plasma AVP or regulated
variables) provides a laboratory method to assess the intensity of homeostatic responses and the
response thresholds which the brain employs. Once identified, these measurements could be
compared to experimentally-controlled TWI volumes to determine the minimum 24-h TWI that
generally elicits no neuroendocrine response above resting baseline levels (i.e., thereby representing
euhydration or normal water balance). This method for assessing 24-h water balance also can be
applied to the TWI of free-living adults. For example, in recent years several research teams have
Figure 4. The relationship of plasma osmolality to plasma AVP (panel A), and the relationship of plasmaAVP to urine osmolality (panel B). Reprinted with copyright from Robertson et al. [71]. Plasma wascollected during recumbent rest in three states of water balance: ad libitum fluid intake, following anacute water load (20 ml/kg), and after acute periods of fluid restriction. The data represent healthyadults and patients with diverse types of polyuria (i.e., abnormally large urine volume and frequency).Dashed lines represent the sensitivity limit of the plasma AVP assay.
In normal adults, an increased intensity of neuroendocrine response (i.e., which defends thevolume and concentration of total body water) results in decreased urine volume and increasedurine osmolality, secondary to increased plasma AVP (Figure 4, panel B). As such, urinary variables(e.g., osmolality, specific gravity, 24-h urine volume) have been identified as valid hydration biomarkersin studies involving free-living pregnant women, nonpregnant women, and men [16,18,38,39,57].Central, autonomically-controlled changes of plasma AVP concentration (i.e., at the border of

Nutrients 2018, 10, 1928 13 of 25
euhydration and mild hypohydration; Figure 3) also act to maintain optimal health and functionsin normal persons. In turn, AVP may be a prognostic indicator of various disease states (Table 7),including ischemic stroke, myocardial infarction, pneumonia, certain types of cancer, and septicshock [93–95].
Table 7. Effects of 12-h and 24-h water restriction a on plasma osmolality and AVP concentration.
Participants Experimental Design Phase Plasma Osmolality (mOsm/kg H2O) Plasma AVP (pg/ml) Reference
8 ♀b
(21–34 year)
Baseline, EU 289 ± 2 1.3 ± 0.6Davison et al., AJP 1984 [62]
12-h WR c 294 ± 2 2.9 ± 1.2
5 ♂& 3 ♀b
(26–50 year)
Baseline, EU 292 ± 1 1.7 ± 0.2Geelen et al., AJP 1984 [63]
24-h WR c 302 ± 1 3.3 ± 0.5
7 ♂(20–31 year)
Baseline, EU 288 ± 1 1.0 ± 0.3Phillips et al., NEJM 1984 [88]
24-h WR c,d 291 ± 1 3.5 ± 0.3
7 ♂(67–75 year)
Baseline, EU 288 ± 1 1.8 ± 0.3Phillips et al., NEJM 1984 [88]
24-h WR c,d 296 ± 1 8.3 ± 0.3
a, diets included no water or beverages and dry food items; b, nonpregnant women; c, 24-h total water intake wasnot measured; d, body mass loss was 1.8–1.9% of the baseline value; Abbreviations: AVP, arginine vasopressin; EU,euhydrated; WR, water restriction.
In terms of the water requirements of normal individuals, determining the intensity of the body’sdefense of total body water and tonicity (e.g., measuring changes of plasma AVP or regulated variables)provides a laboratory method to assess the intensity of homeostatic responses and the responsethresholds which the brain employs. Once identified, these measurements could be compared toexperimentally-controlled TWI volumes to determine the minimum 24-h TWI that generally elicitsno neuroendocrine response above resting baseline levels (i.e., thereby representing euhydrationor normal water balance). This method for assessing 24-h water balance also can be applied to theTWI of free-living adults. For example, in recent years several research teams have compared thephysiological responses of habitual low-volume drinkers (LOW) to those of habitual high-volumedrinkers (HIGH) [16–18,51]. Figure 5 depicts plasma the AVP concentrations of free-living LOW andHIGH during one morning laboratory visit on each of 8 days. The TWI levels of LOW (n = 14 ♀) andHIGH (n = 14 ♀) are described in the figure legend. The experimental design involved 3 d of baselineobservations, 4 d of modified water intake (during which LOW consumed the TWI which HIGHhabitually consumed, and vice versa), and 1 d of ad libitum water intake. The morning plasma AVPlevels in Figure 5 were similar (LOW, 1.4–1.5 pg/ml; HIGH, 1.1–1.3 pg/ml) when both groups wereconsuming a similar high TWI (LOW, 3.5 L/24h; HIGH, 3.2 L/24h). Considering the plasma AVPthreshold which indicates an obvious neuroendocrine response (~2.0 pg/ml [78]; Figure 4), LOW wereabove this threshold when consuming a TWI volume of 1.6–1.7 L/24h whereas HIGH were above this2.0 pg/ml AVP threshold only when their TWI was modified to 2.0 L/24h on days 4–7. We interpretthese data to mean that the brain did not attempt to conserve water when TWI was ≥3.2 L/24h, andthat the water requirement of these healthy young women existed between 1.6 and 3.2 L/24h. Similarplasma AVP concentrations have been published in a study of LOW (TWI, 0.74 L/24h) and HIGH(TWI, 2.70 L/24h) by Perrier and colleagues [16]. Furthermore, a plasma AVP threshold <2.0 pg/mlcorresponds closely with the euhydrated baseline values shown in Table 7 (1.0–1.8 pg/ml), as observedin four groups of men and women. However, when these test subjects underwent water restrictionfor 12h and 24h, a stronger neuroendocrine response was observed (i.e., representing hypohydration)as plasma AVP levels of 2.9–3.5 pg/ml in young adults and 8.3 pg/ml in older adults. In one Table 7experiment [63], participants (5 ♂& 3 ♀, 26–50 years) rehydrated with tap water (10 ml/kg, 620–870 ml)after a 24-h water restriction; 60 min after this water consumption, the average plasma AVP decreasedfrom 3.3 to 1.5 pg/ml, suggesting that subjects had reached a state of euhydration.

Nutrients 2018, 10, 1928 14 of 25
Nutrients 2018, 10, x FOR PEER REVIEW 13 of 24
compared the physiological responses of habitual low-volume drinkers (LOW) to those of habitual
high-volume drinkers (HIGH) [16–18,51]. Figure 5 depicts plasma the AVP concentrations of free-
living LOW and HIGH during one morning laboratory visit on each of 8 days. The TWI levels of
LOW (n = 14 ♀) and HIGH (n = 14 ♀) are described in the figure legend. The experimental design
involved 3 d of baseline observations, 4 d of modified water intake (during which LOW consumed
the TWI which HIGH habitually consumed, and vice versa), and 1 d of ad libitum water intake. The
morning plasma AVP levels in Figure 5 were similar (LOW, 1.4–1.5 pg/ml; HIGH, 1.1–1.3 pg/ml)
when both groups were consuming a similar high TWI (LOW, 3.5 L/24h; HIGH, 3.2 L/24h).
Considering the plasma AVP threshold which indicates an obvious neuroendocrine response (~2.0
pg/ml [78]; Figure 4), LOW were above this threshold when consuming a TWI volume of 1.6–1.7
L/24h whereas HIGH were above this 2.0 pg/ml AVP threshold only when their TWI was modified
to 2.0 L/24h on days 4–7. We interpret these data to mean that the brain did not attempt to conserve
water when TWI was ≥3.2 L/24h, and that the water requirement of these healthy young women
existed between 1.6 and 3.2 L/24h. Similar plasma AVP concentrations have been published in a study
of LOW (TWI, 0.74 L/24h) and HIGH (TWI, 2.70 L/24h) by Perrier and colleagues [16]. Furthermore,
a plasma AVP threshold ˂2.0 pg/ml corresponds closely with the euhydrated baseline values shown
in Table 7 (1.0–1.8 pg/ml), as observed in four groups of men and women. However, when these test
subjects underwent water restriction for 12h and 24h, a stronger neuroendocrine response was
observed (i.e., representing hypohydration) as plasma AVP levels of 2.9–3.5 pg/ml in young adults
and 8.3 pg/ml in older adults. In one Table 7 experiment [63], participants (5 ♂ & 3 ♀, 26–50 years)
rehydrated with tap water (10 ml/kg, 620–870 ml) after a 24-h water restriction; 60 min after this water
consumption, the average plasma AVP decreased from 3.3 to 1.5 pg/ml, suggesting that subjects had
reached a state of euhydration.
Figure 5. Morning plasma AVP concentrations of habitual high-volume drinkers (HIGH, 3.2 ± 0.6
L/24h, n= 14♀) and low-volume drinkers (LOW, 1.6 L/24h, n = 14♀) during ad libitum baseline (3 days),
modified water intake (4 days; HIGH, 2.0 ± 0.2 and LOW, 3.5 ± 0.1 L/24h), and ad libitum recovery (1
day; HIGH, 3.2 ± 0.9 and LOW, 1.7 ± 0.5 L/24h). Different experimental phases are separated by
vertical dotted lines. a, within-group significant difference from the 3-d baseline mean (p < 0.001).
Reprinted with permission from Johnson et al., (2016) [13].
Utilizing a plasma AVP threshold of ˂2.0 pg/ml, this method could be employed to: (a) define
and distinguish states of euhydration and hypohydration; and (b) evaluate the neuroendocrine
response changes which occur with advanced age (Table 7; [61,88,91,96]) or any factor that potentiates
the release of AVP into the circulation. Although a plasma AVP concentration is useful because it
Figure 5. Morning plasma AVP concentrations of habitual high-volume drinkers (HIGH, 3.2 ± 0.6L/24h, n = 14♀) and low-volume drinkers (LOW, 1.6 L/24h, n = 14♀) during ad libitum baseline (3 days),modified water intake (4 days; HIGH, 2.0 ± 0.2 and LOW, 3.5 ± 0.1 L/24h), and ad libitum recovery(1 day; HIGH, 3.2 ± 0.9 and LOW, 1.7 ± 0.5 L/24h). Different experimental phases are separated byvertical dotted lines. a, within-group significant difference from the 3-d baseline mean (p < 0.001).Reprinted with permission from Johnson et al., (2016) [13].
Utilizing a plasma AVP threshold of <2.0 pg/ml, this method could be employed to: (a) define anddistinguish states of euhydration and hypohydration; and (b) evaluate the neuroendocrine responsechanges which occur with advanced age (Table 7; [61,88,91,96]) or any factor that potentiates the releaseof AVP into the circulation. Although a plasma AVP concentration is useful because it represents thesum of all factors that influence pituitary AVP release (Table 5) and AVP turnover in the circulation, weacknowledge that other hormonal/neurological biomarkers (e.g., angiotensin II, aldosterone) also playa role in water homeostasis. In addition, cases of over-hydration likely represent a limitation of thismethod. Excess body water may reduce plasma AVP to a level below the sensitivity of present-daytechnologies (i.e., most immunoassays detect AVP to ≥0.5 pg/ml; [69], making it difficult to distinguishover-hydrated states from a normal euhydrated state (1.0–1.8 pg/ml; Table 7). One final limitation ofthis method is the circadian variation in AVP secretion. It would be imperative for any investigationutilizing this proposed method to ensure blood sampling at similar times if successive samples weretaken as it has been demonstrated that AVP is both an outcome and input related to suprachiasmaticnucleus activity [97].
Plasma AVP concentration was selected as the primary outcome variable of this method becauseprevious TWI investigations have also published AVP with no copeptin measurements. However,AVP has a short half-life and is difficult to isolate/analyze [69,98], whereas copeptin is stable at roomtemperature and is recognized as a diagnostic biomarker for various diseases [99,100]. Furthermore,several studies have reported a strong correlation between plasma AVP and copeptin levels in healthyindividuals [98,101] and patients [102,103] across a wide range of POSM. Thus, it is very likely thatcopeptin will be measured in future investigations of neuroendocrine response intensity.
Currently, copeptin is just beginning to be used in clinical settings during randomized controltrials evaluating changes in water intake and disease [104,105]. Clinical settings are ideal becausecopeptin measurement, although less prone to errors compared to AVP, still requires specializedand expensive equipment (i.e., B·R·A·H·M·S KRYPTOR random-access immunoassay analyzer,ThermoFisher Scientific). Copeptin is also utilized in hospital settings for the evaluation of heartfailure [106]. Therefore, many researchers in the clinical setting already have access to copeptin analysis

Nutrients 2018, 10, 1928 15 of 25
equipment. It is hoped that in the coming years this type of equipment will become a mainstay withinhydratrion physiology laboratories, or advances in assay techniques will make copeptin quantificationmore accessible for all levels of researchers.
To our knowledge, only one study has assessed changes of plasma copeptin concentrationsin normal adults during water restriction [107]. Resting euhydrated plasma copeptin values(i.e., representing no neuroendocrine response by the brain to conserve water) were 18.5 ± 6.8 pg/ml(4.6 ± 1.7 pmol/L; 8 ♀, 8 ♂) at baseline, and increased to 37.0 ± 20.9 pg/ml (9.2 ± 5.2 pmol/L) after a28-h water restriction period that induced a 1.7% body mass loss. To determine a plasma copeptinthreshold similar to the plasma AVP threshold of 2.0 pg/ml (see above), additional experiments similarto those in Table 7 are required.
5. Neuroendocrine Responses across a Range of TWIs
Figure 6 provides evidence regarding the daily water requirement of humans. Compiling a rangeof data from six studies that reported 22 different observation days [10,13,16,18,54,64], we plottedthe relationships between TWI and the primary brain-regulated variable (POSM), the neuroendocrineresponse (plasma AVP) to changes of POSM, and the resulting changes in urine volume and concentration.The R2 value for each relationship describes the amount of variance in the four variables that isexplained by TWI values. Clearly, POSM is not strongly related to TWI (R2 = 0.18, p < 0.05) becauseblood concentration is regulated by the brain within a narrow normal limit [4], across a wide range ofTWI [6]; as reported in previous publications [16,18], POSM does not serve as a valid indicator of eitherTWI or water requirement in free-living adults. This fact opposes the theory that all individuals withnormal POSM levels are similar [2,108], even if their 24-h TWI is low.Nutrients 2018, 10, x FOR PEER REVIEW 15 of 24
Figure 6. Urine volume (UVOL), plasma osmolality (POSM), urine osmolality (UOSM, 24h), and plasma
AVP plotted against daily total water intake. EFSA and NAM water Adequate Intakes are shown as
the vertical shaded column. AVP concentrations associated with water restriction (WR) and baseline
resting total water intake (B) (Table 7) appear as horizontal shaded rows. All data points are group
mean values (SD not shown) from investigations that measured TWI.
The relationship between TWI and urine osmolality in Figure 6 appears to be moderately strong
(R2 = 0.56, p < 0.001), but not very strong because of the simultaneous influence of dietary osmolar
load on UOSM. In contrast, the relationship between TWI and urine volume is very strong (R2 = 0.94, p
< 0.001). However, plasma AVP concentration is the only variable in Figure 6 that directly represents
the intensity of neuroendocrine responses across a wide range of TWI (0.7–6.8 L/24h). As such, this
relationship (R2 = 0.88) provides evidence of the TWI volume that is required to maintain water and
electrolyte homeostasis. Recalling that a plasma AVP concentration of ≥2.0 pg/ml indicates an
obvious neuroendocrine response by the brain ([78]; Figure 4), and that the normal resting level
(shaded zone labeled WR) of plasma AVP lies below 2.0 pg/ml, the line of best fit for the relationship
between TWI and plasma AVP in Figure 6 shows that a plasma AVP concentration of 2.0 pg/ml is
equivalent to a TWI of 1.8 L/24h. Approximately 40% of young healthy college-aged women in the
USA (Figure 2), 19–24% of men and women in Great Britain [109], and 68–71% of men and women in
Spain [110] consume less than this volume of water each day. In Figure 6, a TWI of 1.8 L/24h is
equivalent to a urine volume of ~1400 mL/24h and a 24-h urine osmolality of ~770 mOsm/kg.
Furthermore, a TWI of 1.8 L/24h is similar to the much-debated recommendation to drink “8 × 8”
each day, which refers to consuming eight 8 oz glasses of water (1.89 L/24h) [108,111], and to the
recommended daily AI of water for women (2.0 L/24h, Table 1) established by the European Food
Safety Authority [7]. The two vertical shaded zones in Figure 6 display the EFSA and NAM daily
water AI ranges for men and women; all of these AI correspond to plasma AVP levels <2.0 pg/ml and
a minimal/baseline neuroendocrine defense of total body water and tonicity (Table 7). The daily water
AI range of the NAM corresponds to plasma AVP levels well below 2.0 pg/ml, likely because the
NAM proposed that human water requirements should not be based on a “minimal” intake [6], as
this might eventually lead to a deficit and possible adverse performance and health consequences [2].
Figure 6. Urine volume (UVOL), plasma osmolality (POSM), urine osmolality (UOSM, 24h), and plasmaAVP plotted against daily total water intake. EFSA and NAM water Adequate Intakes are shown asthe vertical shaded column. AVP concentrations associated with water restriction (WR) and baselineresting total water intake (B) (Table 7) appear as horizontal shaded rows. All data points are groupmean values (SD not shown) from investigations that measured TWI.

Nutrients 2018, 10, 1928 16 of 25
The relationship between TWI and urine osmolality in Figure 6 appears to be moderately strong(R2 = 0.56, p < 0.001), but not very strong because of the simultaneous influence of dietary osmolarload on UOSM. In contrast, the relationship between TWI and urine volume is very strong (R2 = 0.94,p < 0.001). However, plasma AVP concentration is the only variable in Figure 6 that directly representsthe intensity of neuroendocrine responses across a wide range of TWI (0.7–6.8 L/24h). As such, thisrelationship (R2 = 0.88) provides evidence of the TWI volume that is required to maintain water andelectrolyte homeostasis. Recalling that a plasma AVP concentration of ≥2.0 pg/ml indicates an obviousneuroendocrine response by the brain ([78]; Figure 4), and that the normal resting level (shaded zonelabeled WR) of plasma AVP lies below 2.0 pg/ml, the line of best fit for the relationship between TWIand plasma AVP in Figure 6 shows that a plasma AVP concentration of 2.0 pg/ml is equivalent to aTWI of 1.8 L/24h. Approximately 40% of young healthy college-aged women in the USA (Figure 2),19–24% of men and women in Great Britain [109], and 68–71% of men and women in Spain [110]consume less than this volume of water each day. In Figure 6, a TWI of 1.8 L/24h is equivalent toa urine volume of ~1400 mL/24h and a 24-h urine osmolality of ~770 mOsm/kg. Furthermore, aTWI of 1.8 L/24h is similar to the much-debated recommendation to drink “8 × 8” each day, whichrefers to consuming eight 8 oz glasses of water (1.89 L/24h) [108,111], and to the recommended dailyAI of water for women (2.0 L/24h, Table 1) established by the European Food Safety Authority [7].The two vertical shaded zones in Figure 6 display the EFSA and NAM daily water AI ranges for menand women; all of these AI correspond to plasma AVP levels <2.0 pg/ml and a minimal/baselineneuroendocrine defense of total body water and tonicity (Table 7). The daily water AI range of theNAM corresponds to plasma AVP levels well below 2.0 pg/ml, likely because the NAM proposed thathuman water requirements should not be based on a “minimal” intake [6], as this might eventuallylead to a deficit and possible adverse performance and health consequences [2].
Figure 6 also depicts plasma AVP levels during the four 12-h and 24-h water restriction experiments(see the horizontal shaded zone labeled WR) that are described in Table 7. At the end of these waterrestriction periods, group mean plasma AVP concentrations ranged from 2.9–3.5 pg/ml, representing amild-to-moderate neuroendocrine response (Figures 3 and 4). Interestingly, this range of concentrations(representing hypohydration of approximately 1% of body mass) is similar to the plasma AVP levelsreported for individuals who habitually consume a low daily TWI of 0.7 L/24h (2.4 pg/ml; [16]),1.0 L/24h (2.5–3.6 pg/ml; [54]), and 1.6 L/24h (2.5–2.9 pg/ml; Figure 5; [13]). This suggests that womenwho consume a TWI of 0.7–1.6 L/24h (i.e., ~20–30% of young healthy women; Figure 2)—well below theAI recommended by EFSA and NAM (Table 1)—experience a chronic mild-to-moderate neuroendocrinedefense of total body water. This observation is significant because numerous investigations and lettersto the editor have proposed that chronically elevated plasma AVP and angiotensin II levels may berelated to negative health outcomes (e.g., cardiovascular disease, obesity, diabetes, cancer morbidityand mortality) [69,96,112] as well as the progression of disease states (e.g., salt-sensitive hypertension,chronic kidney disease, and diabetic nephropathy [113]). Other investigators have: (a) utilized plasmacopeptin concentrations (i.e., part of the molecular pre-prohormone of AVP) to detect myocardialischemia and other diseases (Figure 4; [8,69,114]); and (b) supported the use of AVP receptor antagoniststo treat specific cardiovascular pathologies, suggesting dysfunctional body water regulation [115,116].A 6-week study, involving 82 healthy adults (50% ♀) in three TWI groups (1.43, 1.83, and 2.42 L/24h),provided promising evidence (i.e., increasing the daily TWI of the two LOW groups to match 2.42 L/24h)of reduced circulating copeptin levels [19]. This study suggests that the reduction of plasma AVP viaincreased TWI offers a safe, cost-effective, and easy-to-implement primary preventive intervention thatshould be evaluated in large future clinical trials [117].
6. Evidence for a Role of 24-h TWI in Reducing Disease Risk
As noted above, a surprising number of adults in developed countries do not meet water AIrecommendations (Table 1). This fact is significant in terms of long-term health outcomes because agrowing body of epidemiological evidence shows that chronically elevated plasma AVP ( likely due
Nutrients 2018, 10, 1928 17 of 25
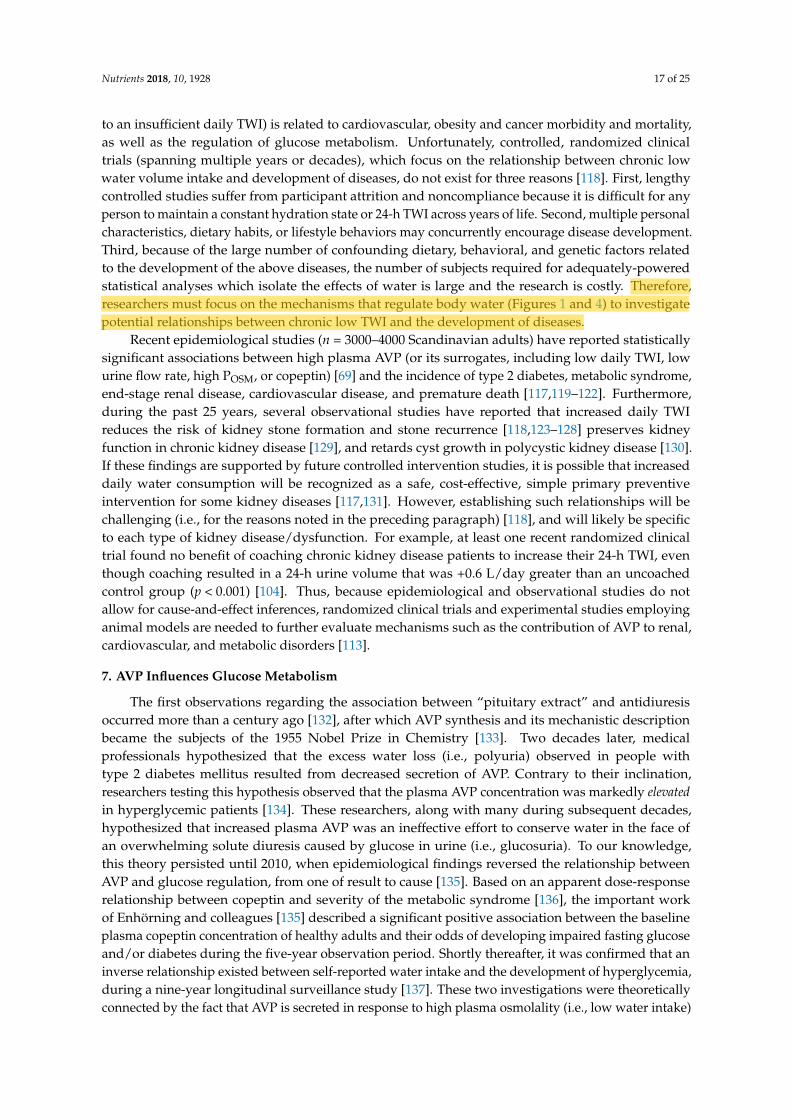
to an insufficient daily TWI) is related to cardiovascular, obesity and cancer morbidity and mortality,as well as the regulation of glucose metabolism. Unfortunately, controlled, randomized clinicaltrials (spanning multiple years or decades), which focus on the relationship between chronic lowwater volume intake and development of diseases, do not exist for three reasons [118]. First, lengthycontrolled studies suffer from participant attrition and noncompliance because it is difficult for anyperson to maintain a constant hydration state or 24-h TWI across years of life. Second, multiple personalcharacteristics, dietary habits, or lifestyle behaviors may concurrently encourage disease development.Third, because of the large number of confounding dietary, behavioral, and genetic factors relatedto the development of the above diseases, the number of subjects required for adequately-poweredstatistical analyses which isolate the effects of water is large and the research is costly. Therefore,researchers must focus on the mechanisms that regulate body water (Figures 1 and 4) to investigatepotential relationships between chronic low TWI and the development of diseases.
Recent epidemiological studies (n = 3000–4000 Scandinavian adults) have reported statisticallysignificant associations between high plasma AVP (or its surrogates, including low daily TWI, lowurine flow rate, high POSM, or copeptin) [69] and the incidence of type 2 diabetes, metabolic syndrome,end-stage renal disease, cardiovascular disease, and premature death [117,119–122]. Furthermore,during the past 25 years, several observational studies have reported that increased daily TWIreduces the risk of kidney stone formation and stone recurrence [118,123–128] preserves kidneyfunction in chronic kidney disease [129], and retards cyst growth in polycystic kidney disease [130].If these findings are supported by future controlled intervention studies, it is possible that increaseddaily water consumption will be recognized as a safe, cost-effective, simple primary preventiveintervention for some kidney diseases [117,131]. However, establishing such relationships will bechallenging (i.e., for the reasons noted in the preceding paragraph) [118], and will likely be specificto each type of kidney disease/dysfunction. For example, at least one recent randomized clinicaltrial found no benefit of coaching chronic kidney disease patients to increase their 24-h TWI, eventhough coaching resulted in a 24-h urine volume that was +0.6 L/day greater than an uncoachedcontrol group (p < 0.001) [104]. Thus, because epidemiological and observational studies do notallow for cause-and-effect inferences, randomized clinical trials and experimental studies employinganimal models are needed to further evaluate mechanisms such as the contribution of AVP to renal,cardiovascular, and metabolic disorders [113].
7. AVP Influences Glucose Metabolism
The first observations regarding the association between “pituitary extract” and antidiuresisoccurred more than a century ago [132], after which AVP synthesis and its mechanistic descriptionbecame the subjects of the 1955 Nobel Prize in Chemistry [133]. Two decades later, medicalprofessionals hypothesized that the excess water loss (i.e., polyuria) observed in people withtype 2 diabetes mellitus resulted from decreased secretion of AVP. Contrary to their inclination,researchers testing this hypothesis observed that the plasma AVP concentration was markedly elevatedin hyperglycemic patients [134]. These researchers, along with many during subsequent decades,hypothesized that increased plasma AVP was an ineffective effort to conserve water in the face ofan overwhelming solute diuresis caused by glucose in urine (i.e., glucosuria). To our knowledge,this theory persisted until 2010, when epidemiological findings reversed the relationship betweenAVP and glucose regulation, from one of result to cause [135]. Based on an apparent dose-responserelationship between copeptin and severity of the metabolic syndrome [136], the important workof Enhörning and colleagues [135] described a significant positive association between the baselineplasma copeptin concentration of healthy adults and their odds of developing impaired fasting glucoseand/or diabetes during the five-year observation period. Shortly thereafter, it was confirmed that aninverse relationship existed between self-reported water intake and the development of hyperglycemia,during a nine-year longitudinal surveillance study [137]. These two investigations were theoreticallyconnected by the fact that AVP is secreted in response to high plasma osmolality (i.e., low water intake)

Nutrients 2018, 10, 1928 18 of 25
and acts via V2 receptors in renal nephrons, increasing translocation of the aquaporin 2 channel andfacilitating increased water reabsorption [138]. Thus, chronically low water intake is associated withelevated plasma AVP [16], both of which predict the development of impaired glucose regulation.
Historically, low daily water intake, in the absence of symptoms and outside of athletic pursuits,has been considered to be innocuous because theoretically it was balanced by increased AVPsecretion, enhanced renal water reabsorption, increased water consumption, and maintenance ofwater balance [108]. However, the examination of cellular receptors sensitive to AVP yielded insightsinto possible mechanisms responsible for the above results. Distinct from V2 membrane receptors, V1areceptors are expressed in the kidney, liver, vascular smooth muscle, blood platelets, and brain [69].In the liver, V1a stimulation by AVP initiates calcium signaling reactions which increase glycogenolysisand blood glucose, directly in hepatocytes and indirectly via vasoconstriction-mediated ischemia [139].Indeed, multiple animal investigations and human genetic studies have described the role of V1areceptors in glucose regulation and dysfunction [140–142].
Independently, V1b receptors are concentrated within the hypothalamic-pituitary-adrenocortical(HPA) axis, where they enhance ACTH and cortisol release, and the physiological effects of CRH,when stimulated by AVP. The downstream effect of increased plasma glucocorticoids is increasedhepatic gluconeogenesis and decreased insulin sensitivity [143]. The role of AVP in glucocorticoidrelease is supported by observational data which show that individuals who consume low daily TWIexhibit increased plasma concentrations of both AVP and cortisol [16]. Additionally, men with type 2diabetes exhibited deteriorated glucose control and increased plasma cortisol following three days ofwater restriction [144]. Thus, mounting evidence suggests that a link exists between AVP and glucoseregulation. Our understanding of this relationship will expand in coming years.
8. Summary
Despite numerous efforts to define a state of euhydration and determine the daily waterrequirements of children, men, women, and older adults, no empirical research provides definitiveanswers and no universal consensus exists. The dynamic complexity of the water regulatory network,and inter-individual differences, are the primary reasons why widespread consensus regardingthe daily water requirements has not been reached to this date. In the preceding paragraphs, wehave proposed a novel experimental approach that offers an alternative to water AI survey dataand the potential to determine 24-h water requirements of individuals. This approach involvesthe assessment of the intensity of neuroendocrine responses during euhydration and followingexperimental perturbations of essential regulated variables. Although future researchers may choosea different regulated variable, we focused on plasma AVP as the primary hydration biomarker todetermine the intensity of neuroendocrine responses to a range of TWIs (Figure 6). A plasma AVPconcentration < 2.0 pg/ml represents a baseline euhydrated state (i.e., the brain is not attempting toconserve water), whereas plasma AVP ≥2.0 pg/ml indicates dehydration or hypohydration becausethe brain is acting to conserve water ([78]; Figure 4). These concentrations provide a previouslyunpublished definition of each term. Our examination of data from multiple research studies (Figure 6)demonstrates that a plasma AVP concentration of 2.0 pg/ml is equivalent to a TWI of 1.8 L/24h.Observational studies demonstrate that 19–71% of adults in various countries consume this volumeof water or less each day [13,109,110]. This is significant because increasing evidence shows thatchronically elevated plasma AVP (likely due to an insufficient daily TWI) could contribute to a numberof negative health outcomes. A TWI of 1.8 L/24h also questions the theory that all individuals withnormal POSM levels are similar [2,108], even if their 24-h TWI is low. Fortunately, the chronic reductionof plasma AVP by consuming a daily TWI that maintains plasma AVP <2.0 pg/ml suggests a safe,cost-effective, and easy-to-implement primary preventive intervention that can be evaluated in futurelong-term clinical trials.
Author Contributions: L.E.A. and E.C.J. worked together on the generation, editing, table design and figurecreation for this manuscript.

Nutrients 2018, 10, 1928 19 of 25
Acknowledgments: The authors would like to thank Professor Ivan Tack, M.D., Ph.D., Toulouse School ofMedicine, Toulouse, France for sharing insights regarding the central regulation of renal function and HillaryYoder, M.S. for providing clerical assistance with the production of the manuscript.
Conflicts of Interest: Lawrence Armstrong has previously served as a Scientific Advisory Board member, paidconsultant, and has received research funding from Danone Nutricia Research, France. He presently serves asa member of the Board of Trustees, Drinking Water Research Foundation, Alexandria, VA and is also a paidconsultant to the Foundation. Evan Johnson has previously received funding for research investigations fromDanone Nutricia Research, France, and served as a paid consultant to Dr. Armstrong during the preparation ofthis paper for the Drinking Water Research Foundation, Alexandria, VA, USA.
References
1. Manz, F.; Wentz, A. 24-h hydration status: Parameters, epidemiology and recommendations. Eur. J. Clin. Nutr.2003, 57, S101–S108. [CrossRef] [PubMed]
2. Sawka, M.N.; Cheuvront, S.N.; Carter, R. Human water needs. Nutr. Rev. 2005, 63, S303–S309. [CrossRef]3. Greenleaf, J.E. Problem: Thirst, drinking behavior, and involuntary dehydration. Med. Sci. Sports Exerc. 1992,
24, 645–656. [CrossRef] [PubMed]4. Kratz, A.; Ferraro, M.; Sluss, P.M.; Lewandrowski, K.B. Laboratory Reference Values. N. Engl. J. Med. 2004,
35, 1548–1563. [CrossRef] [PubMed]5. The third national health and nutrition examination survey (NHANES III 1988–1994). Available online:
https://wwwn.cdc.gov/nchs/data/nhanes3/3a/VIFSE-acc.pdf (accessed on 25 May 2018).6. Institute of Medicine. Dietary reference intakes for water, potassium, sodium, chloride, and sulfate; Institute of
Medicine: Washington, DC, USA, 2004.7. EFSA Panel on Dietic Products, Nutrition, and Allergies (NDA). Scientific opinion on dietary reference
values for water. EFSA J. 2010, 8, 1459–1507.8. Thornton, S.N. Thirst and hydration: Physiology and consequences of dysfunction. Physiol. Behav. 2010,
100, 15–21. [CrossRef]9. Gamble, J. Chemical Anatomy, Physiology and Pathology of Extracellular Fluid: A Lecture Syllabus; Harvard
University Press: Cambridge, MA, USA, 1947.10. Manz, F.; Johner, S.A.; Wentz, A.; Boeing, H.; Remer, T. Water balance throughout the adult life span in a
German population. Br. J. Nutr. 2012, 107, 1673–1681. [CrossRef]11. Manz, F.; Wentz, A. Hydration status in the United States and Germany. Nutr. Rev. 2005, 63, S55–S62.
[CrossRef]12. Manz, F.; Wentz, A.; Sichert-Hellert, W. The most essential nutrient: Defining the adequate intake of water.
J. Pediatr. 2002, 141, 587–592. [CrossRef]13. Johnson, E.C.; Muñoz, C.X.; Jimenez, L.; Le Bellego, L.; Kupchak, B.R.; Kraemer, W.J.; Casa, D.J.; Maresh, C.M.;
Armstrong, L.E. Hormonal and thirst modulated maintenance of fluid balance in young women with differentlevels of habitual fluid consumption. Nutrients 2016, 8, 302. [CrossRef]
14. Guelinckx, I.; Tavoularis, G.; König, J.; Morin, C.; Gharbi, H.; Gandy, J. Contribution of water from foodand fluids to total water intake: Analysis of a French and UK population surveys. Nutrients 2016, 8, 630.[CrossRef] [PubMed]
15. Guelinckx, I.; Ferreira-Pêgo, C.; Moreno, L.A.; Kavouras, S.A.; Gandy, J.; Martinez, H.; Bardosono, S.;Abdollahi, M.; Nasseri, E.; Jarosz, A.; et al. Intake of water and different beverages in adults across 13countries. Eur. J. Nutr. 2015, 54, 45–55. [CrossRef] [PubMed]
16. Perrier, E.; Vergne, S.; Klein, A.; Poupin, M.; Rondeau, P.; Le Bellego, L.; Armstrong, L.E.; Lang, F.; Stookey, J.;Tack, I. Hydration biomarkers in free-living adults with different levels of habitual fluid consumption.Br. J. Nutr. 2013, 109, 1678–1687. [CrossRef] [PubMed]
17. Pross, N.; Demazières, A.; Girard, N.; Barnouin, R.; Metzger, D.; Klein, A.; Perrier, E.; Guelinckx, I. Effects ofchanges in water intake on mood of high and low drinkers. PLoS ONE 2014, 9, e94754. [CrossRef]
18. Perrier, E.; Demazières, A.; Girard, N.; Pross, N.; Osbild, D.; Metzger, D.; Guelinckx, I.; Klein, A. Circadianvariation and responsiveness of hydration biomarkers to changes in daily water intake. Eur. J. Appl. Physiol.2013, 113, 2143–2151. [CrossRef]
19. Lemetais, G.; Melander, O.; Vecchio, M.; Bottin, J.H.; Enhörning, S.; Perrier, E.T. Effect of increased waterintake on plasma copeptin in healthy adults. Eur. J. Nutr. 2018, 57, 1883–1890. [CrossRef]

Nutrients 2018, 10, 1928 20 of 25
20. Pross, N.; Demazières, A.; Girard, N.; Barnouin, R.; Santoro, F.; Chevillotte, E.; Klein, A.; Le Bellego, L.Influence of progressive fluid restriction on mood and physiological markers of dehydration in women.Br. J. Nutr. 2013, 109, 313–321. [CrossRef]
21. National Health and Medical Research Council. National Health and Medical Research Council of Australia.In Australian Dietary Guidlines; National Health and Medical Research Council: Canberra, Australia, 2013.
22. Armstrong, L.E.; Pumerantz, A.C.; Fiala, K.A.; Roti, M.W.; Kavouras, S.A.; Casa, D.J.; Maresh, C.M. Humanhydration indices: Acute and longitudinal reference values. Int. J. Sport Nutr. Exerc. MeTable 2010, 20, 145–153.[CrossRef]
23. Armstrong, L.E.; Johnson, E.C.; Muñoz, C.X.; Swokla, B.; Le Bellego, L.; Jimenez, L.; Casa, D.J.; Maresh, C.M.Hydration biomarkers and dietary fluid consumption of women. J. Acad. Nutr. Diet. 2012, 112, 1056–1061.[CrossRef]
24. Leiper, J.B.; Pitsiladis, Y.; Maughan, R.J. Comparison of water turnover rates in men undertaking prolongedcycling exercise and sedentary men. Int. J. Sports Med. 2001, 22, 181–185. [CrossRef]
25. Raman, A.; Schoeller, D.A.; Subar, A.F.; Troiano, R.P.; Schatzkin, A.; Harris, T.; Bauer, D.; Bingham, S.A.;Everhart, J.E.; Newman, A.B.; et al. Water turnover in 458 American adults 40–79 year of age. Am. J. Physiol.Renal Physiol. 2004, 286, F394–F401. [CrossRef] [PubMed]
26. McKenzie, A.L.; Armstrong, L.E. Monitoring body water balance in pregnant and nursing women: Thevalidity of urine color. Ann. Nutr. Metab. 2017, 70, 18–22. [CrossRef] [PubMed]
27. Armstrong, L.E.; Kenefick, R.W.; Castellani, J.W.; Riebe, D.; Kavouras, S.A.; Kuznicki, J.T.; Maresh, C.M.Bioimpedance spectroscopy technique: Intra-, extracellular, and total body water. Med. Sci. Sports Exerc.1997, 29, 1657–1663. [CrossRef] [PubMed]
28. Davis, J.M.; Burgess, W.A.; Slentz, C.A.; Bartoli, W.P.; Pate, R.R. Effects of ingesting 6% and 12%glucose/electrolyte beverages during prolonged intermittent cycling in the heat. Eur. J. Appl. Physiol.Occup. Physiol. 1988, 57, 563–569. [CrossRef] [PubMed]
29. Sawka, M.N.; Young, A.J.; Francesconi, R.P.; Muza, S.R.; Pandolf, K.B. Thermoregulatory and blood responsesduring exercise at graded hypohydration levels. J. Appl. Physiol. 1985, 59, 1394–1401. [CrossRef] [PubMed]
30. Armstrong, L.E.; Maresh, C.M.; Gabaree, C.V.; Hoffman, J.R.; Kavouras, S.A.; Kenefick, R.W.; Castellani, J.W.;Ahlquist, L.E. Thermal and circulatory responses during exercise: Effects of hypohydration, dehydration,and water intake. J. Appl. Physiol. 1997, 82, 2028–2035. [CrossRef] [PubMed]
31. Kenefick, R.W.; Maresh, C.M.; Armstrong, L.E.; Castellani, J.W.; Riebe, D.; Echegaray, M.E.; Kavorous, S.A.Plasma vasopressin and aldosterone responses to oral and intravenous saline rehydration. J. Appl. Physiol.2000, 89, 2117–2122. [CrossRef] [PubMed]
32. Muñoz, C.X.; Johnson, E.C.; Demartini, J.K.; Huggins, R.A.; McKenzie, A.L.; Casa, D.J.; Maresh, C.M.;Armstrong, L.E. Assessment of hydration biomarkers including salivary osmolality during passive andactive dehydration. Eur. J. Clin. Nutr. 2013, 67, 1257–1263. [CrossRef]
33. Rolls, E.T.; Rolls, B.J.; Rowe, E.A. Sensory-specific and motivation-specific satiety for the sight and taste offood and water in man. Physiol. Behav. 1983, 30, 185–192. [CrossRef]
34. Geelen, G.; Greenleaf, J.E.; Keil, L.C. Drinking-induced plasma vasopressin and norepinephrine changes indehydrated humans. J. Clin. Endocrinol. Metab. 1996, 81, 2131–2135.
35. Engell, D.B.; Maller, O.; Sawka, M.N.; Francesconi, R.N.; Drolet, L.; Young, A.J. Thirst and fluid intakefollowing graded hypohydration levels in humans. Physiol. Behav. 1987, 40, 229–236. [CrossRef]
36. Maughan, R.J.; Watson, P.; Cordery, P.A.; Walsh, N.P.; Oliver, S.J.; Dolci, A.; Rodriguez-Sanchez, N.;Galloway, S.D. A randomized trial to assess the potential of different beverages to affect hydration status:Development of a beverage hydration index. Am. J. Clin. Nutr. 2016, 103, 717–723. [CrossRef] [PubMed]
37. Evans, G.H.; James, L.J.; Shirreffs, S.M.; Maughan, R.J. Optimizing the restoration and maintenance of fluidbalance after exercise-induced dehydration. J. Appl. Physiol. 2017, 122, 945–951. [CrossRef]
38. Perrier, E.T.; Buendia-Jimenez, I.; Vecchio, M.; Armstrong, L.E.; Tack, I.; Klein, A. Twenty-four-hour urineosmolality as a physiological index of adequate water intake. Dis. Markers 2015, 2015, 231063. [CrossRef][PubMed]
39. McKenzie, A.L.; Muñoz, C.X.; Armstrong, L.E. Accuracy of urine color to detect equal to or greater than 2%body mass loss in men. J Athl. Train 2015, 50, 1306–1309. [CrossRef] [PubMed]
40. Romano, G.; Bortolotti, N.; Falleti, E.; Favret, G.; Gonano, F.; Bartoli, G.E. The influence of furosemide on freewater clearance. Panminerva. Med. 1999, 41, 103–108. [PubMed]

Nutrients 2018, 10, 1928 21 of 25
41. Armstrong, L.E.; Johnson, E.C.; McKenzie, A.L.; Muñoz, C.X. Interpreting common hydration biomarkers onthe basis of solute and water excretion. Eur. J. Clin. Nutr. 2013, 67, 249–253. [CrossRef] [PubMed]
42. Armstrong, L.E.; Johnson, E.C.; Ganio, M.S.; Judelson, D.A.; Vingren, J.L.; Kupchak, B.R.; Kunces, L.J.;Muñoz, C.X.; McKenzie, A.L.; Williamson, K.H. Effective body water and body mass changes duringsummer ultra-endurance road cycling. J. Sports Sci. 2015, 33, 125–135. [CrossRef] [PubMed]
43. Maughan, R.J.; Shirreffs, S.M.; Merson, S.J.; Horswill, C.A. Fluid and electrolyte balance in elite male football(soccer) players training in a cool environment. J. Sports Sci. 2005, 23, 73–79. [CrossRef] [PubMed]
44. Rehrer, N.J.; Burke, L.M. Sweat losses during various sports. Aust. J. Nutr. Diet. 1996, 53, S13–S16.45. Adolph, E.F. Physiology of Man in the Desert; Adolf, E.F., Ed.; Interscience Pub.: Cummings Park, MA,
USA, 1947.46. Cheuvront, S.N.; Fraser, C.G.; Kenefick, R.W.; Ely, B.R.; Sawka, M.N. Reference change values for monitoring
dehydration. Clin. Chem. Lab. Med. 2011, 49, 1033–1037. [CrossRef] [PubMed]47. Cheuvront, S.N.; Ely, B.R.; Kenefick, R.W.; Sawka, M.N. Biological variation and diagnostic accuracy of
dehydration assessment markers. Am. J. Clin. Nutr. 2010, 92, 565–573. [CrossRef] [PubMed]48. Cheuvront, S.N.; Kenefick, R.W. Dehydration: Physiology, assessment, and performance effects.
Compr Physiol 2014, 4, 257–285. [PubMed]49. Racette, S.B.; Schoeller, D.A.; Luke, A.H.; Shay, K.; Hnilicka, J.; Kushner, R.F. Relative dilution spaces of 2H-
and 18O-labeled water in humans. Am. J. Physiol. 1994, 267, E585–E590. [CrossRef] [PubMed]50. Armstrong, L.E.; Maresh, C.M.; Castellani, J.; Bergeron, M.; Kenefick, R.; La Gasse, K.; Riebe, D.
Urinary indices of hydration status. Int. J. Sport Nutr. 1994, 4, 265–279. [CrossRef] [PubMed]51. Johnson, E.C.; Muñoz, C.X.; Le Bellego, L.; Klein, A.; Casa, D.J.; Maresh, C.M.; Armstrong, L.E. Markers of
the hydration process during fluid volume modification in women with habitual high or low daily fluidintakes. Eur. J. Appl. Physiol. 2015, 115, 1067–1074. [CrossRef]
52. Maughan, R.J.; Shirreffs, S.M.; Leiper, J.B. Errors in the estimation of hydration status from changes in bodymass. J. Sports Sci. 2007, 25, 797–804. [CrossRef]
53. Hoyt, R.W.; Honig, A. Environmental influences on body fluid balance during exercise: Altitude. In BodyFluid Balance: Exercise and Sport; Buskirk, E., Puhl, S.M., Eds.; CRC: Boca Raton, FL, USA, 1996; pp. 183–196.
54. Shore, A.C.; Markandu, N.D.; Sagnella, G.A.; Singer, D.R.; Forsling, M.L.; Buckley, M.G.; Sugden, A.L.;MacGregor, G.A. Endocrine and renal response to water loading and water restriction in normal man.Clin. Sci. 1988, 75, 171–177. [CrossRef]
55. Miles, B.E.; Paton, A.; De Wardener, H.E. Maximum urine concentration. Br. Med. J. 1954, 2, 901–905.[CrossRef] [PubMed]
56. Armstrong, L.E. Assessing hydration status: The elusive gold standard. J. Am. Coll. Nutr. 2007, 26, 575s–584s.[CrossRef] [PubMed]
57. McKenzie, A.L.; Perrier, E.T.; Guelinckx, I.; Kavouras, S.A.; Aerni, G.; Lee, E.C.; Volek, J.S.; Maresh, C.M.;Armstrong, L.E. Relationships between hydration biomarkers and total fluid intake in pregnant and lactatingwomen. Eur. J. Nutr. 2017, 56, 2161–2170. [CrossRef] [PubMed]
58. Grandjean, A.C.; Reimers, K.J.; Haven, M.C.; Curtis, G.L. The effect on hydration of two diets, one with andone without plain water. J. Am. Coll. Nutr. 2003, 22, 165–173. [CrossRef]
59. Tucker, M.A.; Ganio, M.S.; Adams, J.D.; Brown, L.A.; Ridings, C.B.; Burchfield, J.M.; Robinson, F.B.;McDermott, J.L.; Schreiber, B.A.; Moyen, N.E.; et al. Hydration status over 24-H is not affected by ingestedbeverage composition. J. Am. Coll. Nutr. 2015, 34, 318–327. [CrossRef] [PubMed]
60. Popkin, B.M.; Armstrong, L.E.; Bray, G.M.; Caballero, B.; Frei, B.; Willett, W.C. A new proposed guidancesystem for beverage consumption in the United States. Am. J. Clin. Nutr. 2006, 83, 529–542. [CrossRef]
61. Rolls, B.J.; Phillips, P.A. Aging and disturbances of thirst and fluid balance. Nutr. Rev. 1990, 48, 137–144.[CrossRef] [PubMed]
62. Davison, J.M.; Gilmore, E.A.; Durr, J.; Robertson, G.L.; Lindheimer, M.D. Altered osmotic thresholds forvasopressin secretion and thirst in human pregnancy. Am. J. Physiol. 1984, 246, F105–F109. [CrossRef][PubMed]
63. Geelen, G.; Keil, L.C.; Kravik, S.E.; Wade, C.E.; Thrasher, T.N.; Barnes, P.R.; Pyka, G.; Nesvig, C.; Greenleaf, J.E.Inhibition of plasma vasopressin after drinking in dehydrated humans. Am. J. Physiol. 1984, 247, R968–R971.[CrossRef] [PubMed]

Nutrients 2018, 10, 1928 22 of 25
64. Stookey, J.D.; Hamer, J.; Killilea, D.W. Change in hydration indices associated with an increase in total waterintake of more than 0.5 L/day, sustained over 4 weeks, in healthy young men with initial total water intakebelow 2 L/day. Physiol. Rep. 2017. [CrossRef]
65. Silverthorn, D.U. Human Physiology: An integrated approach, 5th ed.; Silverthorn, D.U., Ed.; Pearson/BenjaminCummings: San Franciso, CA, USA, 2009.
66. Armstrong, L.E.; Maughan, R.J.; Senay, L.C.; Shirreffs, S.M. Limitations to the use of plasma osmolality as ahydration biomarker. Am. J. Clin. Nutr. 2013, 98, 503–504. [CrossRef]
67. Sawka, M.N.; Montain, S.J.; Latzka, W.A. Body fluid balance during exercise-heat exposure. In Body FluidBalance: Exercise and Sport; CRC Press: Boca Raton, FL, USA, 1996; pp. 139–157.
68. Sollanek, K.J.; Kenefick, R.W.; Cheuvront, S.N.; Axtell, R.S. Potential impact of a 500-mL water bolus andbody mass on plasma osmolality dilution. Eur. J. Appl. Physiol. 2011, 111, 1999–2004. [CrossRef]
69. Bankir, L.; Bichet, D.G.; Morgenthaler, N.G. Vasopressin: Physiology, assessment and osmosensation.J. Intern. Med. 2017, 282, 284–297. [CrossRef] [PubMed]
70. Moses, A.M.; Miller, M. Osmotic threshold for vasopressin release as determined by saline infusion and bydehydration. Neuroendocrinology 1971, 7, 219–226. [CrossRef] [PubMed]
71. Robertson, G.L.; Mahr, E.A.; Athar, S.; Sinha, T. Development and clinical application of a new methodfor the radioimmunoassay of arginine vasopressin in human plasma. J. Clin. Invest. 1973, 52, 2340–2352.[CrossRef] [PubMed]
72. Robertson, G.L.; Shelton, R.L.; Athar, S. The osmoregulation of vasopressin. Kidney Int. 1976, 10, 25–37.[CrossRef] [PubMed]
73. Zerbe, R.L.; Robertson, G.L. Osmoregulation of thirst and vasopressin secretion in human subjects: Effect ofvarious solutes. Am. J. Physiol. 1983, 244, E607–E614. [CrossRef] [PubMed]
74. Thompson, C.J.; Bland, J.; Burd, J.; Baylis, P.H. The osmotic thresholds for thirst and vasopressin release aresimilar in healthy man. Clin. Sci. 1986, 71, 651–656. [CrossRef] [PubMed]
75. Thompson, C.J.; Davis, S.N.; Butler, P.C.; Charlton, J.A.; Baylis, P.H. Osmoregulation of thirst and vasopressinsecretion in insulin-dependent diabetes mellitus. Clin. Sci. 1988, 74, 599–606. [CrossRef] [PubMed]
76. Thompson, C.J.; Edwards, C.R.W.; Baylis, P.H. Osmotic and non-osmotic regulation of thirst and vasopressinsecretion in patients with compulsive water drinking. Clin. Endocrinol. 1991, 35, 221–228. [CrossRef]
77. Zerbe, R.L.; Miller, J.Z.; Robertson, G.L. The reproducibility and heritability of individual differences inosmoregulatory function in normal human subjects. J. Lab. Clin. Med. 1991, 117, 51–59.
78. Vokes, T. Water homeostasis. Annu. Rev. Nutr. 1987, 7, 383–406. [CrossRef]79. Halter, J.B.; Goldberg, A.P.; Robertson, G.L.; Porte, D., Jr. Selective osmoreceptor dysfunction in the syndrome
of chronic hypernatremia. J. Clin. Endocrinol. MeTable 1977, 44, 609–616. [CrossRef] [PubMed]80. Hochberg, Z.; Moses, A.M.; Miller, M.; Benderli, A.; Richman, R.A. Altered osmotic threshold for
vasopressin release and impaired thirst sensation: Additional abnormalities in Kallmann’s syndrome.J. Clin. Endocrinol. Metab. 1982, 55, 779–782. [CrossRef] [PubMed]
81. Katz, F.H.; Smith, J.A.; Lock, J.P.; Loeffel, D.E. Plasma vasopressin variation and renin activity in normalactive humans. Horm. Res. 1979, 10, 289–302. [CrossRef] [PubMed]
82. Melander, O. Vasopressin: Novel roles for a new hormone-Emerging therapies in cardiometabolic and renaldiseases. J. Intern. Med. 2017, 282, 281–283. [CrossRef] [PubMed]
83. Moses, A.M.; Miller, M.; Streeten, D.H. Quantitative influence of blood volume expansion on the osmoticthreshold for vasopressin release. J. Clin. Endocrinol. Metab. 1967, 27, 655–662. [CrossRef] [PubMed]
84. Robertson, G.L.; Athar, S. The interaction of blood osmolality and blood volume in regulating plasmavasopressin in man. J. Clin. Endocrinol. Metab. 1976, 42, 613–620. [CrossRef] [PubMed]
85. Schrier, R.W.; Berl, T.; Anderson, R.J. Osmotic and nonosmotic control of vasopressin release. Am. J. Physiol.1979, 236, F321–F332. [CrossRef] [PubMed]
86. Zerbe, R.L.; Robertson, G.L. Osmotic and nonosmotic regulation of thirst and vasopressin secretion.In Clinical Disorders of Fluid and Electrolyte Metabolism, 5th ed.; Narins, R., Ed.; McGraw Hill: New York, NY,USA, 1994; Volume 5, pp. 81–100.
87. Spruce, B.A.; Baylis, P.H.; Burd, J.; Watson, M.J. Variation in osmoregulation of arginine vasopressin duringthe human menstrual cycle. Clin. Endocrinol. 1985, 22, 37–42. [CrossRef]
88. Phillips, P.A.; Rolls, B.J.; Ledingham, J.G.; Forsling, M.L.; Morton, J.J.; Crowe, M.J.; Wollner, L. Reduced thirstafter water deprivation in healthy elderly men. N. Engl. J. Med. 1984, 311, 753–759. [CrossRef]

Nutrients 2018, 10, 1928 23 of 25
89. Kenney, W.L.; Chiu, P. Influence of age on thirst and fluid intake. Med. Sci. Sports Exerc. 2001, 33, 1524–1532.[CrossRef]
90. Davies, I.; O’Neill, P.A.; McLean, K.A.; Catania, J.; Bennett, D. Age-associated alterations in thirst andarginine vasopressin in response to a water or sodium load. Age Ageing 1995, 24, 151–159. [CrossRef]
91. Stachenfeld, N.S.; DiPietro, L.; Nadel, E.R.; Mack, G.W. Mechanism of attenuated thirst in aging: Role ofcentral volume receptors. Am. J. Physiol. 1997, 272, R148–R157. [CrossRef] [PubMed]
92. Farrell, M.J.; Zamarripa, F.; Shade, R.; Phillips, P.A.; McKinley, M.; Fox, P.T.; Blair-West, J.; Denton, D.A.;Egan, G.F. Effect of aging on regional cerebral blood flow responses associated with osmotic thirst and itssatiation by water drinking: A PET study. Proc. Natl. Acad. Sci. U.S.A. 2008, 8, 382–387. [CrossRef]
93. Morgenthaler, N.G.; Struck, J.; Jochberger, S.; Dünser, M.W. Copeptin: Clinical use of a new biomarker.Trends Endocrinol. Metab. 2008, 19, 43–49. [CrossRef]
94. Katan, M.; Christ-Crain, M. The stress hormone copeptin: A new prognostic biomarker in acute illness.Swiss Med. Wkly. 2010, 140, w13101. [CrossRef] [PubMed]
95. Munro, A.H.G.; Crompton, G.K. Inappropriate antidiuretic hormone secretion in oat-cell carcinoma ofbronchus Aggravation of hyponatraemia by intravenous cyclophosphamide. Thorax 1972, 27, 40–642.[CrossRef]
96. Thornton, S.N. Angiotensin, the hypovolaemia hormone, aggravates hypertension, obesity, diabetes andcancer. J. Intern. Med. 2009, 265, 616–617. [CrossRef]
97. Eric, L. Bittman Vasopressin: More than just an output of the circadian pacemaker? Focus on “Vasopressinreceptor V1a regulates circadian rhythms of locomotor activity and expression of clock-controlled genes inthe suprachiasmatic nuclei”. Am. J. Physiol. Regul. Integr. Comp. Physiol. 2009, 296, R821–R823.
98. Morgenthaler, N.G.; Struck, J.; Alonso, C.; Bergmann, A. Assay for the measurement of copeptin, a stablepeptide derived from the precursor of vasopressin. Clin. Chem. 2006, 52, 112–119. [CrossRef]
99. Roussel, R.; Fezeu, L.; Marre, M.; Velho, G.; Fumeron, F.; Jungers, P.; Lantieri, O.; Balkau, B.; Bouby, N.;Bankir, L.; et al. Comparison between copeptin and vasopressin in a population from the community and inpeople with chronic kidney disease. J. Clin. Endocrinol. Metab. 2014, 99, 4656–4663. [CrossRef]
100. Morgenthaler, N.G. Copeptin: A biomarker of cardiovascular and renal function. Congest. Heart Fail. 2010,16, S37–S44. [CrossRef] [PubMed]
101. Balanescu, S.; Kopp, P.; Gaskill, M.B.; Morgenthaler, N.G.; Schindler, C.; Rutishauser, J. Correlation of plasmacopeptin and vasopressin concentrations in hypo-, iso-, and hyperosmolar States. J. Clin. Endocrinol. Metab.2011, 96, 1046–1052. [CrossRef] [PubMed]
102. Westermann, I.; Dünser, M.W.; Haas, T.; Jochberger, S.; Luckner, G.; Mayr, V.D.; Wenzel, V.; Stadlbauer, K.H.;Innerhofer, P.; Morgenthaler, N.; et al. Endogenous vasopressin and copeptin response in multiple traumapatients. Shock 2007, 28, 644–649. [CrossRef] [PubMed]
103. Ettema, E.M.; Heida, J.; Casteleijn, N.F.; Boesten, L.; Westerhuis, R.; Gaillard, C.; Gansevoort, R.T.;Franssen, C.F.M.; Zittema, D. The effect of renal function and hemodialysis treatment on plasma vasopressinand copeptin levels. Kidney Int. Rep. 2017, 2, 410–419. [CrossRef] [PubMed]
104. Clark, W.F.; Sontrop, J.M.; Huang, S.H.; Gallo, K.; Moist, L.; House, A.A.; Cuerden, M.S.; Weir, M.A.;Bagga, A.; Brimble, S.; et al. Effect of coaching to increase water intake on kidney function decline in adultswith chronic kidney disease: The CKD WIT randomized clinical trial. JAMA 2018, 319, 1870–1879. [CrossRef][PubMed]
105. Enhörning, S.; Tasevska, I.; Roussel, R.; Bouby, N.; Persson, M.; Burri, P.; Bankir, L.; Melander, O. Effects ofhydration on plasma copeptin, glycemia and gluco-regulatory hormones: A water intervention in humans.Eur J. Nutr. 2017. [CrossRef]
106. Balling, L.; Gustafsson, F. Copeptin as a biomarker in heart failure. Biomark Med. 2014, 8, 841–854. [CrossRef]107. Szinnai, G.; Morgenthaler, N.G.; Berneis, K.; Struck, J.; Muller, B.; Keller, U.; Christ-Crain, M. Changes in
plasma copeptin, the c-terminal portion of arginine vasopressin during water deprivation and excess inhealthy subjects. J. Clin. Endocrinol. Metab. 2007, 92, 3973–3978. [CrossRef]
108. Valtin, H. “Drink at least eight glasses of water a day.” Really? Is there scientific evidence for “8 × 8”? Am. J.Physiol. Regul. Integr. Comp. Physiol. 2002, 283, R993–R1004. [CrossRef]
109. Gibson, S.; Shirreffs, S.M. Beverage consumption habits “24/7” among British adults: Association with totalwater intake and energy intake. Nutr. J. 2013, 12, 9. [CrossRef]

Nutrients 2018, 10, 1928 24 of 25
110. Nissensohn, M.; Sánchez-Villegas, A.; Ortega, R.M.; Aranceta-Bartrina, J.; Gil, A.; Gonzalez-Gross, M.;Varela-Moreiras, G.; Serra-Majem, L. Beverage consumption habits and association with total water andenergy intakes in the Spanish Population: Findings of the ANIBES study. Nutrients 2016, 8, 232. [CrossRef]
111. Chang, A.; Kramer, H. Fluid intake for kidney disease prevention: An urban myth? Clin. J. Am. Soc. Nephrol.2011, 6, 2558–2560. [CrossRef] [PubMed]
112. Bouby, N.; Clark, W.F.; Roussel, R.; Taveau, C.; Wang, C.J. Hydration and kidney health. Obes. Facts. 2014,7, 19–32. [CrossRef] [PubMed]
113. Bankir, L.; Bouby, N.; Ritz, E. Vasopressin: A novel target for the prevention and retardation of kidneydisease? Nat. Rev. Nephrol. 2013, 9, 223–239. [CrossRef]
114. Staub, D.; Morgenthaler, N.G.; Buser, C.; Breidthardt, T.; Potocki, M.; Noveanu, M.; Reichlin, T.; Bergmann, A.;Mueller, C. Use of copeptin in the detection of myocardial ischemia. Clin. Chim. Acta. 2009, 399, 69–73.[CrossRef]
115. Schrier, R.W.; Masoumi, A.; Elhassan, E. Role of vasopressin and vasopressin receptor antagonists in type Icardiorenal syndrome. Blood Purif. 2009, 27, 28–32. [CrossRef] [PubMed]
116. Decaux, G.; Soupart, A.; Vassart, G. Non-peptide arginine-vasopressin antagonists: The vaptans. Lancet 2008,371, 1624–1632. [CrossRef]
117. Melander, O. Vasopressin, from regulator to disease predictor for diabetes and cardiometabolic risk.Ann. Nutr. Metab. 2016, 68, 24–28. [CrossRef]
118. Armstrong, L.E. Challenges of linking chronic dehydration and fluid consumption to health outcomes.Nutr. Rev. 2012, 70, S121–S127. [CrossRef]
119. Enhörning, S.; Bankir, L.; Bouby, N.; Struck, J.; Hedblad, B.; Persson, M.; Morgenthaler, N.G.; Nilsson, P.M.;Melander, O. Copeptin, a marker of vasopressin, in abdominal obesity, diabetes and microalbuminuria: Theprospective Malmo Diet and Cancer Study cardiovascular cohort. Int. J. Obes. 2013, 37, 598–603.
120. Enhörning, S.; Hedblad, B.; Nilsson, P.M.; Engström, G.; Melander, O. Copeptin is an independent predictorof diabetic heart disease and death. Am. Heart J. 2015, 169, 549–556. [CrossRef]
121. Tasevska, I.; Enhörning, S.; Christensson, A.; Persson, M.; Nilsson, P.M.; Melander, O. Increased levels ofcopeptin, a surrogate marker of arginine vasopressin, are associated with an increased risk of chronic kidneydisease in a general population. Am. J. Nephrol. 2016, 44, 22–28. [CrossRef]
122. Velho, G.; El Boustany, R.; Lefèvre, G.; Mohammedi, K.; Fumeron, F.; Potier, L.; Bankir, L.; Bouby, N.;Hadjadj, S.; Marre, M.; et al. Plasma Copeptin, Kidney Outcomes, Ischemic Heart Disease, and All-CauseMortality in People With Long-standing Type 1 Diabetes. Diabetes Care 2016, 39, 2288–2295. [CrossRef]
123. Borghi, L.; Meschi, T.; Amato, F.; Briganti, A.; Novarini, A.; Giannini, A. Urinary volume, water andrecurrences in idiopathic calcium nephrolithiasis: A 5-year randomized prospective study. J. Urol. 1996,155, 839–843. [CrossRef]
124. Borghi, L.; Meschi, T.; Schianchi, T.; Allegri, F.; Guerra, A.; Maggiore, U.; Novarini, A. Medical treatment ofnephrolithiasis. Endocrinol. Metab. Clin. North Am. 2002, 31, 1051–1064. [CrossRef]
125. Borghi, L.; Meschi, T.; Schianchi, T.; Briganti, A.; Guerra, A.; Allegri, F.; Novarini, A. Urine volume: Stonerisk factor and preventive measure. Nephron 1999, 81, 31–37. [CrossRef]
126. Siener, R.; Hesse, A. Fluid intake and epidemiology of urolithiasis. Eur. J. Clin. Nutr. 2003, 57, S47–S51.[CrossRef]
127. Siener, R.; Schade, N.; Nicolay, C.; von Unruh, G.E.; Hesse, A. The efficacy of dietary intervention on urinaryrisk factors for stone formation in recurrent calcium oxalate stone patients. J. Urol. 2005, 173, 1601–1605.[CrossRef]
128. Wenzel, U.O.; Hebert, L.A.; Stahl, R.A.; Krenz, I. My doctor said I should drink a lot! Recommendations forfluid intake in patients with chronic kidney disease. Clin. J. Am. Soc. Nephrol. 2006, 1, 344–346. [CrossRef]
129. Wang, C.J.; Grantham, J.J.; Wetmore, J.B. The medicinal use of water in renal disease. Kidney Int. 2013,84, 45–53. [CrossRef]
130. Clark, W.F.; Sontrop, J.M.; Huang, S.H.; Moist, L.; Bouby, N.; Bankir, L. Hydration and Chronic KidneyDisease Progression: A Critical Review of the Evidence. Am. J. Nephrol. 2016, 43, 281–292. [CrossRef]
131. Sontrop, J.M.; Dixon, S.N.; Garg, A.X.; Buendia-Jimenez, I.; Dohein, O.; Huang, S.H.; Clark, W.F. Associationbetween water intake, chronic kidney disease, and cardiovascular disease: A cross-sectional analysis ofNHANES data. Am. J. Nephrol. 2013, 37, 434–442. [CrossRef]
132. Farini, F. Diabete insipido ed opoterapia. Gazz. Osped. Clin. 1913, 34, 1135–1139.

Nutrients 2018, 10, 1928 25 of 25
133. Ragnarsson, U. The nobel trail of Vincent du Vigneaud. J. Pept. Sci. 2007, 13, 431–433. [CrossRef]134. Zerbe, R.L.; Vinicor, F.; Robertson, G.L. Plasma vasopressin in uncontrolled diabetes mellitus. Diabetes 1979,
28, 503–508. [CrossRef]135. Enhörning, S.; Wang, T.J.; Nilsson, P.M.; Almgren, P.; Hedblad, B.; Berglund, G.; Struck, J.; Morgenthaler, N.G.;
Bergmann, A.; Lindholm, E.; et al. Plasma copeptin and the risk of diabetes mellitus. Circulation 2010,121, 2102–2108.
136. Saleem, U.; Khaleghi, M.; Morgenthaler, N.G.; Bergmann, A.; Struck, J.; Mosley, T.H., Jr.; Kullo, I.J. Plasmacarboxy-terminal provasopressin (copeptin): A novel marker of insulin resistance and metabolic syndrome.J. Clin. Endocrinol. Metab. 2009, 94, 2558–2564. [CrossRef]
137. Roussel, R.; Fezeu, L.; Bouby, N.; Balkau, B.; Lantieri, O.; Alhenc-Gelas, F.; Marre, M.; Bankir, L. Low waterintake and risk for new-onset hyperglycemia. Diabetes Care 2011, 34, 2551–2554. [CrossRef]
138. Nielsen, S.; Chou, C.L.; Marples, D.; Christensen, E.I.; Kishore, B.K.; Knepper, M.A. Vasopressin increaseswater permeability of kidney collecting duct by inducing translocation of aquaporin-CD water channels toplasma membrane. Proc. Natl. Acad. Sci. USA 1995, 92, 1013–1017. [CrossRef]
139. Nakamura, K.; Velho, G.; Bouby, N. Vasopressin and metabolic disorders: Translation from experimentalmodels to clinical use. J. Intern. Med. 2017, 282, 298–309. [CrossRef]
140. Taveau, C.; Chollet, C.; Bichet, D.G.; Velho, G.; Guillon, G.; Corbani, M.; Roussel, R.; Bankir, L.; Melander, O.;Bouby, N. Acute and chronic hyperglycemic effects of vasopressin in normal rats: Involvement of V1Areceptors. Am. J. Physiol. Endocrinol. Metab. 2017, 312, E127–E135. [CrossRef] [PubMed]
141. Taveau, C.; Chollet, C.; Waeckel, L.; Desposito, D.; Bichet, D.G.; Arthus, M.F.; Magnan, C.; Philippe, E.;Paradis, V.; Foufelle, F.; et al. Vasopressin and hydration play a major role in the development of glucoseintolerance and hepatic steatosis in obese rats. Diabetologia 2015, 58, 1081–1090. [CrossRef] [PubMed]
142. Enhörning, S.; Leosdottir, M.; Wallstrom, P.; Gullberg, B.; Berglund, G.; Wirfalt, E.; Melander, O. Relationbetween human vasopressin 1a gene variance, fat intake, and diabetes. Am. J. Clin. Nutr. 2009, 89, 400–406.[CrossRef] [PubMed]
143. Kuo, T.; McQueen, A.; Chen, T.C.; Wang, J.C. Regulation of glucose homeostasis by glucocorticoids. Adv. Exp.Med. Biol. 2015, 872, 99–126.
144. Johnson, E.C.; Bardis, C.N.; Jansen, L.T.; Adams, J.D.; Kirkland, T.W.; Kavouras, S.A. Reduced water intakedeteriorates glucose regulation in patients with type 2 diabetes. Nutr. Res. 2017, 43, 25–32. [CrossRef]
© 2018 by the authors. Licensee MDPI, Basel, Switzerland. This article is an open accessarticle distributed under the terms and conditions of the Creative Commons Attribution(CC BY) license (http://creativecommons.org/licenses/by/4.0/).