water management plan - mine 2013e.pdf · this document describes the water management plan - mine...
TRANSCRIPT

NorthMet Project
Water Management Plan - Mine
Version 2
Issue Date: January 9, 2013
Date: January 9, 2012 NorthMet Project
Water Management Plan - Mine
Version: 2 Contents
\\barr.com\projects\Mpls\23 MN\69\2369862\WorkFiles\APA\Mgmt Plans\Water-Mine\Mgmt Plan\Version 2\NorthMet WMP-Mine v2 d5.docx
Table of Contents
Acronyms, Abbreviations and Units .............................................................................................. iv
1.0 Introduction ......................................................................................................................... 1
1.1 Objective and Overview ................................................................................................. 1 1.2 Outline ............................................................................................................................ 2 1.3 Baseline Data .................................................................................................................. 3
1.3.1 Surface Water Baseline Data ...................................................................................... 3 1.3.2 Groundwater Baseline Data ........................................................................................ 4
1.4 Existing Conditions ......................................................................................................... 4
2.0 Process Water and Stormwater Management System Design ............................................ 6
2.1 Process Water ................................................................................................................. 7 2.1.1 Design Criteria for the Process Water Systems .......................................................... 8 2.1.2 Mine Site Water Balance ............................................................................................ 9 2.1.3 Pit Dewatering ............................................................................................................ 9 2.1.4 Stockpile Drainage .................................................................................................... 11
2.1.4.1 Temporary Stockpile Drainage Collection Systems ......................................... 12 2.1.4.1.1 Temporary Stockpile Overliner Sump and Overflow Pond Design ............ 12 2.1.4.1.2 Ore Surge Pile Sump (OSP) and Sump Liner ............................................. 14 2.1.4.1.3 Construction of Lined Sumps and Ponds .................................................... 14
2.1.4.2 Category 1 Waste Rock Stockpile Groundwater Containment System ............ 15 2.1.5 Process Water Ponds for Other Infrastructure .......................................................... 15
2.1.5.1 Overburden Storage and Laydown Area (OSLA) Drainage ............................. 17 2.1.5.2 Haul Road Drainage .......................................................................................... 17 2.1.5.3 Rail Transfer Hopper (RTH) Area Drainage .................................................... 18
2.1.6 Waste Water Treatment Facility (WWTF) ............................................................... 18 2.1.7 Central Pumping Station (CPS) and Treated Water Pipeline (TWP) ....................... 19
2.2 Stormwater Management .............................................................................................. 21 2.2.1 Stormwater Modeling ............................................................................................... 21 2.2.2 Exclusion Dikes ........................................................................................................ 22
2.2.2.1 Perimeter Dikes ................................................................................................. 22 2.2.2.2 Pit Rim Dikes .................................................................................................... 23
2.2.3 Interior Ditches ......................................................................................................... 24
2.2.4 Sedimentation Ponds and Outlets ............................................................................. 24 2.2.4.1 General Design Criteria .................................................................................... 25 2.2.4.2 Sedimentation Pond Sizing and Outlet Design ................................................. 26
3.0 Key Outcomes ................................................................................................................... 28
3.1 Water Quantity .............................................................................................................. 28 3.2 Water Quality ................................................................................................................ 28
4.0 Operating Plan .................................................................................................................. 29

Date: January 9, 2012 NorthMet Project
Water Management Plan - Mine
Version: 2 Contents
4.1 Process Water ............................................................................................................... 29 4.1.1 Waste Water Treatment Facility (WWTF) ............................................................... 29 4.1.2 Central Pumping Station (CPS) ................................................................................ 29 4.1.3 Treated Water Pipeline (TWP) ................................................................................. 30 4.1.4 Mine Site Pipelines ................................................................................................... 30 4.1.5 Mine Site Sumps and Pumps .................................................................................... 31 4.1.6 Mine Site Process Water Ponds ................................................................................ 31
4.2 Stormwater .................................................................................................................... 31 4.3 Spills ............................................................................................................................. 32 4.4 Overflows ...................................................................................................................... 32
4.4.1 Process Water............................................................................................................ 32
4.4.2 Stormwater ................................................................................................................ 34
5.0 Water Quantity and Quality Monitoring ........................................................................... 35
5.1 Internal .......................................................................................................................... 39 5.1.1 Pit Water ................................................................................................................... 39 5.1.2 Stockpile Drainage .................................................................................................... 39 5.1.3 Overburden Storage and Laydown (OSLA) Area Runoff ........................................ 39 5.1.4 Haul Road Runoff ..................................................................................................... 39 5.1.5 Rail Transfer Hopper (RTH) Area Runoff ................................................................ 40 5.1.6 Waste Water Treatment Facility (WWTF) Influents and Effluent ........................... 40 5.1.7 Treated Water Pipeline (TWP) Flows....................................................................... 40
5.2 Stormwater .................................................................................................................... 40 5.3 Groundwater ................................................................................................................. 40
5.4 Wetlands ....................................................................................................................... 41 5.5 Surface Water ............................................................................................................... 41
5.5.1 Partridge River and Tributaries ................................................................................. 41 5.5.2 Colby Lake ................................................................................................................ 41
6.0 Reporting and Adaptive Management .............................................................................. 42
6.1 Monthly Reporting ........................................................................................................ 42
6.2 Annual Reporting .......................................................................................................... 42 6.3 Annual Comparison to Model ....................................................................................... 43 6.4 Model Refinements ....................................................................................................... 43
6.5 Adaptive Management .................................................................................................. 44 6.6 Contingency Mitigations ............................................................................................... 44
7.0 Reclamation and Long-Term Closure ............................................................................... 47
7.1 Incremental Reclamation .............................................................................................. 47
7.2 Final Reclamation ......................................................................................................... 47 7.2.1 Perimeter and Interior Dikes ..................................................................................... 47 7.2.2 Ditch Filling and Rerouting ...................................................................................... 48 7.2.3 Stormwater and Process Water Pond Restoration .................................................... 48

Date: January 9, 2012 NorthMet Project
Water Management Plan - Mine
Version: 2 Contents
7.2.4 Pipe and Pump Removal ........................................................................................... 48 7.2.5 Central Pumping Station and Treated Water Pipeline Removal ............................... 49
7.3 Long-Term Closure ....................................................................................................... 49 7.3.1 Monitoring and Reporting......................................................................................... 49 7.3.2 Water Treatment ....................................................................................................... 49
7.4 Contingency Reclamation Estimates ............................................................................ 50 7.4.1 Contingency Reclamation Plan (Mine Year 0 and 1) ............................................... 50
7.4.1.1 Mine Year 0 (end of construction/development) .............................................. 50 7.4.1.2 Mine Year 1 (end of first year of operations) ................................................... 50
7.4.2 Contingency Reclamation Estimate (Mine Year 0 and 1) – PLACEHOLDER ....... 51 7.4.2.1 Mine Year 0 (end of construction/development) – PLACEHOLDER ............. 51
7.4.2.2 Mine Year 1 (end of first year of operations) – PLACEHOLDER .................. 51 7.4.3 Forecast of Annual Contingency Reclamation Estimates (Mine Years 2 to 20) –
PLACEHOLDER .................................................................................................................. 51
Revision History ........................................................................................................................... 52
References ..................................................................................................................................... 53
List of Tables ................................................................................................................................ 54
List of Large Tables ...................................................................................................................... 55
List of Large Figures ..................................................................................................................... 55
List of Attachments ....................................................................................................................... 56
List of Large Figures ..................................................................................................................... 17
Date: January 9, 2012 NorthMet Project
Water Management Plan - Mine
Version: 2 Contents
Acronyms, Abbreviations and Units
Acronym Stands For
ac-ft acre-feet
AWMP Adaptive Water Management Plan
BMP best management practice
cfs cubic feet per second
CPS Central Pumping Station
East EQ Basin East Equalization Basin
fps feet per second
FSP Field Sampling Plan
FTB Flotation Tailings Basin
gpm gallons per minute
HDPE high-density polyethylene
HRC haul road central
HRE haul road east
HRN haul road north
HRW haul road west
LCRS leak collection and recovery system
MDNR Minnesota Department of Natural Resources
mg/L milligram per liter
mi2 square mile
mm millimeter
MPCA Minnesota Pollution Control Agency
MSFMF Mine Site Fueling and Maintenance Facility
Date: January 9, 2012 NorthMet Project
Water Management Plan - Mine
Version: 2 Contents
Acronym Stands For
MSHA Mine Safety and Health Administration
N/A not applicable
NPDES National Pollutant Discharge Elimination System
No. Number
NWL normal water level
OSLA Overburden Storage and Laydown Area
OSP Ore Surge Pile
PRB Permeable Reactive Barrier
PTM Permit to Mine
PW- Process water
QAPP Quality Assurance Project Plan
RTH Rail Transfer Hopper
S Process water sump
SAP Sampling and Analysis Plan
SCS Soil Conservation Service
SDS State Disposal System
SOP Standard Operating Procedure
SPCC Spill Prevention Control & Counter Measures
SWPPP Storm Water Pollution Prevention Plan
TBD to be determined
TSS total suspended solids
TWP Treated Water Pipeline
USGS United States Geological Survey

Date: January 9, 2012 NorthMet Project
Water Management Plan - Mine
Version: 2 Contents
Acronym Stands For
West EQ Basin West Equalization Basin
WWTF Mine Site Waste Water Treatment Facility
XP-SWMM Software package used to model stormwater, sanitary water and river systems

Date: January 9, 2012 NorthMet Project
Water Management Plan - Mine
Version: 2 Page 1
1.0 Introduction
This document describes the Water Management Plan - Mine for Poly Met Mining Inc.’s
(PolyMet) NorthMet Project (Project) and presents the management of process water and
stormwater at the Mine Site and includes design of process water and stormwater infrastructure
associated with the Project, estimated quantity of process water to be pumped to the Flotation
Tailings Basin (FTB), estimated water quality at appropriate water quality compliance points,
operating plans, water quality and quantity monitoring plans, reporting requirements and
adaptive management approaches. This report will become part of the Minnesota Department of
Natural Resources (MDNR) Permit to Mine (PTM) and Minnesota Pollution Control Agency
(MPCA) National Pollutant Discharge Elimination System (NPDES) / State Disposal System
(SDS) Permit and is summarized in the NorthMet Project Mine Plan (Reference (1)).
In addition to the management of water at the Mine Site, this document also briefly describes the
quantity of water removed from the upper reaches of the Partridge River by the Project and the
quantity of water that will be discharged from the Mine Site Waste Water Treatment Facility
(WWTF) in long-term closure, as modeled in the Water Modeling Data Package Volume 1 –
Mine Site (Reference (2)).
Several other Management Plans contain information that relates to the water management at the
Mine Site. The NorthMet Project Rock and Overburden Management Plan (Reference (3))
includes design details for stockpile water containment/liner systems. The NorthMet Project
Adaptive Water Management Plan (AWMP, Reference (4)) contains details of adaptive
engineering controls (WWTF and Category 1 Waste Rock Stockpile cover) that will ensure
compliance with applicable water quality standards at appropriate evaluation points.
The Project is described in the Project Description (Reference (5)). Detailed reclamation plans
and cost estimates for the process water and stormwater management systems are described in
this document. The overall reclamation plan and cost estimate is described in the NorthMet
Project Reclamation Plan (Reference (6)). All of the Management Plans will evolve through the
environmental review, permitting, operating, reclamation and long-term closure phases of the
Project.
1.1 Objective and Overview
The objective of the Water Management Plan - Mine is to describe a safe and reliable system for
managing the water at the Mine Site in a manner that results in compliance with applicable
surface water and groundwater quality standards at appropriate Mine Site compliance points as
demonstrated by modeling outcomes discussed in Reference (2).
In order to manage the water at the Mine Site, an understanding of the overall Mine Plan is
necessary. As described in Section 1.1 of Reference (1), ore will be mined from the East Pit from
Mine Year 1 to 11 and from the West Pit from Mine Year 2 through 11. During that period, the
more reactive waste rock will be placed in temporary stockpiles, and the least reactive waste rock

Date: January 9, 2012 NorthMet Project
Water Management Plan - Mine
Version: 2 Page 2
will be placed in a permanent stockpile. Ore will be mined from the West and Central Pits from
Mine Year 11 to 16. As mining of the Central Pit progresses, it will be joined to the East Pit, and
the combined pits will be referred to as the East Pit. Ore will be mined only from the West Pit
from Mine Year 17 to 20. Beginning in Mine Year 11, the more reactive waste rock mined from
the West and Central Pits will be placed directly in the East Pit, after mining is completed in that
pit. The waste rock in the temporary stockpiles will be relocated to the East Pit beginning in
Mine Year 11. As the least reactive waste rock is mined, it will be placed in the permanent
stockpile or the East Pit. As the East Pit is backfilled, water will be pumped to the pit to
submerge the backfilled rock. By the end of operations (Mine Year 20), the East Pit will be
backfilled with waste rock mined from the West and Central pits, waste rock and overburden
from the temporary stockpiles and water, resulting in permanent subaqueous disposal of these
materials.
1.2 Outline
The outline of this document is:
Section 1.0 Introduction, objective and overview, and description of the Mine Site baseline
data and existing conditions
Section 2.0 Description of the design of the process water management systems and
stormwater management infrastructure at the Mine Site
Section 3.0 Description of key outcomes of the design, including quantity of water treated and
pumped to the FTB or East Pit and water quality at compliance points
Section 4.0 Description of operational water management plans for process water,
stormwater, spills and overflows
Section 5.0 Description of monitoring of water quantity and quality, including process water
internal to the Project, stormwater from the Mine Site, external groundwater, and
external surface water
Section 6.0 Description of monthly and annual reporting requirements including comparison
to modeled outcomes and compliance, adaptive management plan and available
mitigations
Section 7.0 Description of the reclamation and long-term closure plan for the Mine Site water
management systems including the Contingency Reclamation Plan and Cost
Estimate (assumes closure in the upcoming year) and a forecast of annual
contingency reclamation cost estimates for years remaining to end of mining
Because this document is intended to evolve through the environmental review, permitting
(NPDES/SDS, Water Appropriations and PTM), operating, reclamation and long-term closure

Date: January 9, 2012 NorthMet Project
Water Management Plan - Mine
Version: 2 Page 3
phases of the Project, some headings are included as placeholders and are so identified. It will be
reviewed and updated as necessary in conjunction with changes that occur and for future
permitting needs. A Revision History is included at the end of the document.
1.3 Baseline Data
Section 4 of Reference (2) describes the baseline climate, land use, geology, surface water and
groundwater data used in water quantity and quality modeling at the Mine Site. This section
provides a summary of the baseline surface water and groundwater data from Reference (2).
1.3.1 Surface Water Baseline Data
As described in Section 4.4 of Reference (2), the Mine Site is located within the Partridge River
watershed, approximately 17 river miles upstream of Colby Lake (see Large Figure 1). Above
Colby Lake, the Partridge River watershed covers approximately 103 square miles. Tributaries to
the Partridge River above Colby Lake and downstream of the Mine Site include an Unnamed
Creek downstream of the future West Pit Overflow, Wetlegs Creek, Longnose Creek, and
Wyman Creek. Colvin Creek and the south branch of the Partridge River are also tributaries to
the Partridge River; however, these streams will not be directly or indirectly impacted by the
Project.
Daily flow data is available for the Partridge River from the U.S. Geological Survey (USGS)
gaging station 04015475 – Partridge River above Colby Lake at Hoyt Lakes, Minnesota from
water years 1978 through 1987. During this period, hydrology was affected by the periodic and
variable dewatering of the Peter Mitchell Pits located at the headwaters of the Partridge River.
The hydrology data has been validated and adjusted for use on this Project, as described in
Reference (2).
Several locations within the Partridge River watershed have been monitored for water quality
between 2004 and 2012. These locations are shown in Large Figure 1 and include seven
monitoring locations on the Partridge River above Colby Lake, two locations along Wyman
Creek, three locations along tributaries to the Partridge River, and four locations in Colby Lake
and Whitewater Reservoir. The results of baseline monitoring upstream of Colby Lake is
presented in Large Table 3 of Reference (2). Baseline monitoring data from water collected in
Colby Lake and Whitewater Reservoir is presented in Large Table 4 of Reference (2). The
frequency and extent (i.e., number of constituents) of monitoring varies by location. Monitoring
conducted from 2004 through 2008 generally includes a wider list of constituents to characterize
the baseline conditions within the watershed. Monitoring from 2008 through 2011 generally
focused on a smaller list of constituents and locations to resolve specific issues (e.g., ratio of
dissolved to total aluminum, inadequate thallium detection limits) with the data. More
comprehensive baseline monitoring at select locations along the Partridge River and its
tributaries was resumed in 2012 with a wider list of constituents.

Date: January 9, 2012 NorthMet Project
Water Management Plan - Mine
Version: 2 Page 4
1.3.2 Groundwater Baseline Data
As described in Section 4.3 of Reference (2), baseflow in the Partridge River near the Mine Site
can be considered a proxy for overall discharge through the surficial aquifer at the Mine Site
because the river represents the primary sink for shallow groundwater flow. In the Mine Site
area, the average 30-day low flow (considered a proxy for baseflow) in the Partridge River is
estimated to be 3.84 cubic feet per second (cfs), corresponding to a contributing watershed area
of approximately 95 square miles (mi2), which represents an estimated aquifer yield of 0.04
cfs/mi2, or 0.5 inches per year.
Based on groundwater elevations at the Mine Site surficial aquifer monitoring wells and
estimated Partridge River elevations downgradient of the wells, the average hydraulic gradient
across the area is on the order of 0.01. Using the geometric mean of the hydraulic conductivity
estimates from slug tests completed at the Mine Site (0.3 feet/day) and assuming a porosity of
0.3, a representative groundwater velocity in the unconsolidated aquifer at the Mine Site is
approximately 0.01 feet/day. Locally, actual velocities likely range over several orders of
magnitude, depending on the gradient and hydraulic conductivity of the aquifer material present.
As described in Section 4.3 of Reference (2), the Mine Site contains 33 monitoring wells,
including:
24 wells located in the surficial deposits
Five wells within the upper 100 feet of bedrock
Four wells in bedrock at depths ranging from 485 to 610 feet below grade.
The locations of these wells are shown on Large Figure 2. Three of the monitoring wells in the
surficial deposits wells were installed in 2005 and have been sampled intermittently since
installation. The additional 21 wells in the surficial deposits were installed between October
2011 and February 2012. A monthly groundwater sampling program of these surficial
monitoring wells was initiated in November 2011 and continued through August 2012 with an
additional round of samples completed in October 2012. Future sampling of these wells is
planned three times per year. The five monitoring wells within the upper 100 feet of the bedrock
have each been sampled seven or eight times since installation in 2006. The four larger diameter
deep bedrock wells were installed in 2006 and have been sampled during aquifer testing in 2006
and 2007. Groundwater monitoring data from the monitoring wells in the surficial deposits and
bedrock wells is summarized in Large Table 3 and Large Table 4 in Reference (2), respectively.
1.4 Existing Conditions
Existing subwatersheds at and near the Mine Site are shown on Large Figure 3. Under existing
conditions, runoff from the northernmost area of the Mine Site generally drains north into the
One Hundred Mile Swamp and associated wetlands along the Partridge River. These wetlands
form the headwaters of the Partridge River, which meanders around the east end of the Mine Site
Date: January 9, 2012 NorthMet Project
Water Management Plan - Mine
Version: 2 Page 5
before turning southwest. Runoff from the majority of the Mine Site naturally drains to the south
through culverts under Dunka Road and the adjacent rail line, into the Partridge River
downstream of the Dunka Road crossing.
In addition to subwatershed boundaries, Large Figure 3 shows the 100-year flood levels and
average water levels at selected locations along the Partridge River. The flood boundary was
developed for the 24-hour storm event, which was the critical event for the Partridge River. The
100-year, 10-day snowmelt event was previously modeled to evaluate the peak flows in the
Partridge River, but the 24-hour storm event produced higher flows and flood levels due to the
lack of storage in the upper watershed immediately north of the Mine Site.
As shown by these flood levels, the Partridge River is very flat in the upstream reach in the
vicinity of the One Hundred Mile Swamp; however, there is still an increase of over 10 feet in
normal and flood water levels through the wetland from the east end of the Mine Site to the west
end. Between the headwaters and Dunka Road, the Partridge River has a maximum slope of
approximately 0.6 percent. The flood levels downstream of Dunka Road are more than 20 feet
lower than most of the adjacent Mine Site perimeter ground elevations. There is very little risk
from Partridge River flooding on the east and south sides of the Mine Site.
The increase in flood elevation from the 100-year event to the 500-year event on the Partridge
River is relatively minor, varying from 0.1 to 0.5 feet on the north and east sides of the Mine Site
to 1.0 foot upstream of the railroad crossing in the southeast corner of the Mine Site.

Date: January 9, 2012 NorthMet Project
Water Management Plan - Mine
Version: 2 Page 6
2.0 Process Water and Stormwater Management System Design
The water at the Mine Site will be managed by keeping the stormwater separate from the process
water through a system of ditches, dikes and ponds. Each of these terms is defined specifically
for this Project, as follows:
Stormwater is the result of precipitation or snowmelt runoff that falls on natural or
reclaimed surfaces, including reclaimed stockpiles, and all surface runoff that has not
been exposed to mining activities. Stormwater is expected to meet water quality
standards after sedimentation ponds remove total suspended solids (TSS) prior to being
discharged off-site.
Process water includes precipitation and snowmelt runoff and collected groundwater (pit
dewatering water) that has contacted surfaces disturbed by mining activities, such as
drainage collected on stockpile liners and runoff contacting exposed ore and waste rock
and Mine Site haul road surfaces. Runoff from the Overburden Storage and Laydown
Area (OSLA) is also considered process water.
Construction water will be managed as both process water and stormwater depending on its
water quality. Generally, if water quality sampling shows that runoff from construction areas
meet surface water discharge requirements other than for TSS, the discharges will be considered
stormwater; if sampling shows that it does not meet water quality discharge requirements, the
runoff will be handled as process water. If water quality sampling has not been performed, the
following will apply:
Runoff from construction areas with no excavation will be managed as stormwater;
Runoff from construction areas where the majority of the material being excavated is
Unsaturated Overburden or Peat will be managed as stormwater; and
Runoff and groundwater from construction areas of mainly Saturated Overburden (i.e.,
dewatering) will be managed as process water.
The process water system including sumps, ponds, and the piping network for Mine Years 1, 11
and 20 are shown on Large Figure 4 through Large Figure 6. The stormwater system including
dikes, ditches, culverts and sedimentation ponds for Mine Years 1, 11, and 20 are shown on
Large Figure 7 through Large Figure 9.
Date: January 9, 2012 NorthMet Project
Water Management Plan - Mine
Version: 2 Page 7
2.1 Process Water
Process water includes runoff1 and groundwater that has contacted surfaces disturbed by mining
activities such as active stockpiles, water from the Category 1 Waste Rock Stockpile
Groundwater Containment System and pit dewatering. This water may not meet water quality
discharge limits for metals or other constituents and as a result, may require treatment at the
WWTF prior to being pumped through the Treated Water Pipeline (TWP) to the FTB for use as
plant make-up water or for East Pit flooding in later years. Process water will be intercepted by
ditches, dikes and stockpile foundation liners/containment system to keep it separate from the
stormwater collection and conveyance systems. Design drawings and flow diagrams of the
mechanical infrastructure, which includes the TWP, Central Pumping Station (CPS) and process
water systems, will be provided in Attachment A during permitting.
Drawing ME-003 of Attachment A (to be provided in permitting) provides a flow diagram of the
process water collection and conveyance system from each source to the FTB at the Plant Site or
the East Pit. Process water sources include mine pits, waste rock and ore stockpiles, the OSLA,
and other mine infrastructure such as haul roads, the Rail Transfer Hopper (RTH) and the Mine
Site Fueling and Maintenance Facility (MSFMF).
There are three types of stockpiles that generate process water:
Overburden stockpiles in the OSLA
Waste rock stockpiles (Category 1, 2/3, and 4)
The Ore Surge Pile (OSP)
Precipitation coming in contact with each of these stockpiles will be managed as process water
until the stockpiles are reclaimed. Runoff from the OSLA will be considered process water due
to the concern regarding Peat drainage potentially containing elevated levels of mercury. As
described in Section 5.2 of Reference (1), the Category 1 Waste Rock Stockpile is the only
permanent stockpile and will be reclaimed. Once reclaimed, surface runoff from the Category 1
Waste Rock Stockpile will be managed as stormwater. The Category 2/3 and 4 waste rock
1Runoff is defined in this document as the total volume of stormwater or process water that collects above
ground. According to this definition, the runoff from active stockpiles is process water and the runoff from
reclaimed stockpiles is stormwater. Runoff from active stockpiles includes the total yield from surface runoff,
liner drainage and leakage through the liner. Runoff from reclaimed stockpiles includes flows from the top of
the cover and interflow that infiltrates into the cover and exits the stockpile without contacting the waste rock.

Date: January 9, 2012 NorthMet Project
Water Management Plan - Mine
Version: 2 Page 8
stockpiles are temporary, and the footprints will be reclaimed after the material is relocated to the
mined out East Pit for subaqueous disposal and the liner systems are removed. The ore in the
OSP will be removed by the end of Mine Year 20, the liner will be removed, and the footprint
will be reclaimed.
As described in Section 3.4.3 of Reference (4), incremental reclamation of the Category 1 Waste
Rock Stockpile is planned beginning in Mine Year 14. The timing of cover placement will have
a large impact on the water flows. The total flow from the reclaimed stockpile will include:
Infiltration through the cover that drains through the waste rock and is stored in the
stockpile. This process water will not be seen in any collection system.
Infiltration through the cover that drains through the waste rock and is collected by the
groundwater containment system and routed to the WWTF. Design of the groundwater
containment system is provided in Section 2.1.2 of Reference (3).
Infiltration through the cover that drains through the waste rock, bypasses the
containment system and flows via groundwater to the pits for collection as process water
during operations or to the West Pit lake during reclamation and long-term closure.
Surface runoff from the stockpile cover (stormwater) that will be collected by the
stormwater ditch surrounding the stockpile and routed through sedimentation ponds prior
to off-site discharge or routed to the West Pit lake during reclamation.
2.1.1 Design Criteria for the Process Water Systems
Design criteria for the process water design features are provided in Table 2-1 with preliminary
sizing of the components listed on Drawing ME-004 of Attachment A (to be provided in
permitting). All process water system components at the Mine Site have been designed to route
process water by gravity flow to sumps or process water ponds that are designed to contain water
from a component-specific “design event”. The design event chosen for each component was
based on the expected quality of water handled by the component and the overflow potential of
the component. This allows matching the level of protection applied to the component to the
expected water quality handled by the component and the potential for overflows by choosing
larger design events as necessary. Water from the sumps and process water ponds will be
pumped to the WWTF, if needed, and then to the CPS pond. The CPS will pump water from the
pond through the TWP to the FTB or the East Pit during pit flooding.
The following sections describe the design of the major components of the Process Water
System, which includes the collection and conveyance of water from the pits, the waste rock
stockpiles, the OSLA, the OSP and applicable construction areas.

Date: January 9, 2012 NorthMet Project
Water Management Plan - Mine
Version: 2 Page 9
Table 2-1 Design Criteria for Process Water Infrastructure
Infrastructure Draining Process Water
Structure Name(1) Design Event Overflow Pond Design Event
Category 1 Waste Rock Stockpile
Groundwater Containment System
(Section 2.1.2 of Reference (3))
100-year, 24-hour
(2)
Not applicable (N/A)
Category 2/3 Waste Rock Stockpile
S23-1, S23-2, S23-3; PW-S23-1, PW-S23-3
2
Sump: 10-year, 24-hour
2
100-year, 24-hour less sump capacity
2
Category 4 Waste Rock Stockpile S4; PW-S42
Sump: 10-year, 24-hour
2
100-year, 24-hour less sump capacity
2
Ore Surge Pile SOSP; PW-SOSP Sump: 10-year,
24-hour2
100-year, 24-hour less sump capacity
2
Rail Transfer Hopper PW-RTH Pond: 100-year,
24-hour2
N/A
Haul Roads PW-HRE, PW-HRN, PW-HRC, PW-HRW
Pond: 100-year, 24-hour
2
N/A
Overburden Storage and Laydown Area
PW-OSLA 25-year, 24-hour2 N/A
Pit Pumps and Pipes Varies Annual snowmelt event (removal within 3 days)
N/A
Other Pumps / Pipes Varies Annual snowmelt event (removal within 30 days)
N/A
(1) Process water sumps are named with the prefix S followed by an abbreviation of the infrastructure the drainage is coming from. Process water ponds are named with the prefix PW followed by an abbreviation of the infrastructure the drainage is coming from.
(2) All process water sumps and ponds include a safety factor in the form of freeboard in addition to the design storm volume.
2.1.2 Mine Site Water Balance
The details of the Mine Site water balance can be found in Section 6.1 of Reference (2). The
details include quantification and breakdown of the stormwater, groundwater and process water,
including the water balance associated with the stockpiles.
2.1.3 Pit Dewatering
The estimated average annual inflow rates and peak inflow rates for the three pits were modeled
as part of Reference (2) and are listed in Table 2-2. Mine pit inflows will be directed to sumps

Date: January 9, 2012 NorthMet Project
Water Management Plan - Mine
Version: 2 Page 10
within the pits where the water can be collected and pumped to the WWTF. The mine pit pump
capacities have been designed to minimize delay to mining operations during the typical spring
snowmelt event.
Table 2-2 Mine Pit Inflows
Mine Pit
Inflow Component
Mine Year 1 Inflows(1)
Mine Year 11 Inflows(1,2)
Mine Year 20 Inflows(1)
Average Annual (gallons
per minute [gpm])
90th Percentile
(gpm)
Average Annual (gpm)
90th Percentile
(gpm)
Average Annual (gpm)
90th Percentile
(gpm)
West Pit
Groundwater
Not Applicable
68 90 46 61
Runoff 240 300 240 300
Total(3)
310 370 290 350
Central Pit
Groundwater
Not Applicable
20 26 10 13
Runoff 5.3 6.6 65 78
Total(3)
25 32 75 89
East Pit
Groundwater(4)
43 57 280 370 100 130
Runoff 100 130 130 160 210 250
Total(3)
150 180 410 500 310 350
(1) Source of data: Section 6.1 of Reference (2) (2) The Central Pit exists for only a portion of Mine Year 11; the values shown are for the latter third of the year when
the pit is operational. The East Pit begins to be backfilled in Mine Year 11, but backfilling does not significantly change the natural inflows to the pit; the values shown are for the entire year.
(3) Groundwater and runoff values do not sum to totals due to probabilistic model (high groundwater and high runoff conditions do not necessarily occur simultaneously.
(4) East Pit groundwater inflows are significantly higher than the West and Central Pit inflows due to its proximity to the Virginia Formation. The hydraulic conductivity of the Virginia Formation is almost 3 orders of magnitude higher than the Duluth Complex. The East Pit intersects the Virginia Formation, and the West and Central pits do not.
Water management within the pit will occur as part of mine development, with the pit floors
sloped toward collection sumps. The sumps will be excavated as part of mine operations. Pumps
in the sumps will either be submersible pumps or pumps on a raft floating in the sump. These
pumping systems could include one single large pump or several smaller pumps, depending on
an optimization analysis. Hoses will connect the pumps to pipes which may connect to additional
pumps at the rim of the pits conveying the water to the WWTF. The alignment of the pit
dewatering system is based on the future pit development, thus minimizing the need to
frequently move the pipes. In locations where a pipe will intersect a road, the pipes will be
placed inside a culvert or a larger pipe buried under the road. Hoses may be used in some places,
where design allows, providing operational flexibility and simplicity.
Date: January 9, 2012 NorthMet Project
Water Management Plan - Mine
Version: 2 Page 11
Inflows to the pits include contributions from groundwater and runoff within the pit. The size
and location of the sumps and pumps will change as the pits expand in size and depth, requiring
periodic evaluation of the pumping system. Pump capacities are based on peak annual flows
from the snowmelt event, assuming a rapid spring snowmelt (40 percent of the snowmelt
occurring within one day). The pumping systems are designed to handle groundwater inflows
and the average annual runoff volumes from a snowmelt event, removing approximately 100
percent of the groundwater inflows and 40 percent of the annual snowmelt runoff (1.28 inches)
within 3 days; the volume from this snowmelt event is approximately equivalent to the runoff
volume expected in the pits during the 5-year, 24-hour storm event. The sumps are designed with
capacity to hold the remaining volume from this snowmelt runoff event.
In the event that a storm exceeds the sump and pump capacity, the lowest level of the pit will be
used to store the excess water, with mining operations relocated to higher levels or delayed until
water levels are pumped down. During extreme storm events, pit dewatering may temporarily be
stopped to allow the WWTF to handle the increased volumes from other process water sources to
minimize overflow of process water sumps and ponds across the Mine Site.
The pipes associated with these pumps are sized to maintain average velocities less than 5 feet
per second to minimize friction losses and surge pressures (water hammer) in the pipes. The
pump sizes were evaluated for each Mine Year, because, as the pits deepen, larger pumps will be
needed to overcome the change in static head.
The number and size of pumps will be evaluated on a regular basis due to changes in head,
pumping distances and availability of electrical power sources.
The preliminary pit sump, pump and pipe sizes for pit dewatering are listed on Drawing ME-004
of Attachment A (to be provided in permitting). Pipe configurations for pit dewatering are shown
on Drawings PW-001, PW-002 and ME-003 of Attachment A for Mine Years 1 and 11 (to be
provided in permitting).
2.1.4 Stockpile Drainage
The design of the stockpile liner and underdrain system for the Category 2/3 and Category 4
waste rock stockpiles and the OSP, and the Category 1 Waste Rock Stockpile Groundwater
Containment System are described in Section 2.1 of Reference (3). This section discusses the
evaluation of leakage through the liners, the collection of water on top of the liners and the
routing of the process water away from the temporary stockpiles, and the containment system for
collection of drainage from the Category 1 Waste Rock Stockpile.
Table 2-3 presents the range of total annual process water volumes and flow rates estimated from
the temporary stockpiles based on modeling results. These annual volumes assume that process
water drainage from the stockpiles will begin within the first year and that all process water is
conveyed to the sumps.

Date: January 9, 2012 NorthMet Project
Water Management Plan - Mine
Version: 2 Page 12
Table 2-3 Temporary Stockpile Drainage
Stockpile
Mine Year 1(1) Mine Year 11(1,2) Mine Year 20(1,3)
Average Annual Inflow (gpm)
90th Percentile
Inflow (gpm)
Average Annual Inflow (gpm)
90th Percentile
Inflow (gpm)
Average Annual Inflow (gpm)
90th Percentile
Inflow (gpm)
Category 2/3 Waste Rock
44 52 120 140 9.3 11
Category 4 Waste Rock
20 24 38 45 Not Applicable
Ore Surge Pile 20 24 20 24 20 24
(1) Source of data: Section 6.1 of Reference (2) (2) The Category 4 Waste Rock Stockpile exists through the first half of Mine Year 11; the stockpile is removed in the
latter half of the year. (3) All mass is removed from the Category 2/3 Waste Rock Stockpile by the end of Mine Year 19. The Mine Year 20
values represent the water collected on the liner as it is being removed and the stockpile is being reclaimed.
2.1.4.1 Temporary Stockpile Drainage Collection Systems
As described in Section 2.1.3 of Reference (3), the temporary stockpiles, which include the
Category 2/3 and 4 waste rock stockpiles and the OSP, have drainage systems with underdrains
in the foundation that will flow by gravity to underdrain sumps in addition to the stockpile liner
drainage systems that will flow by gravity to process water sumps and overflow ponds. The
water will be pumped from the process water sumps to the WWTF for treatment before being
sent to the CPS to be pumped through the TWP to the FTB or to the East Pit for pit filling. This
section describes the design of the stockpile sumps and the overflow ponds that collect the water
from the temporary stockpile liner system. See Section 2.1.3 of Reference (3) for design of the
foundation underdrain sumps.
2.1.4.1.1 Temporary Stockpile Overliner Sump and Overflow Pond Design
Process water sumps will be located along the perimeter of the temporary stockpiles to collect
overliner runoff, as shown in Large Figure 4 through Large Figure 6. The number of process
water sumps associated with each stockpile depends on the stockpile foundation design (see
Section 2.1.3 of Reference (3)), as follows:
The Category 2/3 Waste Rock Stockpile will have 3 sumps, S23-1, S23-2, and S23-3,
located on the south side of the stockpile, between the stockpile and Dunka Road.
Overflow process water ponds include PW-S23-1, which provides overflow capacity for
S23-1 and S23-2, and PW-S23-3, which provides overflow capacity for S23-3.
The Category 4 Waste Rock Stockpile will have one sump, S4, located on the south side
of the stockpile, with one overflow pond PW-S4.

Date: January 9, 2012 NorthMet Project
Water Management Plan - Mine
Version: 2 Page 13
The OSP will have one sump, SOSP, located on the southwest side of the OSP, with one
overflow pond PW-SOSP.
The sumps will be designed to contain process water drainage from active stockpiles during a
10-year, 24-hour rainfall event with the flood level below the stockpile liner discharge pipe
elevation. To minimize uncontrolled overflows from the sumps, the volume generated by the
100-year 24-hour storm event in excess of the sump capacity will flow by gravity to overflow
ponds adjacent to each sump. Dikes will be constructed around the perimeter of each sump and
pond with a combined capacity for the 100-year, 24-hour process water yield plus a safety factor
in the form of freeboard. Further discussion of overflows is included in Section 4.4. Preliminary
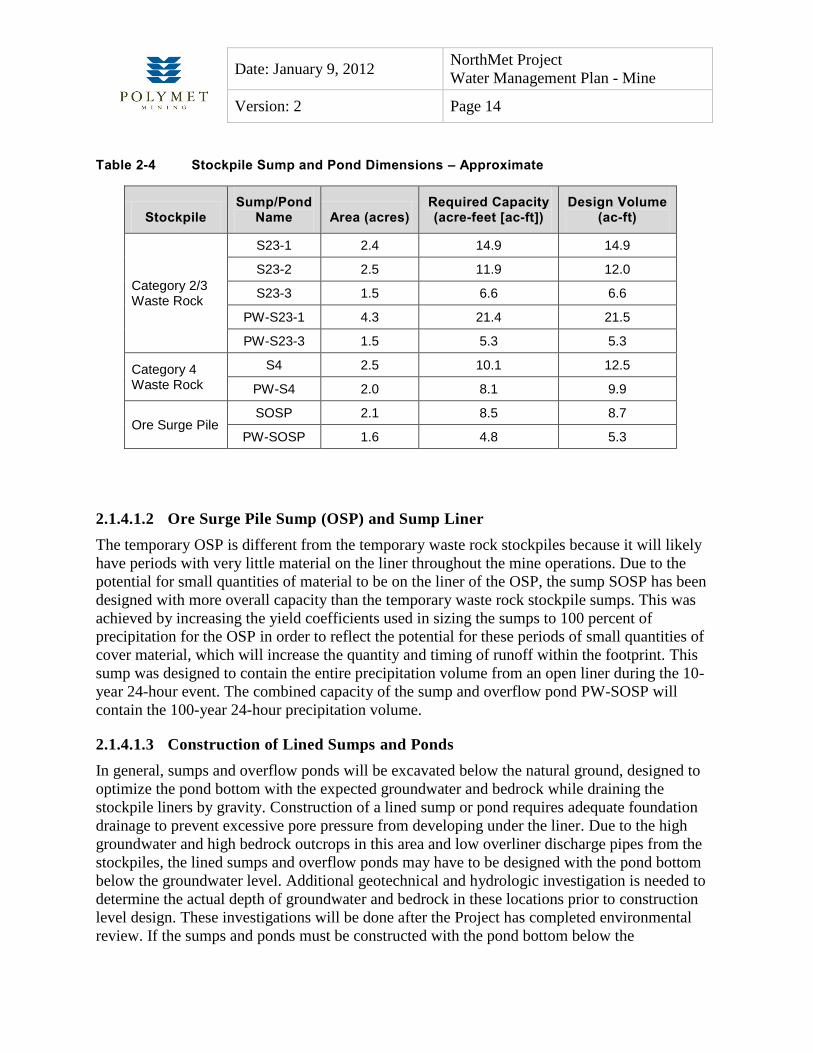
sump and pond footprints for the temporary stockpiles are listed in Table 2-4.
The temporary stockpile process water sumps will be constructed with a double composite liner
system consisting of an upper high-density polyethylene (HDPE) primary liner underlain by a
geonet leak collection and recovery system (LCRS) which is underlain by a secondary HDPE
liner which overlies a one-foot thick soil liner as shown in Detail 2 of Drawing PW-014 of
Attachment A (to be provided in permitting) or equivalent protection. Overflow ponds will be
constructed with a single liner system overlying a one-foot thick soil liner as shown on Detail 1
of Drawing PW-014 of Attachment A (to be provided in permitting). Temporary stockpile
process water sumps and ponds are designed with an average depth between 6 and 12 feet
depending on the depth to bedrock, depth to groundwater and stockpile outlet pipe elevation.
Drawings PW-003 to PW-007 of Attachment A (to be provided in permitting) show the layout of
each of these sumps and associated overflow ponds.
The sump and pond dikes and slopes will be vegetated to limit erosion. The design will be
finalized once the foundation grading design is completed, and sump and pond elevations can be
established. This will be dependent on site-specific investigations of depth to bedrock and depth
to groundwater. The design elevations will allow runoff from the temporary stockpiles to be
conveyed by gravity into the sumps with gravity overflow into the overflow ponds. The outlet for
both the sumps and ponds will be a pump and piping system to convey this process water to the
WWTF.
Date: January 9, 2012 NorthMet Project
Water Management Plan - Mine
Version: 2 Page 14
Table 2-4 Stockpile Sump and Pond Dimensions – Approximate
Stockpile Sump/Pond
Name Area (acres) Required Capacity (acre-feet [ac-ft])
Design Volume (ac-ft)
Category 2/3 Waste Rock
S23-1 2.4 14.9 14.9
S23-2 2.5 11.9 12.0
S23-3 1.5 6.6 6.6
PW-S23-1 4.3 21.4 21.5
PW-S23-3 1.5 5.3 5.3
Category 4 Waste Rock
S4 2.5 10.1 12.5
PW-S4 2.0 8.1 9.9
Ore Surge Pile SOSP 2.1 8.5 8.7
PW-SOSP 1.6 4.8 5.3
2.1.4.1.2 Ore Surge Pile Sump (OSP) and Sump Liner
The temporary OSP is different from the temporary waste rock stockpiles because it will likely
have periods with very little material on the liner throughout the mine operations. Due to the
potential for small quantities of material to be on the liner of the OSP, the sump SOSP has been
designed with more overall capacity than the temporary waste rock stockpile sumps. This was
achieved by increasing the yield coefficients used in sizing the sumps to 100 percent of
precipitation for the OSP in order to reflect the potential for these periods of small quantities of
cover material, which will increase the quantity and timing of runoff within the footprint. This
sump was designed to contain the entire precipitation volume from an open liner during the 10-
year 24-hour event. The combined capacity of the sump and overflow pond PW-SOSP will
contain the 100-year 24-hour precipitation volume.
2.1.4.1.3 Construction of Lined Sumps and Ponds
In general, sumps and overflow ponds will be excavated below the natural ground, designed to
optimize the pond bottom with the expected groundwater and bedrock while draining the
stockpile liners by gravity. Construction of a lined sump or pond requires adequate foundation
drainage to prevent excessive pore pressure from developing under the liner. Due to the high
groundwater and high bedrock outcrops in this area and low overliner discharge pipes from the
stockpiles, the lined sumps and overflow ponds may have to be designed with the pond bottom
below the groundwater level. Additional geotechnical and hydrologic investigation is needed to
determine the actual depth of groundwater and bedrock in these locations prior to construction
level design. These investigations will be done after the Project has completed environmental
review. If the sumps and ponds must be constructed with the pond bottom below the

Date: January 9, 2012 NorthMet Project
Water Management Plan - Mine
Version: 2 Page 15
groundwater level, the following options will be evaluated to prevent excessive pore pressures
from building up below the liners:
The stockpile underdrain sumps could be extended below the sump and pond bottom to
allow for pumping to maintain dry foundations. The advantage of this is that it minimizes
the number of pumps on-site; however, the disadvantage is that it will increase the
amount of water pumped and managed.
A separate underdrain system could be installed below the sump and pond bottom to
allow for pumping to maintain dry foundations. The advantage of this is that it is separate
from the stockpile underdrain system and could potentially be discharged off-site (clean
groundwater); however, this will increase the number of pumps required for increased
capital and maintenance costs.
A clay liner could be used instead of the geomembrane liners. The advantage of this will
be that an underdrain system with a separate pump and piping system will not be needed
below the sumps and ponds; however, use of a clay liner will increase the amount of
water pumped due to increased leakage rates into the sump and pond to maintain inward
drainage rather than leakage out of the sumps and ponds to groundwater.
The ballast, or weight on top of the liner, in the sump and pond could be increased to
counteract the buoyancy forces of groundwater. The advantage of this option is that there
will be no additional pumping or piping systems required and no extra water to manage
and treat. However, the ballast used to hold down the liner will reduce the capacity of the
sumps/ponds, so increased volumes will be required.
These options will be evaluated after the additional geotechnical and hydrologic investigation are
performed.
2.1.4.2 Category 1 Waste Rock Stockpile Groundwater Containment System
A groundwater containment system will be constructed to capture stockpile drainage from below
the Category 1 Waste Rock Stockpile and will convey this water to sumps for collection and
further pumping to the WWTF. Drainage through the stockpile is significantly reduced once
portions of the stockpile are reclaimed. See Section 2.1.2 of Reference (3) for more details of this
design.
2.1.5 Process Water Ponds for Other Infrastructure
Process water ponds provide storage for gravity flow of process water volumes during large
rainfall or snowmelt events and during short power outages. Apart from the temporary stockpile
ponds, there will be six other process water ponds constructed at the Mine Site, as shown on
Large Figure 4 through Large Figure 6 and Drawing PW-001 and PW-002 of Attachment A (to
be provided in permitting). These include:
Date: January 9, 2012 NorthMet Project
Water Management Plan - Mine
Version: 2 Page 16
PW-OSLA will collect drainage from the OSLA
Haul road ponds include PW-HRE, PW-HRW, PW-HRN, and PW-HRC
The RTH drains to PW-RTH
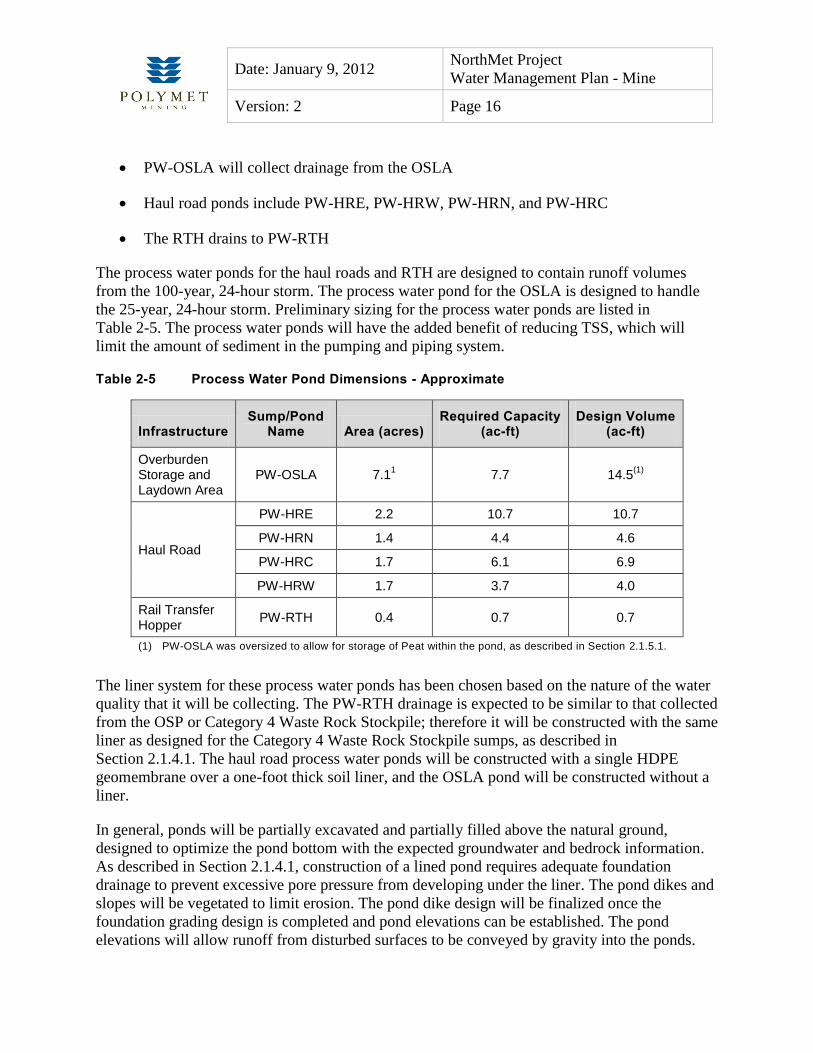
The process water ponds for the haul roads and RTH are designed to contain runoff volumes
from the 100-year, 24-hour storm. The process water pond for the OSLA is designed to handle
the 25-year, 24-hour storm. Preliminary sizing for the process water ponds are listed in
Table 2-5. The process water ponds will have the added benefit of reducing TSS, which will
limit the amount of sediment in the pumping and piping system.
Table 2-5 Process Water Pond Dimensions - Approximate
Infrastructure Sump/Pond
Name Area (acres) Required Capacity
(ac-ft) Design Volume
(ac-ft)
Overburden Storage and Laydown Area
PW-OSLA 7.11 7.7 14.5
(1)
Haul Road
PW-HRE 2.2 10.7 10.7
PW-HRN 1.4 4.4 4.6
PW-HRC 1.7 6.1 6.9
PW-HRW 1.7 3.7 4.0
Rail Transfer Hopper
PW-RTH 0.4 0.7 0.7
(1) PW-OSLA was oversized to allow for storage of Peat within the pond, as described in Section 2.1.5.1.
The liner system for these process water ponds has been chosen based on the nature of the water
quality that it will be collecting. The PW-RTH drainage is expected to be similar to that collected
from the OSP or Category 4 Waste Rock Stockpile; therefore it will be constructed with the same
liner as designed for the Category 4 Waste Rock Stockpile sumps, as described in
Section 2.1.4.1. The haul road process water ponds will be constructed with a single HDPE
geomembrane over a one-foot thick soil liner, and the OSLA pond will be constructed without a
liner.
In general, ponds will be partially excavated and partially filled above the natural ground,
designed to optimize the pond bottom with the expected groundwater and bedrock information.
As described in Section 2.1.4.1, construction of a lined pond requires adequate foundation
drainage to prevent excessive pore pressure from developing under the liner. The pond dikes and
slopes will be vegetated to limit erosion. The pond dike design will be finalized once the
foundation grading design is completed and pond elevations can be established. The pond
elevations will allow runoff from disturbed surfaces to be conveyed by gravity into the ponds.

Date: January 9, 2012 NorthMet Project
Water Management Plan - Mine
Version: 2 Page 17
The outlet for the haul road ponds and the RTH pond will be a pump and piping system to
convey this process water to the WWTF. The outlet for the OSLA pond will be a pump and
piping system to convey the process water directly to the CPS pond unless monitoring shows that
treatment is necessary.
2.1.5.1 Overburden Storage and Laydown Area (OSLA) Drainage
This section describes the collection and conveyance of runoff from the OSLA including design
of the process water pond.
As described in Section 2.2.3 of Reference (1), the OSLA is a temporary storage area used to
screen, sort and temporarily store Unsaturated Overburden and Peat that may be used for future
construction or reclamation purposes. As described in Reference (1), the area will be graded to
provide a relatively even, well drained site while directing surface runoff to process water pond
PW-OSLA at the southwest corner of the area. Pond PW-OSLA was designed to accommodate
runoff from the 25-year, 24-hour storm event with three feet of freeboard. As shown on
Table 2-5, this pond was oversized to allow for storage of Peat within the pond to maintain
wetland characteristics for future restoration.
Surface runoff from the OSLA is considered process water, because there is concern about the
potential release of mercury from Peat storage. Surface runoff from the OSLA will drain to a
process water pond for storage and reduction of TSS. The water in Pond PW-OSLA is not
expected to require treatment for dissolved substances; however, water quality will be
continually monitored throughout the life of the mine. The water will be pumped from the
process water pond directly to the CPS and on to the FTB where any mercury will be sequestered
in the FTB or to the East Pit during pit filling.
2.1.5.2 Haul Road Drainage
The quality of the water coming off the haul roads will be related to the amount and type of
waste rock and ore spillage occurring on the roadways; therefore drainage from the haul roads
will be collected in process water ditches and directed to one of four lined haul road ponds. Haul
roads will generally be kept clear of material for safe travel of the vehicles and as part of best
management practices at the Mine Site.
As shown on Table 2-5, haul road drainage will be directed to four separate process water ponds,
PW-HRE, PW-HRN, PW-HRC and PW-HRW, as shown on Large Figure 4 through Large
Figure 6 and on Drawings PW-001 and PW-002 of Attachment A (to be provided in permitting).
PW-HRE is located on the south side of the haul road leading to the Category 2/3 Waste Rock
Stockpile, west of the OSP. PW-HRW is located along the haul road to the West Pit, between the
haul road and the OSLA. PW-HRN is located south of the Category 4 Waste Rock Stockpile and
Central Pit, east of the West Pit, at the intersection of two haul roads. PW-HRC is located on the
south side of the haul road leading to the OSP. PW-HRC and PW-HRE will be needed in Mine

Date: January 9, 2012 NorthMet Project
Water Management Plan - Mine
Version: 2 Page 18
Year 1, while PW-HRW and PW-HRN will be constructed as the haul roads are expanded to
those areas.
Haul road ponds have been designed to contain runoff from the 100-year, 24-hour storm event
with three feet of freeboard with design capacities as listed on Table 2-5. Drainage from the haul
roads will be directed to these process water ponds prior to being pumped to the WWTF. In some
cases, haul road runoff may be directed to a mine pit and included in mine dewatering rather than
routed to these ponds.
The haul roads will either be constructed to divide surface runoff to both sides of the road by
crowning the middle of the road or by directing all surface runoff to one side by super-elevating
one side of the road. Depending on the height of these roads above the natural grade, ditches will
either be built in the road section or adjacent to the road. These process water ditches will only
collect surface runoff from the road cross-section. Stormwater runoff from adjacent areas will be
intercepted before entering the road section and routed to stormwater ponds. This may mean
construction of parallel ditches in some areas, one for process water and one intercepting
adjacent stormwater. This will minimize the size of the process water ditches and the amount of
water requiring treatment from haul road drainage.
The haul roads will be constructed with safety berms as required by the Mine Safety and Health
Administration (MSHA) and described in Section 2.1 of Reference (1). The safety berms will be
constructed of coarse rock to allow surface drainage from the haul roads to flow through the
berm into the process water ditches.
2.1.5.3 Rail Transfer Hopper (RTH) Area Drainage
As described in Section 2.2.1 of Reference (1), the RTH is used for loading ore into rail cars.
Due to the nature of the work and potential for ore spillage, surface runoff from the RTH active
areas will be considered process water. The layout of the RTH consists of a raised platform on
which haul trucks enter and exit the area and from which they dump ore into a hopper over a pan
feeder, which conveys the ore into rail cars. There will be a sloped concrete floor within the
RTH, directing runoff to the south. The runoff will cross the rail spur on sloped concrete panels
to a small swale along the south side of the railroad track to pond PW-RTH. Water from PW-
RTH will get pumped to the adjacent OSP sump for further conveyance to the WWTF.
Pond PW-RTH will be designed to accommodate runoff volumes from the 100-year, 24-hour
storm event from the RTH with additional freeboard.
2.1.6 Waste Water Treatment Facility (WWTF)
Mine Site process water, with the exception of process water from the OSLA, will be treated at
the WWTF and then pumped to the FTB for re-use or to the East Pit during pit filling after Mine
Year 11. The purpose of this water treatment is to maintain the overall water quality in the FTB
at or below process water quality targets in order to manage the water quality of groundwater
seepage from the FTB. The design and treatment process of the WWTF can be modified as

Date: January 9, 2012 NorthMet Project
Water Management Plan - Mine
Version: 2 Page 19
needed to meet the required water quality targets. Because the design of the WWTF can be
adapted as modeling and monitoring require, the details of the design are included in Section 2.2
of Reference (4).
The WWTF will be located west of the RTH, as shown on Large Figure 4. Process water streams
at the Mine Site will be combined into three waste streams for treatment at the WWTF.
Construction water will be treated in a construction water stream and would only be needed
through approximately Mine Year 11. Process water containing relatively high levels of metals
and sulfate (drainage from the temporary Category 2/3 and Category 4 Waste Rock Stockpile
liners and the temporary OSP liner) will be stored in the West Equalization Basin (West EQ
Basin) and routed to the chemical precipitation treatment train. Process water containing
relatively low concentrations of metals and sulfate (drainage from haul roads, the RTH, pit
dewatering and Category 1 Waste Rock Stockpile drainage) will be stored in the East
Equalization Basin (East EQ Basin) and routed to the membrane filtration treatment train.
The WWTF effluent will flow by gravity to the CPS pond to be blended with the OSLA runoff
prior to being pumped through the TWP for use at the FTB or used to supplement flooding of the
East Pit after approximately Mine Year 11.
2.1.7 Central Pumping Station (CPS) and Treated Water Pipeline (TWP)
Process water treated by the WWTF and process water from the OSLA that does not need
treatment are discharged into the CPS pond, which is the collection point for all water that will
be pumped to the FTB or to the East Pit during pit filling. Consequently, the CPS pond will be
constructed with a clay liner to minimize loss of water from leakage. The CPS pond will have an
active storage capacity of approximately 1.2 million gallons and three feet of freeboard.
The CPS houses three pumps that have a combined design capacity of 4,000 gpm. All of the
water collected in the CPS pond will be pumped through the TWP to the FTB (see Drawing ME-
003 of Attachment A, to be provided in permitting), with the exception of any water needed
during East Pit flooding operations, starting in Mine Year 12. A pipeline will be constructed
from the CPS to the pits to facilitate pit flooding. Flows through the CPS are expected to be
continuous year-round, with lower flows during the winter months and during periods with low
precipitation. The CPS pond is expected to receive flows that do not vary significantly as a result
of storm and snowmelt events due to the upstream storage in process water ponds and the
WWTF equalization basins and treatment units.
The TWP will be used continuously throughout the year and will be designed and constructed to
prevent freezing in the winter. The TWP will consist of the pipeline, air/vacuum relief valves,
drain valves and in-line flow meters on each end of the TWP.
The alignment selected for the TWP is parallel to the existing Dunka Road alignment and has a
total length of approximately 40,000 feet. The TWP will be designed so that it safely discharges

Date: January 9, 2012 NorthMet Project
Water Management Plan - Mine
Version: 2 Page 20
into the water in the FTB to prevent any potential erosion of tailings or the FTB dams. The
following criteria were used in selecting this route:
The TWP will be next to Dunka Road, which will be utilized for daily Mine traffic. This
means that the corridor will be under regular observation by mine personnel. In the
unlikely event that a leak should develop, it can be quickly identified and repaired. In
addition, flow meters at both ends of the TWP will allow for quick detection of any loss
of fluid.
Wetland impacts along this established route are not as great as along the other
alignments considered.
The alignment never crosses a major road planned for regular mine traffic or a rail line,
minimizing the risk of structural failure due to surface loads from heavy mine vehicles or
trains.
The majority of the route is in areas already disturbed by previous activities.
This route provides easy access for operations, maintenance and repairs of the TWP.
Preliminary review of the alignment did not identify any major constructability concerns.
The TWP will be designed to handle flow rates from 1,000 to 4,000 gpm. The maximum total
design head (static plus dynamic) is estimated at approximately 470 feet at the maximum design
flow. In order to accommodate this range of flow rates, a nominal pipe diameter of 16 inches was
selected. Smaller pipe diameters result in a significant increase in pumping head at higher flows,
and larger pipe diameters result in unacceptably slow velocities at lower flow rates. Pipeline
velocities will vary from approximately 1.8 feet per second (fps) at 1,000 gpm up to 7 fps at
4,000 gpm. These pipe velocities are considered acceptable by current design standards.
The TWP drawings included in Attachment A (to be provided in permitting) include the general
layout (Drawing TWP-001), plan and profile sheets (Drawing TWP-002 to TWP-009), typical
sections (Drawing TWP-010), and details of the installation (Drawing TWP-011). Because
varying topographic conditions along the TWP corridor will require different installation
methods, five typical cross-sections have been developed to illustrate the method of construction.
Although it is anticipated that the five standard cross-sections shown on Drawing TWP-010 will
address most conditions encountered, variations and modifications to these standard
arrangements may occasionally be necessary. Where modifications are required in the field, they
will be done in conjunction with the Engineer. The TWP will be constructed to generally follow
the surface profile of the corridor with sufficient cut and backfill to avoid abrupt changes in
elevation. The TWP layout also avoids abrupt changes in direction. Automatic air/vacuum relief
valves will be placed along the alignment at the high points as shown on the plan and profile
sheets. Likewise, manually operated drain valves will be provided at the low points to allow
drainage of pipeline sections for maintenance.

Date: January 9, 2012 NorthMet Project
Water Management Plan - Mine
Version: 2 Page 21
2.2 Stormwater Management
Stormwater is precipitation that falls on natural or reclaimed vegetated surfaces, which includes
reclaimed portions of the permanent Category 1 Waste Rock Stockpile, and is expected to meet
water quality standards after being routed through sedimentation ponds to remove TSS prior to
flowing off-site. Additionally, runoff from the Dunka Road corridor including the adjacent
railroad (which will generally remain in its existing condition) will contribute to the stormwater
runoff volumes from the Mine Site.
The Mine Site stormwater management system will be developed as required throughout the
mining operation to control site stormwater up to the 100-year, 24-hour storm event. The overall
system capacity will be based on the Mine Site configuration, and the individual segments will
be installed when needed, as shown on Large Figure 7 through Large Figure 9. Permit design
drawings of the stormwater system will be included in Attachment B during permitting
Stormwater management is modified during reclamation and during long-term closure, including
filling of some ditches, construction of some new ditches, and reclamation of the sedimentation
ponds into wetlands or uplands, as described in Section 7.0.
Stormwater in and around the Mine Site will be managed in a manner that reduces potential
impacts to mining activities, protects the environment and maintains existing flow patterns to the
extent practicable. The volume and rate of stormwater flows will be altered by construction of
stockpiles, pits and mine infrastructure (haul roads, RTH, OSLA, etc.), because runoff from
these areas will be captured and treated as process water.
Stormwater flowing on and off the Mine Site will be controlled by natural watershed divides and
a series of dikes and ditches constructed around the perimeter of the Mine Site, along the pit rims
and around the interior of the Mine Site. Sedimentation ponds will be constructed along the
perimeter of the Mine Site to reduce TSS from these stormwater ditches prior to discharging off-
site.
2.2.1 Stormwater Modeling
The stormwater ditches and sedimentation ponds were modeled using XP-SWMM, Version 10.6,
which is a software package used to model stormwater, sanitary water and river systems. The
design for the stormwater ditches and sedimentation ponds was based on a critical year, which
represents the Mine Year producing the highest quantity of runoff for each ditch and pond
network. Once the critical year was established, the sedimentation ponds and stormwater ditches
were designed using the 10-year and 100-year, 24 hour Soil Conservation Service (SCS) Type II
storm events.
For the sedimentation ponds, the design goal was to control, at a minimum, the 10-year, 24-hour
storm event through the outlet pipe(s). The ponds provide a secondary spillway to control the
discharge up to the 100-year, 24-hour storm event. See Section 2.2.4.2 for detailed information
regarding the pond and outlet design. It should be noted that the stormwater pond model does not

Date: January 9, 2012 NorthMet Project
Water Management Plan - Mine
Version: 2 Page 22
use the groundwater component of the model because it was used to analyze single storm events
rather than long-term modeling; it accounts for the groundwater/surface water interactions by
assuming an average antecedent moisture content which classifies all wetland areas as partially
impervious.
The following sections describe the major components of the Stormwater Management System
2.2.2 Exclusion Dikes
Dikes will be placed at strategic locations around the perimeter of the site and around the pit rim
as described in the following sections.
2.2.2.1 Perimeter Dikes
The intent of constructing dikes and ditches at or near the perimeter of the Mine Site is to:
Minimize the amount of surface water flowing onto the Mine Site
Minimize dewatering of wetlands outside the perimeter of the Mine Site
Eliminate process water (i.e., water that has contacted surfaces disturbed by mining
activities) flowing uncontrolled off the Mine Site
Manage the rate and location of stormwater flowing off the Mine Site
The criteria used to select dike alignments include:
As close to the Project boundary as practicable to avoid obstructing mining operations
Where needed to facilitate construction of subsurface flow cutoff to prevent shallow
groundwater flow from entering the Mine Site
Where the ground surface at the Project boundary is lower than flood levels in
surrounding water bodies, and flood levels are high enough to flow onto the Mine Site if
not controlled
Where process water from construction areas or other surfaces disturbed by mining
activities will otherwise discharge off the site and where ditches will not adequately
control the runoff
Where needed to ensure that stormwater runoff is detained and discharged in a manner
that will meet stormwater quality requirements
Dikes will be constructed of silty sands or glacial till material excavated during construction of
ditches and removal of overburden. Side slopes will be vegetated to control erosion. Small dikes

Date: January 9, 2012 NorthMet Project
Water Management Plan - Mine
Version: 2 Page 23
will also be constructed, as needed, along interior stormwater ditches and around stockpile
construction areas to separate stormwater and process water around the Mine Site.
In order to convey stormwater adjacent to the dikes, prevent surface runoff from entering the
mine pits, intercept stormwater prior to reaching process water areas and prevent water from
pooling in areas where the dikes cut across low areas, ditches will be constructed along the
interior of most of the perimeter dike system. In addition, there will be some areas along the site
perimeter where the existing ground is already relatively high so that a ditch will be able to
capture the site surface runoff without a dike. Stormwater captured by the ditches will be
directed to sedimentation ponds and then routed into a natural drainage system.
Where glacial till is present in the dike foundation zone below the water table and where
inspection trenching (conducted at the time of construction) indicates potential for high-
permeability conditions or where peat is present, seepage control measures may be installed to
restrict groundwater movement. As part of construction-level design, test trenches will be
excavated along the perimeter dike alignments to determine the underlying soil conditions. The
test trenches will be used to evaluate the need for construction of cutoff trenches.
In areas where glacial till is present, seepage control measures may include soil cut-off trenches
constructed of compacted silty sand or compacted glacial till, or slurry trenches. The decision on
which design to use will depend on depth to bedrock and soil type on which the dike will be
built. In areas where peat is present, seepage will be prevented by compressing the peat by
placing earthen dike materials over the surface to surcharge the peat to create a low-permeability
layer. If a sand seam or other high-permeability material is found in the dike foundation zone
below the peat deposit, a soil cutoff trench, slurry wall, or sheetpile wall will be installed
(depending on depth to bedrock) to cut off seepage. Geotechnical testing has indicated that silty
sand soils found at the Mine Site are a relatively low-permeability material in their natural state,
as discussed in Section 4.1 of Referene (7). Therefore, seepage cutoffs are generally not planned
to be used in areas where dike foundation soils are silty sand.
The alignment of the perimeter dikes for the various years of Mine operation are shown on
Large Figure 7 through Large Figure 9 or on Drawing SW-003 and SW-004 of Attachment B (to
be provided in permitting).
2.2.2.2 Pit Rim Dikes
Pit rim dikes will be constructed in areas where surface water might otherwise drain into the
mine pits. The pit rim dikes are temporary in nature, intended to be in place only as long as the
rim of the mine pit is at a specific location. Dikes will be constructed by pushing up a ridge of
soil where needed around the rims of the pits during overburden stripping operations. Pit rim
dikes do not require as rigorous control of construction materials (compaction and moisture
content control) as the perimeter dikes need. They can be constructed quickly and economically
to cut off surface water flow into the pits. Dikes will be removed and reconstructed in a new
location as the mine pit expands. These dikes are intended only to intercept and direct surface

Date: January 9, 2012 NorthMet Project
Water Management Plan - Mine
Version: 2 Page 24
runoff, not to impede movement of groundwater flow. The dikes will also serve as safety berms
for mining operations at some locations and will need to remain in place until mining operations
are terminated at those locations.
2.2.3 Interior Ditches
The intent of stormwater ditch construction throughout the interior of the Mine Site is to:
Ensure that stormwater is routed away from the areas of mining activity to minimize the
amount of process water created on the Mine Site
Convey collected stormwater to perimeter ditches and sedimentation ponds prior to
controlled discharge from the Mine Site
Minimize the impacts of mining operations on the Partridge River system
The layout of the proposed stormwater system was designed to match the existing drainage
patterns at the Mine Site to the extent practical while still maintaining the objectives of the
system. The primary strategy is to intercept stormwater prior to contacting areas that have been
disturbed by mining activities, which will minimize the amount of process water and the overall
impacts to the Partridge River.
Stormwater Permit Drawings SW-003 through SW-005 (Attachment B, to be provided in
permitting) show the layout of the stormwater ditches, dikes and ponds for Mine Years 1, 11, and
20, respectively. Ditch plan and profile views are shown in Drawings SW-012 through SW-029
(Attachment B, to be provided in permitting). Cross-sections and details for stormwater ditches
are shown in Drawing SW-006 through SW-011 (Attachment B, to be provided in permitting).
2.2.4 Sedimentation Ponds and Outlets
Sedimentation ponds will be constructed to reduce TSS from stormwater runoff and to allow for
controlled discharge of stormwater from the Mine Site. There are five stormwater sedimentation
ponds planned for the Mine Site, as shown on Large Figure 7 through Large Figure 9. Pond A is
located at the northeast corner of the Category 1 Waste Rock Stockpile and directs stormwater
from the north and west sides of the stockpile off-site. Pond B is located between the East Pit and
northern border of the property. Pond C (West) is located west of the West Pit and was designed
to provide additional flood storage prior to Pond C (East), which is located west of the OSLA
and downstream of Pond C (West). Pond D is located west of the OSP, on the north side of
Dunka Road.
Stormwater will be routed from the Mine Site to these five locations around the perimeter of the
site. These locations were selected to match existing flow paths to mimic existing conditions to
the extent possible and minimize the overall hydrologic impacts to the Partridge River. Some
existing culvert locations along Dunka Road were consolidated through diking and ditching to
limit the number of outlets from the site to simplify management, monitoring and operations. All

Date: January 9, 2012 NorthMet Project
Water Management Plan - Mine
Version: 2 Page 25
five of these sedimentation ponds (shown on Drawing SW-003 of Attachment B, to be provided
in permitting) will be constructed in Mine Year 1.
2.2.4.1 General Design Criteria
The stormwater sedimentation ponds will be designed to limit TSS outflow concentrations into
natural flow paths to meet the TSS discharge limits established in the NPDES/SDS Multi-Sector
General Permit for Industrial Stormwater Activity (Permit Number [No.] MNR050000). It may
take several years to establish a thick vegetative cover on the reclaimed stockpile surfaces and as
a result, sediments in stormwater may temporarily be higher than under natural conditions until
the vegetative cover is fully established.
The inflow TSS concentrations may fluctuate over time and can only be estimated for this
design. The design assumes inflow TSS concentrations of 50 milligram per liter (mg/L) during
baseflow conditions and 100 mg/L during storm events. These TSS estimates are believed to
overestimate the actual concentrations, although the inflow concentrations used in the design will
need to be confirmed once water quality sampling can be conducted.
Sediment removal in the sedimentation ponds is extremely sensitive to the grain size distribution
of the sediments in the stormwater entering the pond. The grain size distribution of the inflow
sediments used in the design will also need to be confirmed once water quality sampling can be
conducted at the site and additional geotechnical data can be obtained. The ponds and outlet
configuration will be modified according to any new data as necessary to meet the permit
requirements. The pond surface areas were designed to remove 70 percent of sediment during the
10-year and 100-year storm events. The 10-year storm event assumes a larger percentage of fines
using a design gradation of 0.0363 millimeters (mm), 70 percent of which will be larger than this
according to the reference gradations. The 100-year storm event uses a design gradation of 0.05
mm, of which 70 percent of the expected sediment will be larger than this according to the
reference gradations. However, a small change in the grain size distribution could result in a
large change in the required surface area of the pond for sediment removal.
Additionally, stormwater permitting has been taken into account in the design of these ponds.
The MPCA issued its new NPDES/SDS Multi-Sector General Permit for Industrial Stormwater
Activity (Permit No. MNR050000) on April 5, 2010. This permit includes TSS storm event
benchmark limit of 100 mg/L. The Project is expected to have an individual NPDES/SDS permit
but these same limits will likely apply; therefore this requirement was used in the design criteria.
The annual average flow was used to size the ponds for the baseflow condition, for which a
lower TSS concentration but higher percent of finer sediments is expected. The peak flows from
the SCS Type II, 10-year and 100-year, 24-hour storm events determined from the XP-SWMM
model were used to size the ponds for storm event flows, for which a higher TSS concentration
but lower percent of finer sediments is expected. TSS removal was estimated using the
assumption of a steady-state plug flow reactor and computing sediment fall velocity (in still
water) according to Dietrich (Reference (8)).

Date: January 9, 2012 NorthMet Project
Water Management Plan - Mine
Version: 2 Page 26
In general, the sedimentation ponds will be partially excavated and partially filled above the
natural ground. The planned 3 (horizontal) to 1 (vertical) side slopes of the pond dikes will
ensure a stable cross-section that will provide sufficient flow path length to control leakage. Side
slopes will be covered with soil and seeded to control erosion. With this design, the diversion
ditches will flow by gravity from the channels into the sedimentation ponds, and additional
storage can be provided above the ground. This also allows better control of the pond outflows
and increases their sediment trapping efficiency.
2.2.4.2 Sedimentation Pond Sizing and Outlet Design
The sizes of the sedimentation ponds have been designed and will be constructed to meet the
objectives for the MPCA’s NPDES/SDS Multi-Sector General Permit for Industrial Stormwater
Activity (Permit No. MNR050000). The primary design objective is reduction of sediment in
runoff from storms up to the 100-year, 24-hour storm event.
The primary outlet structures for the ponds will be designed and constructed to allow flows up to
the 10-year, 24-hour storm to pass without overtopping the pond. Detention storage will be
provided to assist with containing flows up to the 10-year storm event. An earthen weir and
secondary spillway will also be constructed through the pond embankment to accommodate
flows from the 100-year storm event without overtopping the dikes or roads. The downstream
side of these overflow structures will include erosion control measures such as riprap.
Accumulated sediment will be removed from sedimentation ponds by pumping, as required. Due
to its outlet through Dunka Road, Pond D has a single weir outlet (with no secondary spillway)
to serve up to the 100-year storm to convey flows from the pond to an existing wetland south of
Dunka Road.
Each of the outlets on Ponds A and B will be fitted with check valves to prevent water from
flowing from off-site into the ponds. Both the primary outlet and an emergency outlet will be
evaluated on a site-specific basis, with the first one designed to provide flood attenuation
capacity and the second one designed to pass flows larger than the design values used to size the
sedimentation pond. The pond outlet configuration showing the primary outlet pipes and
secondary overflow earthen weirs are illustrated on the Drawings SW-007 to SW-011 in
Attachment B (to be provided in permitting). Similar to all long-term infrastructure at the Mine
Site, this outlet design was chosen to minimize maintenance.
The ponds will be excavated to have 8 to 10 feet of dead storage to prevent resuspension of
sediment that has already settled to the bottom of the ponds and to provide capacity for the
sediment that settles out. As required under the MPCA’s general stormwater program, these
ponds will have depths no greater than 10 feet. The ponds will typically be sized to achieve a
length-to-width ratio that will range from about 2 to 3 to eliminate short-circuiting and allow
adequate sedimentation for flows up to the 100-year storm event.
Date: January 9, 2012 NorthMet Project
Water Management Plan - Mine
Version: 2 Page 27
In many proposed pond locations, the groundwater is near or at the existing ground surface. The
normal water level of the ponds will be based on the expected groundwater elevations which
may be approximately at the existing ground elevation.
To achieve the desired TSS removal efficiencies, the surface area of the ponds range from 1.7 to
6.0 acres. For all ponds, with the exception of Pond D, the primary outlet of each pond will
consist of between one and six reinforced concrete pipes with diameters ranging from 24 to 48
inches with the invert set at the normal water level (NWL) and having a positive slope
discharging to the downstream side of the dike or road embankment. With the exception of Pond
D, each pond will also have a secondary overflow structure to allow flows up to the 100-year
event to be conveyed without overtopping the dikes or road embankments with one foot of
freeboard. The spillway will be an earthen spillway with an elevation set between 0.5 feet and
one foot below the dike elevation and vary in length from 6 to 200 feet. The downstream side of
these spillways will include erosion control measures such as riprap as needed. The riprap will
either be Minnesota Department of Transportation Standard Specification 3601 Random Riprap
Class III, IV, or V, depending on the size of riprap required for the calculated normal depth
velocity for the spillway.
Existing culvert invert elevations under Dunka Road were maintained where they will be
replaced to ensure that existing flows will not be impeded. Therefore, culverts to or from ponds
located adjacent to Dunka Road, including culverts directing flow from Pond D and Pond C-
East, are designed to maintain the surveyed grades of the existing corrugated metal pipe culverts
under the road. The culverts under Dunka Road for Pond C-East have been designed to convey
the 100-year, 24-hour storm event.

Date: January 9, 2012 NorthMet Project
Water Management Plan - Mine
Version: 2 Page 28
3.0 Key Outcomes
Through modeling (described in detail in Reference (2)), water quantity and quality estimates
have been determined and used in the design of these water management systems. The modeling
also includes the expected water quantity and quality outcomes resulting from these water
management systems which are summarized in this section.
3.1 Water Quantity
The Mine Site water balance determines the quantity of water that will be removed from the
Upper Partridge River watershed and the disposition of that water. Process water will be pumped
to the FTB, which will reduce the amount of water withdrawn from Colby Lake or used to flood
the mine pits.
Reference (2) describes the water quantity modeling with key outcomes summarized in
Table 3-1.
Table 3-1 Upper Partridge River Water Appropriation and Disposition – PLACEHOLDER
3.2 Water Quality
Reference (2) describes the water quality modeling with key outcomes summarized in the tables
below.
Table 3-2 Estimated West Pit Lake Water Quality – PLACEHOLDER
Table 3-3 Estimated Stockpile Drainage Water Quality – PLACEHOLDER
Table 3-4 Estimated Groundwater Quality – PLACEHOLDER
Table 3-5 Estimated Surface Water Quality – PLACEHOLDER
Table 3-6 Estimated Treated Water Pipeline Water Quality – PLACEHOLDER

Date: January 9, 2012 NorthMet Project
Water Management Plan - Mine
Version: 2 Page 29
4.0 Operating Plan
Once construction begins and until the West Pit lake concentrations meet the required water
resource objectives or until non-mechanical treatment has been proven, as described in
Section 2.1.1 of Reference (4), water at the Mine Site must be continually channeled, monitored,
treated and pumped as necessary to allow the mine to function efficiently and to protect the
environment. This section describes the steps and processes planned at the Mine Site during the
operating phase. Section 7.0 describes the management of water during reclamation and in long-
term closure.
4.1 Process Water
Process water may not meet water quality limits for metals or other constituents and as a result,
may require treatment at the WWTF prior to being routed through the TWP to the FTB or for pit
flooding in later years. Process water will be intercepted by ditches, dikes and stockpile
foundation liners to keep it separate from the stormwater conveyance systems as detailed below.
4.1.1 Waste Water Treatment Facility (WWTF)
In the early months of Mine Site development (Mine Year -1), the first phase of the WWTF will
be built, specifically the East EQ Basin and the Construction Water Treatment Building. These
facilities will treat construction water generated during Mine Site development activities
described in Section 2.2 of Reference (4). During Mine Year 1, this facility will treat both
construction water and process water, while construction of the West EQ Basin, Construction
Water Basin and the first half of the mechanical treatment are taking place. Mechanical treatment
includes chemical precipitation and membrane filtration treatment. The WWTF will be fully
operational at the end of Mine Year 1 and able to treat Mine Site process water. After Mine Year
1, construction water will be routed to the Construction Water Basin, treated by chemical
addition from the Construction Water Treatment Building, and subsequently discharged to the
CPS pond. It is anticipated that the second half of the mechanical treatment will be constructed
starting in Mine Year 3.
Operation of the WWTF is described in Section 2.2 of Reference (4).
4.1.2 Central Pumping Station (CPS)
Under normal conditions, the CPS pumps will be operated automatically by liquid level sensing
equipment. The three pumps will be started in sequence, one at a time, as required to maintain
the water level in the CPS pond at safe levels. Start pump and stop pump levels will be based on
depth of water in the basin. As the water level in the pond rises, the first pump will be started at
reduced speed. If the water level continues to rise, a second pump will be started at reduced
speed. Likewise, the third pump will be started should the inflow to the CPS pond exceed the
capacity of two pumps operating at maximum speed to maintain the desired water level in the
basin.

Date: January 9, 2012 NorthMet Project
Water Management Plan - Mine
Version: 2 Page 30
Preventive maintenance will be an integral part of the operation of the CPS. Preventive
maintenance will be focused on keeping equipment operable under the expected range of
operating conditions. Preventive maintenance tasks include, but are not limited to:
Daily observation of pump operation and review of alarm conditions, if any, that have
occurred
Daily verification that the flow meters at the CPS and the end of the TWP are properly
sending data and that data appears to be valid over the previous 24-hour period
Weekly inspection of the intake screens; clearing debris, as required.
Prior to winter, any ice control measures at the intake will be inspected to ensure that
they are operational. In the winter, daily inspection of the pump station intake will be
required to ensure that ice is not forming to the extent that it may damage the intake
and/or restrict flow to the pumps.
Annual inspection of instrumentation, controls, and electrical components and
replacement of worn or damaged parts
Annual cleaning of intake well, as required, to remove any solids that may have collected
Inspection of pumps and valves, with rebuilding, as required, at intervals of
approximately one billion gallons of water pumped for each pump. Valves will be
lubricated as required.
Building services, such as heating and ventilation, will be regularly inspected and
serviced as required.
4.1.3 Treated Water Pipeline (TWP)
A flow meter will be installed at each end of the TWP. The difference in flow between these
flow meters will provide an alarm if the flows are different (indicating a leak), and the CPS
pumps will automatically be stopped.
4.1.4 Mine Site Pipelines
The Mine Site pipelines will carry the water from the process water sumps and ponds, located
around the Mine Site, to the WWTF and CPS pond. The only water that is expected to be
pumped directly to the CPS pond is from the OSLA process water pond (PW-OSLA). All other
process water at the Mine Site is expected to require treatment and will be sent to the WWTF.
The process water piping system will expand as the mine expands, connecting the pits, stockpiles
and ore handling areas with the WWTF and CPS pond. The condition of the pipes will be
monitored and maintenance will be performed as necessary.
Date: January 9, 2012 NorthMet Project
Water Management Plan - Mine
Version: 2 Page 31
4.1.5 Mine Site Sumps and Pumps
Sumps are located throughout the Mine Site in the pits, around the edge of the temporary waste
rock stockpiles and along the edge of the OSP, as described in Section 2.1.4.1. The water that
collects in these sumps will be pumped to the WWTF and CPS pond via the process water
pipelines. The condition of the pumps and sumps will be monitored and maintenance or
replacement of the pumps will be performed, as necessary.
4.1.6 Mine Site Process Water Ponds
If a storm event, snowmelt or power outage creates more water than a stockpile sump can
contain, the excess water from the sumps will overflow to adjacent process water ponds.
Process water ponds without sumps are also located in six locations to collect drainage from the
haul roads, RTH and OSLA. In these cases, process water runoff will flow by gravity from these
process water areas to their appropriate ponds. Water in the process water ponds will be pumped
to the WWTF for treatment via the process water pipelines.
The condition of the ponds and pumps will be monitored and maintenance or replacement of the
pumps will be performed as necessary
4.2 Stormwater
This section is a summary of the Preliminary Stormwater Pollution Prevention Plan (SWPPP)
which is included as Attachment C (to be provided in permitting). The SWPPP is part of the
environmental review process and will be updated as necessary to meet the requirements of
project permitting. A SWPPP is a “living” document that evolves with changes at a site. PolyMet
will amend the SWPPP whenever there is:
A change in Mine Site facilities
A change in the operating procedures of the facility
A change that may impact the potential for pollutants to be discharged via stormwater
The intent of the SWPPP is to protect water quality by preventing pollution from stormwater
associated with industrial activities. The SWPPP identifies and describes Best Management
Practices (BMP) proposed for industrial activities; these BMPs are intended to minimize the
discharge of potential pollutants in stormwater runoff.
Inspections and recording activities are important parts of the continued success of the SWPPP.
Inspections will be performed every other month during non-freeze conditions, with at least one
inspection per year occurring during a rainfall event.
Date: January 9, 2012 NorthMet Project
Water Management Plan - Mine
Version: 2 Page 32
4.3 Spills
This section is a summary of the Mine Site Spill Prevention Control and Countermeasures
(SPCC) Plan which is included as Attachment D (to be provided in permitting). This document
provides the procedures for response to spills. A spill is an uncontrolled release of a petroleum
product to the ground outside a building or to water that can exit a building. This procedure
applies to all PolyMet employees, contractors and vendors delivering, dispensing or using
petroleum products at the Mine Site. It is the policy of PolyMet to promote a long-term,
continuous effort towards spill prevention first, and control and countermeasures where
necessary. An SPCC Plan Administrator will be designated and is responsible for developing,
implementing and maintaining the SPCC Plan. In the case of a spill, the procedures for
emergency contacts and a spill contingency plan are further described in Attachment D. Training
sessions and spill prevention briefings for operating personnel will review the requirements of
the SPCC Plan and highlight and describe recently developed precautionary measures.
4.4 Overflows
This section includes discussion of what will occur in the event of an overflow of process and
stormwater containment features. An overflow may occur when a storm event exceeds the design
storm or an extended power outage occurs at the Mine Site. In order to prevent and mitigate the
effects of possible overflows, the following operational plan will be used.
4.4.1 Process Water
The storage capacities of all of the process water sumps and ponds are provided on Table 2-4 and
Table 2-5 and on Drawing ME-004 of Attachment A (to be provided in permitting). Where the
sumps and ponds are next to each other, the sump volume only includes the volume before it will
overflow into the pond, whereas the pond volume is all of the remaining volume apart from the
sump. This is the storage capacity of the design and does not include the freeboard or
contingency response plans for removing or rerouting the water to prevent overtopping.
Process water collection from the temporary stockpiles, haul roads and ore handling areas (OSP
and RTH) will likely require treatment to meet water quality standards. The design storm for
these facilities, the 100-year, 24-hour event, only has a 1 percent chance of being exceeded in
any given year, or an 18 percent chance of being exceeded during the 20-year life of the Mine
Site. Although these facilities have been designed according to a significant design storm, there
may be occasions during the life of the mine that the design storm is exceeded, resulting in
runoff exceeding the capacity of the facilities. The design includes a factor of safety in the form
of freeboard volume, and additional contingencies have been developed to minimize
environmental impacts in the event the total volume available is exceeded.
For storm events in excess of the design storm, process water from temporary stockpiles, haul
roads, and the ore handling areas will continue to fill the ponds within the excess capacity
(freeboard) included in the design of each pond. The sump and pond design includes three feet of

Date: January 9, 2012 NorthMet Project
Water Management Plan - Mine
Version: 2 Page 33
freeboard based on the MPCA’s Recommended Pond Design Criteria (Reference (9)). Use of
freeboard in the design provides a significant factor of safety for these ponds, ranging from 39 to
180 percent over the required capacity, with a total excess capacity (design volume plus
freeboard) exceeding this volume as shown in Table 4-1.
Table 4-1 Sump and Pond Excess Capacity
Infrastructure Sump/Pond
Name
Required Capacity
(ac-ft)
Design Volume (ac-ft)
Freeboard Volume (ac-ft)
Total Excess Capacity(1)
Category 2/3 Waste Rock Stockpile
S23-1 14.9 14.9
15.7 33% S23-2 11.9 12.0
PW-S23-1 21.4 21.5
S23-3 6.6 6.6 6.4 54%
PW-S23-3 5.3 5.3
Category 4 Waste Rock Stockpile
S4 10.1 12.5 10.6 81%
PW-S4 8.1 9.9
Ore Surge Pile SOSP 8.5 8.7
5.6 47% PW-SOSP 4.8 5.3
Overburden Storage and Laydown Area
PW-OSLA 7.7 14.52 14.1
2 271%
(2)
Haul Roads
PW-HRE 10.7 10.7 4.2 39%
PW-HRN 4.4 4.6 2.8 69%
PW-HRC 6.1 6.9 3.0 61%
PW-HRW 3.7 4.0 2.6 77%
Rail Transfer Hopper
PW-RTH 0.7 0.7 0.3 57%
(1) Excess capacity compares the design capacity (design volume plus freeboard volume) to required capacity . (2) PW-OSLA was oversized to allow for storage of Peat within the pond, as described in Section 2.1.5.1.
Although the chance that the total design volume will be exceeded is small, an operational
contingency plan has been developed in the event that this occurs. The pumping networks
draining these sumps and ponds are sized for the snowmelt event; therefore any additional
pumping capacity required must be increased through a second pump system. Although it will
not be cost-effective to have a second permanent pump and pipeline network in place in the
event of an extended power outage or storm event that causes the design capacities to be
exceeded, an emergency operating procedure has been developed to manage process water under
these circumstances. This operational contingency plan includes use of temporary diesel pumps

Date: January 9, 2012 NorthMet Project
Water Management Plan - Mine
Version: 2 Page 34
to operate during events greater than the design volume or under circumstances of extended
power outages associated with heavy rainfall. This plan will maintain water levels below the
total capacity of the sumps and ponds, pumping to the pits until process water volumes are down
to manageable levels.
Under circumstances of design events exceeding sump and pond capacity or extended power
outages during heavy rainfall, it is likely that the WWTF may also reach capacity and shut down
the pumping network leading to it. In these circumstances, pumped process water may be
temporarily pumped into the pits, with mining operations in the lower levels temporarily shut
down until water in the pit sumps are back to manageable levels. If the emergency operating
procedure, as described above, is put into effect, process water will be pumped to the pits, based
on the level of reactivity of material stockpiled, following these priorities in descending order of
reactivity and priority: OSP sump SOSP and overflow pond PW-SOSP; Category 4 Waste Rock
stockpile sump S4 and overflow pond PW-S4; Category 2/3 Waste Rock Stockpile sumps and
overflow ponds; RTH runoff pond PW-RTH; haul road runoff ponds PW-HRC, PW-HRE, PW-
HRW, and PW-HRN; and OSLA runoff pond PW-OSLA. Pit dewatering may be temporarily
stopped during these conditions to allow lowering of the water in these sumps and process water
ponds to manageable levels.
In the unlikely event of runoff exceeding the total design capacity of the sumps and ponds and
containment under the emergency contingency plan is insufficient, overflows from the process
water areas will ultimately overflow into the Mine Site stormwater system, which ultimately
flows off-site to the Partridge River.
Sump overflow ponds will contain sump overflow during events exceeding the 10-year, 24-hour
storm up to the 100-year, 24-hour storm, but they will also receive direct precipitation during all
rainfall events. Therefore these ponds will require periodic pumping because there is not a
separate pumping system for these ponds. The pump system installed for the sumps will be used
for periodic pumping of these overflow ponds to maintain capacity for the design storm.
After major storm events, stockpile sumps will be pumped down to their normal water levels to
maintain storage volume for future storms, and then the overflow pond water will be conveyed to
the WWTF, taking a lower priority over the stockpile sumps.
4.4.2 Stormwater
Each of the stormwater sedimentation pond outlets will be fitted with controls to temporarily
shut off discharge from the site, or onto the site under Partridge River flooding conditions, if so
desired. Both the primary outlet and an emergency outlet will be evaluated on a site-specific
basis, with the first one designed to provide flood attenuation capacity and the second one
designed to pass flows larger than the design values used to size the sedimentation pond. During
large flood events, excess stormwater from the Mine Site sedimentation ponds will be pumped
off-site using temporary portable pumps. If necessary, pumping priorities will be given to the
stormwater ponds that will overflow into the process water system.

Date: January 9, 2012 NorthMet Project
Water Management Plan - Mine
Version: 2 Page 35
5.0 Water Quantity and Quality Monitoring
Proper long-term management of water quality and quantity at the Mine Site will depend in part
on a systematic monitoring plan that will be finalized in permitting. As operations proceed, the
monitoring plan will be updated as required. Monitoring will be used to evaluate whether
unanticipated operational or maintenance procedures or incorrect modeling assumptions lead to
exceedances in water quality standards. The water quality monitoring plan that is expected to be
required by the various permits and regulatory plan applicable to mining operations are
summarized in Table 5-1 and described in detail in Sections 5.1 to Section 5.5.
In aggregate, the monitoring plan will provide a comprehensive and thorough evaluation of water
flow, water elevation and water quality on a continuous, monthly or three times a year (first
month of non-freezing quarters – approximately April, July, October) basis depending upon the
component being monitored. For example, during mine operations stockpile drainage and pit
water flow will be monitored continuously and the quality of these waters will be monitored
monthly at multiple locations (when flows are present). Stormwater and surface water quantity
and quality will be monitored monthly at multiple locations, and wetland hydrology will be
monitored at a frequency yet to be determined at multiple locations during non-frozen
conditions. Finally, groundwater quality will be monitored quarterly at multiple monitoring well
locations.
A summary of each monitoring plan component is presented below and provided in
Large Table 1 through Large Table 5. For each monitoring plan, the tables specify the following:
Media to be monitored
o D = drainage
o GW = groundwater
o PS = process stream
o SW = surface water
o TW = treated water
Status of Monitoring System:
o E = existing
o P = proposed
Station ID: monitoring station nomenclature as shown in Large Table 1 through
Large Table 5

Date: January 9, 2012 NorthMet Project
Water Management Plan - Mine
Version: 2 Page 36
Location Map: Large Figure 10 through Large Figure 12 provides location of monitoring
stations
Frequency: the frequency of monitoring
Parameter Groups(s): Large Table 6 provides lists of monitoring parameters for each plan
Reporting Requirements: the frequency of monitoring report submittal
Table 5-1 Overview of Monitoring Plans at Mine Site
Monitoring Plan Component Purpose Summary General Locations
Internal Streams
Pit Water (Section 4.5.1)
Compare water balance with expected
conditions. Define future pumping
requirements, and evaluate trends in pit
water quality.
Continuous flow monitoring and monthly water
quality samples at up to four
sumps(1)
Stations installed to monitor flows and water quality
from each pit sumps
Stockpile Drainage (Section 4.5.2)
Compare water balance with expected
conditions. Define future pumping
requirements, and evaluate trends in stockpile drainage
water quality.
Continuous flow monitoring and monthly water
quality samples at up to twelve
locations(1)
Stations installed to monitor
drainage from each stockpile
liner, each stockpile
underdrain and the two Category
1 Waste Rock Stockpile
Groundwater Containment
System sumps
Overburden Storage and Laydown Area
Runoff (Section 4.5.3)
Compare water balance with expected
conditions. Define future pumping
requirements, and evaluate trends in
OSLA water quality.
Continuous flow monitoring and monthly water
quality samples in the OSLA
pond(1)
Station installed to monitor flows and water quality from the OSLA
pond
Haul Road Runoff (Section 4.5.4)
Compare water balance with expected
conditions. Define future pumping
requirements, and evaluate trends in haul
road water quality.
Continuous flow monitoring and monthly water
quality samples in the haul road
ponds(1)
Stations installed to monitor flows and water quality
from the haul road ponds

Date: January 9, 2012 NorthMet Project
Water Management Plan - Mine
Version: 2 Page 37
Monitoring Plan Component Purpose Summary General Locations
Internal Streams (continued)
Rail Transfer Hopper Runoff (Section 4.5.5)
Compare water balance with expected
conditions. Define future pumping
requirements, and evaluate trends in RTH
water quality.
Continuous flow monitoring and monthly water
quality samples in the RTH
pond(1)
Station installed to monitor flows and water quality
from the RTH pond
Waste Water Treatment Facility
Influents and Effluents
(Section 4.5.6)
Optimize the treatment operations and demonstrate
acceptable effluent characteristics.
Continuous flow monitoring and monthly water
quality samples in the influent and effluent
streams
Inlets and outlet of the Waste
Water Treatment Plant
Treated Water Pipeline Flows (Section 4.5.7)
Compare water balance with expected
conditions.
Continuous flow monitoring and monthly water
quality samples at the inlet and
outlet
Inlet and outlet of the Treated Water Pipeline
Stormwater Stormwater (Section 4.6)
Evaluate trends in stormwater quality.
Monthly flow monitoring and water quality
sampling at four pond outlets
(1)
Stormwater pond outlets
Groundwater Surficial Aquifer (Section 4.7)
Evaluate groundwater level and water quality trends in the surficial
aquifer.
Thirty-three sampling locations sampled
approximately April, July, and
October
Surficial aquifer monitoring wells installed down
gradient of each stockpile and pit
Bedrock (Section 4.7)
Evaluate groundwater level and water quality trends in the bedrock.
Number of wells are yet to be
determined with sampling
approximately April, July, and
October
Bedrock monitoring well
locations are yet to be determined
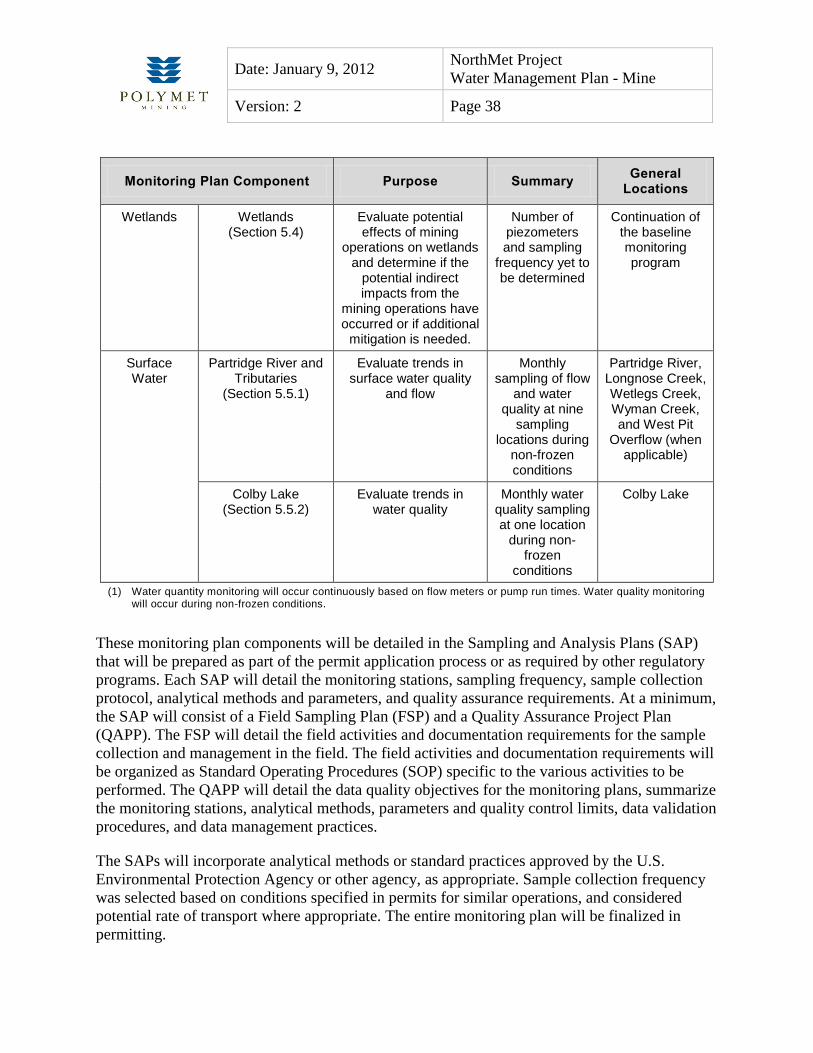
Date: January 9, 2012 NorthMet Project
Water Management Plan - Mine
Version: 2 Page 38
Monitoring Plan Component Purpose Summary General Locations
Wetlands Wetlands (Section 5.4)
Evaluate potential effects of mining
operations on wetlands and determine if the
potential indirect impacts from the
mining operations have occurred or if additional
mitigation is needed.
Number of piezometers and sampling
frequency yet to be determined
Continuation of the baseline monitoring program
Surface Water
Partridge River and Tributaries
(Section 5.5.1)
Evaluate trends in surface water quality
and flow
Monthly sampling of flow
and water quality at nine
sampling locations during
non-frozen conditions
Partridge River, Longnose Creek, Wetlegs Creek, Wyman Creek, and West Pit
Overflow (when applicable)
Colby Lake (Section 5.5.2)
Evaluate trends in water quality
Monthly water quality sampling at one location
during non-frozen
conditions
Colby Lake
(1) Water quantity monitoring will occur continuously based on flow meters or pump run times. Water quality monitoring will occur during non-frozen conditions.
These monitoring plan components will be detailed in the Sampling and Analysis Plans (SAP)
that will be prepared as part of the permit application process or as required by other regulatory
programs. Each SAP will detail the monitoring stations, sampling frequency, sample collection
protocol, analytical methods and parameters, and quality assurance requirements. At a minimum,
the SAP will consist of a Field Sampling Plan (FSP) and a Quality Assurance Project Plan
(QAPP). The FSP will detail the field activities and documentation requirements for the sample
collection and management in the field. The field activities and documentation requirements will
be organized as Standard Operating Procedures (SOP) specific to the various activities to be
performed. The QAPP will detail the data quality objectives for the monitoring plans, summarize
the monitoring stations, analytical methods, parameters and quality control limits, data validation
procedures, and data management practices.
The SAPs will incorporate analytical methods or standard practices approved by the U.S.
Environmental Protection Agency or other agency, as appropriate. Sample collection frequency
was selected based on conditions specified in permits for similar operations, and considered
potential rate of transport where appropriate. The entire monitoring plan will be finalized in
permitting.

Date: January 9, 2012 NorthMet Project
Water Management Plan - Mine
Version: 2 Page 39
5.1 Internal
Key internal waters will be monitored for water quality and quantity or level. Large Table 1 and
Large Figure 10 show the details of internal monitoring locations.
5.1.1 Pit Water
The quantity of the pit water delivered to the WWTF will be monitored continuously from the pit
dewatering pumps based on pump run hours with use of pump curves or with flow meters.
The quality of the pit water will be monitored on a monthly basis during non-frozen conditions
(approximately April to October).
During East Pit backfilling and during reclamation for the West Pit, the water level in each pit
will be monitored on a monthly basis while being flooded.
The water quality in the East, Central and West pits will be monitored on a monthly basis during
pit flooding.
5.1.2 Stockpile Drainage
The quantity of stockpile drainage delivered to the WWTF will be monitored continuously from
the stockpile sump pumps from pump run hours with use of pump curves or with flow meters.
The quality of the stockpile drainage will be monitored on a monthly basis during non-frozen
conditions (approximately April to October).
5.1.3 Overburden Storage and Laydown (OSLA) Area Runoff
The quantity of OSLA surface water runoff delivered to the CPS pond or WWTF will be
monitored from the OSLA pond pump based on pump run hours with use of the pump curve or
with a flow meter.
The quality of the OSLA surface water runoff will be monitored on a monthly basis during non-
frozen conditions (approximately April to October).
5.1.4 Haul Road Runoff
The quantity of haul road runoff delivered to the WWTF will be monitored from the haul road
pond pumps based on pump run hours with use of pump curves or with flow meters.
The quality of the haul road runoff will be monitored on a monthly basis during non-frozen
conditions (approximately April to October).

Date: January 9, 2012 NorthMet Project
Water Management Plan - Mine
Version: 2 Page 40
5.1.5 Rail Transfer Hopper (RTH) Area Runoff
The quantity of RTH runoff delivered to the WWTF will be monitored continuously from the
RTH pond pump based on pump run hours with use of the pump curve or with a flow meter.
The quality of the RTH runoff will be monitored on a monthly basis during non-frozen
conditions (approximately April to October).
5.1.6 Waste Water Treatment Facility (WWTF) Influents and Effluent
The quantity of WWTF influent and effluent will be monitored continuously with flow meters.
The quality of WWTF influent and effluent will be monitored on a monthly basis during non-
frozen conditions (approximately April to October).
5.1.7 Treated Water Pipeline (TWP) Flows
The quantity of flow will be monitored continuously with flow meters at the CPS and at the
TWP outlet.
The quality of flow at the CPS and at the TWP outlet will be monitored on a monthly basis
during non-frozen conditions (approximately April to October).
5.2 Stormwater
Stormwater will be monitored at the Mine Site stormwater pond outlets as shown on
Large Figure 10. Large Table 2 provides the details of stormwater monitoring.
The quantity of stormwater flowing from the Mine Site will be monitored on a monthly basis at
each stormwater pond outlet.
The quality of the stormwater flowing from the site will be monitored on a monthly basis at each
stormwater pond outlet during non-frozen conditions (approximately April to October).
5.3 Groundwater
Groundwater flow from the Mine Site flows generally south to the property boundary. Project
impacts at the property boundary will be monitored from groundwater monitoring wells and
compared to groundwater quality standards.
Groundwater will be monitored downgradient of the stockpiles and the pits, along with baseline
monitoring locations. Large Table 3 shows the details of groundwater monitoring with locations
tentatively shown on Large Figure 11.
Date: January 9, 2012 NorthMet Project
Water Management Plan - Mine
Version: 2 Page 41
5.4 Wetlands
Wetland hydrology will be monitored similar to the baseline wetland hydrology monitoring
program currently underway; see Section 4 of Reference (10) and Large Table 4.
5.5 Surface Water
Key surface waters will be monitored, as listed on Large Table 5 and shown on Large Figure 12.
5.5.1 Partridge River and Tributaries
Groundwater flow from the Mine Site generally flows south to the Partridge River and its
tributaries (Wetlegs Creek, Longnose Creek, Wyman Creek), as shown on Large Figure 12.
Project impacts to this system will be monitored and compared to surface water quality
standards.
The Partridge River flow and water quality upstream and downstream of the Project will be
monitored on a monthly basis during non-frozen conditions (approximately April to October).
Flow and water quality in Wetlegs Creek, Longnose Creek, and Wyman Creek downstream of
the Project will be monitored on a monthly basis during non-frozen conditions (approximately
April to October).
5.5.2 Colby Lake
Partridge River flows into Colby Lake.
Water quality in Colby Lake will be monitored on a monthly basis during non-frozen conditions
(approximately April to October).

Date: January 9, 2012 NorthMet Project
Water Management Plan - Mine
Version: 2 Page 42
6.0 Reporting and Adaptive Management
Adaptive management is a system of management practices based on clearly defined outcomes
and monitoring requirements to determine if management actions are meeting the desired
outcomes; and, if not, facilitating changes that will best ensure that outcomes are met or re-
evaluated. Adaptive management recognizes the uncertainty associated with estimates based on
natural systems as a result of the baseline monitoring data, waste characterization, scale of plan,
decisions on modeling inputs and other limiting factors. Adaptive management measures will be
developed through the Environmental Review process, permitting and during operations,
reclamation and long-term closure to define when changes are needed to the proposed water
management system.
A key component of adaptive management for water is the Adaptive Water Management Plan
(Reference (4)) that describes adaptive engineering controls that manage water quality and
quantity. Fixed engineering controls (liners, dikes, ditches, etc.) are described in this plan and
other management plans. Contingency mitigations that could be applied if engineering controls
do not manage water quality and quantity properly are also described in this document.
6.1 Monthly Reporting
The NPDES/SDS permit will require and define routine water quality reporting and annual
reports. The content requirements for those reports will be defined in those permits.
Routine water quality reports will be submitted to the MPCA. In addition to water quantity and
quality monitoring described in Section 5.0, it is anticipated that routine reports will include:
Sulfur content of ore and waste rock placed in stockpiles
Monthly precipitation
Identification and explanation of variations from permit requirements, if any.
6.2 Annual Reporting
An Annual NPDES/SDS Report will be submitted to the MPCA. It is anticipated that it will
include:
A comparison of actual mine pit and stockpile drainage water chemistry to the water
chemistry estimated by the Project water quality model from start of operations through
the past year
Identification of any changes to the stockpile liners or groundwater containment system
made during the last year

Date: January 9, 2012 NorthMet Project
Water Management Plan - Mine
Version: 2 Page 43
A summary of any previously reported variations from permit requirements during the
past year if any
Identification of any changes to the stockpile liners or groundwater containment system
planned for the coming year
An Annual PTM Report will be submitted to the MDNR. A draft version of the Annual PTM
Report is included in Reference (1) (Attachment A, to be provided in permitting) and will
include:
The total tons of overburden and waste rock by type placed in stockpiles or mine pits
from the start of operations through the past year and the remaining planned capacity
The total tons of overburden and waste rock by type used for constructions from the start
of operations through the past year and remaining planned applications
A map showing where waste rock and overburden were placed and where vegetation was
established for reclamation during the past year
A map showing where overburden and waste rock are planned to be placed and where
vegetation is planned to be established for reclamation during the coming year
Identification of any planned changes in operations that could impact final reclamation
An update of the waste rock waste characterization program
An update of any Special Performance Monitoring defined in Reference (4)
An update on the results of any Test Projects defined in Reference (4)
6.3 Annual Comparison to Model
Annual reports will include comparison of actual water quantity and quality to the quantity and
quality estimated by the Project water quality model for the conditions existing at the time of the
report.
6.4 Model Refinements
The Project water model developed in Reference (2) is an integrated model that includes all
aspects of the Project. If the annual comparison of the model shows differences that can be
logically explained as being caused by modeling assumptions that have been demonstrated to be
incorrect, the model will be refined.

Date: January 9, 2012 NorthMet Project
Water Management Plan - Mine
Version: 2 Page 44
The adjusted model will be used to update the Project water quantity and quality estimates. If the
update indicates that outcomes will not be acceptable, adaptive management will be initiated as
described in Section 6.5.
6.5 Adaptive Management
There are adaptive management actions that could be implemented if the water model projects an
exceedence of surface or groundwater standards. In general the steps will be:
1. Initiate any field studies that may be necessary to determine the root cause of the
exceedance.
2. Once the root cause is identified, implement any adjustments that can be made to the
adaptive engineering controls described in Reference (4) that will remedy the root cause.
Adjustments to the adaptive engineering controls include changing the scale or type of
control and its design.
3. If the modeled exceedances persist, implement contingency mitigation (Section 6.6) that
will remedy the root cause and include that contingency mitigation as an adaptive
engineering control in Reference (4).
4. Monitor and model effects to the environment with new or adjusted engineering control.
If issue persists, begin step 1 again.
6.6 Contingency Mitigations
If monitoring or refined model estimates with adaptive engineering controls show that water
quantity or quality at compliance points will not meet compliance parameters, mitigations are
available that will address the following situations. The contingency mitigations described in the
following paragraphs do not include modifications to adaptive engineering controls which are
described in Reference (4).
A. A pattern of overflows of the process water sumps or ponds develop.
i. As described in Section 4.4, there is excess capacity designed as a safety factor in all
the process water sumps and ponds ranging from approximately 30 to 270 percent of
required capacity. Additional capacity could be developed by expanding the pond
areas.
B. Streams along the railroad corridor between the Mine Site and Plant Site show
degradation in water quality as a result of material spilled from the rail cars.
i. Catchment areas could be developed adjacent to the tracks at stream crossings to
minimize the amount of material that reaches the streams.

Date: January 9, 2012 NorthMet Project
Water Management Plan - Mine
Version: 2 Page 45
C. Groundwater downgradient of lined infrastructure has compliance issues.
i. Interception wells could collect groundwater flows impacted by a leak from one of
the liner systems. Because all liner systems at the Mine Site are for temporary
infrastructure (temporary stockpiles, temporary ponds, etc.), the interception wells
will only be needed while the liner is in use or until the liner repair could be
performed.
D. West Pit water quality is not as expected.
i. The contaminant load from the West Pit walls could be reduced by several methods:
a. Dams could be constructed in the low areas of the pit rim to raise the water level
in the West Pit
b. A low permeability soil barrier could be constructed along the Ore Grade Material
portions of the exposed pit wall such that the groundwater flowing into the pit at
that location is stopped and the groundwater level rises in that area to an elevation
above the top of the exposed Ore Grade Material.
ii. The contaminant load from the East Pit could be reduced by several methods:
a. A low permeability soil barrier could be constructed along the Virginia Formation
portion of the exposed pit wall such that the groundwater flowing into the pit at
that location is stopped and the groundwater level rises in that area to an elevation
above the top of the exposed Virginia Formation.
b. A Permeable Reactive Barrier (PRB) could be installed in the East Pit outlet
channel to remove contaminates.
c. The water leaving the East Pit could be pumped to the WWTF for treatment
before flowing to the West Pit.
iii. Add water with lower concentrations of contaminates to the West Pit by routing
additional stormwater to the West Pit.
iv. The West Pit could be treated by several methods:
a. The West Pit water could be pumped to the WWTF, treated and returned to the
West Pit.
b. The West Pit lake could be treated in-situ with iron salts, fertilizer or other
method tailored to the contaminant. For example, Alexco is the industry leader for
pit lake remediation and has technologies that have successfully treated billion
gallon pit lakes for contaminants including selenium, zinc, uranium and nitrate.

Date: January 9, 2012 NorthMet Project
Water Management Plan - Mine
Version: 2 Page 46
Alexco's technologies have been successfully applied at numerous sites and
locations and have demonstrated successful remediation.
Date: January 9, 2012 NorthMet Project
Water Management Plan - Mine
Version: 2 Page 47
7.0 Reclamation and Long-Term Closure
Reclamation information included in this document is for the Mine Site water management
systems only. This includes incremental reclamation, final reclamation and long-term closure
activities. Reclamation information for the mine pits is in Reference (1). Reclamation
information for the stockpiles is in Reference (3). Reclamation information for other Mine Site
infrastructure is included in Reference (6).
7.1 Incremental Reclamation
The Category 2/3 and 4 Waste Rock Stockpiles are temporary and, starting in Mine Year 11, the
waste rock and Saturated Overburden materials in the stockpiles will be relocated to the East and
Central pits for ultimate disposal. The Category 4 Waste Rock Stockpile will be completely
removed and dismantled in Mine Year 11, with stripping of the Central Pit occurring in that
same year. The Category 2/3 Waste Rock Stockpile will be relocated to the East Pit starting in
Mine Year 12 and continuing through Mine Year 19. Reclamation of the former temporary
stockpile footprints will occur incrementally as large areas of the stockpile are removed to make
it efficient to complete reclamation. This will include portions of the temporary Category 4
Waste Rock Stockpile that are outside the extent of the Central Pit and the entire footprint of the
Category 2/3 Waste Rock Stockpile. Reclamation will also include removal of all piping, pump
systems, and liner systems associated with the stockpile foundations and the stockpile sumps and
ponds. Once these systems have been removed, the stockpile, sump and pond footprints will be
reclaimed into a mixture of upland and wetland areas, depending on the ultimate elevation of the
remaining materials. Once reclamation in these areas is complete, the haul roads to these areas
will also be scarified and seeded to allow continued access by small vehicles only for long-term
monitoring.
7.2 Final Reclamation
Once mining operations in the West Pit are complete, final reclamation at the Mine Site will
begin. During this time the West Pit will be flooded, as described in Section 6.2.6 of
Reference (1) and Section 2.1.1 of Reference (4). Large Figure 13 shows infrastructure that will
be removed or reclaimed during reclamation, and Large Figure 14 shows the Mine Site
infrastructure that will remain for long-term closure.
7.2.1 Perimeter and Interior Dikes
The perimeter dike located north of the Central and East pits will be maintained in order to
minimize mixing of Partridge River flows with the East Pit water. Perimeter dikes located on the
north side of the Category 1 Waste Rock Stockpile and along the east boundary of the Mine Site
will be maintained to provide access to groundwater monitoring locations.
Most pit rim dikes will be removed. During reclamation, stormwater runoff within the Mine Site
will be routed to the mine pits using a combination of existing and new ditches (Section 7.2.2).
Some portions of the pit rim dikes will remain in place during reclamation if they are needed to

Date: January 9, 2012 NorthMet Project
Water Management Plan - Mine
Version: 2 Page 48
prevent an uncontrolled discharge inflow to the pits and potential erosion (headcutting) of the
pits walls. A more detailed evaluation of this requirement will be conducted prior to Mine Year
20.
Material will be removed from the main body of the dikes and will be used at the site for
restoration of disturbed surfaces prior to reclamation. To minimize disturbance of subsurface
soils, the subsurface seepage control component of the dikes will remain in place. Typical
construction erosion control measures will be taken as part of the dike removal work, such as
installing silt fence on the down slope side of disturbed areas and control of surface water runoff.
The reclaimed surface will be scarified, topsoil placed, and the area will be revegetated with
native species within the time required by the Project SWPPP (Attachment C, to be provided in
permitting).
7.2.2 Ditch Filling and Rerouting
Large Figure 14 shows the proposed alignment of ditches that will be maintained to direct
stormwater into the West Pit for flooding. Use of ditches that already exist in Mine Year 20 will
been maximized, but a few new ditches may need to be constructed to direct stormwater runoff
into the East or West pits during reclamation. New ditches will be designed using the same
criteria as other stormwater ditches at the Mine Site (Section 2.2.3). Reclamation of ditches will
include either installing ditch blocks or filling, covering with topsoil, and vegetating the restored
surface.
7.2.3 Stormwater and Process Water Pond Restoration
At closure, all five stormwater sedimentation ponds, the six process water ponds, and the
remaining stockpile sumps and overflow ponds will be reclaimed by developing wetlands or by
filling, covering with topsoil and revegetating the area (Large Figure 13). The outlet control
structures from most stormwater sedimentation ponds will be removed to create a natural
transition to the wetlands/streams outside the Mine Site boundary. Outlet control structures from
Ponds C and D will remain in-place to direct water under Dunka Road and the railroad to the
Partridge River along natural drainage paths.
The process water sumps and ponds may require cleanout and removal of the geomembrane liner
in closure. Material removed from the ponds will be disposed of in the pits or an approved
landfill.
7.2.4 Pipe and Pump Removal
During reclamation, all process water pipes and pumps will be removed and recycled or
abandoned in place except those used for the flooding of the West Pit or recycling of the East or
West Pit water.
Date: January 9, 2012 NorthMet Project
Water Management Plan - Mine
Version: 2 Page 49
7.2.5 Central Pumping Station and Treated Water Pipeline Removal
Once no longer necessary, the CPS building will be reclaimed and vegetated according to
Minnesota Rules, part 6132.2700 by a qualified reclamation contractor. The CPS pond will be
reclaimed as a wetland or filled, covered with topsoil and revegetated.
The TWP will be removed, recycled or disposed, or buried and abandoned in place. The area
disturbed by these activities will be revegetated.
7.3 Long-Term Closure
Monitoring, reporting and water treatment will continue after the reclamation process is
complete, until release from these activities is granted via the PTM. If any of the monitoring data
shows that additional work is needed, a plan will be created and implemented to further improve
water quality. During long-term closure, the water level in the West Pit will be maintained below
the natural overflow elevation by discharging treated water to a small watercourse south of the
West Pit that flows off-site to the Partridge River. The discharged water will have been pumped
from the West Pit to the WWTF for treatment to meet the appropriate water discharge limits as
described in Section 2.2 of Reference (4) prior to discharge. The ultimate objective is to
transition from the mechanical treatment provided by the WWTF to a non-mechanical treatment
system once the non-mechanical treatment system has been demonstrated to provide the required
water treatment. Potential non-mechanical treatment systems, including construction of an outlet
structure from the West Pit, are described in Section 6 of Reference (4).
7.3.1 Monitoring and Reporting
The monitoring and reporting described in Section 5.0 and 6.0 will continue until MDNR
releases the company from doing so under the PTM.
7.3.2 Water Treatment
As described in Section 2.0 of Reference (3), the Saturated Overburden and waste rock in the
Category 2/3 and Category 4 waste rock stockpiles will be relocated to the East Pit. This will
result in a flushing of oxidation products into the East Pit water. As the East and West pits flood
with water, oxidation products that have accumulated on the pit wall rock will be flushed into the
pits as the water level rises.
The flushed oxidation products will be removed from the West and East pits by pumping the pit
water to the WWTF for treatment and returning the treated water to the pits. The potential for pit
stratification in the West and East pits is discussed in Section 6.1.3 of Reference (2).
For long-term closure, water treatment is expected to continue until the West Pit water quality
reaches an acceptable level, as described in Section 2 of Reference (4). The WWTF will be
maintained operable until MDNR releases the company from doing so under the PTM.

Date: January 9, 2012 NorthMet Project
Water Management Plan - Mine
Version: 2 Page 50
7.4 Contingency Reclamation Estimates
7.4.1 Contingency Reclamation Plan (Mine Year 0 and 1)
7.4.1.1 Mine Year 0 (end of construction/development)
If closure were to occur at the end of Mine Year 0, there will be no waste rock in the stockpiles,
no ore in the OSP and no mine pits. Stripping of the East Pit will have begun. The stockpiles and
OSP foundations will be the size shown in Large Figure 4. The WWTF will be of limited
operability for treatment, consisting only of the East EQ Basin and Construction Water
Treatment Building for treating construction water. The activities described in Section 7.2 and
Section 7.3 will be implemented. Key parameters driving reclamation costs for water
management systems are shown in Table 7-1.
Table 7-1 Key Reclamation Cost Parameters – PLACEHOLDER
Key Parameter Removal /
Reclamation Construction Monitoring Treatment
Stormwater Dikes TBD N/A TBD N/A
Stormwater Ditches TBD TBD TBD N/A
Stormwater Ponds TBD N/A TBD N/A
Process Water Ponds
TBD N/A TBD N/A
Pipes TBD N/A N/A N/A
WWTF N/A N/A TBD TBD
This plan is used to develop the Mine Year 0 Contingency Reclamation Estimate that will be the
basis for financial assurance required by Minnesota Rules, part 6132.1200, which is required
before a PTM can be granted.
7.4.1.2 Mine Year 1 (end of first year of operations)
If closure were to occur at the end of Mine Year 1, the activities described in Section 7.2 and
Section 7.3 will be implemented. Development of the Mine Site will be as shown in
Large Figure 4 and Large Figure 7. Only the East Pit will be developed, with stripping of the
West Pit not yet started. Key parameters driving reclamation costs for water management
systems are shown in Table 7-2.

Date: January 9, 2012 NorthMet Project
Water Management Plan - Mine
Version: 2 Page 51
Table 7-2 Key Reclamation Cost Parameters – PLACEHOLDER
Key Parameter Removal /
Reclamation Construction Monitoring Treatment
Stormwater Dikes TBD N/A TBD N/A
Stormwater Ditches TBD TBD TBD N/A
Stormwater Ponds TBD N/A TBD N/A
Process Water Ponds
TBD N/A TBD N/A
Pipes TBD N/A N/A N/A
WWTF N/A N/A TBD TBD
This plan is used to develop the Contingency Reclamation Estimate that will be the basis for
financial assurance required by Minnesota Rules, part 6132.1200 the first or second calendar
year (depending on construction progress) after the issuance of the PTM. This plan and estimate
will be updated annually to include contingency reclamation for the site conditions representative
of the end of the upcoming year of operation.
7.4.2 Contingency Reclamation Estimate (Mine Year 0 and 1) – PLACEHOLDER
7.4.2.1 Mine Year 0 (end of construction/development) – PLACEHOLDER
7.4.2.2 Mine Year 1 (end of first year of operations) – PLACEHOLDER
7.4.3 Forecast of Annual Contingency Reclamation Estimates (Mine Years 2 to 20) –
PLACEHOLDER
Date: January 9, 2012 NorthMet Project
Water Management Plan - Mine
Version: 2 Page 52
Revision History
Date Version Description
11/30/2011 1 Initial release
01/09/2012 2
Significant changes to incorporate project changes related to the decisions made in the AWMP Version 4 and 5 (Reference (11) and Reference (4), respectively). These project changes include the extension of the groundwater containment system along the south side of the stockpile, the use of a geomembrane cover on the Category 1 Waste Rock Stockpile, the use of long-term mechanical treatment and the potential for non-mechanical treatment in long-term closure.

Date: January 9, 2012 NorthMet Project
Water Management Plan - Mine
Version: 2 Page 53
References
1. Poly Met Mining Inc. NorthMet Project Mine Plan (v2). December 2012.
2. —. NorthMet Project Water Modeling Data Package Volume 1 - Mine Site (v10). January
2013.
3. —. NorthMet Project Rock and Overburden Management Plan (v5). December 2012.
4. —. NorthMet Project Adaptive Water Management Plan (v5). January 2013.
5. —. NorthMet Project Project Description (v5). January 2013.
6. —. NorthMet Project Reclamation Plan (v3). January 2013.
7. —. NorthMet Project Geotechnical Data Package Vol 3 - Mine Site Stockpiles (v2). May
2012.
8. Dietrich, William E. Settling velocity of natural particles. Water Resources Research.
1982, Vol. 18, 6, p. 1615.
9. Meyer, P., G. Erickson, D. Sahli, N. Groh, B. Smith, V. Sathyaseelan. Recommended
Pond Design Criteria. Document wq-wwtp5-53. s.l. : Minnesota Pollution Control Agency,
December 2009.
10. Poly Met Mining Inc. NorthMet Project Wetland Management Plan (v3). December
2012.
11. —. NorthMet Project Adaptive Water Management Plan (v4). October 2012.

Date: January 9, 2012 NorthMet Project
Water Management Plan - Mine
Version: 2 Page 54
List of Tables
Table 2-1 Design Criteria for Process Water Infrastructure ................................................. 9
Table 2-2 Mine Pit Inflows ................................................................................................. 10
Table 2-3 Temporary Stockpile Drainage ........................................................................... 12
Table 2-4 Stockpile Sump and Pond Dimensions – Approximate ....................................... 14
Table 2-5 Process Water Pond Dimensions - Approximate ................................................. 16
Table 3-1 Upper Partridge River Water Appropriation and Disposition – PLACEHOLDER 28
Table 3-2 Estimated West Pit Lake Water Quality – PLACEHOLDER .............................. 28
Table 3-3 Estimated Stockpile Drainage Water Quality – PLACEHOLDER ...................... 28
Table 3-4 Estimated Groundwater Quality – PLACEHOLDER .......................................... 28
Table 3-5 Estimated Surface Water Quality – PLACEHOLDER ........................................ 28
Table 3-6 Estimated Treated Water Pipeline Water Quality – PLACEHOLDER ................ 28
Table 4-1 Sump and Pond Excess Capacity ........................................................................ 33
Table 5-1 Overview of Monitoring Plans at Mine Site ........................................................ 36
Table 7-1 Key Reclamation Cost Parameters – PLACEHOLDER ...................................... 50
Table 7-2 Key Reclamation Cost Parameters – PLACEHOLDER ...................................... 51

Date: January 9, 2012 NorthMet Project
Water Management Plan - Mine
Version: 2 Page 55
List of Large Tables
Large Table 1 Monitoring Plan – Internal Streams - NorthMet Mine Site
Large Table 2 Monitoring Plan – Stormwater - NorthMet Mine Site
Large Table 3 Monitoring Plan – Groundwater - NorthMet Mine Site
Large Table 4 Monitoring Plan – Wetland Hydrology - NorthMet Mine Site
Large Table 5 Monitoring Plan – Surface Water - NorthMet Mine Site
Large Table 6 Monitoring Plan – Parameter Lists - NorthMet Mine Site
List of Large Figures
Large Figure 1 Partridge River Watersheds and Surface Water Monitoring Locations
Large Figure 2 Geologic / Hydrogeologic Collection Locations
Large Figure 3 Mine Site Existing Subwatershed Boundaries and Partridge River
Floodplain
Large Figure 4 Process Water Management – Year 1
Large Figure 5 Process Water Management – Year 11
Large Figure 6 Process Water Management – Year 20
Large Figure 7 Stormwater Management – Year 1
Large Figure 8 Stormwater Management – Year 11
Large Figure 9 Stormwater Management – Year 20
Large Figure 10 Proposed Monitoring Plan - Mine Site Monitoring Locations
Large Figure 11 Proposed Monitoring Plan - Groundwater Monitoring Locations
Large Figure 12 Proposed Monitoring Plan - Surface Water Monitoring Locations
Large Figure 13 Features to be Removed/Reclaimed at Mine Closure
Large Figure 14 Features to be Remain at Mine Closure

Date: January 9, 2012 NorthMet Project
Water Management Plan - Mine
Version: 2 Page 56
List of Attachments
Attachment A Mechanical Design Drawings – PLACEHOLDER
Attachment B Stormwater Design Drawings – PLACEHOLDER
Attachment C Mine Site Storm Water Pollution Prevention Plan (SWPPP) –
PLACEHOLDER
Attachment D Mine Site Spill Prevention Control and Countermeasures (SPCC) Plan –
PLACEHOLDER

Large Tables

Large Table 1 Monitoring Plan – Internal Streams - NorthMet Mine Site
Monitoring Plan Med
ia
Stat
us
Station ID (Nomenclature) Location Map Parameter Group(s) Frequency Reporting Requirements Additional Information
Pit Water (PW) GW/
SW
P
WS-PW-WW
WS-PW-WE
WS-PW-C
WS-PW-E
Large Figure 10 Flow Rate Continuous Monitoring Reports
• Annual
• May, August, November
Monitor pump rates to manage water in the pits to compare water balance to expected conditions and define future pumping requirements.
Monitor at each pit sump
Flow rates to be based on pump run hours with use of pump curves or flow meters.
Water Quality (see Large Table 6, Internal Streams)
Monthly Monitoring Reports
• Annual
• May, August, November
Monitor water quality of pit water in each pit sump
Stockpile Liner (SL) and Containment System (CS) Drainage
S P
WS-SL-OSP
WS-SL-4
WS-SL-231
WS-SL-232
WS-SL-233
WS-CS-1
WS-CS-2
Large Figure 10 Flow Rate Continuous Flow Rate Monitoring Reports
• Annual
• May, August, November
Monitor drainage from stockpile liners to compare water balance to expected conditions and define future pumping requirements.
Monitor at each stockpile sump
Flow rates to be based on pump run hours with use of pump curves or flow meters.
Water Quality (see Large Table 6, Internal Streams)
Monthly Water Quality Monitoring Reports
• Annual
• May, August, November
Monitor water quality of stockpile liner drainage in each stockpile sump
Stockpile Underdrain (SU) Drainage
GW P
WS-SU-OSP
WS-SU-4
WS-SU-231
WS-SU-232
WS-SU-233
Large Figure 10 Flow Rate Continuous Flow Rate Monitoring Reports
• Annual
• May, August, November
Monitor drainage from the underdrains (beneath the liner) when flows are present. Monitor at each stockpile underdrain sump
Flow rates to be based on pump run hours with use of pump curves or flow meters.
Water Quality (see Large Table 6, Internal Streams)
Monthly Water Quality Monitoring Reports
• Annual
• May, August, November
Monitor water quality of stockpile underdrains (beneath the liner) in each stockpile underdrain sump when flows are present
Overburden Storage and Laydown Area Runoff
SW P WS-OSLA Large Figure 10 Flow Rate Continuous Flow Rate Monitoring Reports
• Annual
• May, August, November
Monitor drainage from OSLA to compare water balance to expected conditions.
Monitor at OSLA pond
Flow rates to be based on pump run hours with use of pump curves or flow meters.
Water Quality (see Large Table 6, Internal
Streams)
Monthly Water Quality Monitoring Reports
• Annual
• May, August, November
Monitor water quality of OSLA drainage in OSLA pond when flows are present
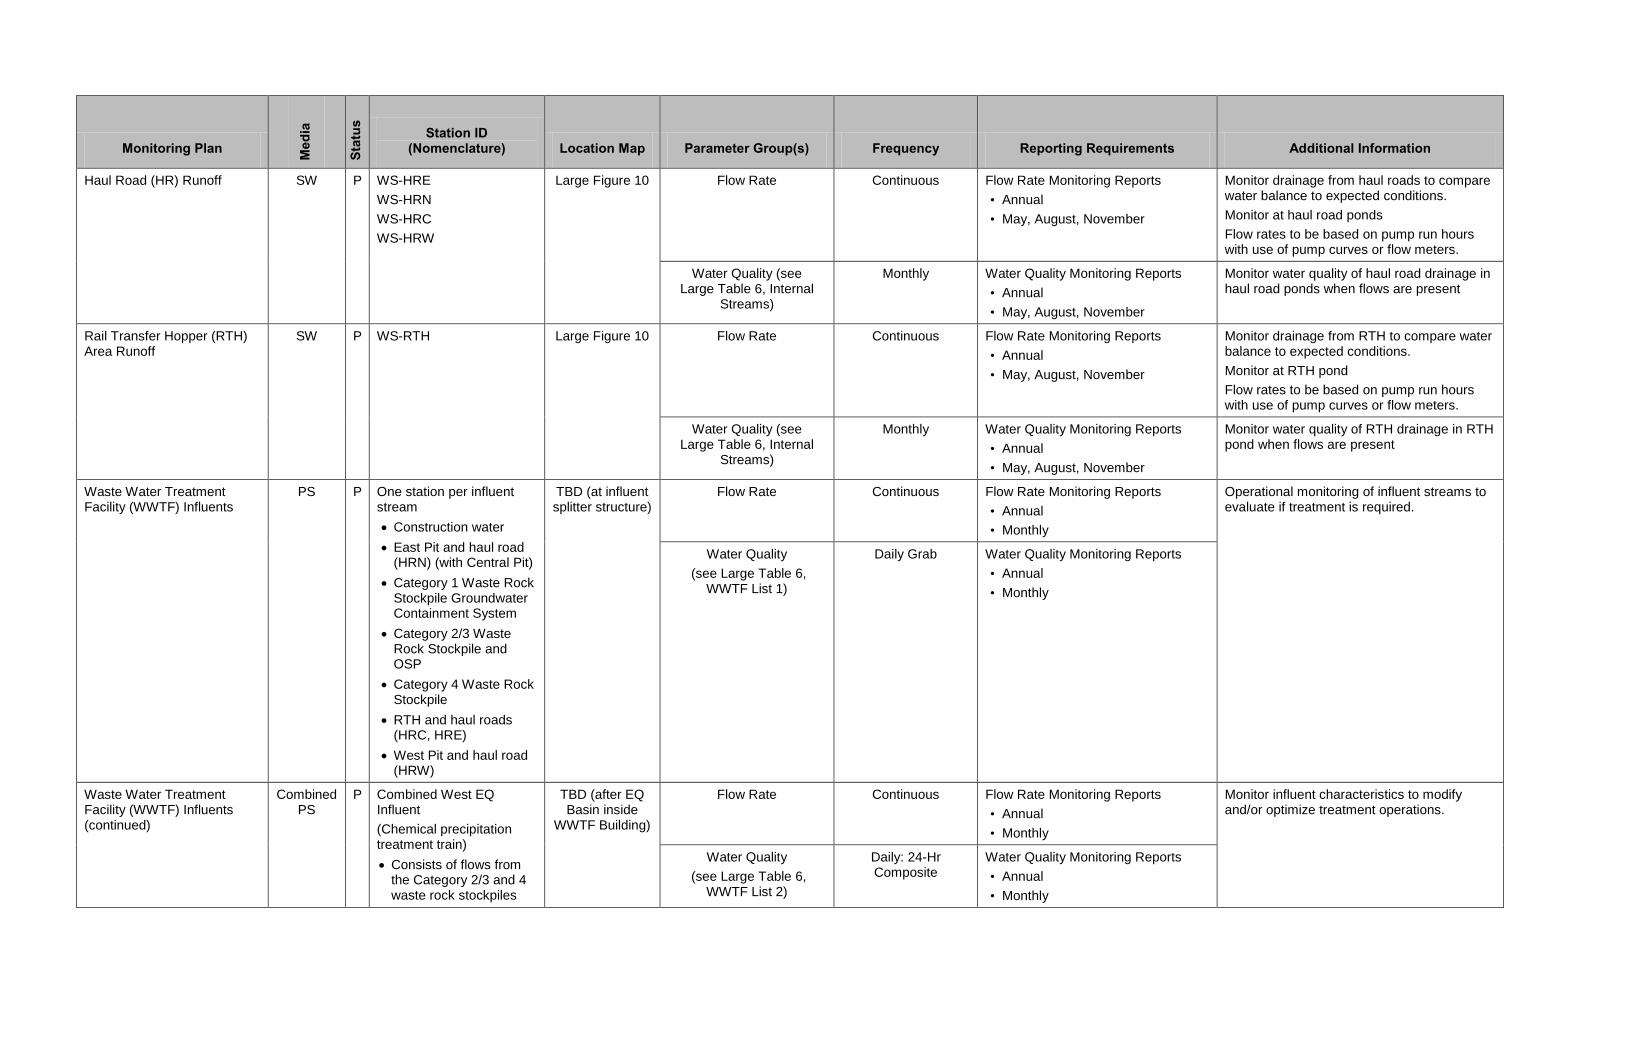
Monitoring Plan Med
ia
Stat
us
Station ID (Nomenclature) Location Map Parameter Group(s) Frequency Reporting Requirements Additional Information
Haul Road (HR) Runoff SW P
WS-HRE
WS-HRN
WS-HRC
WS-HRW
Large Figure 10 Flow Rate Continuous Flow Rate Monitoring Reports
• Annual
• May, August, November
Monitor drainage from haul roads to compare water balance to expected conditions.
Monitor at haul road ponds
Flow rates to be based on pump run hours with use of pump curves or flow meters.
Water Quality (see Large Table 6, Internal
Streams)
Monthly Water Quality Monitoring Reports
• Annual
• May, August, November
Monitor water quality of haul road drainage in haul road ponds when flows are present
Rail Transfer Hopper (RTH) Area Runoff
SW P WS-RTH Large Figure 10 Flow Rate Continuous Flow Rate Monitoring Reports
• Annual
• May, August, November
Monitor drainage from RTH to compare water balance to expected conditions.
Monitor at RTH pond
Flow rates to be based on pump run hours with use of pump curves or flow meters.
Water Quality (see Large Table 6, Internal
Streams)
Monthly Water Quality Monitoring Reports
• Annual
• May, August, November
Monitor water quality of RTH drainage in RTH pond when flows are present
Waste Water Treatment Facility (WWTF) Influents
PS P One station per influent stream
Construction water
East Pit and haul road (HRN) (with Central Pit)
Category 1 Waste Rock Stockpile Groundwater Containment System
Category 2/3 Waste Rock Stockpile and OSP
Category 4 Waste Rock Stockpile
RTH and haul roads (HRC, HRE)
West Pit and haul road (HRW)
TBD (at influent splitter structure)
Flow Rate Continuous Flow Rate Monitoring Reports
• Annual
• Monthly
Operational monitoring of influent streams to evaluate if treatment is required.
Water Quality
(see Large Table 6, WWTF List 1)
Daily Grab Water Quality Monitoring Reports
• Annual
• Monthly
Waste Water Treatment Facility (WWTF) Influents (continued)
Combined PS
P Combined West EQ Influent
(Chemical precipitation treatment train)
Consists of flows from the Category 2/3 and 4 waste rock stockpiles
TBD (after EQ Basin inside
WWTF Building)
Flow Rate Continuous Flow Rate Monitoring Reports
• Annual
• Monthly
Monitor influent characteristics to modify and/or optimize treatment operations.
Water Quality
(see Large Table 6, WWTF List 2)
Daily: 24-Hr Composite
Water Quality Monitoring Reports
• Annual
• Monthly

Monitoring Plan Med
ia
Stat
us
Station ID (Nomenclature) Location Map Parameter Group(s) Frequency Reporting Requirements Additional Information
and the OSP Water Quality
(see Large Table 6, WWTF List 3)
Monthly
Combined
PS
P Combined East EQ Basin Influent
(Membrane filtration treatment train)
Consists of flows from haul road, RTH, pit dewatering and Category 1 Waste Rock Stockpile Groundwater Containment System
TBD (after EQ Basin inside
WWTF Building)
Flow Rate Continuous Flow Rate Monitoring Reports
• Annual
• Monthly
Monitor influent characteristics to modify and/or optimize treatment operations.
Water Quality
(see Large Table 6, WWTF List 2)
Daily: 24-Hr Composite
Water Quality Monitoring Reports
• Annual
• Monthly
Water Quality
(see Large Table 6, WWTF List 3)
Monthly
Waste Water Treatment Facility (WWTF) Effluents
TW P Effluent
Consists of whole effluent
TBD Flow Rate Continuous Flow Rate Monitoring Reports
• Annual
• Monthly
Monitor effluent characteristics to document water quality prior to reuse in closure operations
Water Quality
(see Large Table 6, WWTF List 2)
Daily: 24-Hr Composite
Water Quality Monitoring Reports
• Annual
• Monthly
Water Quality
(see Large Table 6, WWTF List 3)
Monthly
Treated Water Pipeline (PP) Flows
TW P WS-PP-1
WS-PP-2
Large Figure 10 Flow Rate and Pressure Continuous Flow Rate Monitoring Reports
• Annual
• May, August, November
Monitoring both ends of the pipeline to detect leaks.
Water Quality (see Large Table 6, Internal
Streams)
Monthly Water Quality Monitoring Reports
• Annual
• May, August, November
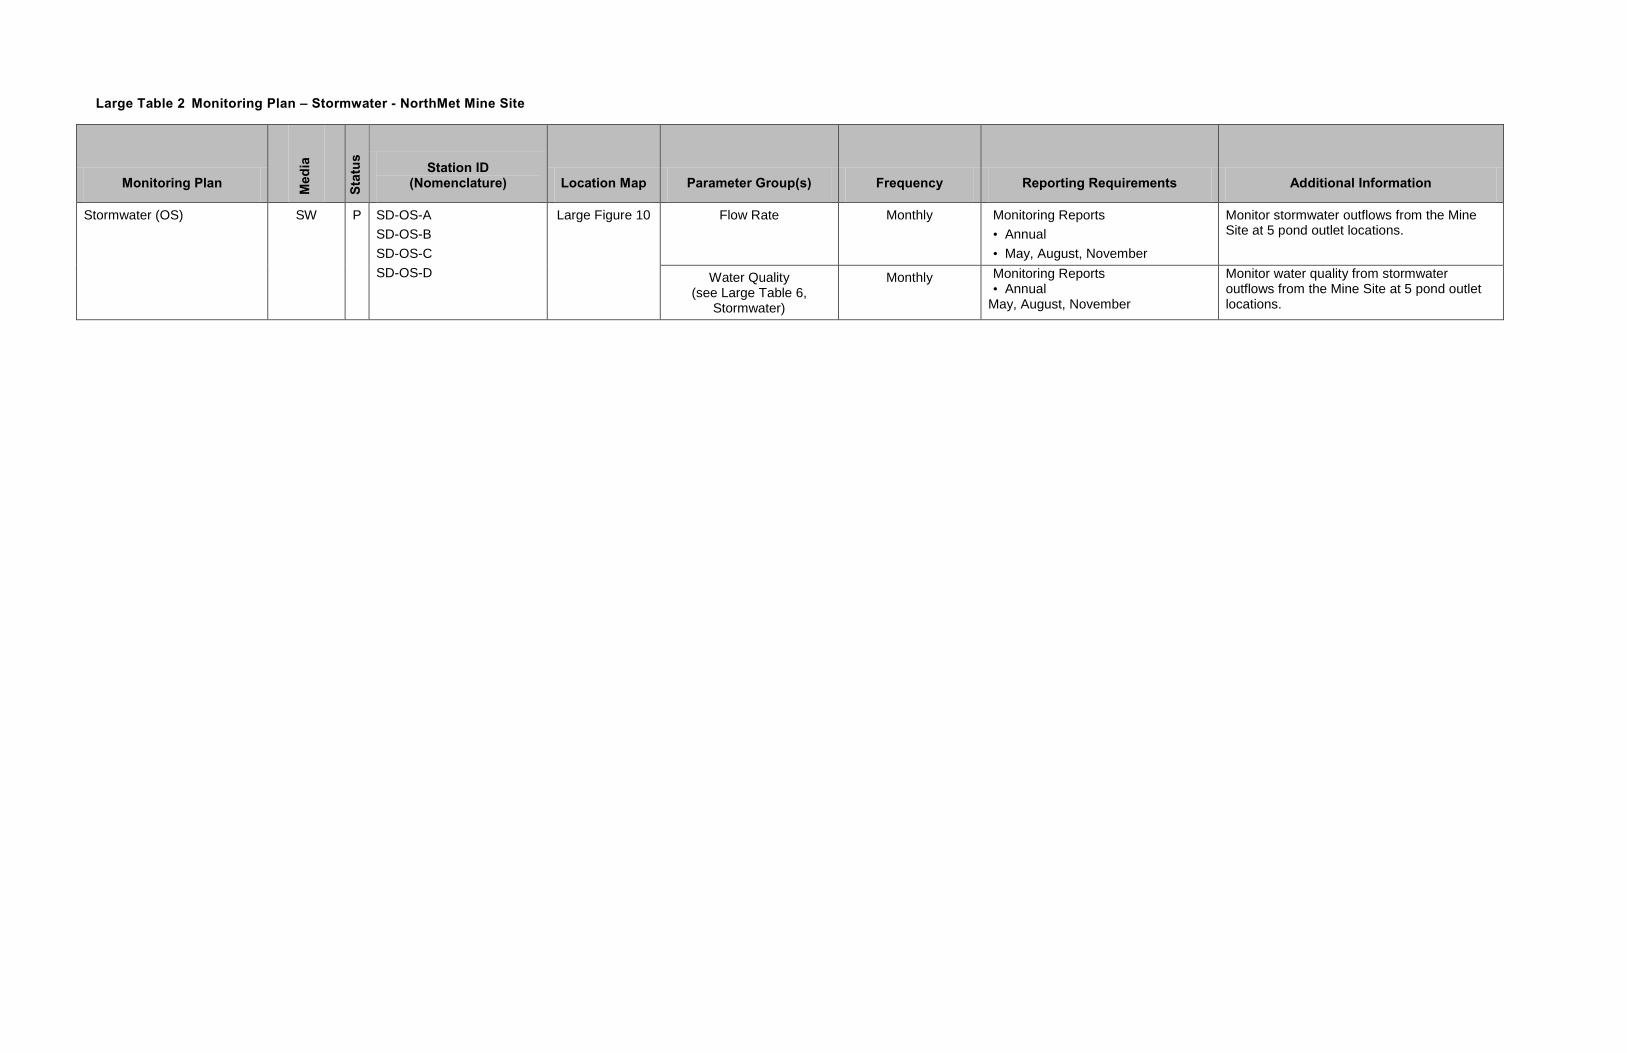
Large Table 2 Monitoring Plan – Stormwater - NorthMet Mine Site
Monitoring Plan Med
ia
Stat
us
Station ID (Nomenclature) Location Map Parameter Group(s) Frequency Reporting Requirements Additional Information
Stormwater (OS) SW P SD-OS-A
SD-OS-B
SD-OS-C
SD-OS-D
Large Figure 10 Flow Rate Monthly Monitoring Reports
• Annual
• May, August, November
Monitor stormwater outflows from the Mine Site at 5 pond outlet locations.
Water Quality (see Large Table 6,
Stormwater)
Monthly Monitoring Reports • Annual
May, August, November
Monitor water quality from stormwater outflows from the Mine Site at 5 pond outlet locations.

Large Table 3 Monitoring Plan – Groundwater - NorthMet Mine Site
Monitoring Plan Med
ia
Stat
us
Station ID (Nomenclature) Location Map Parameter Group(s) Frequency Reporting Requirements Additional Information
Monitoring Wells –
Surficial Aquifer
GW E
P
24 existing wells:
MW-05-02
MW-05-08
MW-05-09
MW-1 through MW-5
MW-6S/6D
MW-7S
MW-8S/8D
MW-9
MW-10S/10D
MW-11 through MW-18
Large Figure 11 Elevation Quarterly Annual Monitoring Report
Evaluate groundwater flow gradient and direction.
Surficial aquifer wells will be generally located downgradient of mine features such as pits and stockpiles.
Groundwater is expected to flow toward the mine pit during mine dewatering operations. Groundwater flow direction is expected to revert to the natural flow direction after mine reclamation.
Sampling frequency is preliminary and may be revised based on the outcome of ongoing discussions.
When nested monitoring wells are installed, they are numbered with MW-# with an S or D following the ID number to indicate a shallow and deep monitoring well.
Water Quality (see Large Table 6,
Groundwater)
Quarterly Annual Monitoring Report
Summarize water quality data and evaluate trends.
Monitoring Wells – Bedrock GW E
P
9 existing wells:
OB-1 through OB-5
P-1 through P-4
TBD proposed wells:
MW-BR-x
TBD Elevation Quarterly Annual Monitoring Report
Summarize water quality data and evaluate trends.
Evaluate groundwater flow gradient and direction.
Number and location of bedrock wells have not yet been identified.
Water Quality (see Large Table 6,
Groundwater)
Quarterly Annual Monitoring Report
Summarize water quality data and evaluate trends.

Large Table 4 Monitoring Plan – Wetland Hydrology - NorthMet Mine Site
Monitoring Plan Med
ia
Stat
us
Station ID (Nomenclature) Location Map Parameter Group(s) Frequency Reporting Requirements Additional Information
Wetlands – Baseline Monitoring
Baseline Mine Site Wetlands
GW E TBD Large Figure 8 in
Reference (10)
Elevation – relative to ground surface
In progress
Began in 2005
Ranging from monthly to continuous during non-freezing months
Varies Provide sufficient hydrology information to allow identification of potential indirect hydrologic impacts to wetlands.
Additional information is available in Section 4.3 of the Wetland Management Plan (Reference (10))
Stations 3, and 17-20 were removed during the baseline monitoring phase, and Stations 23 and 24 were added
Wetlands – Operations Monitoring
Mine Site Wetlands
GW E TBD Large Figure 8 in
Reference (10)
Elevation – relative to ground surface
TBD TBD This program will provide the necessary information to determine whether indirect hydrologic impacts have occurred and to assess required mitigation measures.
Additional information is available in Section 4.3 of the Wetland Management Plan (Reference (10)) Final number of stations is TBD

Large Table 5 Monitoring Plan – Surface Water - NorthMet Mine Site
Monitoring Plan Med
ia
Stat
us
Station ID (Nomenclature) Location Map Parameter Group(s) Frequency Reporting Requirements Additional Information
Partridge River SW E SW-002 (PM-2)
SW-003 (PM-3)
SW-004 (PM-16)
SW-004a
SW-005 (PM-4)
Large Figure 12 Flow Rate Monthly Flow Rate Monitoring Reports
Annual
May, August, November
Monitoring of the Partridge River to define trends in water flow and identify potential impacts from the Project
SW-001 (upstream of the Mine Site) and SW-006 (upstream of Colby Lake, which is actually the USGS gage) have been omitted
Water Quality (see Large Table 6, Surface
Water)
Monthly Water Quality Monitoring Reports
Annual
May, August, November
Monitoring of the Partridge River to define trends on water quality and identify potential impacts from the Project
Partridge River Tributaries SW E SW-007 (WP-1)
SW-008 (LN-1)
SW-009 (WL-1)
SW-010 (PM-5)
Large Figure 12 Flow Rate Monthly Flow Rate Monitoring Reports
Annual
May, August, November
Monitoring of the Partridge River tributaries to define trends in water flow and identify potential impacts from the Project
Water Quality
(see Large Table 6, Surface Water)
Monthly Water Quality Monitoring Reports
Annual
May, August, November
Monitoring of the Partridge River tributaries to define trends on water quality and identify potential impacts from the Project
Colby Lake SW P SW-011 (LCy-2) Large Figure 12 Water Quality
(see Large Table 6, Surface Water)
Monthly Water Quality Monitoring Reports
Annual
May, August, November
Monitoring of Colby Lake to define trends in water quality

Large Table 6 Monitoring Plan – Parameter Lists - NorthMet Mine Site
Internal Streams – Pit Water (see Large Table 1)
Parameter List TBD
Internal Streams – Stockpile Drainage, Overburden Storage and Laydown Area Runoff, Haul Road Runoff, Rail Transfer Hopper Runoff (see Large Table 1)
Parameter List TBD
Internal Streams – Waste Water Treatment Plant Influent (WWTF List 1) (see Large Table 1)
Parameter List TBD
Internal Streams – Waste Water Treatment Plant Daily Influent and Effluent (WWTF List 2) (see Large Table 1)
Parameter List TBD
Internal Streams – Waste Water Treatment Plant Monthly Influent and Effluent (WWTF List 3) (see Large Table 1)
Parameter List TBD
Stormwater – (see Large Table 2)
Parameter List TBD
Groundwater – Surficial Aquifer and Bedrock (See Large Table 3)
Parameter List TBD
Surface Water – Partridge River, Partridge River Tributaries, and Colby Lake (see Large Table 5)
Parameter List TBD

Large Figures
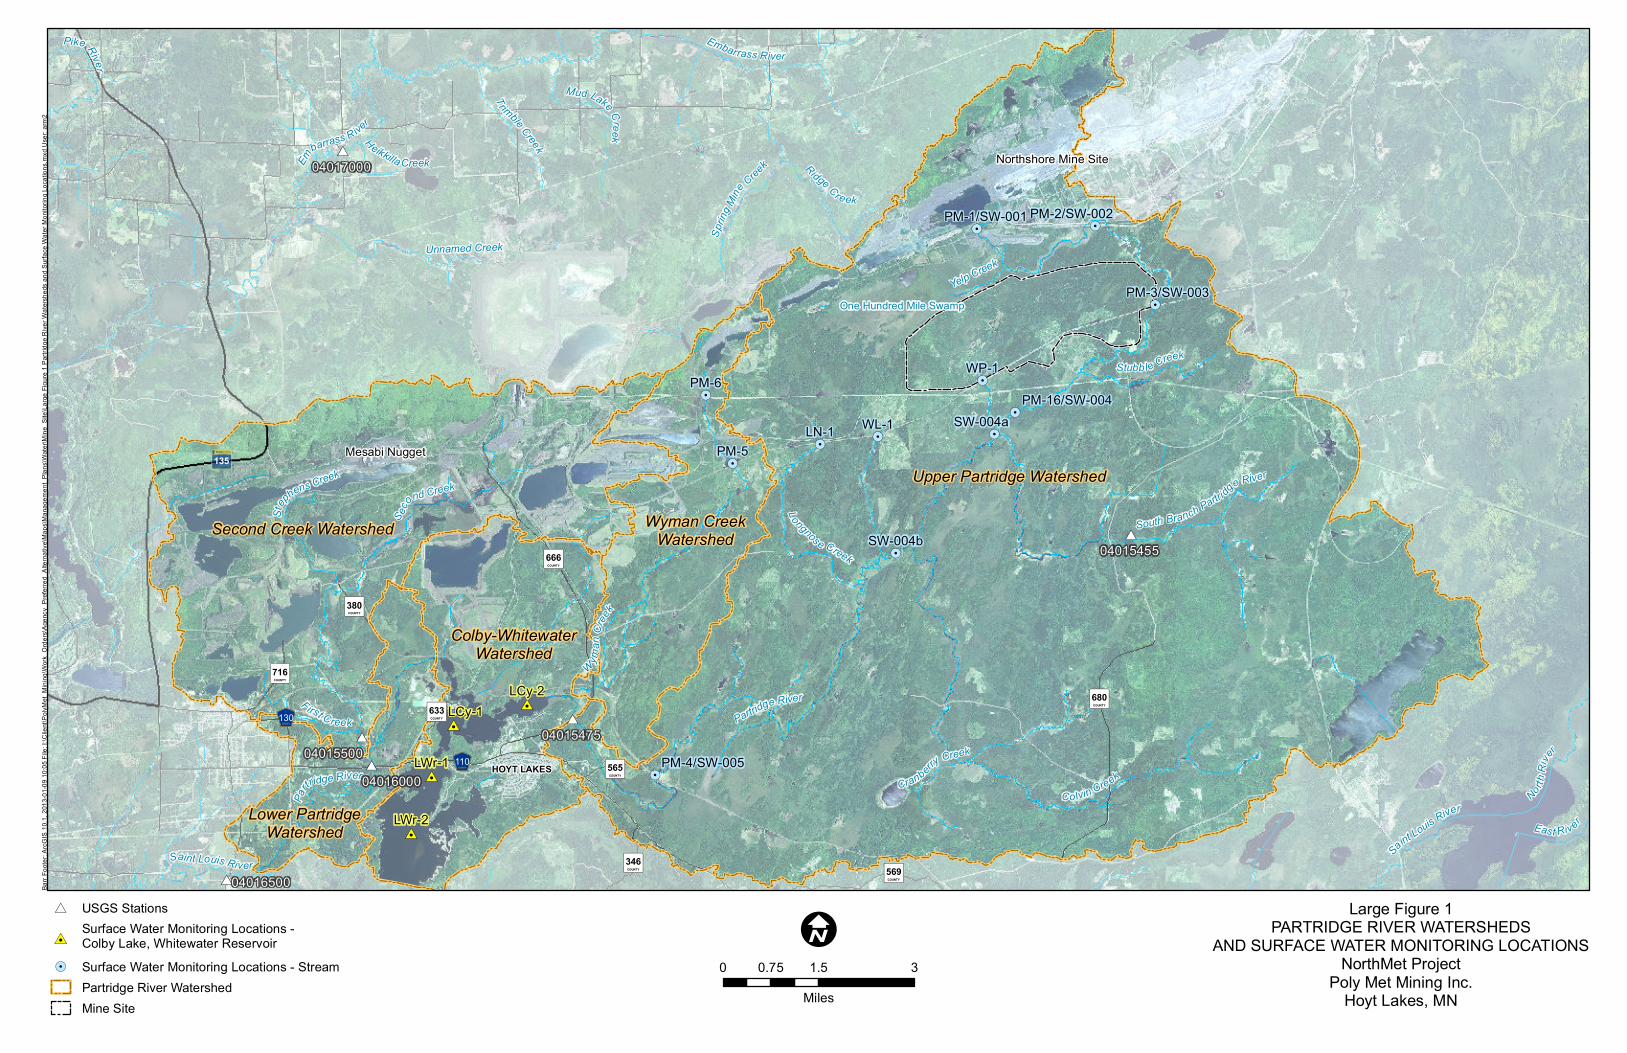
!.
!.
!.
!.
!.
!.
!.
!.!.
!.
!.
!.
#0
#0
#0
#0
#*
#*
#*
#*
#*
#* Northshore Mine Site
Mesabi Nugget
HOYT LAKES
One Hundred Mile Swamp
Upper Partridge Watershed
Second Creek Watershed
Colby-WhitewaterWatershed
Wyman CreekWatershed
Lower PartridgeWatershed
135
4567110
4567130©̈680
©̈569
©̈666
©̈633
©̈716
©̈346
©̈565
©̈380
PM-4/SW-005
PM-2/SW-002
PM-3/SW-003
PM-1/SW-001
PM-16/SW-004
LWr-2
LWr-1
LCy-1LCy-2
PM-6
PM-5
WP-1
WL-1LN-1
SW-004b
SW-004a
Partridge River
Em
barrass R iver
Colvin Creek
Wyman
Cree
k
Sec
ond Creek
NorthRi
ver
F irst C reekSp
ring Mi
ne
Creek
Unnamed Creek
South Branch Partri dge River
Longnose Creek
Trimble Creek
Stubb le Creek
Sa
int Louis River
Mud Lake Creek
Ridge Cr eek
East Riv er
Pike River
Stephens Creek
Yelp Creek
CranberryCreek
Heikkilla Creek
Partridge River
Embarrass River
Saint Louis River
04017000
04016500
0401600004015500
04015475
04015455
#* USGS Stations
#0Surface Water Monitoring Locations -Colby Lake, Whitewater Reservoir
!. Surface Water Monitoring Locations - StreamPartridge River WatershedMine Site
Large Figure 1PARTRIDGE RIVER WATERSHEDS
AND SURFACE WATER MONITORING LOCATIONSNorthMet Project
Poly Met Mining Inc.Hoyt Lakes, MN
Barr
Foote
r: ArcG
IS 10
.1, 20
13-01
-09 10
:05 Fi
le: I:\
Clien
t\Poly
Met_M
ining
\Work
_Orde
rs\Ag
ency
_Pref
erred
_Alte
rnativ
e\Map
s\Man
agem
ent_P
lans\W
ater\M
ine_S
ite\La
rge Fi
gure
1 Part
ridge
Rive
r Wate
rshed
s and
Surf
ace W
ater M
onito
ring L
ocati
ons.m
xd U
ser: a
rm2
I0 1.5 30.75
Miles

!.!.
!.
!.
!.!.
!.
!.
!.
!.
!.
!.
!.
!.
!.
!.
!.
!.
!(
!(
!(
!(
!(
!(
!(
!(
!(
!(
!(
!(
!(
!(
!(
!(
!(!(
!(
!(
!(
!(
!(
!(
!(!(
!(!(
!(
!(
!(
!(
!(
!(
")")
")")
")")")
")
")")
")
")
#0
#0
#0
!<!<!<
!<
!<
!<!<
!<
!<
!<!<
!<
!<
!<
!<
!<!<!<
!<
!<
!<
!<!<
!<
!<
!<
!<
!<
!<
")
")
")
")")
")
")
")
")
")
")")
")
")
")
"/
"/
"/
"/
"/
"/"/
"/
"/"/
"/
"/"/
"/
"/
"/
"/
"/
"/
"/
"/
"/
"/
"/
!A
!A
!A
!A
!A
!A
!A
!(
!(
!(!(
!(
!(!(
!(
!(
!(
!(
OVERBURDEN STORAGE& LAYDOWN AREA
CATEGORY 4 -REMOVED
CATEGORY 2/3 -REMOVED AND RECLAIMED
CATEGORY 1
ORE SURGE PILE
Virginia Formation
Duluth Complex
PETER MITCHELL OPEN PIT
TACONITE MINE
P2
P3
P4
P1
P4A
Ob2
Ob4
Ob5
Ob1
Ob3 2Ob3 1
717972
RS-24
RS-23
RS-22
RS-51
RS-40
RS-35
RS-36
RS-39
RS-06
RS-16 RS-13
RS-15
RS-20
RS-19
RS-18
RS-07RS-14
RS-10
RS-11
RS-12
RS-09
RS-04
RS-03
RS-01
RS-08BRS-08A
RS-17BRS-17A
RS-05BRS-05A
RS-01BRS-01A
MW-9
MW-7MW-5
MW-4
MW-3
MW-2
MW-1
MW-18
MW-17
MW-16
MW-15
MW-14
MW-13
MW-12
MW-11
MW-8DMW-8S
MW-6DMW-6S
MW-10D MW-10S
MW-05-09
MW-05-08
MW-05-02
SB-05-10
SB-05-06
SB-05-05
SB-05-04
SB-05-03
SB-05-01
WEST PIT
EAST PIT
Barr
Foote
r: ArcG
IS 10
.1, 20
13-01
-09 10
:39 Fi
le: I:\
Clien
t\Poly
Met_M
ining
\Work
_Orde
rs\Ag
ency
_Pref
erred
_Alte
rnativ
e\Map
s\Man
agem
ent_P
lans\W
ater\M
ine_S
ite\La
rge Fi
gure
2 Geo
logic_
Hydro
geolo
gic C
ollec
tion L
ocati
ons.m
xd U
ser: a
rm2
Large Figure 2GEOLOGIC/HYDROGEOLOGICDATA COLLECTION LOCATIONS
NorthMet ProjectPoly Met Mining Inc.
Hoyt Lakes, MN
Mine SiteYear 20 Mine Plan
Active StockpileRemoved and Reclaimed StockpilesRemoved StockpileUncovered StockpileCovered StockpileMine Pits
Haul RoadsReclaimed Haul Roads
Phase I!( Bedrock Aquifer Testing Location - 2005!A Soil Boring - 2005
Phase II") Observation Wells - 2005/2006") Pumping Test Wells - 2005/2006
!( Phase III - Wetland Piezometer - 2006!< Overburden Geochem/Geotech Boring - 2008!< 2011/2012 Rotasonic Borings!. Exploratory Borehole Sump Logging Location - 2010#0 Sorption Sampling Location - 2009"/ Monitoring Well!( Bedrock Groundwater Elevation Measurement - 2006") Golder Test Trench - 2006
Unit BoundariesExisting Trails and RoadsProposed Railroad TrackExisting Private Railroad
I0 1,500 3,000750
Feet

Dunka Road
PETER MITCHELL OPEN PIT
TACONITE MINE
Direction of overflow during100-yr flood event.
Average WL = 1550 ft100-yr WL = 1553.7 ft
Average WL = 1608.6 ft100-yr WL = 1609.9 ft
Average WL = 1625.6 ft100-yr WL = 1626.3 ft
Average WL = 1599 ft100-yr WL = 1601.7 ft
Average WL = 1575.7 ft100-yr WL = 1577.7 ft
Average WL = 1536.7 ft100-yr WL = 1538.3 ft
Average WL = 1598.3 ft100-yr WL = 1601.3 ft
Average WL = 1582.2 ft100-yr WL = 1584.6 ft
Average WL = 1556.7 ft100-yr WL = 1560.9 ft
Average WL = 1528.5 ft100-yr WL = 1531.9 ft
Average WL = 1591.7 ft100-yr WL = 1593.3 ft
Average WL = 1526.9 ft100-yr WL = 1531.4 ft
CATEGORY 1ORE SURGE PILE
CATEGORY 2/3 -REMOVED AND RECLAIMEDCATEGORY 4 -
REMOVED
OVERBURDEN STORAGE& LAYDOWN AREA
Partridge River
Stubble Creek
Yelp Creek
Rid ge C reek
Partri d ge R iver
WEST PIT
EAST PIT
Large Figure 3MINE SITE EXISTING SUBWATERSHED BOUNDARIES
AND PARTRIDGE RIVER FLOODPLAINNorthMet Project
Poly Met Mining Inc.Hoyt Lakes, MN
Barr
Foote
r: ArcG
IS 10
.1, 20
13-01
-09 12
:31 Fi
le: I:\
Clien
t\Poly
Met_M
ining
\Work
_Orde
rs\Ag
ency
_Pref
erred
_Alte
rnativ
e\Map
s\Man
agem
ent_P
lans\W
ater\M
ine_S
ite\La
rge Fi
gure
3 Mi
ne Si
te Ex
isting
Sub
water
shed
Boun
darie
s and
Part
ridge
Rive
r Floo
dplai
n.mxd
Use
r: arm
2
Streams/RiversSubwatershed Flow DirectionPartridge River Subwatersheds100-yr Floodplain (without NorthMet Project)
Mine SiteMine Footprint - Year 20Haul RoadsDunka RoadProposed Railroad TrackExisting Private Railroad
I0 2,000 4,0001,000
FeetWL = Water Level

!
!
ORE SURGE PILE
OVERBURDEN STORAGE& LAYDOWN AREA
CATEGORY 4
CATEGORY 1
CATEGORY 2/3
CENTRAL PUMPING STATIONWASTE WATER TREATMENT FACILITY (WWTF) BUILDING
RAIL TRANSFER HOPPER
DUNKA ROADTREATED WATER PIPELINE
MINE SITE FUELING AND MAINTENANCE FACILITY
WWTF PONDS
CPSPOND
PETER MITCHELL OPEN PIT
TACONITE MINE
TEMPORARY POND
S4, PW-S4
S23-1PW-S23-1
PW-OSLA
PW-HRE
PW-HRC
PW-RTHSOSP, PW-SOSP
Sump 2
Sump 1EAST PIT
Partridge R ive
r
Stu bble Creek
Yelp Creek
Partri dge River
Barr
Foote
r: ArcG
IS 10
.1, 20
13-01
-09 11
:41 Fi
le: I:\
Clien
t\Poly
Met_M
ining
\Work
_Orde
rs\Ag
ency
_Pref
erred
_Alte
rnativ
e\Map
s\Man
agem
ent_P
lans\W
ater\M
ine_S
ite\La
rge Fi
gure
4 Proc
ess W
ater M
anag
emen
t Yea
r 1.m
xd U
ser: a
rm2
Large Figure 4PROCESS WATER MANAGEMENT
YEAR 1NorthMet Project
Poly Met Mining Inc.Hoyt Lakes, MN
Mine SiteMine PitActive StockpileHaul RoadsProposed Railroad TrackExisting Private Railroad
Process Water PipeGroundwater Containment SystemPonds and SumpsPW = Process Water Pond; S = Sump
I0 1,500 3,000750
Feet
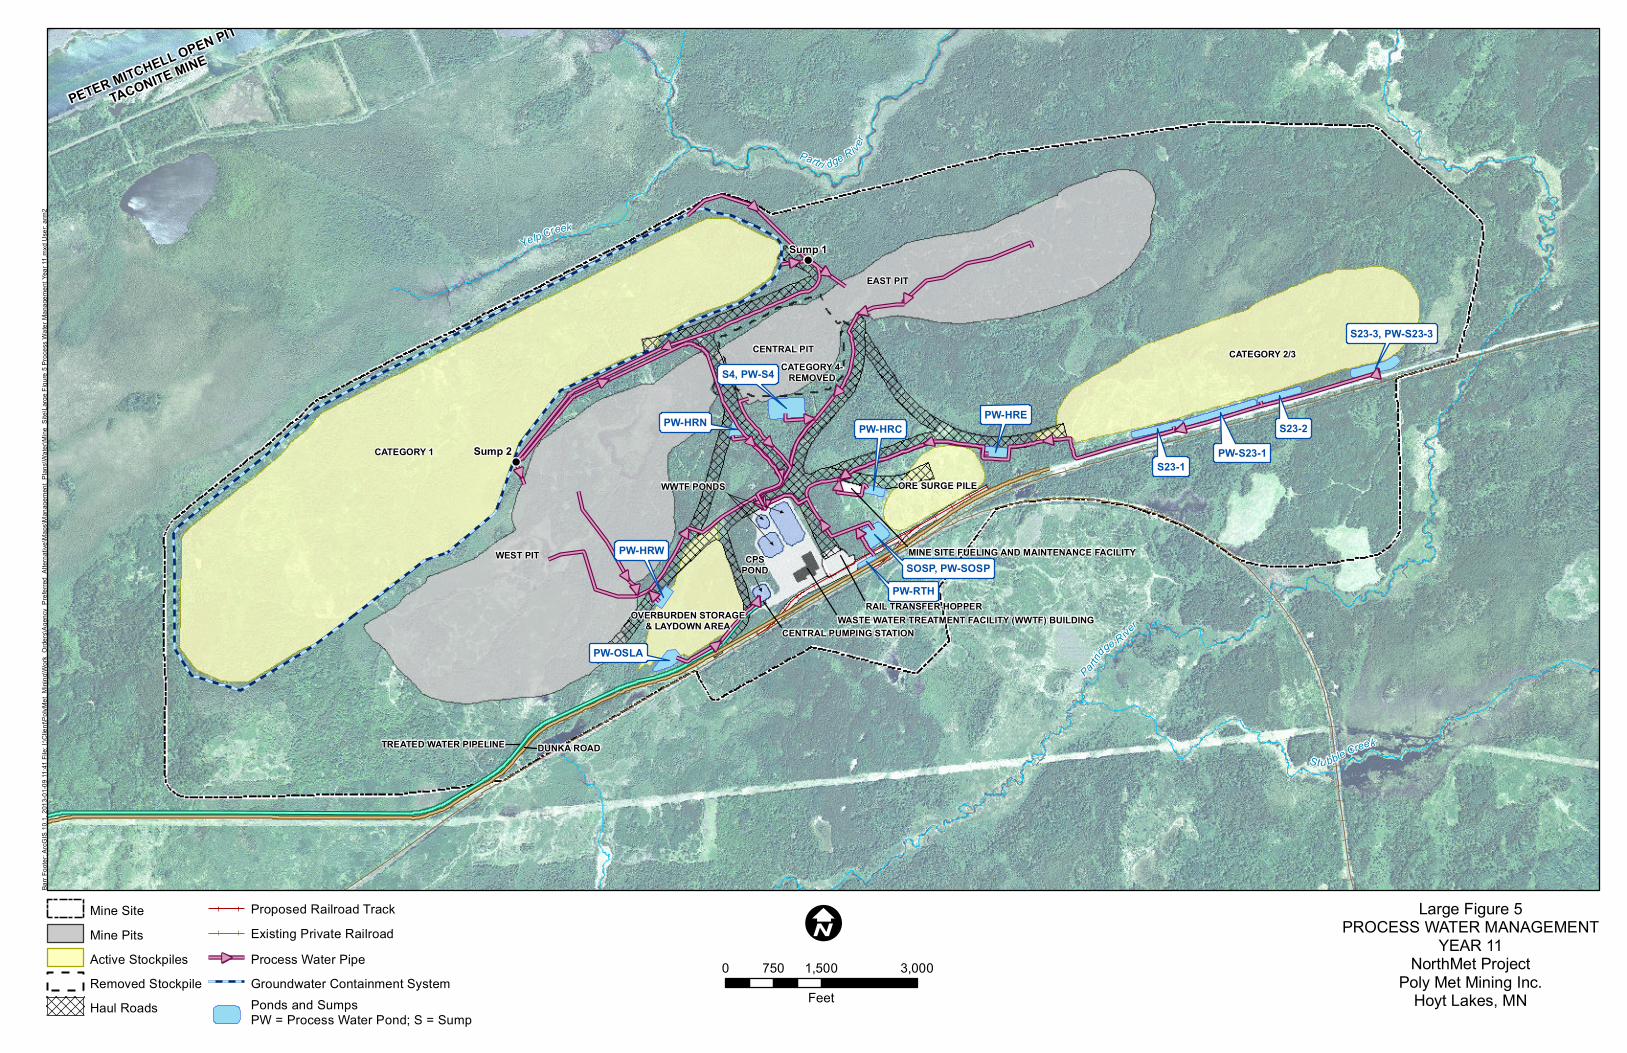
!
!
ORE SURGE PILE
OVERBURDEN STORAGE& LAYDOWN AREA
CATEGORY 4-REMOVED
CATEGORY 2/3
CATEGORY 1
CENTRAL PUMPING STATIONWASTE WATER TREATMENT FACILITY (WWTF) BUILDING
RAIL TRANSFER HOPPER
DUNKA ROADTREATED WATER PIPELINE
WWTF PONDS
MINE SITE FUELING AND MAINTENANCE FACILITY
CENTRAL PIT
CPSPOND
PETER MITCHELL OPEN PIT
TACONITE MINE
S4, PW-S4
S23-1PW-S23-1
S23-2
PW-OSLA
S23-3, PW-S23-3
PW-HRW
PW-HRN
SOSP, PW-SOSP
PW-HRCPW-HRE
PW-RTH
Sump 2
Sump 1
WEST PIT
EAST PIT
Partridge R ive
r
Stu bble Creek
Yelp Creek
Partri dge River
Barr
Foote
r: ArcG
IS 10
.1, 20
13-01
-09 11
:41 Fi
le: I:\
Clien
t\Poly
Met_M
ining
\Work
_Orde
rs\Ag
ency
_Pref
erred
_Alte
rnativ
e\Map
s\Man
agem
ent_P
lans\W
ater\M
ine_S
ite\La
rge Fi
gure
5 Proc
ess W
ater M
anag
emen
t Yea
r 11.m
xd U
ser: a
rm2
Large Figure 5PROCESS WATER MANAGEMENT
YEAR 11NorthMet Project
Poly Met Mining Inc.Hoyt Lakes, MN
Mine SiteMine PitsActive StockpilesRemoved StockpileHaul Roads
Proposed Railroad TrackExisting Private RailroadProcess Water PipeGroundwater Containment SystemPonds and SumpsPW = Process Water Pond; S = Sump
I0 1,500 3,000750
Feet
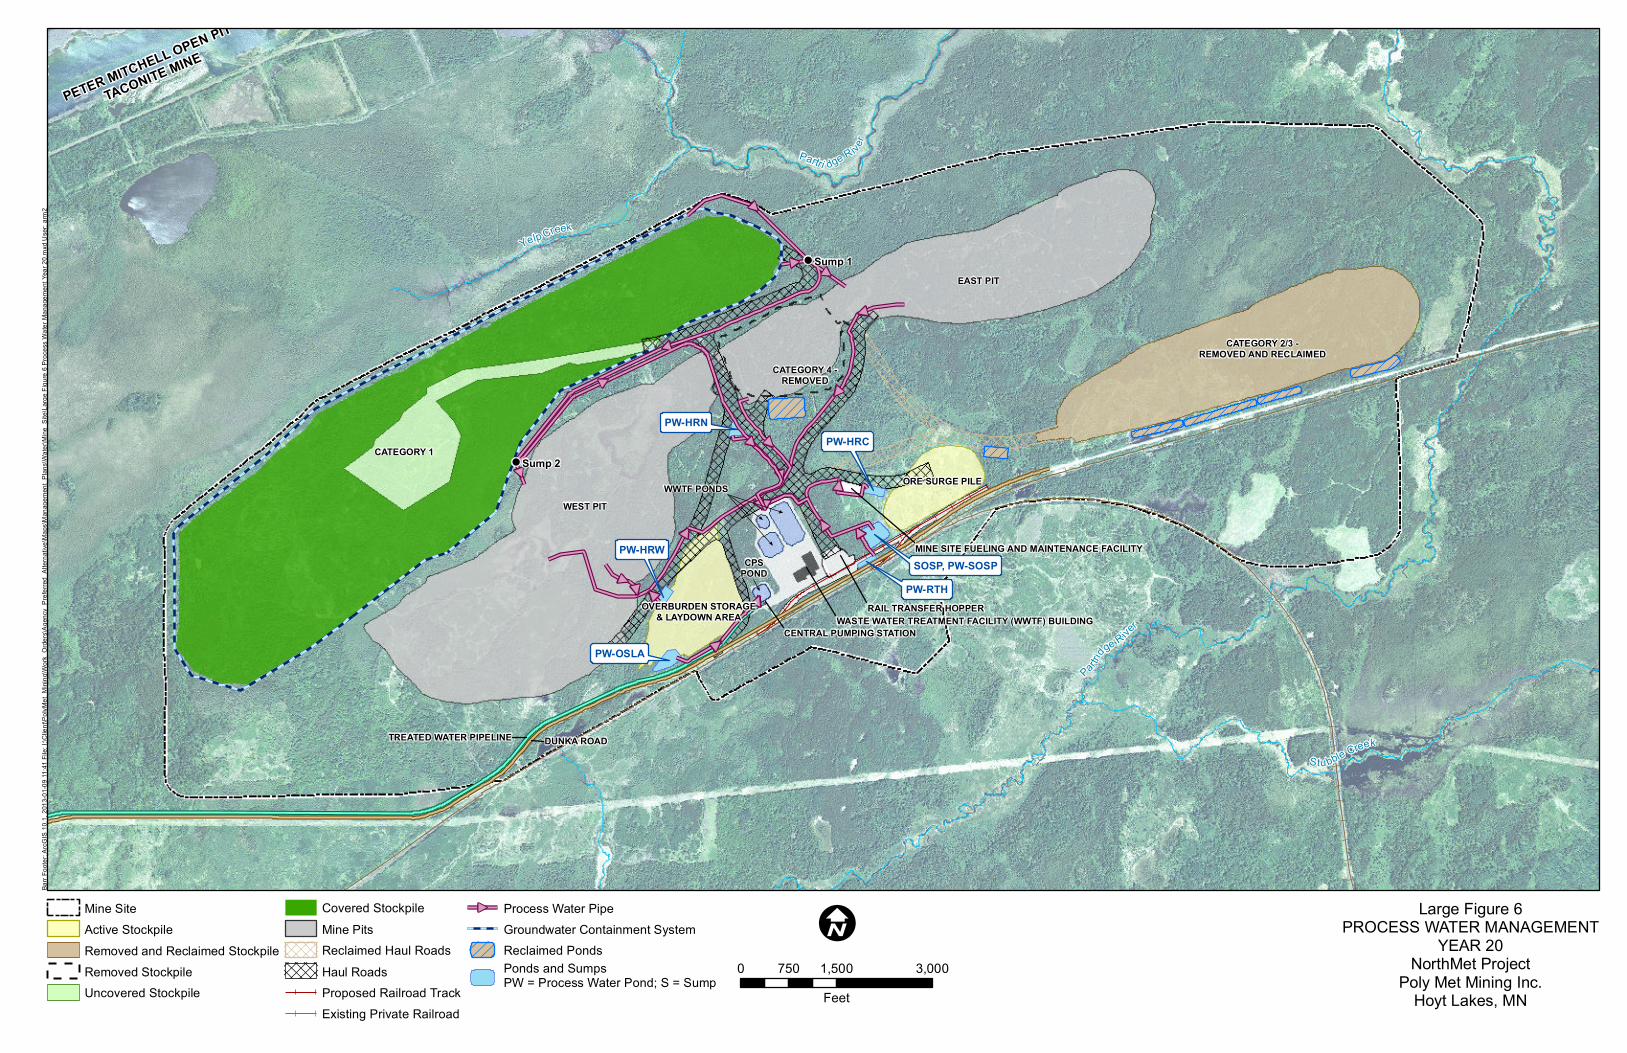
!
!
OVERBURDEN STORAGE& LAYDOWN AREA
CATEGORY 4 -REMOVED
CATEGORY 2/3 -REMOVED AND RECLAIMED
CATEGORY 1
ORE SURGE PILE
CENTRAL PUMPING STATIONWASTE WATER TREATMENT FACILITY (WWTF) BUILDING
RAIL TRANSFER HOPPER
DUNKA ROADTREATED WATER PIPELINE
WWTF PONDS
MINE SITE FUELING AND MAINTENANCE FACILITYCPS
POND
PETER MITCHELL OPEN PIT
TACONITE MINE
PETER MITCHELL OPEN PIT
TACONITE MINE PETER MITCHELL OPEN PIT
TACONITE MINE
WEST PIT
EAST PIT
PW-OSLA
PW-HRW
PW-HRN
PW-RTH
PW-HRC
SOSP, PW-SOSP
Sump 2
Sump 1
Partridge R iver
Stu bble Creek
Yelp Creek
Partri dge River
Barr
Foote
r: ArcG
IS 10
.1, 20
13-01
-09 11
:41 Fi
le: I:\
Clien
t\Poly
Met_M
ining
\Work
_Orde
rs\Ag
ency
_Pref
erred
_Alte
rnativ
e\Map
s\Man
agem
ent_P
lans\W
ater\M
ine_S
ite\La
rge Fi
gure
6 Proc
ess W
ater M
anag
emen
t Yea
r 20.m
xd U
ser: a
rm2
Large Figure 6PROCESS WATER MANAGEMENT
YEAR 20NorthMet Project
Poly Met Mining Inc.Hoyt Lakes, MN
I0 1,500 3,000750
Feet
Mine SiteActive StockpileRemoved and Reclaimed StockpileRemoved StockpileUncovered Stockpile
Covered StockpileMine PitsReclaimed Haul RoadsHaul RoadsProposed Railroad TrackExisting Private Railroad
Process Water PipeGroundwater Containment SystemReclaimed PondsPonds and SumpsPW = Process Water Pond; S = Sump
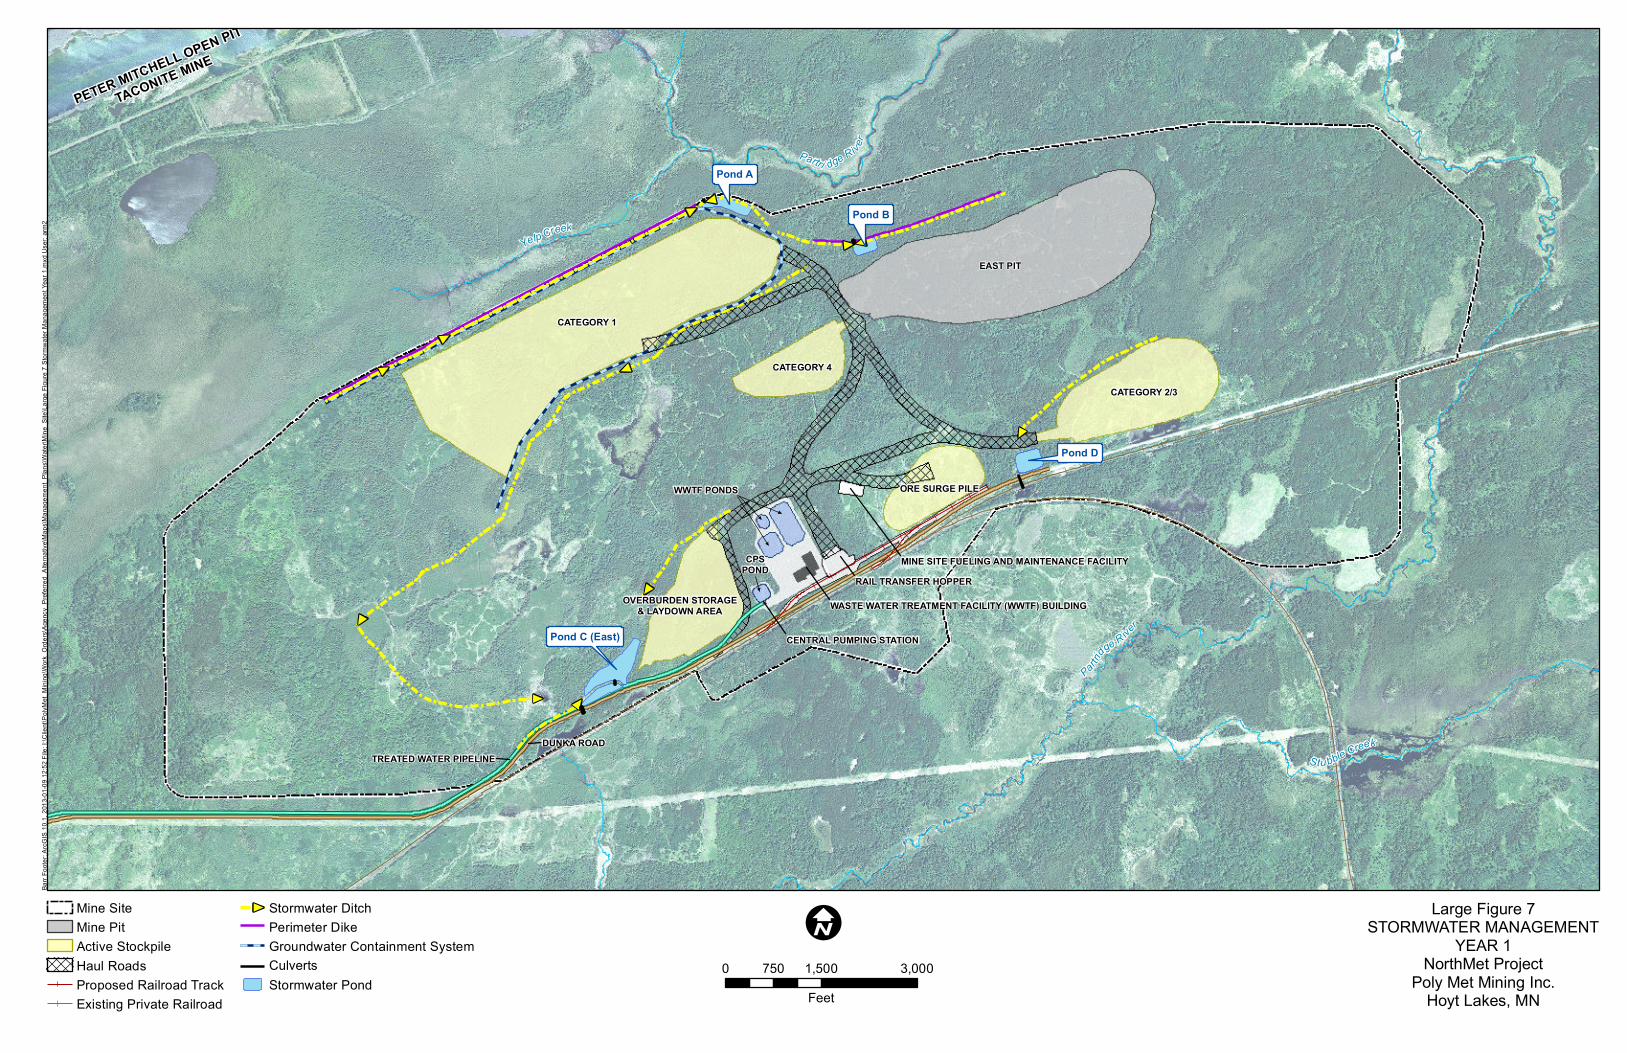
ORE SURGE PILE
OVERBURDEN STORAGE& LAYDOWN AREA
CATEGORY 4
CATEGORY 1
CATEGORY 2/3
CENTRAL PUMPING STATION
WASTE WATER TREATMENT FACILITY (WWTF) BUILDING
RAIL TRANSFER HOPPER
DUNKA ROADTREATED WATER PIPELINE
MINE SITE FUELING AND MAINTENANCE FACILITYCPSPOND
WWTF PONDS
PETER MITCHELL OPEN PIT
TACONITE MINE
Pond C (East)
Pond D
Pond A
Pond B
EAST PIT
Partridge R ive
r
Stu bble Creek
Yelp Creek
Partri dge River
Barr
Foote
r: ArcG
IS 10
.1, 20
13-01
-09 12
:52 Fi
le: I:\
Clien
t\Poly
Met_M
ining
\Work
_Orde
rs\Ag
ency
_Pref
erred
_Alte
rnativ
e\Map
s\Man
agem
ent_P
lans\W
ater\M
ine_S
ite\La
rge Fi
gure
7 Stor
mwate
r Man
agem
ent Y
ear 1
.mxd
Use
r: arm
2
Mine SiteMine PitActive StockpileHaul RoadsProposed Railroad TrackExisting Private Railroad
Stormwater DitchPerimeter DikeGroundwater Containment SystemCulvertsStormwater Pond
Large Figure 7STORMWATER MANAGEMENT
YEAR 1NorthMet Project
Poly Met Mining Inc.Hoyt Lakes, MN
I0 1,500 3,000750
Feet
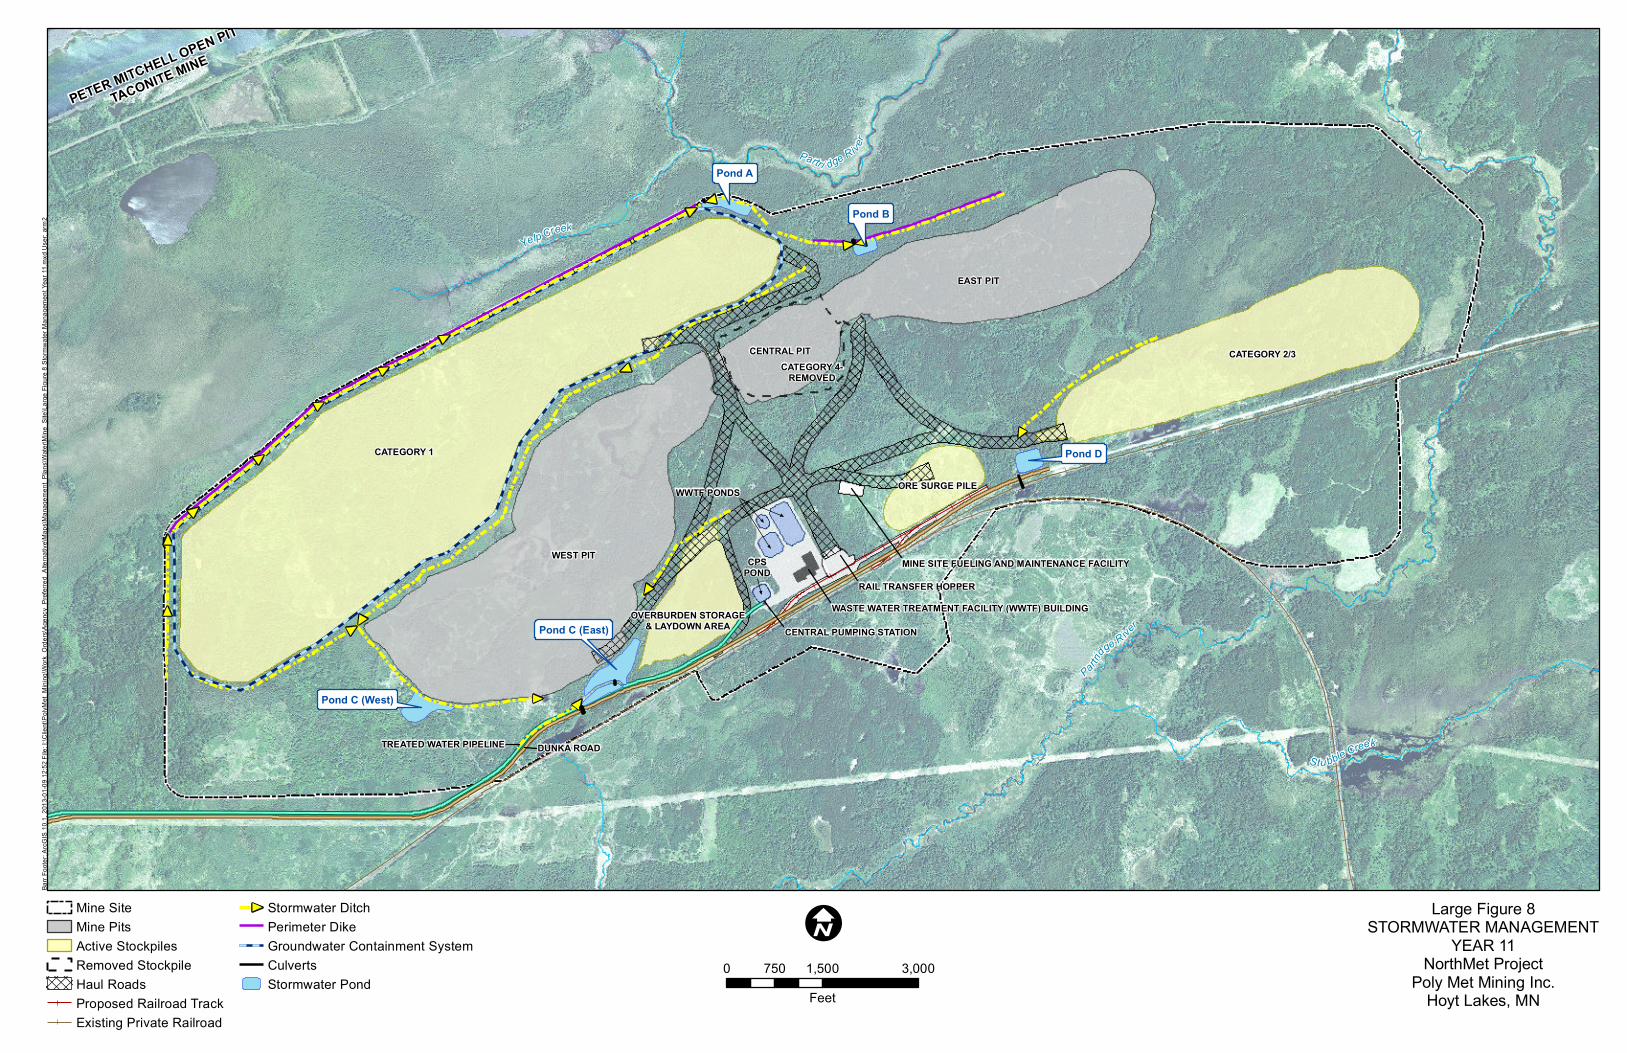
ORE SURGE PILE
OVERBURDEN STORAGE& LAYDOWN AREA
CATEGORY 4-REMOVED
CATEGORY 2/3
CATEGORY 1
CENTRAL PUMPING STATION
WASTE WATER TREATMENT FACILITY (WWTF) BUILDINGRAIL TRANSFER HOPPER
DUNKA ROADTREATED WATER PIPELINE
MINE SITE FUELING AND MAINTENANCE FACILITY
CENTRAL PIT
CPSPOND
WWTF PONDS
PETER MITCHELL OPEN PIT
TACONITE MINE
Pond C (East)
Pond D
Pond A
Pond C (West)
Pond B
WEST PIT
EAST PIT
Partridge R ive
r
Stu bble Creek
Yelp Creek
Partri dge River
Barr
Foote
r: ArcG
IS 10
.1, 20
13-01
-09 12
:52 Fi
le: I:\
Clien
t\Poly
Met_M
ining
\Work
_Orde
rs\Ag
ency
_Pref
erred
_Alte
rnativ
e\Map
s\Man
agem
ent_P
lans\W
ater\M
ine_S
ite\La
rge Fi
gure
8 Stor
mwate
r Man
agem
ent Y
ear 1
1.mxd
Use
r: arm
2
Mine SiteMine PitsActive StockpilesRemoved StockpileHaul RoadsProposed Railroad TrackExisting Private Railroad
Stormwater DitchPerimeter DikeGroundwater Containment SystemCulvertsStormwater Pond
Large Figure 8STORMWATER MANAGEMENT
YEAR 11NorthMet Project
Poly Met Mining Inc.Hoyt Lakes, MN
I0 1,500 3,000750
Feet

OVERBURDEN STORAGE& LAYDOWN AREA
CATEGORY 4 -REMOVED
CATEGORY 2/3 -REMOVED AND RECLAIMED
CATEGORY 1
ORE SURGE PILE
CENTRAL PUMPING STATION
WASTE WATER TREATMENT FACILITY (WWTF) BUILDING
RAIL TRANSFER HOPPER
DUNKA ROADTREATED WATER PIPELINE
CPSPOND
WWTF PONDS
MINE SITE FUELING & MAINTENANCE FACILITY
PETER MITCHELL OPEN PIT
TACONITE MINE
Pond C (East)
Pond D
Pond A
Pond C (West)
Pond B
WEST PIT
EAST PIT
Partridge R ive
r
Stu bble Creek
Yelp Creek
Partri dge River
Barr
Foote
r: ArcG
IS 10
.1, 20
13-01
-09 12
:52 Fi
le: I:\
Clien
t\Poly
Met_M
ining
\Work
_Orde
rs\Ag
ency
_Pref
erred
_Alte
rnativ
e\Map
s\Man
agem
ent_P
lans\W
ater\M
ine_S
ite\La
rge Fi
gure
9 Stor
mwate
r Man
agem
ent Y
ear 2
0.mxd
Use
r: arm
2
Mine SiteUncovered StockpileCovered StockpileActive StockpileRemoved & Reclaimed StockpilesRemoved Stockpile
Mine PitsHaul RoadsReclaimed Haul RoadsProposed Railroad TrackExisting Private Railroad
Stormwater DitchPerimeter DikeGroundwater Containment SystemCulverts
Large Figure 9STORMWATER MANAGEMENT
YEAR 20NorthMet Project
Poly Met Mining Inc.Hoyt Lakes, MN
I0 1,500 3,000750
Feet

!R
$8
$8
$8
$8
$8$8
$8$8
#0
#0
#0
#0
#0
#0
#0
#0
#0
#0
"/
"/
"/
"/
"/
"/
"/
"/
!.
!.
!.
!.
!.
!.
#0
#0
ORE SURGE PILE
OVERBURDEN STORAGE& LAYDOWN AREA
CATEGORY 4-REMOVED
CATEGORY 2/3
CATEGORY 1
CENTRAL PUMPING STATION
WASTE WATER TREATMENT FACILITY (WWTF) BUILDINGRAIL TRANSFER HOPPER
DUNKA ROADTREATED WATER PIPELINE
MINE SITE FUELING ANDMAINTENANCE FACILITY
CENTRAL PIT
SD-OS-A
SD-OS-B
SD-OS-C
SD-OS-D
WS-PP-1
WS-SL-231WS-SU-231
WS-SL-4WS-SU-4
WS-SL-OSPWS-SU-OSP
WS-SL-233WS-SU-233
WS-SL-232WS-SU-232
WS-CS-1
WS-CS-2
PETER MITCHELL OPEN PIT
TACONITE MINE
WS-PW-E
WS-PW-C
WS-PW-WE
WS-PW-WWWS-RTH
WS-HRCWS-HRN
WS-HRW
WS-OSLA
WS-HRE
WEST PIT
EAST PIT
Barr
Foote
r: ArcG
IS 10
.1, 20
13-01
-07 16
:52 Fi
le: I:\
Clien
t\Poly
Met_M
ining
\Work
_Orde
rs\Ag
ency
_Pref
erred
_Alte
rnativ
e\Map
s\Man
agem
ent_P
lans\W
ater\M
ine_S
ite\La
rge Fi
gure
10 M
onito
ring P
lan Lo
catio
ns.m
xd U
ser: a
rm2
Large Figure 10PROPOSED MONITORING PLAN
MINE SITE MONITORING LOCATIONSNorthMet Project
Poly Met Mining Inc.Hoyt Lakes, MN
I0 1,500 3,000750
Feet
!R
!R WS-PP-1WS-PP-2
TREATED WATER PIPELINE DUNKA ROAD
TAILINGS BASIN MINE SITE
See Large Tables 1 and 2 for Naming Conventions
Monitoring Locations!. Process Water"/ Stormwater#0 Stockpile Drainage$8 Pit Water!R Pumping Station Flows
Groundwater Containment SystemProcess Water PipeStormwater DitchPerimeter DikeStormwater PondProcess Water Ponds
Mine SiteMine Plan - Year 11
Mine PitsActive StockpilesRemoved StockpileHaul Roads
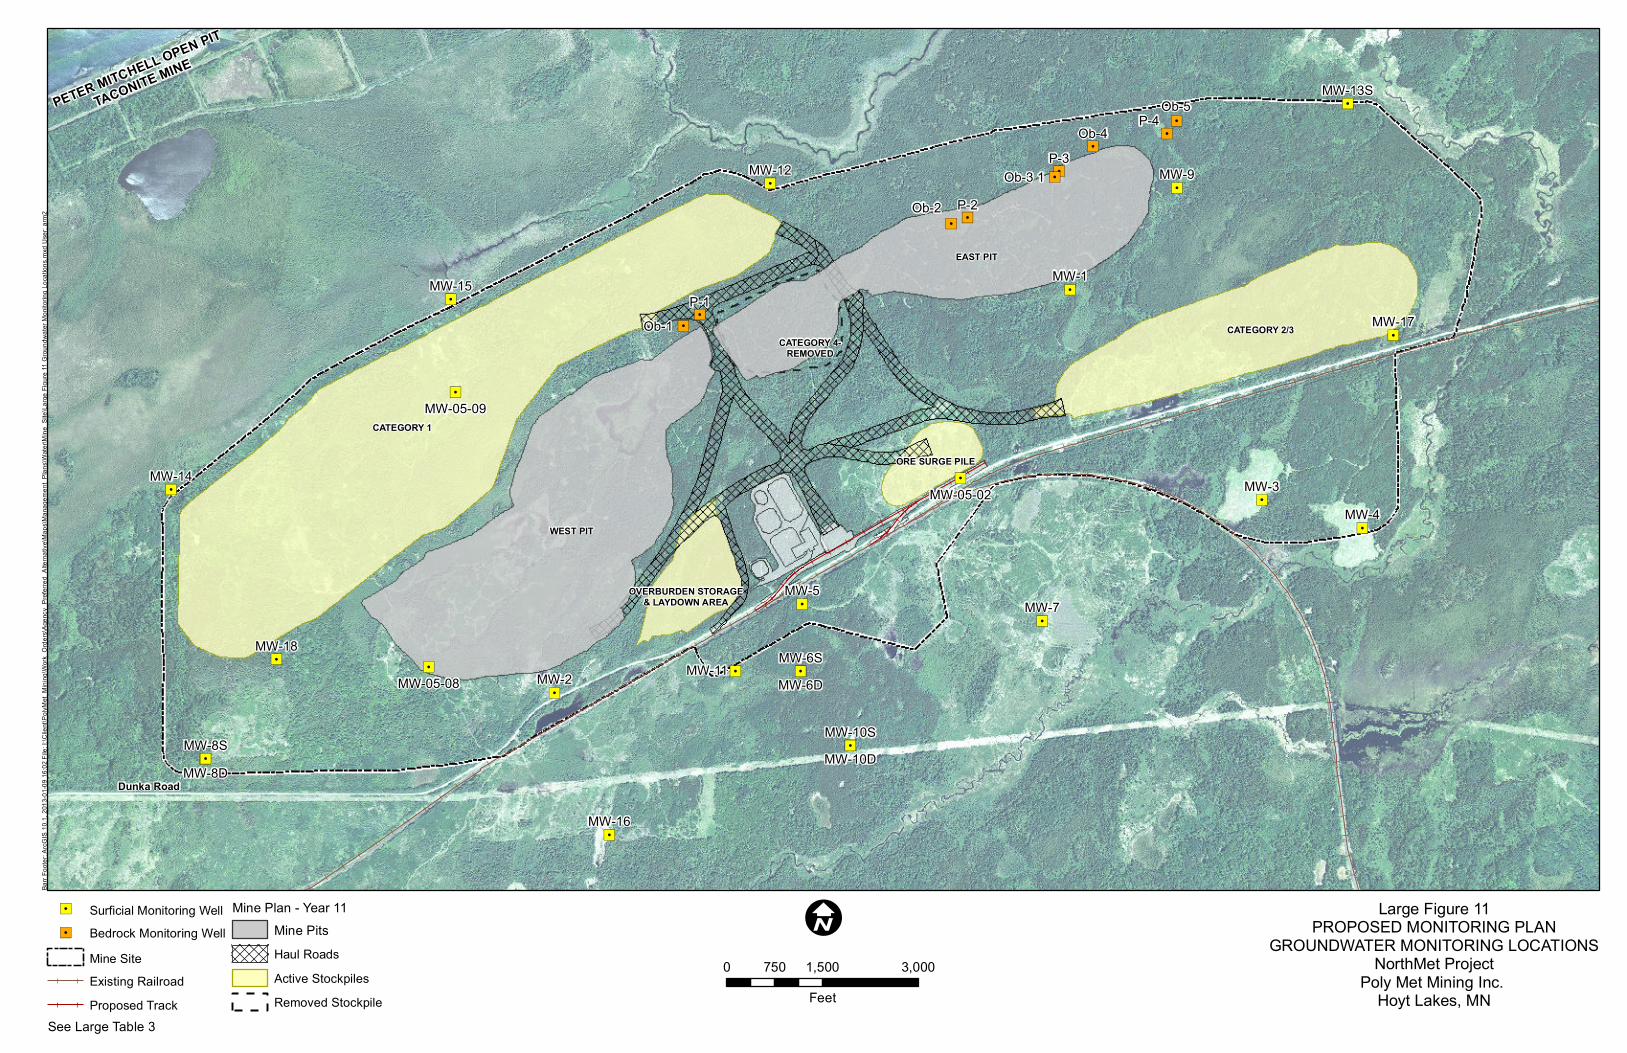
"/"/
"/"/
"/"/
"/
"/ "/
"/
"/
"/
"/
"/
"/"/
"/
"/"/
"/
"/"/
"/
"/
"/
"/
"/
"/
"/
"/
"/
"/
"/
ORE SURGE PILE
OVERBURDEN STORAGE& LAYDOWN AREA
CATEGORY 4-REMOVED
CATEGORY 2/3
CATEGORY 1
Dunka Road
PETER MITCHELL OPEN PIT
TACONITE MINE
MW-9
MW-7MW-5
MW-4MW-3
MW-2
MW-1
MW-18
MW-17
MW-16
MW-15
MW-14
MW-13S
MW-12
MW-11
MW-8SMW-10S
MW-6S
MW-05-09
MW-05-08
MW-05-02
MW-8DMW-10D
MW-6D
P-2
P-3
P-4
P-1
Ob-2
Ob-4Ob-5
Ob-1
Ob-3 1
WEST PIT
EAST PIT
Barr
Foote
r: ArcG
IS 10
.1, 20
13-01
-09 16
:02 Fi
le: I:\
Clien
t\Poly
Met_M
ining
\Work
_Orde
rs\Ag
ency
_Pref
erred
_Alte
rnativ
e\Map
s\Man
agem
ent_P
lans\W
ater\M
ine_S
ite\La
rge Fi
gure
11 G
round
water
Mon
itorin
g Loc
ation
s.mxd
Use
r: arm
2
Large Figure 11PROPOSED MONITORING PLAN
GROUNDWATER MONITORING LOCATIONSNorthMet Project
Poly Met Mining Inc. Hoyt Lakes, MN
2010 FSA Aerial Photo
0 1,500 3,000750Feet
I"/ Surficial Monitoring Well"/ Bedrock Monitoring Well
Mine SiteExisting RailroadProposed Track
Mine Plan - Year 11Mine PitsHaul RoadsActive StockpilesRemoved Stockpile
See Large Table 3

!.
!.
!.
!.
!.!.
!.
!.
!.
!.
Colby Lake
WhitewaterReservoir
Peter Mitchell Open PitTaconite Mine
Mesabi Nugget
HOYT LAKES
FlotationTailings Basin
Mine Site
Plant Site
P artridge River
Colvin Creek
Wym
anCree
kSeco
nd Creek
UnnamedCree
k
South Branch Partridge River
Longnose C reek
Stubble Creek
Wetlegs Creek
Yelp Creek
First Creek
CranberryCreek
Partri
dge R
iver
Unnamed Creek
Second Creek
SW-005 (PM-4)
SW-002 (PM-2)
SW-003 (PM-3)
SW-004 (PM-16)
PM-5
WP-1
WL-1LN-1
LCy-2
4567110
SW-004a
©̈680
©̈666
©̈633
©̈565
©̈380
©̈362
Large Figure 12PROPOSED MONITORING PLAN
SURFACE WATER MONITORING LOCATIONSNorthMet Project
Poly Met Mining Inc.Hoyt Lakes, MN
Barr
Foote
r: ArcG
IS 10
.1, 20
13-01
-09 15
:40 Fi
le: I:\
Clien
t\Poly
Met_M
ining
\Work
_Orde
rs\Ag
ency
_Pref
erred
_Alte
rnativ
e\Map
s\Man
agem
ent_P
lans\W
ater\M
ine_S
ite\La
rge Fi
gure
12 Su
rface
Wate
r Mon
itorin
g Loc
ation
s.mxd
Use
r: arm
2
I1 0 10.5
Miles
!. Surface Water Monitoring LocationsStreams/RiversProject Areas
Mine Plan - Year 11Mine PitsActive StockpilesRemoved StockpileHaul Roads
See Large Table 5
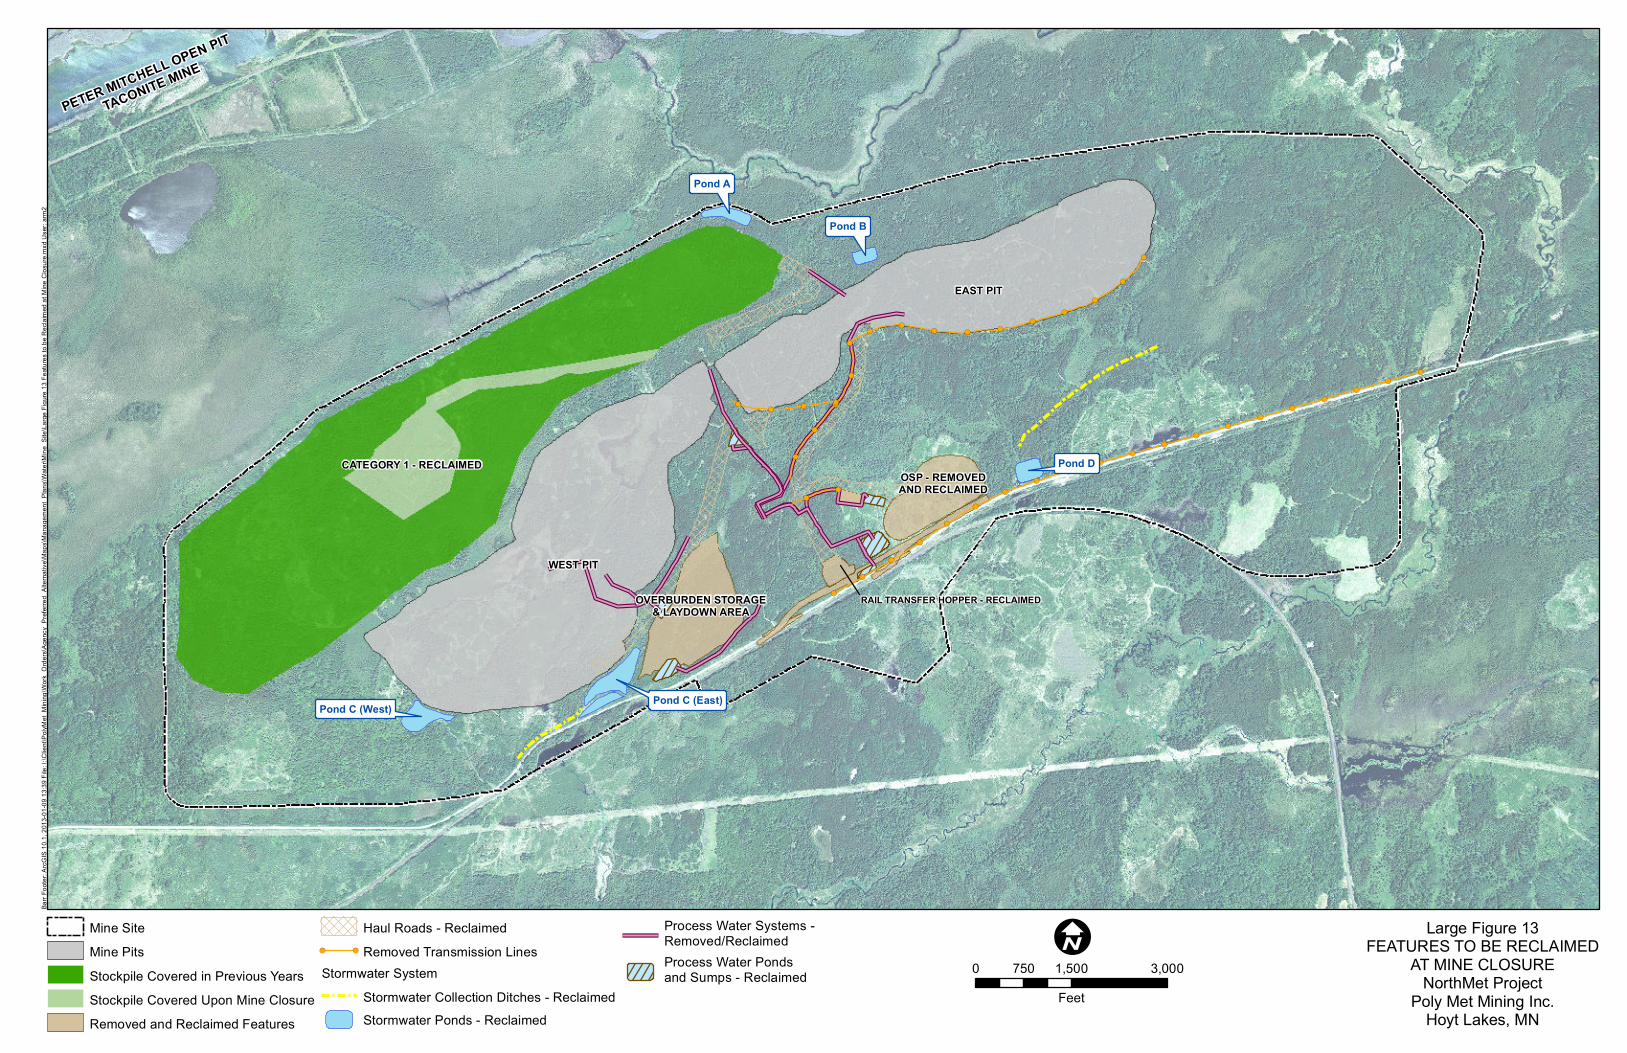
!(
!(
!(
!(
!(
!(!(!(!(
!(
!(!(
!(
!(
!(
!(
!(
!(
!(
!(
!(
!(
!(
!(
!(
!(
!(
!(
!(
!(
!(
!(
!(
!(
!(
!(!(!(
!(
!(!(
RAIL TRANSFER HOPPER - RECLAIMED
PETER MITCHELL OPEN PIT
TACONITE MINE
OSP - REMOVEDAND RECLAIMED
CATEGORY 1 - RECLAIMED
OVERBURDEN STORAGE& LAYDOWN AREA
Pond C (East)
Pond D
Pond A
Pond C (West)
Pond B
WEST PIT
EAST PIT
Barr
Foote
r: ArcG
IS 10
.1, 20
13-01
-09 13
:39 Fi
le: I:\
Clien
t\Poly
Met_M
ining
\Work
_Orde
rs\Ag
ency
_Pref
erred
_Alte
rnativ
e\Map
s\Man
agem
ent_P
lans\W
ater\M
ine_S
ite\La
rge Fi
gure
13 Fe
atures
to be
Rec
laime
d at M
ine C
losure
.mxd
Use
r: arm
2
Large Figure 13FEATURES TO BE RECLAIMED
AT MINE CLOSURENorthMet Project
Poly Met Mining Inc.Hoyt Lakes, MN
Mine SiteMine PitsStockpile Covered in Previous YearsStockpile Covered Upon Mine ClosureRemoved and Reclaimed Features
Haul Roads - Reclaimed!( !( Removed Transmission LinesStormwater System
Stormwater Collection Ditches - ReclaimedStormwater Ponds - Reclaimed
Process Water Systems -Removed/ReclaimedProcess Water Pondsand Sumps - Reclaimed
I0 1,500 3,000750
Feet

DD
DDDD
DD
DD
DD
DD
DD
DDDD
DD
DD
DDDD
DD
DD
DDDD
DDDD
DD
DD
DD
DD
DD
DD
DD
DDDDDDDDDD
DD
DD
DD
DD
DD
DD
DD
DD
DD
DD
DD
DD
DD
DD
DDDD
DDDD
DD
DD
DD
DDDD DD
DDDD
DD
DD
DD
DDDD
DDDDDD
DDDDDDDD
DD
DDDD
DD
DD
DDDD
DD
DD
DD
DD
DD
DDDD
DD
!(
!(
!(
!(
!( !( !( !( !( !( !( !( !( !( !( !( !( !( !( !( !( !( !( !( !( !( !( !( !( !( !( !( !( !( !( !( !( !( !( !( !( !( !( !( !( !( !( !( !( !( !( !( !( !( !( !( !( !( !( !( !( !( !( !( !( !( !( !( !( !(!(
!(!(
!(!(
!(!(
!(!(
!(!(
!(!(
!(!(
!(!(
!(!(
!(!(
!(!(
!(!( !( !( !(
!(!(
!(!(
!(!(
!(!(
!(!(
!(!(
!(!(
!(!(
!(!(
!(!(
!(!(
!(!(
!(
!(
!(
!(
!(
!(
!(
!(
!(
!(
!(
!(
!(
!(
!(
!(
!(
!(
!(
!(
!(
!(
!(
!(
!(
!(
!(
!(
!(
!(
!(
!(
!(
!(
!(
!(
!(
!(
!(
!(
!(
!(
!(
!(
!(
!(
!(
!(
!(
!(
!(
!(
!(
!(
!(
!(
!(
!(!(
!(!(
!(!(
!(!(
!(!(
!(!(
!(!(
!(!(
!(!(
!(!(
!(!(
!(
!(
!(
!(
!(
!(
!(
!(!( !( !( !(
!(
!(
!(
!(
!(
!(
!(
!(
!(
!(
!(
!(
!(
!(
!(
!(
!(
!(
!(!(
!(
!(
!(
!(
!(
!(
!(
!(
!(
!(
!(
!(
!(
!(
!(
!(
!( !( !( !( !( !( !( !( !( !( !( !( !(
!(!(
!(!(
!(
!(
!(
!(
!(
!(
!(
!(
!(
!(
!(
!(
!(
!(
!(
!(
!(
!(
5
5
CENTRAL PUMPING STATION
WASTE WATER TREATMENT FACILITY (WWTF) BUILDING
DUNKA ROADTREATED WATER PIPELINE
WWTF PONDS
CPSPOND
CATEGORY 1 - RECLAIMED
MINNESOTA POWERSUBSTATION
PETER MITCHELL OPEN PIT
TACONITE MINE
WEST PIT
EAST PIT
Sump 2
Sump 1
Minnesota Power 138 kV Existing Transmission Line
Partridge R iver
Stubb le Creek
Yelp Creek
Partri dge River
Barr
Foote
r: ArcG
IS 10
.1, 20
13-01
-09 14
:36 Fi
le: I:\
Clien
t\Poly
Met_M
ining
\Work
_Orde
rs\Ag
ency
_Pref
erred
_Alte
rnativ
e\Map
s\Man
agem
ent_P
lans\W
ater\M
ine_S
ite\La
rge Fi
gure
14 M
ine P
lan at
Mine
Clos
ure.m
xd U
ser: a
rm2
Large Figure 14FEATURES TO REMAIN AT MINE CLOSURE
NorthMet ProjectPoly Met Mining Inc.
Hoyt Lakes, MN
I0 1,500 3,000750
Feet
Mine SiteCovered StockpileWest PitMitigation WetlandHaul Roads
Groundwater Containment SystemProcess Water PipeStormwater Collection DitchPerimeter DikeTreated Water Pipeline
CulvertsDD DD Fence!( Proposed Transmission Lines

Attachments

Attachment A
Mechanical Design Drawings – PLACEHOLDER

Attachment B
Stormwater Design Drawings – PLACEHOLDER

Attachment C
Mine Site Storm Water Pollution Prevention Plan (SWPPP) – PLACEHOLDER

Attachment D
Mine Site Spill Prevention Control and Countermeasures (SPCC) Plan – PLACEHOLDER