water quality degradation trends in kenya over the last decade
TRANSCRIPT
23
Water Quality Degradation Trends in Kenya over the Last Decade
Shadrack Mulei Kithiia Postgraduate Programme in Hydrology,
Department of Geography and Environmental Studies, University of Nairobi, Nairobi,
Kenya
“Once the water is polluted, life is polluted; once the water is exhausted, civilization is exhausted; once the water disappears, the human being disappears;
protecting the water resources is protecting the human being”. Mingjun, J. (2010).
1. Introduction
Water is described as both a chemical substance vital to life on earth and a means for navigation. Water, is a commodity that is consumed, and carrier of other substances or properties, such as heat, disease vectors, pollutants and energy (Jordaan et al. 1993). But, whereas the total quantity of water on earth remains constant, its quality changes in both time and space. The problem of water quality was articulated by Jordaan et al. (1993) as causing a great strain on water supply systems, especially in cities along river courses. Similarly, in 1985, at the midpoint of the international water supply and sanitation decade, it was pointed out that although 870 million people lived in urban areas of the developing world, roughly 1.6 million were rural inhabitants and approximately 22% of the urban group was lacking water supply service and 40% were without sanitation. The population represented 64% and about 85% as lacking water supply and sanitation services to the rural population, respectively (Jordaan, et al. 1993). In essence, the rural inhabitants are faced with a great threat of using low quality water compared to the urban counterparts. This explains the existent problem of water quality degradation not only in the urban areas but also in the rural areas.
The problem of water pollution and quality degradation in the developing countries is
increasingly becoming a threat to the natural water resources. This phenomenon is
attributed to the increasing quest of these countries to attain industrialization status and
diversification of the national development goals and Kenya is no exception to this
phenomenon (Kithiia,S.M & Khroda, G.O, 2011).
Kenya is described as a water scarce country, and yet future projections show that per capita available water currently at 650m3/year, will likely drop to 359m3/year by 2020, as a result of population growth. This figure is far much below the global accepted value of 1000m3
www.intechopen.com
Water Quality Monitoring and Assessment
510
year-1 per capita level. Urgent action is therefore needed to increase the capacity of the water sector to improve the availability and accessibility of clean and safe drinking water (GoK, 2007). Many Kenyans especially in the rural areas have limited access to quality water. They walk for long distances in search of this precious commodity and use it raw and untreated from rivers, lakes and dams. The untreated water is not only turbid, but also contain disease causing bacteria and in some cases chemicals. The problem is further compounded by the seasonal fluctuations of water availability which is more correlated to the seasonal patterns of rainfall in most parts of the country.
“Water is essential to sustain life and a satisfactory (adequate, safe and accessible) supply must be available to all. Improving access to safe drinking water can result in tangible benefits to health. Every effort should be made to achieve a drinking water quality as safe as practicable”. (W.H. O;
Guidelines for Drinking Water Quality, 1991, 1997).
In addition, water resources in Kenya are under pressure from agricultural chemicals (fertilizers and herbicides) and urban and industrial wastes, as well as from use for hydroelectric power. Thus, increase in demand for water resources for various uses is likely to cause many constraints and lead to the pollution of the available water resources. Water pollution from urban and industrial wastes poses another environmental problem. Kenya has 20.2 cubic kilometers of renewable water resources with 76% being used in farming activity and 4% used for industrial purposes. Only about 42% of the residents in rural areas and 88% of city dwellers have pure drinking water. The situation is much worse in the informal settlements in the urban areas due to lack of proper sanitation and sewerage system. These settlements are located near or on top of the rivers courses draining the city of Nairobi and contribute significant pollutants amounts and water quality degradation.
In addition, water resources in Kenya are increasingly being polluted by organic, inorganic and microbial matter (Kithiia, 1992 & 1997). The impact of pollution on water resources is manifested by water of poor quality which gives rise to water toxicity to mammals and aquatic life; loss of aesthetic value by becoming unsuitable for recreational activities, high cost of water supply as polluted water is expensive to treat, eutrophication, deoxygenation, acid rain and habitat modification. This is evident in the urban centers and more in the city of Nairobi.
Kenyan urban population which has been growing at a rate of 8% per annum is now more that 27% of the country’s total population as described in the state of the Environment report of 2003 (NEMA, 2004). In addition, generation of solid, liquid and gaseous wastes has been increasing at the same level as industrial development and the diversification of consumption patterns. The report by NEMA (2004) indicates that per capita waste generation ranges between 0.29 and 0.66 kg day-1 within the urban areas of the country, and that of the municipal waste generated in the urban centres is 21% emanatting from industrial areas and 61% from residential areas.
The city of Nairobi is the heart of industrial production in Kenya and the commercial hub of the East African Community (EAC). It is drained by three tributaries of the Nairobi River, namely; Ngong, Nairobi and Mathare rivers. These rivers collect most of the wastes generated in the city and its waters are heavily polluted by solid, liquid and organic wastes. The polluted water has a strong impact on human beings and other living organisms and the environment in general. Nairobi River has acted as a major depository of waste from
www.intechopen.com
Water Quality Degradation Trends in Kenya over the Last Decade
511
both domestic and industrial sources. The riparian reserves of the three main rivers are marked with numerous informal settlements without adequate sewerage and sanitation services and hence discharge their raw sewage into the rivers; and most industries find it cheaper to discharge their effluents into the rivers without any satisfactory treatment (UPIU, 2009).There is therefore, a need to find strategic ways and methods of reducing pollution levels and manage the water quality status within the basin. This is the basis of the investigations explored in the present paper.
2. Background information – Water quality issues in Kenya
Trends in water use and demand are often a guide to the availability of water in terms of
both quantity and quality. In many instances, an increase in water demand and use is
directly proportional to deterioration in water quality. The amount of waste discharged
tends to increase with rising water demand, although the relationship depends in detail on
the amount of water and the specific use involved. The amount of water in a river depends
on the type and number of water abstraction facilities along the course, the number of
tributaries, amount of rainfall and distribution, soil type, temperature and the shape of the
drainage basin, as well as the population structure. The nature and extent of human activity,
be it industrial, agricultural or both, will in turn determine the magnitude and nature of
pollution and the water quality status of the water course. Clearly, in order to avoid the
dangerous consequences of serious water pollution, there is a need to properly understand
the amount of water required and the volume of effluents to be discharged by any
development projects planned for a drainage basin (Kithiia, S.M & Ongwenyi, S.O. 1997).
Water quality degradation problem is not a new phenomenon in Kenya. Initial research
reports on the problem in the country dates back in the 1950’s. In Kenya, the problem of
water quality degradation was first exposed in the MOWD (1976 a&b) containing case
studies of three rivers; Nzoia, the Nyando and Kerio. These reports contain the chemical
characteristics of water shortly before and after establishment of factories along their
courses. Nzoia River which drains into Lake Victoria carries the effluents discharged from
Pan Africa Paper Mill in Webuye upstream and from Mumias Sugar Factory downstream;
Nyando which also discharges its waters into Lake Victoria receives Molasses from Sugar
Factories, Chemilil and Muhoroni. Kerio River drains the Kerio Valley with intermittent
flow into Lake Turkana. This is now periodically polluted by effluents from fluorspar
factory established three decades ago. All these three reports are a clear indication of the
effects of industrial growth on the quality of water courses and their effluents are a major
contributing factor to water quality degradation at the extreme vicinity of industrial
activities. This was once more confirmed by a recent study done by the Ministry of Land
Reclamation and Regional Development (MLRRD, 1993) (now the Ministry of Water and
Irrigation). Many studies indicate that groundwater resources are not seriously threatened
with water pollution problem but the major concern has been on the surface waters
especially in river systems.
Other research reports which indicated water quality deterioration in Kenya are those by
Ongwenyi (1979) and Njunguna (1978). Njunguna (1978) also added that pollution in the
river (Nairobi-Athi-Sabaki) was chiefly due to domestic waste, industrial wastes and runoff
(both rural and urban).
www.intechopen.com
Water Quality Monitoring and Assessment
512
The most recent studies by Kithiia (1992, 2006), Okoth and Otieno (2000) and Mavuti (2003)
revealed degradation trends in water quality within the river system due to changes and
intensity in land use activities. The study by Kithiia (1992) in the same area revealed high
concentration levels of Mercury and Lead surpassing the critical WHO and the Kenya
standards guideline values (Mercury 0.03 and Lead 0.1 mg l-1). In the same study pesticide
residues notably DDT, “Ambush”, “Ridomil”, “Malathion” etc were all found to surpass the
WHO and the Kenya standards for drinking water. DDT was measured at 0.000086 mg l-1,
“Ambush “0.1413 mg l-1, “Ridomil” 0.147 mg l-1 and “Malathion” 0.00039 mg l-1. In addition,
the study by Kithiia (2006) within the same river systems indicated a downstream increase
in water pollutants and water quality degradation. Sediment and Heavy metal
concentrations were found to increase downstream the river courses. The increasing trends
in pollution levels and water quality deterioration are attributed to increased land use
activities and population growth rates within the urban area and the basins in general. This
calls for stringent measures to address the problem and reduce the ever increasing water
pollutants and water quality degradation. This should incorporate measures devoted
towards the reduction of the water quality degradation trends within the Nairobi River
basins in order to restore the water quality status as of the time when the city was
established.
3. Problem discussion
While the amount of water available in a drainage basin normally remains relatively static,
the demand for water often rises with changing human activities. The latter include a wide
spectrum from changes in the basic way of living to changes in the technology employed to
exploit natural resources (Dunne & Leopold, 1978; Kithiia, 1992). Water pollution often
arises as a consequence and not only does a low quality supply result, but there may also be
a major reduction in its quantity. The sources of water for Nairobi River sub-basins are the
Ondiri springs, the Kabete and Karura forests, the Ngong hills, and all the streams which
join downstream of Nairobi city to form the main Athi River. The total quantity of water in
these streams is 23.6 m3 s-1 which amounts to 36.7 X 10⁶ m3 year-1. This amount of water,
however, is less than the discharge of waste water from both industry and domestic use in
the city. This is a major source of water pollution and hence water quality degradation
within the basin and in Kenya generally.
Water demand increase and use is directly proportional to deterioration in water quality in
many instances. In most cases, the amount of waste discharged tends to increase with rising
water demand, although the relationship depends in detail on the amount of water and the
specific use involved. Thus, the nature and extent of human activity will in turn determine
the magnitude and nature of pollution as well as the water quality status of the water
course/or source.
4. Water quality problems in Nairobi city
The main water pollution problems in the city of Nairobi are closely linked to the various
land use systems. Nairobi city and its environs are the focus of the study. The area covers a
total of 2435 km2 and its part of the upper-Athi drainage basin. Its forms a greater part of the
www.intechopen.com
Water Quality Degradation Trends in Kenya over the Last Decade
513
conglomeration of the urban centres of Ruiru, Ngong and Mavoko municipalities. The city
and its environs are drained by three sub-streams of Ngong, Nairobi and Mathare rivers,
which run in a southeast direction towards the Indian Ocean. These streams drain areas of
diverse land use activities. The significant contribution of these land use activities to water
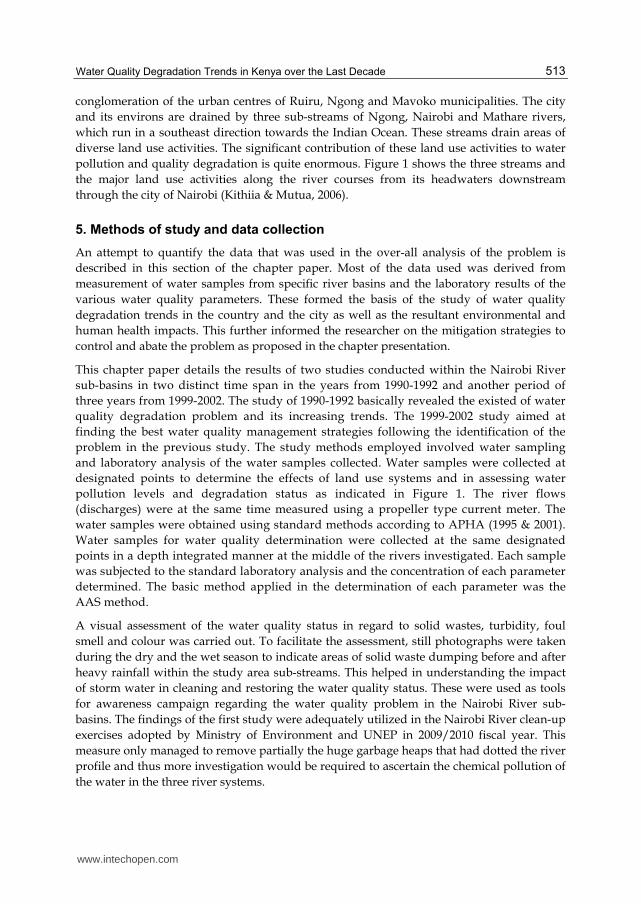
pollution and quality degradation is quite enormous. Figure 1 shows the three streams and
the major land use activities along the river courses from its headwaters downstream
through the city of Nairobi (Kithiia & Mutua, 2006).
5. Methods of study and data collection
An attempt to quantify the data that was used in the over-all analysis of the problem is
described in this section of the chapter paper. Most of the data used was derived from
measurement of water samples from specific river basins and the laboratory results of the
various water quality parameters. These formed the basis of the study of water quality
degradation trends in the country and the city as well as the resultant environmental and
human health impacts. This further informed the researcher on the mitigation strategies to
control and abate the problem as proposed in the chapter presentation.
This chapter paper details the results of two studies conducted within the Nairobi River
sub-basins in two distinct time span in the years from 1990-1992 and another period of
three years from 1999-2002. The study of 1990-1992 basically revealed the existed of water
quality degradation problem and its increasing trends. The 1999-2002 study aimed at
finding the best water quality management strategies following the identification of the
problem in the previous study. The study methods employed involved water sampling
and laboratory analysis of the water samples collected. Water samples were collected at
designated points to determine the effects of land use systems and in assessing water
pollution levels and degradation status as indicated in Figure 1. The river flows
(discharges) were at the same time measured using a propeller type current meter. The
water samples were obtained using standard methods according to APHA (1995 & 2001).
Water samples for water quality determination were collected at the same designated
points in a depth integrated manner at the middle of the rivers investigated. Each sample
was subjected to the standard laboratory analysis and the concentration of each parameter
determined. The basic method applied in the determination of each parameter was the
AAS method.
A visual assessment of the water quality status in regard to solid wastes, turbidity, foul
smell and colour was carried out. To facilitate the assessment, still photographs were taken
during the dry and the wet season to indicate areas of solid waste dumping before and after
heavy rainfall within the study area sub-streams. This helped in understanding the impact
of storm water in cleaning and restoring the water quality status. These were used as tools
for awareness campaign regarding the water quality problem in the Nairobi River sub-
basins. The findings of the first study were adequately utilized in the Nairobi River clean-up
exercises adopted by Ministry of Environment and UNEP in 2009/2010 fiscal year. This
measure only managed to remove partially the huge garbage heaps that had dotted the river
profile and thus more investigation would be required to ascertain the chemical pollution of
the water in the three river systems.
www.intechopen.com
Water Quality Monitoring and Assessment
514
$Z
$Z $Z
$Z
$Z
$Z
$Z
$Z
$Z $Z
NGONG
MUTOINI
KIRICHWA KUBWA
NAIROBI
KABETEKABETE
NAIROBINAIROBI
INDUSTRIAL AREAINDUSTRIAL AREA
NJIRUNJIRU
NAIROBI DAMNAIROBI DAM
GITATHURU
MATHARE
2 3
5
6
7
8
9 10
14
N
30 0 30 60 Kilometers
Catchment Boundary
Rivers
Rilway LineRoad
$Z Samplling Points
1 – Kirichwa Kubwa D/S Kawangware 2 – Nairobi at Muthangari 3 – Nairobi at Museum 4 – Ngong at Langata Road Bridge 5 – Mathare at Thika Road Bridge
6 – Mathare at Outer Ring Road 7 – Nairobi at Outer Ring Road 8 – Ngong at Embakasi D/S Industrial Area 9 – Nairobi at Njiru 1 10 – Nairobi at Njiru 2 - Ruai
Fig. 1. Distribution of study sampling points (1999-2002)
6. Data analysis and results
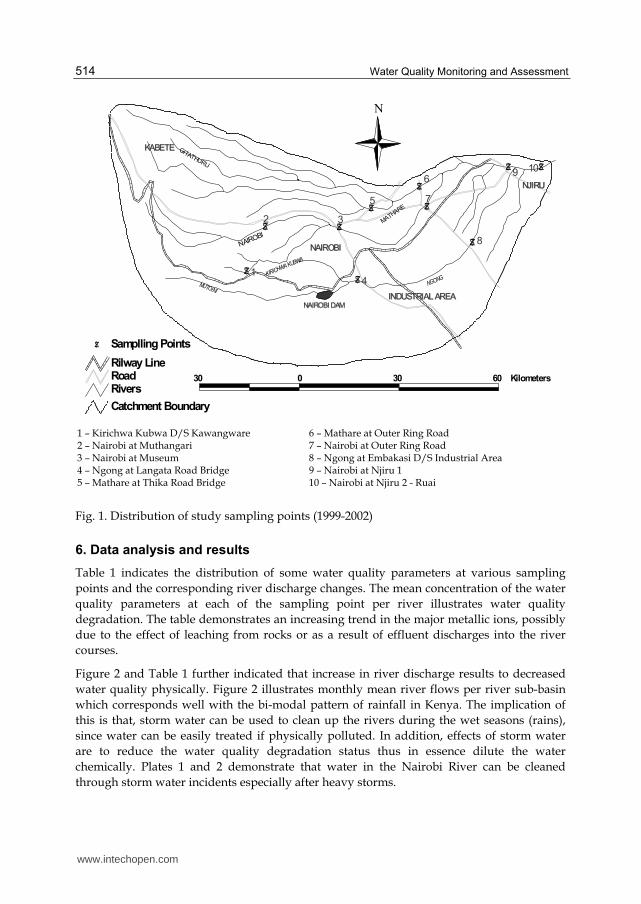
Table 1 indicates the distribution of some water quality parameters at various sampling
points and the corresponding river discharge changes. The mean concentration of the water
quality parameters at each of the sampling point per river illustrates water quality
degradation. The table demonstrates an increasing trend in the major metallic ions, possibly
due to the effect of leaching from rocks or as a result of effluent discharges into the river
courses.
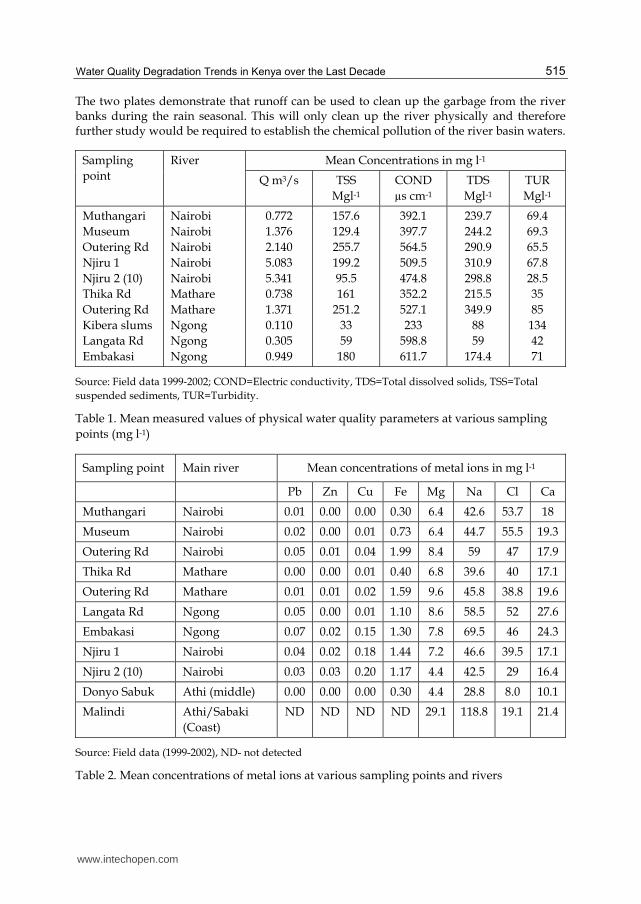
Figure 2 and Table 1 further indicated that increase in river discharge results to decreased
water quality physically. Figure 2 illustrates monthly mean river flows per river sub-basin
which corresponds well with the bi-modal pattern of rainfall in Kenya. The implication of
this is that, storm water can be used to clean up the rivers during the wet seasons (rains),
since water can be easily treated if physically polluted. In addition, effects of storm water
are to reduce the water quality degradation status thus in essence dilute the water
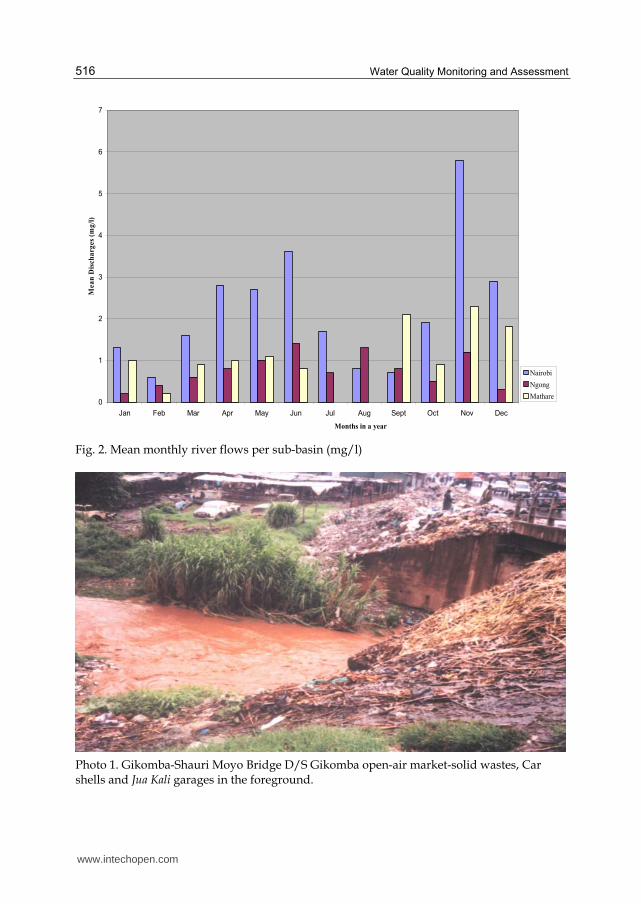
chemically. Plates 1 and 2 demonstrate that water in the Nairobi River can be cleaned
through storm water incidents especially after heavy storms.
www.intechopen.com
Water Quality Degradation Trends in Kenya over the Last Decade
515
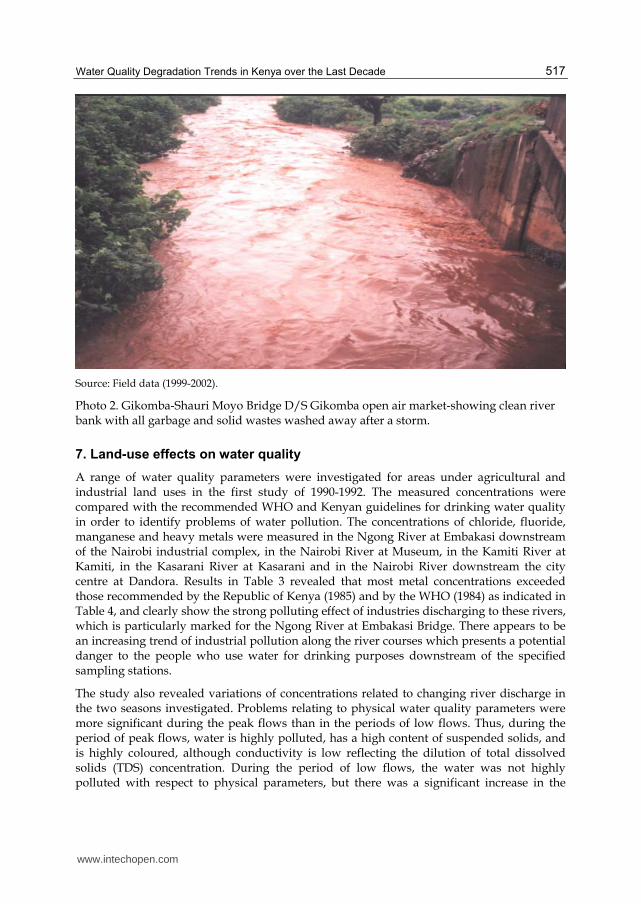
The two plates demonstrate that runoff can be used to clean up the garbage from the river banks during the rain seasonal. This will only clean up the river physically and therefore further study would be required to establish the chemical pollution of the river basin waters.
Sampling
point
River Mean Concentrations in mg l-1
Q m3/s TSS
Mgl-1
COND
µs cm-1
TDS
Mgl-1
TUR
Mgl-1
Muthangari
Museum
Outering Rd
Njiru 1
Njiru 2 (10)
Thika Rd
Outering Rd
Kibera slums
Langata Rd
Embakasi
Nairobi
Nairobi
Nairobi
Nairobi
Nairobi
Mathare
Mathare
Ngong
Ngong
Ngong
0.772
1.376
2.140
5.083
5.341
0.738
1.371
0.110
0.305
0.949
157.6
129.4
255.7
199.2
95.5
161
251.2
33
59
180
392.1
397.7
564.5
509.5
474.8
352.2
527.1
233
598.8
611.7
239.7
244.2
290.9
310.9
298.8
215.5
349.9
88
59
174.4
69.4
69.3
65.5
67.8
28.5
35
85
134
42
71
Source: Field data 1999-2002; COND=Electric conductivity, TDS=Total dissolved solids, TSS=Total
suspended sediments, TUR=Turbidity.
Table 1. Mean measured values of physical water quality parameters at various sampling
points (mg l-1)
Sampling point Main river Mean concentrations of metal ions in mg l-1
Pb Zn Cu Fe Mg Na Cl Ca
Muthangari Nairobi 0.01 0.00 0.00 0.30 6.4 42.6 53.7 18
Museum Nairobi 0.02 0.00 0.01 0.73 6.4 44.7 55.5 19.3
Outering Rd Nairobi 0.05 0.01 0.04 1.99 8.4 59 47 17.9
Thika Rd Mathare 0.00 0.00 0.01 0.40 6.8 39.6 40 17.1
Outering Rd Mathare 0.01 0.01 0.02 1.59 9.6 45.8 38.8 19.6
Langata Rd Ngong 0.05 0.00 0.01 1.10 8.6 58.5 52 27.6
Embakasi Ngong 0.07 0.02 0.15 1.30 7.8 69.5 46 24.3
Njiru 1 Nairobi 0.04 0.02 0.18 1.44 7.2 46.6 39.5 17.1
Njiru 2 (10) Nairobi 0.03 0.03 0.20 1.17 4.4 42.5 29 16.4
Donyo Sabuk Athi (middle) 0.00 0.00 0.00 0.30 4.4 28.8 8.0 10.1
Malindi Athi/Sabaki
(Coast)
ND ND ND ND 29.1 118.8 19.1 21.4
Source: Field data (1999-2002), ND- not detected
Table 2. Mean concentrations of metal ions at various sampling points and rivers
www.intechopen.com
Water Quality Monitoring and Assessment
516
0
1
2
3
4
5
6
7
Jan Feb Mar Apr May Jun Jul Aug Sept Oct Nov Dec
Months in a year
Mea
n D
isch
arg
es
(mg
/l)
Nairobi
Ngong
Mathare
Fig. 2. Mean monthly river flows per sub-basin (mg/l)
Photo 1. Gikomba-Shauri Moyo Bridge D/S Gikomba open-air market-solid wastes, Car shells and Jua Kali garages in the foreground.
www.intechopen.com
Water Quality Degradation Trends in Kenya over the Last Decade
517
Source: Field data (1999-2002).
Photo 2. Gikomba-Shauri Moyo Bridge D/S Gikomba open air market-showing clean river bank with all garbage and solid wastes washed away after a storm.
7. Land-use effects on water quality
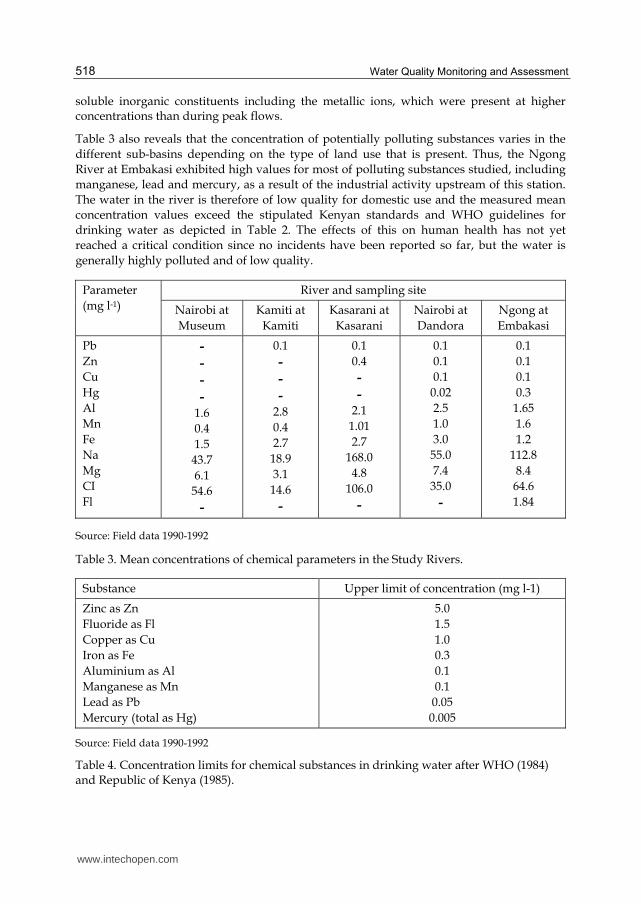
A range of water quality parameters were investigated for areas under agricultural and industrial land uses in the first study of 1990-1992. The measured concentrations were compared with the recommended WHO and Kenyan guidelines for drinking water quality in order to identify problems of water pollution. The concentrations of chloride, fluoride, manganese and heavy metals were measured in the Ngong River at Embakasi downstream of the Nairobi industrial complex, in the Nairobi River at Museum, in the Kamiti River at Kamiti, in the Kasarani River at Kasarani and in the Nairobi River downstream the city centre at Dandora. Results in Table 3 revealed that most metal concentrations exceeded those recommended by the Republic of Kenya (1985) and by the WHO (1984) as indicated in Table 4, and clearly show the strong polluting effect of industries discharging to these rivers, which is particularly marked for the Ngong River at Embakasi Bridge. There appears to be an increasing trend of industrial pollution along the river courses which presents a potential danger to the people who use water for drinking purposes downstream of the specified sampling stations.
The study also revealed variations of concentrations related to changing river discharge in the two seasons investigated. Problems relating to physical water quality parameters were more significant during the peak flows than in the periods of low flows. Thus, during the period of peak flows, water is highly polluted, has a high content of suspended solids, and is highly coloured, although conductivity is low reflecting the dilution of total dissolved solids (TDS) concentration. During the period of low flows, the water was not highly polluted with respect to physical parameters, but there was a significant increase in the
www.intechopen.com
Water Quality Monitoring and Assessment
518
soluble inorganic constituents including the metallic ions, which were present at higher concentrations than during peak flows.
Table 3 also reveals that the concentration of potentially polluting substances varies in the
different sub-basins depending on the type of land use that is present. Thus, the Ngong
River at Embakasi exhibited high values for most of polluting substances studied, including
manganese, lead and mercury, as a result of the industrial activity upstream of this station.
The water in the river is therefore of low quality for domestic use and the measured mean
concentration values exceed the stipulated Kenyan standards and WHO guidelines for
drinking water as depicted in Table 2. The effects of this on human health has not yet
reached a critical condition since no incidents have been reported so far, but the water is
generally highly polluted and of low quality.
Parameter
(mg l-1)
River and sampling site
Nairobi at
Museum
Kamiti at
Kamiti
Kasarani at
Kasarani
Nairobi at
Dandora
Ngong at
Embakasi
Pb
Zn
Cu
Hg
Al
Mn
Fe
Na
Mg
CI
Fl
-
-
-
- 1.6
0.4
1.5
43.7
6.1
54.6
-
0.1
-
-
- 2.8
0.4
2.7
18.9
3.1
14.6
-
0.1
0.4
-
- 2.1
1.01
2.7
168.0
4.8
106.0
-
0.1
0.1
0.1
0.02
2.5
1.0
3.0
55.0
7.4
35.0
-
0.1
0.1
0.1
0.3
1.65
1.6
1.2
112.8
8.4
64.6
1.84
Source: Field data 1990-1992
Table 3. Mean concentrations of chemical parameters in the Study Rivers.
Substance Upper limit of concentration (mg l-1)
Zinc as Zn
Fluoride as Fl
Copper as Cu
Iron as Fe
Aluminium as Al
Manganese as Mn
Lead as Pb
Mercury (total as Hg)
5.0
1.5
1.0
0.3
0.1
0.1
0.05
0.005
Source: Field data 1990-1992
Table 4. Concentration limits for chemical substances in drinking water after WHO (1984) and Republic of Kenya (1985).
www.intechopen.com
Water Quality Degradation Trends in Kenya over the Last Decade
519
The relationship between ionic concentration and discharge varied from one sub basin to
another. The slope of the concentration-flow relationship was steepest for the Ngong
River, followed by the Nairobi River at Dandora, the Kamiti River and the Kasarani River
and the Nairobi River at Museum. The different response of ionic concentrations to
changes in flow reflects the nature and volume of pollutant discharges which affect
different sub-basins.
8. Agricultural pollution and water quality deterioration
By increasing suspended solids, turbidity and colour, nitrates and phosphates from fertilizer
application, and animal wastes, agricultural activity causes deterioration in both the
hygienic and aesthetic aspects of water quality. Health problems rarely result, but
agricultural pollution leads to increased treatment costs and a reduction in the aesthetic
enjoyment of the water resources (Kithiia, 1992).
The application of chemicals through agricultural production in the Nairobi river sub-basins
was the main subject of the study. The substances investigated were pesticides, which are
applied to control crop pests and diseases. Pesticides are considered to be very toxic in
water, even in small concentrations, and they render the water harmful for human
consumption. The pesticides used in the study area include "Dithane M45", "Ambush",
"Malathion", "Ridomil", copper sulphate and DDT, and both soil and water samples were
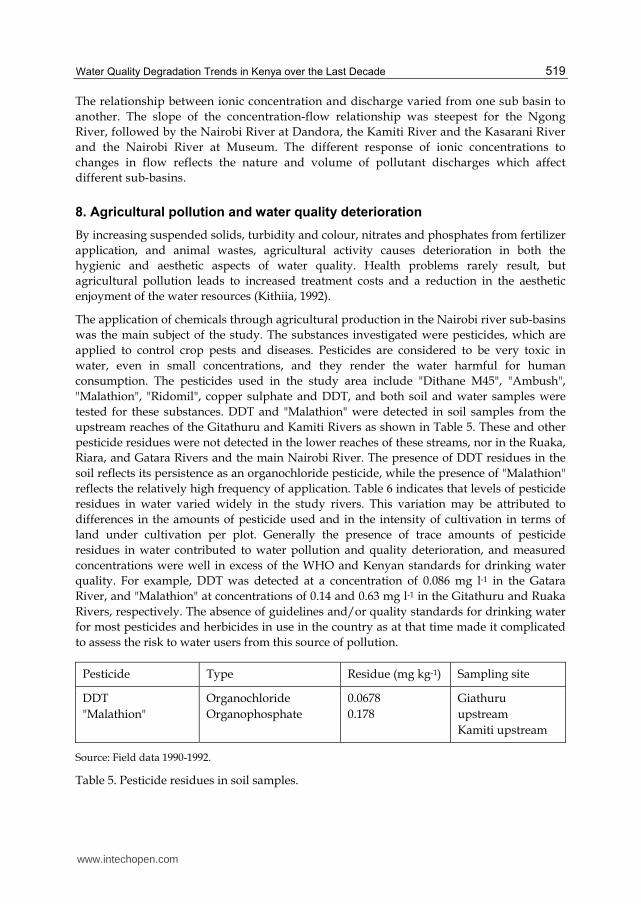
tested for these substances. DDT and "Malathion" were detected in soil samples from the
upstream reaches of the Gitathuru and Kamiti Rivers as shown in Table 5. These and other
pesticide residues were not detected in the lower reaches of these streams, nor in the Ruaka,
Riara, and Gatara Rivers and the main Nairobi River. The presence of DDT residues in the
soil reflects its persistence as an organochloride pesticide, while the presence of "Malathion"
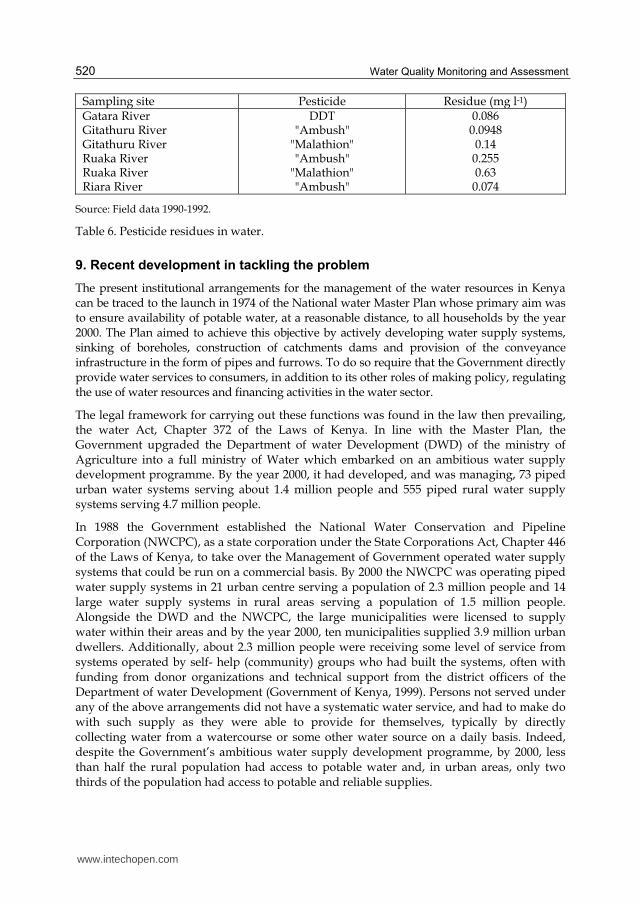
reflects the relatively high frequency of application. Table 6 indicates that levels of pesticide
residues in water varied widely in the study rivers. This variation may be attributed to
differences in the amounts of pesticide used and in the intensity of cultivation in terms of
land under cultivation per plot. Generally the presence of trace amounts of pesticide
residues in water contributed to water pollution and quality deterioration, and measured
concentrations were well in excess of the WHO and Kenyan standards for drinking water
quality. For example, DDT was detected at a concentration of 0.086 mg l-1 in the Gatara
River, and "Malathion" at concentrations of 0.14 and 0.63 mg l-1 in the Gitathuru and Ruaka
Rivers, respectively. The absence of guidelines and/or quality standards for drinking water
for most pesticides and herbicides in use in the country as at that time made it complicated
to assess the risk to water users from this source of pollution.
Pesticide Type Residue (mg kg-1) Sampling site
DDT
"Malathion"
Organochloride
Organophosphate
0.0678
0.178
Giathuru
upstream
Kamiti upstream
Source: Field data 1990-1992.
Table 5. Pesticide residues in soil samples.
www.intechopen.com
Water Quality Monitoring and Assessment
520
Sampling site Pesticide Residue (mg l-1) Gatara River Gitathuru River Gitathuru River Ruaka River Ruaka River Riara River
DDT"Ambush"
"Malathion" "Ambush"
"Malathion" "Ambush"
0.086 0.0948 0.14
0.255 0.63
0.074
Source: Field data 1990-1992.
Table 6. Pesticide residues in water.
9. Recent development in tackling the problem
The present institutional arrangements for the management of the water resources in Kenya can be traced to the launch in 1974 of the National water Master Plan whose primary aim was to ensure availability of potable water, at a reasonable distance, to all households by the year 2000. The Plan aimed to achieve this objective by actively developing water supply systems, sinking of boreholes, construction of catchments dams and provision of the conveyance infrastructure in the form of pipes and furrows. To do so require that the Government directly provide water services to consumers, in addition to its other roles of making policy, regulating the use of water resources and financing activities in the water sector.
The legal framework for carrying out these functions was found in the law then prevailing, the water Act, Chapter 372 of the Laws of Kenya. In line with the Master Plan, the Government upgraded the Department of water Development (DWD) of the ministry of Agriculture into a full ministry of Water which embarked on an ambitious water supply development programme. By the year 2000, it had developed, and was managing, 73 piped urban water systems serving about 1.4 million people and 555 piped rural water supply systems serving 4.7 million people.
In 1988 the Government established the National Water Conservation and Pipeline Corporation (NWCPC), as a state corporation under the State Corporations Act, Chapter 446 of the Laws of Kenya, to take over the Management of Government operated water supply systems that could be run on a commercial basis. By 2000 the NWCPC was operating piped water supply systems in 21 urban centre serving a population of 2.3 million people and 14 large water supply systems in rural areas serving a population of 1.5 million people. Alongside the DWD and the NWCPC, the large municipalities were licensed to supply water within their areas and by the year 2000, ten municipalities supplied 3.9 million urban dwellers. Additionally, about 2.3 million people were receiving some level of service from systems operated by self- help (community) groups who had built the systems, often with funding from donor organizations and technical support from the district officers of the Department of water Development (Government of Kenya, 1999). Persons not served under any of the above arrangements did not have a systematic water service, and had to make do with such supply as they were able to provide for themselves, typically by directly collecting water from a watercourse or some other water source on a daily basis. Indeed, despite the Government’s ambitious water supply development programme, by 2000, less than half the rural population had access to potable water and, in urban areas, only two thirds of the population had access to potable and reliable supplies.
www.intechopen.com
Water Quality Degradation Trends in Kenya over the Last Decade
521
In the 1980s the Government begun experiencing budgetary constraints and it became clear that, on its own, it could not deliver water to all Kenyans by the year 2000. Attention therefore turned to finding ways of involving others in the provision of water services in place of the Government, a process that came to be known popularly as “handing over.” There was general agreement over the need to hand over Government water supply systems but much less agreement over what it meant for the Government to hand over public water supply systems to others. In 1997 the Government published manual giving guidelines on handing over of rural water supply systems to communities (Ministry of Land Reclamation, Regional and Water Development, 1997). The Manual indicated that “… at the moment the ministry is only transferring the management of the water supply schemes. The communities will act as custodians of the water supply schemes, including the assets, when they take over the responsibility for operating and maintaining them.” But, the goal of community management should be ownership of the water supplies, including the associated assets. The Manual stated the criteria for handing over to be the capacity of the community to take over; ability to pay; capacity to operate and maintain the system; involvement of women in management and ability and willingness to form a community based group with legal status. By 2002 ten schemes serving about 85, 000 people had been handed over under these guidelines, focusing on management and revenue collection, not full asset transfer.
Building on this experience, the Government developed a full-fledged policy, the National Water Policy in 1999. It has tackled issues pertaining to water resources management, water and sewerage development, institutional framework and financing of the sector. In each case an attempt has been made to discuss the problems associated with each area and suggest the appropriate strategies and the desired policies that the government will put in place to resolve those problems. The Policy stated that the Government’s role would be redefined away from direct service provision to regulatory functions: service provision would be left to municipalities, the private sector and communities.
The Policy also stated that the Water Act, Chapter 372 would be reviewed and updated, attention being paid to the transfer of water facilities. Regulations would be introduced to give other institutions the legal mandate to provide water services and to provide mechanisms for regulation. The Policy justified handing over, arguing that ownership of water facility encourages proper operation and maintenance: facilities should therefore be handed over to those responsible for their operation and maintenance. The Policy stated that the Government would hand over urban water systems to autonomous departments within local authorities and rural water supplies to communities. While developing the National Water Policy, the Government also established a National Task Force to review the Water Act, Chapter 372 and draft a Bill to replace the Water Act. The Water Bill 2002 was published on 15th March 2002 and passed by Parliament on 18th July 2002. It was gazetted in October 2002 as the Water Act, 2002 and went into effect in 2003 when effective implementation of its provisions commenced. The New Water Act Building on this initiative, the current government set out on an agenda of reform with water resources development and management as one of its priorities. In his opening address to parliament, President Mwai Kibaki stated that his Government, “ is committed to ensuring that Kenyans have access to clean water.” In this context, the Minister for Water Affairs established the new 2002 Water Act, intended to tackle the worsening water services experienced over the earlier decade. This step has given poverty reduction in Kenya a new possibility.
www.intechopen.com
Water Quality Monitoring and Assessment
522
This Water Act established an autonomous Water Resources Management Authority,
destined to manage and protect Kenya’s resources. It also shaped an institutional
framework that gave responsibility for providing decentralized services to seven regional
Water Services Boards (WSB). These Boards manage water services assets and ensure that
they remain in the public realm. An essential aspect of the reform outlined in the Water Act
is the separation of water and sanitation from the management of resources. Overall
supervision of water services will consequently be carried out by the Water Services
Regulatory Board (WSRB), an organ in charge of regulating the services supplied by the
regional Boards and their providers. From mid-2005, the responsibility for water services
provision – originally falling under the Ministry of Water and Irrigation was put entirely to
the WSRB. Simultaneously, representatives for the new Area Catchments Advisory
Committees are being selected and the Water Users Associations are being encouraged to
define their new roles. These efforts were meant to encourage proper use and management
of the water resources in the country as well as try to minimize pollution of the meager
resources by creating sanitation infrastructure in many of the urban and rural areas.
10. State of water environment: Water pollution in Kenya
Water resources in Kenya are increasingly becoming polluted from both point and non-
point sources due to agriculture, urbanization, and industry which contribute to organic,
inorganic and aesthetic pollution of water. Ground-water is threatened by intrusion of saline
water in the coastal region, leachates from solid waste dumps, and infiltration of fertilizer
and pesticide residues. The five principal sources of water pollution in Kenya include,
among others, the categories listed below, (JICA/GOK, 1992).
a. Agricultural activities which produce sediments and agro-chemical residues (biocides
and fertilizers).
b. Industrial processing of agricultural and forestry products which produce liquid
effluents, gaseous emissions and solid wastes.
c. Industrial manufacturing - heavy metals, acids, dyes, oils.
d. Domestic/municipal effluents - sewage and garbage.
e. Sedimentation - soil erosion; and mining which produces tailings and effluents.
Municipalities and industries constitute the largest source of waste water discharges;
however, industries discharge an enormous variety of wastes some of which are toxic to
human beings and the general environment. Examples of such industrial wastes, which are a
critical environmental issue in Kenya, include effluents, sludge and solid waste from sugar,
coffee pulping and textile factories, leather tanneries, paper-mills and slaughter- houses.
All these wastes impact on water quality and are manifested through:
i. Deterioration of the quality of the aquatic environment, namely, deoxygenation, eutrophication, siltation, habitat modification and toxicity, among others;
ii. Environmental health effects with the occurrence of water-borne diseases, for example, typhoid and cholera, and chemical poisoning in humans and animals;
iii. aesthetic effects leading to loss of scenic beauty with water becoming unsuitable for recreation;
iv. high cost of water supply as polluted water is expensive to treat; and,
www.intechopen.com
Water Quality Degradation Trends in Kenya over the Last Decade
523
v. Water rights conflicts due to shortage of water of suitable quality for domestic, industrial and irrigation purposes. In order to protect Kenya's water resources from further degradation, water pollution or effluent discharge standards are necessary.
11. Water pollution control guidelines/standards setting
• In practice, standards can be set from either first principles or based on existing guidelines; international or national. For first principles, classification, and prioritization of pollutants is necessary. Pollutant exposure processes and their ecological effects should be determined. Predicted environmental concentrations (PEC) and predicted no effect concentration (PNEC) for the aquatic environment should be derived. Usually, actual analytical data (baseline data) relevant to the locality or country situation are preferred.
• Standards can also be based on existing guidelines such as those of the International Standards Organization (ISO) or other similar country standards. Baseline data collection is then undertaken to improve or adapt the initial standards to own country situation. Thus, baseline data is important for the setting of standards for water pollution as well as:(a) forming a basis for zoning; where general or special standards should apply; (b) assessing the assimilative capacity of various streams; (c) identifying the water courses which require stringent or less stringent application of standards; and, (d) formulating rehabilitation and/or conservation measures.
12. Water pollution effects
Waterborne diseases caused by polluted drinking water may include:
• Typhoid • Amoebiasis • Giardiasis • Ascariasis • Hookworm
Waterborne diseases caused by polluted beach water may include:
• Rashes, ear ache, pink eye • Respiratory infections • Hepatitis, encephalitis, gastroenteritis, diarrhoea, vomiting, and stomach aches
Conditions related to water polluted by chemicals (such as pesticides, hydrocarbons, persistent organic pollutants, heavy metals etc) may include but not exclusive of the following:
• Cancer, incl. prostate cancer and non-Hodgkin’s lymphoma • Hormonal problems that can disrupt reproductive and developmental processes • Damage to the nervous system • Liver and kidney damage • Damage to the DNA • Exposure to mercury (heavy metal) may further result :
• In the womb: may cause neurological problems including slower reflexes, learning deficits, delayed or incomplete mental development, autism and brain damage.
• In adults: Parkinson’s disease, multiple sclerosis, Alzheimer’s disease, heart disease, and even death.
www.intechopen.com
Water Quality Monitoring and Assessment
524
Other notes:
• Water pollution may also result from interactions between water and contaminated soil, as well as from deposition of air contaminants (such as acid rain).
• Damage to people may be caused by fish foods coming from polluted water (a well known example is high mercury levels in fish).
• Damage to people may be caused by vegetable crops grown / washed with polluted water (author’s own conclusion).
13. Water quality control strategies
Sources of the various pollutants should be identified and mechanisms put in place especially proper land management practices which minimize surface runoff and maximize ground infiltration of surface runoff. An integrated approach to the management of water resources should be adopted to encompass soil conservation and management, forest conservation and re-afforestation, protection of water catchment areas as well as river courses and prohibiting dumping of wastes into river courses and banks. This also should create buffer zones along the river systems to allow for the growth of riverine vegetation (macrophytes) which can take up some of the water pollutants and hence reduce water quality degradation and restore the quality of water. In the slum areas with inadequate drainage and sewerage systems, well constructed pit latrines should be provided far away from river banks, in addition to a better drainage system. Good housing structures with toilets will also reduce direct discharge of raw human wastes into the rivers flowing through these slum areas and to any other water courses in the country.
There are indications that, land use changes and activities have profound effects on water quality. There is therefore, need to review the existing land use policy in the country to guard against encroachment of land use activities into watershed areas. This will encourage land management control and conservation measures as well as riparian use of water resources in the headwater and downstream areas. Use of modern techniques and strategies (Best Management Practices-BMP) to control water quality degradation and maintain the quality of water need be emphasized. These should include Integrated Water Resources Management (IWRM) with emphasis on community participation and policy formulation.
There is also need for public awareness regarding the pollution problem and the consequences arising thereof in the rivers and basins facing water quality degradation. In overall, a sound integrated Environmental Education (EE) programme need be adopted with emphasis on communities’ participation and use of green environmental policy.
Research findings and conclusions
• Water quality deterioration within the study area sub-streams was found to vary with increasing stream discharge. Thus, the study revealed that stream discharge and concentration of water pollutants exhibited a discordant relationship. This was found to be true in all the streams investigated.
• Storm water run-off was found useful in cleaning up the river systems by washing away the solid wastes, diluting the chemical industrial effluents and waste water from residential areas and burst sewers. In addition, the water was found to be physically polluted and therefore easily treatable using conventional methods of treating water such as filtration and sedimentation processes.
www.intechopen.com
Water Quality Degradation Trends in Kenya over the Last Decade
525
• Specific plant species were found to take up some of the heavy metals from the water resources and hence contributing to cleaning up the water resources within the basin.
14. Recommendations
• There is need for public awareness regarding the pollution problems and the consequences arising thereof in the rivers and basins investigated. In over all there is need for an integrated Environmental Education (EE) programme within the basins. The programme should focus on the need for people living within the city of Nairobi and its environs to appreciate a cleaner environment. It should try to encourage people to properly manage their domestic raw wastes and avoid dumping these into the rivers. Domestic wastes separation and sorting out would a better option. People should be encouraged to treat the Nairobi River as their friend and therefore protect its water quality for the present and future generations and to enjoy its aesthetic values.
• Integrated water resources management (IWRM) approach would be very integral in addressing the problem of water quality degradation within the city and the country in general. The approach need to involve all Government Ministries, water resources stakeholders and the participation of the people (community) in understanding the implication of declining water quality status and the need to guard against polluting the resources. This will ensure continued safe supply of clean and potable water resources to the people and minimize disease outbreaks.
15. Acknowledgement
The researcher wishes to thank the University of Nairobi who funded the first phase of this project and DAAD (the German Academic Exchange service) for providing substantial funding for research and completion of the project.
16. References
APHA (1995) Standard methods for the examination of water and wastewater-18th Edition. A. Greenber, L.S. Clescer, A.D. Eaton (Ed). American Public Health Association, American Water Works Association, Water Environment, New York.
APHA (2001) American Public Health Association, American Water Works Association, and Water Environment Federation, Standard Methods for Examination of Water and Wastewater, 20th Ed., American Public Health Association, New York, NY.
Dunne, T (1978) Sediment yield of Kenya Rivers. Report to the Ministry of Water Development, Nairobi, Kenya.
Dunne, T. and Leopold, L.B. (1978) Water in Environmental Planning; W.H. Freeman Company. Pp 255-San Francisco.
GOK; Kenya, Republic of, (1985) Kenya Standards for drinking water quality. Kenya Bureau of Standards (KBS), Standards No. KS 05-459.
GOK; Kenya, Republic of, (1986) Sessional Paper No. 1 of 1986 on Economic Management for Renewed Growth, Nairobi, Kenya; p 5.
GOK; Kenya, Republic of, (2003) State of the Environment Report 2003, Kenya; National Environment Management Authority (Nema), 2004.
MOWD (1976a) The Water Chemistry of the Nyando river 1974-1975. Technical report 1; Ministry of Water Development, Kenya.
www.intechopen.com
Water Quality Monitoring and Assessment
526
MOWD (1976b) The Chemistry of the upper-Athi river 1975. Technical report 2; Ministry of Water Development, Kenya.
MOWD (MLRRWD) (1997) The Athi River Basin Integrated water resources management programme: Phase 1, Management of aquifers underlying the greater Nairobi area and monitoring of industrial pollution problems in the upper-Athi river basin, Draft final report.
http://www.upiu.com/environment/2009/03/26. The untold story of the Nairobi River/ Upiu-5861238090615.
JICA/GOK, Kenya, Republic of, (1992) The National Water Master Plan. Final report., Ministry of Water Development, Kenya.
Jordaan, J., E.J. Plate, E. Prins and J. Veltrop (1993) Water in our common future; IHP Committee on water research (COWAR); A research agenda for sustainable development of water resources, Paris, 1993. UNESCO.
Kithiia, S.M. (1992) Effects of Industries and Other land-use systems on the water quality within the Nairobi river sub-catchments, Kenya. unpublished M.Sc. Thesis University of Nairobi.
Kithiia, S.M. (1997) Land use changes and their effects on sediment transport and soil erosion within the Athi river drainage basin, Kenya. In: Human Impact on Erosion and Sedimentation (proceedings of Rabat Symposium S6, April 1997). IAHS Publ. No. 245, 1997. 145-150.
Kithiia, S.M., and S.O. Ongwenyi (1997) Some problems of Water Quality degradation in the Nairobi River sub-basins in Kenya. In: Freshwater Contamination (proceedings of Rabat Symposium S4, April 1997). IAHS Publ. No. 243, 1997.
Kithiia, S.M. (2006) Effects of land-use types on the Hydrology and water quality of the upper-Athi River Basin, Kenya, unpublished PhD. Thesis materials, University of Nairobi.
Kithiia, S. M. and F.M. Mutua (2006b) Impacts of land use changes on sediment yields and water quality within the Nairobi River sub-basin, Kenya. In: Sediment dynamics and the Hydromorphology of Fluvial systems. (Ed. by J. Rowan, R. W. Duck & A. Werrity) (Proceedings of a symposium held in Dundee, UK, July 2006), IAHS Publ. 306. IAHS Press, Wallingford, UK, 582-588.
Kithiia,S.M and G.O. Khroda (2011) Sediments yields and Transport within the Nairobi River basins, Kenya: In River, Coastal and Estuarine Morphodynamics: RCEM2011 © 2011 Tsinghua University Press, Beijing.
Mavuti, K.M (2003) Nairobi River Basin Project-Phase II, Pollution Assessment and Monitoring Sub-component, UNEP/UON (2003), Final Report, Nairobi, Kenya.
Mingjun, J (2010) Comprensive Introduction on Eco-safety. The Chinese Overseas Publishing House. Beijing.
Nairobi River Clean up Organization (1992) Nairobi River (unpublished materials). Njuguna, G.S. (1978) A study of the effects of pollution on tropical river in Kenya
(unpublished M.Sc. Thesis) University of Nairobi. Okoth, P.E. and P. Otieno (eds) (2000) Technical report of the Nairobi River basin project-
Africa Water Network, UNEP. Ongwenyi, G.S. (1979) Water Resources and the Environment in Kenya: Seminar of
Environment Engineering, University of Nairobi. WHO (World Health Organization) (1993) Guidelines for drinking water quality; Vol. 1.
Recommendations (2nd Ed.), WHO, Geneva. WHO (World Health Organization) (1995) Guidelines for drinking water quality; Vol. 1.
Recommendations, WHO, Geneva.
www.intechopen.com
Water Quality Monitoring and AssessmentEdited by Dr. Voudouris
ISBN 978-953-51-0486-5Hard cover, 602 pagesPublisher InTechPublished online 05, April, 2012Published in print edition April, 2012
InTech EuropeUniversity Campus STeP Ri Slavka Krautzeka 83/A 51000 Rijeka, Croatia Phone: +385 (51) 770 447 Fax: +385 (51) 686 166www.intechopen.com
InTech ChinaUnit 405, Office Block, Hotel Equatorial Shanghai No.65, Yan An Road (West), Shanghai, 200040, China
Phone: +86-21-62489820 Fax: +86-21-62489821
The book attempts to covers the main fields of water quality issues presenting case studies in variouscountries concerning the physicochemical characteristics of surface and groundwaters and possible pollutionsources as well as methods and tools for the evaluation of water quality status. This book is divided into twosections: Statistical Analysis of Water Quality Data;Water Quality Monitoring Studies.
How to referenceIn order to correctly reference this scholarly work, feel free to copy and paste the following:
Shadrack Mulei Kithiia (2012). Water Quality Degradation Trends in Kenya over the Last Decade, WaterQuality Monitoring and Assessment, Dr. Voudouris (Ed.), ISBN: 978-953-51-0486-5, InTech, Available from:http://www.intechopen.com/books/water-quality-monitoring-and-assessment/water-quality-degradation-trends-in-kenya-over-the-last-decade

© 2012 The Author(s). Licensee IntechOpen. This is an open access articledistributed under the terms of the Creative Commons Attribution 3.0License, which permits unrestricted use, distribution, and reproduction inany medium, provided the original work is properly cited.