water quality trends for minnesota rivers and streams at milestone
TRANSCRIPT

June 2014
Water Quality Trends for Minnesota Rivers and Streams at Milestone Sites
Five of seven pollutants better, two getting worse

Minnesota Pollution Control Agency 520 Lafayette Road North | Saint Paul, MN 55155-4194 | www.pca.state.mn.us | 651-296-6300
Toll free 800-657-3864 | TTY 651-282-5332
This report is available in alternative formats upon request, and online at www.pca.state.mn.us .
Document number: wq-s1-71
Author David Christopherson
The MPCA is reducing printing and mailing costs by using the Internet to distribute reports and information to wider audience. Visit our website for more information.
MPCA reports are printed on 100% post-consumer recycled content paper manufactured without chlorine or chlorine derivatives.

Summary Long-term trend analysis of seven different water pollutants measured at 80 locations across Minnesota for more than 30 years shows consistent reductions in five pollutants, but consistent increases in two pollutants. Concentrations of total suspended solids, phosphorus, ammonia, biochemical oxygen demand, and bacteria have significantly decreased, but nitrate and chloride concentrations have risen, according to data from the Minnesota Pollution Control Agency’s (MPCA) “Milestone” monitoring network. Recent, shorter-term trends are consistent with this pattern, but are less pronounced. Pollutant concentrations show distinct regional differences, with a general pattern across the state of lower levels in the northeast to higher levels in the southwest.
These trends reflect both the successes of cleaning up municipal and industrial pollutant discharges during this period, and the continuing challenge of controlling the more diffuse “nonpoint” polluted runoff sources and the impacts of increased water volumes from artificial drainage practices.
Minnesota Milestone Monitoring Program The Minnesota Milestone sites are a collection of 80 monitoring locations at rivers and streams across the state with good, long-term water quality data. The period of record is generally more than 30 years, through 2010, with monitoring at some sites going back to the 1950s. While the Milestone sites are not necessarily representative of Minnesota’s rivers and streams as a whole, they do provide a valuable and wide-spread historical record for many of the state’s waters.
Monitoring was done by MPCA staff for a standard set of key pollutants on a regular basis, usually monthly for 9 to 10 months of the year. Generally, sites were sampled each year through the mid-1990s, at which time the sampling frequency was reduced to two out of every five years on a rotating basis. In some cases and when appropriate for this report, data from the Milestone sites has been supplemented with data collected at the sites through other monitoring efforts. All water quality data is stored in the Environmental Quality Information System (EQuIS).
In 2010 the Minnesota Milestone program was superseded by the Minnesota Watershed Pollutant Load Monitoring Network, which will be used to evaluate water quality trends in the future. This new network has more than twice as many monitoring sites, much more frequent monitoring, and includes streamflow to document not only the concentration of pollutants, but also pollutant loads, flow-weighted mean pollutant concentrations, and watershed pollutant yields.
Analysis methods The analysis in this report was performed using the Seasonal Kendall Test for Trends. The Seasonal Kendall is a nonparametric test that has the advantages of being robust to outliers, missing values, and values less than detection limits, can account for seasonal differences, and is now commonly used to analyze water quality trends. The trends shown are monotonic in nature, meaning that they are one-way trends over the relevant period. As such, they may not reflect shorter-term trends within the period. For example, early decreases in pollutant levels, followed by maintenance of those levels, will be listed as a “decreasing trend.” Likewise, increasing levels of pollutants followed by decreasing levels of pollutants may be listed as "no trend." Because flow information is not available for many of the sites, flow adjustment for the trends is not part of the analysis.
It should be noted that the period of record shown for each monitoring site does not necessarily indicate regular, continuous monitoring for all the listed pollutants over all years. In some cases, monitoring for certain of the pollutants may have begun some time subsequent to the initial date; the
1

initial 10-year period for which median pollutant concentrations are shown can thus vary from pollutant to pollutant. In addition, the analytical detection limit for ammonia was lowered considerably in the 1970s, and the trend analysis for that pollutant generally begins at that time.
Likewise, there are sometimes significant gaps in the data when monitoring for some or all of the pollutants was interrupted for a time. Such gaps can occasionally result in under- or over-estimates regarding annual and overall changes; the latter is particularly true for chloride, which had relatively little monitoring for a number of years. In such cases, looking at the median concentrations for the beginning and ending 10-year periods can help to give a better picture of actual conditions.
Trends shown are statistically significant at the 90% confidence level. Percentage changes are statistical estimates based on the available data, and actual changes could of course be higher or lower. A designation of "no trend" means that a statistically significant trend has not been found; this may be because there is not enough data or there is too much natural variability in the data to discern the actual trend.
The annual and overall changes in pollutant concentrations and the median concentrations are estimates from the available data, and are subject to the various limitations of that data. In particular, the results for individual sites can be affected by such things as the precise timing of the monitoring, gaps in the data, small data sets, and the large amount of natural variability inherent in water quality monitoring.
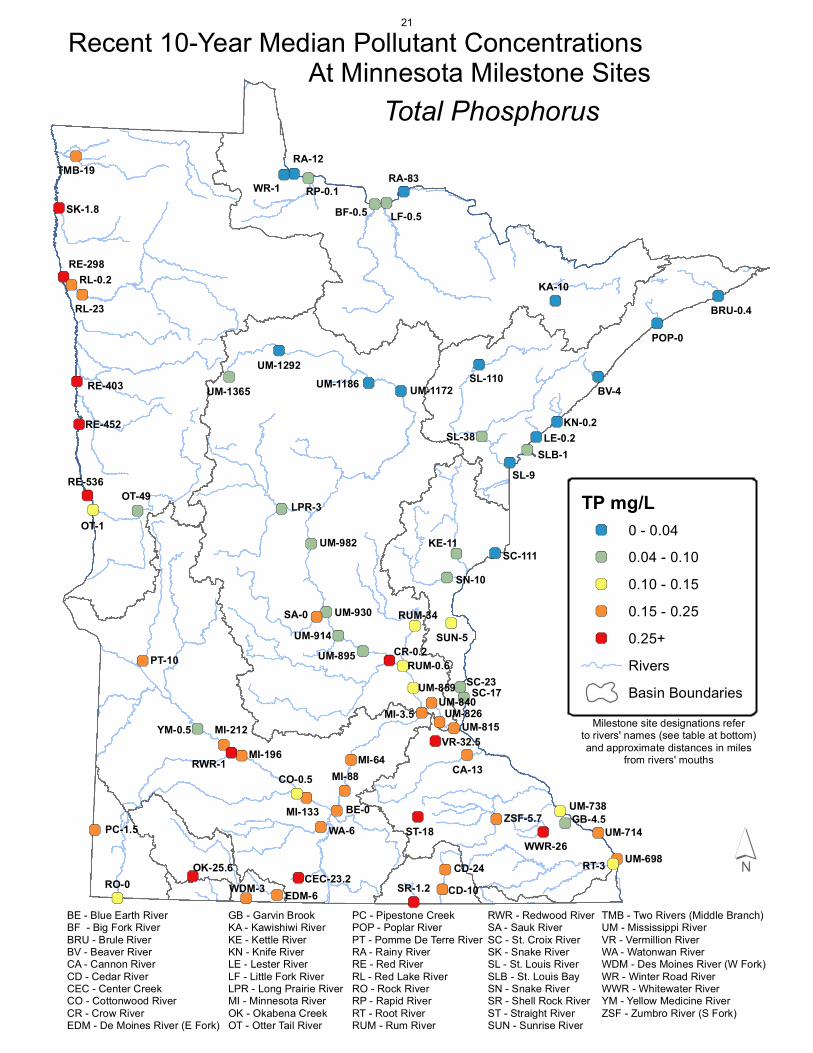
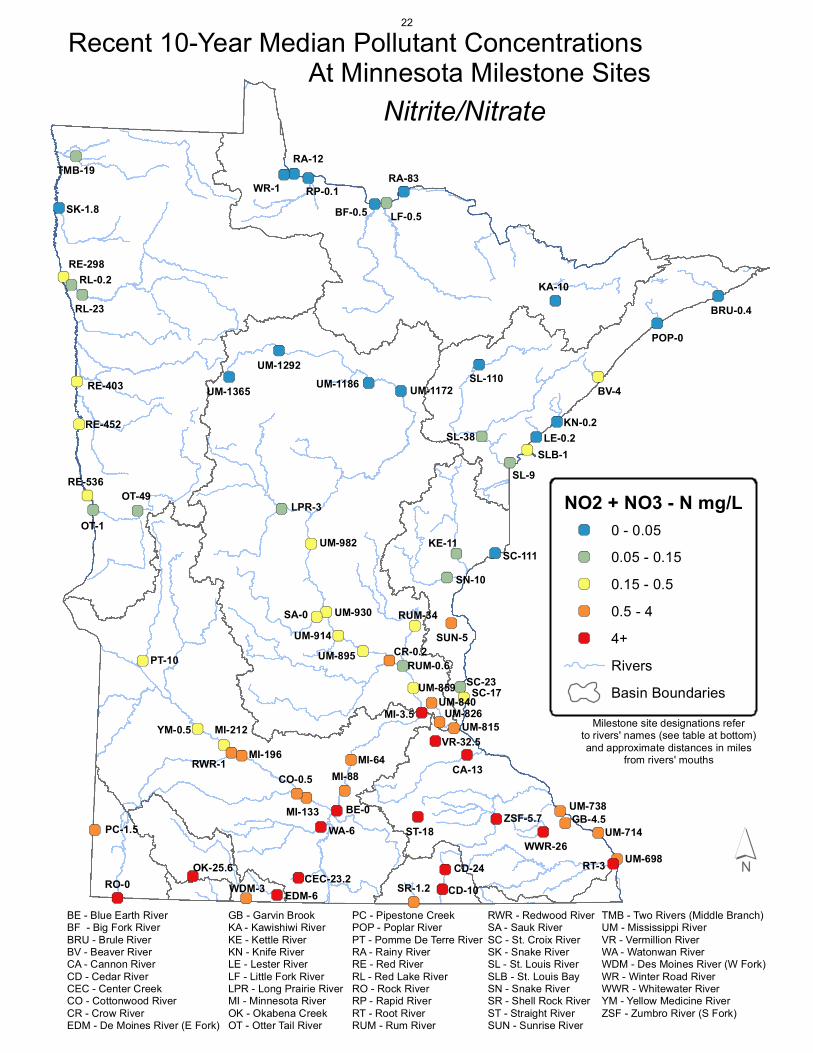
The pollutant concentrations shown in the table and maps are median summer (June-August) values, except for chlorides, which are median year-round values. All concentrations are in mg/L (parts per million). No map has been created for recent 10-year median ammonia concentrations because levels at the vast majority of Milestone sites are now below laboratory detection limits.
Results Improvements: The Minnesota Milestone sites, as a whole, show significant reductions over the period of record across the state for total suspended solids, phosphorus, ammonia, and biochemical oxygen demand. For all four of these parameters, the trends that are discernible are almost entirely in a positive environmental direction. In addition, it should be noted that bacterial pollution in Minnesota streams has also decreased significantly over the Milestone monitoring period. While the change in monitoring parameter in the early 2000s from fecal coliform bacteria to E. coli (the latter is considered to be a better indicator of pathogens which can affect human health) has precluded an accurate updating of the earlier trends work, the vast majority (82%) of Milestone sites showed decreasing pollutant trends for bacteria through the year 2000, and the continued monitoring for E. coli gives no indication of any reversal in this trend.
Increasing Problems: For nitrate and chloride, the picture is much different, with Milestone sites largely showing trends in the opposite direction, with increasing pollutant levels, or no trends.
The results of this study, while not identical because of differences in both the data and the statistical methods used, are consistent with those of other studies of trends in Minnesota rivers and streams.
The positive, decreasing pollutant trends for total suspended solids, phosphorus, ammonia, biochemical oxygen demand, and bacteria reflect the considerable progress made during the overall Milestone period in controlling municipal and industrial point sources of pollution. The negative, increasing pollutant trends for nitrate and chloride, on the other hand, likely reflect continuing, and in some ways more difficult, nonpoint source problems such as agricultural practices (nitrogen) and road salt application (chloride).
2
Concern regarding nitrogen in Minnesota’s waters has grown in recent decades, with the discovery that some streams now exceed the state’s human-health drinking water standard, with increasing studies showing the toxic effects of nitrate on aquatic life, and with the fact that nitrogen in the Mississippi River – originating in part from Minnesota – plays the major role in causing a large oxygen-depleted “dead zone” in the Gulf of Mexico. In response, the MPCA is developing aquatic-life-toxicity water quality standards for nitrogen and is likewise developing a state-level Nutrient Reduction Strategy which will identify how further progress can be made to reduce nitrogen (and phosphorus) in our waters.
Concern regarding chloride in Minnesota’s waters is somewhat newer. An examination of Milestone trends in 2000 did not look at chloride because of a lack of sufficient data. Increased monitoring since that time, however, has shown significant, largely statewide increases in chloride concentrations over the years of the Milestone program. Monitoring for chloride has subsequently been increased in other waters, especially in the Twin Cities metro area. The MPCA has listed a number of waters as impaired by the pollutant and is working with local governments and others to reduce the amount of chloride that enters our waters from the various sources, especially the application of road-deicing salts.
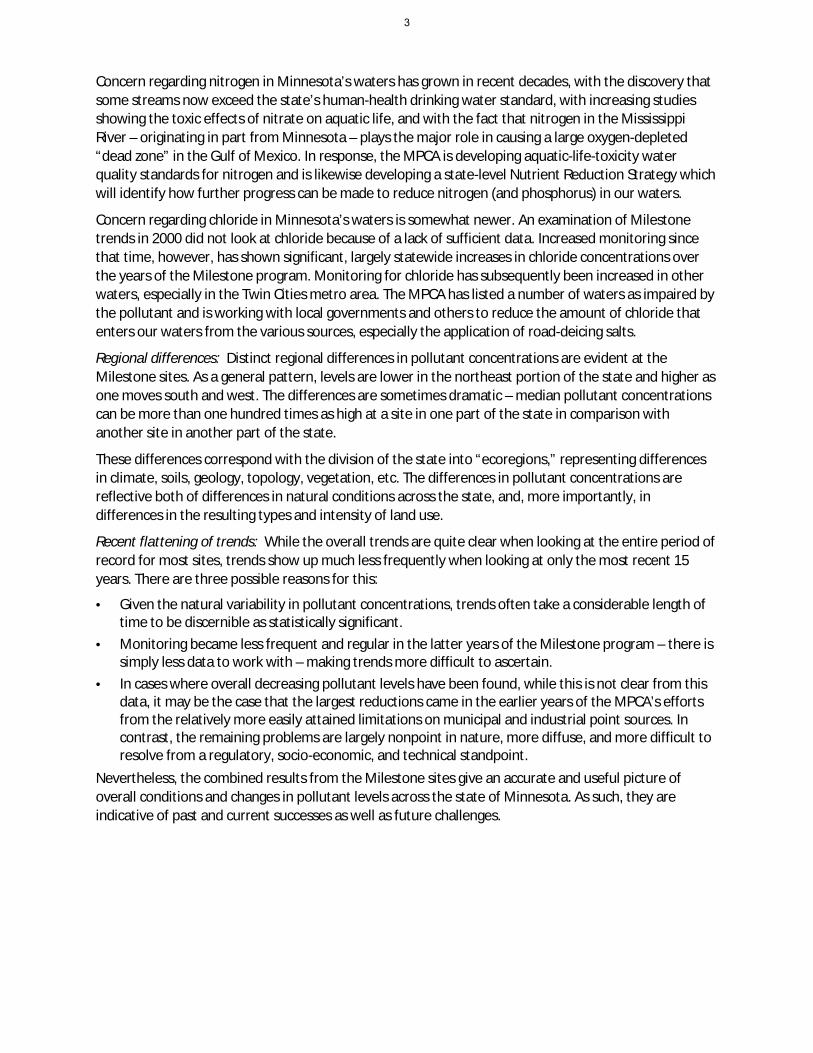
Regional differences: Distinct regional differences in pollutant concentrations are evident at the Milestone sites. As a general pattern, levels are lower in the northeast portion of the state and higher as one moves south and west. The differences are sometimes dramatic – median pollutant concentrations can be more than one hundred times as high at a site in one part of the state in comparison with another site in another part of the state.
These differences correspond with the division of the state into “ecoregions,” representing differences in climate, soils, geology, topology, vegetation, etc. The differences in pollutant concentrations are reflective both of differences in natural conditions across the state, and, more importantly, in differences in the resulting types and intensity of land use.
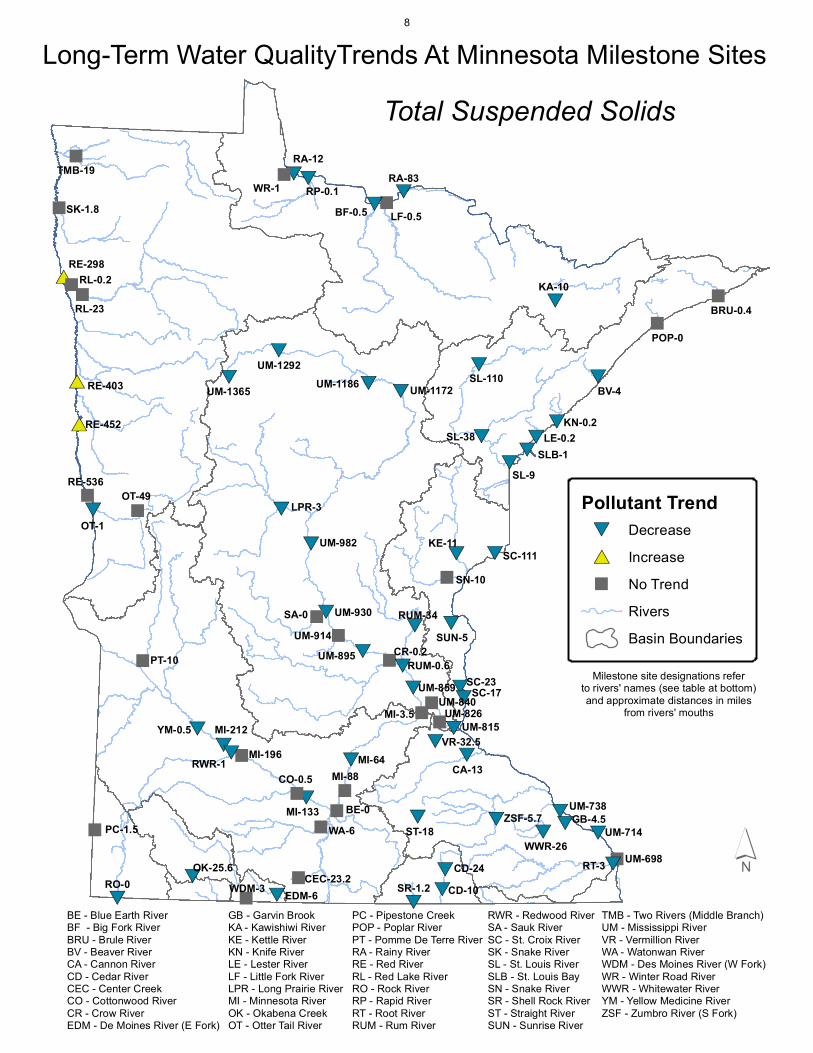
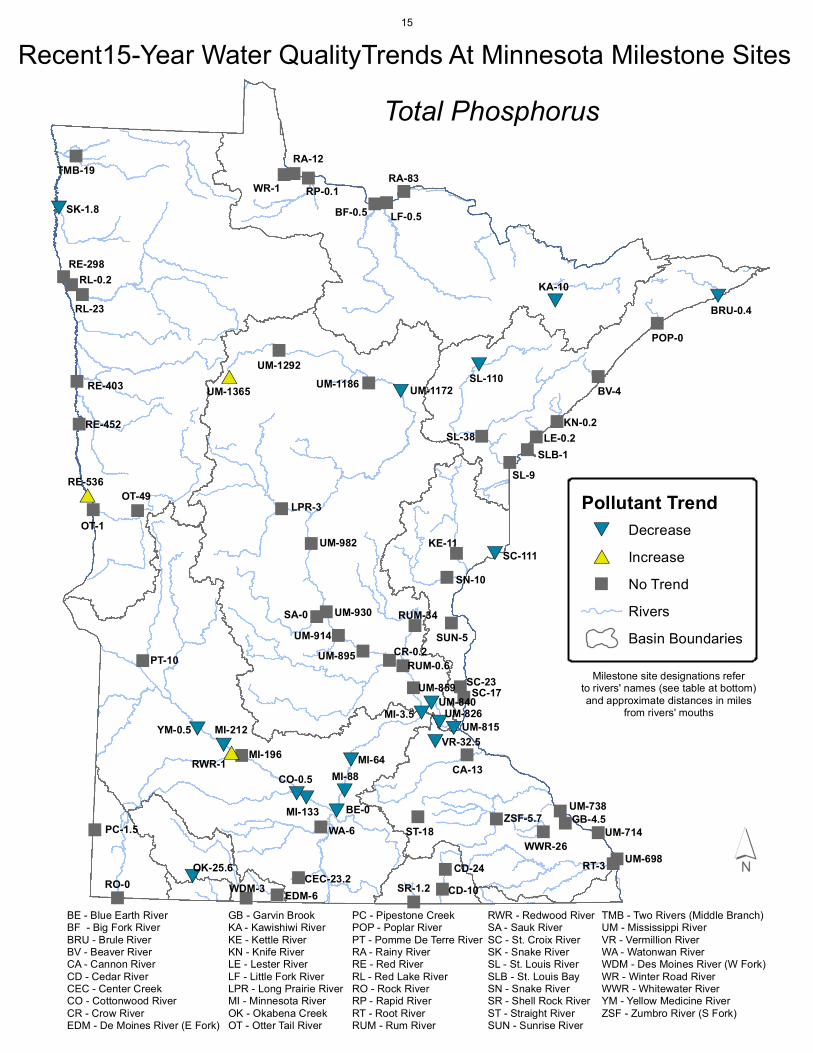
Recent flattening of trends: While the overall trends are quite clear when looking at the entire period of record for most sites, trends show up much less frequently when looking at only the most recent 15 years. There are three possible reasons for this:
· Given the natural variability in pollutant concentrations, trends often take a considerable length of time to be discernible as statistically significant.
· Monitoring became less frequent and regular in the latter years of the Milestone program – there is simply less data to work with – making trends more difficult to ascertain.
· In cases where overall decreasing pollutant levels have been found, while this is not clear from this data, it may be the case that the largest reductions came in the earlier years of the MPCA’s efforts from the relatively more easily attained limitations on municipal and industrial point sources. In contrast, the remaining problems are largely nonpoint in nature, more diffuse, and more difficult to resolve from a regulatory, socio-economic, and technical standpoint.
Nevertheless, the combined results from the Milestone sites give an accurate and useful picture of overall conditions and changes in pollutant levels across the state of Minnesota. As such, they are indicative of past and current successes as well as future challenges.
3

0%
10%
20%
30%
40%
50%
60%
70%
80%
90%
100%
Total SuspendedSolids
Total Phosphorus Nitrite/Nitrate Ammonia BiochemicalOxygen Demand
Chloride
Perc
ent o
f Site
s Sh
owin
g Tr
end
Long-Term Water Quality Trends at 80 Minnesota Milestone Sites
No Trend
Increasing Pollutant Trend
Decreasing Pollutant Trend
4

0%
10%
20%
30%
40%
50%
60%
70%
80%
90%
100%
Total SuspendedSolids
Total Phosphorus Nitrite/Nitrate Ammonia BiochemicalOxygen Demand
Chloride
Perc
ent o
f Site
s Sh
owin
g Tr
end
Recent 15-Year Water Quality Trends at 80 Minnesota Milestone Sites
No Trend
Increasing Pollutant Trend
Decreasing Pollutant Trend
5

Water Quality Trends at 80 Minnesota Milestone Sites
River Station
Total Suspended
SolidsTotal
PhosphorusNitrite/Nitrate Ammonia
Biochemical Oxygen Demand Chloride
Total Suspended
SolidsTotal
PhosphorusNitrite/Nitrate Ammonia
Biochemical Oxygen Demand Chloride TSS TP
NO2/NO3 NH3 BOD Cl
Red River of the North BasinRed RE-536 no trend no trend increase no trend decrease increase increase increase no trend no trend no trend increase 74 0.3 0.2 <0.05 3 15Red RE-452 increase no trend increase no trend decrease increase no trend no trend no trend no trend no trend no trend 120 0.3 0.3 <0.05 2 17Red RE-403 increase decrease increase decrease decrease no trend no trend no trend no trend no trend decrease no trend 230 0.5 0.4 0.05 2 18Red RE-298 increase no trend increase decrease decrease increase no trend no trend no trend no trend decrease no trend 160 0.4 0.5 <0.05 1 19Otter Tail OT-49 no trend decrease no trend no trend decrease increase no trend no trend no trend no trend no trend little data 13 0.1 0.06 <0.05 1 10Otter Tail OT-1 decrease decrease increase decrease decrease increase no trend no trend no trend no trend no trend no trend 64 0.1 0.06 <0.05 1 10Red Lake RL-23 no trend decrease increase no trend decrease increase no trend no trend no trend no trend no trend no trend 79 0.2 0.1 <0.05 2 7Red Lake RL-0.2 no trend decrease increase decrease decrease increase no trend no trend no trend no trend no trend no trend 98 0.2 0.1 <0.05 1 7Snake SK-1.8 no trend decrease no trend decrease decrease no trend no trend decrease no trend no trend no trend decrease 70 0.3 <0.05 <0.05 2 14Two Rivers TMB-19 no trend decrease no trend no trend decrease no trend no trend no trend no trend no trend no trend no trend 30 0.2 0.08 <0.05 2 17Rainy River BasinRainy RA-83 decrease decrease increase no trend decrease no trend no trend no trend no trend no trend no trend little data 2 0.02 <0.05 <0.05 1 2Rainy RA-12 decrease decrease increase no trend decrease increase no trend no trend no trend no trend no trend little data 4 0.03 <0.05 <0.05 1 3Kawishiwi KA-10 decrease decrease no trend no trend no trend no trend no trend decrease no trend no trend no trend little data 3 0.02 <0.05 <0.05 1 2Little Fork LF-0.5 no trend decrease no trend no trend decrease increase no trend no trend no trend no trend no trend little data 12 0.1 0.06 <0.05 1 4Big Fork BF-0.5 decrease decrease no trend decrease decrease no trend no trend no trend no trend no trend increase little data 12 0.05 <0.05 <0.05 1 2Rapid RP-0.1 decrease decrease no trend no trend no trend decrease no trend no trend no trend no trend no trend little data 9 0.05 <0.05 <0.05 1 1Winter Road WR-1 no trend no trend no trend no trend decrease little data no trend no trend no trend no trend no trend little data 4 0.03 <0.05 <0.05 1 2Lake Superior BasinBrule BRU-0.4 no trend decrease no trend no trend no trend no trend no trend decrease no trend no trend no trend little data 2 0.01 <0.05 <0.05 <0.5 1Poplar POP-0 no trend decrease no trend no trend no trend no trend no trend no trend no trend no trend no trend little data 3 0.02 0.05 <0.05 0.7 2Beaver BV-4 decrease decrease increase no trend decrease increase no trend no trend increase no trend no trend little data 2 0.01 0.4 <0.05 0.6 7Knife KN-0.2 decrease decrease no trend no trend decrease no trend no trend no trend no trend no trend no trend little data 2 0.01 <0.05 <0.05 0.5 5Lester LE-0.2 decrease decrease no trend no trend no trend increase no trend no trend no trend no trend no trend little data 2 0.02 <0.05 <0.05 0.8 11St. Louis SL-110 decrease decrease no trend decrease decrease little data no trend decrease decrease no trend no trend little data 4 0.03 <0.05 <0.05 0.8 6St. Louis SL-38 decrease decrease no trend decrease decrease increase no trend no trend no trend no trend no trend little data 4 0.04 0.06 <0.05 1 5St. Louis SL-9 decrease decrease no trend decrease decrease decrease decrease no trend no trend no trend no trend little data 5 0.04 0.09 <0.05 1 7St. Louis SLB-1 decrease decrease increase decrease decrease decrease no trend no trend increase increase no trend increase 5 0.05 0.2 0.07 1 11Upper Mississippi River BasinMississippi UM-1365 decrease decrease no trend no trend decrease no trend no trend increase no trend no trend no trend little data 2 0.05 <0.05 <0.05 1 2Mississippi UM-1292 decrease decrease no trend decrease decrease increase no trend no trend no trend no trend no trend little data 1 0.03 <0.05 <0.05 1 7Mississippi UM-1186 decrease decrease no trend decrease decrease increase no trend no trend no trend no trend no trend little data 2 0.03 <0.05 <0.05 1 3Mississippi UM-1172 decrease decrease no trend decrease decrease no trend decrease decrease no trend no trend no trend little data 3 0.04 <0.05 <0.05 1 5Mississippi UM-982 decrease decrease increase decrease decrease increase no trend no trend no trend no trend no trend little data 5 0.05 0.2 <0.05 1 9Mississippi UM-930 decrease decrease increase decrease decrease increase no trend no trend increase no trend no trend little data 7 0.08 0.2 <0.05 1 9Mississippi UM-914 no trend decrease increase decrease decrease increase no trend no trend increase no trend no trend little data 8 0.07 0.2 <0.05 2 11Mississippi UM-895 decrease decrease increase decrease decrease no trend decrease no trend increase no trend no trend little data 8 0.09 0.4 <0.05 2 12Mississippi UM-859 decrease decrease increase decrease decrease increase decrease no trend no trend no trend no trend little data 19 0.1 0.3 <0.05 2 25Mississippi UM-840 no trend decrease increase decrease decrease increase decrease decrease no trend no trend no trend little data 68 0.2 3 <0.05 2 25Mississippi UM-826 no trend decrease increase decrease decrease increase decrease decrease increase no trend decrease little data 48 0.2 3 0.08 2 31Mississippi UM-815 decrease decrease increase decrease decrease increase decrease decrease no trend no trend no trend little data 42 0.2 2 0.05 3 28Long Prairie LPR-3 decrease no trend increase decrease decrease increase no trend no trend no trend no trend decrease little data 3 0.09 0.1 <0.05 1 25Sauk SA-0 no trend decrease increase decrease no trend increase no trend no trend increase no trend no trend little data 9 0.2 0.4 <0.05 2 32Crow CR-0.2 no trend no trend increase no trend no trend increase decrease no trend no trend no trend no trend no trend 51 0.3 0.7 <0.05 6 33Rum RUM-34 decrease decrease increase decrease decrease increase no trend no trend no trend no trend no trend little data 14 0.1 0.2 <0.05 2 12Rum RUM-0.6 decrease decrease increase no trend decrease increase no trend no trend no trend no trend decrease little data 8 0.1 0.1 <0.05 2 18
Long-Term Trend Recent 15-Year Trend Recent 10-Year Median Concentration
6

Water Quality Trends at 80 Minnesota Milestone Sites
River Station
Total Suspended
SolidsTotal
PhosphorusNitrite/Nitrate Ammonia
Biochemical Oxygen Demand Chloride
Total Suspended
SolidsTotal
PhosphorusNitrite/Nitrate Ammonia
Biochemical Oxygen Demand Chloride TSS TP
NO2/NO3 NH3 BOD Cl
Long-Term Trend Recent 15-Year Trend Recent 10-Year Median Concentration
Minnesota River BasinMinnesota MI-212 decrease decrease no trend decrease no trend little data decrease decrease decrease no trend increase little data 54 0.2 0.2 <0.05 4 22Minnesota MI-196 no trend decrease no trend decrease decrease increase no trend no trend no trend no trend increase little data 68 0.2 0.7 <0.05 4 26Minnesota MI-133 decrease decrease no trend decrease decrease increase decrease decrease no trend no trend increase little data 79 0.2 1 <0.05 4 29Minnesota MI-88 no trend decrease no trend decrease decrease increase decrease decrease no trend no trend increase little data 87 0.2 4 <0.05 4 29Minnesota MI-64 decrease decrease no trend decrease decrease increase decrease decrease no trend no trend increase little data 81 0.2 3 <0.05 4 32Minnesota MI-3.5 no trend decrease no trend decrease no trend little data decrease decrease no trend no trend no trend little data 71 0.2 7 <0.05 3 55Pomme de Terre PT-10 no trend decrease increase decrease decrease increase decrease no trend no trend no trend no trend no trend 73 0.2 0.3 <0.05 2 13Yellow Medicine YM-0.5 decrease decrease increase decrease decrease increase decrease decrease no trend no trend decrease little data 26 0.1 0.3 <0.05 2 18Redwood RWR-1 decrease no trend no trend decrease decrease no trend no trend increase no trend no trend no trend little data 51 0.3 2 <0.05 4 71Cottonwood CO-0.5 no trend decrease no trend decrease decrease increase decrease decrease no trend no trend increase little data 65 0.1 3 <0.05 5 29Center Creek CEC-23.2 no trend decrease increase decrease decrease no trend decrease no trend increase no trend no trend little data 38 0.3 6 0.08 4 79Watonwan WA-6 no trend decrease no trend decrease decrease increase decrease no trend no trend no trend no trend little data 52 0.2 6 <0.05 2 42Blue Earth BE-0 no trend decrease no trend decrease decrease increase decrease decrease no trend no trend increase little data 62 0.2 7 <0.05 5 31St. Croix River BasinSt. Croix SC-111 decrease decrease no trend no trend decrease increase no trend decrease no trend no trend no trend little data 4 0.03 <0.05 <0.05 1 5St. Croix SC-23 decrease decrease increase no trend decrease increase no trend no trend no trend no trend no trend little data 10 0.1 0.1 <0.05 2 7St. Croix SC-17 decrease decrease increase decrease decrease increase no trend no trend no trend no trend no trend no trend 5 0.1 0.2 <0.05 1 7Kettle KE-11 decrease decrease no trend decrease decrease increase no trend no trend increase no trend no trend little data 3 0.05 0.1 <0.05 1 8Snake SN-10 no trend no trend no trend decrease no trend increase no trend no trend no trend no trend no trend little data 7 0.09 0.06 0.06 2 8Sunrise SUN-5 decrease no trend increase no trend increase no trend decrease no trend increase no trend no trend little data 8 0.1 2 <0.05 1 31Lower Mississippi River BasinMississippi UM-738 decrease decrease increase decrease decrease increase decrease no trend increase no trend decrease little data 17 0.1 1 <0.05 2 23Mississippi UM-714 decrease decrease increase decrease decrease increase no trend no trend increase no trend no trend little data 21 0.2 2 <0.05 2 18Mississippi UM-698 no trend decrease increase decrease decrease no trend no trend no trend increase no trend no trend little data 20 0.2 0.9 <0.05 2 18Vermillion VR-32.5 decrease decrease no trend decrease increase little data decrease decrease decrease no trend no trend little data 12 0.5 5 <0.05 1 52Straight ST-18 decrease decrease no trend decrease decrease increase no trend no trend no trend no trend no trend little data 23 0.3 4 <0.05 1 30Cannon CA-13 decrease decrease increase decrease decrease increase no trend no trend increase no trend no trend little data 14 0.2 4 <0.05 2 28Zumbro ZSF-5.7 decrease decrease increase decrease decrease increase decrease no trend no trend no trend no trend little data 16 0.2 7 <0.05 2 54Whitewater WWR-26 decrease no trend increase decrease decrease increase no trend no trend increase no trend no trend little data 16 0.4 11 <0.05 1 43Garvin Brook GB-4.5 decrease decrease increase decrease decrease increase decrease no trend increase no trend no trend little data 23 0.1 2 <0.05 1 13Root RT-3 decrease decrease increase decrease decrease increase decrease no trend increase no trend no trend little data 58 0.1 4 <0.05 1 13Missouri River BasinRock RO-0 decrease decrease increase decrease decrease increase no trend no trend increase no trend no trend little data 30 0.1 5 <0.05 2 26Pipestone Creek PC-1.5 no trend decrease increase decrease decrease no trend decrease no trend no trend no trend no trend little data 39 0.2 4 0.07 5 26Des Moines River BasinW Fk Des Moines WDM-3 no trend no trend increase decrease no trend no trend no trend no trend no trend no trend no trend little data 71 0.2 3 <0.05 8 38E Fk Des Moines EDM-6 decrease decrease no trend decrease decrease no trend no trend no trend no trend no trend no trend little data 20 0.2 11 <0.05 5 36Okabena Creek OK-25.6 decrease no trend increase decrease decrease little data decrease decrease no trend no trend no trend little data 32 5 42 <0.05 2 175Cedar River BasinCedar CD-24 decrease decrease increase decrease decrease no trend no trend no trend no trend no trend no trend little data 11 0.2 8 <0.05 1 20Cedar CD-10 decrease decrease increase decrease decrease no trend no trend no trend increase no trend no trend little data 34 0.2 9 <0.05 2 28Shell Rock SR-1.2 decrease decrease increase decrease decrease increase no trend no trend no trend no trend no trend little data 54 0.4 2 <0.05 7 43
Milestone Sites (Having Sufficient Data) Showing: Decreasing Pollutant Trend 63% 85% 0% 73% 84% 4% 34% 24% 4% 0% 9% 8%Increasing Pollutant Trend 4% 0% 56% 0% 3% 68% 1% 4% 24% 1% 10% 15%No Trend 34% 15% 44% 28% 14% 28% 65% 73% 73% 99% 81% 77%
7
"
#*
#*
#*
"
#*
""
"
"
#*#*
#*
"
#*
#*
"
"
"
#*
#*#*
#*
#*
#*#*
#*
#*
#* #*
#*
#*
" #*
#*
"" #*
#*
"
"
#*
#*
#*
"
#* "
#*
"
"
#*#*
"
"
""
#*
#*#*
#*
"
#*
#*#*
"
#*
#*
#*
#*#* #*
#*
#*
"
"
#*#* #*
#*#*
RE-536
RE-452
RE-403
RE-298
OT-49
OT-1
RL-23
RL-0.2
SK-1.8
TMB-19 RA-83RA-12
KA-10
LF-0.5BF-0.5RP-0.1WR-1
BRU-0.4
POP-0
BV-4
KN-0.2LE-0.2
SL-110
SL-38
SL-9SLB-1
UM-1365
UM-1292UM-1186 UM-1172
UM-982
UM-930UM-914
UM-895
UM-859UM-840
UM-826UM-815
LPR-3
SA-0
CR-0.2
RUM-34
RUM-0.6
MI-212MI-196
MI-133
MI-88MI-64
MI-3.5
PT-10
YM-0.5
RWR-1CO-0.5
CEC-23.2
WA-6BE-0
SC-111
SC-23
KE-11
SN-10
SUN-5
UM-738
UM-714
UM-698
VR-32.5
ST-18
CA-13
ZSF-5.7
WWR-26
GB-4.5
RT-3RO-0
PC-1.5
WDM-3 EDM-6
OK-25.6 CD-24CD-10SR-1.2
SC-17
Long-Term Water QualityTrends At Minnesota Milestone SitesTotal Suspended Solids
BE - Blue Earth RiverBF - Big Fork RiverBRU - Brule RiverBV - Beaver RiverCA - Cannon RiverCD - Cedar RiverCEC - Center CreekCO - Cottonwood RiverCR - Crow RiverEDM - De Moines River (E Fork)
GB - Garvin BrookKA - Kawishiwi RiverKE - Kettle RiverKN - Knife RiverLE - Lester RiverLF - Little Fork RiverLPR - Long Prairie RiverMI - Minnesota RiverOK - Okabena CreekOT - Otter Tail River
PC - Pipestone CreekPOP - Poplar RiverPT - Pomme De Terre RiverRA - Rainy RiverRE - Red RiverRL - Red Lake RiverRO - Rock RiverRP - Rapid RiverRT - Root RiverRUM - Rum River
RWR - Redwood RiverSA - Sauk RiverSC - St. Croix RiverSK - Snake RiverSL - St. Louis RiverSLB - St. Louis BaySN - Snake RiverSR - Shell Rock RiverST - Straight RiverSUN - Sunrise River
TMB - Two Rivers (Middle Branch)UM - Mississippi RiverVR - Vermillion RiverWA - Watonwan RiverWDM - Des Moines River (W Fork)WR - Winter Road RiverWWR - Whitewater RiverYM - Yellow Medicine RiverZSF - Zumbro River (S Fork)
´
Pollutant Trend
RiversBasin Boundaries
Decrease#*
Increase#*
No Trend"
Milestone site designations referto rivers' names (see table at bottom)and approximate distances in miles
from rivers' mouths
8

"
"
#*
"
#*#*
#*#*
#*
#*
#*#*
#*
#*#*
#*
"
#*
#*
#*
#*#*
#*
#*
#*#*
#*
#*
#* #*
#*
#*#*
#*
#*#*#*#*
"
#*
"
#*
#*
#*#*
#* #*
#*
#*
#*
#*
"
#*
#*
#*#*
#*
#*#*
#*
"
"
#*#*
#*
#*
#*
#*
#*
"
#*
#*
#*
#*
"
#*"
#*#*
#*
RE-536
RE-452
RE-403
RE-298
OT-49
OT-1
RL-23
RL-0.2
SK-1.8
TMB-19 RA-83RA-12
KA-10
LF-0.5BF-0.5RP-0.1WR-1
BRU-0.4
POP-0
BV-4
KN-0.2LE-0.2
SL-110
SL-38
SL-9SLB-1
UM-1365
UM-1292UM-1186 UM-1172
UM-982
UM-930UM-914
UM-895
UM-859UM-840
UM-826UM-815
LPR-3
SA-0
CR-0.2
RUM-34
RUM-0.6
MI-212MI-196
MI-133
MI-88MI-64
MI-3.5
PT-10
YM-0.5
RWR-1CO-0.5
CEC-23.2
WA-6BE-0
SC-111
SC-23
KE-11
SN-10
SUN-5
UM-738
UM-714
UM-698
VR-32.5
ST-18
CA-13
ZSF-5.7
WWR-26
GB-4.5
RT-3RO-0
PC-1.5
WDM-3 EDM-6
OK-25.6 CD-24CD-10SR-1.2
SC-17
Long-Term Water QualityTrends At Minnesota Milestone SitesTotal Phosphorus
BE - Blue Earth RiverBF - Big Fork RiverBRU - Brule RiverBV - Beaver RiverCA - Cannon RiverCD - Cedar RiverCEC - Center CreekCO - Cottonwood RiverCR - Crow RiverEDM - De Moines River (E Fork)
GB - Garvin BrookKA - Kawishiwi RiverKE - Kettle RiverKN - Knife RiverLE - Lester RiverLF - Little Fork RiverLPR - Long Prairie RiverMI - Minnesota RiverOK - Okabena CreekOT - Otter Tail River
PC - Pipestone CreekPOP - Poplar RiverPT - Pomme De Terre RiverRA - Rainy RiverRE - Red RiverRL - Red Lake RiverRO - Rock RiverRP - Rapid RiverRT - Root RiverRUM - Rum River
RWR - Redwood RiverSA - Sauk RiverSC - St. Croix RiverSK - Snake RiverSL - St. Louis RiverSLB - St. Louis BaySN - Snake RiverSR - Shell Rock RiverST - Straight RiverSUN - Sunrise River
TMB - Two Rivers (Middle Branch)UM - Mississippi RiverVR - Vermillion RiverWA - Watonwan RiverWDM - Des Moines River (W Fork)WR - Winter Road RiverWWR - Whitewater RiverYM - Yellow Medicine RiverZSF - Zumbro River (S Fork)
´
Pollutant Trend
RiversBasin Boundaries
Decrease#*
Increase#*
No Trend"
Milestone site designations referto rivers' names (see table at bottom)and approximate distances in miles
from rivers' mouths
9

#*
#*
#*
#*
"#*
#*#*
"
"
#*#*
"
""
""
"
"
#*
""
"
"
"#*
"
"
""
#*
#*#*
#*
#*#*#*#*
#*
#*
#*
#*
#*
""
" "
"
"
#*
#*"
"
#*
""
"
#*#*
"
"
#*
#*#*
#*
"
"
#*
#*#* #*
#*
#*
#*
#* "#* #*
#*#*
RE-536
RE-452
RE-403
RE-298
OT-49
OT-1
RL-23
RL-0.2
SK-1.8
TMB-19 RA-83RA-12
KA-10
LF-0.5BF-0.5RP-0.1WR-1
BRU-0.4
POP-0
BV-4
KN-0.2LE-0.2
SL-110
SL-38
SL-9SLB-1
UM-1365
UM-1292UM-1186 UM-1172
UM-982
UM-930UM-914
UM-895
UM-859UM-840
UM-826UM-815
LPR-3
SA-0
CR-0.2
RUM-34
RUM-0.6
MI-212MI-196
MI-133
MI-88MI-64
MI-3.5
PT-10
YM-0.5
RWR-1CO-0.5
CEC-23.2
WA-6BE-0
SC-111
SC-23
KE-11
SN-10
SUN-5
UM-738
UM-714
UM-698
VR-32.5
ST-18
CA-13
ZSF-5.7
WWR-26
GB-4.5
RT-3RO-0
PC-1.5
WDM-3 EDM-6
OK-25.6 CD-24CD-10SR-1.2
SC-17
Long-Term Water QualityTrends At Minnesota Milestone SitesNitrite/Nitrate
BE - Blue Earth RiverBF - Big Fork RiverBRU - Brule RiverBV - Beaver RiverCA - Cannon RiverCD - Cedar RiverCEC - Center CreekCO - Cottonwood RiverCR - Crow RiverEDM - De Moines River (E Fork)
GB - Garvin BrookKA - Kawishiwi RiverKE - Kettle RiverKN - Knife RiverLE - Lester RiverLF - Little Fork RiverLPR - Long Prairie RiverMI - Minnesota RiverOK - Okabena CreekOT - Otter Tail River
PC - Pipestone CreekPOP - Poplar RiverPT - Pomme De Terre RiverRA - Rainy RiverRE - Red RiverRL - Red Lake RiverRO - Rock RiverRP - Rapid RiverRT - Root RiverRUM - Rum River
RWR - Redwood RiverSA - Sauk RiverSC - St. Croix RiverSK - Snake RiverSL - St. Louis RiverSLB - St. Louis BaySN - Snake RiverSR - Shell Rock RiverST - Straight RiverSUN - Sunrise River
TMB - Two Rivers (Middle Branch)UM - Mississippi RiverVR - Vermillion RiverWA - Watonwan RiverWDM - Des Moines River (W Fork)WR - Winter Road RiverWWR - Whitewater RiverYM - Yellow Medicine RiverZSF - Zumbro River (S Fork)
´
Pollutant Trend
RiversBasin Boundaries
Decrease#*
Increase#*
No Trend"
Milestone site designations referto rivers' names (see table at bottom)and approximate distances in miles
from rivers' mouths
10

"
"
#*
#*
"
#*
"
#*
#*
"
""
"
"
#*
""
"
"
"
""
#*
#*
#*#*
"
#*
#* #*
#*
#*#*
#*
#*#*#*#*
#*
#*
"
#*
"
#*#*
#* #*
#*
#*
#*
#*#*
#*
#*
#*#*
"
" #*
#*#*
"
#*#*
#*
#*
#*
#*
#*#* #*
#*
#*
#*
#* #*#* #*
#*#*
RE-536
RE-452
RE-403
RE-298
OT-49
OT-1
RL-23
RL-0.2
SK-1.8
TMB-19 RA-83RA-12
KA-10
LF-0.5BF-0.5RP-0.1WR-1
BRU-0.4
POP-0
BV-4
KN-0.2LE-0.2
SL-110
SL-38
SL-9SLB-1
UM-1365
UM-1292UM-1186 UM-1172
UM-982
UM-930UM-914
UM-895
UM-859UM-840
UM-826UM-815
LPR-3
SA-0
CR-0.2
RUM-34
RUM-0.6
MI-212MI-196
MI-133
MI-88MI-64
MI-3.5
PT-10
YM-0.5
RWR-1CO-0.5
CEC-23.2
WA-6BE-0
SC-111
SC-23
KE-11
SN-10
SUN-5
UM-738
UM-714
UM-698
VR-32.5
ST-18
CA-13
ZSF-5.7
WWR-26
GB-4.5
RT-3RO-0
PC-1.5
WDM-3 EDM-6
OK-25.6 CD-24CD-10SR-1.2
SC-17
Long-Term Water QualityTrends At Minnesota Milestone SitesAmmonia
BE - Blue Earth RiverBF - Big Fork RiverBRU - Brule RiverBV - Beaver RiverCA - Cannon RiverCD - Cedar RiverCEC - Center CreekCO - Cottonwood RiverCR - Crow RiverEDM - De Moines River (E Fork)
GB - Garvin BrookKA - Kawishiwi RiverKE - Kettle RiverKN - Knife RiverLE - Lester RiverLF - Little Fork RiverLPR - Long Prairie RiverMI - Minnesota RiverOK - Okabena CreekOT - Otter Tail River
PC - Pipestone CreekPOP - Poplar RiverPT - Pomme De Terre RiverRA - Rainy RiverRE - Red RiverRL - Red Lake RiverRO - Rock RiverRP - Rapid RiverRT - Root RiverRUM - Rum River
RWR - Redwood RiverSA - Sauk RiverSC - St. Croix RiverSK - Snake RiverSL - St. Louis RiverSLB - St. Louis BaySN - Snake RiverSR - Shell Rock RiverST - Straight RiverSUN - Sunrise River
TMB - Two Rivers (Middle Branch)UM - Mississippi RiverVR - Vermillion RiverWA - Watonwan RiverWDM - Des Moines River (W Fork)WR - Winter Road RiverWWR - Whitewater RiverYM - Yellow Medicine RiverZSF - Zumbro River (S Fork)
´
Pollutant Trend
RiversBasin Boundaries
Decrease#*
Increase#*
No Trend"
Milestone site designations referto rivers' names (see table at bottom)and approximate distances in miles
from rivers' mouths
11

#*
#*
#*
#*
#*#*
#*#*
#*
#*
#*#*
"
#*#*
"
#*
"
"
#*
#*
"
#*
#*
#*#*
#*
#*
#* #*
#*
#*#*
#*
#*#*#*#*
#*
"
"
#*
#*
" #*
#* #*
#*
"
#*
#*#*
#*
#*
#*#*
#*
#*#*
#*
"
#*
#*#*
#*
#*
#*
#*
#*#* #*
#*
#*
#*
"
#*#* #*
#*#*
RE-536
RE-452
RE-403
RE-298
OT-49
OT-1
RL-23
RL-0.2
SK-1.8
TMB-19 RA-83RA-12
KA-10
LF-0.5BF-0.5RP-0.1WR-1
BRU-0.4
POP-0
BV-4
KN-0.2LE-0.2
SL-110
SL-38
SL-9SLB-1
UM-1365
UM-1292UM-1186 UM-1172
UM-982
UM-930UM-914
UM-895
UM-859UM-840
UM-826UM-815
LPR-3
SA-0
CR-0.2
RUM-34
RUM-0.6
MI-212MI-196
MI-133
MI-88MI-64
MI-3.5
PT-10
YM-0.5
RWR-1CO-0.5
CEC-23.2
WA-6BE-0
SC-111
SC-23
KE-11
SN-10
SUN-5
UM-738
UM-714
UM-698
VR-32.5
ST-18
CA-13
ZSF-5.7
WWR-26
GB-4.5
RT-3RO-0
PC-1.5
WDM-3 EDM-6
OK-25.6 CD-24CD-10SR-1.2
SC-17
Long-Term Water QualityTrends At Minnesota Milestone SitesBiochemical Oxygen Demand
BE - Blue Earth RiverBF - Big Fork RiverBRU - Brule RiverBV - Beaver RiverCA - Cannon RiverCD - Cedar RiverCEC - Center CreekCO - Cottonwood RiverCR - Crow RiverEDM - De Moines River (E Fork)
GB - Garvin BrookKA - Kawishiwi RiverKE - Kettle RiverKN - Knife RiverLE - Lester RiverLF - Little Fork RiverLPR - Long Prairie RiverMI - Minnesota RiverOK - Okabena CreekOT - Otter Tail River
PC - Pipestone CreekPOP - Poplar RiverPT - Pomme De Terre RiverRA - Rainy RiverRE - Red RiverRL - Red Lake RiverRO - Rock RiverRP - Rapid RiverRT - Root RiverRUM - Rum River
RWR - Redwood RiverSA - Sauk RiverSC - St. Croix RiverSK - Snake RiverSL - St. Louis RiverSLB - St. Louis BaySN - Snake RiverSR - Shell Rock RiverST - Straight RiverSUN - Sunrise River
TMB - Two Rivers (Middle Branch)UM - Mississippi RiverVR - Vermillion RiverWA - Watonwan RiverWDM - Des Moines River (W Fork)WR - Winter Road RiverWWR - Whitewater RiverYM - Yellow Medicine RiverZSF - Zumbro River (S Fork)
´
Pollutant Trend
RiversBasin Boundaries
Decrease#*
Increase#*
No Trend"
Milestone site designations referto rivers' names (see table at bottom)and approximate distances in miles
from rivers' mouths
12

#*
#*
"
#*
#*#*
#*#*
"
"
"#*
"
#*"
#*
%
"
"
#*
"#*
%
#*
#*#*
"
#*
#* "
#*
#*#*
"
#*#*#*#*
#*
#*
#*
#*
#*
%#*
#* #*
#*
%
#*
#*"
#*
"
#*#*
#*
#*#*
#*#*
"
#*#*
"
%
#*
#*
#*#* #*
#*
#*
"
" "% "
"#*
RE-536
RE-452
RE-403
RE-298
OT-49
OT-1
RL-23
RL-0.2
SK-1.8
TMB-19 RA-83RA-12
KA-10
LF-0.5BF-0.5RP-0.1WR-1
BRU-0.4
POP-0
BV-4
KN-0.2LE-0.2
SL-110
SL-38
SL-9SLB-1
UM-1365
UM-1292UM-1186 UM-1172
UM-982
UM-930UM-914
UM-895
UM-859UM-840
UM-826UM-815
LPR-3
SA-0
CR-0.2
RUM-34
RUM-0.6
MI-212MI-196
MI-133
MI-88MI-64
MI-3.5
PT-10
YM-0.5
RWR-1CO-0.5
CEC-23.2
WA-6BE-0
SC-111
SC-23
KE-11
SN-10
SUN-5
UM-738
UM-714
UM-698
VR-32.5
ST-18
CA-13
ZSF-5.7
WWR-26
GB-4.5
RT-3RO-0
PC-1.5
WDM-3 EDM-6
OK-25.6 CD-24CD-10SR-1.2
SC-17
Long-Term Water QualityTrends At Minnesota Milestone SitesChloride
BE - Blue Earth RiverBF - Big Fork RiverBRU - Brule RiverBV - Beaver RiverCA - Cannon RiverCD - Cedar RiverCEC - Center CreekCO - Cottonwood RiverCR - Crow RiverEDM - De Moines River (E Fork)
GB - Garvin BrookKA - Kawishiwi RiverKE - Kettle RiverKN - Knife RiverLE - Lester RiverLF - Little Fork RiverLPR - Long Prairie RiverMI - Minnesota RiverOK - Okabena CreekOT - Otter Tail River
PC - Pipestone CreekPOP - Poplar RiverPT - Pomme De Terre RiverRA - Rainy RiverRE - Red RiverRL - Red Lake RiverRO - Rock RiverRP - Rapid RiverRT - Root RiverRUM - Rum River
RWR - Redwood RiverSA - Sauk RiverSC - St. Croix RiverSK - Snake RiverSL - St. Louis RiverSLB - St. Louis BaySN - Snake RiverSR - Shell Rock RiverST - Straight RiverSUN - Sunrise River
TMB - Two Rivers (Middle Branch)UM - Mississippi RiverVR - Vermillion RiverWA - Watonwan RiverWDM - Des Moines River (W Fork)WR - Winter Road RiverWWR - Whitewater RiverYM - Yellow Medicine RiverZSF - Zumbro River (S Fork)
´
Pollutant Trend
RiversBasin Boundaries
Decrease#*
Increase#*
No Trend"
% Insufficient Data
Milestone site designations referto rivers' names (see table at bottom)and approximate distances in miles
from rivers' mouths
13

#*
"
"
"
""
""
"
"
""
"
""
""
"
"
"
""
"
"
#*"
"
"
" #*
"
"
" #*
#*#*#*#*
"
"
#*
"
"
#*
"
#* #*
#*
#*
#*
#*
"
#*
#*
#*#*
"
""
"
"
#*
#*
"
"
#*
"
"
#*
"
#*
#*
"
#*
" "
#* "
""
RE-536
RE-452
RE-403
RE-298
OT-49
OT-1
RL-23
RL-0.2
SK-1.8
TMB-19 RA-83RA-12
KA-10
LF-0.5BF-0.5RP-0.1WR-1
BRU-0.4
POP-0
BV-4
KN-0.2LE-0.2
SL-110
SL-38
SL-9SLB-1
UM-1365
UM-1292UM-1186 UM-1172
UM-982
UM-930UM-914
UM-895
UM-859UM-840
UM-826UM-815
LPR-3
SA-0
CR-0.2
RUM-34
RUM-0.6
MI-212MI-196
MI-133
MI-88MI-64
MI-3.5
PT-10
YM-0.5
RWR-1CO-0.5
CEC-23.2
WA-6BE-0
SC-111
SC-23
KE-11
SN-10
SUN-5
UM-738
UM-714
UM-698
VR-32.5
ST-18
CA-13
ZSF-5.7
WWR-26
GB-4.5
RT-3RO-0
PC-1.5
WDM-3 EDM-6
OK-25.6 CD-24CD-10SR-1.2
SC-17
Recent 15-Year Water QualityTrends At Minnesota Milestone SitesTotal Suspended Solids
BE - Blue Earth RiverBF - Big Fork RiverBRU - Brule RiverBV - Beaver RiverCA - Cannon RiverCD - Cedar RiverCEC - Center CreekCO - Cottonwood RiverCR - Crow RiverEDM - De Moines River (E Fork)
GB - Garvin BrookKA - Kawishiwi RiverKE - Kettle RiverKN - Knife RiverLE - Lester RiverLF - Little Fork RiverLPR - Long Prairie RiverMI - Minnesota RiverOK - Okabena CreekOT - Otter Tail River
PC - Pipestone CreekPOP - Poplar RiverPT - Pomme De Terre RiverRA - Rainy RiverRE - Red RiverRL - Red Lake RiverRO - Rock RiverRP - Rapid RiverRT - Root RiverRUM - Rum River
RWR - Redwood RiverSA - Sauk RiverSC - St. Croix RiverSK - Snake RiverSL - St. Louis RiverSLB - St. Louis BaySN - Snake RiverSR - Shell Rock RiverST - Straight RiverSUN - Sunrise River
TMB - Two Rivers (Middle Branch)UM - Mississippi RiverVR - Vermillion RiverWA - Watonwan RiverWDM - Des Moines River (W Fork)WR - Winter Road RiverWWR - Whitewater RiverYM - Yellow Medicine RiverZSF - Zumbro River (S Fork)
´
Pollutant Trend
RiversBasin Boundaries
Decrease#*
Increase#*
No Trend"
Milestone site designations referto rivers' names (see table at bottom)and approximate distances in miles
from rivers' mouths
14
#*
"
"
"
""
""
#*
"
""
#*
""
""
#*
"
"
""
#*
"
""
#*
"
" #*
"
"
""
" #*#*#*
"
"
"
"
"
#*
"
#* #*
#*
#*
"
#*
#*
#*
"
"
#*
#*
""
"
"
"
"
"
"
#*
"
"
""
"
"
"
"
" "
#* "
""
RE-536
RE-452
RE-403
RE-298
OT-49
OT-1
RL-23
RL-0.2
SK-1.8
TMB-19 RA-83RA-12
KA-10
LF-0.5BF-0.5RP-0.1WR-1
BRU-0.4
POP-0
BV-4
KN-0.2LE-0.2
SL-110
SL-38
SL-9SLB-1
UM-1365
UM-1292UM-1186 UM-1172
UM-982
UM-930UM-914
UM-895
UM-859UM-840
UM-826UM-815
LPR-3
SA-0
CR-0.2
RUM-34
RUM-0.6
MI-212MI-196
MI-133
MI-88MI-64
MI-3.5
PT-10
YM-0.5
RWR-1CO-0.5
CEC-23.2
WA-6BE-0
SC-111
SC-23
KE-11
SN-10
SUN-5
UM-738
UM-714
UM-698
VR-32.5
ST-18
CA-13
ZSF-5.7
WWR-26
GB-4.5
RT-3RO-0
PC-1.5
WDM-3 EDM-6
OK-25.6 CD-24CD-10SR-1.2
SC-17
Total Phosphorus
BE - Blue Earth RiverBF - Big Fork RiverBRU - Brule RiverBV - Beaver RiverCA - Cannon RiverCD - Cedar RiverCEC - Center CreekCO - Cottonwood RiverCR - Crow RiverEDM - De Moines River (E Fork)
GB - Garvin BrookKA - Kawishiwi RiverKE - Kettle RiverKN - Knife RiverLE - Lester RiverLF - Little Fork RiverLPR - Long Prairie RiverMI - Minnesota RiverOK - Okabena CreekOT - Otter Tail River
PC - Pipestone CreekPOP - Poplar RiverPT - Pomme De Terre RiverRA - Rainy RiverRE - Red RiverRL - Red Lake RiverRO - Rock RiverRP - Rapid RiverRT - Root RiverRUM - Rum River
RWR - Redwood RiverSA - Sauk RiverSC - St. Croix RiverSK - Snake RiverSL - St. Louis RiverSLB - St. Louis BaySN - Snake RiverSR - Shell Rock RiverST - Straight RiverSUN - Sunrise River
TMB - Two Rivers (Middle Branch)UM - Mississippi RiverVR - Vermillion RiverWA - Watonwan RiverWDM - Des Moines River (W Fork)WR - Winter Road RiverWWR - Whitewater RiverYM - Yellow Medicine RiverZSF - Zumbro River (S Fork)
´
Recent15-Year Water QualityTrends At Minnesota Milestone Sites
Pollutant Trend
RiversBasin Boundaries
Decrease#*
Increase#*
No Trend"
Milestone site designations referto rivers' names (see table at bottom)and approximate distances in miles
from rivers' mouths
15

"
"
"
"
""
""
"
"
""
"
""
""
"
"
#*
""
#*
"
"#*
"
"
""
"
#*#*
#*
""
#*"
"
#*
"
"
"
#*
"
" "
"
"
"
"
"
"
#*
""
"
""
#*"
#*
#*#*
#*
#*
"
#*
"#* #*
#*
#*
"
" "" "
#*"
RE-536
RE-452
RE-403
RE-298
OT-49
OT-1
RL-23
RL-0.2
SK-1.8
TMB-19 RA-83RA-12
KA-10
LF-0.5BF-0.5RP-0.1WR-1
BRU-0.4
POP-0
BV-4
KN-0.2LE-0.2
SL-110
SL-38
SL-9SLB-1
UM-1365
UM-1292UM-1186 UM-1172
UM-982
UM-930UM-914
UM-895
UM-859UM-840
UM-826UM-815
LPR-3
SA-0
CR-0.2
RUM-34
RUM-0.6
MI-212MI-196
MI-133
MI-88MI-64
MI-3.5
PT-10
YM-0.5
RWR-1CO-0.5
CEC-23.2
WA-6BE-0
SC-111
SC-23
KE-11
SN-10
SUN-5
UM-738
UM-714
UM-698
VR-32.5
ST-18
CA-13
ZSF-5.7
WWR-26
GB-4.5
RT-3RO-0
PC-1.5
WDM-3 EDM-6
OK-25.6 CD-24CD-10SR-1.2
SC-17
Nitrite/Nitrate
BE - Blue Earth RiverBF - Big Fork RiverBRU - Brule RiverBV - Beaver RiverCA - Cannon RiverCD - Cedar RiverCEC - Center CreekCO - Cottonwood RiverCR - Crow RiverEDM - De Moines River (E Fork)
GB - Garvin BrookKA - Kawishiwi RiverKE - Kettle RiverKN - Knife RiverLE - Lester RiverLF - Little Fork RiverLPR - Long Prairie RiverMI - Minnesota RiverOK - Okabena CreekOT - Otter Tail River
PC - Pipestone CreekPOP - Poplar RiverPT - Pomme De Terre RiverRA - Rainy RiverRE - Red RiverRL - Red Lake RiverRO - Rock RiverRP - Rapid RiverRT - Root RiverRUM - Rum River
RWR - Redwood RiverSA - Sauk RiverSC - St. Croix RiverSK - Snake RiverSL - St. Louis RiverSLB - St. Louis BaySN - Snake RiverSR - Shell Rock RiverST - Straight RiverSUN - Sunrise River
TMB - Two Rivers (Middle Branch)UM - Mississippi RiverVR - Vermillion RiverWA - Watonwan RiverWDM - Des Moines River (W Fork)WR - Winter Road RiverWWR - Whitewater RiverYM - Yellow Medicine RiverZSF - Zumbro River (S Fork)
´
Recent 15-Year Water QualityTrends At Minnesota Milestone Sites
Pollutant Trend
RiversBasin Boundaries
Decrease#*
Increase#*
No Trend"
Milestone site designations referto rivers' names (see table at bottom)and approximate distances in miles
from rivers' mouths
16
"
"
"
"
""
""
"
"
""
"
""
""
"
"
"
""
"
"
"#*
"
"
""
"
"
""
""""
"
"
"
"
"
""
" "
"
"
"
"
"
"
"
""
"
""
"
"
"
"
"
"
"
"
"
""
"
"
"
"
" "" "
""
RE-536
RE-452
RE-403
RE-298
OT-49
OT-1
RL-23
RL-0.2
SK-1.8
TMB-19 RA-83RA-12
KA-10
LF-0.5BF-0.5RP-0.1WR-1
BRU-0.4
POP-0
BV-4
KN-0.2LE-0.2
SL-110
SL-38
SL-9SLB-1
UM-1365
UM-1292UM-1186 UM-1172
UM-982
UM-930UM-914
UM-895
UM-859UM-840
UM-826UM-815
LPR-3
SA-0
CR-0.2
RUM-34
RUM-0.6
MI-212MI-196
MI-133
MI-88MI-64
MI-3.5
PT-10
YM-0.5
RWR-1CO-0.5
CEC-23.2
WA-6BE-0
SC-111
SC-23
KE-11
SN-10
SUN-5
UM-738
UM-714
UM-698
VR-32.5
ST-18
CA-13
ZSF-5.7
WWR-26
GB-4.5
RT-3RO-0
PC-1.5
WDM-3 EDM-6
OK-25.6 CD-24CD-10SR-1.2
SC-17
Ammonia
BE - Blue Earth RiverBF - Big Fork RiverBRU - Brule RiverBV - Beaver RiverCA - Cannon RiverCD - Cedar RiverCEC - Center CreekCO - Cottonwood RiverCR - Crow RiverEDM - De Moines River (E Fork)
GB - Garvin BrookKA - Kawishiwi RiverKE - Kettle RiverKN - Knife RiverLE - Lester RiverLF - Little Fork RiverLPR - Long Prairie RiverMI - Minnesota RiverOK - Okabena CreekOT - Otter Tail River
PC - Pipestone CreekPOP - Poplar RiverPT - Pomme De Terre RiverRA - Rainy RiverRE - Red RiverRL - Red Lake RiverRO - Rock RiverRP - Rapid RiverRT - Root RiverRUM - Rum River
RWR - Redwood RiverSA - Sauk RiverSC - St. Croix RiverSK - Snake RiverSL - St. Louis RiverSLB - St. Louis BaySN - Snake RiverSR - Shell Rock RiverST - Straight RiverSUN - Sunrise River
TMB - Two Rivers (Middle Branch)UM - Mississippi RiverVR - Vermillion RiverWA - Watonwan RiverWDM - Des Moines River (W Fork)WR - Winter Road RiverWWR - Whitewater RiverYM - Yellow Medicine RiverZSF - Zumbro River (S Fork)
´
Recent 15-Year Water QualityTrends At Minnesota Milestone Sites
Pollutant Trend
RiversBasin Boundaries
Decrease#*
Increase#*
No Trend"
Milestone site designations referto rivers' names (see table at bottom)and approximate distances in miles
from rivers' mouths
17

"
"
#*
#*
""
""
"
"
""
"
"#*
""
"
"
"
""
"
"
""
"
"
""
"
"
""
"" #*
"
#*
"
"
"
#*
#*#*
#* #*
#*
"
"
#*
"
#*
"
"#*
"
""
"
"
"
#*
"
"
"
"
"
""
"
"
"
"
" "" "
""
RE-536
RE-452
RE-403
RE-298
OT-49
OT-1
RL-23
RL-0.2
SK-1.8
TMB-19 RA-83RA-12
KA-10
LF-0.5BF-0.5RP-0.1WR-1
BRU-0.4
POP-0
BV-4
KN-0.2LE-0.2
SL-110
SL-38
SL-9SLB-1
UM-1365
UM-1292UM-1186 UM-1172
UM-982
UM-930UM-914
UM-895
UM-859UM-840
UM-826UM-815
LPR-3
SA-0
CR-0.2
RUM-34
RUM-0.6
MI-212MI-196
MI-133
MI-88MI-64
MI-3.5
PT-10
YM-0.5
RWR-1CO-0.5
CEC-23.2
WA-6BE-0
SC-111
SC-23
KE-11
SN-10
SUN-5
UM-738
UM-714
UM-698
VR-32.5
ST-18
CA-13
ZSF-5.7
WWR-26
GB-4.5
RT-3RO-0
PC-1.5
WDM-3 EDM-6
OK-25.6 CD-24CD-10SR-1.2
SC-17
Biochemical Oxygen Demand
BE - Blue Earth RiverBF - Big Fork RiverBRU - Brule RiverBV - Beaver RiverCA - Cannon RiverCD - Cedar RiverCEC - Center CreekCO - Cottonwood RiverCR - Crow RiverEDM - De Moines River (E Fork)
GB - Garvin BrookKA - Kawishiwi RiverKE - Kettle RiverKN - Knife RiverLE - Lester RiverLF - Little Fork RiverLPR - Long Prairie RiverMI - Minnesota RiverOK - Okabena CreekOT - Otter Tail River
PC - Pipestone CreekPOP - Poplar RiverPT - Pomme De Terre RiverRA - Rainy RiverRE - Red RiverRL - Red Lake RiverRO - Rock RiverRP - Rapid RiverRT - Root RiverRUM - Rum River
RWR - Redwood RiverSA - Sauk RiverSC - St. Croix RiverSK - Snake RiverSL - St. Louis RiverSLB - St. Louis BaySN - Snake RiverSR - Shell Rock RiverST - Straight RiverSUN - Sunrise River
TMB - Two Rivers (Middle Branch)UM - Mississippi RiverVR - Vermillion RiverWA - Watonwan RiverWDM - Des Moines River (W Fork)WR - Winter Road RiverWWR - Whitewater RiverYM - Yellow Medicine RiverZSF - Zumbro River (S Fork)
´
Recent 15-Year Water QualityTrends At Minnesota Milestone Sites
Pollutant Trend
RiversBasin Boundaries
Decrease#*
Increase#*
No Trend"
Milestone site designations referto rivers' names (see table at bottom)and approximate distances in miles
from rivers' mouths
18

#*
"
"
"
%"
""
#*
"
%%
%
%%
%%
%
%
%
%%
%
%
%#*
%
%
% %
%
%%
%
%%%%
%
%
"
%
%
%%
% %
%
%
"
%%
%
%
%%
%
%"
%%
%
%%
%
%
%
%
%% %
%
%
%
% %% %
%%
RE-536
RE-452
RE-403
RE-298
OT-49
OT-1
RL-23
RL-0.2
SK-1.8
TMB-19 RA-83RA-12
KA-10
LF-0.5BF-0.5RP-0.1WR-1
BRU-0.4
POP-0
BV-4
KN-0.2LE-0.2
SL-110
SL-38
SL-9SLB-1
UM-1365
UM-1292UM-1186 UM-1172
UM-982
UM-930UM-914
UM-895
UM-859UM-840
UM-826UM-815
LPR-3
SA-0
CR-0.2
RUM-34
RUM-0.6
MI-212MI-196
MI-133
MI-88MI-64
MI-3.5
PT-10
YM-0.5
RWR-1CO-0.5
CEC-23.2
WA-6BE-0
SC-111
SC-23
KE-11
SN-10
SUN-5
UM-738
UM-714
UM-698
VR-32.5
ST-18
CA-13
ZSF-5.7
WWR-26
GB-4.5
RT-3RO-0
PC-1.5
WDM-3 EDM-6
OK-25.6 CD-24CD-10SR-1.2
SC-17
Chloride
BE - Blue Earth RiverBF - Big Fork RiverBRU - Brule RiverBV - Beaver RiverCA - Cannon RiverCD - Cedar RiverCEC - Center CreekCO - Cottonwood RiverCR - Crow RiverEDM - De Moines River (E Fork)
GB - Garvin BrookKA - Kawishiwi RiverKE - Kettle RiverKN - Knife RiverLE - Lester RiverLF - Little Fork RiverLPR - Long Prairie RiverMI - Minnesota RiverOK - Okabena CreekOT - Otter Tail River
PC - Pipestone CreekPOP - Poplar RiverPT - Pomme De Terre RiverRA - Rainy RiverRE - Red RiverRL - Red Lake RiverRO - Rock RiverRP - Rapid RiverRT - Root RiverRUM - Rum River
RWR - Redwood RiverSA - Sauk RiverSC - St. Croix RiverSK - Snake RiverSL - St. Louis RiverSLB - St. Louis BaySN - Snake RiverSR - Shell Rock RiverST - Straight RiverSUN - Sunrise River
TMB - Two Rivers (Middle Branch)UM - Mississippi RiverVR - Vermillion RiverWA - Watonwan RiverWDM - Des Moines River (W Fork)WR - Winter Road RiverWWR - Whitewater RiverYM - Yellow Medicine RiverZSF - Zumbro River (S Fork)
´
Recent 15-Year Water QualityTrends At Minnesota Milestone Sites
Pollutant Trend
RiversBasin Boundaries
Decrease#*
Increase#*
No Trend"
% Insufficient Data
Milestone site designations referto rivers' names (see table at bottom)and approximate distances in miles
from rivers' mouths
19

'
'
'
'
''
''
'
'
'
'
'
''
''
'
'
'
''
'
'
''
'
'
''
'
'
''
''
''
'
'
'
'
'
''
''
'
'
'
'
'
'
'
'
'
'
''
'
'
'
'
'
'
'
'
'
'''
'
'
'
' '
''
''
RE-536
RE-452
RE-403
RE-298
OT-49
OT-1
RL-23
RL-0.2
SK-1.8
TMB-19 RA-83RA-12
KA-10
LF-0.5BF-0.5RP-0.1WR-1
BRU-0.4
POP-0
BV-4
KN-0.2LE-0.2
SL-110
SL-38
SL-9SLB-1
UM-1365
UM-1292UM-1186 UM-1172
UM-982
UM-930UM-914
UM-895
UM-859UM-840
UM-826UM-815
LPR-3
SA-0
CR-0.2
RUM-34
RUM-0.6
MI-212MI-196
MI-133
MI-88MI-64
MI-3.5
PT-10
YM-0.5
RWR-1CO-0.5
CEC-23.2
WA-6BE-0
SC-111
SC-23
KE-11
SN-10
SUN-5
UM-738
UM-714
UM-698
VR-32.5
ST-18
CA-13
ZSF-5.7
WWR-26
GB-4.5
RT-3RO-0
PC-1.5
WDM-3 EDM-6
OK-25.6 CD-24CD-10SR-1.2
SC-17
Total Suspended Solids
BE - Blue Earth RiverBF - Big Fork RiverBRU - Brule RiverBV - Beaver RiverCA - Cannon RiverCD - Cedar RiverCEC - Center CreekCO - Cottonwood RiverCR - Crow RiverEDM - De Moines River (E Fork)
GB - Garvin BrookKA - Kawishiwi RiverKE - Kettle RiverKN - Knife RiverLE - Lester RiverLF - Little Fork RiverLPR - Long Prairie RiverMI - Minnesota RiverOK - Okabena CreekOT - Otter Tail River
PC - Pipestone CreekPOP - Poplar RiverPT - Pomme De Terre RiverRA - Rainy RiverRE - Red RiverRL - Red Lake RiverRO - Rock RiverRP - Rapid RiverRT - Root RiverRUM - Rum River
RWR - Redwood RiverSA - Sauk RiverSC - St. Croix RiverSK - Snake RiverSL - St. Louis RiverSLB - St. Louis BaySN - Snake RiverSR - Shell Rock RiverST - Straight RiverSUN - Sunrise River
TMB - Two Rivers (Middle Branch)UM - Mississippi RiverVR - Vermillion RiverWA - Watonwan RiverWDM - Des Moines River (W Fork)WR - Winter Road RiverWWR - Whitewater RiverYM - Yellow Medicine RiverZSF - Zumbro River (S Fork)
´
TSS mg/L' 0 - 4' 4 - 12' 12 - 24' 24 - 60' 60+
RiversBasin Boundaries
Recent 10-Year Median Pollutant ConcentrationsAt Minnesota Milestone Sites
Milestone site designations referto rivers' names (see table at bottom)and approximate distances in miles
from rivers' mouths
20
'
'
'
'
''
''
'
'
'
'
'
''
''
'
'
'
''
'
'
''
'
'
''
'
'
''
''
''
'
'
'
'
'
''
''
'
'
'
'
'
'
'
'
'
'
''
'
'
'
'
'
'
'
'
'
'''
'
'
'
' '
''
''
RE-536
RE-452
RE-403
RE-298
OT-49
OT-1
RL-23
RL-0.2
SK-1.8
TMB-19 RA-83RA-12
KA-10
LF-0.5BF-0.5RP-0.1WR-1
BRU-0.4
POP-0
BV-4
KN-0.2LE-0.2
SL-110
SL-38
SL-9SLB-1
UM-1365
UM-1292UM-1186 UM-1172
UM-982
UM-930UM-914
UM-895
UM-859UM-840
UM-826UM-815
LPR-3
SA-0
CR-0.2
RUM-34
RUM-0.6
MI-212MI-196
MI-133
MI-88MI-64
MI-3.5
PT-10
YM-0.5
RWR-1CO-0.5
CEC-23.2
WA-6BE-0
SC-111
SC-23
KE-11
SN-10
SUN-5
UM-738
UM-714
UM-698
VR-32.5
ST-18
CA-13
ZSF-5.7
WWR-26
GB-4.5
RT-3RO-0
PC-1.5
WDM-3 EDM-6
OK-25.6 CD-24CD-10SR-1.2
SC-17
Total Phosphorus
BE - Blue Earth RiverBF - Big Fork RiverBRU - Brule RiverBV - Beaver RiverCA - Cannon RiverCD - Cedar RiverCEC - Center CreekCO - Cottonwood RiverCR - Crow RiverEDM - De Moines River (E Fork)
GB - Garvin BrookKA - Kawishiwi RiverKE - Kettle RiverKN - Knife RiverLE - Lester RiverLF - Little Fork RiverLPR - Long Prairie RiverMI - Minnesota RiverOK - Okabena CreekOT - Otter Tail River
PC - Pipestone CreekPOP - Poplar RiverPT - Pomme De Terre RiverRA - Rainy RiverRE - Red RiverRL - Red Lake RiverRO - Rock RiverRP - Rapid RiverRT - Root RiverRUM - Rum River
RWR - Redwood RiverSA - Sauk RiverSC - St. Croix RiverSK - Snake RiverSL - St. Louis RiverSLB - St. Louis BaySN - Snake RiverSR - Shell Rock RiverST - Straight RiverSUN - Sunrise River
TMB - Two Rivers (Middle Branch)UM - Mississippi RiverVR - Vermillion RiverWA - Watonwan RiverWDM - Des Moines River (W Fork)WR - Winter Road RiverWWR - Whitewater RiverYM - Yellow Medicine RiverZSF - Zumbro River (S Fork)
´
TP mg/L' 0 - 0.04' 0.04 - 0.10' 0.10 - 0.15' 0.15 - 0.25' 0.25+
RiversBasin Boundaries
Recent 10-Year Median Pollutant Concentrations At Minnesota Milestone Sites
Milestone site designations referto rivers' names (see table at bottom)and approximate distances in miles
from rivers' mouths
21
'
'
'
'
''
''
'
'
'
'
'
''
''
'
'
'
''
'
'
''
'
'
''
'
'
''
''
''
'
'
'
'
'
''
''
'
'
'
'
'
'
'
'
'
'
''
'
'
'
'
'
'
'
'
'
'''
'
'
'
' '
''
''
RE-536
RE-452
RE-403
RE-298
OT-49
OT-1
RL-23
RL-0.2
SK-1.8
TMB-19 RA-83RA-12
KA-10
LF-0.5BF-0.5RP-0.1WR-1
BRU-0.4
POP-0
BV-4
KN-0.2LE-0.2
SL-110
SL-38
SL-9SLB-1
UM-1365
UM-1292UM-1186 UM-1172
UM-982
UM-930UM-914
UM-895
UM-859UM-840
UM-826UM-815
LPR-3
SA-0
CR-0.2
RUM-34
RUM-0.6
MI-212MI-196
MI-133
MI-88MI-64
MI-3.5
PT-10
YM-0.5
RWR-1CO-0.5
CEC-23.2
WA-6BE-0
SC-111
SC-23
KE-11
SN-10
SUN-5
UM-738
UM-714
UM-698
VR-32.5
ST-18
CA-13
ZSF-5.7
WWR-26
GB-4.5
RT-3RO-0
PC-1.5
WDM-3 EDM-6
OK-25.6 CD-24CD-10SR-1.2
SC-17
Nitrite/Nitrate
BE - Blue Earth RiverBF - Big Fork RiverBRU - Brule RiverBV - Beaver RiverCA - Cannon RiverCD - Cedar RiverCEC - Center CreekCO - Cottonwood RiverCR - Crow RiverEDM - De Moines River (E Fork)
GB - Garvin BrookKA - Kawishiwi RiverKE - Kettle RiverKN - Knife RiverLE - Lester RiverLF - Little Fork RiverLPR - Long Prairie RiverMI - Minnesota RiverOK - Okabena CreekOT - Otter Tail River
PC - Pipestone CreekPOP - Poplar RiverPT - Pomme De Terre RiverRA - Rainy RiverRE - Red RiverRL - Red Lake RiverRO - Rock RiverRP - Rapid RiverRT - Root RiverRUM - Rum River
RWR - Redwood RiverSA - Sauk RiverSC - St. Croix RiverSK - Snake RiverSL - St. Louis RiverSLB - St. Louis BaySN - Snake RiverSR - Shell Rock RiverST - Straight RiverSUN - Sunrise River
TMB - Two Rivers (Middle Branch)UM - Mississippi RiverVR - Vermillion RiverWA - Watonwan RiverWDM - Des Moines River (W Fork)WR - Winter Road RiverWWR - Whitewater RiverYM - Yellow Medicine RiverZSF - Zumbro River (S Fork)
´
NO2 + NO3 - N mg/L' 0 - 0.05' 0.05 - 0.15' 0.15 - 0.5' 0.5 - 4' 4+
RiversBasin Boundaries
Recent 10-Year Median Pollutant Concentrations At Minnesota Milestone Sites
Milestone site designations referto rivers' names (see table at bottom)and approximate distances in miles
from rivers' mouths
22

'
'
'
'
''
''
'
'
'
'
'
''
''
'
'
'
''
'
'
''
'
'
''
'
'
''
''
''
'
'
'
'
'
''
''
'
'
'
'
'
'
'
'
'
'
''
'
'
'
'
'
'
'
'
'
'''
'
'
'
' '
''
''
RE-536
RE-452
RE-403
RE-298
OT-49
OT-1
RL-23
RL-0.2
SK-1.8
TMB-19 RA-83RA-12
KA-10
LF-0.5BF-0.5RP-0.1WR-1
BRU-0.4
POP-0
BV-4
KN-0.2LE-0.2
SL-110
SL-38
SL-9SLB-1
UM-1365
UM-1292UM-1186 UM-1172
UM-982
UM-930UM-914
UM-895
UM-859UM-840
UM-826UM-815
LPR-3
SA-0
CR-0.2
RUM-34
RUM-0.6
MI-212MI-196
MI-133
MI-88MI-64
MI-3.5
PT-10
YM-0.5
RWR-1CO-0.5
CEC-23.2
WA-6BE-0
SC-111
SC-23
KE-11
SN-10
SUN-5
UM-738
UM-714
UM-698
VR-32.5
ST-18
CA-13
ZSF-5.7
WWR-26
GB-4.5
RT-3RO-0
PC-1.5
WDM-3 EDM-6
OK-25.6 CD-24CD-10SR-1.2
SC-17
Biochemical Oxygen Demand
BE - Blue Earth RiverBF - Big Fork RiverBRU - Brule RiverBV - Beaver RiverCA - Cannon RiverCD - Cedar RiverCEC - Center CreekCO - Cottonwood RiverCR - Crow RiverEDM - De Moines River (E Fork)
GB - Garvin BrookKA - Kawishiwi RiverKE - Kettle RiverKN - Knife RiverLE - Lester RiverLF - Little Fork RiverLPR - Long Prairie RiverMI - Minnesota RiverOK - Okabena CreekOT - Otter Tail River
PC - Pipestone CreekPOP - Poplar RiverPT - Pomme De Terre RiverRA - Rainy RiverRE - Red RiverRL - Red Lake RiverRO - Rock RiverRP - Rapid RiverRT - Root RiverRUM - Rum River
RWR - Redwood RiverSA - Sauk RiverSC - St. Croix RiverSK - Snake RiverSL - St. Louis RiverSLB - St. Louis BaySN - Snake RiverSR - Shell Rock RiverST - Straight RiverSUN - Sunrise River
TMB - Two Rivers (Middle Branch)UM - Mississippi RiverVR - Vermillion RiverWA - Watonwan RiverWDM - Des Moines River (W Fork)WR - Winter Road RiverWWR - Whitewater RiverYM - Yellow Medicine RiverZSF - Zumbro River (S Fork)
´
BOD mg/L' 0 - 0.9' 0.9 - 1.2' 1.2 - 1.8' 1.8 - 2.4' 2.4+
RiversBasin Boundaries
Milestone site designations referto rivers' names (see table at bottom)and approximate distances in miles
from rivers' mouths
Recent 10-Year Median Pollutant Concentrations At Minnesota Milestone Sites
23

'
'
'
'
''
''
'
'
'
'
'
''
''
'
'
'
''
'
'
''
'
'
''
'
'
''
''
''
'
'
'
'
'
''
''
'
'
'
'
'
'
'
'
'
'
''
'
'
'
'
'
'
'
'
'
'''
'
'
'
' '
''
''
RE-536
RE-452
RE-403
RE-298
OT-49
OT-1
RL-23
RL-0.2
SK-1.8
TMB-19 RA-83RA-12
KA-10
LF-0.5BF-0.5RP-0.1WR-1
BRU-0.4
POP-0
BV-4
KN-0.2LE-0.2
SL-110
SL-38
SL-9SLB-1
UM-1365
UM-1292UM-1186 UM-1172
UM-982
UM-930UM-914
UM-895
UM-859UM-840
UM-826UM-815
LPR-3
SA-0
CR-0.2
RUM-34
RUM-0.6
MI-212MI-196
MI-133
MI-88MI-64
MI-3.5
PT-10
YM-0.5
RWR-1CO-0.5
CEC-23.2
WA-6BE-0
SC-111
SC-23
KE-11
SN-10
SUN-5
UM-738
UM-714
UM-698
VR-32.5
ST-18
CA-13
ZSF-5.7
WWR-26
GB-4.5
RT-3RO-0
PC-1.5
WDM-3 EDM-6
OK-25.6 CD-24CD-10SR-1.2
SC-17
Chloride
BE - Blue Earth RiverBF - Big Fork RiverBRU - Brule RiverBV - Beaver RiverCA - Cannon RiverCD - Cedar RiverCEC - Center CreekCO - Cottonwood RiverCR - Crow RiverEDM - De Moines River (E Fork)
GB - Garvin BrookKA - Kawishiwi RiverKE - Kettle RiverKN - Knife RiverLE - Lester RiverLF - Little Fork RiverLPR - Long Prairie RiverMI - Minnesota RiverOK - Okabena CreekOT - Otter Tail River
PC - Pipestone CreekPOP - Poplar RiverPT - Pomme De Terre RiverRA - Rainy RiverRE - Red RiverRL - Red Lake RiverRO - Rock RiverRP - Rapid RiverRT - Root RiverRUM - Rum River
RWR - Redwood RiverSA - Sauk RiverSC - St. Croix RiverSK - Snake RiverSL - St. Louis RiverSLB - St. Louis BaySN - Snake RiverSR - Shell Rock RiverST - Straight RiverSUN - Sunrise River
TMB - Two Rivers (Middle Branch)UM - Mississippi RiverVR - Vermillion RiverWA - Watonwan RiverWDM - Des Moines River (W Fork)WR - Winter Road RiverWWR - Whitewater RiverYM - Yellow Medicine RiverZSF - Zumbro River (S Fork)
´
CL mg/L' 0 - 6' 6 - 12' 12 - 18' 18 - 30' 30+
RiversBasin Boundaries
Milestone site designations referto rivers' names (see table at bottom)and approximate distances in miles
from rivers' mouths
Recent 10-Year Median Pollutant Concentrations At Minnesota Milestone Sites
24

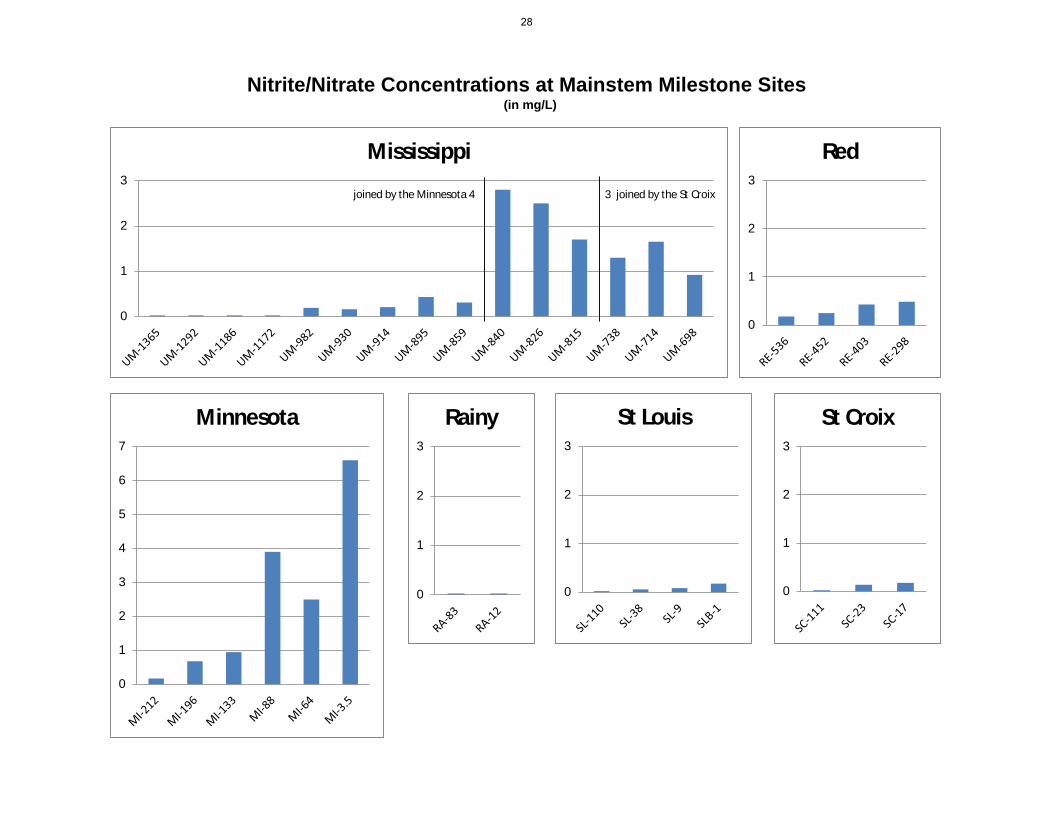
Longitudinal concentrations along mainstems The graphs that follow illustrate longitudinal changes in median pollutant concentrations along the Mississippi, Red, Minnesota, St. Louis, and St. Croix River mainstems, moving from upstream to downstream. Worth noting is the marked differences in pollutant concentrations among the different rivers, reflecting the different ecoregions in which they lie. Also worth noting is the marked increase in concentrations for certain pollutants in the Mississippi where the river enters the Twin Cities metropolitan area – between UM-895 in Monticello and UM-859 in Fridley – and/or where it is joined by the Minnesota River – between UM-859 in Fridley and UM-840 in St. Paul.
25

Total Suspended Solids Concentrationsat Mainstem Milestone Sites
(in mg/L)
0
50
100
150
200
250
Red
0
20
40
60
80
100
Mississippi
0
20
40
60
80
100
Minnesota
0
20
40
60
80
100
St Croix
0
20
40
60
80
100
St Louis
0
20
40
60
80
100
Rainy
joined by the Minnesota 4 3joined by the St Croix
26

Total Phosphorus Concentrations at Mainstem Milestone Sites (in mg/L)
0.0
0.1
0.2
0.3
0.4
0.5
Red
0.0
0.1
0.2
0.3
0.4
0.5
Mississippi
0.0
0.1
0.2
0.3
0.4
0.5
MI-212MI-196MI-133 MI-88 MI-64 MI-3.5
Minnesota
0.0
0.1
0.2
0.3
0.4
0.5
St Croix
0.0
0.1
0.2
0.3
0.4
0.5
St Louis
0.0
0.1
0.2
0.3
0.4
0.5
Rainy
joined by the Minnesota 4 3joined by the St Croix
27
Nitrite/Nitrate Concentrations at Mainstem Milestone Sites (in mg/L)
0
1
2
3
Red
0
1
2
3
Mississippi
0
1
2
3
4
5
6
7
Minnesota
0
1
2
3
St Croix
0
1
2
3
St Louis
0
1
2
3
Rainy
joined by the Minnesota 4 3joined by the St Croix
28

Biochemical Oxygen Demand Concentrations at Mainstem Milestone Sites (in mg/L)
0
1
2
3
4
5
Red
0
1
2
3
4
5
Mississippi
0
1
2
3
4
5
Minnesota
0
1
2
3
4
5
St Croix
0
1
2
3
4
5
St Louis
0
1
2
3
4
5
Rainy
joined by the Minnesota 4 3joined by the St Croix
29

Chloride Concentrations at Mainstem Milestone Sites (in mg/L)
0
10
20
30
40
50
60
Red
0
10
20
30
40
50
60
Mississippi
0
10
20
30
40
50
60
MI-212MI-196MI-133 MI-88 MI-64 MI-3.5
Minnesota
0
10
20
30
40
50
60
St Croix
0
10
20
30
40
50
60
St Louis
0
10
20
30
40
50
60
Rainy
joined by the Minnesota 4 3joined by the St Croix
30
Detailed trends and concentrations at individual milestone sites The tables that follow show estimated changes in pollutant concentrations, both over the entire period of record for each site and over the 15-year period from 1995 to 2010, as well as median pollutant concentrations for the initial and most recent 10 years. Sites are arranged by major river basins, from northwest to southeast across the state, and, within the basins, showing first the mainstem (if present) from upstream to downstream and then the tributaries to the mainstem.
31

Red River of the North BasinTotal Biochemical
Suspended Total Nitrite/ OxygenSolids Phosphorus Nitrate Ammonia Demand Chloride
Red River at Bridge on CSAH-18, 0.5 Mi W of Brushvale (S000-012)(RE-536) (period of record 1953 - 2009)
overall trend no trend no trend increase no trend decrease increase estimated average annual change 1.4% -0.7% 3.1%
estimated total change 63% -33% 448%
1995 - 2009 trend increase increase no trend no trend no trend increase estimated average annual change 4.7% 5.7% 1.7%
estimated total change 58% 75% 23%
median concentrations first 10 years 68 0.3 0.1 0.12 3 3
median concentrations most recent 10 years 74 0.3 0.2 <0.05 3 15
Red River at Bridge on Main Ave at 3rd St. in Moorhead (S000-183)(RE-452) (period of record 1971 - 2009)
overall trend increase no trend increase no trend decrease increase estimated average annual change 2.3% 2.0% -1.8% 2.1%
estimated total change 135% 94% -47% 118%
1995 - 2009 trend no trend no trend no trend no trend no trend no trend estimated average annual change
estimated total change
median concentrations first 10 years 55 0.2 0.1 0.10 3 10
median concentrations most recent 10 years 120 0.3 0.3 <0.05 2 17
Red River at Bridge on CSAH-39, 1 Mi W of Perley (S000-113)(RE-403) (period of record 1967 - 2010)
overall trend increase decrease increase decrease decrease no trend estimated average annual change 1.1% -0.5% 2.3% -5.6% -2.0%
estimated total change 63% -19% 115% -84% -59%
1995 - 2010 trend no trend no trend no trend no trend decrease no trend estimated average annual change -3.2%
estimated total change -43%
median concentrations first 10 years 170 0.5 0.3 0.15 4 19
median concentrations most recent 10 years 230 0.5 0.4 0.05 2 18
Red River at Bridge 50' Upstream of Red Lake R Confl (S001-222)(RE-298) (period of record 1953 - 2010)
overall trend increase no trend increase decrease decrease increase estimated average annual change 1.2% 3.4% -5.2% -1.5% 1.0%
estimated total change 94% 212% -82% -59% 75%
1995 - 2010 trend no trend no trend no trend no trend decrease no trend estimated average annual change -3.0%
estimated total change -40%
median concentrations first 10 years 118 0.3 0.3 0.09 3 10
median concentrations most recent 10 years 160 0.4 0.5 <0.05 1 19
32
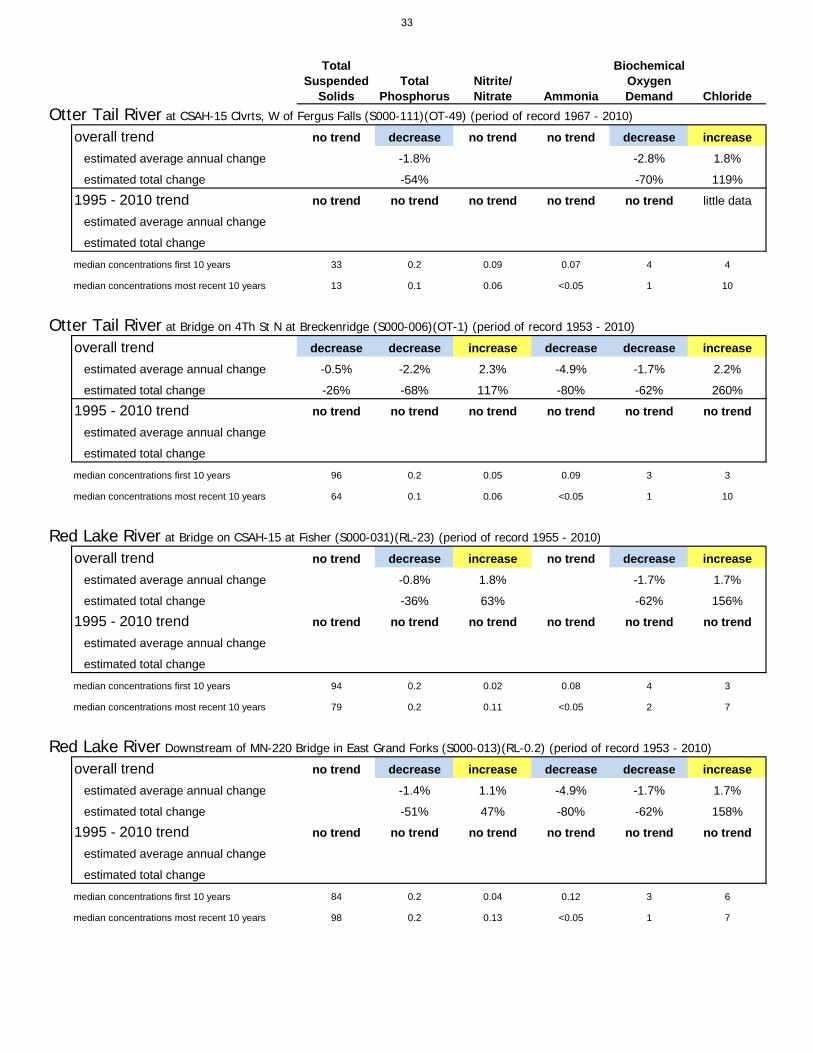
Total BiochemicalSuspended Total Nitrite/ Oxygen
Solids Phosphorus Nitrate Ammonia Demand ChlorideOtter Tail River at CSAH-15 Clvrts, W of Fergus Falls (S000-111)(OT-49) (period of record 1967 - 2010)
overall trend no trend decrease no trend no trend decrease increase estimated average annual change -1.8% -2.8% 1.8%
estimated total change -54% -70% 119%
1995 - 2010 trend no trend no trend no trend no trend no trend little data
estimated average annual change
estimated total change
median concentrations first 10 years 33 0.2 0.09 0.07 4 4
median concentrations most recent 10 years 13 0.1 0.06 <0.05 1 10
Otter Tail River at Bridge on 4Th St N at Breckenridge (S000-006)(OT-1) (period of record 1953 - 2010)
overall trend decrease decrease increase decrease decrease increase estimated average annual change -0.5% -2.2% 2.3% -4.9% -1.7% 2.2%
estimated total change -26% -68% 117% -80% -62% 260%
1995 - 2010 trend no trend no trend no trend no trend no trend no trend estimated average annual change
estimated total change
median concentrations first 10 years 96 0.2 0.05 0.09 3 3
median concentrations most recent 10 years 64 0.1 0.06 <0.05 1 10
Red Lake River at Bridge on CSAH-15 at Fisher (S000-031)(RL-23) (period of record 1955 - 2010)
overall trend no trend decrease increase no trend decrease increase estimated average annual change -0.8% 1.8% -1.7% 1.7%
estimated total change -36% 63% -62% 156%
1995 - 2010 trend no trend no trend no trend no trend no trend no trend estimated average annual change
estimated total change
median concentrations first 10 years 94 0.2 0.02 0.08 4 3
median concentrations most recent 10 years 79 0.2 0.11 <0.05 2 7
Red Lake River Downstream of MN-220 Bridge in East Grand Forks (S000-013)(RL-0.2) (period of record 1953 - 2010)
overall trend no trend decrease increase decrease decrease increase estimated average annual change -1.4% 1.1% -4.9% -1.7% 1.7%
estimated total change -51% 47% -80% -62% 158%
1995 - 2010 trend no trend no trend no trend no trend no trend no trend estimated average annual change
estimated total change
median concentrations first 10 years 84 0.2 0.04 0.12 3 6
median concentrations most recent 10 years 98 0.2 0.13 <0.05 1 7
33

Total BiochemicalSuspended Total Nitrite/ Oxygen
Solids Phosphorus Nitrate Ammonia Demand ChlorideSnake River at Bridge on MN-220 N of Big Woods (S000-185)(SK-1.8) (period of record 1971 - 2010)
overall trend no trend decrease no trend decrease decrease no trend estimated average annual change -0.7% -5.3% -1.7%
estimated total change -24% -88% -49%
1995 - 2010 trend no trend decrease no trend no trend no trend decrease estimated average annual change -1.3% -4.8%
estimated total change -22% -60%
median concentrations first 10 years 47 0.3 <0.01 0.25 4 22
median concentrations most recent 10 years 70 0.3 <0.05 <0.05 2 14
Two Rivers on US-75, 1 Mi N of Hallock (S000-186)(TMB-19) (period of record 1971 - 2010)
overall trend no trend decrease no trend no trend decrease no trend estimated average annual change -2.1% -3.5%
estimated total change -57% -75%
1995 - 2010 trend no trend no trend no trend no trend no trend no trend estimated average annual change
estimated total change
median concentrations first 10 years 24 0.3 <0.01 0.10 3 22
median concentrations most recent 10 years 30 0.2 0.08 <0.05 2 17
34
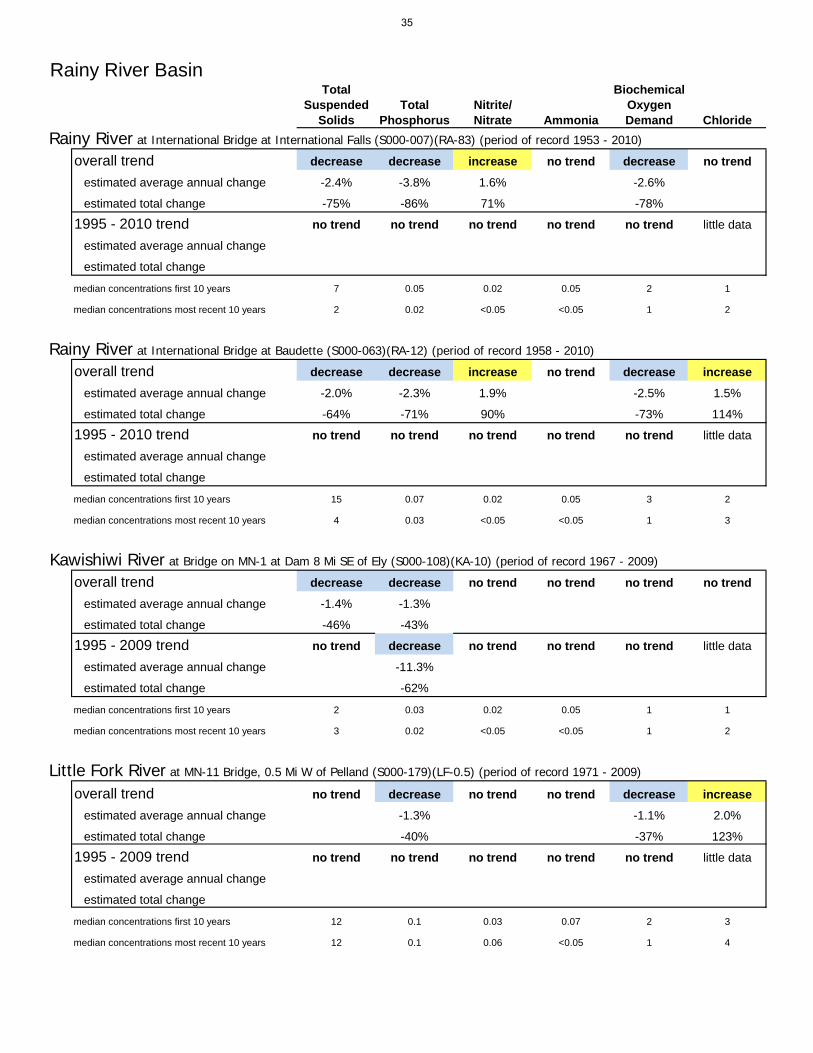
Rainy River BasinTotal Biochemical
Suspended Total Nitrite/ OxygenSolids Phosphorus Nitrate Ammonia Demand Chloride
Rainy River at International Bridge at International Falls (S000-007)(RA-83) (period of record 1953 - 2010)
overall trend decrease decrease increase no trend decrease no trend estimated average annual change -2.4% -3.8% 1.6% -2.6%
estimated total change -75% -86% 71% -78%
1995 - 2010 trend no trend no trend no trend no trend no trend little data
estimated average annual change
estimated total change
median concentrations first 10 years 7 0.05 0.02 0.05 2 1
median concentrations most recent 10 years 2 0.02 <0.05 <0.05 1 2
Rainy River at International Bridge at Baudette (S000-063)(RA-12) (period of record 1958 - 2010)
overall trend decrease decrease increase no trend decrease increase estimated average annual change -2.0% -2.3% 1.9% -2.5% 1.5%
estimated total change -64% -71% 90% -73% 114%
1995 - 2010 trend no trend no trend no trend no trend no trend little data
estimated average annual change
estimated total change
median concentrations first 10 years 15 0.07 0.02 0.05 3 2
median concentrations most recent 10 years 4 0.03 <0.05 <0.05 1 3
Kawishiwi River at Bridge on MN-1 at Dam 8 Mi SE of Ely (S000-108)(KA-10) (period of record 1967 - 2009)
overall trend decrease decrease no trend no trend no trend no trend estimated average annual change -1.4% -1.3%
estimated total change -46% -43%
1995 - 2009 trend no trend decrease no trend no trend no trend little data
estimated average annual change -11.3%
estimated total change -62%
median concentrations first 10 years 2 0.03 0.02 0.05 1 1
median concentrations most recent 10 years 3 0.02 <0.05 <0.05 1 2
Little Fork River at MN-11 Bridge, 0.5 Mi W of Pelland (S000-179)(LF-0.5) (period of record 1971 - 2009)
overall trend no trend decrease no trend no trend decrease increase estimated average annual change -1.3% -1.1% 2.0%
estimated total change -40% -37% 123%
1995 - 2009 trend no trend no trend no trend no trend no trend little data
estimated average annual change
estimated total change
median concentrations first 10 years 12 0.1 0.03 0.07 2 3
median concentrations most recent 10 years 12 0.1 0.06 <0.05 1 4
35
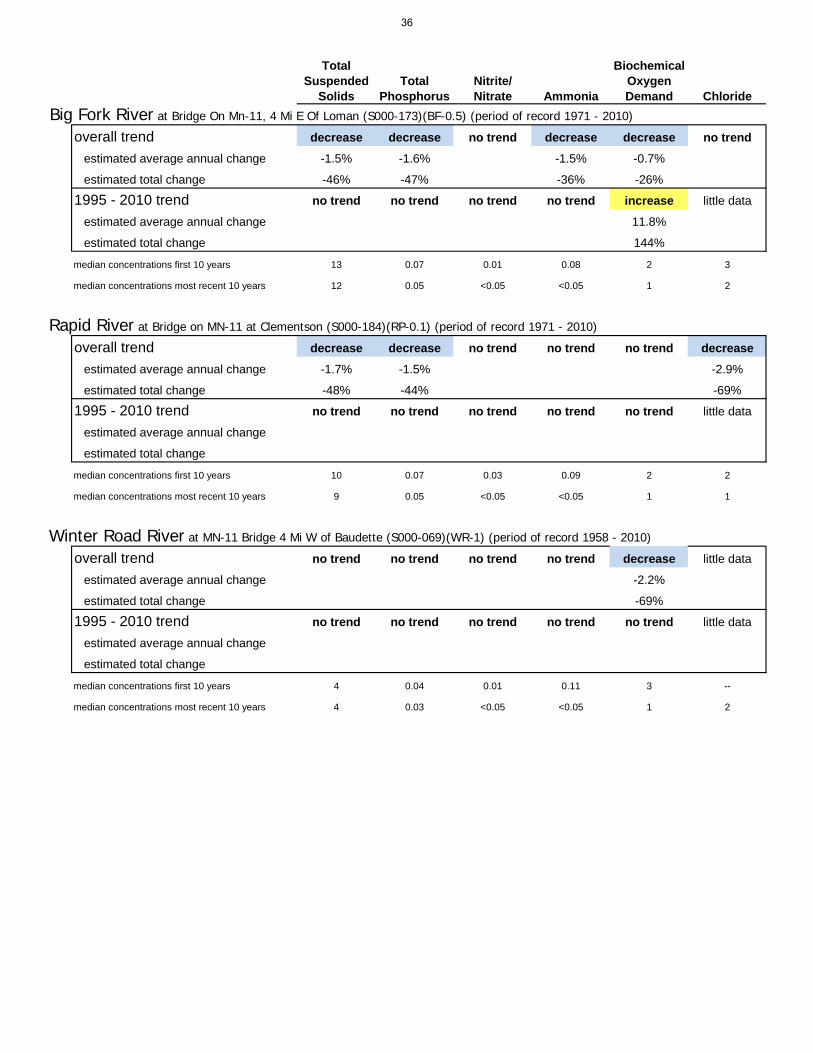
Total BiochemicalSuspended Total Nitrite/ Oxygen
Solids Phosphorus Nitrate Ammonia Demand ChlorideBig Fork River at Bridge On Mn-11, 4 Mi E Of Loman (S000-173)(BF-0.5) (period of record 1971 - 2010)
overall trend decrease decrease no trend decrease decrease no trend estimated average annual change -1.5% -1.6% -1.5% -0.7%
estimated total change -46% -47% -36% -26%
1995 - 2010 trend no trend no trend no trend no trend increase little data
estimated average annual change 11.8%
estimated total change 144%
median concentrations first 10 years 13 0.07 0.01 0.08 2 3
median concentrations most recent 10 years 12 0.05 <0.05 <0.05 1 2
Rapid River at Bridge on MN-11 at Clementson (S000-184)(RP-0.1) (period of record 1971 - 2010)
overall trend decrease decrease no trend no trend no trend decrease estimated average annual change -1.7% -1.5% -2.9%
estimated total change -48% -44% -69%
1995 - 2010 trend no trend no trend no trend no trend no trend little data
estimated average annual change
estimated total change
median concentrations first 10 years 10 0.07 0.03 0.09 2 2
median concentrations most recent 10 years 9 0.05 <0.05 <0.05 1 1
Winter Road River at MN-11 Bridge 4 Mi W of Baudette (S000-069)(WR-1) (period of record 1958 - 2010)
overall trend no trend no trend no trend no trend decrease little data
estimated average annual change -2.2%
estimated total change -69%
1995 - 2010 trend no trend no trend no trend no trend no trend little data
estimated average annual change
estimated total change
median concentrations first 10 years 4 0.04 0.01 0.11 3 --
median concentrations most recent 10 years 4 0.03 <0.05 <0.05 1 2
36
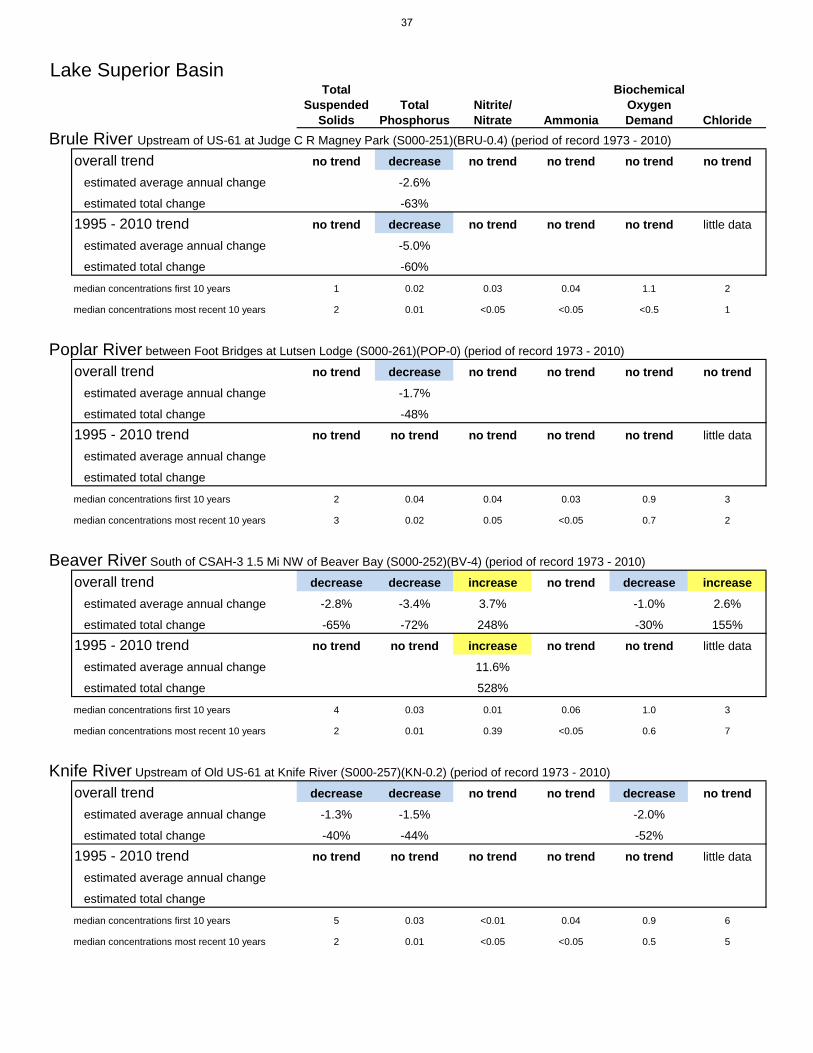
Lake Superior BasinTotal Biochemical
Suspended Total Nitrite/ OxygenSolids Phosphorus Nitrate Ammonia Demand Chloride
Brule River Upstream of US-61 at Judge C R Magney Park (S000-251)(BRU-0.4) (period of record 1973 - 2010)
overall trend no trend decrease no trend no trend no trend no trend estimated average annual change -2.6%
estimated total change -63%
1995 - 2010 trend no trend decrease no trend no trend no trend little data
estimated average annual change -5.0%
estimated total change -60%
median concentrations first 10 years 1 0.02 0.03 0.04 1.1 2
median concentrations most recent 10 years 2 0.01 <0.05 <0.05 <0.5 1
Poplar River between Foot Bridges at Lutsen Lodge (S000-261)(POP-0) (period of record 1973 - 2010)
overall trend no trend decrease no trend no trend no trend no trend estimated average annual change -1.7%
estimated total change -48%
1995 - 2010 trend no trend no trend no trend no trend no trend little data
estimated average annual change
estimated total change
median concentrations first 10 years 2 0.04 0.04 0.03 0.9 3
median concentrations most recent 10 years 3 0.02 0.05 <0.05 0.7 2
Beaver River South of CSAH-3 1.5 Mi NW of Beaver Bay (S000-252)(BV-4) (period of record 1973 - 2010)
overall trend decrease decrease increase no trend decrease increase estimated average annual change -2.8% -3.4% 3.7% -1.0% 2.6%
estimated total change -65% -72% 248% -30% 155%
1995 - 2010 trend no trend no trend increase no trend no trend little data
estimated average annual change 11.6%
estimated total change 528%
median concentrations first 10 years 4 0.03 0.01 0.06 1.0 3
median concentrations most recent 10 years 2 0.01 0.39 <0.05 0.6 7
Knife River Upstream of Old US-61 at Knife River (S000-257)(KN-0.2) (period of record 1973 - 2010)
overall trend decrease decrease no trend no trend decrease no trend estimated average annual change -1.3% -1.5% -2.0%
estimated total change -40% -44% -52%
1995 - 2010 trend no trend no trend no trend no trend no trend little data
estimated average annual change
estimated total change
median concentrations first 10 years 5 0.03 <0.01 0.04 0.9 6
median concentrations most recent 10 years 2 0.01 <0.05 <0.05 0.5 5
37

Total BiochemicalSuspended Total Nitrite/ Oxygen
Solids Phosphorus Nitrate Ammonia Demand ChlorideLester River above Superior St, Lester Pk at Duluth (S000-258)(LE-0.2) (period of record 1973 - 2010)
overall trend decrease decrease no trend no trend no trend increase estimated average annual change -1.6% -1.7% 2.0%
estimated total change -45% -48% 112%
1995 - 2010 trend no trend no trend no trend no trend no trend little data
estimated average annual change
estimated total change
median concentrations first 10 years 5 0.04 0.03 0.07 1.0 5
median concentrations most recent 10 years 2 0.02 <0.05 <0.05 0.8 11
St. Louis River at Bridge at CSAH-7, 0.5 Mi S of Forbes (S000-119)(SL-110) (period of record 1967 - 2010)
overall trend decrease decrease no trend decrease decrease little data
estimated average annual change -1.7% -1.9% -4.4% -1.6%
estimated total change -52% -58% -77% -50%
1995 - 2010 trend no trend decrease decrease no trend no trend little data
estimated average annual change -3.2% -0.9%
estimated total change -42% -15%
median concentrations first 10 years 6 0.04 0.04 0.08 1.2 6
median concentrations most recent 10 years 4 0.03 <0.05 <0.05 0.8 6
St. Louis River at Bridge on US-2, 2 Mi SE of Brookston (S000-023)(SL-38) (period of record 1953 - 2010)
overall trend decrease decrease no trend decrease decrease increase estimated average annual change -1.1% -2.3% -4.8% -1.6% 1.5%
estimated total change -49% -67% -79% -61% 101%
1995 - 2010 trend no trend no trend no trend no trend no trend little data
estimated average annual change
estimated total change
median concentrations first 10 years 13 0.11 0.08 0.08 3 2
median concentrations most recent 10 years 4 0.04 0.06 <0.05 1 5
St. Louis River at Bridge on MN-23 at Fond Du Lac (S000-021)(SL-9) (period of record 1953 - 2010)
overall trend decrease decrease no trend decrease decrease decrease estimated average annual change -2.5% -3.4% -3.1% -4.9% -1.5%
estimated total change -77% -83% -69% -95% -58%
1995 - 2010 trend decrease no trend no trend no trend no trend little data
estimated average annual change -2.3%
estimated total change -32%
median concentrations first 10 years 13 0.12 0.06 0.10 5 7
median concentrations most recent 10 years 5 0.04 0.09 <0.05 1 7
38
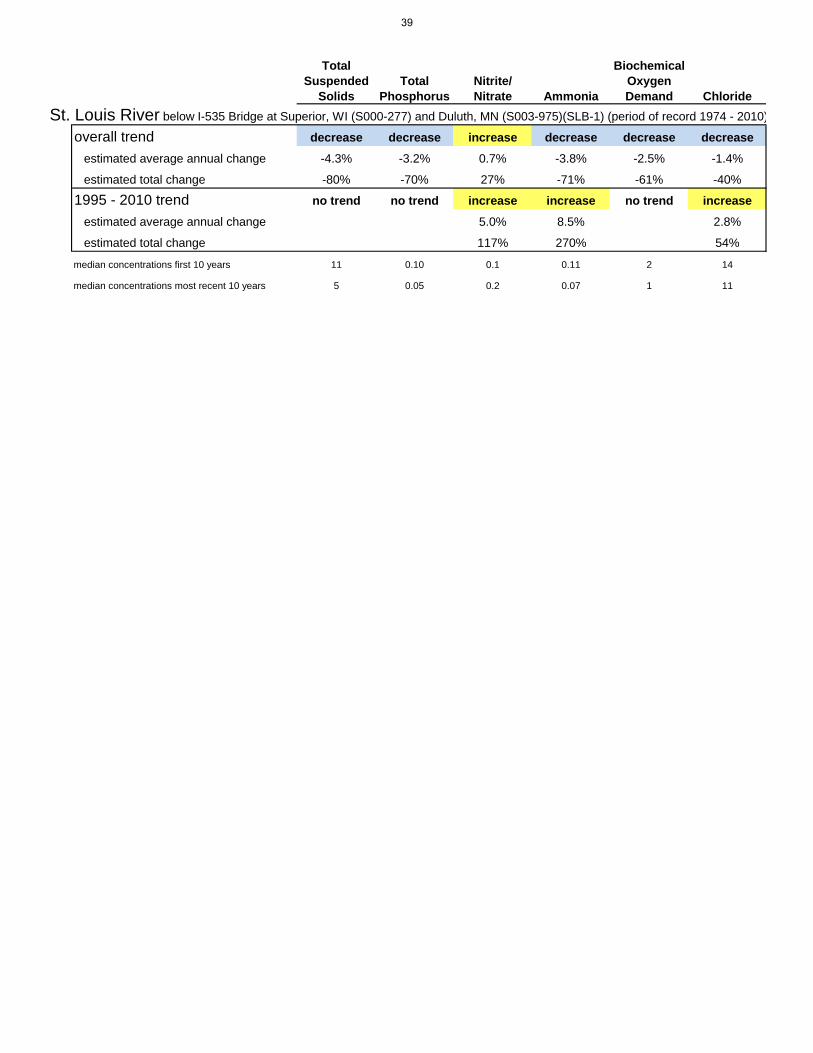
Total BiochemicalSuspended Total Nitrite/ Oxygen
Solids Phosphorus Nitrate Ammonia Demand ChlorideSt. Louis River below I-535 Bridge at Superior, WI (S000-277) and Duluth, MN (S003-975)(SLB-1) (period of record 1974 - 2010)
overall trend decrease decrease increase decrease decrease decrease estimated average annual change -4.3% -3.2% 0.7% -3.8% -2.5% -1.4%
estimated total change -80% -70% 27% -71% -61% -40%
1995 - 2010 trend no trend no trend increase increase no trend increase estimated average annual change 5.0% 8.5% 2.8%
estimated total change 117% 270% 54%
median concentrations first 10 years 11 0.10 0.1 0.11 2 14
median concentrations most recent 10 years 5 0.05 0.2 0.07 1 11
39

Upper Mississippi River BasinTotal Biochemical
Suspended Total Nitrite/ OxygenSolids Phosphorus Nitrate Ammonia Demand Chloride
Mississippi River at MN-200 Bridge 0.5 Mi W of Lake Itasca (S000-105)(UM-1365) (period of record 1965 - 2010)
overall trend decrease decrease no trend no trend decrease no trend estimated average annual change -1.9% -1.4% -2.2%
estimated total change -59% -47% -64%
1995 - 2010 trend no trend increase no trend no trend no trend little data
estimated average annual change 2.0%
estimated total change 40%
median concentrations first 10 years 4 0.06 <0.01 0.06 2 3
median concentrations most recent 10 years 2 0.05 <0.05 <0.05 1 2
Mississippi River at Bridge on CSAH-8 7 Mi E of Bemidji (S000-155)(UM-1292) (period of record 1967 - 2010)
overall trend decrease decrease no trend decrease decrease increase estimated average annual change -2.7% -4.8% -2.6% -2.2% 0.5%
estimated total change -70% -88% -56% -62% 24%
1995 - 2010 trend no trend no trend no trend no trend no trend little data
estimated average annual change
estimated total change
median concentrations first 10 years 5 0.09 0.01 0.07 3 4
median concentrations most recent 10 years 1 0.03 <0.05 <0.05 1 7
Mississippi River at MN-6 Bridge 8 Mi SW of Cohasset (S000-154)(UM-1186) (period of record 1967 - 2010)
overall trend decrease decrease no trend decrease decrease increase estimated average annual change -2.1% -1.6% -4.1% -2.7% 0.2%
estimated total change -59% -51% -74% -69% 9%
1995 - 2010 trend no trend no trend no trend no trend no trend little data
estimated average annual change
estimated total change
median concentrations first 10 years 7 0.05 <0.01 0.10 2 3
median concentrations most recent 10 years 2 0.03 <0.05 <0.05 1 3
Mississippi River at Bridge on CR-441 1 Mi SW of Blackberry (S000-220)(UM-1172) (period of record 1974 - 2010)
overall trend decrease decrease no trend decrease decrease no trend estimated average annual change -2.2% -2.0% -4.2% -2.7%
estimated total change -56% -52% -70% -63%
1995 - 2010 trend decrease decrease no trend no trend no trend little data
estimated average annual change -2.7% -2.0%
estimated total change -37% -29%
median concentrations first 10 years 8 0.09 0.02 0.10 2 4
median concentrations most recent 10 years 3 0.04 <0.05 <0.05 1 5
40

Total BiochemicalSuspended Total Nitrite/ Oxygen
Solids Phosphorus Nitrate Ammonia Demand ChlorideMississippi River at Bridge on MN-115 at Camp Ripley (S000-151)(UM-982) (period of record 1967 - 2010)
overall trend decrease decrease increase decrease decrease increase estimated average annual change -1.0% -2.0% 4.8% -3.3% -2.3% 2.7%
estimated total change -35% -59% 399% -66% -63% 216%
1995 - 2010 trend no trend no trend no trend no trend no trend little data
estimated average annual change
estimated total change
median concentrations first 10 years 8 0.07 0.07 0.08 2 4
median concentrations most recent 10 years 5 0.05 0.19 <0.05 1 9
Mississippi River at 9th Ave Bridge (Old MN-15) at Sauk Rapids (S000-026)(UM-930) (period of record 1953 - 2010)
overall trend decrease decrease increase decrease decrease increase estimated average annual change -2.0% -1.4% 2.3% -4.3% -1.8% 3.8%
estimated total change -68% -53% 116% -75% -65% 762%
1995 - 2010 trend no trend no trend increase no trend no trend little data
estimated average annual change 3.3%
estimated total change 73%
median concentrations first 10 years 22 0.14 0.07 0.09 3 2
median concentrations most recent 10 years 7 0.08 0.16 <0.05 1 9
Mississippi River at Bridge on MN-24 at Clearwater (S000-148)(UM-914) (period of record 1967 - 2010)
overall trend no trend decrease increase decrease decrease increase estimated average annual change -1.6% 2.8% -4.1% -2.0% 3.7%
estimated total change -51% 161% -74% -58% 387%
1995 - 2010 trend no trend no trend increase no trend no trend little data
estimated average annual change 4.6%
estimated total change 96%
median concentrations first 10 years 11 0.11 0.1 0.10 3 5
median concentrations most recent 10 years 8 0.07 0.2 <0.05 2 11
Mississippi River at Bridge on MN-25 at Monticello (S000-221)(UM-895) (period of record 1976 - 2010)
overall trend decrease decrease increase decrease decrease no trend estimated average annual change -1.3% -2.1% 4.7% -5.2% -1.1%
estimated total change -37% -51% 372% -82% -32%
1995 - 2010 trend decrease no trend increase no trend no trend little data
estimated average annual change -3.0% 4.1%
estimated total change -40% 97%
median concentrations first 10 years 15 0.12 0.2 0.10 2 8
median concentrations most recent 10 years 8 0.09 0.4 <0.05 2 12
41

Total BiochemicalSuspended Total Nitrite/ Oxygen
Solids Phosphorus Nitrate Ammonia Demand ChlorideMississippi River at Mpls City Building at Fridley (S000-024)(UM-859) (period of record 1953 - 2010)
overall trend decrease decrease increase decrease decrease increase estimated average annual change -0.9% -1.4% 2.0% -3.8% -1.1% 4.1%
estimated total change -40% -45% 95% -73% -46% 931%
1995 - 2010 trend decrease no trend no trend no trend no trend little data
estimated average annual change -4.2%
estimated total change -52%
median concentrations first 10 years 33 0.2 0.2 0.10 3 1
median concentrations most recent 10 years 19 0.1 0.3 <0.05 2 25
Mississippi River at Dock Upstream of Wabasha St Bridge, St Paul (S000-266)(UM-840) (period of record 1973 - 2010)
overall trend no trend decrease increase decrease decrease increase estimated average annual change -1.0% 3.0% -6.7% -1.4% 2.4%
estimated total change -30% 186% -89% -41% 137%
1995 - 2010 trend decrease decrease no trend no trend no trend little data
estimated average annual change -3.3% -2.2%
estimated total change -43% -32%
median concentrations first 10 years 34 0.2 2 0.18 3 16
median concentrations most recent 10 years 68 0.2 3 <0.05 2 25
Mississippi River at Pier at Gravel Quarry, Grey Cloud Island (S000-339)(UM-826) (period of record 1975 - 2010)
overall trend no trend decrease increase decrease decrease increase estimated average annual change -1.7% 3.7% -8.5% -2.4% 1.0%
estimated total change -46% 270% -96% -59% 44%
1995 - 2010 trend decrease decrease increase no trend decrease little data
estimated average annual change -2.2% -3.5% 1.8% -1.7%
estimated total change -32% -46% 36% -26%
median concentrations first 10 years 37 0.3 2 0.48 4 25
median concentrations most recent 10 years 48 0.2 3 0.08 2 31
Mississippi River at Lock & Dam #2 at Hastings (S000-068)(UM-815) (period of record 1958 - 2010)
overall trend decrease decrease increase decrease decrease increase estimated average annual change -0.4% -1.6% 2.2% -6.2% -2.2% 2.9%
estimated total change -20% -58% 109% -96% -68% 321%
1995 - 2010 trend decrease decrease no trend no trend no trend little data
estimated average annual change -3.4% -3.2%
estimated total change -44% -43%
median concentrations first 10 years 44 0.3 1 0.27 6 13
median concentrations most recent 10 years 42 0.2 2 0.05 3 28
42

Total BiochemicalSuspended Total Nitrite/ Oxygen
Solids Phosphorus Nitrate Ammonia Demand ChlorideLong Prairie River at Bridge on US-10, South of Motley (S000-282)(LPR-3) (period of record 1974 -- 2010)
overall trend decrease no trend increase decrease decrease increase estimated average annual change -1.4% 0.8% -3.6% -0.7% 2.9%
estimated total change -40% 29% -69% -23% 178%
1995 - 2010 trend no trend no trend no trend no trend decrease little data
estimated average annual change -2.0%
estimated total change -28%
median concentrations first 10 years 5 0.08 0.05 0.09 1 8
median concentrations most recent 10 years 3 0.09 0.10 <0.05 1 25
Sauk River Downstream of Bridge on CSAH-1 at Sauk Rapids (S000-017)(SA-0) (period of record 1953 - 2011)
overall trend no trend decrease increase decrease no trend increase estimated average annual change -1.5% 2.1% -4.5% 3.8%
estimated total change -44% 131% -85% 796%
1995 - 2010 trend no trend no trend increase no trend no trend little data
estimated average annual change 3.4%
estimated total change 80%
median concentrations first 10 years 23 0.3 0.4 0.14 4 3
median concentrations most recent 10 years 9 0.2 0.4 <0.05 2 32
Crow River at Bridge on CSAH-36 at Dayton (S000-004)(CR-0.2) (period of record 1953 - 2009)
overall trend no trend no trend increase no trend no trend increase estimated average annual change 3.0% 1.4%
estimated total change 371% 125%
1995 - 2009 trend decrease no trend no trend no trend no trend no trend estimated average annual change -2.9%
estimated total change -35%
median concentrations first 10 years 80 0.3 0.1 0.13 7 8
median concentrations most recent 10 years 51 0.3 0.7 <0.05 6 33
Rum River at Bridge on CSAH-5, 0.5 Mi W of Isanti (S000-043)(RUM-34) (period of record 1955 - 2010)
overall trend decrease decrease increase decrease decrease increase estimated average annual change -1.6% -0.9% 1.1% -4.4% -2.4% 2.6%
estimated total change -58% -37% 44% -77% -75% 303%
1995 - 2010 trend no trend no trend no trend no trend no trend little data
estimated average annual change
estimated total change
median concentrations first 10 years 23 0.2 0.1 0.10 6 4
median concentrations most recent 10 years 14 0.1 0.2 <0.05 2 12
43
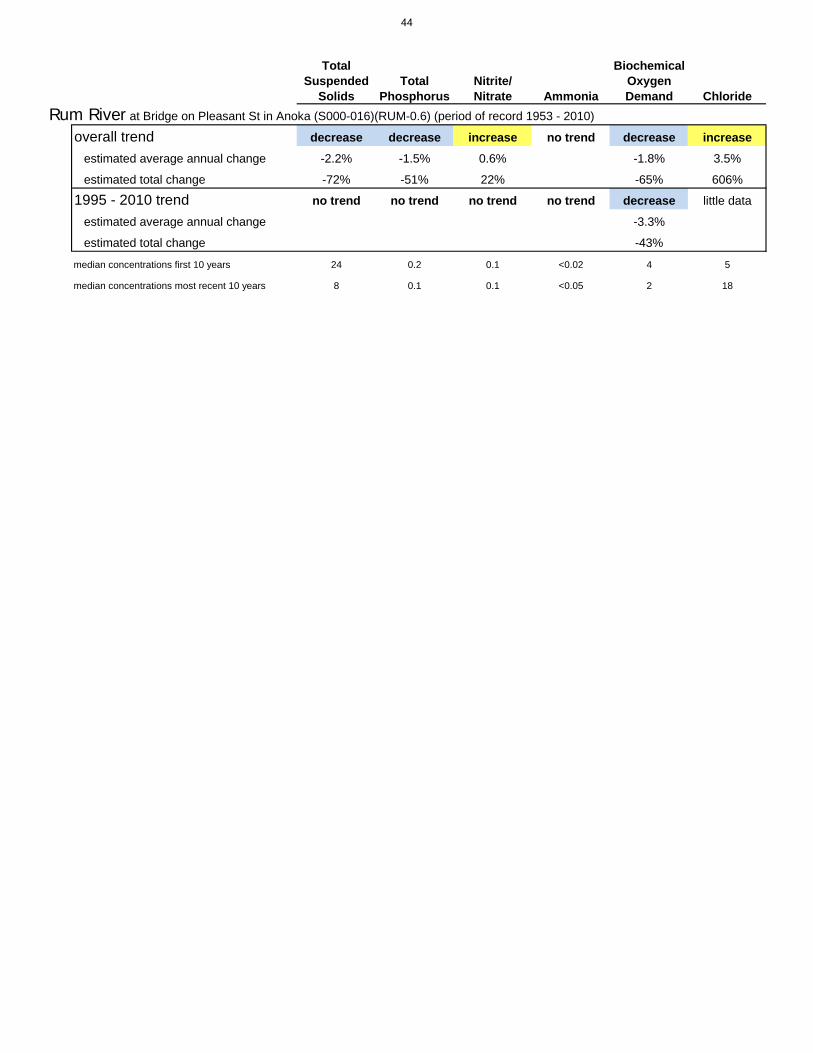
Total BiochemicalSuspended Total Nitrite/ Oxygen
Solids Phosphorus Nitrate Ammonia Demand ChlorideRum River at Bridge on Pleasant St in Anoka (S000-016)(RUM-0.6) (period of record 1953 - 2010)
overall trend decrease decrease increase no trend decrease increase estimated average annual change -2.2% -1.5% 0.6% -1.8% 3.5%
estimated total change -72% -51% 22% -65% 606%
1995 - 2010 trend no trend no trend no trend no trend decrease little data
estimated average annual change -3.3%
estimated total change -43%
median concentrations first 10 years 24 0.2 0.1 <0.02 4 5
median concentrations most recent 10 years 8 0.1 0.1 <0.05 2 18
44

Minnesota River BasinTotal Biochemical
Suspended Total Nitrite/ OxygenSolids Phosphorus Nitrate Ammonia Demand Chloride
Minnesota River at Bridge on CSAH-21, 3 Mi NE of Delhi (S000-055)(MI-212) (period of record 1981 - 2009)
overall trend decrease decrease no trend decrease no trend little data
estimated average annual change -1.4% -0.8% -5.2%
estimated total change -32% -20% -77%
1995 - 2009 trend decrease decrease decrease no trend increase little data
estimated average annual change -4.2% -3.4% -6.6% 4.3%
estimated total change -49% -43% -67% 97%
median concentrations first 10 years 84 0.2 1.0 0.08 5 --
median concentrations most recent 10 years 54 0.2 0.2 <0.05 4 22
Minnesota River at Bridge on US-71 and MN-19 at Morton (S000-145)(MI-196) (period of record 1967 - 2009)
overall trend no trend decrease no trend decrease decrease increase estimated average annual change -0.5% -6.5% -1.2% 2.5%
estimated total change -20% -88% -40% 182%
1995 - 2009 trend no trend no trend no trend no trend increase little data
estimated average annual change 4.8%
estimated total change 110%
median concentrations first 10 years 86 0.3 1.4 0.11 5 18
median concentrations most recent 10 years 68 0.2 0.7 <0.05 4 26
Minnesota River at CSAH-24 Bridge, 1 Mi S of Courtland (S000-054)(MI-133) (period of record 1957 - 2009)
overall trend decrease decrease no trend decrease decrease increase estimated average annual change -0.7% -1.0% -5.0% -1.6% 3.2%
estimated total change -30% -42% -80% -57% 380%
1995 - 2009 trend decrease decrease no trend no trend increase little data
estimated average annual change -5.1% -2.2% 4.8%
estimated total change -56% -30% 110%
median concentrations first 10 years 125 0.3 2 0.10 7 14
median concentrations most recent 10 years 79 0.2 1 <0.05 4 29
Minnesota River at Bridge on MN-22 at St. Peter (S000-041)(MI-88) (period of record 1955 - 2009)
overall trend no trend decrease no trend decrease decrease increase estimated average annual change -1.5% -5.3% -1.8% 5.0%
estimated total change -55% -82% -63% 1011%
1995 - 2009 trend decrease decrease no trend no trend increase little data
estimated average annual change -5.8% -3.9% 6.6%
estimated total change -61% -47% 177%
median concentrations first 10 years 110 0.4 4 0.10 6 16
median concentrations most recent 10 years 87 0.2 4 <0.05 4 29
45

Total BiochemicalSuspended Total Nitrite/ Oxygen
Solids Phosphorus Nitrate Ammonia Demand ChlorideMinnesota River at MN-19 Bridge at Henderson (S000-040)(MI-64) (period of record 1955 - 2009)
overall trend decrease decrease no trend decrease decrease increase estimated average annual change -0.7% -1.3% -5.6% -2.1% 3.2%
estimated total change -30% -48% -83% -68% 362%
1995 - 2009 trend decrease decrease no trend no trend increase little data
estimated average annual change -4.3% -2.6% 4.7%
estimated total change -51% -34% 108%
median concentrations first 10 years 140 0.4 4 0.10 6 17
median concentrations most recent 10 years 81 0.2 3 <0.05 4 32
Minnesota River at MCES Site off SE End of Runway 12L/30R (S000-310)(MI-3.5) (period of record 1980 - 2009)
overall trend no trend decrease no trend decrease no trend little data
estimated average annual change -1.8% -7.7%
estimated total change -41% -90%
1995 - 2009 trend decrease decrease no trend no trend no trend little data
estimated average annual change -4.8% -3.0%
estimated total change -54% -38%
median concentrations first 10 years 77 0.4 3 0.28 4 --
median concentrations most recent 10 years 71 0.2 7 <0.05 3 55
Pomme de Terre River above Dam E of MN-7 at Appleton (S000-195)(PT-10) (period of record 1971 - 2009)
overall trend no trend decrease increase decrease decrease increase estimated average annual change -1.4% 3.9% -6.3% -2.1% 1.6%
estimated total change -42% 280% -87% -56% 89%
1995 - 2009 trend decrease no trend no trend no trend no trend no trend estimated average annual change -3.1%
estimated total change -38%
median concentrations first 10 years 77 0.3 0.1 0.15 4 9
median concentrations most recent 10 years 73 0.2 0.3 <0.05 2 13
Yellow Medicine River at MN-67 Bridge 7 Mi SE of Granite Falls (S000-159)(YM-0.5) (period of record 1967 - 2009)
overall trend decrease decrease increase decrease decrease increase estimated average annual change -1.8% -2.4% 0.8% -2.6% -1.9% 2.2%
estimated total change -52% -63% 29% -53% -56% 148%
1995 - 2009 trend decrease decrease no trend no trend decrease little data
estimated average annual change -10.6% -5.1% -4.7%
estimated total change -83% -57% -53%
median concentrations first 10 years 65 0.2 0.3 0.13 5 13
median concentrations most recent 10 years 26 0.1 0.3 <0.05 2 18
46
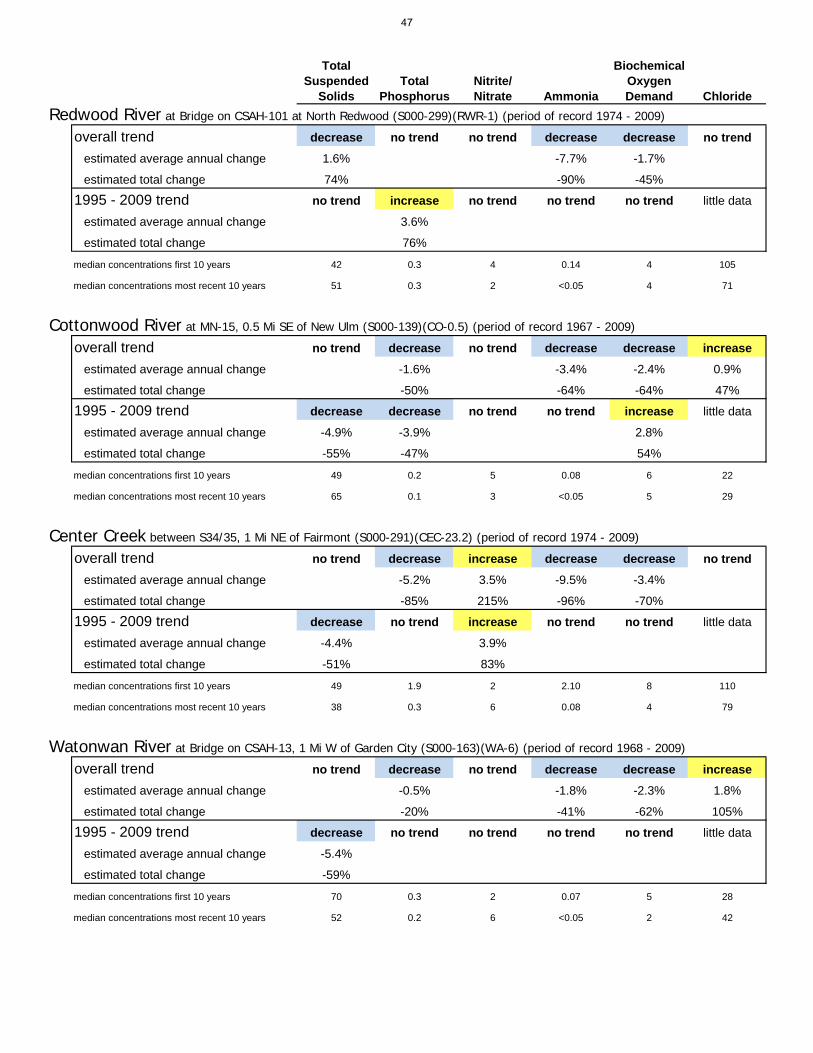
Total BiochemicalSuspended Total Nitrite/ Oxygen
Solids Phosphorus Nitrate Ammonia Demand ChlorideRedwood River at Bridge on CSAH-101 at North Redwood (S000-299)(RWR-1) (period of record 1974 - 2009)
overall trend decrease no trend no trend decrease decrease no trend estimated average annual change 1.6% -7.7% -1.7%
estimated total change 74% -90% -45%
1995 - 2009 trend no trend increase no trend no trend no trend little data
estimated average annual change 3.6%
estimated total change 76%
median concentrations first 10 years 42 0.3 4 0.14 4 105
median concentrations most recent 10 years 51 0.3 2 <0.05 4 71
Cottonwood River at MN-15, 0.5 Mi SE of New Ulm (S000-139)(CO-0.5) (period of record 1967 - 2009)
overall trend no trend decrease no trend decrease decrease increase estimated average annual change -1.6% -3.4% -2.4% 0.9%
estimated total change -50% -64% -64% 47%
1995 - 2009 trend decrease decrease no trend no trend increase little data
estimated average annual change -4.9% -3.9% 2.8%
estimated total change -55% -47% 54%
median concentrations first 10 years 49 0.2 5 0.08 6 22
median concentrations most recent 10 years 65 0.1 3 <0.05 5 29
Center Creek between S34/35, 1 Mi NE of Fairmont (S000-291)(CEC-23.2) (period of record 1974 - 2009)
overall trend no trend decrease increase decrease decrease no trend estimated average annual change -5.2% 3.5% -9.5% -3.4%
estimated total change -85% 215% -96% -70%
1995 - 2009 trend decrease no trend increase no trend no trend little data
estimated average annual change -4.4% 3.9%
estimated total change -51% 83%
median concentrations first 10 years 49 1.9 2 2.10 8 110
median concentrations most recent 10 years 38 0.3 6 0.08 4 79
Watonwan River at Bridge on CSAH-13, 1 Mi W of Garden City (S000-163)(WA-6) (period of record 1968 - 2009)
overall trend no trend decrease no trend decrease decrease increase estimated average annual change -0.5% -1.8% -2.3% 1.8%
estimated total change -20% -41% -62% 105%
1995 - 2009 trend decrease no trend no trend no trend no trend little data
estimated average annual change -5.4%
estimated total change -59%
median concentrations first 10 years 70 0.3 2 0.07 5 28
median concentrations most recent 10 years 52 0.2 6 <0.05 2 42
47

Total BiochemicalSuspended Total Nitrite/ Oxygen
Solids Phosphorus Nitrate Ammonia Demand ChlorideBlue Earth River in Sibley Park at Mankato (S000-134)(BE-0) (period of record 1967 - 2009)
overall trend no trend decrease no trend decrease decrease increase estimated average annual change -1.8% -4.6% -2.3% 1.5%
estimated total change -54% -77% -63% 85%
1995 - 2009 trend decrease decrease no trend no trend increase little data
estimated average annual change -7.1% -6.1% 4.7%
estimated total change -69% -63% 107%
median concentrations first 10 years 115 0.3 9 0.08 5 25
median concentrations most recent 10 years 62 0.2 7 <0.05 5 31
48
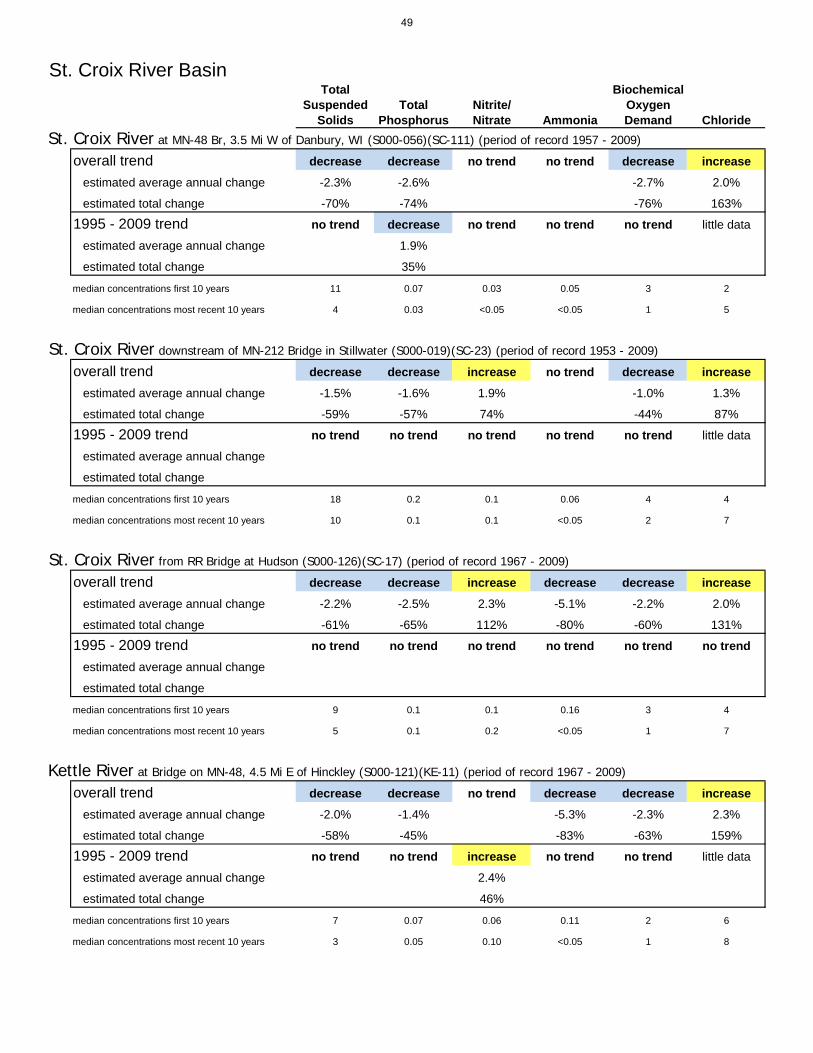
St. Croix River BasinTotal Biochemical
Suspended Total Nitrite/ OxygenSolids Phosphorus Nitrate Ammonia Demand Chloride
St. Croix River at MN-48 Br, 3.5 Mi W of Danbury, WI (S000-056)(SC-111) (period of record 1957 - 2009)
overall trend decrease decrease no trend no trend decrease increase estimated average annual change -2.3% -2.6% -2.7% 2.0%
estimated total change -70% -74% -76% 163%
1995 - 2009 trend no trend decrease no trend no trend no trend little data
estimated average annual change 1.9%
estimated total change 35%
median concentrations first 10 years 11 0.07 0.03 0.05 3 2
median concentrations most recent 10 years 4 0.03 <0.05 <0.05 1 5
St. Croix River downstream of MN-212 Bridge in Stillwater (S000-019)(SC-23) (period of record 1953 - 2009)
overall trend decrease decrease increase no trend decrease increase estimated average annual change -1.5% -1.6% 1.9% -1.0% 1.3%
estimated total change -59% -57% 74% -44% 87%
1995 - 2009 trend no trend no trend no trend no trend no trend little data
estimated average annual change
estimated total change
median concentrations first 10 years 18 0.2 0.1 0.06 4 4
median concentrations most recent 10 years 10 0.1 0.1 <0.05 2 7
St. Croix River from RR Bridge at Hudson (S000-126)(SC-17) (period of record 1967 - 2009)
overall trend decrease decrease increase decrease decrease increase estimated average annual change -2.2% -2.5% 2.3% -5.1% -2.2% 2.0%
estimated total change -61% -65% 112% -80% -60% 131%
1995 - 2009 trend no trend no trend no trend no trend no trend no trend estimated average annual change
estimated total change
median concentrations first 10 years 9 0.1 0.1 0.16 3 4
median concentrations most recent 10 years 5 0.1 0.2 <0.05 1 7
Kettle River at Bridge on MN-48, 4.5 Mi E of Hinckley (S000-121)(KE-11) (period of record 1967 - 2009)
overall trend decrease decrease no trend decrease decrease increase estimated average annual change -2.0% -1.4% -5.3% -2.3% 2.3%
estimated total change -58% -45% -83% -63% 159%
1995 - 2009 trend no trend no trend increase no trend no trend little data
estimated average annual change 2.4%
estimated total change 46%
median concentrations first 10 years 7 0.07 0.06 0.11 2 6
median concentrations most recent 10 years 3 0.05 0.10 <0.05 1 8
49

Total BiochemicalSuspended Total Nitrite/ Oxygen
Solids Phosphorus Nitrate Ammonia Demand ChlorideSnake River below Cross Lake Dam, 2 Mi NE of Pine City (S000-198)(SN-10) (period of record 1971 - 2009)
overall trend no trend no trend no trend decrease no trend increase estimated average annual change -2.0% 1.7%
estimated total change -32% 92%
1995 - 2009 trend no trend no trend no trend no trend no trend little data
estimated average annual change
estimated total change
median concentrations first 10 years 10 0.19 0.06 0.04 5 5
median concentrations most recent 10 years 7 0.09 0.06 0.06 2 8
North Branch Sunrise River at MN-95, 4 Mi E of North Branch (S000-301)(SUN-5) (period of record 1974 - 2009)
overall trend decrease no trend increase no trend increase no trend estimated average annual change -1.8% 2.8% 2.2%
estimated total change -48% 70% 114%
1995 - 2009 trend decrease no trend increase no trend no trend little data
estimated average annual change -3.7% 3.0%
estimated total change -45% 61%
median concentrations first 10 years 26 0.1 2 0.03 2 8
median concentrations most recent 10 years 8 0.1 2 <0.05 1 31
50
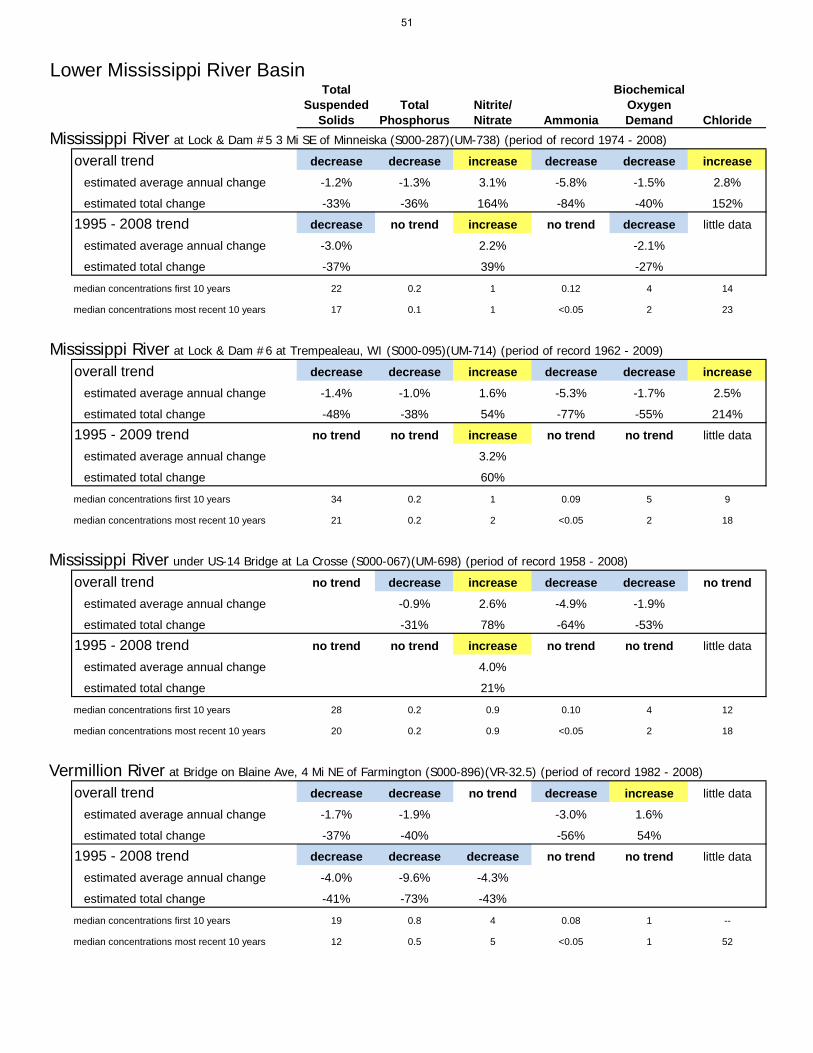
Lower Mississippi River BasinTotal Biochemical
Suspended Total Nitrite/ OxygenSolids Phosphorus Nitrate Ammonia Demand Chloride
Mississippi River at Lock & Dam #5 3 Mi SE of Minneiska (S000-287)(UM-738) (period of record 1974 - 2008)
overall trend decrease decrease increase decrease decrease increase estimated average annual change -1.2% -1.3% 3.1% -5.8% -1.5% 2.8%
estimated total change -33% -36% 164% -84% -40% 152%
1995 - 2008 trend decrease no trend increase no trend decrease little data
estimated average annual change -3.0% 2.2% -2.1%
estimated total change -37% 39% -27%
median concentrations first 10 years 22 0.2 1 0.12 4 14
median concentrations most recent 10 years 17 0.1 1 <0.05 2 23
Mississippi River at Lock & Dam #6 at Trempealeau, WI (S000-095)(UM-714) (period of record 1962 - 2009)
overall trend decrease decrease increase decrease decrease increase estimated average annual change -1.4% -1.0% 1.6% -5.3% -1.7% 2.5%
estimated total change -48% -38% 54% -77% -55% 214%
1995 - 2009 trend no trend no trend increase no trend no trend little data
estimated average annual change 3.2%
estimated total change 60%
median concentrations first 10 years 34 0.2 1 0.09 5 9
median concentrations most recent 10 years 21 0.2 2 <0.05 2 18
Mississippi River under US-14 Bridge at La Crosse (S000-067)(UM-698) (period of record 1958 - 2008)
overall trend no trend decrease increase decrease decrease no trend estimated average annual change -0.9% 2.6% -4.9% -1.9%
estimated total change -31% 78% -64% -53%
1995 - 2008 trend no trend no trend increase no trend no trend little data
estimated average annual change 4.0%
estimated total change 21%
median concentrations first 10 years 28 0.2 0.9 0.10 4 12
median concentrations most recent 10 years 20 0.2 0.9 <0.05 2 18
Vermillion River at Bridge on Blaine Ave, 4 Mi NE of Farmington (S000-896)(VR-32.5) (period of record 1982 - 2008)
overall trend decrease decrease no trend decrease increase little data
estimated average annual change -1.7% -1.9% -3.0% 1.6%
estimated total change -37% -40% -56% 54%
1995 - 2008 trend decrease decrease decrease no trend no trend little data
estimated average annual change -4.0% -9.6% -4.3%
estimated total change -41% -73% -43%
median concentrations first 10 years 19 0.8 4 0.08 1 --
median concentrations most recent 10 years 12 0.5 5 <0.05 1 52
51

Total BiochemicalSuspended Total Nitrite/ Oxygen
Solids Phosphorus Nitrate Ammonia Demand ChlorideStraight River near CSAH-1, 1 Mi SE of Clinton Falls (S000-047)(ST-18) (period of record 1955 - 2009)
overall trend decrease decrease no trend decrease decrease increase average annual change -1.9% -1.0% -7.4% -3.5% 1.4%
total change -64% -43% -98% -85% 114%
1995 - 2009 trend no trend no trend no trend no trend no trend little data
average annual change
total change
median concentrations first 10 years 38 0.7 1 0.44 7 17
median concentrations most recent 10 years 23 0.3 4 <0.05 1 30
Cannon River at Bridge on CSAH-7 at Welch (S000-003)(CA-13) (period of record 1953 - 2008)
overall trend decrease decrease increase decrease decrease increase average annual change -2.6% -2.3% 1.4% -7.0% -0.8% 1.8%
total change -77% -69% 105% -97% -37% 178%
1995 - 2008 trend no trend no trend increase no trend no trend little data
average annual change 1.9%
total change 31%
median concentrations first 10 years 26 0.3 1 0.20 4 11
median concentrations most recent 10 years 14 0.2 4 <0.05 2 28
Zumbro River at CSAH-14, 3 Mi N of Rochester (S000-268)(ZSF-5.7) (period of record 1973 - 2008)
overall trend decrease decrease increase decrease decrease increase average annual change -2.9% -7.1% 2.3% -10.0% -4.6% 3.0%
total change -64% -92% 120% -97% -81% 186%
1995 - 2008 trend decrease no trend no trend no trend no trend little data
average annual change -6.7%
total change -42%
median concentrations first 10 years 45 0.9 3 0.50 5 36
median concentrations most recent 10 years 16 0.2 7 <0.05 2 54
Whitewater River S Fork N of CR-115 3.5 Mi NW of Utica (S000-288)(WWR-26) (period of record 1974 - 2008)
overall trend decrease no trend increase decrease decrease increase estimated average annual change -2.4% 1.8% -2.0% -2.8% 1.9%
estimated total change -57% 79% -46% -64% 94%
1995 - 2008 trend no trend no trend increase no trend no trend little data
estimated average annual change 2.5%
estimated total change 46%
median concentrations first 10 years 32 0.5 7 0.08 3 27
median concentrations most recent 10 years 16 0.4 11 <0.05 1 43
52

Total BiochemicalSuspended Total Nitrite/ Oxygen
Solids Phosphorus Nitrate Ammonia Demand ChlorideGarvin Brook at CSAH-23, SW of Minnesota City (S000-828)(GB-4.5) (period of record 1981 - 2008)
overall trend decrease decrease increase decrease decrease increase estimated average annual change -4.0% -1.7% 3.1% -2.0% -1.8% 3.6%
estimated total change -67% -38% 130% -42% -38% 159%
1995 - 2008 trend decrease no trend increase no trend no trend little data
estimated average annual change -8.5% 2.6%
estimated total change -74% 46%
median concentrations first 10 years 62 0.1 1 0.09 2 6
median concentrations most recent 10 years 23 0.1 2 <0.05 1 13
Root River at Bridge on MN-26, 3 Mi E of Hokah (S000-065)(RT-3) (period of record 1958 - 2008)
overall trend decrease decrease increase decrease decrease increase estimated average annual change -1.3% -2.4% 3.7% -1.0% -4.1% 1.4%
estimated total change -41% -70% 355% -34% -88% 76%
1995 - 2008 trend decrease no trend increase no trend no trend little data
estimated average annual change -8.2% 2.2%
estimated total change -61% 39%
median concentrations first 10 years 120 0.3 1 0.15 4 7
median concentrations most recent 10 years 58 0.1 4 <0.05 1 13
53
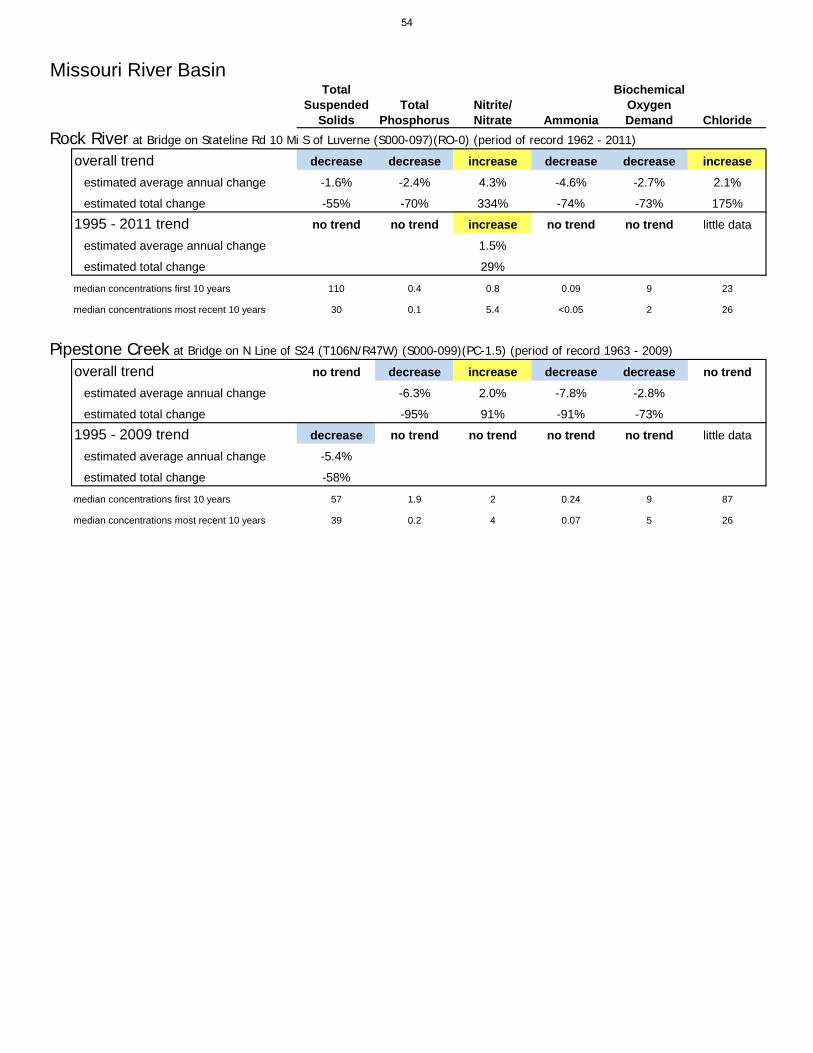
Missouri River BasinTotal Biochemical
Suspended Total Nitrite/ OxygenSolids Phosphorus Nitrate Ammonia Demand Chloride
Rock River at Bridge on Stateline Rd 10 Mi S of Luverne (S000-097)(RO-0) (period of record 1962 - 2011)
overall trend decrease decrease increase decrease decrease increase estimated average annual change -1.6% -2.4% 4.3% -4.6% -2.7% 2.1%
estimated total change -55% -70% 334% -74% -73% 175%
1995 - 2011 trend no trend no trend increase no trend no trend little data
estimated average annual change 1.5%
estimated total change 29%
median concentrations first 10 years 110 0.4 0.8 0.09 9 23
median concentrations most recent 10 years 30 0.1 5.4 <0.05 2 26
Pipestone Creek at Bridge on N Line of S24 (T106N/R47W) (S000-099)(PC-1.5) (period of record 1963 - 2009)
overall trend no trend decrease increase decrease decrease no trend estimated average annual change -6.3% 2.0% -7.8% -2.8%
estimated total change -95% 91% -91% -73%
1995 - 2009 trend decrease no trend no trend no trend no trend little data
estimated average annual change -5.4%
estimated total change -58%
median concentrations first 10 years 57 1.9 2 0.24 9 87
median concentrations most recent 10 years 39 0.2 4 0.07 5 26
54
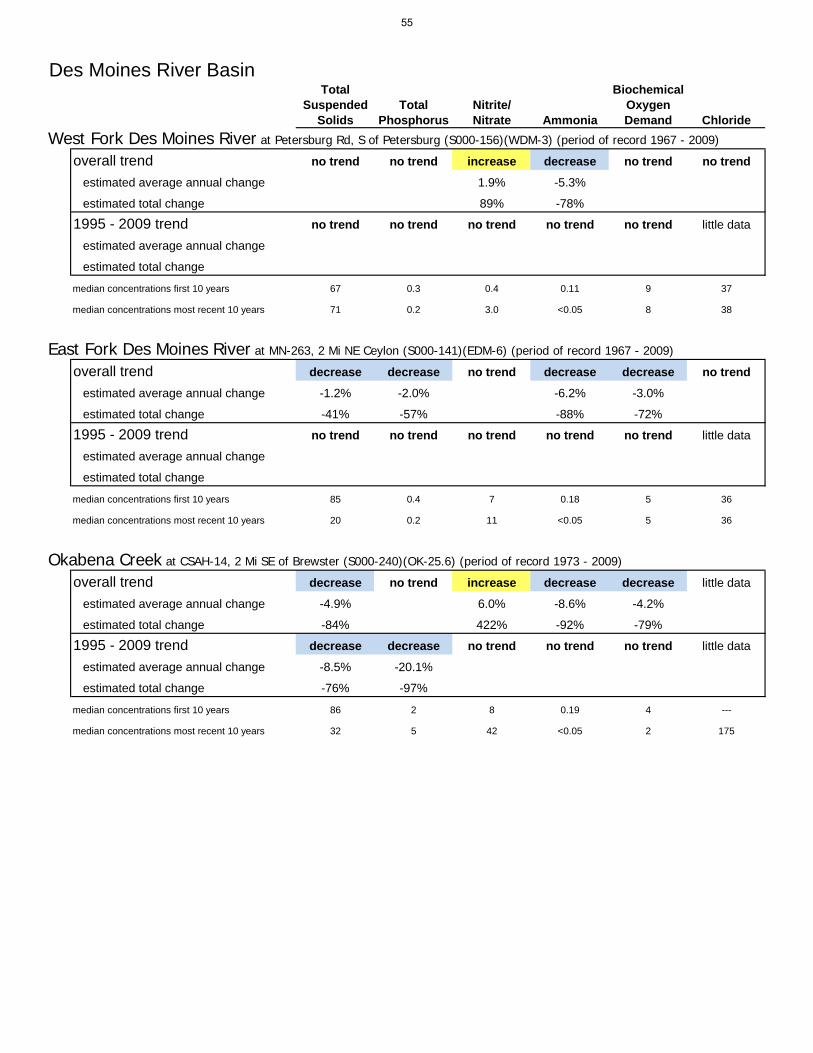
Des Moines River BasinTotal Biochemical
Suspended Total Nitrite/ OxygenSolids Phosphorus Nitrate Ammonia Demand Chloride
West Fork Des Moines River at Petersburg Rd, S of Petersburg (S000-156)(WDM-3) (period of record 1967 - 2009)
overall trend no trend no trend increase decrease no trend no trend estimated average annual change 1.9% -5.3%
estimated total change 89% -78%
1995 - 2009 trend no trend no trend no trend no trend no trend little data
estimated average annual change
estimated total change
median concentrations first 10 years 67 0.3 0.4 0.11 9 37
median concentrations most recent 10 years 71 0.2 3.0 <0.05 8 38
East Fork Des Moines River at MN-263, 2 Mi NE Ceylon (S000-141)(EDM-6) (period of record 1967 - 2009)
overall trend decrease decrease no trend decrease decrease no trend estimated average annual change -1.2% -2.0% -6.2% -3.0%
estimated total change -41% -57% -88% -72%
1995 - 2009 trend no trend no trend no trend no trend no trend little data
estimated average annual change
estimated total change
median concentrations first 10 years 85 0.4 7 0.18 5 36
median concentrations most recent 10 years 20 0.2 11 <0.05 5 36
Okabena Creek at CSAH-14, 2 Mi SE of Brewster (S000-240)(OK-25.6) (period of record 1973 - 2009)
overall trend decrease no trend increase decrease decrease little data
estimated average annual change -4.9% 6.0% -8.6% -4.2%
estimated total change -84% 422% -92% -79%
1995 - 2009 trend decrease decrease no trend no trend no trend little data
estimated average annual change -8.5% -20.1%
estimated total change -76% -97%
median concentrations first 10 years 86 2 8 0.19 4 ---
median concentrations most recent 10 years 32 5 42 <0.05 2 175
55

Cedar River BasinTotal Biochemical
Suspended Total Nitrite/ OxygenSolids Phosphorus Nitrate Ammonia Demand Chloride
Cedar River at CSAH-2, 0.5 Mi E of Lansing (S000-137)(CD-24) (period of record 1967 - 2009)
overall trend decrease decrease increase decrease decrease no trend estimated average annual change -2.8% -2.0% 3.2% -1.6% -4.1%
estimated total change -71% -58% 294% -50% -83%
1995 - 2009 trend no trend no trend no trend no trend no trend little data
estimated average annual change
estimated total change
median concentrations first 10 years 38 0.3 2 0.10 4 20
median concentrations most recent 10 years 11 0.2 8 <0.05 1 20
Cedar River at CSAH-4, 3 Mi S of Austin (S000-136)(CD-10) (period of record 1967 - 2009)
overall trend decrease decrease increase decrease decrease no trend estimated average annual change -2.9% -2.9% 2.5% -5.2% -3.9%
estimated total change -71% -72% 193% -90% -82%
1995 - 2009 trend no trend no trend increase no trend no trend little data
estimated average annual change 3.1%
estimated total change 53%
median concentrations first 10 years 42 0.7 3 0.29 6 41
median concentrations most recent 10 years 34 0.2 9 <0.05 2 28
Shell Rock River at Bridge on CSAH-1, 1 Mi W of Gordonsville (S000-084)(SR-1.2) (period of record 1961 - 2009)
overall trend decrease decrease increase decrease decrease increase estimated average annual change -1.9% -1.0% 4.6% -0.9% -2.9% 1.0%
estimated total change -60% -38% 563% -37% -77% 59%
1995 - 2009 trend no trend no trend no trend no trend no trend little data
estimated average annual change
estimated total change
median concentrations first 10 years 99 0.5 1 0.10 14 35
median concentrations most recent 10 years 54 0.4 2 <0.05 7 43
56