water reclamation using an enhanced scalable wastewater …
TRANSCRIPT

WATER RECLAMATION USING AN ENHANCED SCALABLE WASTEWATER
TREATMENT PACKAGE UNIT
A THESIS SUBMITTED TO THE GRADUATE DIVISION OF THE UNIVERSITY OF HAWAI'I IN PARTIAL FULLFILLMENT
OF THE REQUIREMENTS FOR THE DEGREE OF
MASTER
OF
CIVIL ENGINEERING
AUGUST 1999
By Lance J. Edling
Thesis Committee:
Roger Babcock Jr., Chairperson Victor Moreland Chittaranjan Ray
DISTRIBUTION STATEMENT A ilAAAAflA^ AO/
.tsrsiar 19990827 084 Distribution Unlimited DUC QUALITY INSPECTED 4

We certify that we have read this thesis and that, in our opinion, it is
satisfactory in scope and quality as a thesis for the degree of Master of
Civil Engineering.
THESIS COMMITEE
^ Chairperson
3?-r^—ig_

ACKNOWLEDGMENTS
I would like to thank the many people who assisted me in this project. Thank you
to the members of my thesis committee: Dr. Roger Babcock Jr., Dr. Victor Moreland and
Dr. Chittaranjan Ray for there excellent support and guidance. Thank you to Mrs.
Bunnie Yoneyama for her time and patience in the laboratory. A special thanks to my
partner, LCDR Dan McNair, for his assistance on all testing performed throughout the
project. In addition, I would like to thank the Callisons for their continual
encouragement. Finally, I extend my utmost appreciation to my wife and son who
provided their never-ending support, guidance and perspective.
in

TABLE OF CONTENTS
Acknowledgments in
List of Tables vi
List of Figures vi
List of Abbreviations ix
Chapter 1: Introduction 1
Chapter 2: Background 6
2.1 Current Regulations 6
2.1.1 R-l Quality Water 9
2.1.2 R-2 Quality Water 12
2.2 History and Theory of Sand Filtration 15
2.3 History and Theory of Ultraviolet Disinfection 22
Chapter 3: Methods 30
3.1 System Construction 30
3.2 Analytical Procedures 38
Chapter 4: Results 49
4.1 Effectiveness of Wastewater Treatment Package Unit 49
4.2 Results of Sand Filtration Testing 55
4.3 Results of Ultraviolet Disinfection Testing 62
4.4 Results of R-2 Quality Water Test 73
Chapter 5: Discussion 76
5.1 Guideline Revisions 76
5.2 Guidelines Remaining 82 iv

5.3 Proposed Design 85
5.4 Remaining Problems 91
Chapter 6: Conclusions 94
Appendix 95
Bibliography 101

List of Tables
Table Page
1 WTPU Loading Schedule 50
2 Measured vs. Typical Parameters 52
VI

List of Figures
Figure Page
1 US Fresh Water Demands by Major Uses, 1985 3
2 Average Residential Water Usage by Type of Use 4
3 Picture of WTPU and sand filtration / UV disinfection system 30
4 Picture of connection piping 31
5 Picture of sand filter 31
6 Schematic of Initial Loading 32
7 Ultraviolet Disinfection System Data 33
8 Picture of Ultraviolet Disinfection System 34
9 Schematic of Once-Thru-Pass test 35
10 Schematic of Multiple-Pass test 36
11 Picture of coagulation / flocculation process 36
12 Picture of chlorination process 37
13 Picture of collimated beam unit 45
14 Picture of International Light radiometer 46
15 Picture of sample receiving a known UV dose 46
16 Effluent turbidity (unflltered) 52
17 Effluent transmittance 53
18 Filter Performance 54
19 Percent VSS before and after filtration 57
20 Determination of optimum coagulant dosage 59
21 Dose response curves (Results of four tests) 60
Vll

22 Dose response curve (compilation of test results) 61
23 Density plot of collimated beam testing 61
24 Once-Thru-Pass Test Results 63
25 Turbidity vs. Dose 63
26 Multiple-Pass Test 67
27 Proposed OWRS Design 84
Vlll

List of Abbreviations
BOD5 - Biochemical Oxygen Demand (five day test)
CFU - Colony Forming Units
DNA - Deoxyribonucleic Acid
DO - Dissolved Oxygen
DOH - Department of Health
NSF - National Sanitation Foundation
NTU - Nephelometric Turbidity Unit
OWRS - Onsite Water Reclamation System
SIWTP - Sand Island Wastewater Treatment Plant
TSS - Total Suspended Solids
UV - Ultraviolet
VSS - Volatile Suspended Solids
WTPU - Wastewater Treatment Package Unit
IX

Chapter 1 Introduction
Simply put, water is a precious quantity. We depend on water to grow crops,
raise livestock, produce electricity, manufacture an enormous variety of products, and
most importantly sustain life. Unfortunately this precious quantity is becoming
increasingly scarce due to the demands of society.
While people living in rural areas do not have much difficulty in finding the water
they need, large city populations find this challenge much more daunting. Most large
cities have already exploited all the nearby water resources and are forced to expand their
search for water, often at a great expense. According to a report from the United Nations
in 1989, half of the total population in the world will be living in cities by the year 2000.
Additionally, the number of cities exceeding 1 million residents is expected to be over
400 by the end of this century. (EPA, 1992). This is a trend that is especially true in the
United States. Already in 1966, the U.S. Census Bureau estimated that two thirds of the
U.S. population lived in urban areas and of the remaining one third, only 8% truly lived
in a rural setting (Wright, 1966). Thus, the search for suitable water effects the majority
of us.
In order to sustain water supplies to meet our growing worldwide demand, two
primary methods are suggested. First, we must protect the current water sources from
contamination. Secondly, we must learn to fully utilize the water that we currently take
from these water sources. It is our commitment to these two methods that will determine
the continued availability of the water supply that we all so heavily depend upon.

One of the ways in which our current water sources are contaminated is through
the use of cesspools and septic tanks. Cesspool systems leach water that has not been
treated into ground water aquifers that communities may depend on. Additionally, these
systems leach higher levels of soluble phosphorous and nitrogen than is recommended for
drinking water supplies. This problem could lead to making a suitable aquifer for a
drinking water supply no longer available for such a purpose. A November 1997 survey
in Hawai'i determined that over 218,000 cesspools still exist in the major counties, with
approximately 158,000 located in the City and County of Honolulu (Island of Oahu).
Even if Hawai'i switched to septic tanks, which are a definite improvement over
cesspools, contamination to the groundwater can still occur. Septic tanks have been
shown to be the leading cause of groundwater contamination (nitrate and phosphorous
contamination) in some cities, and this problem is widespread in the United States. It is
estimated that approximately one third of the nation's sewage is disposed of through
septic tanks. (Harmanetal., 1996)
A possible method to avoid or prevent groundwater contamination is to replace
cesspools and septic tanks with small-quantity wastewater treatment package units
(WTPU's). This is a small tank (approximately the same size as a septic tank) that could
replace a septic tank or a cesspool at a residential unit. This unit reduces the total amount
of suspended solids in the wastewater, reduces the biochemical oxygen demand, and
could reduce phosphorous and nitrogen levels. Then, if the water were recharged into the
ground, few if any effects to the surrounding groundwater would arise. A related thesis
(McNair, 1999) further explores the performance of a single-family wastewater treatment
package unit.

The other method to sustain current water supplies is to fully utilize the water that
is currently taken from these water sources. In order to do so, treating wastewater to
make it available for reuse is mandatory. This is especially true in urban areas where
reclaimed water use
could dramatically
reduce fresh water
demand. Figure
1 shows the primary
demands for fresh
water in the United
States (EPA, 1992).
This graph shows
that only 12% of the
total fresh water
Figure: 1 US Fresh Water Demands by Major Uses, 1985
Livestock
Agricultrual Irrigation
40%
Thermo-electric 39%
Industrial & Commercial
8%
Public & Domestic 12%
demand in the U.S. is due to public and domestic use, however, this usage is much more
concentrated geographically than some of the other major water uses. Concentrated
water use in a given location is the major challenge for a society as population growth in
large cities continues to increase.
Figure 2 is another compelling graph showing the reuse possibilities in a
residential setting. This graph shows the breakdown of residential water use by type of
use. Although these statistics may vary due to location and season, they show the general
pattern of water usage. For example, outdoor use and toilet flushing comprise
approximately 60% of water utilization at a residential unit. Both are types of use that can
3

use reclaimed water. It is staggering to think that as much as 60% of all water used in a
residential setting could be reclaimed water. Furthermore, the burden on the potable
water supply for a city would be dramatically reduced if just outdoor water uses and toilet
flushing used reclaimed water.
Therefore, if a residential wastewater treatment package unit can adequately treat
residential wastewater, then the possibility for onsite residential reuse exists. This Thesis
focuses on Figure: 2 Average Residential Water Usage by Type
of Use Cooking & Drinking
3% Laundry &
Dishes 14"/<
Toilet Flushing 28%
Bathing 23%
Outdoor Use 32%
residential reuse
using a small
quantity wastewater
treatment package
unit. Using the
effluent from a
WTPU (provided by
BEST Industries),
we attempted to
create reclaimed water acceptable to meet the highest reuse standards in the State of
Hawai'i. The possibility of creating reusable water at a residence is desirable for many
reasons. By reducing potable water usage at a residence, onsite water reclamation could
cut down on drinking water cost for a residential home, and would be less taxing on
already overburdened drinking water supply systems. Additionally, it could reduce the
infrastructure costs and management problems associated with piping sewage to a large-
scale, publicly owned wastewater treatment plant. Unfortunately, onsite water
4

reclamation also has several potential drawbacks such as excessive cost, state and federal
regulations, and the demanding maintenance and care of the system.
As this thesis will explain, the cost necessary to meet monitoring requirements to
create reclaimed water is currently the primary hindrance to making onsite water
reclamation possible. Therefore, changing the current monitoring regulations is the only
option to making onsite water reclamation possible. This is the case because even if the
water in the WTPU and the following filtration/disinfection steps could always produce
high quality water, the current State of Hawai'i regulations still insist that continuous
monitoring equipment be in place. Therefore, since continuous monitoring equipment is
not cost effective, this type of system is completely infeasible. But the fact that
regulations must be changed before onsite water reclamation can be possible is not much
of an impetus to spur lawmakers to change laws. Obviously, there must be many
assurances that public health standards currently in place would not be lowered if the
laws were revised to accommodate this process. Therefore, a paradox exists. Current
monitoring regulations are the primary stumbling block to making this system feasible,
and the responsibility to makes such a system possible and feasible rests on the shoulders
of the inventors and manufacturers; although inventors and manufacturers do not have the
ability to change regulations. This is the purpose of this study, to wrestle with this
paradox. Ultimately, it is my goal to provide insight and new suggestions to the dilemma
of making an onsite reclamation system more reliable, and consequently more desirable
in the eyes of regulators and legislators.
Chapter 2 Background
2.1 Current Regulations
Demonstrating the technical feasibility of reclaiming wastewater at individual
homes and using it for reuse purposes is the desired result from this study. Before further
discussion on possibilities for achieving this goal, however, we must first discuss some of
the limitations for water reuse in a residential zone. Some of these limitations result from
the Hawai'i State regulations for reclaimed water.
The Hawai'i State Department of Health (DOH) has prepared a manual titled,
"Guidelines for the Treatment and Use of Reclaimed Water" (1993). In this manual, the
DOH outlines the uses for reclaimed water, some of which apply to a residential area.
The following is a shortened list of reclaimed water uses allowable by the DOH that may
be applicable to a residential setting:
1. Residential property where managed by an irrigation supervisor.
2. Flushing toilets and urinals in types of buildings and institutions approved by DOH
and where counties have adopted a provision in their plumbing code pertaining to the
use of a dual water supply within a building.
3. Supply source for decorative fountains if the recirculating water does not support
growth of microorganisms from the surrounding environment that could infect either
the respiratory or digestive system of mammals.
4. Washing of hard surfaces (e.g. parking lots and sidewalks).
(Hawai'i State DOH, 1993)
Already based on the DOH guidelines for water reuse, reclaimed water around a
residential unit will be difficult. Point #1 from above, stated that residential use of
reclaimed water requires an irrigation supervisor. The probable intent of this statement is
for large estates or ranches to have an on-site employee monitor the use and quality of the
reclaimed water being used. Since this is impractical for a single household (which is the
focus of this study) exceptions or revisions to this first rule need to be implemented
before this system could be operated in a single residence setting. Points 2, 3 and 4 from
above, although they are not as directly related to residential water reuse, are still
applicable in a residential setting. The problem with these uses, however, is the
additional cost associated with using the reclaimed water (i.e. replumbing the entire
house) and the impracticality of using reclaimed water for such a purpose (i.e. installing a
fountain is one's backyard). Of the last three opportunities for reuse, perhaps the most
readily applicable use is point #4, to use reclaimed water for cleaning and washing of
hard surfaces, such as sidewalks and driveways.
There are other problems encountered in the DOH guidelines using an onsite
water reclamation system (OWRS) to create reclaimed water for a single household. The
above list is only the state's policy on where reclaimed water could possibly be used.
Also included in the DOH guidelines are requirements for the use of reclaimed water.
The following list is a compilation of the requirements for using reclaimed water that
currently apply to using water in a residential setting:
1. Signs shall be posted where reclaimed water is used.
2. Adequate measures shall be taken to prevent ponding of reclaimed water.

3. Reclaimed water shall be managed to avoid conditions conducive to proliferation of
mosquitoes and other disease vectors.
4. No discharge, runoff, or overspray shall extend beyond the approved use of area
boundaries.
5. There can be no irrigation within a minimum of 50 feet of any drinking water supply
well.
6. The outer edge of the impoundment shall be located at least 100 feet from any
drinking water supply well.
7. Drainage shall be controlled to prevent reclaimed water from coming within 50 feet
of a drinking water supply well.
(Hawai'i State DOH, 1993)
This list of current requirements for reclaimed water use brings up a myriad of
questions when trying to apply these requirements to an OWRS. First, if the requirement
to place signage were strictly enforced, convincing a homeowner to place such a sign in
their front lawn would be difficult. This requirement may be less of a problem for
residences in a more rural setting; however, a sign of this nature may prove to be an
uninviting decoration in any condition even at rural homes. Other problems with this list
of regulations concern the water boundaries for reclaimed water use. In a residential
area, monitoring the use of reclaimed water only within the allowed boundaries would be
difficult. Although boundaries are not too difficult to enforce at some reuse sites, they
would be difficult to strictly enforce at a residential unit. For example, a golf course,
where the irrigation area is large and there is usually some unused space between
adjoining properties, makes the risk of overspray potentially less hazardous. In contrast,

a residential unit usually has a much smaller irrigation area making the possibility of
overspray or leakage into a heavily trafficked public land space (such as a sidewalk,
street or neighboring yard) much more likely.
Obviously, the current guideline is not written with the expectation that single
residential units will be making their own reclaimed water. Therefore, it can be expected
that the requirements in the DOH guidelines will have to be revised before an OWRS
could become a reality. Also, it should be kept in mind that the guidelines are only
guidelines. Thus, as long as the public safety is maintained, the guidelines may be
followed less strictly than how they are written. Later in this report, a likely policy to
monitor an OWRS will be discussed. Some of the guidelines currently in place may not
apply to an OWRS while others may have to be revised to accommodate the new system.
2.1.1 R-l Quality Water
The reclaimed water standards for Hawai'i are also outlined in the DOH manual
"Guideline for the Treatment and Use of Reclaimed Water". The state has defined three
levels of reclaimed water quality: R-l, R-2 and R-3. Simply put, R-3 quality water has
been through a secondary treatment process, R-2 water has undergone secondary
treatment and disinfection, and R-l water has been treated through a secondary treatment
process, filtration, and disinfection. For the purposes of water reuse in a residential
setting, R-l quality water is always required with one exception. (This exception is that
R-2 quality water can be used in a residential setting if subsurface irrigation is used)
Therefore, all references to reclaimed water in this report will be specific to R-l quality

water unless otherwise stated. According to the State DOH, R-l quality water is defined
as follows:
"R-l water (significant reduction in viral and bacterial pathogens)" means
reclaimed water that has been oxidized, filtered, and disinfected to meet the
following criteria:
A. A disinfection process that, when combined with the filtration
process, has been demonstrated to reduce the concentration of plaque-
forming units of F-specific bacteriophage MS, or polio virus, per unit
volume of water in the wastewater that will occur during the
reclamation process. A virus that is at least as resistant to disinfection
as polio virus may be used for purposes of the demonstration.
B. Fecal coliform bacteria densities as follows:
(1) The median density measured in the disinfected effluent does
not exceed 2.2 per 100 milliliters utilizing the bacteriological
results of the last seven days for which analyses have been
completed; and
(2) The density does not exceed 23 per 100 milliliters more than
one sample in any 30-day period; and
(3) No sample shall exceed 200 per 100 milliliters.
(Hawai'i State DOH, 1993: Addendum No. 1, October 27,1998)
This list is the basic requirement for R-l quality water, although other requirements
also exist due to regulations placed on the processes necessary to create R-l quality
water.
10

First, there are requirements for filtration of secondary effluent that must be met. In
order to use secondary effluent for reuse purposes, the secondary effluent must have a
turbidity of 5NTU or less. Additionally, after filtration, the water must have a turbidity
of 2NTU or less. If either of these two turbidity levels is not met, all non-compliant
water must be diverted to another purpose other than reclaimed use. These strict
requirements make the goal of creating R-l quality water at a residential unit very
difficult. Already regulations require two continuously recording turbidimeters to
monitor the effluent water from the WTPU and the filtration process. This process greatly
increases the cost of a home reclamation system, thus, making this process less desirable
for the average homeowner.
Many requirements also exist for the disinfection step of creating R-l quality water,
specifically when using ultraviolet light to accomplish the disinfection process. First,
there are additional water quality standards that must be measured. The minimum
allowable wastewater transmittance is 55%. This will likely be met if the wastewater
turbidity is less than 5NTU; but since it is a required water quality parameter, it must be
measured. Thus, a meter to measure transmittance is required in the overall system.
Secondly, UV disinfection requires a great deal of maintenance compared to other
disinfection processes. As a minimum, the DOH guidelines require alarms to monitor:
(1) Flow rate
(2) Fluid transmittance
(3) Turbidity
(4) Liquid level in UV disinfection channels
(5) Status of each UV bank, on/off
11

(6) Status of each UV lamp, on/off
(7) UV intensity measured by at least one probe per bank.
(8) Lamp age in hours
A quick observation of the above list lends great insight to the amount of
monitoring required before an ultraviolet disinfection process can be operational. This
list requires a flow meter, a turbidimeter, a photometer (to measure transmittance) and
various electronic float switches, valves, and other electronic devices to monitor the
disinfection process. Also, current guidelines require that a water reclamation system
have a backup power supply for all electrical systems in the processing of the reclaimed
water, especially the UV system. Finally, other requirements for an ultraviolet
disinfection system are that the system must be able to deliver a minimum dose of 140
mW-s/cm2 at an average design flow and 100 mW-s/cm2 at a peak flow; and that this
delivery must be achieved with a minimum of three UV banks in series.
2.1.2 R-2 Quality Water
According to the State DOH, R-2 quality water is defined as follows:
"R-2 Water (Disinfected Secondary-23 Reclaimed water)" that has been oxidized,
and disinfected to meet the following criteria:
A. Fecal coliform bacteria densities as follows:
1. The median density measured in the disinfected effluent does not exceed 23
per 100 milliliters utilizing the bacteriological results of the last seven days for
which analyses has been completed; and
12

2. The density does not exceed 200 per 100 milliliters in more than one sample
in any 30-day period.
As shown above, the requirements for R-2 quality water are much less stringent than
R-l quality water; however, the uses are much more limited. This is especially true of
using R-2 water in a residential area. Currently, the Hawai'i State DOH only allows for
R-2 water to be used in subsurface irrigation (drip irrigation) and where managed by an
irrigation supervisor. Therefore, since R-2 water can only be used for one purpose in a
residential setting, the desire to create R-2 water is severely diminished. This desire is
further diminished considering the impracticality of drip irrigation using R-2 water.
Studies show that the major clogging problems associated with drip irrigation are due to
the presence of suspended particles in the irrigation water (Adin, 1987; Asano, 1999).
Therefore, since R-2 water is unfiltered, it would make a poor source for a drip irrigation
system.
In addition to the microbial requirements for R-2 water, the disinfection process
also has some guidelines to follow. (Specific to the testing performed in this study, was
chlorination using Trichloro-s-triazetrione tablets.) Therefore, the guidelines for
chlorination to meet disinfection requirements for R-2 water are applicable. The State
DOH guidelines outline the following three paragraphs for the necessary requirements of
a chlorination disinfection process:
Level 2 Chlorination which meets the requirements of disinfection for R-2 water and
is exposed to chlorine in a well baffled contact basin or pipeline that provides:
1. A chlorine contact time and residual, either or both of which differ from that cited
in paragraph (2) below, that have been shown to the satisfaction of DOH to
13

reliably reduce the concentration of fecal coliform bacteria so that at some
location in the treatment process the median number of fecal coliform bacteria in
the effluent, as determined by approved laboratory methods, does not exceed 4
per 100 milliliters, as determined from the bacteriological results of the last seven
days for which analyses have been completed, and the number of total coliform
bacteria does not exceed 50 per 100 milliliters in any sample; or
2. A theoretical chlorine contact time of 15 minutes or more and an actual modal
contact time of 10 minutes or more throughout which the chlorine residual is 0.5
mg/L or greater, and the median number of fecal coliform bacteria in the effluent,
as determined by approved laboratory methods, does not exceed 4 per 100
milliliters, as determined from the bacteriological results of the last seven days for
which analyses have been completed, and the number of fecal coliform bacteria
does not exceed 50 per 100 milliliters in any sample; and
3. Automatic control of chlorine dosage and automatic, continuous measuring and
recording of chlorine residual shall be provided. The chlorination facilities shall
have adequate capacity to maintain a residual of 2 mg/L.
Note that the chlorination process guidelines in the State DOH manual cite lower
concentrations for fecal coliforms than the overall requirements for R-2 water. This
discrepancy most likely occurs because the definitions for R-l and R-2 water were
amended in a revision five years after the reuse guidelines were originally written.
Therefore, the chlorination process guidelines should reflect the less stringent
requirements stated earlier in the definition of R-2 water.
14

2.2 History and Theory of Filtration
Filtration is probably the oldest form of drinking water treatment, or at least the oldest
effective form of treatment. A collection of medical lore written in Sanskrit around 2000
BC directs that foul water should be boiled, exposed to sunlight, filtered and then cooled
in an earthen vessel (Baker 1981). Other records from Egyptian, Biblical, Greek and
Roman records also describe methods to treat water, some of which discuss filtering
water through granular media. Although the mechanics involved in filtration are more
well known today, the overall process is still fairly similar. In fact, rapid sand filters are
still commonly used as the final clarifying step at most municipal water treatment plants
in the U.S. (Vigneswaran et al., 1995). In the United States, the history of filtration
begins with Albert Stein, who engineered the first sand filter for municipal use in
Richmond VA in 1832 (Baker, 1981). The first attempt to create an upflow filter made of
sand and gravel with a reverse flow cleaning system was a failure, but not long after, this
sand filtration system, as well as others, were up and running in the U.S.
Filtration is a physical process that separates solids of varying sizes from the
liquid. Removing suspended material from the water is the major purpose of filtration
(measured as turbidity). Lowering the turbidity of the water is important because the
suspended particles can act as a shield and prevent the microorganisms from coming into
contact with the disinfectant (usually the following step in water and wastewater
treatment). In some cases the particles can combine chemically with the suspended
solids, leaving less disinfectant to combat the microorganisms (AWWA, 1984). Thus,
removing suspended particles through filtration greatly assists the following process of
disinfection. Filtration occurs when water passes through a medium of granulated
15

material such as sand, anthracite, or granular activated carbon. There are various
processes by which the particles in suspension in the water separate out of the water and
stay in the filtering medium. Often times the process by which the particle separates
from the water is due to particle size, but there are many other physical and chemical
forces at work.
The first filtration mechanism is called straining. Straining occurs when particles that
are larger than the pore sizes between the filtering medium are trapped in the filter. This
filtration mechanism is only effective for the largest particles in suspension since the
particles, which are desirable to remove, are much smaller than the filter medium
particles in the filter. For example, in this study a sand grains of 0.5mm (500um) and
0.1mm (lOOum) were chosen for the dual-medium sand filter. The pore size for this sand
is much greater than the colloidal particles (5|xm and less) which this filter is intended to
remove to some degree. Therefore, since many of the colloids can be greater than 100
times smaller than the filter medium, there must be additional forces at work in a sand
filter to make it effective.
The second type of filtration is sedimentation. Sedimentation occurs within pore
spaces of the sand particles where the flow is slow enough to cause the particle to settle
out of the flow. This is one reason why the filtration rate in a filter is so important. On
one hand, a faster flow through the filter determines the size needed for an overall filter
design; however, increased flow rate makes the flow through the filter media pores much
more rapid and increases headloss. This in turn limits quiescent flow zones in the sand
filter where particles can settle out of the flow. Thus, filtration rate is a vitally important
factor in filtration design.
16

A similar filtration mechanism to sedimentation is impaction. Like sedimentation,
some particles settle out of the flow and onto the filter media. Unlike sedimentation,
however, impaction occurs when the suspended particle becomes lodged in the filtering
media due to the force of the flow causing the particle to impact the filtering media.
Consequently, the suspended particle can no longer follow the flow stream.
Another filtration mechanism is interception. Interception occurs when a suspended
particle comes in contact with the filtering medium. This contact slows the inertia of the
particle, causing it to no longer follow the flow of the water in the filter. Again, filtration
rate plays a major role in this mechanism. If the filtration rate is increased, the force
needed to overcome the friction force that keeps the particle out of suspension will
increase. Once again this particle would be in suspension. Ultimately, the loss of this
filtration mechanism due to an increased filtration rate could increase the turbidity of the
final effluent.
Adsorption is another major mechanism involved in filtration. Adsorption occurs
when particles contact and adsorb (or stick) onto the surface of the filter medium or onto
previously deposited material. Adsorption can occur through chemical bonding and
interaction, or it can occur through physical forces. Electrostatic, electrokinetic, and Van
der Waals forces are some of the physical forces that can attract a suspended particle out
of the flow stream. The effectiveness of adsorption depends most on the type of filter
medium used and the overall specific surface area of the filter medium.
Finally, flocculation and biological growth are the other processes involved in
filtration. Removal of particles through biological growth in the filter is especially
important in slow sand filters (Vigneswaran, 1995). Biological growth can be a nuisance
17
in rapid sand filters, however, causing a major impact on headloss. Biological growth
can even cause an increase in turbidity due to the slough-off of biological films in the
filter (Asano, 1998). Thus, the desirability of biological growth in a filter highly depends
on filter type. Flocculation in a filter is primarily caused by the addition of chemical
additives. The addition of chemicals is part of the coagulation/flocculation process that
often precedes filtration to increase the particle size of the particles that are desirable to
be removed. Proper flocculation time and mixing rate determines the effectiveness in the
filtration process. Thus, the coagulation/flocculation process prior to filtration controls
the overall effectiveness of flocculation in the filter.
Depending on the purpose of the filtration process (to treat drinking water or
wastewater), different filtering mechanisms play the largest role in removing particles
from the water. A well-known source, Wastewater Engineering: Treatment, Disposal and
Reuse (Metcalf and Eddy, 1991) claims that straining is the most important mechanism
for removing particles and consequently all mathematical models are based on this
assumption. However, Introduction to Water Treatment (AWWA, 1984) claims quite the
opposite. The American Water Works Association claims that straining is the least
important filtering mechanism and that adsorption is the predominant factor for removing
particles from the water. The primary difference between drinking water and wastewater
filtration lies in the analysis of particle size distribution. One study at the County
Sanitation Districts of Los Angeles County shows that the turbidity of varying
wastewater effluents are largely impacted by the size of particles in the wastewater
(Asano, 1998). This study shows that in some cases, the particles in the 5|im range and
higher are the primary cause of turbidity. While in other cases, particles in the colloidal
18
range of 0.01p.m to 2fjm are mainly responsible for the turbidity. This analysis of
particle size is key in determining the primary filtration mechanism to remove suspended
particles. If the particles are larger (as is the case in wastewater treatment), the
mechanism of straining will play a much more important role in removing suspended
particles. In contrast if the particles are in the smaller range (typical of drinking water),
then adsorption is probably the predominant mechanism to remove suspended particles.
Mathematical models are rarely used in designing a filter. Most of the
time, filter design is based on previous experience. Previous experience states that there
are two main types of sand filters: slow sand filters and rapid sand filters. Slow sand
filters were first introduced in the U.S. in 1872 (AWWA, 1984). Slow sand filters rely on
fine sand and a sticky mat of suspended material called a "Schmutzdecke". This layer
forms on the surface of the sand bed and may take as long as two weeks to form before
the filter can effectively be used to remove turbidity. Formation of a schmutzdecke
requires very low flow rates (0.05 gpm/sf). Consequently, since the schmutzdecke is
vitally important to a slow sand filter, the filter is not regularly cleaned. Instead, slow
sand filters are cleaned by scraping off the schmutzdecke and the top 6 inches of sand
only after a noticeable change in the effluent quality occurs. The sand is then washed and
replaced and a new schmutzdecke forms. Slow sand filters are only occasionally used to
treat drinking water and are not commonly used in wastewater treatment.
The other major type of filter is rapid sand filters. A rapid sand filter can
accommodate a flow rate 40 times that of a slow sand filter (2gpm/sf). Additionally,
rapid sand filters can be backwashed since they do not rely upon the formation of a
schmutzdecke to remove suspended particles. (A mat layer is formed in rapid sand filters
19

which slightly improves filter performance, however, it is not vitally important to the
overall performance of the filter.) Backwashing is a process where water is forcefully
passed through the filter in direction opposite of the normal flow. Over time (usually
between 15-36 hours at the operational filtration rate) a sand filter will fill with collected
material and dramatic loss in head will be observed. Backwashing removes nearly all the
collected particles in a sand filter and cleans the filter media of collected material. This
cleaning allows for the filter to once again be useful at reducing the turbidity. The
backwash process usually uses between 3-6% of the total amount of water filtered
(Vigneswaran, 1995). In addition, the backwash water is returned to an earlier process in
the overall treatment of the water.
Within the classification of rapid sand filters, two main subcategories exist:
gravity and pressure rapid sand filters. Simply put, the flow through a gravity filters is
due to the force of gravity. For a pressure filter, the flow through the filter medium is due
to the amount of pressure applied. Interestingly, the filtration rate for both types of filters
is about the same. The major advantage to a pressure filter is that air binding (or the
creation of a negative head within the filter) will not occur. Since pressure filters are
within an enclosed container, however, they cannot be observed for problems until an
increase in turbidity is noticed. Therefore, due to their ease of maintenance and minimal
operational cost, gravity rapid sand filters are the most common type of filter in use
today.
There are many types of filter bed options available depending upon the type of
use and the characteristics of the water to be treated. Bed types range from shallow,
mono-medium stratified beds, to mono-medium unstratified beds, and even to dual and
20

multi-medium stratified beds. Bed depths can range from 6 to 84 inches and effective
grain size can range from 0.2mm to 4mm (Metcalf and Eddy, 1991). The effectiveness of
a filter highly depends on its type and the characteristics of the water to be filtered, thus,
pilot studies are always recommended to aid in filter design. In general, however,
turbidity removal efficiencies of 70% can be achieved for waters with an initial turbidity
of 5.0NTU or greater (Asano, 1998). In addition, the effective turbidity removal
generally decreases as the turbidity of the influent water decreases.
21

2.3 History and Theory of Ultraviolet Disinfection:
The germicidal disinfection capability of ultraviolet light has been recognized since
the early 1900's. In fact, the U.S. has recorded its use at municipal drinking water
systems since 1929 when an eight-lamp system was installed in Berea Ohio. (Hansen &
Sawyer, 1992) Due to the evolution of chlorination technologies however, UV
disinfection all but disappeared. Disinfection using chlorine is now the most common
form of disinfection in the world. Approximately 60 percent of the 20,000 municipal
wastewater treatment plants in North America use Chorination, 24% use
Chlorination/dechlorination, 15% use UV irradiation and 1-2% use ozonation. (Reed,
1998).
Disinfection using chlorine is preferred over other methods for many reasons. First,
using chlorine has traditionally been the most cost-effective form of disinfection. Since
cost drives most issues, this method is obviously the most common. Secondly,
chlorination is an established technology hence design issues are well understood. This is
an especially important decision factor for small communities needing to build a
wastewater treatment plant. Finally, chlorination processes easily meet disinfection
standards, while other methods require a greater level of system monitoring and
management.
In the last 10+ years however, using ultraviolet light to disinfect drinking water and
wastewater has grown rapidly. This resurgence of a relatively old disinfection process is
due to a variety of reasons, probably the largest reason for the renewed interest being
cost. The development of new lamps and ballasts has reduced the cost of UV disinfection
systems. Also, as UV disinfection system become more popular, design costs are
22

reduced. Perhaps the primary reason for UV disinfection systems being more cost
effective may be due to the increase cost for chlorination disinfection. New regulations
from state and federal authorities are causing this increase. In 1993, many states adopted
the Building Officials and Code Administrators National Fire Code. This code included
some stringent measures for handling hazardous materials. Two hazardous materials
named in the Code were chlorine gas and sulfur dioxide, chemicals that are used in
chlorination/dechlorination processes. When the additional costs associated with the new
safe storage and handling procedures are taken into consideration, chlorine disinfection
doesn't look as attractive as it used to. Consequently, a growing number of wastewater
treatment facilities are opting to use UV technology instead of chlorination for
disinfection purposes.
Disinfection using ultraviolet radiation is effective because of its damaging effects on
DNA. In particular, UV light between the 230nm to 270nm spectrum (Reed, 1998) is
absorbed by DNA cells and inactivates the biological organism rendering it unable to
proliferate and thus, unable to cause disease. This process is a physical process. It is
different from chemical processes (such as chlorination) where the chemical disinfectant
disrupts cell functions, which kills the organism.
UV light is produced when mercury vapor is excited by electricity. This type of
lamp, when manufactured at a pressure of approximately 10"2 torr (1/760 of standard
atmospheric pressure), will produce a monochromatic wavelength with 85% of the
lamp's output at 253.7nm (Linden, 1998). This type of lamp is called a low-pressure,
low-intensity UV lamp. Low-intensity lamps usually operate at a power of 65 (Reed,
1998) to 85 watts, are usually 2.5 to 5 ft in length, and 0.6 to 0.8 inches in diameter
23
(Metcalf & Eddy, 1991). Low-intensity lamps are effective at producing wavelengths
well suited for germicidal purposes, yet the low intensity of the lamp can make treatment
of large quantities of water difficult. In the city of Calgary in Alberta, Canada, the largest
low-intensity lamp wastewater treatment facility in the world operated 11,520 lamps
treating a flow of 265 million gallons per day. This system would be a maintenance
nightmare.
Medium-pressure, high-intensity UV lamps is the most common system now being
used for larger flow treatment plants. High intensity mercury vapor lamps operate at a
pressure of approximately 103 torr and use between 5,000 and 30,000 watts per lamp
(Reed, 1998). A high-intensity lamp is much less efficient at producing germicidal
wavelengths: 20 to 40% in the germicidal range (Linden, 1998). Due to the much higher
operating power, however, the high-intensity lamps can generate 50 to 80 times the
germicidal UV output than a low-intensity lamp (Asano et al., 1998). For this reason,
one high-intensity lamp can replace many low-intensity lamps. This is extremely
advantageous from a maintenance point of view. Therefore, as a typical rule of thumb,
medium-pressure, high-intensity lamps are now recommended for wastewater treatment
plants with flows greater than lOmgd (Reed, 1998).
An another important fact to know about UV disinfection is the role that the
wastewater quality has on the effectiveness of the ultraviolet light to disinfect the water.
Since UV radiation is only effective if the light penetrates the cell wall of the targeted
organism, anything that will protect or shield the organism from the UV light hinders the
effectiveness of this disinfection process. Therefore, the total suspended solids (TSS)
concentration plays a major role in the ability of UV light to effectively disinfect the
24

wastewater. Additionally, even smaller particles than those typically measured in a TSS
test can influence the effectiveness of UV disinfection.
TSS is usually measured by collecting all suspended solids on a glass fiber filter with
an approximate pore size of 1.6\im. Since bacteria and other colloidal particles can pass
through this filter, their mass is not part of the TSS measurement. Even the small
colloidal particles approximately the same size as one bacterial organism can temporarily
shield the bacteria from the damaging effects of the UV light. The measurement of the
absorbance or deflection of the ultraviolet light in the germicidal range is called
transmittance. Transmittance is the measurement of the percent of light at the 254nm
wavelength that passes straight through a water sample. This is an important
measurement because it is an indicator of the required dose necessary for effective
disinfection. If the percent of transmittance is high, then this means that there are
relatively few organisms, colloidal particles, or organic particles blocking or absorbing
the transmission of UV light through the sample. In other words, the intensity throughout
the water sample will be relatively high (or close to the actual intensity of the lamp). On
the other hand, if the percent transmittance is low, then this means that there are many
organisms, colloidal particles, or organic particles blocking or absorbing the transmission
of UV light through the sample. Therefore the intensity of UV light in the water will be
lower that the actual intensity of the lamp. It will also vary throughout the water sample
due to the dispersion of light from bacterial or colloidal adsorption. In conclusion, a
lower percent transmittance requires a higher UV dose to obtain inactivation of the water
sample.
25

Different microorganisms are more or less resistant to UV light. In general, the
smaller organisms require less of a UV dose to render them biologically inactive. For
example, the EPA requirement for viral inactivation of the hepatitis A virus is between 21
and 31 mW-sec/cm2 (Hansen and Sawyer, 1992). This is a much smaller dose than a
dose of 140 mW-sec/cm2 which is required by the State of Hawai'i to obtain levels of
fecal coliform that is satisfactory for reclaimed water use (Hawai'i DOH, 1993). As we
can see from these regulations, some viruses are easier to inactivate than some bacteria.
This generalization in size, however, is not always true. For example, the MS2
coliphage, F specific single stranded RNA virus has been shown to be more resistant to
UV light than fecal or total coliform bacteria (Braunstein et. al., 1996). Other organisms
such as Giardia Lamblia and other protozoan pathogens are considered to be unaffected
at most commercially available ultraviolet doses (Hansen and Sawyer, 1992).
When determining the effectiveness of ultraviolet disinfection, it is important to
know the received UV dose. A received UV dose is the amount of germicidal UV light
that actually reaches a given microorganism. This is different from an applied dose,
which is based on the power of the UV lamp. The absorption of UV light by dissolved
compounds, suspended colloidal particles and other microorganisms is the cause for this
difference.
There are two basic methods for determining a received UV dose. The first common
method is a bioassay, which uses directly focused beams of ultraviolet light (produced in
a laboratory setting) at a known intensity over a given period of time to measure the
amount of deactivation of a selected microorganism in a water sample. The enumeration
of the remaining reproducible microorganisms is used to determine the relationship
26
between the reduction of microorganisms for different UV doses. Then using samples
obtained from an operational onsite UV system, the measured reduction can then be
compared with the reductions obtained from the laboratory results. Once similar
reductions are observed between the two measurements, the relationship between
microbial reduction and the UV dose achieved in the laboratory can be used to estimate
the received UV dose in the onsite UV system.
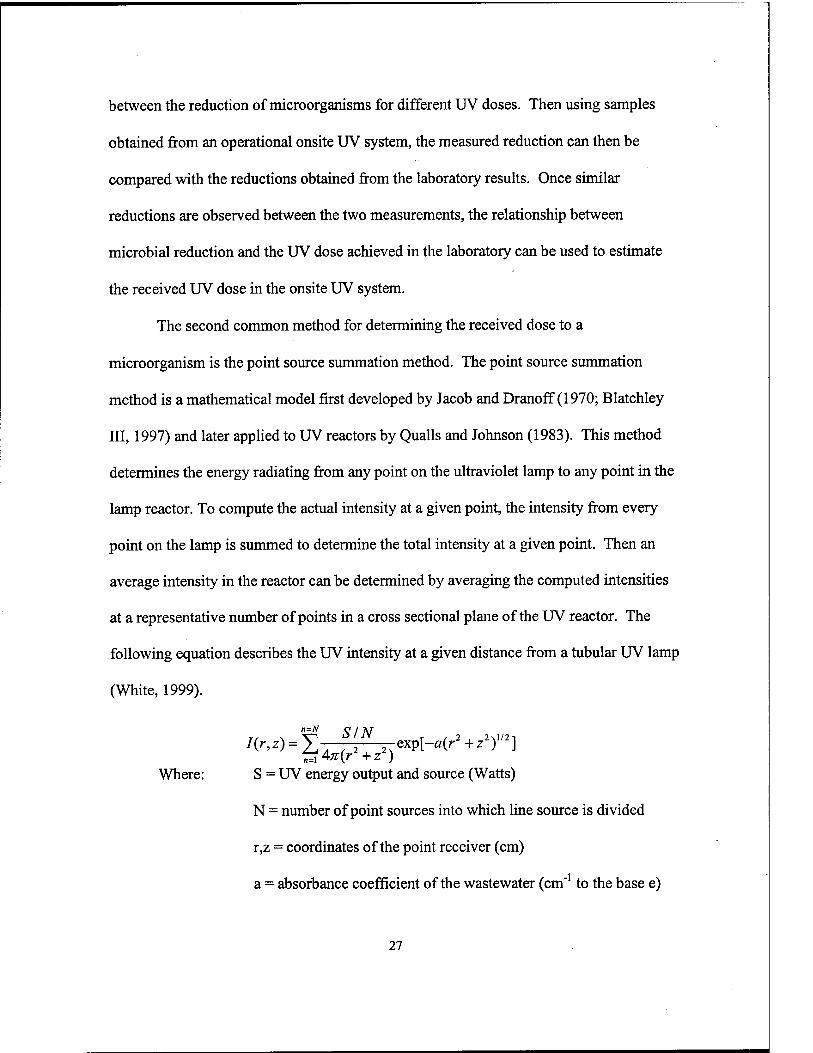
The second common method for determining the received dose to a
microorganism is the point source summation method. The point source summation
method is a mathematical model first developed by Jacob and Dranoff (1970; Blatchley
III, 1997) and later applied to UV reactors by Quails and Johnson (1983). This method
determines the energy radiating from any point on the ultraviolet lamp to any point in the
lamp reactor. To compute the actual intensity at a given point, the intensity from every
point on the lamp is summed to determine the total intensity at a given point. Then an
average intensity in the reactor can be determined by averaging the computed intensities
at a representative number of points in a cross sectional plane of the UV reactor. The
following equation describes the UV intensity at a given distance from a tubular UV lamp
(White, 1999).
t?4;r(r2+z2) Where: S = UV energy output and source (Watts)
N = number of point sources into which line source is divided
r,z = coordinates of the point receiver (cm)
a = absorbance coefficient of the wastewater (cm"1 to the base e)
27

Once the average intensity is determined, the average UV dose is calculated by
multiplying the intensity by the average time a volume of water remains in the reactor.
Case Study (Braunstein et. al., 1996)
Ultraviolet disinfection is gaining popularity as a disinfection alternative in the
production of reclaimed water since UV disinfection has been shown to be an effective
treatment method for disinfection even when low microbial concentrations are required,
as in strict water reclamation regulations. A study at the University of California, Davis
recently tested the effectiveness of using UV disinfection for reuse applications by
applying it to filtered activated sludge effluent. The study was performed with two main
objectives:
1. Assess the performance of a specific UV system in meeting stringent reuse
criteria
2. To compare the results obtained in determining UV dose by the PSS method
with results obtained from a bioassay.
The study used a sand filter made by Dynasand. The filter design was a continuous-
backwash, deep-bed, granular medium upflow filter using 0.9mm sand with a uniformity
coefficient of 1.5. Additionally, the sand filter operated at an applied flow rate of 7.1
gpm per ft2 and without any chemical addition. Fischer & Porter Ltd. manufactured the
UV disinfection system used in this experiment. The designed system consisted of a
stainless steel open channel with three UV banks in series. Each UV bank contained four
lamps with arc lengths of 148.4cm oriented parallel to the fluid flow direction. Each lamp
operated at 26.7 W and was encased in a fused quartz sleeve and completely sealed with
28

O-rings. The UV disinfection system was operated at a flow of 74gpm with an adjustable
outlet weir to keep the height of the water at a constant height.
Testing of this system consisted of measuring total and fecal coliforms, and MS2
coliphage, F-specific single stranded RNA virus. At each test run, and in each UV bank,
the experimenters took samples to measure the selected microorganisms. Also, the point
source summation method was determined at each test run based on the UV bank
configuration and the transmittance.
The results of the 22-week study showed that the Dynasand filter met the desired
turbidity of less that 2NTU approximately 84% of the testing days and never exceeded
2.5NTU. Also, the filtered effluent yielded an average transmittance of 80.2%. The
results from the bioassay showed that reuse standards of less than 2.2 CFU/100mL was
met for fecal coliform after a dose of 112mW-sec/cm2 and 168mW-sec/cm2 for total
coliform. The study also confirmed that MS2 coliphages were more resistant to UV
disinfection that the coliform bacteria. The results of the point source summation method
showed that an equivalent estimate of the UV dose could be obtained using this method
(within a 95% confidence interval).
Another interesting result of this test concerned the maintenance of the UV
disinfection system. During the first 50 days of the test the UV lamp quartz casings were
cleaned daily. But during the last 90 days of the test, no cleaning was performed on the
quartz sleeves at all. The results showed that no difference in coliform counts resulted
between the two periods and no buildup was observed on the lamps in either period.
29

Chapter 3 Methods
3.1 System Construction:
In order to create R-l quality water, filtration and disinfection processes are
required in order to meet the State DOH guidelines. In this experiment to create R-l
quality water a dual-medium, unstratified sand filter was used to fulfill the filtration
process. A single-lamp ultraviolet radiation system was used to perform the disinfection
process. A picture of the constructed unit, which is attached to the wastewater treatment
package unit, is shown
in Figure 3.
First, the effluent
from the wastewater
treatment package unit
was diverted from its
normal route which
discharged all treated
effluent back into the
main channel of the incoming wastewater for Sand Island Wastewater Treatment Plant.
Rerouting was achieved by placing a 2-inch by 1-inch tee onto the effluent discharge
pipe. Then a 2-inch valve was installed to control flow returning to the untreated
wastewater channel, and a 1-inch valve was installed to control flow to the filtration /
disinfection processes (Figure 4).
30
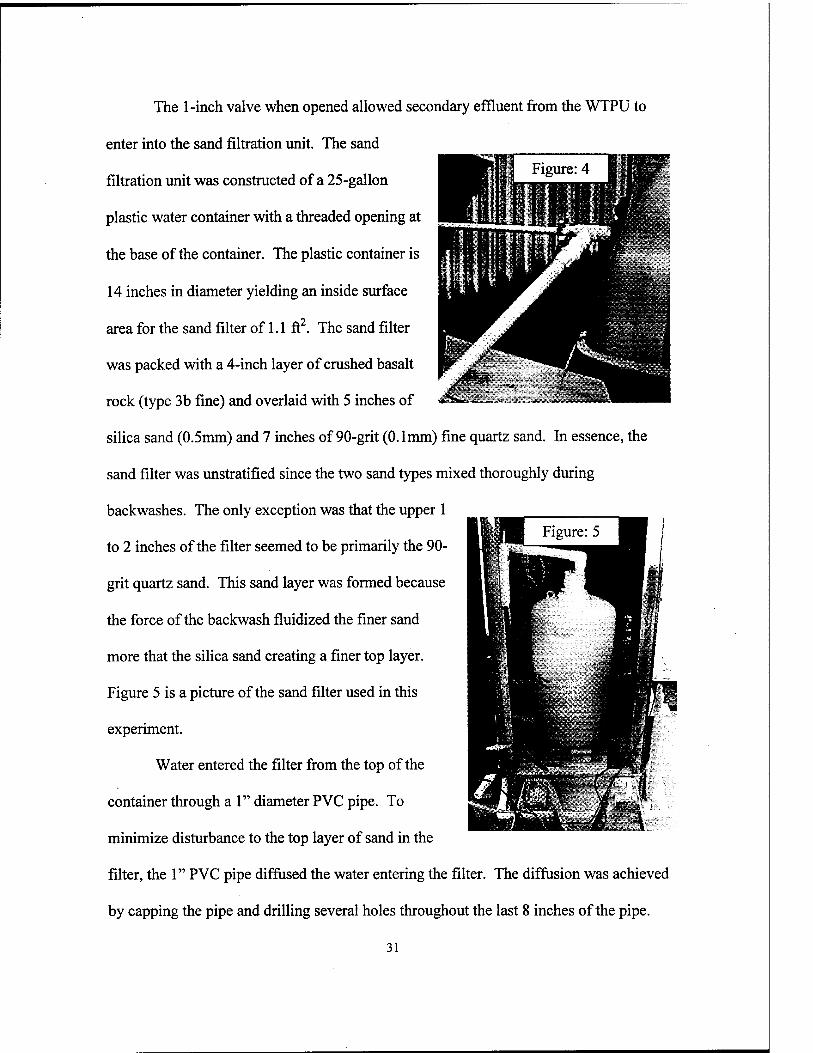
The 1-inch valve when opened allowed secondary effluent from the WTPU to
enter into the sand filtration unit. The sand
filtration unit was constructed of a 25-gallon
plastic water container with a threaded opening at
the base of the container. The plastic container is
14 inches in diameter yielding an inside surface
area for the sand filter of 1.1 ft2. The sand filter
was packed with a 4-inch layer of crushed basalt
rock (type 3 b fine) and overlaid with 5 inches of
silica sand (0.5mm) and 7 inches of 90-grit (0.1mm) fine quartz sand. In essence, the
sand filter was unstratified since the two sand types mixed thoroughly during
backwashes. The only exception was that the upper 1
to 2 inches of the filter seemed to be primarily the 90-
grit quartz sand. This sand layer was formed because
the force of the backwash fluidized the finer sand
more that the silica sand creating a finer top layer.
Figure 5 is a picture of the sand filter used in this
experiment.
Water entered the filter from the top of the
container through a 1" diameter PVC pipe. To
minimize disturbance to the top layer of sand in the
filter, the 1" PVC pipe diffused the water entering the filter. The diffusion was achieved
by capping the pipe and drilling several holes throughout the last 8 inches of the pipe.
31
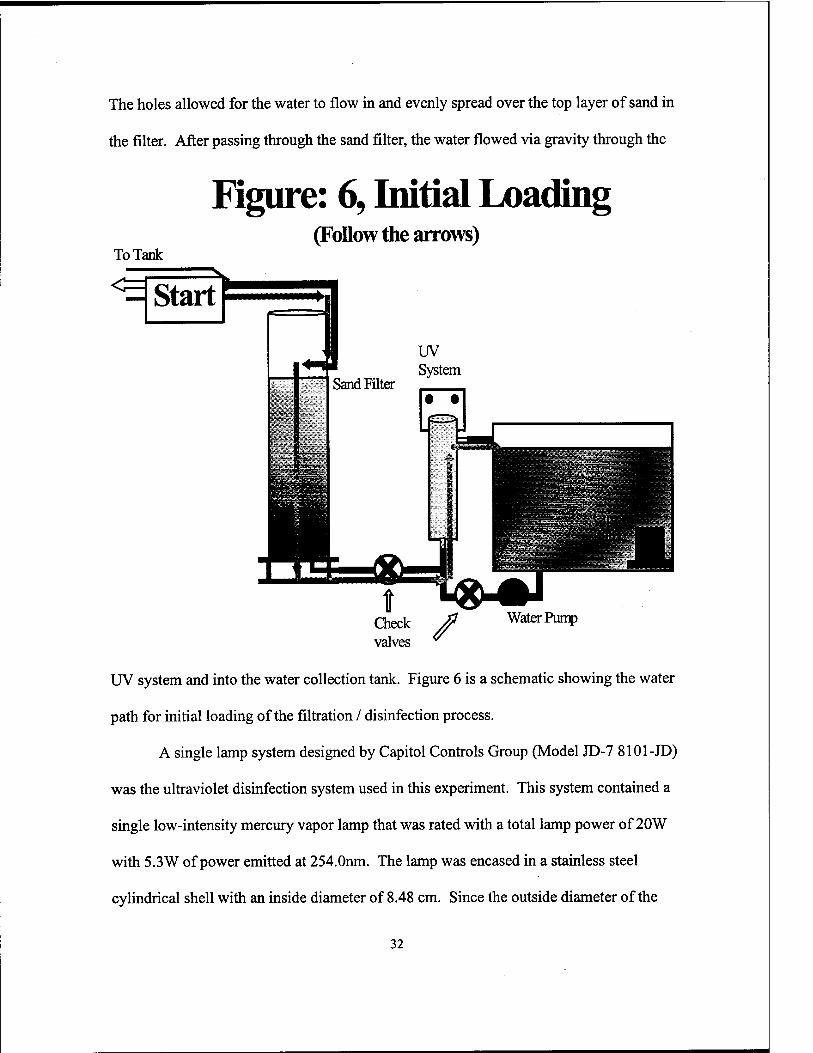
The holes allowed for the water to flow in and evenly spread over the top layer of sand in
the filter. After passing through the sand filter, the water flowed via gravity through the
Figure: 6, Initial Loading (Follow the arrows)
To Tank
Water Pump
valves
UV system and into the water collection tank. Figure 6 is a schematic showing the water
path for initial loading of the filtration / disinfection process.
A single lamp system designed by Capitol Controls Group (Model JD-7 8101-JD)
was the ultraviolet disinfection system used in this experiment. This system contained a
single low-intensity mercury vapor lamp that was rated with a total lamp power of 20W
with 5.3W of power emitted at 254.0nm. The lamp was encased in a stainless steel
cylindrical shell with an inside diameter of 8.48 cm. Since the outside diameter of the
32

Figure: 7 Ultraviolet Disinfection System
Manufacturer: Capital Caitrols Group (Model JD-7 8101 -JD)
Lamp Power (Total): 20W (@254nm): 5.3W
Lamp arc length: 27.1cm Inside diameter of shell: 8.48cm Outside diam of quartz sleeve: 2.45cm Reactor volume: 1.4L Rated Flow: 7gpm Rated contact time: 3.18sec. Tested Flow: -3.8 gpm Tested contact time: ~5.84sec.
quartz sleeve was 2.45 cm
and the lamp arc length
was 27.1cm, a total
reactor volume of 1.4L or
0.37Gal. was calculated.
The manufacturer's rated
flow was 7gpm, and the
rated contact time was
3.18 sec. Additionally,
the intended use for this
system was to provide
added disinfection to
drinking water; and thus,
the designed received U
dose for this system was influent!
30mW-sec/cm2 (assuming a percent transmittance of 95%). Figure 7, is a drawing of the
UV system. A picture of the actual system can be seen in Figure 8.
There are two distinct tests that were conducted to measure the effectiveness of
the on-site UV system. The first test is the once-thru-pass. Figure 9 shows the pathway
for the water in the once-thru-pass. In this test, the centrifugal pump located on the
bottom line of the water collection tank pumped water from the collection tank through
the UV system. Then the water was diverted to an additional collection container before
entering the top of the collection tank again. This configuration ensured that the effluent
33
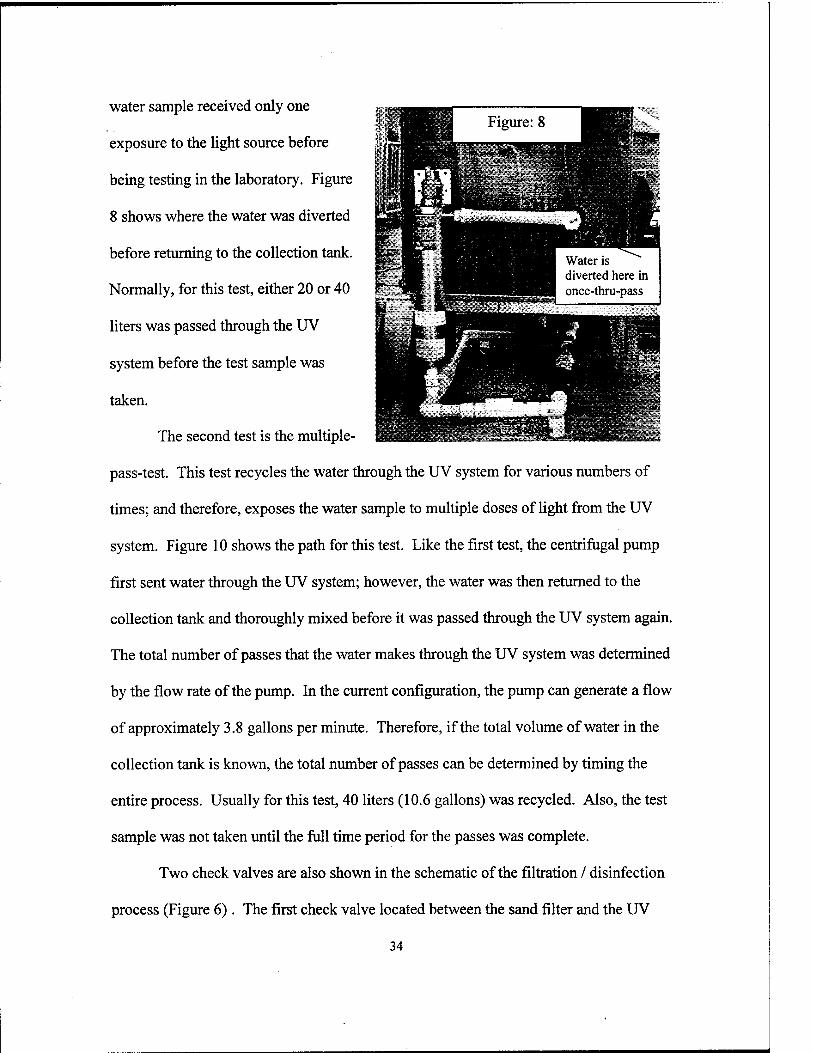
water sample received only one
exposure to the light source before
being testing in the laboratory. Figure
8 shows where the water was diverted
before returning to the collection tank.
Normally, for this test, either 20 or 40
liters was passed through the UV
system before the test sample was
taken.
The second test is the multiple-
pass-test. This test recycles the water through the UV system for various numbers of
times; and therefore, exposes the water sample to multiple doses of light from the UV
system. Figure 10 shows the path for this test. Like the first test, the centrifugal pump
first sent water through the UV system; however, the water was then returned to the
collection tank and thoroughly mixed before it was passed through the UV system again.
The total number of passes that the water makes through the UV system was determined
by the flow rate of the pump. In the current configuration, the pump can generate a flow
of approximately 3.8 gallons per minute. Therefore, if the total volume of water in the
collection tank is known, the total number of passes can be determined by timing the
entire process. Usually for this test, 40 liters (10.6 gallons) was recycled. Also, the test
sample was not taken until the full time period for the passes was complete.
Two check valves are also shown in the schematic of the filtration / disinfection
process (Figure 6). The first check valve located between the sand filter and the UV
34

Figure: 9,Once-Thru-Pass
>
• •
Sample co llected in additional co ntainer.
disinfection unit prevents water from flowing back into the sand filter during either of the
two test runs. The second check valve is located between the UV disinfection system and
the centrifugal pump. This check valve prevents flow to the centrifugal pump and the
bottom feed line of the holding tank during the initial loading process. The use of these
two check valves enabled the system to be designed with only one run of PVC piping.
Otherwise, one complete line would be needed for the initial loading process and one line
would be needed for the testing of the UV system. Additionally, the ultimate design of
disinfecting the water continuously would be compromised. This idea for full-scale
design will be discussed in further detail in a later section.
35
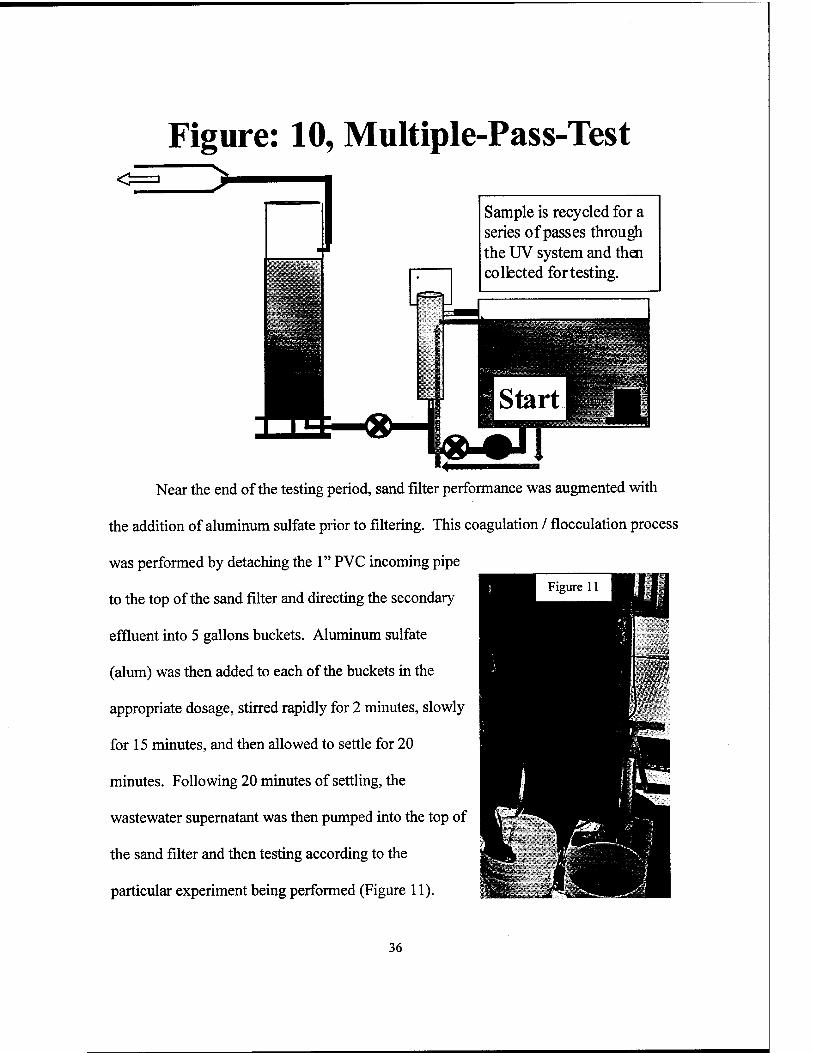
Figure: 10, Multiple-Pass-Test
Sample is recycled for a series of passes through the UV system and then collected for testing.
Near the end of the testing period, sand filter performance was augmented with
the addition of aluminum sulfate prior to filtering. This coagulation / flocculation process
was performed by detaching the 1" PVC incoming pipe
to the top of the sand filter and directing the secondary
effluent into 5 gallons buckets. Aluminum sulfate
(alum) was then added to each of the buckets in the
appropriate dosage, stirred rapidly for 2 minutes, slowly
for 15 minutes, and then allowed to settle for 20
minutes. Following 20 minutes of settling, the
wastewater supernatant was then pumped into the top of
the sand filter and then testing according to the
particular experiment being performed (Figure 11).
36

The final testing performed in this series of experiments determined the
effectiveness of the chlorine tablet disinfection chamber manufactured inside the WTPU.
Until this point, this chamber was not used for disinfection in order to determine the
effectiveness of the constructed filtration / disinfection processes described above. The
volume of the chlorine contact disinfection chamber located inside the WTPU was 5.8
gallons. The chamber was constructed with a small weir that allows overflow into this
chamber from the preceding sections of the WTPU (Figure 12). The weir directed all
flow through approximately a three-inch wide channel. In the center of the channel was a
perforated chlorine tablet canister. The canister rested inside the three-inch channel
where all the overflow water was diverted from the weir. Then, when the canister was
filled with chlorine tablets,
mixing occurred between the
water and the chlorine. Finally,
there was one baffle that
divided the last chamber into
two sections. The baffle was
approximately 12 inches in
depth and prevented the newly
dosed water from leaving the
final chamber before the older water had left. The final chamber had a chlorine contact
time that was completely dependent upon the total flow that was received by this system.
37

3.3 Analytical Procedures:
The following testing procedures were used to measure the performance of the
system constructed:
Standard Method # 9222D. Fecal Coliform Membrane Filter Test
Sample Collection:
1. Collect sample aseptically using a sterile collection bottle (500mL).
2. Place sample in cooler with ice until ready for use.
3. Perform test procedure within 6hrs of collection.
Equipment:
The following equipment was used during this experiment:
1. Membrane Filters (0.45 urn)
2. Tweezers
3. Isopropyl Alcohol
4. Bunsen Burner
5. Sterile 500mL sample collection bottles
6. lOOmL Dilution Bottles
7. Vacuum Filtration Apparatus
8. lOmL Pipettes (O.lmL gradations)
9. Agar Plates (with fecal coliform agar medium)
10. Whirl bags (for 24 hour incubation of agar plates)
11. Precision 260, Circulating Water Bath (for 24 hour incubation of agar plates)
Procedure:
1. Filtration:
38
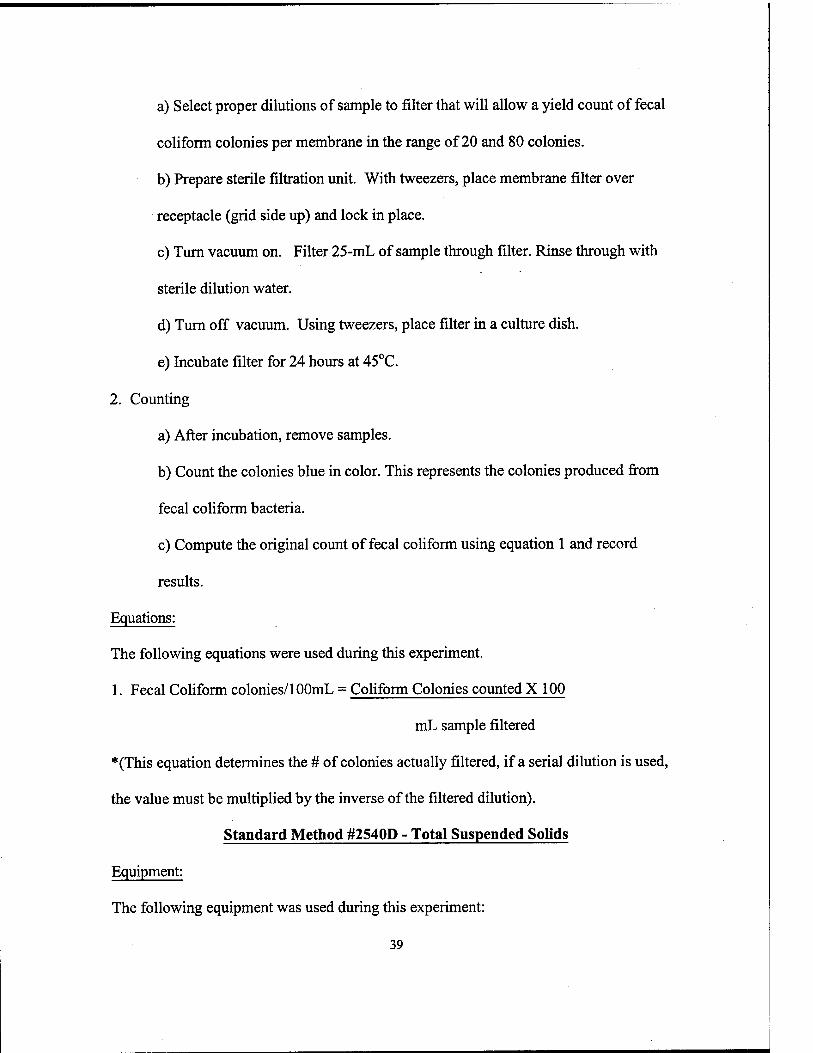
a) Select proper dilutions of sample to filter that will allow a yield count of fecal
coliform colonies per membrane in the range of 20 and 80 colonies.
b) Prepare sterile filtration unit. With tweezers, place membrane filter over
receptacle (grid side up) and lock in place.
c) Turn vacuum on. Filter 25-mL of sample through filter. Rinse through with
sterile dilution water.
d) Turn off vacuum. Using tweezers, place filter in a culture dish.
e) Incubate filter for 24 hours at 45°C.
2. Counting
a) After incubation, remove samples.
b) Count the colonies blue in color. This represents the colonies produced from
fecal coliform bacteria.
c) Compute the original count of fecal coliform using equation 1 and record
results.
Equations:
The following equations were used during this experiment.
1. Fecal Coliform colonies/lOOmL = Coliform Colonies counted X 100
mL sample filtered
*(This equation determines the # of colonies actually filtered, if a serial dilution is used,
the value must be multiplied by the inverse of the filtered dilution).
Standard Method #2540D - Total Suspended Solids
Equipment:
The following equipment was used during this experiment:
39

1. Whatman glass fiber filters (934-AH circles)
2. Aluminum weigh boats
3. 500ml graduated cylinder (5 ml gradations)
4. Vacuum filtration apparatus
5. Vacuum pump
6. Mettler AE200 Analytical Balance (accurate to 0.0001 g)
7. Thelco Model 18 oven (constantly set to 103°C)
Procedure:
1. A new filter (that has been stored in a dessicator) is placed in an aluminum weigh
boat and weighed in grams on an analytical balance. The weight of the filter and
weigh boat is recorded for later use.
2. The collected sample is measured to the nearest lmL using a lOOmL graduated
cylinder. The volume of the sample is recorded for later use.
3. The filter is placed into the vacuum filtration apparatus (above the metal screen) and
the sample is poured though the filtration system so that the entire sample passes
through the inserted filter.
4. Approximately lOmL of distilled water are used to rinse the sides of the glass
filtration apparatus and the graduated cylinder so that all suspended solids in the
sample are on the filter.
5. The filter is then removed from the vacuum filtration apparatus, returned to the weigh
boat and placed in an oven set at a constant temperature of 103°C for a minimum of
24 hours.
40

6. After drying is complete, the filter and weigh boat is removed from the oven and
allowed to cool in a dessicator for a minimum of 10 minutes.
7. Finally, the filter and weigh boat is weighed in grams using the sample analytical
balance in step 1.
8. Using equation 1 in the following section, the TSS concentration can be determined.
Equations:
The following equations were used during this experiment.
Total Suspended Solids: TSS (mg/L) = (A-B)*106 / V
Where: A = Final wt. of filter after drying in 103°C oven (g)
B = Initial wt. of filter (g)
V = Volume of sample filtered (mL)
Standard Method #2540 E - Volatile Suspended Solids
Procedure:
1. Using the same filter and weigh boat from Method #2540D, place the filter and weigh
boat in the 550°C oven for 20 minutes after the TSS has been recorded.
2. After 20 minutes, the filter and weigh boat is removed from the 550°C oven and
allowed to cool in a dessicator for a minimum of 10 minutes.
3. The filter and weigh boat is then weighed in grams using the same sample analytical
balance used in determining the TSS.
4. Using the equation in the previous section, the VSS concentration can be determined.
Standard Method # 5210 B - 5 Day Biochemical Oxygen Demand
Equipment:
The following equipment was used during this experiment:
41
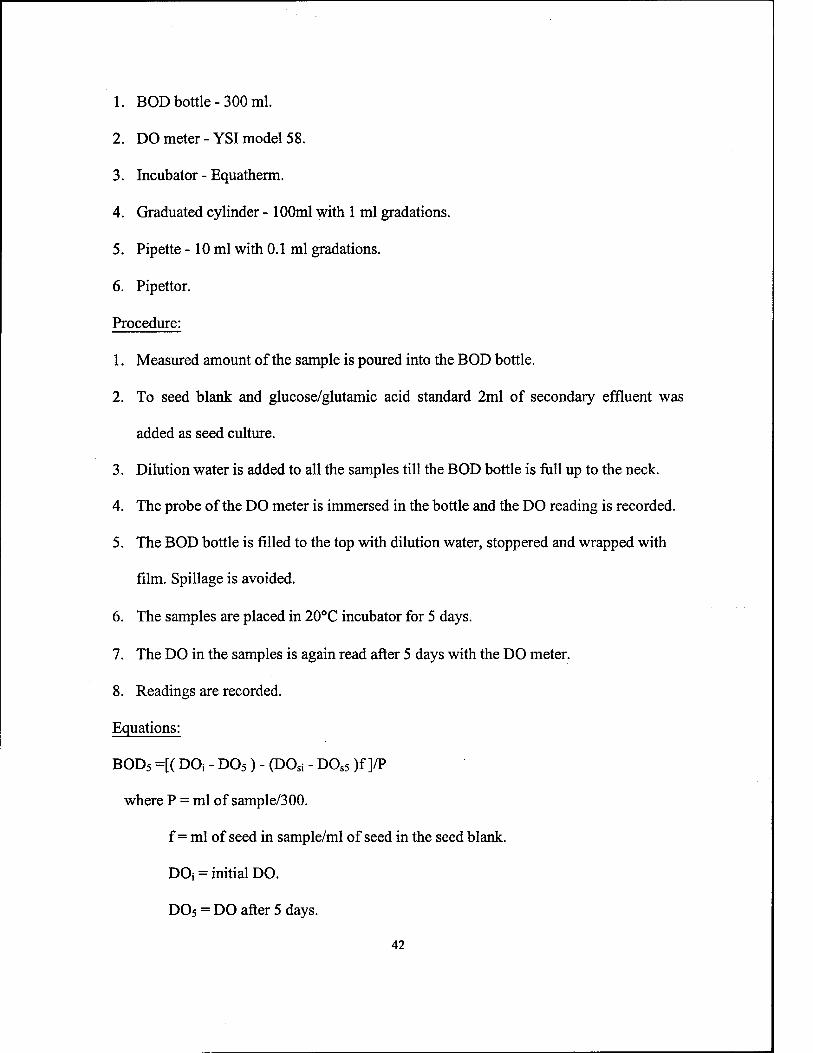
1. BOD bottle - 300 ml.
2. DO meter - YSI model 58.
3. Incubator - Equatherm.
4. Graduated cylinder - 100ml with 1 ml gradations.
5. Pipette -10 ml with 0.1 ml gradations.
6. Pipettor.
Procedure:
1. Measured amount of the sample is poured into the BOD bottle.
2. To seed blank and glucose/glutamic acid standard 2ml of secondary effluent was
added as seed culture.
3. Dilution water is added to all the samples till the BOD bottle is full up to the neck.
4. The probe of the DO meter is immersed in the bottle and the DO reading is recorded.
5. The BOD bottle is filled to the top with dilution water, stoppered and wrapped with
film. Spillage is avoided.
6. The samples are placed in 20°C incubator for 5 days.
7. The DO in the samples is again read after 5 days with the DO meter.
8. Readings are recorded.
Equations:
BOD5 =[( DOj - D05 ) - (DOsi - DOs5 )f ]/P
where P = ml of sample/300.
f = ml of seed in sample/ml of seed in the seed blank.
DOj = initial DO.
D05 = DO after 5 days.
42

DOsi = DO in the seed initially.
DOS5 = DO in the seed after 5 days.
Criteria: 1. ADO>=2mg/l
2. D05 >= 1 mg/1
Standard Method # 2130B. Turbidity, Nephelometric Method
Equipment:
The following equipment was used during this experiment:
1. Turbidimeter (Hach model 2100A)
2. Turbidity Sample Cell
Procedure:
1. Select an appropriate sensitivity range for sample. Adjust meter before each sample
reading to the relevant sensitivity range.
2. Pour sample into sample cell.
3. Wipe sample cell free of fingerprints, dust or condensation.
4. Place cell into the meter.
5. Record turbidity.
Transmittance
Equipment:
The following equipment was used during this experiment:
1. Hach DR4000 Spectrophotometer
2. Quartz Cuvat
Procedure:
1. Set spectophotometer to wavelength: 254.0nm.
43

2. Set spectrophotometer to display results in percent transmittance "%T"
3. Fill quartz cuvat with distilled water, place in cell holder and press "Zero". This will
calibrate the spectrophotometer so that the distilled water sample will display a
reading of 100% transmittance (0.0 absorbance).
4. Remove quartz cuvat, empty and fill with unknown water sample. Place cuvat in cell
holder and record result.
Collimated Beam Testing
Equipment:
The following equipment was used during this experiment:
1. Collimated Beam Unit (See Figure 13)
2. Corning Magnetic Stirring stand (See Figure 13)
3. International Light 1700, Radiometer (See Figure 14)
4. 50mL Petri Dishes (See Figure 15)
5. Magnetic Stir Bars
6. 50mL Graduated Conical Cylinder (varying gradations)
7. Hach DR4000 Spectrophotometer
44

Figure 13
3" diam. Copper pipe Electrical wire to power source.
Magnetic stirrer Laboratory Jacks
45

Figure 14: International Light 1700, Radiometer (Measuring Intensity of the UV lamp before performing the collimated beam test)
Figure 15: 50 mL Petri Dish (In position for receiving UV Dose) *In all cases, sample size is 50 mL.
46

Procedure:
The first step in performing a collimated beam test on a wastewater sample was to
collect and prepare the sample. Each time a sample was collected, it was collected in a
sterile 500mL plastic collection bottle. The samples were transferred from the site
location (Sand Island Wastewater Treatment Facility) to the laboratory via a 151iter
plastic cooler containing two cold packs. In all cases the experimentation was completed
within 6 hours of collection. Also, in all cases the wastewater samples remained in the
cooler until it was needed for examination in the experiment.
The next step was to determine the percent transmittance of the wastewater sample.
Using the Hach DR4000 spectrophotometer, distilled water was placed in a quartz cuvat
and inserted into the spectrophotometer to zero (or adjust) the spectrophotometer to a
transmittance of 100%. Then the quartz cuvat was filled with the wastewater sample and
measured for transmittance.
Following the determination of the percent transmittance, the determination of
exposure time to the collimated beam unit needed to be calculated. For all tests in this
experiment, collimated beam unit number 2 at the University of Hawai'i Environmental
Lab was used to provided consistent data between collimated beam tests. First, the unit
was measured for intensity at a given distance from the collimating tube (see Figure 14).
Distances that yielded even numbers on the radiometer were used to make calculations
easier. A distance corresponding to an intensity of 240mW/cm2 was used for this unit at
each experiment. Using a correction factor to correct for the absorbance of the light in
the water sample, an average intensity throughout the depth of the 50mL water sample
could be determined. The correction factor used was (Morowitz, 1950):
47

C = (l-e-aL)/otL
Where: C = correction factor
a = Absorbance (/cm)
L = Sample depth (cm)
The sample depth of each 50mL petri dish was 2.2 cm. Finally, exposure times were
calculated to obtain doses of 5,10, 20, 30,40, 50 and 75 mW-sec/cm2.
To expose the 50mL samples of effluent to the UV source, the following
procedure was used. First, the sample was measured to 50mL using a conical cylinder
and then poured into a 50mL petri dish. Then, while placing a cover (a cardboard plate)
over the dish, the dish was inserted underneath the collimating tube on the collimating
beam unit (see Figure 15). After a timer had been set for the exposure time for the tested
sample, the cardboard plate was removed and the timer was started. After the exposure
time was complete, the cardboard plate was returned to cover the petri dish from the UV
source, and the petri was then removed from the collimated beam unit stand. The sample
was then ready for analysis using the membrane filter technique to determine the number
of reproducing fecal coliforms remaining in the sample.
48

Chapter 4 Results
4.1 Effectiveness of the Wastewater Treatment Package Unit
The wastewater treatment package unit used in this project provided a varied
quality of secondary effluent with which to begin the filtration and disinfection processes.
The WTPU (which has a total capacity of approximately 800 gallons) received a daily
flow of 400 gallons per day. This yielded a 2-day retention time. The daily loading of
400gpd was determined under the assumption that this unit would service a four-person
household with each individual contributing 100 gallons of wastewater per day (Metcalf
& Eddy, 1991; NSF Standard 40). This is different from the manufacturer's rated
capacity, which intended this unit to treat domestic wastewater for a family of five in
Japan. In Japan, however, the average per capita flow for domestic wastewater is
approximately 66 gallons per person per day. Therefore, the manufacturer's maximum
hydraulic loading capacity would be approximately 330gpd. Thus, the tested loading of
400gpd is overloading the WTPU by approximately 21% from its designed maximum
daily hydraulic capacity. From this analysis it can be assumed that the system was tested
at its maximum hydraulic capacity; and that the effluent quality tested is likely the worst
case scenario for this tank.
There are other factors that must be considered, however, when determining the
quality of the effluent tested in this experiment versus the quality of the effluent from a
residential unit. First, since the raw wastewater used for this testing was obtained from
Sand Island Wastewater Treatment Plant (SIWTP), the water characteristics are different
than wastewater from a home. One of the primary ways in which SIWTP's untreated
49

wastewater differs is that there is a significant amount of saltwater intrusion into the
system. Depending upon the time of day, salt water intrusion accounts for 15 - 45
percent of the total inflow into the plant (Salt Water intrusion data provided by SIWTP).
This is radically different from a home use situation which would have zero saltwater
intrusion in most cases. Additionally, wastewater that enters SIWTP comes from
industrial sources as well as residential areas. This also changes the quality of the water
and may include chemicals which normally would not be found in wastewater from a
residential unit. Secondly, another major factor that might cause the quality of the
effluent in this test to vary from a real (single family home) situation is the loading
schedule that was used for this testing. The loading criterion used to fill the tank with
400gpd of raw wastewater followed the protocol described in the National Sanitation
Foundation (NSF), Standard 40 for the production of class 1 effluent. This schedule
consisted of following the periods shown below.
TABLE 1 - WTPU LOADING SCHEDULE
TIME OF DAY (HRS) % OF DAILY FLOW VOLUME (GAL)
0600-0900 35 140
1100-1400 25 100
1700-2000 40 160
Totals 100 400
This schedule loaded the tank at three time periods per day. Although this
loading schedule may simulate an average household flow, it does not account for
exceptional circumstances such as a heavy laundry day, vacation periods, spring cleaning
50

etc. The NSF Standard 40 protocol does require testing circumstances where this typical
loading schedule would not be followed (i.e. stress tests); however, these tests outlined in
the standard were not performed during the testing period to create water of reusable
quality.
Finally, the quality of water tested at the SIWTP rarely contained particles of
5mm in diameter. This result would be far different than if the test was performed at a
residential unit where the wastewater did not have the time to partially solubilize the
larger particles. Thus, the microbial growth rates of the free and fixed microorganisms in
the tank chambers would be altered. Therefore it is difficult to know the effectiveness of
this experiment with regards to the conditions the WTPU would receive when operating
at a residential unit.
It is worthy to note that although the testing performed on the WTPU was
extensive, it did not determine if the testing performed taxed the tank to its maximum
limits. Based on some of the reasons discussed, it is likely that the tank was tested more
at typical operational levels. Also, it is difficult to say whether the wastewater tested was
of similar quality to that of a single household.
Perhaps for the purposes of this study, it is best to simply compare BOD5 levels of
SIWTP untreated wastewater with the expected levels at a typical, four-person, US
family home. From our study the average BOD5 level that entered this tank was 146
mg/L. When this value is compared with typical values for BOD5 in a four-person home,
however, this is lower that typical values. Using unit waste loading factors originally
published by the Water Pollution Control Federation, BOD5 ranges between 0.13 and
0.26 pounds per capita per day (Metcalf and Eddy, 1991). This is a range of
51

approximately 155-312 mg/L, assuming that a four-person family produces 400gpd of
wastewater, which was the case for the hydraulic loading of the WTPU. Average values
for BOD5 range between 215 - 265 mg/L depending upon if kitchen disposal wastes are
included in the wastewater.
Table 2 shows the typical range for suspended solids using the unit waste loading
factors and a loading of 400gpd at a four-person home.
TABLE 2 - MEASURED VS. TYPICAL PARAMETERS
Parameters This Study Typical domestic values*
BOD5 Influent (mg/L) 146 155-312
1 Total Suspended Solids (mg/L) 128 155-395
*Metcalf&Eddy,1991
As this table shows, the levels measured during this study are closer to the lower
values stated for typical domestic wastewater. Therefore, this study may not be
indicative of the concentrations possible in a single family home. Clearly, the next step
of this study would be to connect the WTPU to a single family home and test the results.
Regardless of the variations between the wastewater tested and the expected
values in a home use situation, the WTPU did achieve effluent suitable for this study.
The effluent from the tank averaged at 14 mg/L for BOD5, 11 mg/L for total suspended
solids and 8 mg/L for volatile suspended solids. Additionally, the average turbidity from
the six months of testing was 5.6 NTU (Figure 16), and the average percent transmittance
was measured at 58.8% during this period (Figure 17).
These values present some challenges for reuse. First, note that the wastewater
effluent does not meet the secondary effluent standards for turbidity prior to direct
52

Figure: 16 Effluent Turbidity (unfiltered)
35
30
S 25
|» 2 15
= 10
Tank Maintenance
^
Average = 5.6NTU
♦♦♦ .♦♦♦♦♦♦♦♦ ♦♦♦»♦♦+♦ ♦♦♦
-♦♦^
*♦♦♦♦♦♦ ♦♦♦* ♦♦♦♦ *•*. ^—To
10 20 Test# 30 40 50
filtration. The state DOH guidelines clearly state that any secondary effluent that is over
5NTU must be chemically coagulated before filtration or diverted to other than R-l
reclaimed use. Of the times that turbidity was recorded over the six-month testing period,
the turbidity exceeded 5 NTU fifty percent of the time. Therefore, if this regulation were
Figure: 17 Effluent Transmittance (filtered)
80
70
8 60
fi 50
1 40 2 30
5 20 10
*♦♦: ♦♦♦♦ ̂ ♦^♦♦♦» ♦♦♦
±^ -^♦♦♦♦♦^♦v- -+**+
Average = 58.8%
10 20 Test* 30 40 50
strictly enforced, an automatic chemical addition system would be required. This is
considered impractical. Another problem with the initial quality of the water is the
effluent transmittance. The DOH guidelines require the wastewater to be above 55%
after filtration. This could be a roadblock to reclaimed water production because the
results from Figure 17 show that the transmittance after filtration (using a laboratory
53

glass fiber filter) drops below 55% approximately 27 percent of the time. This
occurrence happens at the same time the turbidity rises above 5 NTU in all cases.
54

4.2 Results of Sand Filtration Testing
Since this experiment was not subject to the DOH guidelines, (because all
wastewater was diverted back to the raw wastewater channel at SIWTP) wastewater
Figure: 18 Filter Performance 6
jjj 5
XI 3
R 7 ft
Turbidity Before Filter (NTU) 10
above 5NTU and below 55% transmittance was sent directly through the sand filter
without prior chemical coagulant addition. As explained in the methods section of this
report, a dual-medium sand filter was initially used to filter the water. Turbidity
measurements were taken before the sand filter (collected in the last chamber of the
WTPU) and after the sand filter (collected in the holding tank). Based on the before and
after turbidity measurements, Figure 18 was created. This shows that from our testing an
improvement of approximately 44% was achieved. This is a relatively low percent
improvement compared with 70% which is possible by some sand filters (Asano, 1998).
Additionally, the data used in this graph included only five tests run between 3/22/99 and
4/2/99. Earlier testing proved to be inadequate since the sand filter was not initially
backflushed before testing; and the later testing showed that continual deterioration of the
effluent turbidity was apparent. It is expected that the continual deterioration of effluent
55

turbidity was due to dirty site conditions and a poorly designed gravel bed. The mistakes
made and lessons learned will be discussed at the end of this section.
If at this point, the maximum initial turbidity possible to obtain 2NTU after sand
filtration (using the current percent improvement of 44%) is calculated, the secondary
effluent could not exceed about 3.6NTU. This is even lower than the regulated criteria of
5NTU and would limit the possible times that R-l quality water could be produced even
further. Fortunately, better sand filters are available and could be implemented in this
system. If a sand filter capable of removing 70% of the turbidity was used, this would
raise the maximum initial turbidity of the secondary effluent to about 6.7NTU. This is a
definite improvement, but it still does not account for the overall fluctuation in the
secondary effluent produced by the WTPU. The fluctuations in Figure 16 showed that
the turbidity exceeded 6.7NTU approximately 20% of the time. This is still a major
limitation to consistent quality water. However, since this limitation already assumes the
best possible removal from a sand filter, it is unlikely that turbidity levels will be low
enough to pass current DOH criteria using sand filtration alone. Clearly an additional
process would be needed to ensure turbidity levels below 2NTU on a consistent basis.
Many mistakes were made in the testing process; and consequently, much was
learned from the experimental process. As stated earlier, the design of the sand filter was
less than ideal. The sand filter used was a dual-medium, essentially unstratified, rapid
sand filter. After the first backwash on March 22,1999 an improvement in the turbidity
of 56% was recorded. However, the percent improvement in effluent turbidity rapidly
decreased until it was only 31% after five tests. This is an extremely rapid deterioration
of effluent quality and indicates poor filter design. Likely reasons for the poor filter
56
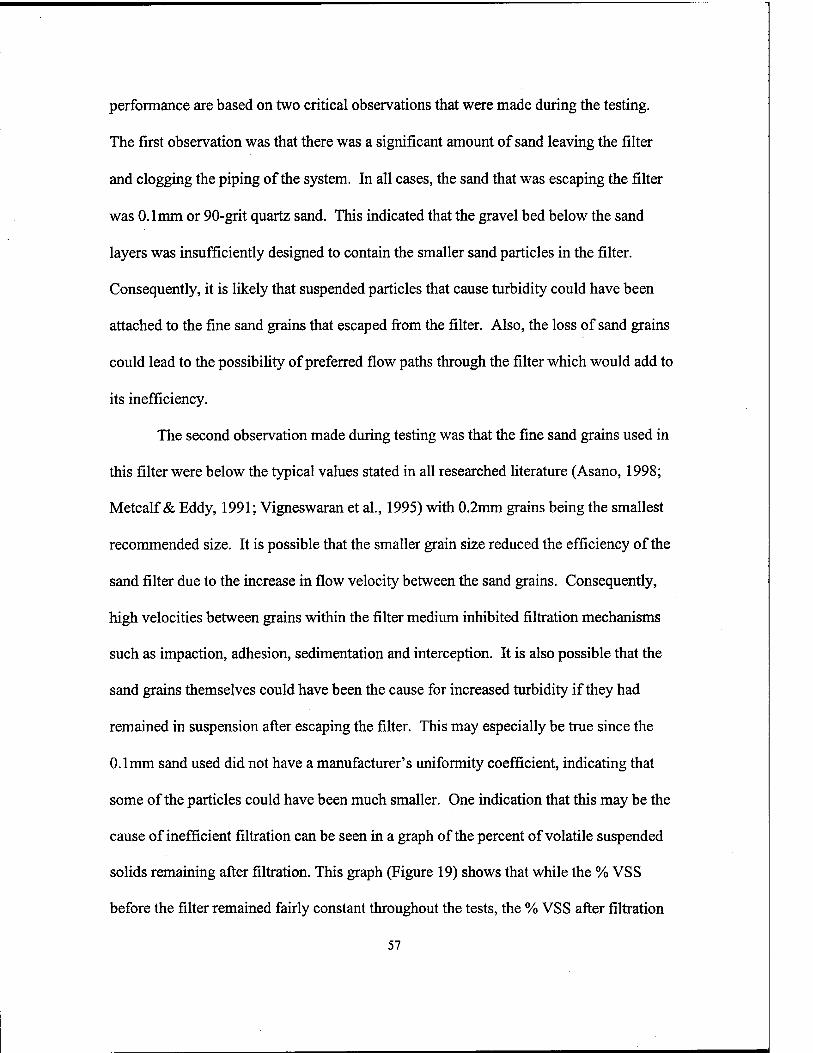
performance are based on two critical observations that were made during the testing.
The first observation was that there was a significant amount of sand leaving the filter
and clogging the piping of the system. In all cases, the sand that was escaping the filter
was 0.1mm or 90-grit quartz sand. This indicated that the gravel bed below the sand
layers was insufficiently designed to contain the smaller sand particles in the filter.
Consequently, it is likely that suspended particles that cause turbidity could have been
attached to the fine sand grains that escaped from the filter. Also, the loss of sand grains
could lead to the possibility of preferred flow paths through the filter which would add to
its inefficiency.
The second observation made during testing was that the fine sand grains used in
this filter were below the typical values stated in all researched literature (Asano, 1998;
Metcalf & Eddy, 1991; Vigneswaran et al., 1995) with 0.2mm grains being the smallest
recommended size. It is possible that the smaller grain size reduced the efficiency of the
sand filter due to the increase in flow velocity between the sand grains. Consequently,
high velocities between grains within the filter medium inhibited filtration mechanisms
such as impaction, adhesion, sedimentation and interception. It is also possible that the
sand grains themselves could have been the cause for increased turbidity if they had
remained in suspension after escaping the filter. This may especially be true since the
0.1mm sand used did not have a manufacturer's uniformity coefficient, indicating that
some of the particles could have been much smaller. One indication that this may be the
cause of inefficient filtration can be seen in a graph of the percent of volatile suspended
solids remaining after filtration. This graph (Figure 19) shows that while the % VSS
before the filter remained fairly constant throughout the tests, the % VSS after filtration
57
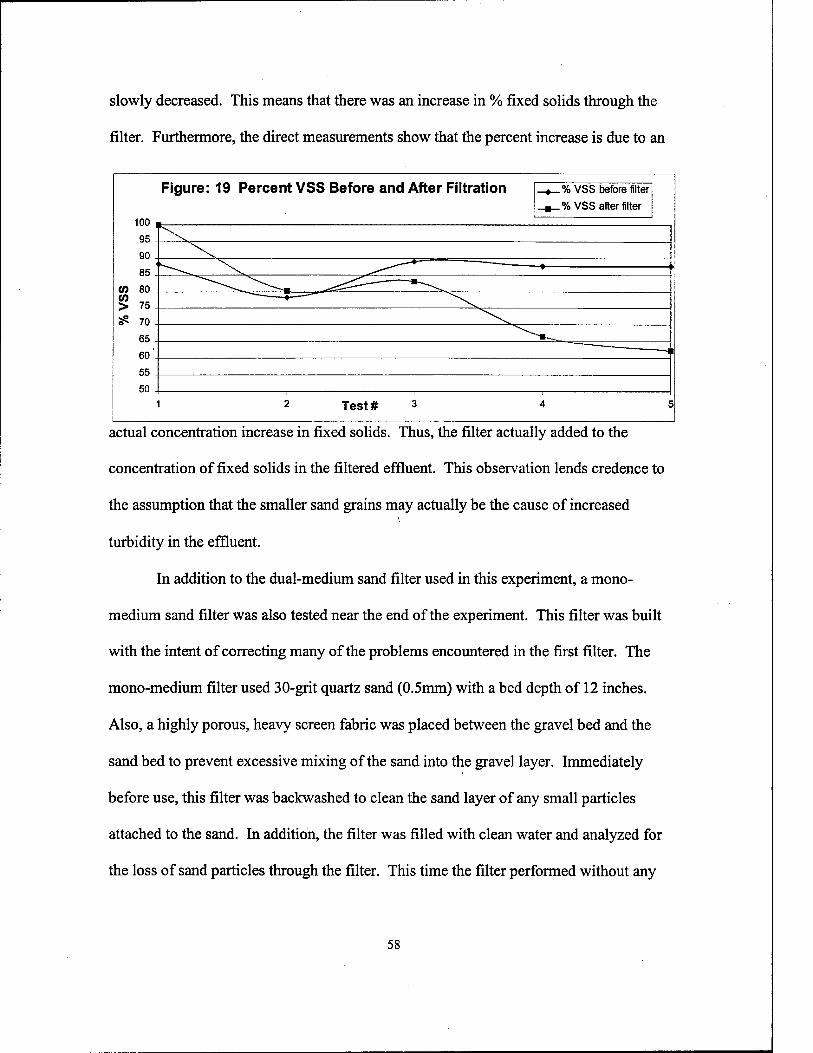
slowly decreased. This means that there was an increase in % fixed solids through the
filter. Furthermore, the direct measurements show that the percent increase is due to an
Figure: 19 Percent VSS Before and After Filtration .%VSS before filter
.% VSS after filter
60
55
50
Test#
actual concentration increase in fixed solids. Thus, the filter actually added to the
concentration of fixed solids in the filtered effluent. This observation lends credence to
the assumption that the smaller sand grains may actually be the cause of increased
turbidity in the effluent.
In addition to the dual-medium sand filter used in this experiment, a mono-
medium sand filter was also tested near the end of the experiment. This filter was built
with the intent of correcting many of the problems encountered in the first filter. The
mono-medium filter used 30-grit quartz sand (0.5mm) with a bed depth of 12 inches.
Also, a highly porous, heavy screen fabric was placed between the gravel bed and the
sand bed to prevent excessive mixing of the sand into the gravel layer. Immediately
before use, this filter was backwashed to clean the sand layer of any small particles
attached to the sand. In addition, the filter was filled with clean water and analyzed for
the loss of sand particles through the filter. This time the filter performed without any
58

loss of sand. Unfortunately, the fouling of the entire system prevented accurate testing of
this filter; thus, no additional data was obtained using the improved filter.
It was noticed at this time that the entire system had become filled with the
smaller sand particles. Small deposits of sand were noticed in the piping immediately
exiting the sand filter and in the piping after the UV disinfection reactor. The intrusion of
sand throughout the system prevented any further testing of the old and new filter since
any sample taken after the filter showed little or no improvement in effluent quality.
Additionally, the current system design prevented any means of collecting sand (i.e.: a
sand trap) before complete spreading throughout the system. Also, this system did not
provide a means for cleaning out the piping without completely disassembling the
system. The construction of the system and possible improvements will be discussed in
further detail in the discussion section of this report.
Since sand filtration alone could not provide the type of removal necessary to
consistently reduce the turbidity levels produced from the WTPU, coagulation, and
flocculation processes were tested. Approximately 10 gallons of the secondary effluent
wastewater was brought back to the lab for jar testing in order to determine an optimum
dose for effective coagulation and flocculation. Aluminum Sulfate was the chemical
agent used for this experiment to provide coagulation and flocculation prior to the sand
filter. Jar testing was performed in the laboratory following recommended coagulation,
flocculation, and sedimentation periods outlined in Eckenfelder and Ford (1970), and
explained in the system construction section of this report. Figure 20 shows the results of
the laboratory jar testing. This graph shows varying doses of alum ranging from 15mg/L
to 300mg/L. From this test it is apparent that improved turbidity continues until
59

approximately 200mg/L of Alum was added. At this point, increased doses of Alum
provide almost no additional settling or removal of suspended particles in the water.
Therefore, 200mg/L was chosen as the optimum amount of chemical coagulant to use for
this testing. In an actual OWRS, 200mg/L of alum would not be required since the
Figure: 20 Determination of Optimum Coagulant dosage 0 1 i
6^ 5- 4- 3- 2- 1 - n
3 1- Z
&
'2 \
3 1- ^s^
♦— —♦ < ► ♦— -—♦ <>
20 n
4-40 S E o> oc 0s»
60
80
100 50 100 150 200
Alum Dosage (mg/L) 250 300
effluent prior to filtration only needs to be below 5NTU. A high alum dose was chosen
in this test for the purpose of proving the effectiveness of the process. In an actual
OWRS, however, the highest percent removal required would be about 50% since the
guidelines require that any secondary effluent above 10NTU not be used for R-l water.
Thus, 50% removal from the coagulation / flocculation process would lower secondary
effluent from 10NTU to 5NTU. Figure 20 shows that greater than 50% removal can be
achieved with only an alum dose of 50mg/L. 50mg/L would probably be a more likely
alum dose in an actual onsite water reclamation system.
Based on the field results, 84% removal was achieved on site producing water
with a turbidity of 1.7NTU prior to filtration. The % removal was a little lower than what
was achieved in the laboratory, but this was due to the less than ideal conditions for
coagulation and flocculation onsite. As explained in the system construction section,
60

five-gallon buckets were used to perform the coagulation and flocculation, and manual
stirring was performed to aid the two processes. Thus, ideal mixing conditions were
difficult to simulate onsite. After filtration using the new mono-medium sand filter, there
was a noticeable rise in the overall turbidity of the sample. This was again due to the
fouling that had occurred throughout the piping in the entire system. Therefore, the R-l
requirement of filtered water below 2NTU was not met. None-the-less, the
coagulation/flocculation testing did show that with chemical assistance, the final turbidity
requirement of less than 2NTU is possible.
61

4.3 Results of Ultraviolet Disinfection Testing
Now that filtered effluent had been obtained, a study on the effectiveness of the
ultraviolet disinfection of the single lamp system could commence. A 500mL sample of
filtered effluent was returned to the lab for collimated beam testing. Using the method
for collimated beam testing explained earlier, four dose-response curves were generated.
Figure 21 is a graph of the four collimated beam tests. As shown in the legend, the
turbidity of the samples tested varied from 2NTU to 5.7NTU. Interestingly, the log
removal from each test did not vary dramatically. The expected result should have been a
noticeable decrease in the log removal as the turbidity increased. However, the result
was quite the opposite in some cases. Perhaps the reason is based upon the observations
Figure n „
21: Dose Response Curves (Results of four tests) ♦ 2.0NTU / 70%T 13.0NTU / 60%T
4.6NTU / 54%T y 5.7NTU / 48%T
1 -
o 2- z z r 3 -, A >
W °> c _i
6 -
7 .
♦
.
■ V A « ■
x ft
.,,..,.,,!,,,,,,,.. , , , , , 1 , >:>>,., , < i , , . , , i . , , i . r i . i 1 i t i i , . . , .
0 10 20 30 40 50 Dose (mW-sec/cm2)
60 70 8 0
noted in the previous section. In the results of the sand filtration testing, it was suggested
that a portion of the turbidity in the filtered effluent was due to fixed solids leaving the
sand filter and becoming suspended in the effluent. If this were the case, these particles
would have little effect on shielding the microorganisms from the ultraviolet light
because the shielding effect that microorganisms receive from suspended particles must
62
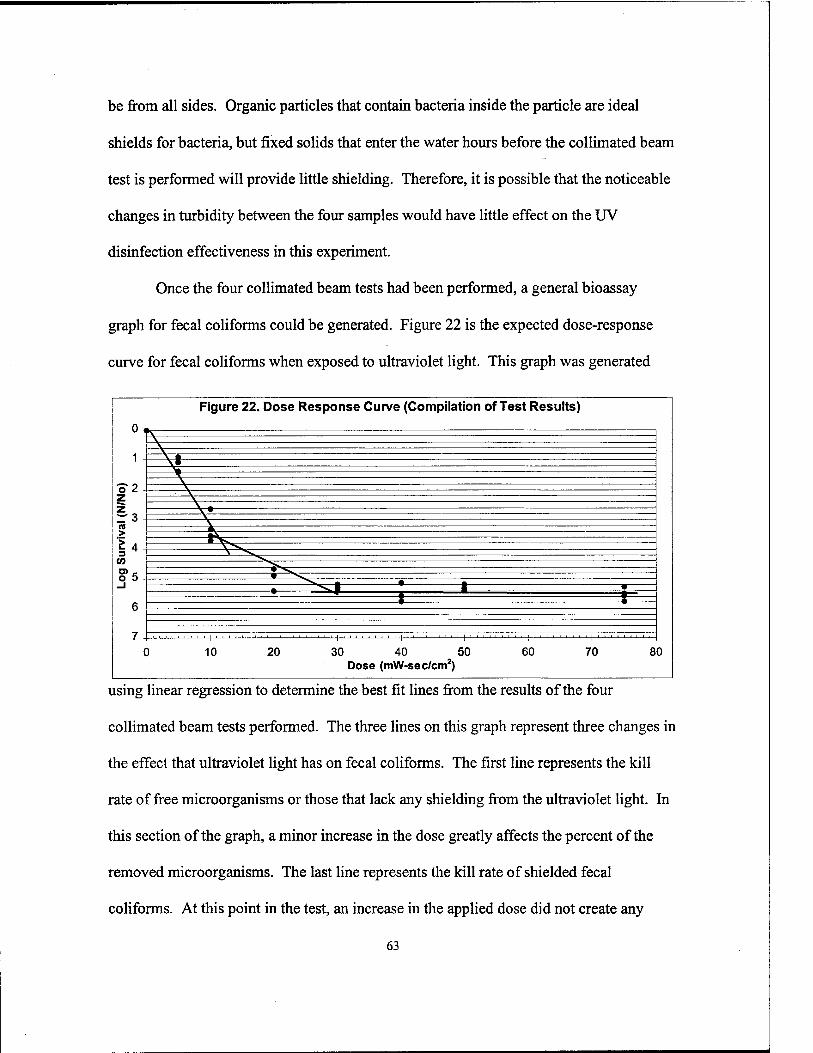
be from all sides. Organic particles that contain bacteria inside the particle are ideal
shields for bacteria, but fixed solids that enter the water hours before the collimated beam
test is performed will provide little shielding. Therefore, it is possible that the noticeable
changes in turbidity between the four samples would have little effect on the UV
disinfection effectiveness in this experiment.
Once the four collimated beam tests had been performed, a general bioassay
graph for fecal coliforms could be generated. Figure 22 is the expected dose-response
curve for fecal coliforms when exposed to ultraviolet light. This graph was generated
0 i
1 -
o2- z z r 3 - es > 1*-
CO
o 5 - _l
6-
7 - (
Figure 22. Dose Response Curve (Compilation of Test Results)
0
\ • \i
\ _
J\_ '
• ^"v_ ̂ *. m _
. ^V| f 1 _ = • —■— 1 —1—
) 10 20 30 40 50 60 70 Dose (mW-sec/cm2)
8
using linear regression to determine the best fit lines from the results of the four
collimated beam tests performed. The three lines on this graph represent three changes in
the effect that ultraviolet light has on fecal coliforms. The first line represents the kill
rate of free microorganisms or those that lack any shielding from the ultraviolet light. In
this section of the graph, a minor increase in the dose greatly affects the percent of the
removed microorganisms. The last line represents the kill rate of shielded fecal
coliforms. At this point in the test, an increase in the applied dose did not create any
63

change in the number of microorganisms removed. This can be seen more clearly in
Figure 23, which is a density plot of the collimated beam tests performed. Note that very
few organisms remain at the higher doses, yet these are fully shielded and practically
Figure 23: Density Plot of Collimated Beam Testing
10,000,000
1,000,000
f 100,000 o o
10,000
1,000
100
10
1
•
!
•
• •
• • • •
[ i.. i.
i i s
111.. i. 1111
• •
| , ) i t ( , , , , j , |
•
10 20 30 40 50 Dose (mW-sec/cm2)
60 70 80
immune to the effects of the UV light. Also note that the remaining values are above the
R-l criteria of less than 2.2CFU/100mL which means that improved filtration is
necessary to remove the particles shielding the remaining microorganisms. Finally, the
middle line shows the transition between the free organisms and the shielded
microorganisms. This section of the graph represents those fecal coliforms that are
partially shielded and therefore require a higher dose of radiation to render inactive. Yet
these microorganisms are still able to be affected by the UV light and ultimately succumb
to the inactivation effects of radiation. A curve would more accurate represent this
section since it is a transition zone between the first and last lines. Since this section is
not used in the analysis, however, a line is suitable for this experiment.
64

As shown earlier in Figure 9, the filtered effluent that had been collected was
pumped from the bottom of the collection container through a check valve and then
through the UV reactor. For the once-thru-pass test, the water was collected in another
container and then discarded back into the main waste stream at Sand Island Wastewater
Treatment Facility. To ensure that a collected sample accurately reflected typical
operating conditions, the sample was taken after at least 20 liters of water had passed
through the UV system. This was done so that the flow through the UV reactor would
reflect a steady state flow condition. Additionally, before the commencement of a UV
test, the reactor was filled with water and the lamp was turned on for a minimum of five
minutes to allow proper warm up time for the lamp.
Following collection, the sample was returned to the laboratory and tested using
the membrane filtration method to determine the effectiveness of the UV disinfection
system. Figure 24 shows the average effectiveness of the single lamp system. As shown
Figure 24: Once-Thru-Pass Test Results
o" 2 z z - 3
V)
o 5
♦ \
10 20 30 40 50 Dose (mW-sec/cm2)
60 70 80
in this graph, the log survival from a once-thru-pass test varied from 1.5 to 2.5. Since the
65

DOH guidelines closely monitor turbidity, it could be assumed that the variance was due
to turbidity as is shown in Figure 25. In the two figures, the higher doses generally relate
to the lower turbidities and the lower doses generally relate to the higher turbidities,
however, the tests performed did not always produce the expected results. For example,
the lowest turbidity test of 2.0 NTU did not yield the highest log removal; and therefore,
this test did not yield the highest dose. Rather, the highest dose was from a sample
containing a turbidity of 4.0NTU. Also, the R2 value for Figure 25 was only 0.31. This
shows that turbidity was not a good indicator to determine the actual received dose.
Clearly, factors other than turbidity affected the results of this test.
12 Figure 25: Turbidity vs. Dose R2 = 0.31
^ 10 . ▼
£• 6
1 A
3 0 t ▼
T
O
1
; , 1 ,_ , , , , , 1 , , H ' 1 _, 1 , , ,
0.0 1.0 2.0 3.0 4.0 5.0 6.0 7.0 8.0 9.0 10.0 Actual Received Dose (mW-sec/cm2)
The variable population of microorganisms in the wastewater stream was the first
factor evaluated for explaining the results. During the early stages of the disinfection
testing period (3/9/99-3/11/99), it was apparent that the WTPU needed semi-annual
maintenance since the turbidity levels became unusually high after 6 months of
continuous operation. Therefore, to revive the tank, half of the total contents from the
WTPU was pumped out. This cleaning varied the fecal coliform counts in the tank from
an average of 1.2xl06 CFU/100mL to a high of 8X10⁶ and then to a low of about 100,000
CFU/100mL. It is suspected that this variation effected the log removal determined by the
66

membrane filtration technique when the overall population was in such a state of flux.
An effective UV dose could have been miscalculated because a larger population could
have provided shielding to a different number of microorganisms than a smaller
population. Also, a decrease in the population of fecal coliforms could have affected the
overall health of the population. In other words, the extent of the inactivation could have
been overestimated due to the physical state of the microbes (Sobsey, 1989). In any case,
the variation in the population of fecal coliforms did play a role in the variance of the log
removal noticed and should be noted.
To minimize the effects of the fecal coliform population flux, all collimated beam
tests were performed when the microbial population was near average levels. One
collimated beam test was performed one month prior to the tank maintenance and the
other three collimated beam tests were performed two weeks after the tank maintenance
and when the system was operating within typical parameters again. Three of the eight
once-thru-pass tests, however, were performed when microbial populations were lower
than average and one microbial test was performed when the microbial population was
near the high value in this range. All four tests performed when the fecal coliform
population was unstable produced lower than average log survival values.
Other variations in the observed log removal of the once-thru-pass include the
testing method used with the UV lamp. The 5-minute warm up period was arbitrarily
chosen to give the lamp a short period to reach typical luminescent conditions. No actual
warm up period was recommended by the manufacturer, therefore, the warm up period
may not have been sufficient for the lamp to reach a steady state condition. Under ideal
conditions (in an actual system) this would not have been a concern because the lamp
67

most likely would have remained in operation continuously; but during this testing
process, the lamp could only be on at certain times. The lamp had to be turned off
periodically because the water passing from the filter to the holding container during the
initial loading could not be disinfected or else the once-thru-pass could not be
determined. Also, the lamp was only fully submerged during the test and could not
remain in use when system was emptied and unattended.
Not only was the variation in the values obtained from the once-thru-pass test
noticeable, but the values were also much lower than expected. Based on the values
graphed in Figures 24 and 25, one log survival was obtained at a received dose of
3.5mW-sec/cm2 and the average received dose recorded from the once-thru-pass test was
6.4 mW-sec/cm . Additionally, the average received dose of 6.4mW-sec/cm
corresponded to a 2 log survival or a 99% removal of fecal coliforms. The average
received dose from the once-thru-pass tests was dramatically lower than the 30mW-
sec/cm2 dose published by the manufacturer. However, the manufacturer's value was for
a transmittance of 95% and so this comparison was really of no use since the
transmittance of the filtered effluent averaged around 60%. The manufacturer of the UV
lamp system was available for comment on a few occasions for discussion concerning
this output. Based on a point source summation method used exclusively by Capitol
Controls Group, the manufacturer estimated that a 16.6 mW-sec/cm applied dose could
be obtained for wastewater with a transmittance of 60%. Capitol Controls Group would
not release the exact way in which they used the point source summation method to
obtain this value, but it was probably similar to the general method explained in the
theory section of this report. This value stated by Capitol Controls Group was also based
68
on a reactor flow rate of 7gpm or a contact time of 3.18sec as compared to the 3.8gpm
flow rate used in this experiment which corresponds to a 5.84sec contact time.
Thus, based on a longer contact time alone, the value obtained in the bioassay
should yield a higher dose than the applied dose obtained from the manufacturer. Using
simple geometry, an average intensity can be calculated by dividing the lamp power by
the average contact area between the quartz sleeve and the reactor wall. Also the average
intensity must be corrected for lamp age (factor of 0.7) and the transmittance through the
quartz sleeve (factor of 0.7). This rough method to determine the average intensity yields
a value of approximately 5.6mW/cm2 for this UV system. If this value is multiplied by
the manufacturer's recommended contact time of 3.18 seconds, the applied dose is
17.7mW-sec/cm2, which is close to the point source summation value received from the
manufacturer. When the contact time is increased to the time tested in the bioassay (5.84
seconds) an applied dose of 32.6mW-sec/cm2 is calculated. Comparing this value with
the actual received dose determined in the bioassay, the reactor efficiency is determined.
This experiment showed that the UV reactor had an efficiency of only 20%. This is a
poor reactor efficiency and must be partially due to factors other than the reactor design.
It is suspected that the primary reason for the discrepancy between the
manufacturer's applied dose and the actual received dose determined from the bioassay is
the condition of the UV lamp's quartz sleeve. Many resources have stated that the key
element of an effective UV system is the cleanliness of the quartz sleeve (EPA, 1992b;
White, 1999). This concern was not considered during the testing because the entire
testing period lasted for about a month which is about the usual time period that a lamp is
cleaned (EPA, 1992b). Therefore, fouling of the quartz sleeve was not expected during
69

the testing period. After the testing period, the quartz sleeve was removed and although
the outer surface of the quartz sleeve was still clean, the inner surface was coated with
moisture. This was an unexpected scenario since the inner surface of the quartz sleeve
was not in contact with the wastewater passing through the reactor. The most likely
cause of this buildup of moisture inside the quartz sleeve was infiltration of moisture
from the outside air. The system design was made to keep the lamp fairly protected from
exposure to dust, but the lamp housing was not airtight and was really not made for
exterior use. Thus, the moisture inside the quartz sleeve may have been extremely
detrimental to the overall effectiveness of the system. The problem with this scenario
was that the light was immediately refracted by the moisture and as the moisture dried,
residue from dissolved solids in the water droplets dried on the inside of the sleeve which
caused further fouling. It is suspected that the major cause of the lower effective doses
obtained in the bioassay was due to the moisture buildup inside the quartz sleeve. The
other factors stated earlier were minor compared to the major fouling caused by the lack
of an airtight lamp housing.
Once the average effective dose was determined from the once-thru-pass tests, the
multiple-pass test could begin. The goal of the multiple-pass test was to show that a dose
of 140mW-sec/cm could be obtained and that if this dose was applied that the remaining
bacteria would be below levels stated for R-l reuse. Assuming that each pass through the
UV system would yield an effective dose of 8mW-sec/cm2, the water was then recycled
through the system enough times to obtain the desired dose. A value of 8 mW-sec/cm2
was used instead of 6.4mW-sec/cm because when the test was performed, the average
dose was determined using only one of the collimated beam test results instead of a
70
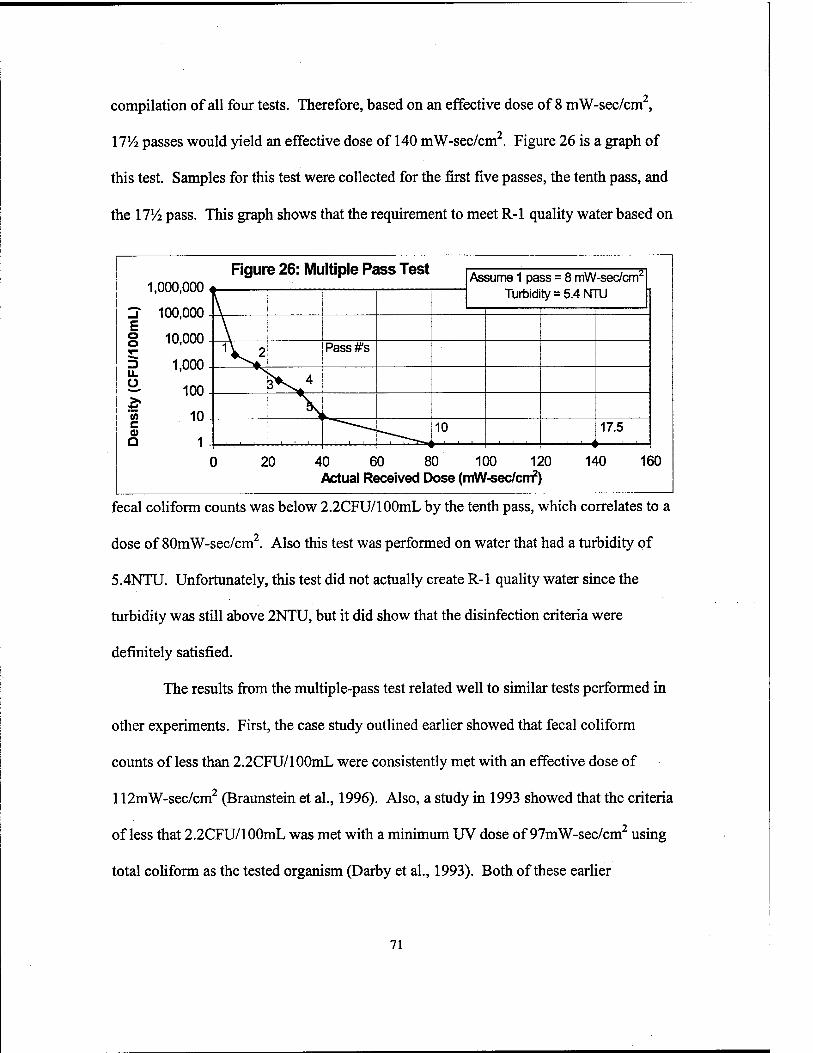
compilation of all four tests. Therefore, based on an effective dose of 8 mW-sec/cm ,
ITA passes would yield an effective dose of 140 mW-sec/cm2. Figure 26 is a graph of
this test. Samples for this test were collected for the first five passes, the tenth pass, and
the 1754 pass. This graph shows that the requirement to meet R-l quality water based on
E o
3 li. Ü
to c 0) a
1 000 000 4 Figure 26: Multiple Pass Test Assume 1 pass = 8 mW-sec/cm2
Turbidity = 5.4 NTU 100 000
10 000
1 000 V 2 Passes
100 **x4
10
1- 10 17.5
0 20 40 60 80 100 120 Actual Received Dose (mW-sec/cnf)
140 160
fecal coliform counts was below 2.2CFU/100mL by the tenth pass, which correlates to a
dose of 80mW-sec/cm2. Also this test was performed on water that had a turbidity of
5.4NTU. Unfortunately, this test did not actually create R-l quality water since the
turbidity was still above 2NTU, but it did show that the disinfection criteria were
definitely satisfied.
The results from the multiple-pass test related well to similar tests performed in
other experiments. First, the case study outlined earlier showed that fecal coliform
counts of less than 2.2CFU/100mL were consistently met with an effective dose of
112mW-sec/cm2 (Braunstein et al., 1996). Also, a study in 1993 showed that the criteria
of less that 2.2CFU/100mL was met with a minimum UV dose of 97mW-sec/cm using
total coliform as the tested organism (Darby et al., 1993). Both of these earlier
71

experiments relate well with the results from this experiment which showed that a dose of
80mW-sec/cm2 was sufficient to yield fecal coliform counts below 2.2CFU/100mL.
72

4.4 Results of R-2 Quality Water Test
The attempt to create R-2 quality water using chlorine tablets failed. As
explained earlier, the WTPU has a small tank section (approximately 5.8 gallons) at the
end of the unit specifically designed for disinfection purposes. This chamber receives all
water from a small weir that directs the entire flow path through a perforated container
containing 3" diameter chlorine tablets. The 7 oz. tablets are 99% Trichloro-S-
Triazetrione and are designed to disintegrate leaving a 1-3 mg/L chlorine residual in pool
water. Additionally, each tablet is expected to last for 10,000 gallons when fully
submerged in a pool chlorination chamber.
Based on the above data, it is questionable if the chlorine tablets will be able to
disinfect the secondary effluent to below 23CFU/100mL. First, the contact time is much
shorter than what would be ideal. For example, if the flow of 400gpd was evenly spread
throughout the day, this would yield a contact time of 21 minutes in the final contact
chamber. However, since the flow is concentrated in three time periods, the contact time
is much shorter. The worst case scenario for loading schedule of the test would be the
1700-2000 period which would give a contact time of approximately 654 minutes. For
the testing performed, samples were taken during the morning flow period which had a
chlorine contact time of about TA minutes. The contact time in this situation is far
shorter that traditional values and may not be sufficient in providing doses to meet R-2
quality water standards.
Secondly, the quality of the water in the WTPU is far different than the quality of
water in a pool. The manufacturer's data stated that the tablet would give a 1-3 mg/L
chlorine residual. This statement assumes that the pool water is potable and either has
73

almost no chlorine demand or already has a chlorine residual from the water treatment
plant. The secondary effluent from the WTPU on the other hand, will most definitely
have a chlorine demand, which could even exceed the 1-3 mg/L residual that the chlorine
tablet provides. Thus, it is poor logic to assume that a pool tablet would provide the
desired disinfection.
Finally, the design of the weir system for the WTPU is not suited for the
disintegration rate of the chlorine tablets. Since the chlorine tablets are designed for pool
use, they are meant to be placed in a pool chlorination chamber. This chamber forcefully
recycles the pool water through the chamber where the chlorine tablet is fully submerged
at all times. This is very different from the weir setup in the WTPU in which the water
slowly flows around the chlorine tablet, and the tablet is not fully submerged. Therefore,
it is highly unlikely that the chlorine tablets will disintegrate at the same rate as in a pool
chlorination chamber. In other words, it is unlikely that the tablets will provide a
chlorine residual of 1-3 mg/L.
To test the effectiveness of the chlorine tablets, 5 samples were taken at evenly
spaced time intervals during the morning loading period. The first sample represented a
chlorine contact time of approximately 10 hours since the tank had not been loaded since
the previous evening. The last sample represented the shortest chlorine contact time
which was approximately VA minutes. The three intermediate samples were taken to
determine if there was a change in the disinfection effectiveness as the contact time
varied throughout the loading period. Additionally, random samples were tested onsite
for total chlorine and chlorine residual using a Hach chlorine test kit.
74
The results of the testing proved that the chlorine tablets did not work in the same
way as in a pool situation. There was no noticeable reduction in the fecal coliform count.
The results of the microbial testing showed that fecal coliform counts were similar to
typical values obtained prior to any disinfection during the UV disinfection period of
testing. Additionally, the average total chlorine measured in the disinfected effluent
averaged at 0.15mg/L, and there was no measurable free chlorine in the effluent.
The results showed two things. First, the results showed that the chlorine tablets
were not disintegrating at the same rate as the manufacturer intended, otherwise, the total
chlorine would have been between l-3mg/L. Secondly, the results showed that there is a
chlorine demand, and the chlorine demand is greater than the chlorine dose that is being
applied by the chlorine tablets. Clearly, the chlorine tablets do not provide enough of a
chlorine dose to disinfect the effluent to R-2 quality water standards.
In order to improve the chlorine disinfection process at the end of the WTPU, two
revisions must be made. First, the chlorine contact chambers must be resized to provide a
minimum contact time of 15 minutes as stated by the DOH guidelines. Thus, using the
loading schedule outlined by NSF Standard 40, and a total daily loading of 400gpd, the
disinfection chamber must be at least 14 gallons. This will accommodate the largest
loading of 160 gallons in three hours during the evening loading period. Secondly,
different chlorine tablets must be used if the existing weir configuration was to remain.
The chemical binder used in the tablets would need to release the chlorine into the water
at a faster rate. If this was not possible, or using existing chlorine tablets was desired,
the weir configuration would need to be revised to submerge multiple chlorine tablets
simultaneously in order to raise the total and free chlorine levels in the contact chamber.
75

Chapter 5 Discussion
Now that the results have been presented, it is necessary to discuss some of the
design changes and plans for a real OWRS. Before discussing this, however, a break
down of the guidelines that could be changed and those that must be complied with in
order to make onsite water reclamation a reality must be understood. First, the
regulations that are currently in the guidelines that could possibly be revised or relaxed
are discussed. These are the regulations that only apply to current technological
limitations or current processes that have driven the regulations in the past. Secondly,
some of the guidelines are discussed that, regardless of the improvements made to the
system, are unlikely to change. These are the requirements currently listed in the
guidelines that state officials feel are necessary to maintain minimum standards that
cannot be revised. After discussing how the regulations need to be altered, it will be
possible to discuss the actual changes to the system and how the OWRS could possibly
be designed. Finally, some of the roadblocks that will remain even if some of the
guidelines were revised to accommodate an OWRS are discussed.
5.1 Guideline Revisions
There are some currently active regulations that could be revised to make onsite
water reclamation more plausible. The first regulation recommended for revision is the
one that requires that signs shall be posted where reclaimed water is used. As stated
earlier, this regulation has an extremely negative psychological impact on people
unfamiliar with water quality standards. A sign stating that reclaimed water is used for
76

irrigation around the home could be a major deterrent for this type of system. Images of
horrible diseases or even death come to mind for the uninformed person and could be a
real source of headache and trauma for a homeowner relating to friends and neighbors.
On the other hand, the alternative of keeping the homeowner and neighbors uninformed
would also be a poor choice. For example, current water supply systems allow drinking
from an outdoor hose or sprinkler head, however, if an onsite water reclamation system
was used this practice would not be recommended. Thus, there would be some level of
education necessary to the general public before R-l quality water could be used
regularly in a residential area. In other words, a sign in everyone's front yard may not be
the solution; but neither would be the lack of notification. The challenge of getting the
general public to accept this system may possibly be the largest drawback to making
water reuse possible at a residence.
The regulation concerning the maintenance and care of a system is the next
guideline requiring revision prior to onsite water reclamation. The DOH guidelines
currently state that reclaimed water may only be used at a residential property when
managed by an irrigation supervisor. It seems as if the intent of this guideline is for the
management of reclaimed water at large, privately owned properties, such as golf
courses, or farms. This guideline is not practical, however, from a single-homeowner's
point of view. Yet, while it is unreasonable to expect a homeowner to hire an irrigation
supervisor, it may also be unreasonable to expect a homeowner to be in charge of the
maintenance of the system because of the technical nature of the system and the lack of
any assurance to the regulators that the system would be properly maintained.
Ultimately, this determination would depend upon the level of monitoring required by the
77

system. One recommendation to revise this rule would be to designate the company
selling the wastewater treatment package unit and the onsite water reclamation system as
the irrigation supervisor. This may prove to be acceptable since the WTPU would
require regular maintenance, and thus, a reclaimed water use program could be
incorporated into the regular maintenance program for the WTPU. This relieves the
owner of having to ensure that water meeting R-l standards is produced. Also, a regular
maintenance program would be much less expensive for the homeowner than hiring a full
time individual to maintain this system. The only drawback to this recommendation,
however, is that onsite water reclamation is still very costly when compared to the cost of
potable water today. Currently in the state of Hawai'i, potable water costs approximately
$1.17/1,000gallons. Therefore, just to make the maintenance program comparable to the
current cost of potable water, the monthly maintenance bill would need to be under $20-
$30/month, the cost of a typical water bill.
The third regulation that would require revision in order to make onsite water
reclamation more plausible is the requirement that a UV disinfection system must have
three UV banks in series to provide a minimum design dose of 140mW-sec/cm2 at a
maximum week flow. The current rationale for requiring three UV banks in series is that
three banks is considered to be the minimum number of banks necessary to prevent short
circuiting and inadequate disinfection (White, 1999). This rationale is designed to ensure
that if a lamp failure occurs or other problems prevent one bank from operating at a less
than ideal condition, an adequate dose could still be provided to the microorganisms.
This is definitely a necessary criterion for a wastewater treatment plant which services a
large amount of water and must discharge it before additional water can be accepted at
78
the plant, but this is not the case for a single home OWRS such as this one. For example,
if the onsite water reclamation system was designed with only one lamp and there was a
lamp failure, the water could be diverted to the leach field and the WTPU could operate
in a similar fashion as a septic tank. Thus, the requirement of having back up UV banks
is really a luxury for this system and not at a necessity at all. In essence, all that should
be required in the guidelines is that the microbial requirements for R-l water be met
before use. Furthermore, the methodology on how this is accomplished should be at the
manufacturer's discretion.
A regulation associated with the requirement of three UV banks in series is the
requirement for backup power to be supplied to the system. If it is understood that in the
event of a lamp failure that R-l water production would temporarily be suspended, then
the same reasoning could be employed for power failures. Therefore, it is recommended
that a backup power supply system for the UV disinfection process be eliminated.
Another unnecessary regulation is the additional requirement for minimum
turbidity levels prior to filtration. The current regulation requires that the secondary
effluent used for reclamation must be below 5NTU before filtration. The rationale
behind this regulation is that conventional wisdom states that secondary effluent above
5NTU cannot reasonably be treated to meet the final requirement of below 2NTU.
Therefore, the State DOH placed this requirement in the guidelines as a goal for
secondary effluent quality. Depending on the type of sand filter used and the use of
chemical coagulants, however, the final turbidity requirement can be achieved with
secondary effluents greater than 5NTU. Thus, in order for this system to operate
consistently, the initial turbidity requirement for secondary effluent must be relaxed.
79
Again, this is an intermediate regulation that does not alter the final water quality, and is
therefore unnecessary.
Finally, the criteria for alarms must be reduced if an OWRS is to be possible. The
guidelines for UV disinfection require eight different alarms throughout the process.
Alarms are required to monitor: flow rate, transmittance, turbidity, liquid level, on/off
status of each UV bank, on/off status of each UV lamp, UV intensity, and lamp age. As
in the case of some of the guidelines already discussed, some of these requirements do
not apply. Of these eight alarms, only three apply to this design. First, there would be
little reason to monitor the flow rate since this system is not dependent on an adjustable
baffle system like most UV systems which regulate flow and the liquid level in the flow
channel. Rather, this system would operate on a pump that has only one flow rate and
pumps the water through and enclosed UV system. Therefore, a flow meter alarm would
be unnecessary, as would an alarm to monitor the liquid level of each channel. The
on/off status of each UV bank would also be unnecessary since it was recommended
earlier that only one UV lamp would be used. Thus, the alarm to monitor the status of the
UV lamp would be sufficient in this system. Finally, the lamp age and UV intensity
should not be required in this system since the system would be designed to the minimum
dose produced over the life of the lamp. Therefore, an alarm would only be needed to
monitor the on/off status of the lamp, signaling when R-l quality water was not being
produced. This leaves alarms for the transmittance, turbidity, and status of the UV lamp
as the only ones necessary for the operation of this system.
It is possible that even the transmittance would not require an alarm since this
study shows that every time the turbidity was too high, the transmittance was too low;
80

and never was the transmittance above the guidelines when the turbidity was within
acceptable limits. Based on previous results, however, this might not always be the case.
Two separate studies showed that there was a poor correlation between transmittance and
turbidity (Darby, 1993; Petrasek et al., 1980). In contrast, one showed an excellent
correlation between the two (Harris et al., 1987). A possible reason for the confusion in
the relationship between these two measurements is the fact that transmittance is effected
more by the dissolved constituent in the water than the suspended particles (Quails et al.,
1983). Thus, until the relationship between transmittance and turbidity is better
understood, both will require monitoring.
81

5.2 Guidelines Remaining
So far it seems as if there would need to be many revisions to the existing
guidelines in order to make onsite reclamation possible, but there are also many
regulations that could remain unchanged. Regulators would assume that a lower level of
safety would occur if revisions to the following guidelines were made. The first
guideline that would unlikely change is found in the statement made in the DOH
guidelines that adequate measures should be made to prevent the ponding of reclaimed
water. This regulation is very similar to the next one in the guidelines which states that
reclaimed water should be managed to avoid the proliferation of mosquitoes. Both of
these regulations are concerned with the possibility of any pathogenic bacteria growth
that may remain in the area. The concern would be that undesirable microorganisms
could proliferate in ponded water, infect mosquitoes, and spread disease. Since this
regulation would not effect the design of the system, however, revisions to the guidelines
and the OWRS would not be required.
These two regulations, however, shed light on how the use of reclaimed water is
viewed. Clearly, regulators have serious apprehensions about the use of reclaimed water,
making it difficult to implement and enforce the proper use of reclaimed water in a
residential zone. This apprehension is heightened because homeowners do not carefully
monitor their water usage the way a golf course, farm, or larger organization would. This
is not to say that homeowners are careless, but simply that the construct of society does
not currently require homeowners to monitor their water use. There are no rules for
watering a homeowner's lawn or carefully preventing ponding in one's yard. Therefore,
suddenly requiring these things to be taken seriously may be beyond the desire of many
82
homeowners. The inconvenience caused by using reclaimed water may alone be enough
to deter many homeowners from using such a system even if they could save money.
The next regulation unlikely to change is the requirement that no discharge,
runoff, or overspray may spread beyond approved boundaries. The rationale for this
guideline is that it is impossible for regulators to know what conditions exist beyond the
boundaries of the person using the reclaimed water. This guideline may just be an
artificial restraint, however, since some sort of boundary limitations had to be described
in the guidelines. Thus, the practicality of the OWRS could heavily depend on how this
guideline is followed. If this guideline was strictly enforced, sprinkler irrigation would
be nearly impossible since sprinklers always cause overspray and runoff to some extent.
Realistically, however, it is unlikely that the guideline would be interpreted this way. If it
was determined that reclaimed water was safe for one homeowner at one residential
property, then it would be unlikely that overspray onto an adjoining property would
create unsafe conditions for the neighboring homeowner. Therefore, this guideline
should most likely not cause any additional difficulty in making onsite water reclamation
a reality.
Also, there are two regulations concerning the use of reclaimed water near
drinking water supply wells. The first requirement states that there can be no irrigation
using reclaimed water within a minimum of fifty feet from a drinking water supply well.
The second requirement states that the outer edge of the impoundment should be one
hundred feet from any drinking water supply well. These requirements do not directly
relate to the reclaimed water concepts discussed in the majority of this paper since they
do not necessarily apply to water reclamation near most residential units because most
83

homes do not have their own drinking wells. Therefore, these two requirements apply
more to a rural setting such as a farm or a home in a remote location and do not directly
apply to onsite water reclamation in a residential zone.
Finally, it is highly unlikely that any of the biological criteria or water quality
standards would be relaxed to accommodate an OWRS. The responsibility to meet
standards such as a final effluent quality of 2NTU and less than 2.2CFU/100mL for R-l
water, or less than 23CFU/100mL for R-2 water is strictly on the shoulders of the system
designers. Thus, any regulations pertaining to these standards should be left out of any
conversation with the State DOH when presenting this system for review. Additionally,
since the regulations are not structured to accommodate the type of system described in
this report, it is safe to assume that there may be some additional requirements that could
arise to regulate an OWRS. Therefore, restrictions currently not in the guidelines should
be expected to regulate an OWRS.
84

5.3 Proposed Design
Now that the regulations have been discussed and the testing results have been
presented, it is questionable if an OWRS to produce R-l quality water is currently
practical. First, the WTPU / OWRS package is currently not reliable enough to
consistently produce R-l quality water. Secondly, many revisions to the existing
guidelines are necessary to make the system a reality. Finally, if the guidelines were
strictly enforced, water overspray and runoff would be almost impossible to avoid.
While R-l quality water is difficult to currently produce, R-2 quality water is not. The
system (as currently constructed) was shown to easily produce water that met the R-2
quality standards (see Figure 26). Also, if the guidelines were strictly enforced and drip
irrigation was the only practical form of irrigation, R-2 water could still be used since this
is the approved form of irrigation for R-2 water in a residential zone. In summation, an
OWRS to create R-2 quality water is ideal since it requires less revisions to the existing
guidelines and is more in line with the current capabilities of the OWRS.
This section will first discuss the recommended design for an actual OWRS.
Secondly, a maintenance program to care for the system and ensure that the guidelines
are consistently met will be discussed. Finally, the last section will address some of the
remaining problems with the system even after the recommended revisions have been
incorporated.
When designing a follow-on system to this experiment, it is highly recommended
that an upflow sand filter be used. This is recommended for many reasons. First, the
case study (Braunstein et al., 1996) showed that an upflow sand filter very effectively
removed suspended solids to levels below 2NTU. This pre-made sand filter effectively
85

allowed the researchers to focus on the UV disinfection and not have to bother with many
of the problems encountered in this project. Secondly, an upflow sand filter does not
require periodic backwashing since it is continuously backwashed. This reduces the
regular maintenance required on the sand filter and does not create a surge of backwash
water into the WTPU. Also, the upflow filter is better suited for the configuration of this
system. As shown in Figure 3, this experiment relied on the existing elevation of the
secondary effluent from the WTPU. The water flowed via gravity through the sand filter,
and the UV system into the collection container. Although this is an easy and
inexpensive way to run the system, this method would be full of problems. The main
flaw with a gravity design is that the final WTPU would be installed underground. This
would mean that the filter, UV lamp, and collection container would also have to be
underground if a gravity rapid sand filter was used. This would be extremely impractical.
Since the system would be underground, maintenance on the sand filter would be nearly
impossible, an effective backwash of the filter could not be performed since visual
inspection is practically required, and the UV lamp would be completely inaccessible for
maintenance. Thus, we are left with a system that requires a pump to bring the secondary
effluent to the surface. Therefore, since a pump is already required in the design, an
upflow filter might as well be used instead of a gravity filter.
The second major revision required to improve this system is to have an airtight
UV system. This revision is needed because the accumulation of moisture on the inside
of the quartz sleeve was the most likely cause of fouling in the UV system. The case
study mentioned earlier stated that there was little change in the effectiveness of the UV
lamps when the quartz sleeves were cleaned daily versus when they were not cleaned for
86

ninety days. Also, since our testing period lasted only slightly longer than the average
recommended cleaning period (one month) for a quartz sleeve, it is highly unlikely that
the outside of the sleeve was extremely dirty. This fact was also noted after the testing
period when the quartz sleeve was removed and inspected for contamination. Little dirt,
water marks or bacterial growth were observed on the outside of the quartz sleeve. Thus,
the major cause of fouling was likely due to the moisture build up on the inside of the
quartz sleeve because the UV system was not airtight.
The revisions necessary to make an airtight system are quite simple. Currently,
the quartz sleeve is placed into the reactor, followed by a threaded aluminum cylinder,
which secures the quartz sleeve in place and guides the UV lamp into location when
installed. After the UV lamp is installed, a rubber gasket is fastened over the aluminum
cylinder. This gasket provides excellent protection from water and dust that could enter
and effect the performance of the lamp, but this current configuration is not airtight. To
make the system airtight, the UV lamp and quartz sleeve must be manufactured as a
single unit. Then there would be no chance of moisture accumulating on the inside of the
quartz sleeve. This would require only small revisions to the current design of the UV
system and would greatly reduce the chances of fouling due to moisture. Also, the quartz
sleeve, which is sealed around the lamp, would provide greater protection to the lamp.
The main disadvantage of this design would be the additional cost associated with
manufacturing the lamp/sleeve package versus manufacturing them as separate items.
This design would also effect the cost of repair when lamp replacement is required. Due
to the necessity of an airtight system, however, this additional cost cannot be avoided.
87

Another necessary revision to this system would be the overall process by which
the reclaimed water is made. The system that was constructed in this experiment
collected the filtered water in a single collection container. To achieve the regulatory
dose of 140mW-sec/cm2, the water pump pushed water through the UV reactor and
discharged the water back into the same collection container, as explained in an earlier
section. This recycling process could effectively treat a set amount of filtered effluent
and provide the necessary effective dose to meet current DOH guidelines. The problem
with this design, however, is that the system does not contain a final holding tank for the
R-2 quality water. A separate tank would definitely be required since the sand filter
directly discharges newly received effluent from the WTPU into the current collection
container. Thus, as the system is currently built, whenever new filtered effluent is
discharged into the collection container, the entire amount of the effluent in the container
must be recycled through the UV reactor. Also, if this was the only collection container
in the OWRS, whenever the recycle process was operating, no water would be available
for reuse.
The following design is proposed to remedy the current problems. First, a twenty
to fifty gallon container would be required to collect filtered effluent from the WTPU.
Once the container is full, an electronic valve would be required to divert all secondary
effluent from the WTPU into the leach field until the ultraviolet disinfection process was
complete. Then, all disinfected effluent would be transferred to a final collection
container which could then be used for reclaimed water purposes. Finally, the electronic
valve would be reopened to redirect all secondary effluent back into the sand filter to
repeat the process. This batch process for creating R-2 quality water loses any secondary
88

effluent that is discharged during the recycle process, but the losses should be minor
compared with the amount collected. This specific problem could also be avoided if two
intermediate containers were used, but this option is not ideal due to the added overall
cost and size of the system.
Figure 27 is a schematic of the OWRS with the recommendations explained
Figure: 27 Proposed Design .-FEF3 Return
To Tank
.From Tank
already incorporated into the design. This figure shows that the system would be above
ground while the WTPU would be below ground. Therefore, a pump would be required
to lift all secondary effluent into the sand filter. An upflow sand filter is incorporated
into the design since a pump is already required and since an upflow filter would require
less maintenance and servicing than other filter types. Following the filter, the
intermediate collection container receives all water from the sand filter until its capacity
is reached. Once this capacity is reached, the container and UV system begin the recycle
process until the required effective dose is obtained. Then a submersible pump transfers
all of the disinfected water from the intermediate collection container to the final
89

collection container. Finally, the water is ready for reuse; and the filtration/disinfection
system repeats the entire process with a new batch of secondary effluent.
90

5.4 Remaining Problems
Even if all of the above changes were made to the system; and the DOH
guidelines were revised to accommodate the OWRS, some problems would still remain.
The first problem is that the cost of the system outweighs any of the cost savings that
could be realized by this system. This is true because the only cost savings that can be
realized by using an OWRS is the savings in monthly potable water use. At best, potable
water use reduction for a four-person family would be 60% of the total water used (see
Figure 2). In Hawai'i, the average four person family's water bill is approximately $20-
$30/month. Therefore, the possible savings that could be realized using an OWRS would
be $12-$18/month. Compared with the monthly costs that would be required to operate
the OWRS, the potable water savings would be minimal. Not only would the system
have a high initial cost, but the monthly operating costs would also be high. As stated
earlier, the quartz lamp sleeve for the UV disinfection unit would need a monthly
cleaning. Even if this was the shortest time period that maintenance calls were made, one
maintenance call per month would cost at least $60. This already exceeds the monthly
savings in potable water and doesn't even include repairs to the system, new parts,
electricity cost or any regulatory testing. Clearly, the cost would still be a major issue.
The second problem remaining with this system is the maintenance schedule
itself. The estimate of $60/month is a best case scenario. In reality, however, this cost
could be much more. A maintenance program would need to periodically check the
condition of the valves, filter, UV system, pumps, UV lamp, and UV sleeve. Ideally,
these systems should be checked at least once a week to make sure that the system is
operating within the required parameters; but this would greatly increase the cost of a
91

maintenance program. Another question that has been left unanswered until now is the
question of the number of microbial tests that would be required to ensure R-2 quality
water. The guidelines state that the disinfected effluent must not exceed 23 CFU/100mL
utilizing bacteriological results of the last seven days and that the density does not exceed
200 CFU/100mL in more than one sample in any 30 day period. The guidelines are
written in a way such that the intent seems to require a daily microbial test. Daily testing,
however, certainly excludes any maintenance program from being even slightly realistic
in cost. This requirement is similar to the requirement that restricts overspray and
discharge beyond approved boundaries in that it will likely not be strictly enforced.
Thus, daily testing would probably not be the case and this would be especially true for
R-2 quality water and a drip irrigation system since the risk of human contact with the
water is low. Also, since the system can easily disinfect the water to meet the DOH
guidelines, the likelihood of less frequent testing is also increased.
The last problem with this system is that it would not be as safe as the residential
practices that are currently done now. Even if the OWRS was working perfectly and was
creating R-2 quality water consistently, the water created is not as clean as current
drinking water. Therefore, the water is not as safe as potable drinking water. This is
something that communities and regulators may have difficulty accepting. Once a certain
level of safety has been set, it is difficult to lower the standard. In addition, the current
level of safety requires little effort or knowledge on the part of the homeowner. If
suddenly, the level of safety were to decrease and the level of knowledge or training to
operate an OWRS were to increase, the desire to use reclaimed water might be less.
Thus, onsite water reclamation is ultimately controlled by the desires of the homeowner.
92

Since onsite water reclamation is ultimately controlled by the desires of homeowners,
however, desires can be changed as the conditions change. For example, if the cost of
potable water increases or water shortages restrict irrigation, water reuse will look more
attractive. Eventually the desire to save money or have a green lawn may outweigh any
fears of reclaimed water being unsafe. Also, government subsidies to offset the
additional cost of an OWRS or educational programs to inform the general public of the
benefits of water reuse may change the public's opinion about water reuse in a residential
area. In conclusion, current public opinion and current cost restrictions are only current
barriers. Inevitably the current conditions will change and thus, these barriers will
change making onsite water reclamation much more possible, attractive, and cost
effective in the future.
93
Chapter 6 Conclusion
The following recommendations are made to the OWRS design:
• The OWRS should be designed with the purpose to create R-2 quality water.
• The sand filter should be a continuously backwashed, deep bed upflow sand filter.
• An airtight UV system is crucial to efficient system performance.
• A batch system process for creating R-2 quality water is recommended.
The following recommendation is made concerning revisions to the State DOH
guidelines for water reuse:
• Intermediate requirements should be removed. DOH guidelines should only
outline the final requirements necessary for the classification of the desire type of
reclaimed water for small onsite systems.
94

Appendix
Date Total Suspended Solids (mg/L) Volatile Suspended Solids (mg/L)
Before Filter After Filter UV (Once) Before Filter After Filter UV (Once)
3/4/99 2.67 5.25 2.67 3.23
3/5/99
3/9/99 10.00 8.80 7.10 8.60 6.20 4.90
3/18/99 7.50 4.65 3.26 6.46 2.83 1.63
3/19/99 4.12 1.47 3.33 2.87 0.63 . 1.46
3/22/99 3.40 1.00 1.82 3.00 1.00 1.00
3/24/99 5.35 1.56 1.59 4.19 1.25 1.14
3/25/99 5.40 1.88 1.80 4.80 1.56 1.35
3/26/99 6.53 2.57 3.20 5.71 1.71 2.20
4/2/99. 3.31 1.67 2.04 2.90 1.04 1.22
Averages 4.80 1.74 2.09 4.12 1.31 1.38
Date Turbidity (NTU) Transmittance (%)
Before Filter After Filter UV (Once) UV (Twice) Before Filter
After Filter UV(Once) UV (Twice)
3/4/99 5.8 4.8 59.9 60.5
3/5/99 5.5 4.5 61.6 62.4
3/9/99 10 10 10 43.3 39.9
3/18/99 7.2 5.2 5.9 53.5 57.8 58.4
3/19/99 6.9 5.1 5.8 52.1 56.1 57.7
3/22/99 5.9 2.6 2 2.4 65 72.1 72 71.4
3/24/99 7 3.3 2.7 53 59.5 62.6
3/25/99 8 4.6 4 48.3 54.1 56.5
3/26/99 8.8 5.7 5.2 45.3 48.3 50.3
4/2/99 7.8 5.4 5.5 51 55.7 56.3 57.2
Averages: 7.5 4.3 3.9 52.5 57.9 59.5
Date Density (CFU/100ml) Test Comments
Before Filter After Filter UV (Once) UV (Twice)
3/4/99 1,700,000 1,240,000 System backwashed 2 days ago
3/5/99 1,500,000 1,520,000
3/9/99 8,000,000 7,200,000 478,000
3/18/99 600,000 85,000 1,500 Added 4" 90 grit sand to filter
3/19/99 200,000 250,000 7,500
3/22/99 290,000 60,000 600 50 Sand filter backflushed and now 12" in depth
3/24/99 2,120,000 1,700,000 17,000
3/25/99 1,440,000 1,162,000 9,800
3/26/99 1,740,000 1,260,000 23,800
4/2/99 1,280,000 1,000,000 3,000 1,160 Backwashed Filter before the test
95

Collimated Beam Test #1 Date: 2/10/99
Dose Density Log(N/No) (mW-sec/cm2) (CFU/100ml)
0 2,226,667 0.0000000
5 284,000 0.8943369
10 5,213 2.6305397
40 6 5.5695040
50 15 5.1813238 75 6 5.5695040
Collimated Beam Test #3 Date: 3/25/99
Dose Density Log(N/No) (mW-sec/cm2) (CFU/100ml)
0 1,162,000 0.0000000 5 100,800 1.0617456 10 540 3.3328124 20 15 4.8891149
30 6 5.2870549
40 2 5.7641761 50 5 5.3662361 75 2 5.7641761
Collimated Beam Test #2 Date: 3/24/99
Dose (mW-sec/cm2)
0 5 10 20 30 40
50 75
Density (CFU/100ml)
1,700,000 73,000 503 37 7 3
8 9
Log(N/No)
0.0000000 1.3671261 3.5288809 4.6622472 5.3853509 5.7533277
5.3273589 5.2762064
Collimated Beam Test #4 Date: 3/26/99
Dose Density Log(N/No) (mW-sec/cm2) (CFU/100ml)
0 1,260,000 0.0000000 5 51,200 1.3911006 10 248 3.7059189 20 5 5.4014005 30 8 5.1972806 40 9 5.1461280 50 5 5.4014005 75 4 5.4983106
Multiple Pass Test (4/2/99)
Sample Received Dose Density Pass Log (N/No)
Description (mW-sec/cm2) CFU/100mL # Original 0 1,000,000 0 0
Pass 1 8 3,000 1 2.52
Pass 2 16 1,160 2 2.94
Pass 3 24 307 3 3.51
Pass 4 32 105 4 3.98
Pass 5 40 12 5 4.92
Pass 10 80 1 10 6
Pass 17.5 140 1 17.5 6
96
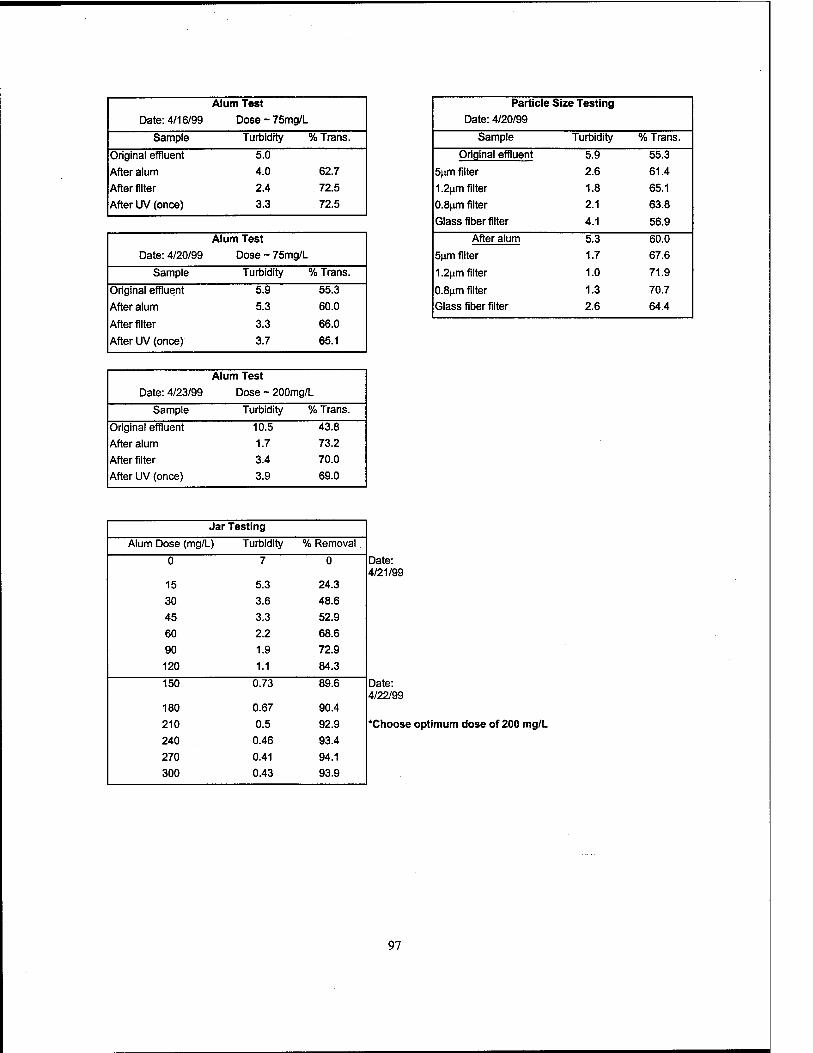
Alum Test
Date: 4/16/99 Dose - 75mg/L
Sample Turbidity '/o Trans.
Original effluent 5.0
After alum 4.0 62.7
After filter 2.4 72.5
After UV (once) 3.3 72.5
Alum Test
Date: 4/20/99 Dose ~ 75mg/L
Sample Turbidity % Trans.
Original effluent 5.9 55.3
After alum 5.3 60.0
After filter 3.3 66.0
After UV (once) 3.7 65.1
Particle Size Testing
Date: 4/20/99
Sample Turbidity % Trans.
Original effluent 5.9 55.3
5nm filter 2.6 61.4
1.2nm filter 1.8 65.1
0.8nm filter 2.1 63.8
Glass fiber filter 4.1 56.9
After alum 5.3 60.0
5nm filter 1.7 67.6
1.2jim filter 1.0 71.9
0.8(im filter 1.3 70.7
Glass fiber filter 2.6 64.4
Alum Test
Date: 4/23/99 Dose - 200mg/L
Sample Turbidity % Trans.
Original effluent 10.5 43.8
After alum 1.7 73.2
After filter 3.4 70.0
After UV (once) 3.9 69.0
Jar Testing
Alum Dose (mg/L) Turbidity % Removal
0 7 0
15 5.3 24.3
30 3.6 48.6
45 3.3 52.9
60 2.2 68.6
90 1.9 72.9
120 1.1 84.3
150 0.73 89.6
180 0.67 90.4
210 0.5 92.9
240 0.46 93.4
270 0.41 94.1
300 0.43 93.9
Date: 4/21/99
Date: 4/22/99
'Choose optimum dose of 200 mg/L
97
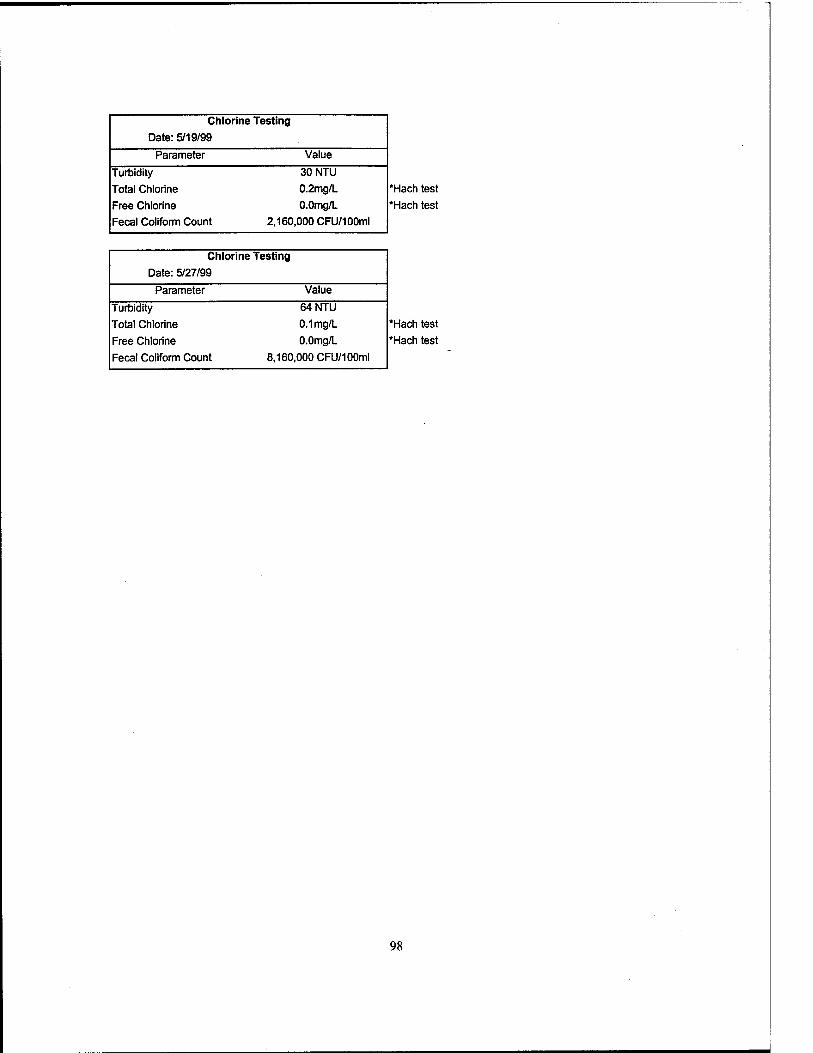
Chlorine Testing
Date: 5/19/99
Parameter Value
Turbidity 30 NTU
Total Chlorine 0.2mg/L
Free Chlorine 0.0mg/L
Fecal Coliform Count 2,160,000 CFU/100ml
*Hach test
Hach test
Chlorine Testing
Date: 5/27/99
Parameter Value
Turbidity 64 NTU
Total Chlorine 0.1mg/L
Free Chlorine 0.0mg/L
Fecal Coliform Count 8,160,000 CFU/100ml
Hach test
Hach test
98

Turbidity(NTU) unfiltered Turbidity(NTU) filtered Test# Day Influent Effluent Test# Day Influent Effluent
1 10/23/98 32 1.5 1 11/20/98 8.4 1.2 2 10/26/98 33 1.6 2 11/23/98 8.5 1.3 3 10/27/98 42.5 1.4 3 11/25/98 23 1.9 4 11/6/98 44 3.3 4 12/1/98 16 3.7 5 11/9/98 36 3.5 5 12/2/98 38 2.7 6 11/10/98 43 3.5 6 12/3/98 36 3.6 7 11/11/98 44 3.7 7 12/8/98 15 4.5 8 11/12/98 45 4.2 8 12/11/98 15 4.1 9 11/13/98 63 5.0 9 12/14/98 7.7 3.4 10 11/17/98 54 4.4 10 1/4/99 25 2.8 11 11/18/98 55 4.0 11 1/5/99 22 2.0 12 11/26/98 43 4.1 12 1/6/99 24 2.0 13 11/27/98 32 8.8 13 1/7/99 22 2.0 14 11/30/98 46 6.6 14 1/8/99 25 2.3 15 12/8/98 37 6.2 15 1/11/99 25 2.1 16 12/25/98 60 6.5 16 1/12/99 32 2.0 17 12/10/98 22 5.1 17 1/13/99 29 2.1 18 12/25/98 60 6.2 18 1/14/99 18 2.1 19 12/28/98 53 7.0 19 1/15/99 40 2.2 20 12/29/98 74 5.4 20 1/18/99 17 3.1 21 12/30/98 74 6.5 21 1/19/99 4.7 4.0 22 12/31/98 52 5.2 22 1/21/99 24 5.0 23 1/1/99 22 5.1 23 1/22/99 34 4.2 24 1/4/99 28 4.3 24 1/25/99 32 2.4 25 1/5/99 42 3.9 25 1/26/99 23 2.1 26 1/6/99 35 3.5 26 1/27/99 19 2.0 27 28
1/7/99 1/8/99
30 35
3.0 3.5
27 1/29/99 35 2.0
30 1/12/99 55 3.5 31 1/14/99 52 4.2 32 1/15/99 67 3.9 33 1/18/99 45 5.6 34 1/19/99 48 6.1 35 1/21/99 58 7.3 36 1/22/99 57 6.5 37 1/25/99 47 4.2 38 1/26/99 65 4.0 39 1/27/99 34 3.3 40 1/29/99 68 3.5 41 3/1/99 84 8.2 42 3/2/99 65 7.4 43 3/3/99 72 6.6 44 3/4/99 70 5.8 45 3/5/99 65 5.5 46 3/9/99 70 10.0 47 3/8/99 71 10.0 48 3/10/99 51 7.5 49 3/12/99 60 30.0 50 3/15/99 65 5.7 51 3/16/99 52 2.6 52 3/17/99 55 4.0 53 3/18/99 65 7.2 54 3/19/99 60 8.2 55 3/22/99 50 4.0 56 3/23/99 62 3.7
99

Transmittance (filtered) Time# Day Influent Effluent
1 11/9/98 60.5 2 11/10/98 60.1 3 11/11/98 60.8 4 11/12/98 56.8 5 11/13/98 63 6 11/16/98 62.6 7 11/17/98 62.3 8 11/18/98 40.1 63.3 9 11/19/98 39.6 65.1 10 11/23/98 33.6 67.4 11 11/24/98 65.6 12 11/25/98 46.5 62.2 13 11/26/98 59.2 14 11/27/98 42.2 15 12/1/98 37.1 52.6 16 12/2/98 30.9 55.9 17 12/3/98 35.2 54.6 18 12/7/98 38.5 52.1 19 12/8/98 38.4 52.7 20 12/10/98 38.1 51.9 21 12/11/98 37.2 53.3 22 12/14/98 35.1 54.9 23 12/15/98 50.0 56 24 12/16/98 52.1 62 25 12/17/98 43.5 66.8 26 12/18/98 40.8 65.5 27 12/21/98 44.0 56.9 28 12/22/98 49.6 60.4 29 12/23/98 42.3 65.1 30 12/24/98 36.1 54.2 31 12/25/98 44.6 47.2 32 12/28/98 36.2 48.5 33 12/29/98 36.0 48.6 34 12/30/98 43.6 46.8 35 12/31/98 30.7 52.1 36 1/1/99 27.5 53.3 37 1/4/99 36.2 57.2 38 1/5/99 35.1 61.5 39 1/6/99 38.9 60.7 40 1/7/99 37.4 61.2 41 1/8/99 34.1 59.4 42 1/11/99 35.4 57.9 43 1/12/99 40.3 60.5 44 1/13/99 39.1 62.7 45 1/14/99 46.9 65.8 46 1/15/99 37.1 64 47 1/18/99 38.1 61.5 48 1/19/99 54.3 60.4 49 1/21/99 48.4 55.7 50 1/22/99 38.0 59.1 51 1/25/99 33.6 65.5 52 1/26/99 44.4 64.6 53 1/27/99 46.6 67.4 54 1/29/99 44.5 68.6
100

Bibliography
1. Adin, A. (1986) "Problems Associated with Particulate Matter in Water Reuse for Agricultural Irrigation and Their Prevention" Water Science Technology, Volume 18, pp. 185-195
2. American Water Works Association. Volume 2, Introduction to Water Treatment. American Water Works Association, Denver, CO. 1984
3. Asano, Takashi; Eckenfelder, W.W; Malina, J.F. Jr. and Patterson, J.W. (1998) Wastewater Reclamation and Reuse. Technomic Publishing Co. Inc., Lancaster, PA, pp. 345-382.
4. Baker, M.N. (1981) The Quest for Pure Water. American Water Works Association, Second Edition.
5. Blatchley III, E.R.( 1997) "Numerical Modeling of UV Intensity: Application to Collimated-Beam Reactors and Continuous-Flow Systems" Water Research, Volume 31, Number 9, pp. 2205-2218.
6. Jeffery L. Braunstein, Frank J. Loge, George Tchobanoglous, Jeannie L. Darby (1996) "Ultraviolet disinfection of filtered activated sludge effluent for reuse applications." Water Environment Research, Volume 68, Number 2, pp. 152-161
7. Darby, J.L., Snider K.E., Tchobanoglous G. (1993) "Ultraviolet disinfection for wastewater Reclamation and Reuse Subject to Restrictive Standards" Water Environment Research, Volume 65, Number 2, pp. 169-180.
8. Eckenfelder, W.W. and Ford, D.L (1970) Water Pollution Control. Jenkins Publishing, New York, NY, pp. 67-73.
9. Hansen & Sawyer Environmental Engineers & Scientists (1992), Disinfection Alternatives for Safe Drinking Water. Van Nostrand Reinhold, pp.278-285
10. Harman, J.; Robertson, W. D.; Cherry, J. A.; and Zanini, L (1996) "Impacts on a Sand Aquifer from an Old Septic System: Nitrate and Phosphate" Groundwater November-December, pp. 1105-1113
11. Harris, G.D.; Adams, V.D.; Sorensen, D.L.; Dupont R.R. (1987) "The Influence of Photoreactivation and Water Quality on Ultraviolet Disinfection of Secondary Municipal Wastewater" Journal Water Pollution Control Federation, Volume 59, Number 8, pp. 781-787.
12. Hawai'i State Department of Health, Wastewater Branch "Guidelines for the Treatment and Use of Reclaimed Water" November 22, 1993.
101
13. Instruction Manual-UV Disinfection Unit, Series 8101. The Capitols Control Group Inc., Colmar, PA, 1998.
14. Jacob, S.M.; Dranoff, J.S. (1970) "Light Intensity Profiles in a Perfectly Mixed Photoreactor" Am. Inst. Chem. Eng., Volume 16, Number 3, pp. 359-363.
15. Linden, Karl G. (1998). "UV Acceptance", Civil Engineering, March, Vol 68 Number 3, pp. 58-61.
16. McNair, D.A. (1999) "Performance of a Scalable Wastewater Treatment Package Unit and Potential Military Applications."
17. Metcalf and Eddy, Inc. (1991) Wastewater Engineering: Treatment, Disposal, and Reuse, 3rd edition, McGraw-Hill, New York, NY, pp. 580-591.
18. Morowitz, H. J., (1950) "Absorption Effects in Volume Irradiation of Microorganisms" Science, March, Volume III, pp. 229-230
19. National Sanitation Foundation, Standard 40 for Individual Wastewater Treatment Plants, 1984
20. Quails R.G.; Johnson J.D. (1983) "Bioassay and Dose Measurement in UV Disinfection" Applied and Environmental Microbiology, Volume 45, pp. 872-877.
21. Quails, R.G.; Flynn, M.P.; Johnson, J.D. (1983) "The Role of Suspended Particles in Ultraviolet Disinfection" Journal Water Pollution Control Federation, Volume 55, Number 10, pp.1280-1285.
22. Reed, Douglas (1998) "Selecting Alternatives to Chlorine Disinfection." Pollution Engineering September, pp. 48-51.
23. Sobsey, M.D. (1989) "Inactivation of Health-Related Microorganisms in Water by Disinfection Processes" Water Science Technology, Volume 211, Number 3, pp. 179- 195.
24. Standard Methods for the Examination of Water and Wastewater, 19th edition, 1995, APHA/AWWA/WEF, United Book Press, Baltimore, MD
25. United States. Environmental Protection Agency. Ultraviolet Disinfection of Municipal Wastewater Effluents. Publication No. EPA-600 2-80-102, August 1980.
26. United States. Environmental Protection Agency. Guidelines for Water Reuse. Publication No. EPA/625/R-92/004. September 1992.
102

27. United States. Environmental Protection Agency. Ultraviolet Disinfection Technology Assessment. Publication No. EPA/832/R-92/004. September 1992.
28. Vigneswaran, S.; Visvanathan, C. (1995) Water Treatment Processes: Simple Options, CRC Press, Boca Raton, FL, pp. 109-154
29. White, G. C, Handbook of Chlorination and Alternative Disinfectants, Fourth Edition. John Wiley & Sons Inc., New York, NY, 1999
30. Wright, J., The Coming Water Famine, Coward-McCann Inc., New York, NY, 1966
103