water resources planning department projection analysis
TRANSCRIPT

Water Resources Planning Department
Projection Analysis Work Sheetsfor
Bakersfield District
2015
Printed on 4/12/2016 at 2:11 PM

17
Projected Annual Supply by Source
Historical and Projected Average Day, Maximum Day, and Peak Demands
13
14
15 Per Capita Water Demand Calculation
Indoor/Outdoor Water Usage
SB-7 Compliance Demand Worksheet
Population Estimate
Temperature & Rainfall History
Groundwater Facilities (if available)
11
12
7
16
Actual & Projected Demand in Acre-Feet
Percentage of Total Sales
9
Percentage of Total Demand
Actual & Projected Annual Average Services
10
2 Service Growth Percentage
Table of Contents for Worksheets
Worksheet Title1 Annual Services
3 District Sales (AF)
4
5
6
Demand per Service (Gallons per Day)
Percentage Change in Annual Demand
8
Printed on 4/12/2016 at 2:11 PM

Distribution of Services Chart
BK PAWS 2015 Distribution of Services Chart 4/12/2016
Residential88.0%
Multi-Residential1.7%
Commercial9.1%
Industrial0.04%
Government1.0%
Other0.1%
Distribution of Services(2015)

Historical Services Graph
BK PAWS 2015 Historical Services Graph 4/12/2016
0
10,000
20,000
30,000
40,000
50,000
60,000
70,000
80,000
1980 1985 1990 1995 2000 2005 2010 2015
Serv
ices
Year
Historical Services Single Family (MTR) Single Family (FLT) Multi Family (MFR) Commercial (COM) (IND) Government (GOV) Other (OTH)

Services
California Water Service Company - Bakersfield District Worksheet 1Water Supply and Demand Analysis and ProjectionsAverage Annual Services
Single Family Single Family Single Family Multi Family Commercial Industrial Government Other AnnualYear (MTR) (FLT) (Total) (MFR) (COM) (IND) (GOV) (OTH) Total Change1980 3,945 35,027 38,972 318 5,435 57 310 31 45,1221981 4,076 35,441 39,517 330 5,532 56 310 33 45,778 6561982 4,289 35,685 39,975 331 5,622 56 310 34 46,327 5501983 4,468 35,996 40,463 354 5,705 54 310 40 46,927 6001984 4,668 36,672 41,339 384 5,858 52 313 48 47,995 1,0681985 4,842 37,216 42,057 419 5,997 51 326 48 48,898 9031986 4,992 38,105 43,098 441 6,111 49 330 47 50,075 1,1771987 5,044 38,533 43,578 452 6,173 48 328 37 50,616 5411988 5,176 38,613 43,789 450 6,206 48 330 40 50,863 2471989 5,282 38,727 44,009 447 6,245 47 337 35 51,120 2571990 5,456 39,079 44,535 449 6,266 47 335 33 51,664 5441991 5,905 39,406 45,311 450 6,286 47 343 44 52,480 8161992 6,602 39,345 45,947 451 6,350 47 349 34 53,178 6981993 7,334 39,076 46,410 455 6,388 46 355 38 53,692 5131994 8,000 38,513 46,513 456 6,378 44 355 37 53,784 921995 8,784 37,720 46,504 458 6,400 45 357 46 53,810 261996 9,400 37,373 46,773 446 6,358 43 350 48 54,017 2071997 10,288 36,927 47,215 448 6,374 41 350 48 54,477 4601998 11,011 36,538 47,549 448 6,364 40 352 49 54,802 3261999 11,871 36,226 48,097 446 6,355 41 351 52 55,342 5402000 12,972 36,188 49,160 448 6,443 40 378 56 56,525 1,1832001 13,847 36,068 49,915 450 6,541 41 399 50 57,396 8712002 15,033 35,705 50,737 449 6,558 40 399 57 58,239 8432003 16,218 35,380 51,598 516 6,480 37 476 62 59,168 9292004 18,737 34,391 53,128 970 6,024 37 572 78 60,809 252005 21,168 33,395 54,563 960 6,047 36 573 93 62,271 3,1032006 23,069 32,776 55,844 936 6,124 36 578 122 63,640 2,8312007 24,444 32,168 56,612 931 6,219 35 579 132 64,507 2,2372008 25,154 31,418 56,572 998 6,269 33 594 103 64,568 9282009 26,478 30,720 57,198 1,035 6,245 32 653 69 65,232 7252010 28,480 29,877 58,357 1,089 6,229 32 661 56 66,424 1,8552011 30,848 28,422 59,270 1,185 6,249 32 670 55 67,462 2,2292012 33,434 26,419 59,852 1,194 6,262 32 685 51 68,076 1,6522013 35,947 24,391 60,338 1,194 6,260 31 693 53 68,568 1,1072014 38,190 22,635 60,825 1,190 6,273 30 696 69 69,083 1,0072015 41,541 19,753 61,294 1,199 6,305 30 712 76 69,616 1,047
5 Yr Avg. 35,992 24,324 60,316 1,192 6,270 31 691 61 68,561 1,57010 Yr Avg. 30,758 27,858 58,616 1,095 6,243 32 652 79 66,718 1,76715 Yr Avg. 26,172 30,235 56,407 953 6,272 34 596 75 64,337 1,43520 Yr Avg. 22,406 31,839 54,245 827 6,299 36 536 69 62,011 1,154
Note: Reclassification occurred between categories from 2007 to 2009
BK PAWS 2015 Services 4/12/2016
Services
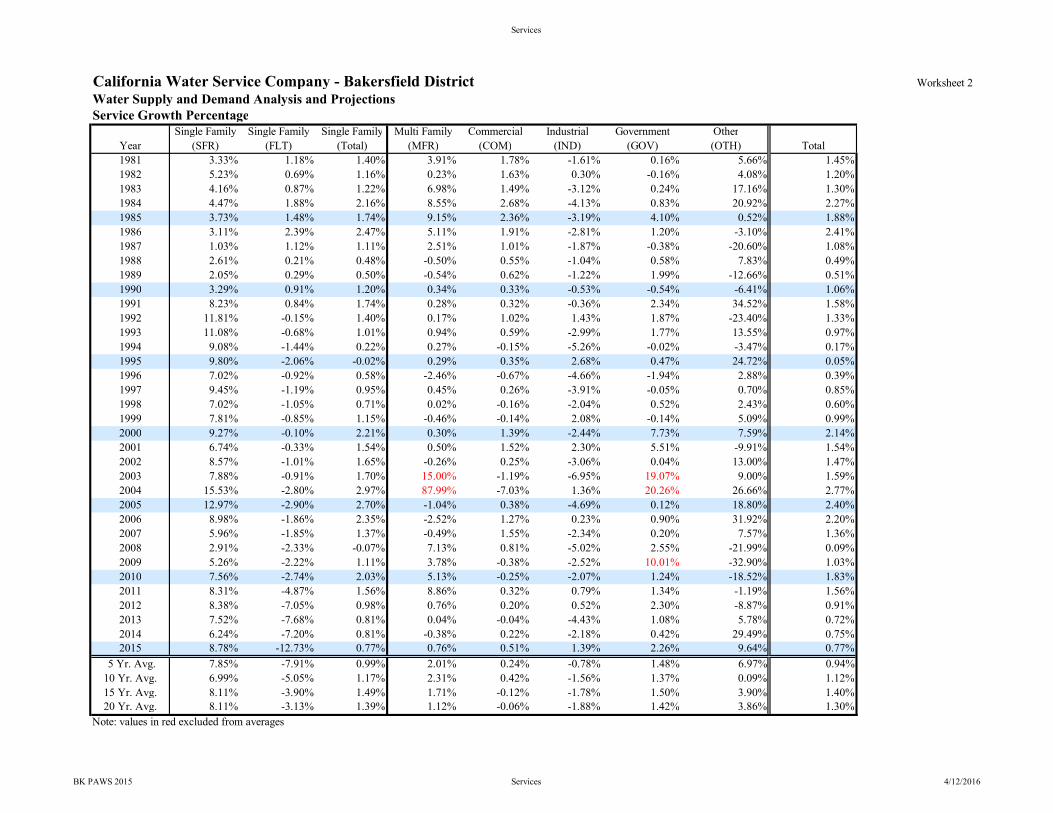
California Water Service Company - Bakersfield District Worksheet 2Water Supply and Demand Analysis and ProjectionsService Growth Percentage
Single Family Single Family Single Family Multi Family Commercial Industrial Government OtherYear (SFR) (FLT) (Total) (MFR) (COM) (IND) (GOV) (OTH) Total1981 3.33% 1.18% 1.40% 3.91% 1.78% -1.61% 0.16% 5.66% 1.45%1982 5.23% 0.69% 1.16% 0.23% 1.63% 0.30% -0.16% 4.08% 1.20%1983 4.16% 0.87% 1.22% 6.98% 1.49% -3.12% 0.24% 17.16% 1.30%1984 4.47% 1.88% 2.16% 8.55% 2.68% -4.13% 0.83% 20.92% 2.27%1985 3.73% 1.48% 1.74% 9.15% 2.36% -3.19% 4.10% 0.52% 1.88%1986 3.11% 2.39% 2.47% 5.11% 1.91% -2.81% 1.20% -3.10% 2.41%1987 1.03% 1.12% 1.11% 2.51% 1.01% -1.87% -0.38% -20.60% 1.08%1988 2.61% 0.21% 0.48% -0.50% 0.55% -1.04% 0.58% 7.83% 0.49%1989 2.05% 0.29% 0.50% -0.54% 0.62% -1.22% 1.99% -12.66% 0.51%1990 3.29% 0.91% 1.20% 0.34% 0.33% -0.53% -0.54% -6.41% 1.06%1991 8.23% 0.84% 1.74% 0.28% 0.32% -0.36% 2.34% 34.52% 1.58%1992 11.81% -0.15% 1.40% 0.17% 1.02% 1.43% 1.87% -23.40% 1.33%1993 11.08% -0.68% 1.01% 0.94% 0.59% -2.99% 1.77% 13.55% 0.97%1994 9.08% -1.44% 0.22% 0.27% -0.15% -5.26% -0.02% -3.47% 0.17%1995 9.80% -2.06% -0.02% 0.29% 0.35% 2.68% 0.47% 24.72% 0.05%1996 7.02% -0.92% 0.58% -2.46% -0.67% -4.66% -1.94% 2.88% 0.39%1997 9.45% -1.19% 0.95% 0.45% 0.26% -3.91% -0.05% 0.70% 0.85%1998 7.02% -1.05% 0.71% 0.02% -0.16% -2.04% 0.52% 2.43% 0.60%1999 7.81% -0.85% 1.15% -0.46% -0.14% 2.08% -0.14% 5.09% 0.99%2000 9.27% -0.10% 2.21% 0.30% 1.39% -2.44% 7.73% 7.59% 2.14%2001 6.74% -0.33% 1.54% 0.50% 1.52% 2.30% 5.51% -9.91% 1.54%2002 8.57% -1.01% 1.65% -0.26% 0.25% -3.06% 0.04% 13.00% 1.47%2003 7.88% -0.91% 1.70% 15.00% -1.19% -6.95% 19.07% 9.00% 1.59%2004 15.53% -2.80% 2.97% 87.99% -7.03% 1.36% 20.26% 26.66% 2.77%2005 12.97% -2.90% 2.70% -1.04% 0.38% -4.69% 0.12% 18.80% 2.40%2006 8.98% -1.86% 2.35% -2.52% 1.27% 0.23% 0.90% 31.92% 2.20%2007 5.96% -1.85% 1.37% -0.49% 1.55% -2.34% 0.20% 7.57% 1.36%2008 2.91% -2.33% -0.07% 7.13% 0.81% -5.02% 2.55% -21.99% 0.09%2009 5.26% -2.22% 1.11% 3.78% -0.38% -2.52% 10.01% -32.90% 1.03%2010 7.56% -2.74% 2.03% 5.13% -0.25% -2.07% 1.24% -18.52% 1.83%2011 8.31% -4.87% 1.56% 8.86% 0.32% 0.79% 1.34% -1.19% 1.56%2012 8.38% -7.05% 0.98% 0.76% 0.20% 0.52% 2.30% -8.87% 0.91%2013 7.52% -7.68% 0.81% 0.04% -0.04% -4.43% 1.08% 5.78% 0.72%2014 6.24% -7.20% 0.81% -0.38% 0.22% -2.18% 0.42% 29.49% 0.75%2015 8.78% -12.73% 0.77% 0.76% 0.51% 1.39% 2.26% 9.64% 0.77%
5 Yr. Avg. 7.85% -7.91% 0.99% 2.01% 0.24% -0.78% 1.48% 6.97% 0.94%10 Yr. Avg. 6.99% -5.05% 1.17% 2.31% 0.42% -1.56% 1.37% 0.09% 1.12%15 Yr. Avg. 8.11% -3.90% 1.49% 1.71% -0.12% -1.78% 1.50% 3.90% 1.40%20 Yr. Avg. 8.11% -3.13% 1.39% 1.12% -0.06% -1.88% 1.42% 3.86% 1.30%
Note: values in red excluded from averages
BK PAWS 2015 Services 4/12/2016

Services
PAGE LEFT BLANK INTENTIONALLY
BK PAWS 2015 Services 4/12/2016

Historical Sales Graph
BK PAWS 2015 Historical Sales Graph 4/12/2016
0
10,000
20,000
30,000
40,000
50,000
60,000
70,000
80,000
90,000
100,000
198019811982198319841985198619871988198919901991199219931994199519961997199819992000200120022003200420052006200720082009201020112012201320142015
Sale
s in
Acr
e-Fe
et
Year
Historical Sales
Single Family (mtr) Single Family (flat) Multi Family Commercial Industrial Government Other Unaccountedfor Water

Sales
California Water Service Company - Bakersfield District Worksheet 3Water Supply and Demand Analysis and ProjectionsSales (AF)
Multi Family Commercial Industrial Government OtherUnaccounted
for Water(SFR) (FLT) (Total) (MFR) (COM) (IND) (GOV) (OTH) (UAFW)
1980 2,977 30,701 33,679 1,695 8,386 730 2,624 147 4,110 47,261 51,371 16,7391981 3,248 32,059 35,307 1,803 9,255 596 2,727 193 4,337 49,880 54,218 17,6671982 3,117 30,480 33,597 1,755 8,807 525 2,535 72 4,112 47,290 51,403 16,7501983 3,245 30,691 33,937 1,859 9,291 470 2,728 176 4,214 48,461 52,674 17,1641984 3,898 36,373 40,271 2,165 10,261 474 3,255 162 4,921 56,588 61,509 20,0431985 3,750 35,005 38,756 2,427 10,385 484 3,219 105 4,815 55,377 60,192 19,6141986 3,847 35,353 39,200 2,552 10,733 462 3,265 178 4,903 56,389 61,292 19,9721987 3,778 34,241 38,019 2,601 10,782 446 3,340 59 4,804 55,247 60,052 19,5681988 4,001 34,851 38,852 2,792 10,751 437 3,402 149 4,903 56,384 61,287 19,9701989 4,097 35,469 39,566 2,861 10,820 430 3,611 118 4,992 57,405 62,396 20,3321990 4,208 34,857 39,066 2,893 10,897 381 3,682 174 4,965 57,093 62,057 20,2211991 4,079 33,313 37,392 2,770 10,597 340 2,973 277 4,726 54,349 59,075 19,2501992 4,595 39,327 43,921 2,849 10,723 313 3,178 136 5,315 61,121 66,436 21,6481993 5,144 40,651 45,795 2,738 10,610 228 3,284 94 5,457 62,750 68,206 22,2251994 5,720 42,614 48,334 2,822 11,084 179 3,535 119 5,745 66,071 71,817 23,4021995 6,169 40,197 46,366 2,720 11,139 190 3,113 103 5,533 63,631 69,164 22,5371996 7,107 41,198 48,305 2,853 12,263 211 3,643 111 5,860 67,386 73,246 23,8671997 7,914 40,563 48,477 2,853 12,323 192 3,658 118 5,880 67,621 73,501 23,9501998 7,346 32,705 40,051 2,834 11,503 183 3,159 104 5,029 57,834 62,863 20,4841999 8,976 38,342 47,318 2,953 12,386 167 3,489 129 5,778 66,442 72,220 23,5332000 10,144 39,226 49,370 3,162 13,027 71 3,949 178 6,066 69,756 75,822 24,7072001 10,643 37,814 48,457 2,978 13,084 57 3,914 192 5,972 68,682 74,655 24,3262002 11,863 38,637 50,500 3,036 13,565 60 4,223 362 6,239 71,747 77,986 25,4122003 12,177 40,020 52,197 3,296 13,046 52 4,647 357 6,400 73,594 79,994 26,0662004 13,888 37,191 51,078 4,213 12,031 55 5,014 500 6,338 72,890 79,229 25,8172005 14,571 34,266 48,837 3,726 11,765 77 5,007 818 6,107 70,231 76,338 24,8752006 16,466 40,936 57,402 3,625 12,197 72 5,151 953 6,904 79,399 86,304 28,1222007 18,084 34,743 52,827 3,494 12,896 85 5,854 616 6,589 75,773 82,362 26,8382008 17,906 34,622 52,527 3,673 13,195 66 5,927 344 6,585 75,732 82,317 26,8232009 17,769 34,927 52,696 3,718 12,823 53 5,534 152 6,520 74,977 81,497 26,5562010 17,334 32,598 49,932 3,520 11,932 45 5,444 131 6,174 71,004 77,178 25,1492011 18,726 28,811 47,537 3,757 12,014 56 5,599 95 6,005 69,058 75,063 24,4602012 21,767 30,079 51,846 3,919 12,389 56 6,725 134 6,528 75,069 81,597 26,5892013 23,050 23,753 46,803 3,874 12,404 51 6,674 144 6,083 69,950 76,033 24,7752014 23,161 20,024 43,185 3,734 12,327 51 6,135 356 5,721 65,786 71,507 23,3012015 19,508 13,179 32,688 3,368 10,104 57 4,216 196 4,403 50,630 55,033 17,932
Total Sales (AF)
Total Demand
(AF)
Total Demand (MGal)Year
Single Family
BK PAWS 2015 Sales 4/12/2016
DPS TOT
BK PAWS 2015 DPS TOT 4/12/2016
0
200
400
600
800
1,000
1,200
1,400
1980 1985 1990 1995 2000 2005 2010 2015
Dem
and
per
Serv
ice
(Gal
lons
/day
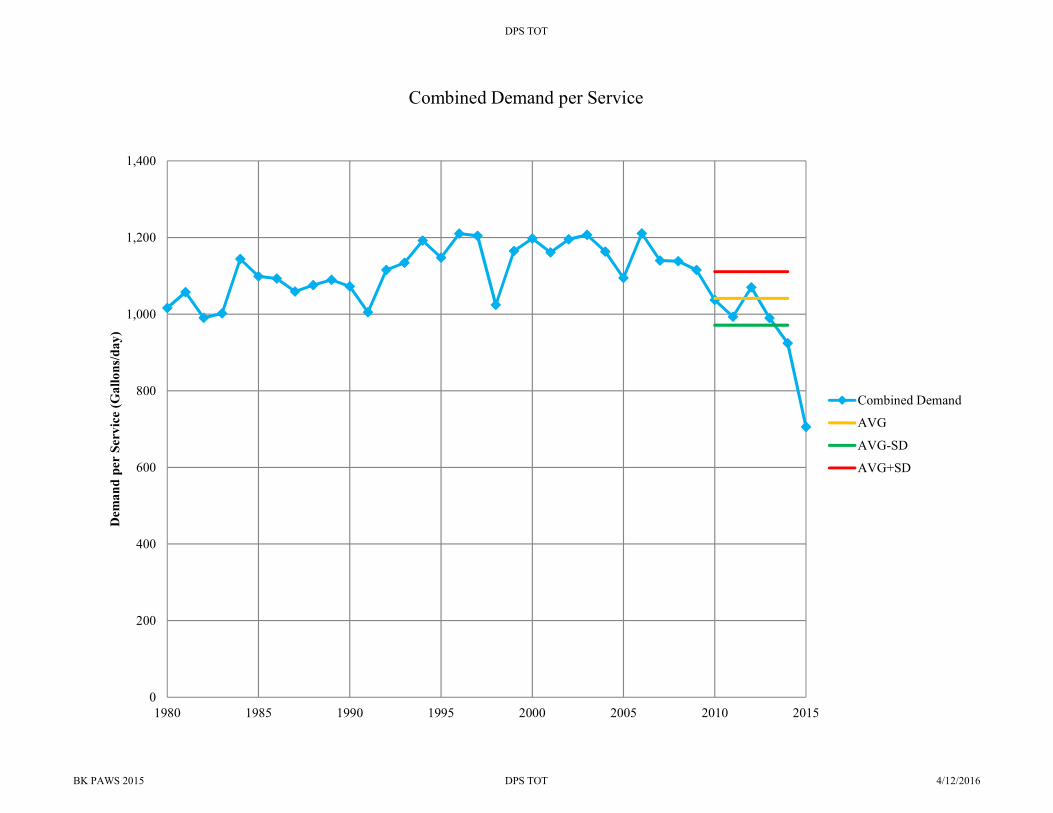
)Combined Demand per Service
Combined Demand
AVG
AVG-SD
AVG+SD
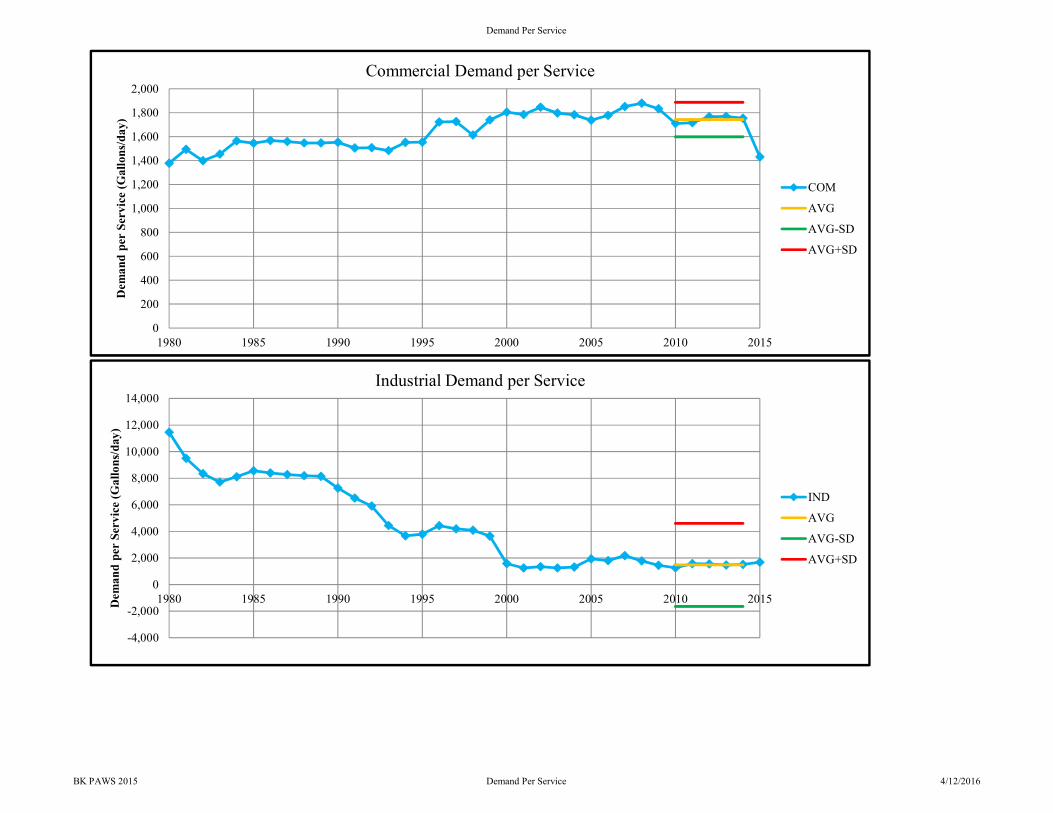
Demand Per Service
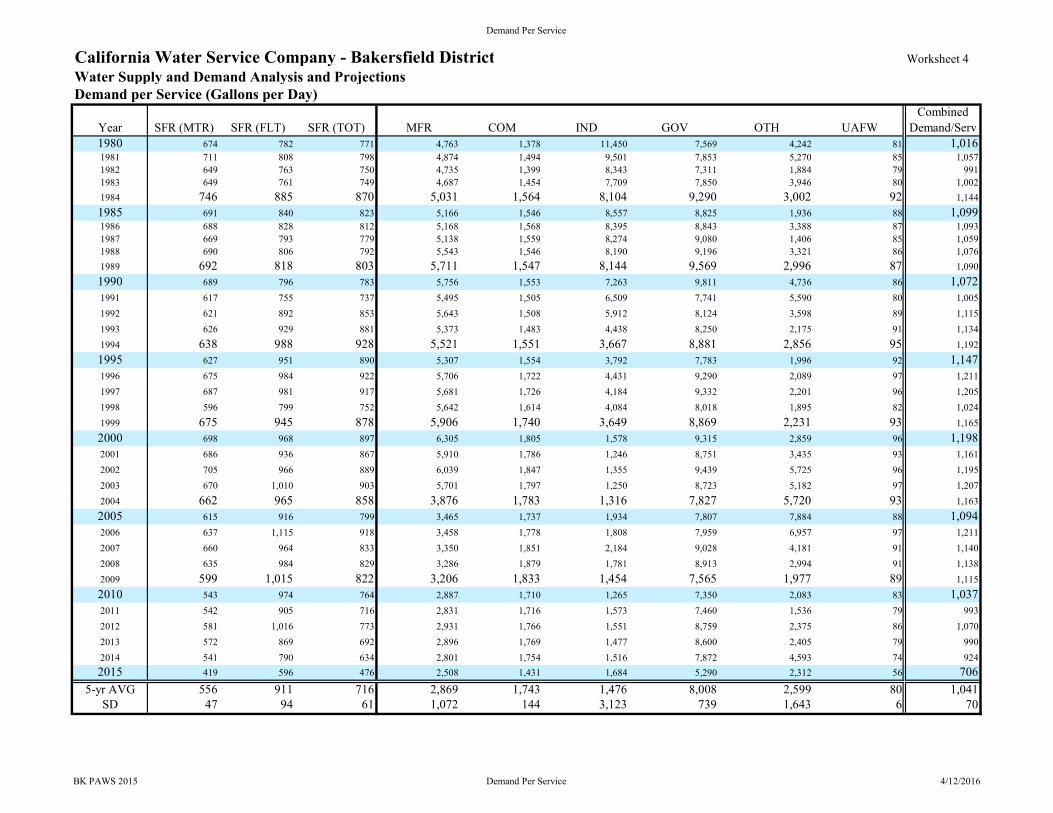
California Water Service Company - Bakersfield District Worksheet 4Water Supply and Demand Analysis and ProjectionsDemand per Service (Gallons per Day)
CombinedYear SFR (MTR) SFR (FLT) SFR (TOT) MFR COM IND GOV OTH UAFW Demand/Serv1980 674 782 771 4,763 1,378 11,450 7,569 4,242 81 1,0161981 711 808 798 4,874 1,494 9,501 7,853 5,270 85 1,0571982 649 763 750 4,735 1,399 8,343 7,311 1,884 79 9911983 649 761 749 4,687 1,454 7,709 7,850 3,946 80 1,0021984 746 885 870 5,031 1,564 8,104 9,290 3,002 92 1,1441985 691 840 823 5,166 1,546 8,557 8,825 1,936 88 1,0991986 688 828 812 5,168 1,568 8,395 8,843 3,388 87 1,0931987 669 793 779 5,138 1,559 8,274 9,080 1,406 85 1,0591988 690 806 792 5,543 1,546 8,190 9,196 3,321 86 1,0761989 692 818 803 5,711 1,547 8,144 9,569 2,996 87 1,0901990 689 796 783 5,756 1,553 7,263 9,811 4,736 86 1,0721991 617 755 737 5,495 1,505 6,509 7,741 5,590 80 1,0051992 621 892 853 5,643 1,508 5,912 8,124 3,598 89 1,1151993 626 929 881 5,373 1,483 4,438 8,250 2,175 91 1,1341994 638 988 928 5,521 1,551 3,667 8,881 2,856 95 1,1921995 627 951 890 5,307 1,554 3,792 7,783 1,996 92 1,1471996 675 984 922 5,706 1,722 4,431 9,290 2,089 97 1,2111997 687 981 917 5,681 1,726 4,184 9,332 2,201 96 1,2051998 596 799 752 5,642 1,614 4,084 8,018 1,895 82 1,0241999 675 945 878 5,906 1,740 3,649 8,869 2,231 93 1,1652000 698 968 897 6,305 1,805 1,578 9,315 2,859 96 1,1982001 686 936 867 5,910 1,786 1,246 8,751 3,435 93 1,1612002 705 966 889 6,039 1,847 1,355 9,439 5,725 96 1,1952003 670 1,010 903 5,701 1,797 1,250 8,723 5,182 97 1,2072004 662 965 858 3,876 1,783 1,316 7,827 5,720 93 1,1632005 615 916 799 3,465 1,737 1,934 7,807 7,884 88 1,0942006 637 1,115 918 3,458 1,778 1,808 7,959 6,957 97 1,2112007 660 964 833 3,350 1,851 2,184 9,028 4,181 91 1,1402008 635 984 829 3,286 1,879 1,781 8,913 2,994 91 1,1382009 599 1,015 822 3,206 1,833 1,454 7,565 1,977 89 1,1152010 543 974 764 2,887 1,710 1,265 7,350 2,083 83 1,0372011 542 905 716 2,831 1,716 1,573 7,460 1,536 79 9932012 581 1,016 773 2,931 1,766 1,551 8,759 2,375 86 1,0702013 572 869 692 2,896 1,769 1,477 8,600 2,405 79 9902014 541 790 634 2,801 1,754 1,516 7,872 4,593 74 9242015 419 596 476 2,508 1,431 1,684 5,290 2,312 56 706
5-yr AVG 556 911 716 2,869 1,743 1,476 8,008 2,599 80 1,041SD 47 94 61 1,072 144 3,123 739 1,643 6 70
BK PAWS 2015 Demand Per Service 4/12/2016
Demand Per Service
0
1,000
2,000
3,000
4,000
5,000
6,000
7,000
1980 1985 1990 1995 2000 2005 2010 2015
Dem
and
per
Serv
ice
(Gal
lons
/day
)
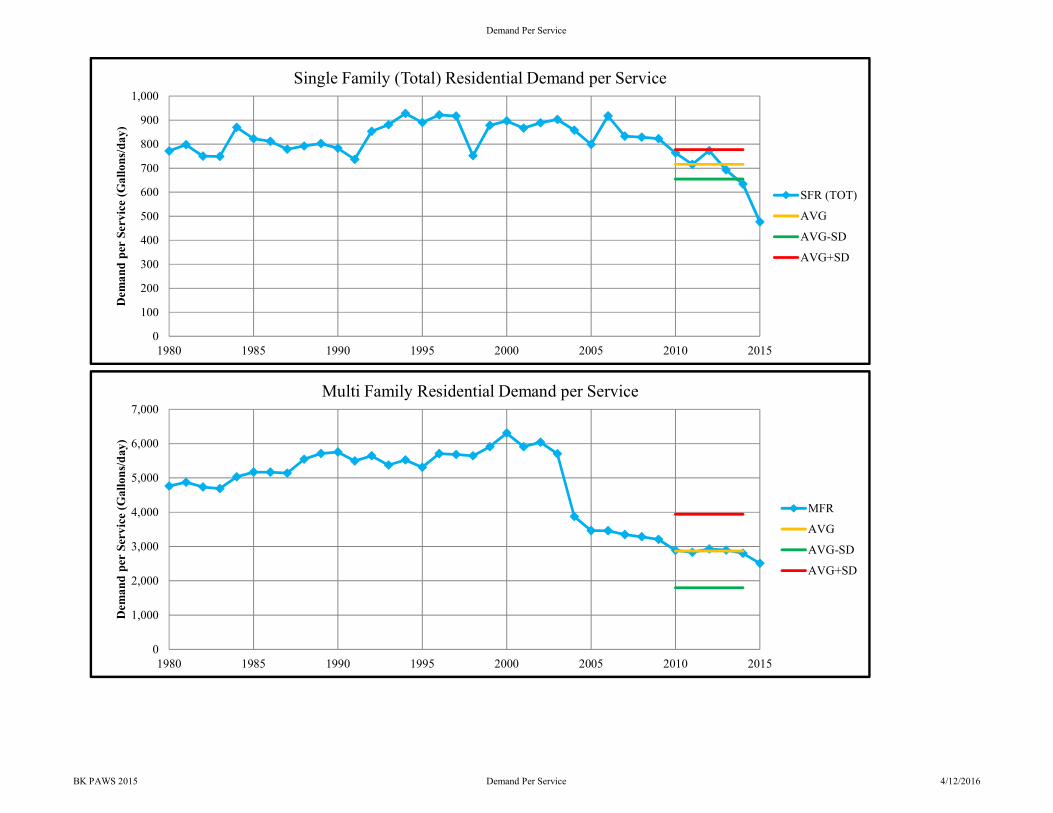
Multi Family Residential Demand per Service
MFR
AVG
AVG-SD
AVG+SD
0
100
200
300
400
500
600
700
800
900
1,000
1980 1985 1990 1995 2000 2005 2010 2015
Dem
and
per
Serv
ice
(Gal
lons
/day
)
Single Family (Total) Residential Demand per Service
SFR (TOT)
AVG
AVG-SD
AVG+SD
BK PAWS 2015 Demand Per Service 4/12/2016
Demand Per Service
-4,000
-2,000
0
2,000
4,000
6,000
8,000
10,000
12,000
14,000
1980 1985 1990 1995 2000 2005 2010 2015Dem
and
per
Serv
ice
(Gal
lons
/day
)
Industrial Demand per Service
IND
AVG
AVG-SD
AVG+SD
0
200
400
600
800
1,000
1,200
1,400
1,600
1,800
2,000
1980 1985 1990 1995 2000 2005 2010 2015
Dem
and
per
Serv
ice
(Gal
lons
/day
)
Commercial Demand per Service
COM
AVG
AVG-SD
AVG+SD
BK PAWS 2015 Demand Per Service 4/12/2016

Demand Per Service
0
2,000
4,000
6,000
8,000
10,000
12,000
1980 1985 1990 1995 2000 2005 2010 2015
Dem
and
per
Serv
ice
(Gal
lons
/day
)
Government Demand per Service
GOV
AVG
AVG-SD
AVG+SD
0
1,000
2,000
3,000
4,000
5,000
6,000
7,000
8,000
9,000
1980 1985 1990 1995 2000 2005 2010 2015
Dem
and
per
Serv
ice
(Gal
lons
/day
)
Other Demand per Service
OTH
AVG
AVG-SD
AVG+SD
BK PAWS 2015 Demand Per Service 4/12/2016

Demand Per Service
0
20
40
60
80
100
120
1980 1985 1990 1995 2000 2005 2010 2015
Dem
and
per
Serv
ice
(Gal
lons
/day
)
Un-accounted for Water Demand per Service
UAFW
AVG
AVG-SD
AVG+SD
BK PAWS 2015 Demand Per Service 4/12/2016
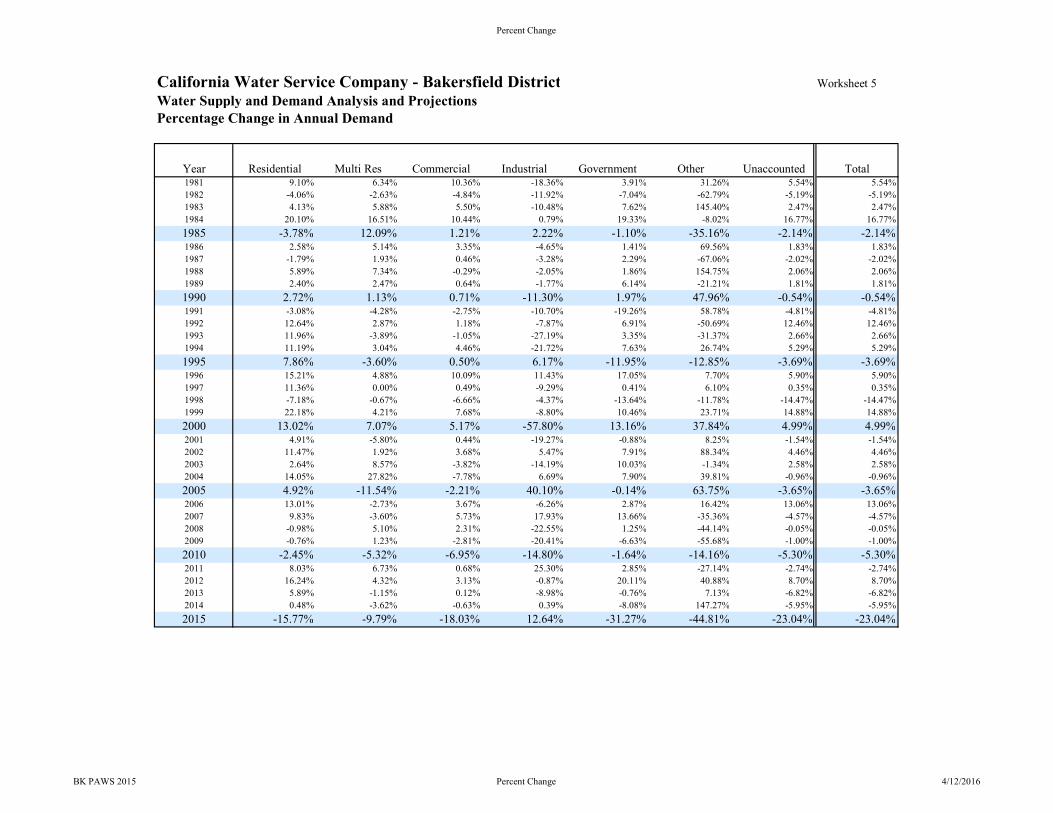
Percent Change
California Water Service Company - Bakersfield District Worksheet 5Water Supply and Demand Analysis and ProjectionsPercentage Change in Annual Demand
Year Residential Multi Res Commercial Industrial Government Other Unaccounted Total1981 9.10% 6.34% 10.36% -18.36% 3.91% 31.26% 5.54% 5.54%1982 -4.06% -2.63% -4.84% -11.92% -7.04% -62.79% -5.19% -5.19%1983 4.13% 5.88% 5.50% -10.48% 7.62% 145.40% 2.47% 2.47%1984 20.10% 16.51% 10.44% 0.79% 19.33% -8.02% 16.77% 16.77%1985 -3.78% 12.09% 1.21% 2.22% -1.10% -35.16% -2.14% -2.14%1986 2.58% 5.14% 3.35% -4.65% 1.41% 69.56% 1.83% 1.83%1987 -1.79% 1.93% 0.46% -3.28% 2.29% -67.06% -2.02% -2.02%1988 5.89% 7.34% -0.29% -2.05% 1.86% 154.75% 2.06% 2.06%1989 2.40% 2.47% 0.64% -1.77% 6.14% -21.21% 1.81% 1.81%1990 2.72% 1.13% 0.71% -11.30% 1.97% 47.96% -0.54% -0.54%1991 -3.08% -4.28% -2.75% -10.70% -19.26% 58.78% -4.81% -4.81%1992 12.64% 2.87% 1.18% -7.87% 6.91% -50.69% 12.46% 12.46%1993 11.96% -3.89% -1.05% -27.19% 3.35% -31.37% 2.66% 2.66%1994 11.19% 3.04% 4.46% -21.72% 7.63% 26.74% 5.29% 5.29%1995 7.86% -3.60% 0.50% 6.17% -11.95% -12.85% -3.69% -3.69%1996 15.21% 4.88% 10.09% 11.43% 17.05% 7.70% 5.90% 5.90%1997 11.36% 0.00% 0.49% -9.29% 0.41% 6.10% 0.35% 0.35%1998 -7.18% -0.67% -6.66% -4.37% -13.64% -11.78% -14.47% -14.47%1999 22.18% 4.21% 7.68% -8.80% 10.46% 23.71% 14.88% 14.88%2000 13.02% 7.07% 5.17% -57.80% 13.16% 37.84% 4.99% 4.99%2001 4.91% -5.80% 0.44% -19.27% -0.88% 8.25% -1.54% -1.54%2002 11.47% 1.92% 3.68% 5.47% 7.91% 88.34% 4.46% 4.46%2003 2.64% 8.57% -3.82% -14.19% 10.03% -1.34% 2.58% 2.58%2004 14.05% 27.82% -7.78% 6.69% 7.90% 39.81% -0.96% -0.96%2005 4.92% -11.54% -2.21% 40.10% -0.14% 63.75% -3.65% -3.65%2006 13.01% -2.73% 3.67% -6.26% 2.87% 16.42% 13.06% 13.06%2007 9.83% -3.60% 5.73% 17.93% 13.66% -35.36% -4.57% -4.57%2008 -0.98% 5.10% 2.31% -22.55% 1.25% -44.14% -0.05% -0.05%2009 -0.76% 1.23% -2.81% -20.41% -6.63% -55.68% -1.00% -1.00%2010 -2.45% -5.32% -6.95% -14.80% -1.64% -14.16% -5.30% -5.30%2011 8.03% 6.73% 0.68% 25.30% 2.85% -27.14% -2.74% -2.74%2012 16.24% 4.32% 3.13% -0.87% 20.11% 40.88% 8.70% 8.70%2013 5.89% -1.15% 0.12% -8.98% -0.76% 7.13% -6.82% -6.82%2014 0.48% -3.62% -0.63% 0.39% -8.08% 147.27% -5.95% -5.95%2015 -15.77% -9.79% -18.03% 12.64% -31.27% -44.81% -23.04% -23.04%
BK PAWS 2015 Percent Change 4/12/2016

Percent Change
PAGE LEFT BLANK INTENTIONALLY
BK PAWS 2015 Percent Change 4/12/2016

Percent Total
Residential64.6%
Multi Res6.7%
Commercial20.0%
Industrial0.1%
Government8.3%
Other0.4%
Percent of Total Sales by Type of Use(2015)
BK PAWS 2015 Percent Total 4/12/2016
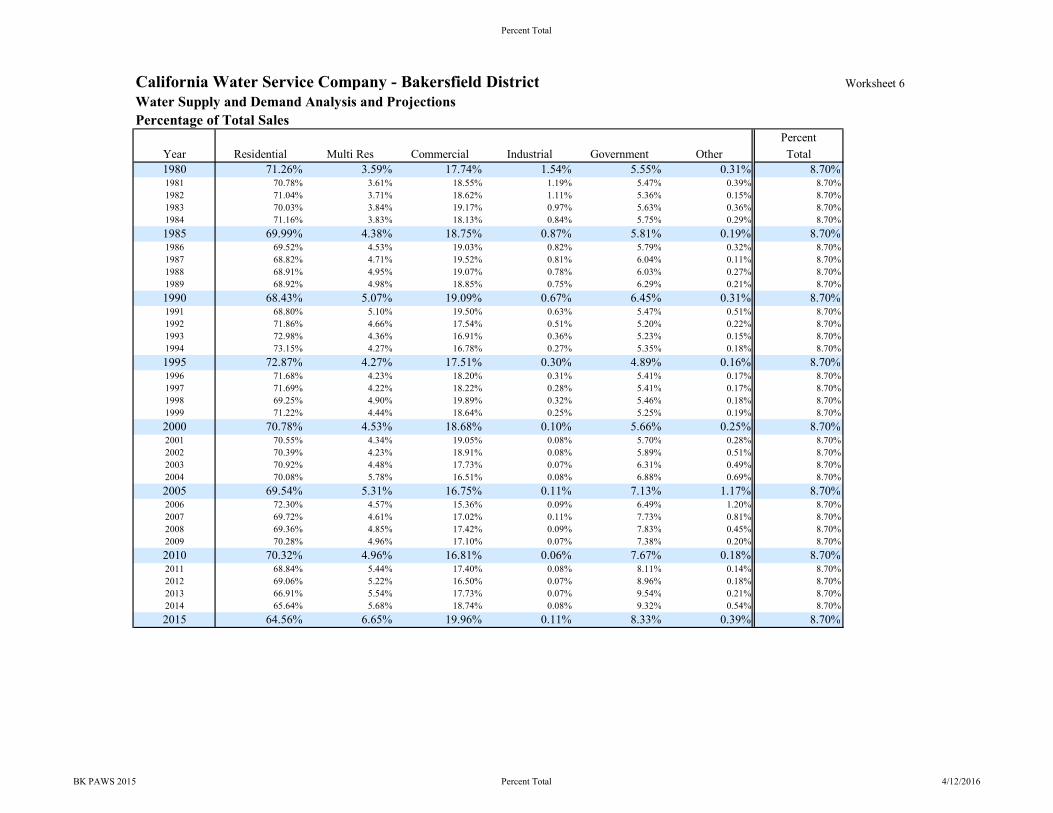
Percent Total
California Water Service Company - Bakersfield District Worksheet 6Water Supply and Demand Analysis and ProjectionsPercentage of Total Sales
PercentYear Residential Multi Res Commercial Industrial Government Other Total1980 71.26% 3.59% 17.74% 1.54% 5.55% 0.31% 8.70%1981 70.78% 3.61% 18.55% 1.19% 5.47% 0.39% 8.70%1982 71.04% 3.71% 18.62% 1.11% 5.36% 0.15% 8.70%1983 70.03% 3.84% 19.17% 0.97% 5.63% 0.36% 8.70%1984 71.16% 3.83% 18.13% 0.84% 5.75% 0.29% 8.70%1985 69.99% 4.38% 18.75% 0.87% 5.81% 0.19% 8.70%1986 69.52% 4.53% 19.03% 0.82% 5.79% 0.32% 8.70%1987 68.82% 4.71% 19.52% 0.81% 6.04% 0.11% 8.70%1988 68.91% 4.95% 19.07% 0.78% 6.03% 0.27% 8.70%1989 68.92% 4.98% 18.85% 0.75% 6.29% 0.21% 8.70%1990 68.43% 5.07% 19.09% 0.67% 6.45% 0.31% 8.70%1991 68.80% 5.10% 19.50% 0.63% 5.47% 0.51% 8.70%1992 71.86% 4.66% 17.54% 0.51% 5.20% 0.22% 8.70%1993 72.98% 4.36% 16.91% 0.36% 5.23% 0.15% 8.70%1994 73.15% 4.27% 16.78% 0.27% 5.35% 0.18% 8.70%1995 72.87% 4.27% 17.51% 0.30% 4.89% 0.16% 8.70%1996 71.68% 4.23% 18.20% 0.31% 5.41% 0.17% 8.70%1997 71.69% 4.22% 18.22% 0.28% 5.41% 0.17% 8.70%1998 69.25% 4.90% 19.89% 0.32% 5.46% 0.18% 8.70%1999 71.22% 4.44% 18.64% 0.25% 5.25% 0.19% 8.70%2000 70.78% 4.53% 18.68% 0.10% 5.66% 0.25% 8.70%2001 70.55% 4.34% 19.05% 0.08% 5.70% 0.28% 8.70%2002 70.39% 4.23% 18.91% 0.08% 5.89% 0.51% 8.70%2003 70.92% 4.48% 17.73% 0.07% 6.31% 0.49% 8.70%2004 70.08% 5.78% 16.51% 0.08% 6.88% 0.69% 8.70%2005 69.54% 5.31% 16.75% 0.11% 7.13% 1.17% 8.70%2006 72.30% 4.57% 15.36% 0.09% 6.49% 1.20% 8.70%2007 69.72% 4.61% 17.02% 0.11% 7.73% 0.81% 8.70%2008 69.36% 4.85% 17.42% 0.09% 7.83% 0.45% 8.70%2009 70.28% 4.96% 17.10% 0.07% 7.38% 0.20% 8.70%2010 70.32% 4.96% 16.81% 0.06% 7.67% 0.18% 8.70%2011 68.84% 5.44% 17.40% 0.08% 8.11% 0.14% 8.70%2012 69.06% 5.22% 16.50% 0.07% 8.96% 0.18% 8.70%2013 66.91% 5.54% 17.73% 0.07% 9.54% 0.21% 8.70%2014 65.64% 5.68% 18.74% 0.08% 9.32% 0.54% 8.70%2015 64.56% 6.65% 19.96% 0.11% 8.33% 0.39% 8.70%
BK PAWS 2015 Percent Total 4/12/2016

Percent Total
Residential59.4%
Multi Res6.1% Commercial
18.4%
Industrial0.1%
Government7.7%
Other0.4%Unaccounted
8.0%
Percent of Total Demand by Type of Use(2015)
BK PAWS 2015 Percent Total 4/12/2016

Percent Total
California Water Service Company - Bakersfield District Worksheet 7Water Supply and Demand Analysis and ProjectionsPercentage of Total Demand
PercentYear Residential Multi Res Commercial Industrial Government Other Unaccounted Total1980 65.56% 3.30% 16.33% 1.42% 5.11% 0.29% 8.00% 100.00%1981 65.12% 3.32% 17.07% 1.10% 5.03% 0.36% 8.00% 100.00%1982 65.36% 3.41% 17.13% 1.02% 4.93% 0.14% 8.00% 100.00%1983 64.43% 3.53% 17.64% 0.89% 5.18% 0.33% 8.00% 100.00%1984 65.47% 3.52% 16.68% 0.77% 5.29% 0.26% 8.00% 100.00%1985 64.39% 4.03% 17.25% 0.80% 5.35% 0.17% 8.00% 100.00%1986 63.96% 4.16% 17.51% 0.75% 5.33% 0.29% 8.00% 100.00%1987 63.31% 4.33% 17.96% 0.74% 5.56% 0.10% 8.00% 100.00%1988 63.39% 4.56% 17.54% 0.71% 5.55% 0.24% 8.00% 100.00%1989 63.41% 4.59% 17.34% 0.69% 5.79% 0.19% 8.00% 100.00%1990 62.95% 4.66% 17.56% 0.61% 5.93% 0.28% 8.00% 100.00%1991 63.30% 4.69% 17.94% 0.58% 5.03% 0.47% 8.00% 100.00%1992 66.11% 4.29% 16.14% 0.47% 4.78% 0.21% 8.00% 100.00%1993 67.14% 4.01% 15.56% 0.33% 4.82% 0.14% 8.00% 100.00%1994 67.30% 3.93% 15.43% 0.25% 4.92% 0.17% 8.00% 100.00%1995 67.04% 3.93% 16.11% 0.27% 4.50% 0.15% 8.00% 100.00%1996 65.95% 3.89% 16.74% 0.29% 4.97% 0.15% 8.00% 100.00%1997 65.95% 3.88% 16.77% 0.26% 4.98% 0.16% 8.00% 100.00%1998 63.71% 4.51% 18.30% 0.29% 5.03% 0.17% 8.00% 100.00%1999 65.52% 4.09% 17.15% 0.23% 4.83% 0.18% 8.00% 100.00%2000 65.11% 4.17% 17.18% 0.09% 5.21% 0.23% 8.00% 100.00%2001 64.91% 3.99% 17.53% 0.08% 5.24% 0.26% 8.00% 100.00%2002 64.76% 3.89% 17.39% 0.08% 5.42% 0.46% 8.00% 100.00%2003 65.25% 4.12% 16.31% 0.06% 5.81% 0.45% 8.00% 100.00%2004 64.47% 5.32% 15.18% 0.07% 6.33% 0.63% 8.00% 100.00%2005 63.97% 4.88% 15.41% 0.10% 6.56% 1.07% 8.00% 100.00%2006 66.51% 4.20% 14.13% 0.08% 5.97% 1.10% 8.00% 100.00%2007 64.14% 4.24% 15.66% 0.10% 7.11% 0.75% 8.00% 100.00%2008 63.81% 4.46% 16.03% 0.08% 7.20% 0.42% 8.00% 100.00%2009 64.66% 4.56% 15.73% 0.06% 6.79% 0.19% 8.00% 100.00%2010 64.70% 4.56% 15.46% 0.06% 7.05% 0.17% 8.00% 100.00%2011 63.33% 5.01% 16.01% 0.07% 7.46% 0.13% 8.00% 100.00%2012 63.54% 4.80% 15.18% 0.07% 8.24% 0.16% 8.00% 100.00%2013 61.56% 5.10% 16.31% 0.07% 8.78% 0.19% 8.00% 100.00%2014 60.39% 5.22% 17.24% 0.07% 8.58% 0.50% 8.00% 100.00%2015 59.40% 6.12% 18.36% 0.10% 7.66% 0.36% 8.00% 100.00%
BK PAWS 2015 Percent Total 4/12/2016

TOT Cht
BK PAWS 2015 TOT Cht 4/12/2016
0
20,000
40,000
60,000
80,000
100,000
120,000
140,000
1980 1985 1990 1995 2000 2005 2010 2015 2020 2025 2030 2035 2040
Serv
ices
Historical & Projected Services
Annual Services
Projection
2010 UWMP Selected
Water Supply and Facility Master Plan (High Growth)

Serv Proj
California Water Service Company - Bakersfield District Worksheet 8Water Supply and Demand Analysis and Projections
CustomerCategory Base Year
2000 2005 2010 2015 2015 2020 2025 2030 2035 2040
SFR SFR_B 5 Yr. Avg. 0.99% 49,160 54,563 58,357 61,294 61,294 64,376 67,613 71,013 74,583 78,334
MFR MFR_E 20 Yr. Avg. 1.12% 448 960 1,089 1,199 1,199 1,267 1,340 1,416 1,497 1,583
COM COM_C 10 Yr. Avg. 0.42% 6,443 6,047 6,229 6,305 6,305 6,439 6,575 6,715 6,858 7,003
IND IND_A Zero Growth Rate 0.00% 40 36 32 30 30 30 30 30 30 30
GOV GOV_B 5 Yr. Avg. 1.48% 378 573 661 712 712 766 824 887 955 1,027
OTH OTH_A Zero Growth Rate 0.00% 56 93 56 76 76 76 76 76 76 76
TOTAL Average growth rate 2012-2040 0.94% 56,525 62,271 66,424 69,616 69,616 72,954 76,459 80,137 83,999 88,053
Actual Services Projected ServicesSelected Trend Growth
Rate
BK PAWS 2015 Serv Proj 4/12/2016
Serv Proj
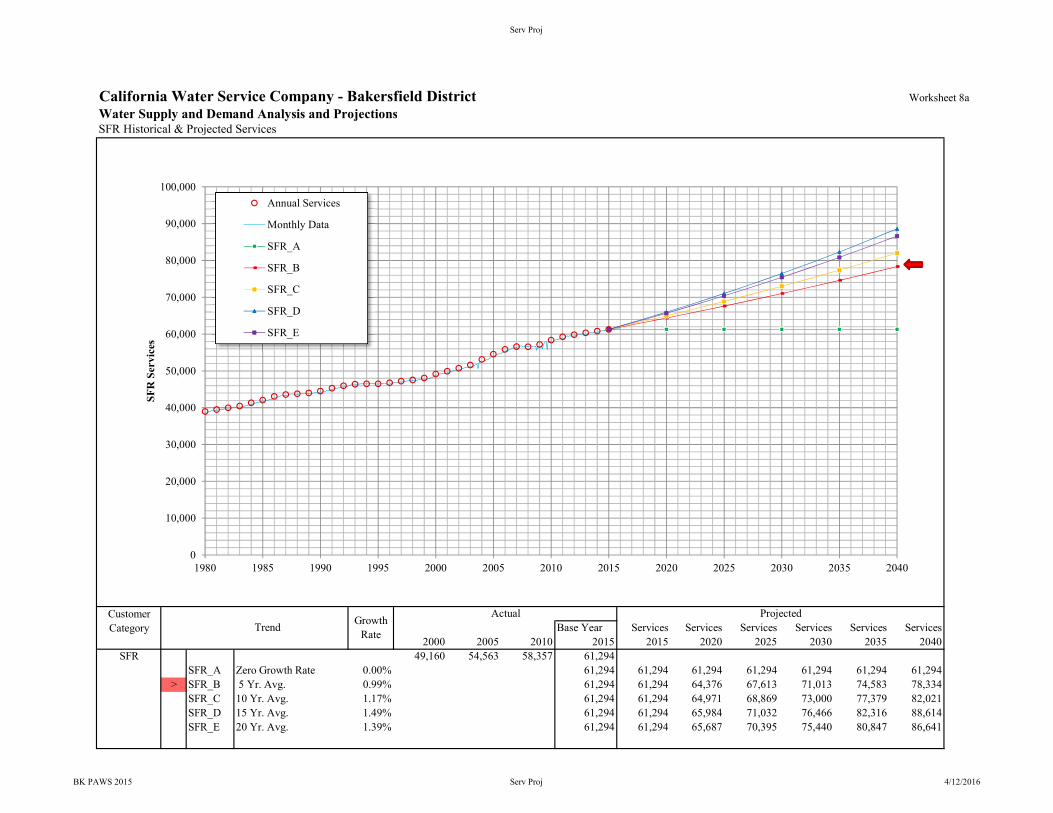
California Water Service Company - Bakersfield District Worksheet 8aWater Supply and Demand Analysis and ProjectionsSFR Historical & Projected Services
CustomerCategory Base Year Services Services Services Services Services Services
2000 2005 2010 2015 2015 2020 2025 2030 2035 2040SFR 49,160 54,563 58,357 61,294
SFR_A Zero Growth Rate 0.00% 61,294 61,294 61,294 61,294 61,294 61,294 61,294> SFR_B 5 Yr. Avg. 0.99% 61,294 61,294 64,376 67,613 71,013 74,583 78,334
SFR_C 10 Yr. Avg. 1.17% 61,294 61,294 64,971 68,869 73,000 77,379 82,021SFR_D 15 Yr. Avg. 1.49% 61,294 61,294 65,984 71,032 76,466 82,316 88,614SFR_E 20 Yr. Avg. 1.39% 61,294 61,294 65,687 70,395 75,440 80,847 86,641
Trend Growth Rate
Actual Projected
0
10,000
20,000
30,000
40,000
50,000
60,000
70,000
80,000
90,000
100,000
1980 1985 1990 1995 2000 2005 2010 2015 2020 2025 2030 2035 2040
SFR
Ser
vice
s
Annual Services
Monthly Data
SFR_A
SFR_B
SFR_C
SFR_D
SFR_E
BK PAWS 2015 Serv Proj 4/12/2016

Serv Proj
California Water Service Company - Bakersfield District Worksheet 8bWater Supply and Demand Analysis and ProjectionsMFR Historical & Projected Services
CustomerCategory Base Year Services Services Services Services Services Services
2000 2005 2010 2015 2015 2020 2025 2030 2035 2040MFR 448 960 1,089 1,199
MFR_A Zero Growth Rate 0.00% 1,199 1,199 1,199 1,199 1,199 1,199 1,199MFR_B 5 Yr. Avg. 2.01% 1,199 1,199 1,324 1,463 1,615 1,784 1,971MFR_C 10 Yr. Avg. 2.31% 1,199 1,199 1,344 1,506 1,688 1,892 2,120MFR_D 15 Yr. Avg. 1.71% 1,199 1,199 1,305 1,421 1,547 1,684 1,833
> MFR_E 20 Yr. Avg. 1.12% 1,199 1,199 1,267 1,340 1,416 1,497 1,583
Trend Growth Rate
Actual Projected
0
200
400
600
800
1,000
1,200
1,400
1,600
1,800
2,000
1980 1985 1990 1995 2000 2005 2010 2015 2020 2025 2030 2035 2040
MFR
Ser
vice
sAnnual Data
Monthly Data
MFR_A
MFR_B
MFR_C
MFR_D
MFR_E
BK PAWS 2015 Serv Proj 4/12/2016

Serv Proj
California Water Service Company - Bakersfield District Worksheet 8cWater Supply and Demand Analysis and ProjectionsCOM Historical & Projected Services
CustomerCategory Base Year Services Services Services Services Services Services
2000 2005 2010 2015 2015 2020 2025 2030 2035 2040COM 6,443 6,047 6,229 6,305
COM_A Zero Growth Rate 0.00% 6,305 6,305 6,305 6,305 6,305 6,305 6,305COM_B 5 Yr. Avg. 0.24% 6,305 6,305 6,382 6,459 6,538 6,617 6,698
> COM_C 10 Yr. Avg. 0.42% 6,305 6,305 6,439 6,575 6,715 6,858 7,003COM_D 15 Yr. Avg. -0.12% 6,305 6,305 6,266 6,227 6,189 6,150 6,112COM_E 20 Yr. Avg. -0.06% 6,305 6,305 6,286 6,268 6,249 6,231 6,213
Trend Growth Rate
Actual Projected
1,200
2,200
3,200
4,200
5,200
6,200
7,200
8,200
1980 1985 1990 1995 2000 2005 2010 2015 2020 2025 2030 2035 2040
CO
M S
ervi
ces
Annual Services
Monthly Data
COM_A
COM_B
COM_C
COM_D
COM_E
BK PAWS 2015 Serv Proj 4/12/2016
Serv Proj
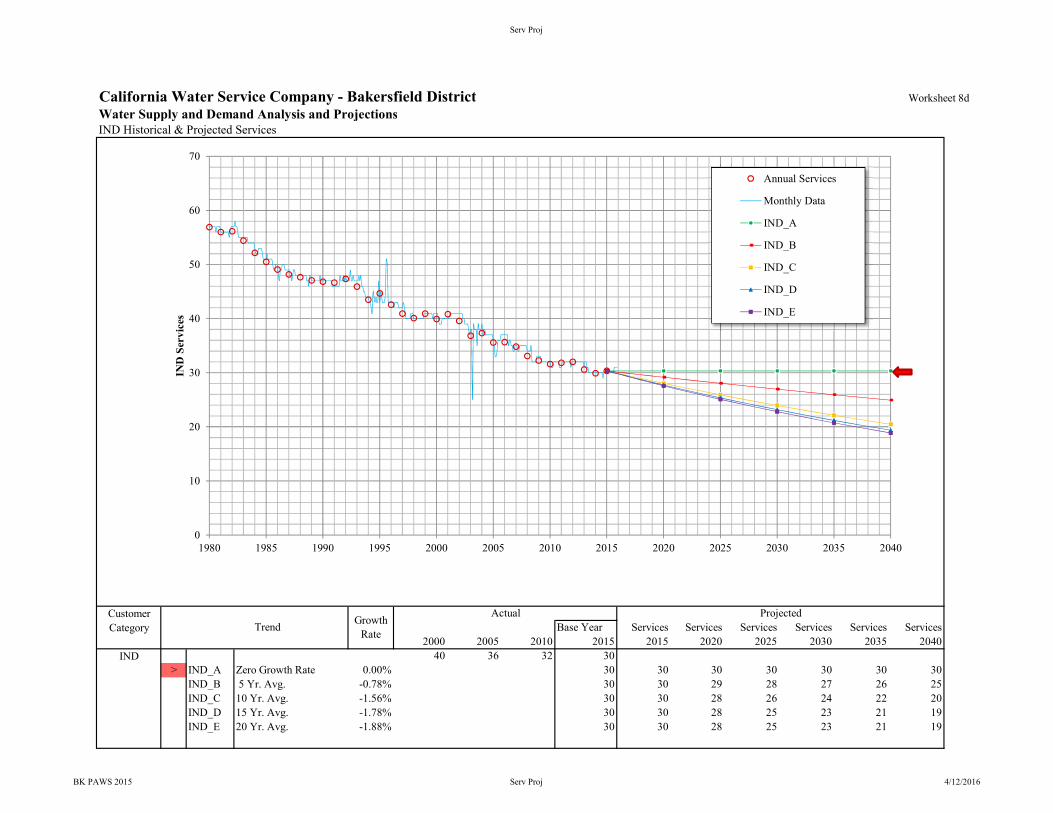
California Water Service Company - Bakersfield District Worksheet 8dWater Supply and Demand Analysis and ProjectionsIND Historical & Projected Services
CustomerCategory Base Year Services Services Services Services Services Services
2000 2005 2010 2015 2015 2020 2025 2030 2035 2040IND 40 36 32 30
> IND_A Zero Growth Rate 0.00% 30 30 30 30 30 30 30IND_B 5 Yr. Avg. -0.78% 30 30 29 28 27 26 25IND_C 10 Yr. Avg. -1.56% 30 30 28 26 24 22 20IND_D 15 Yr. Avg. -1.78% 30 30 28 25 23 21 19IND_E 20 Yr. Avg. -1.88% 30 30 28 25 23 21 19
Trend Growth Rate
Actual Projected
0
10
20
30
40
50
60
70
1980 1985 1990 1995 2000 2005 2010 2015 2020 2025 2030 2035 2040
IND
Ser
vice
sAnnual Services
Monthly Data
IND_A
IND_B
IND_C
IND_D
IND_E
BK PAWS 2015 Serv Proj 4/12/2016

Serv Proj
California Water Service Company - Bakersfield District Worksheet 8eWater Supply and Demand Analysis and ProjectionsGOV Historical & Projected Services
CustomerCategory Base Year Services Services Services Services Services Services
2000 2005 2010 2015 2015 2020 2025 2030 2035 2040GOV 378 573 661 712
GOV_A Zero Growth Rate 0.00% 712 712 712 712 712 712 712> GOV_B 5 Yr. Avg. 1.48% 712 712 766 824 887 955 1,027
GOV_C 10 Yr. Avg. 1.37% 712 712 761 815 872 933 999GOV_D 15 Yr. Avg. 1.50% 712 712 766 825 889 958 1,032GOV_E 20 Yr. Avg. 1.42% 712 712 763 819 879 943 1,011
Trend Growth Rate
Actual Projected
0
200
400
600
800
1,000
1,200
1980 1985 1990 1995 2000 2005 2010 2015 2020 2025 2030 2035 2040
GO
V S
ervi
ces
Annual Services
Monthly Data
GOV_A
GOV_B
GOV_C
GOV_D
GOV_E
BK PAWS 2015 Serv Proj 4/12/2016
Serv Proj
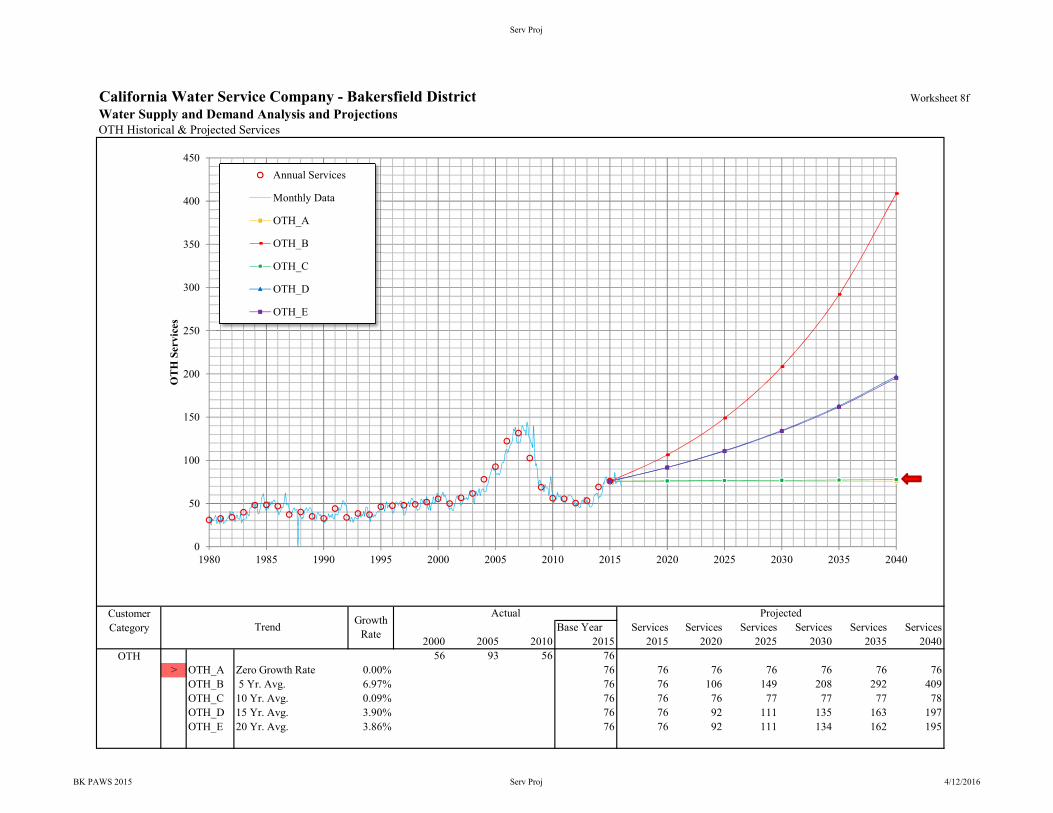
California Water Service Company - Bakersfield District Worksheet 8fWater Supply and Demand Analysis and ProjectionsOTH Historical & Projected Services
CustomerCategory Base Year Services Services Services Services Services Services
2000 2005 2010 2015 2015 2020 2025 2030 2035 2040OTH 56 93 56 76
> OTH_A Zero Growth Rate 0.00% 76 76 76 76 76 76 76OTH_B 5 Yr. Avg. 6.97% 76 76 106 149 208 292 409OTH_C 10 Yr. Avg. 0.09% 76 76 76 77 77 77 78OTH_D 15 Yr. Avg. 3.90% 76 76 92 111 135 163 197OTH_E 20 Yr. Avg. 3.86% 76 76 92 111 134 162 195
Trend Growth Rate
Actual Projected
0
50
100
150
200
250
300
350
400
450
1980 1985 1990 1995 2000 2005 2010 2015 2020 2025 2030 2035 2040
OTH
Ser
vice
sAnnual Services
Monthly Data
OTH_A
OTH_B
OTH_C
OTH_D
OTH_E
BK PAWS 2015 Serv Proj 4/12/2016

Projected Demand Graph
BK PAWS 2015 Projected Demand Graph 4/12/2016
0
20,000
40,000
60,000
80,000
100,000
120,000
140,000
160,000
1980 1985 1990 1995 2000 2005 2010 2015 2020 2025 2030 2035 2040
Hist
oric
al &
Pro
ject
ed D
eman
d (A
cre-
Feet
)
Year
Historical & Projected Demand (BK)
Historical Demand
AVG+SD
AVG
Avg Demand w/Cons

Demand Proj
California Water Service Company - Bakersfield District Worksheet 9Water Supply and Demand Analysis and Projections
CustomerCategory
1980 1985 1990 1995 2000 2005 2010 2015 2015 2020 2025 2030 2035 2040
53,363 56,046 58,864 61,824 64,933 68,198SFR 33,679 38,756 39,066 46,366 49,370 48,837 49,932 32,688 49,153 51,624 54,220 56,946 59,809 62,817
44,942 47,202 49,575 52,068 54,686 57,436
5,292 5,595 5,914 6,252 6,610 6,988MFR 1,695 2,427 2,893 2,720 3,162 3,726 3,520 3,368 3,853 4,073 4,306 4,552 4,812 5,087
2,414 2,552 2,698 2,852 3,015 3,187
13,329 13,612 13,901 14,196 14,497 14,805COM 8,386 10,385 10,897 11,139 13,027 11,765 11,932 10,104 12,311 12,572 12,839 13,112 13,390 13,674
11,293 11,533 11,778 12,028 12,283 12,544
156 156 156 156 156 156IND 730 484 381 190 71 77 45 57 50 50 50 50 50 50
0 0 0 0 0 0
6,971 7,502 8,074 8,690 9,352 10,065GOV 2,624 3,219 3,682 3,113 3,949 5,007 5,444 4,216 6,382 6,869 7,392 7,956 8,562 9,215
5,794 6,235 6,711 7,222 7,773 8,365
360 360 360 360 360 360OTH 147 105 174 103 178 818 131 196 221 221 221 221 221 221
81 81 81 81 81 81
6,693 7,014 7,350 7,704 8,075 8,465UAWF 4,110 4,815 4,965 5,533 6,066 6,107 6,174 4,403 6,257 6,557 6,872 7,202 7,549 7,914
5,821 6,100 6,393 6,700 7,023 7,362
86,165 90,286 94,621 99,183 103,984 109,037TOTAL (AFY) 51,371 60,192 62,057 69,164 75,822 76,338 77,178 55,033 78,227 81,966 85,900 90,039 94,395 98,978
70,345 73,703 77,235 80,951 84,861 88,975
76.923 80.602 84.472 88.545 92.831 97.342TOTAL (MGD) 45.861 53.736 55.401 61.746 67.689 68.150 68.900 49.130 69.836 73.175 76.687 80.382 84.270 88.362
62.800 65.798 68.951 72.269 75.759 79.432
Actual Demand (AFY)
BK PAWS 2015 Demand Proj 4/12/2016

Projected Sources Graph
BK PAWS 2015 Projected Sources Graph 4/12/2016
0
10,000
20,000
30,000
40,000
50,000
60,000
70,000
80,000
90,000
100,000
110,000
1980 1985 1990 1995 2000 2005 2010 2015 2020 2025 2030 2035 2040
Prod
uctio
n in
Acr
e-Fe
et
Year
Historical and Projected Distribution of Demand by Source
Purchased Import Water Groundwater Surface Conservation
Historical Projected

Sources
California Water Service Company - Bakersfield DistrictWater Supply and Demand Analysis and ProjectionsHistorical and Projected Distribution of Demand by Source
Year MGD AFY MGD AFY MGD AFY MGD AFY MGD AFY MGD AFY MGD AFY MGD AFY1980 9.47 10,609 36.39 40,762 0.00 0 0.00 0 0.00 0 0.00 0 45.86 51,3711981 9.24 10,353 39.16 43,865 0.00 0 0.00 0 0.00 0 0.00 0 48.40 54,2181982 9.47 10,603 36.42 40,800 0.00 0 0.00 0 0.00 0 0.00 0 45.89 51,4031983 11.20 12,550 35.82 40,124 0.00 0 0.00 0 0.00 0 0.00 0 47.02 52,6741984 10.93 12,244 43.98 49,265 0.00 0 0.00 0 0.00 0 0.00 0 54.91 61,5091985 9.63 10,782 44.11 49,410 0.00 0 0.00 0 0.00 0 0.00 0 53.74 60,1921986 10.40 11,650 44.32 49,643 0.00 0 0.00 0 0.00 0 0.00 0 54.72 61,2921987 10.80 12,101 42.81 47,950 0.00 0 0.00 0 0.00 0 0.00 0 53.61 60,0521988 12.72 14,243 42.00 47,044 0.00 0 0.00 0 0.00 0 0.00 0 54.71 61,2871989 12.45 13,947 43.25 48,449 0.00 0 0.00 0 0.00 0 0.00 0 55.70 62,3961990 12.87 14,421 42.53 47,637 0.00 0 0.00 0 0.00 0 0.00 0 55.40 62,0571991 7.78 8,714 44.96 50,361 0.00 0 0.00 0 0.00 0 0.00 0 52.74 59,0751992 10.91 12,220 48.40 54,216 0.00 0 0.00 0 0.00 0 0.00 0 59.31 66,4361993 12.75 14,277 48.15 53,929 0.00 0 0.00 0 0.00 0 0.00 0 60.89 68,2061994 12.53 14,038 51.58 57,779 0.00 0 0.00 0 0.00 0 0.00 0 64.11 71,8171995 13.96 15,640 47.78 53,524 0.00 0 0.00 0 0.00 0 0.00 0 61.75 69,1641996 11.79 13,202 53.60 60,044 0.00 0 0.00 0 0.00 0 0.00 0 65.39 73,2461997 12.49 13,994 53.12 59,507 0.00 0 0.00 0 0.00 0 0.00 0 65.62 73,5011998 11.31 12,670 44.81 50,194 0.00 0 0.00 0 0.00 0 0.00 0 56.12 62,8631999 11.17 12,516 53.30 59,704 0.00 0 0.00 0 0.00 0 0.00 0 64.47 72,2202000 11.56 12,945 55.32 61,961 0.82 915 0.00 0 0.00 0 0.82 915 67.69 75,8222001 10.76 12,053 54.96 61,566 0.93 1,036 0.00 0 0.00 0 0.93 1,036 66.65 74,6552002 10.02 11,226 58.60 65,645 0.99 1,114 0.00 0 0.00 0 0.99 1,114 69.62 77,9862003 13.93 15,606 52.03 58,278 5.45 6,109 0.00 0 0.00 0 5.45 6,109 71.41 79,9942004 10.70 11,982 46.05 51,586 13.98 15,660 0.00 0 0.00 0 13.98 15,660 70.73 79,2292005 11.52 12,908 44.51 49,856 12.12 13,574 0.00 0 0.00 0 12.12 13,574 68.15 76,3382006 16.85 18,879 46.87 52,499 13.32 14,926 0.00 0 0.00 0 13.32 14,926 77.05 86,3042007 12.33 13,814 48.11 53,889 12.17 13,634 0.92 1,026 0.00 0 13.09 14,660 73.53 82,3622008 12.55 14,058 47.01 52,661 12.74 14,265 1.19 1,334 0.00 0 13.93 15,599 73.49 82,3172009 12.58 14,090 42.99 48,154 12.83 14,374 4.36 4,879 0.00 0 17.19 19,253 72.76 81,4972010 12.59 14,103 39.28 43,995 13.32 14,922 3.71 4,157 0.00 0 17.03 19,079 68.90 77,1782011 12.89 14,436 37.35 41,835 12.87 14,415 3.91 4,377 0.00 0 16.78 18,793 67.01 75,0632012 15.81 17,712 40.81 45,709 11.67 13,067 4.56 5,109 0.00 0 16.23 18,176 72.85 81,5972013 15.92 17,829 36.74 41,157 12.00 13,443 3.22 3,603 0.00 0 15.22 17,046 67.88 76,0332014 12.66 14,178 40.62 45,495 8.07 9,043 2.49 2,791 0.00 0 10.56 11,834 63.84 71,5072015 11.16 12,496 29.81 33,388 7.17 8,027 1.00 1,122 0.00 0 8.17 9,149 49.13 55,033
2016 17.41 19,500 26.58 29,776 15.00 16,802 4.00 4,481 7.50 8,401 26.50 29,684 0.00 0 70.49 78,9602017 17.85 20,000 26.80 30,016 15.00 16,802 4.00 4,481 7.50 8,401 26.50 29,684 0.00 0 71.15 79,7002018 18.30 20,500 27.02 30,264 15.00 16,802 4.00 4,481 7.50 8,401 26.50 29,684 0.00 0 71.82 80,4482019 18.30 20,500 27.69 29,381 15.00 16,802 4.00 4,481 7.50 8,401 26.50 29,684 1.46 1,639 72.49 81,2032020 18.30 20,500 28.37 28,297 15.00 16,802 4.00 4,481 7.50 8,401 26.50 29,684 3.11 3,485 73.17 81,966
2025 18.30 20,500 9.39 7,227 30.00 33,604 4.00 4,481 15.00 16,802 49.00 54,887 2.93 3,286 76.69 85,9002030 18.30 20,500 13.08 11,579 30.00 33,604 4.00 4,481 15.00 16,802 49.00 54,887 2.74 3,074 80.38 90,0392035 18.30 20,500 16.97 16,160 30.00 33,604 4.00 4,481 15.00 16,802 49.00 54,887 2.54 2,847 84.27 94,3952040 18.30 20,500 21.06 20,984 30.00 33,604 4.00 4,481 15.00 16,802 49.00 54,887 2.33 2,607 88.36 98,978
NEBWTP = North East Bakersfield Water Treatment Plant
RRSSWTP = Rosedale Ranch and Seventh Standard Corridor WTP conceptual design planned for 2045 (7 mgd [7*365*0.75 = 1916 MGY, 5881 AFY])
SBTP = South Bakersfield Water Treatment Plant, expected to be operational by September 2013. The plant will be owned by Cal Water, but its output will be shared 50/50 with the City. Each entity will have rights to an ultimate capacity of 10 mgd (11.5 mgd peak capacity) in Phase 1 (20 mgd total) and 20 mgd (23 mgd peak capacity) in Phase 2 (total plant capacity is 40 mgd). Plant assumed to be operating 75% of the year.
TotalGroundwater ConservationPurchasedWater NEBWTP North Garden WTP SubtotalSBWTP
BK PAWS 2015 Sources 4/12/2016

PerCapita chart
BK PAWS 2015 PerCapita chart 4/12/2016
0
50
100
150
200
250
300
350
1995 2000 2005 2010 2015 2020 2025 2030 2035
Gal
lons
Per
Cap
itaPe
r D
ay
Year
Per Capita Consumption (BK)

PerCapita
California Water Service Company - Bakersfield District Worksheet 15Water Supply and Demand Analysis and ProjectionsPer Capita Water Demand Calculation
Per Capita Per Capita Demand Per Capita Demand Per Capita 2015 268(GPCPD) (GPCPD) (AFY) (GPCPD) (AFY) (GPCPD) 2020 239
1995 214,863 69,164 287 49,086 2041996 213,683 73,246 306 51,157 2141997 215,318 73,501 305 51,330 2131998 216,301 62,863 259 42,885 1771999 217,530 72,220 296 50,271 2062000 220,851 75,822 306 52,532 2122001 224,924 74,655 296 51,435 2042002 229,212 77,986 304 53,536 2092003 233,630 79,994 306 55,492 2122004 240,029 79,229 295 55,291 2062005 246,177 76,338 277 52,563 1912006 251,898 86,304 306 61,027 2162007 256,127 82,362 287 56,322 1962008 257,982 82,317 285 56,200 1942009 261,817 81,497 278 56,414 1922010 267,255 77,178 258 53,452 1792011 271,344 75,063 247 51,294 1692012 273,798 81,597 266 55,765 1822013 275,282 76,033 247 50,677 1642014 276,364 71,507 231 46,919 1522015 278,488 55,033 176 36,056 1162016 281,361 78,960 251 82,636 2622017 284,263 79,700 250 81,642 2562018 287,196 80,448 250 80,618 2512019 290,158 81,203 250 79,565 2452020 293,152 81,966 250 78,481 2392025 308,590 85,900 249 82,614 2392030 324,845 90,039 247 86,966 2392035 341,959 94,395 246 91,547 2392040 359,979 98,978 245 96,371 239
SBx7-7 TargetsHistorical Projected
Residential Only Avg Demand Avg Demand w/ ConsYear Usage
(AFY)
Gross DemandUsage(AFY)
POP
BK PAWS 2015 PerCapita 4/12/2016

Demand Grph
BK PAWS 2015 Demand Grph 4/12/2016
0
50
100
150
200
250
1980 1985 1990 1995 2000 2005 2010
Dem
and
in M
illio
n G
allo
ns p
er D
ay
Year
Average Day, Maximum Day, Peak Demand

ADD MDD PHD
California Water Service Company - Bakersfield District Worksheet 11Water Supply and Demand Analysis and ProjectionsHistorical and Projected Average Day, Maximum Day, and Peak Demand
Historical Annual Average Day Demand Maximum Day Demand MDD PHD PHD PHDDemand Demand Demand Per Service Demand Per Service ADD MDD ADD MDD
Year (AFY) (MGY) (MGD) (GPD) (MGD) (GPD) Ratio (MGD) (GPM) Ratio Ratio (MGD) (GPM) Ratio1980 51,371 16,739 45.86 1,016 96.12 2,130 2.10 144.18 100,128 1.50 3.141981 54,218 17,667 48.40 1,057 90.26 1,972 1.86 135.39 94,018 1.50 2.801982 51,403 16,750 45.89 991 88.02 1,900 1.92 132.03 91,684 1.50 2.881983 52,674 17,164 47.02 1,002 96.84 2,064 2.06 145.26 100,872 1.50 3.091984 61,509 20,043 54.91 1,144 100.59 2,096 1.83 150.89 104,783 1.50 2.751985 60,192 19,614 53.74 1,099 98.57 2,016 1.83 147.86 102,681 1.50 2.751986 61,292 19,972 54.72 1,093 103.37 2,064 1.89 155.06 107,677 1.50 2.831987 60,052 19,568 53.61 1,059 95.37 1,884 1.78 143.06 99,345 1.50 2.671988 61,287 19,970 54.71 1,076 96.70 1,901 1.77 145.06 100,733 1.50 2.651989 62,396 20,332 55.70 1,090 93.31 1,825 1.68 139.96 97,193 1.50 2.511990 62,057 20,221 55.40 1,072 94.15 1,822 1.70 141.22 98,071 1.50 2.551991 59,075 19,250 52.74 1,005 94.27 1,796 1.79 141.40 98,193 1.50 2.681992 66,436 21,648 59.31 1,115 97.41 1,832 1.64 146.12 101,472 1.50 2.461993 68,206 22,225 60.89 1,134 107.45 2,001 1.76 161.17 111,925 1.50 2.651994 71,817 23,402 64.11 1,192 114.36 2,126 1.78 171.54 119,128 1.50 2.681995 69,164 22,537 61.75 1,147 112.46 2,090 1.82 168.69 117,146 1.50 2.731996 73,246 23,867 65.39 1,211 116.22 2,152 1.78 174.33 121,063 1.50 2.671997 73,501 23,950 65.62 1,205 112.24 2,060 1.71 168.36 116,917 1.50 2.571998 62,863 20,484 56.12 1,024 115.67 2,111 2.06 173.51 120,491 1.50 3.091999 72,220 23,533 64.47 1,165 113.65 2,054 1.76 170.47 118,384 1.50 2.642000 75,822 24,707 67.69 1,198 126.29 2,234 1.87 189.43 131,547 1.50 2.802001 74,655 24,326 66.65 1,161 124.88 2,176 1.87 187.32 130,085 1.50 2.812002 77,986 25,412 69.62 1,195 125.32 2,152 1.80 187.98 130,539 1.50 2.702003 79,994 26,066 71.41 1,207 128.35 2,169 1.80 192.52 133,698 1.50 2.702004 79,229 25,817 70.73 1,163 127.46 2,096 1.80 191.19 132,770 1.50 2.702005 76,338 24,875 68.15 1,094 122.67 1,970 1.80 184.01 127,781 1.50 2.702006 86,304 28,122 77.05 1,211 123.43 1,940 1.60 185.15 128,573 1.50 2.402007 82,362 26,838 73.53 1,140 125.73 1,949 1.71 188.60 130,969 1.50 2.562008 82,317 26,823 73.49 1,138 117.38 1,818 1.60 176.07 122,271 1.50 2.402009 81,497 26,556 72.76 1,115 113.85 1,745 1.56 170.78 118,594 1.50 2.352010 77,178 25,148 68.90 1,037 130.58 1,966 1.90 195.87 136,021 1.50 2.842011 75,063 24,459 67.01 993 131.08 1,943 1.96 196.62 136,542 1.50 2.932012 81,597 26,589 72.85 1,070 129.38 1,901 1.78 194.07 134,771 1.50 2.662013 76,033 24,775 67.88 990 101.66 1,483 1.50 152.49 105,896 1.50 2.252014 71,507 23,301 63.84 924 120.60 1,746 1.89 180.90 125,625 1.50 2.832015 55,033 17,932 49.13 706
10 year Average 68.64 1,032 121.64 1,846 1.73 182.45 126,704 1.50 2.59 5 year Average 64.14 937 122.66 1,808 1.80 183.99 127,771 1.50 2.70
Estimated Peak Hour Demand
Measured Peak Hour Demand
BK PAWS 2015 ADD MDD PHD 4/12/2016

Marplot Summary
California Water Service Company - Bakersfield District Worksheet 12Water Supply and Demand Analysis and ProjectionsMarPlot Summary
System Census Blocks Population
HousingUnits(HU)
Density Census Blocks Population
HousingUnits(HU)
DensityPercentage Population
Change
PercentageHU
Change
DensityChange
Bakersfield 2,651 243,138 80,892 3.01North Garden 250 24,117 8,945 2.70
District 2,699 220,851 76,022 2.91 2,901 267,255 89,837 2.97 21.0% 18.2% 2.4%
City of Bakersfield 3,318 330,483 115,715 2.86Percent of City service by Cal Water 87.4% 80.9% 77.6%
US Census 2000 Summary US Census 2010 Summary 2000-2010 Change
MARPLOT disclaimer: The population and housing number given above are only rough estimates. They are based on the US Census Blocks. Although Census Blocks are polygons, MARPLOT uses the centoid, or center point, rather than the entire polygon. If a Census Block centroid is within any of the MARPLOT selected objects, the population and housing numbers for that block are tallied, even if only part of the block is within the selected object. It is possible for a block not be counted if its centroid is not within selected objects, even thought part of the block is within the selected objects.
BK PAWS 2015 Marplot Summary 4/12/2016

HOU
BK PAWS 2015 HOU 4/12/2016
0
20,000
40,000
60,000
80,000
100,000
120,000
140,000
160,000
1990 1995 2000 2005 2010 2015 2020 2025 2030 2035 2040
Hou
se/S
ervi
ce C
ount
Year
Housing ProjectionsTotal Residential Dwelling Units US CensusCDOF Water Supply and Facility Master PlanKern County Economic Forecast City of Bakersfield (May 5, 2015)Cal Water's portion times City Housing Estimate

POP
BK PAWS 2015 POP 4/12/2016
0
50,000
100,000
150,000
200,000
250,000
300,000
350,000
400,000
450,000
500,000
1995 2000 2005 2010 2015 2020 2025 2030 2035 2040
Popu
latio
n
Year
Population ProjectionsCal Water Projection US Census
CDOF Water Supply and Facility Master Plan
Kern County Economic Forecast 2010 UWMP
City of Bakersfield (May 5, 2015) Cal Water's portion times City Population

Population
California Water Service Company - Bakersfield District Worksheet 12Water Supply and Demand Analysis and ProjectionsPopulation Estimate
Single Family Flat Rate Residential Residential Unit Residential
Services (DU) Services Units (DU) Density Services (DU)2000 220,851 76,022 2.905 12,972 448 26,862 60.0 36,1882010 267,255 89,837 2.975 28,480 1,089 31,480 28.9 29,877
21.0% 18.2% 2.4% 119.6% 143.1% 17.2% -51.8% -17.4%
Single Family Flat Rate Total EstimatedResidential Services Residential Unit Residential Residential District
Services (DU) Units (DU) Density Services (DU) Dwelling Units Population1995 8,784 458 27,457 60.0 37,720 73,961 2.905 214,8631996 9,400 446 26,782 60.0 37,373 73,555 2.905 213,6831997 10,288 448 26,902 60.0 36,927 74,117 2.905 215,3181998 11,011 448 26,907 60.0 36,538 74,456 2.905 216,3011999 11,871 446 26,782 60.0 36,226 74,879 2.905 217,5302000 12,972 448 26,862 60.0 36,188 76,022 2.905 220,8512001 13,847 450 27,324 60.7 36,068 77,239 2.912 224,9242002 15,033 449 27,786 61.9 35,705 78,523 2.919 229,2122003 16,218 516 28,247 54.7 35,380 79,845 2.926 233,6302004 18,737 970 28,709 29.6 34,391 81,837 2.933 240,0292005 21,168 960 29,171 30.4 33,395 83,734 2.940 246,1772006 23,069 936 29,633 31.7 32,776 85,477 2.947 251,8982007 24,444 931 30,094 32.3 32,168 86,707 2.954 256,1272008 25,154 998 30,556 30.6 31,418 87,129 2.961 257,9822009 26,478 1,035 31,018 30.0 30,720 88,216 2.968 261,8172010 28,480 1,089 31,480 28.9 29,877 89,837 2.975 267,2552011 30,848 1,185 31,942 27.0 28,422 91,212 2.975 271,3442012 33,434 1,194 32,184 27.0 26,419 92,036 2.975 273,798
/\ 2013 35,947 1,194 32,198 27.0 24,391 92,535 2.975 275,282 /\| 2014 38,190 1,190 32,074 27.0 22,635 92,899 2.975 276,364 |
ACTUAL 2015 41,541 1,199 32,319 27.0 19,753 93,613 2.975 278,488 ACTUALPROJECTED 2020 64,376 1,267 34,166 27.0 0 98,542 2.975 293,152 PROJECTED
| 2025 67,613 1,340 36,119 27.0 0 103,732 2.975 308,590 |\/ 2030 71,013 1,416 38,183 27.0 0 109,196 2.975 324,845 \/
2035 74,583 1,497 40,365 27.0 0 114,949 2.975 341,9592040 78,334 1,583 42,672 27.0 0 121,006 2.975 359,979
Notes: linear extrapolation used to estimated MFR-DU from 2000. Estimate extend until 2011 due to reclassification, afterwards a constant MFR Unit Density is used.
Multi Family Residential
Year
Persons per Housing Unit
Multi Family Residential
Population Housing UnitsYear
US Census Persons per Housing Unit
BK PAWS 2015 Population 4/12/2016

Annual Rain
BK PAWS 2015 Annual Rain 4/12/2016
5.0% 0.9%
43.7%
79.4%
-34.6%
-22.0%
-3.3%
24.9%
-15.5%
-52.0%
-51.4%
14.7%
26.3%
24.8%
3.8%
56.5%
34.5%
-12.7%
133.2%
-18.7%
-21.3%
21.1%
-36.8%
-8.1% -16.7%
23.7%
-11.5%
-52.7%
-52.5%
-25.5%
99.6%
-24.7%
-27.7%
-45.1%
-30.6%
-28.7%
6.81
6.54
9.32
11.63
4.24
5.06
6.27
8.10
5.48
3.11
3.15
7.44
8.19
8.09
6.73
10.15
8.72
5.66
15.12
5.27
5.10
7.85
4.10
5.96
5.40
8.02
5.74
3.07
3.08
4.83
12.94
4.88
4.69
3.56
4.50
4.62
-
200
400
600
800
1,000
1,200
1,400
-100%
-80%
-60%
-40%
-20%
0%
20%
40%
60%
80%
100%
120%
140%
160%
180%
200%
1980
1981
1982
1983
1984
1985
1986
1987
1988
1989
1990
1991
1992
1993
1994
1995
1996
1997
1998
1999
2000
2001
2002
2003
2004
2005
2006
2007
2008
2009
2010
2011
2012
2013
2014
2015
Dem
and
per
Serv
ice
(GPD
)
Perc
ent D
evia
tion
from
Ave
rage
(%)
Calendar Year
Comparison of Annual Rainfall to Historical Average
Annual Rainfall Totals (inches)
Demand per Service

TempRain
California Water Service Company - Bakersfield District Worksheet 13Water Supply and Demand Analysis and ProjectionsTemperature & Rainfall History
Percent ofYear Tmax Tmin Mean Average Mean High Year Low Year
(°F) (°F) (°F) Demand in. in. - in. -
1980 6.81 5.0% 78.01 38.50 58.3 1,016 -6.8% Jan 1.19 4.03 1916 0.00 1948 1.24
1981 6.54 0.9% 79.21 41.50 60.4 1,057 -3.0% Feb 1.14 6.11 1998 0.00 1898 1.961982 9.32 43.7% 75.98 36.60 56.3 991 -9.1% Mar 1.12 5.21 1991 0.00 1934 3.411983 11.63 79.4% 76.25 37.20 56.7 1,002 -8.1% Apr 0.64 2.95 1967 0.00 1905 5.101984 4.24 -34.6% 77.72 38.20 58.0 1,144 5.0% May 0.30 2.48 1921 0.00 1897 6.821985 5.06 -22.0% 75.85 35.90 55.9 1,099 0.8% Jun 0.06 0.65 1933 0.00 1910 7.801986 6.27 -3.3% 77.94 38.40 58.2 1,093 0.2% Jul 0.01 0.39 1913 0.00 1964 8.061987 8.10 24.9% 77.95 35.20 56.6 1,059 -2.8% Aug 0.03 0.82 1983 0.00 1960 7.131988 5.48 -15.5% 79.12 35.80 57.5 1,076 -1.3% Sep 0.13 1.76 1976 0.00 1899 5.401989 3.11 -52.0% 77.98 32.00 55.0 1,090 0.0% Oct 0.30 1.61 1974 0.00 1900 3.721990 3.15 -51.4% 78.01 30.70 54.4 1,072 -1.6% Nov 0.61 2.80 1960 0.00 1898 1.801991 7.44 14.7% 78.06 37.10 57.6 1,005 -7.8% Dec 0.88 6.14 2010 0.00 1900 0.931992 8.19 26.3% 78.45 36.40 57.4 1,115 2.3%1993 8.09 24.8% 77.65 37.40 57.5 1,134 4.0% Annual 6.41 15.12 1998 2.41 1898 53.301994 6.73 3.8% 77.71 36.80 57.3 1,192 9.4%1995 10.15 56.5% 78.13 41.90 60.0 1,147 5.3%1996 8.72 34.5% 78.45 39.00 58.7 1,211 11.1% Tmax Tmin Mean1997 5.66 -12.7% 77.53 36.70 57.1 1,205 10.5% °F °F °F1998 15.12 133.2% 74.54 33.10 53.8 1,024 -6.0% Jan 57.3 38.5 47.91999 5.27 -18.7% 77.28 34.80 56.0 1,165 6.9% Feb 61.2 41.4 51.32000 5.10 -21.3% 78.13 36.20 57.2 1,198 9.9% Mar 64.3 43.1 53.7
2001 7.85 21.1% 78.97 37.80 58.4 1,161 6.5% Apr 68.4 44.7 56.62002 4.10 -36.8% 78.49 37.80 58.1 1,195 9.7% May 72.9 48.5 60.72003 5.96 -8.1% 78.74 40.50 59.6 1,207 10.7% Jun 77.4 52.6 65.02004 5.40 -16.7% 77.98 36.60 57.3 1,163 6.7% Jul 78.4 54.9 66.72005 8.02 23.7% 77.46 41.80 59.6 1,094 0.4% Aug 78.5 54.7 66.62006 5.74 -11.5% 78.06 35.90 57.0 1,211 11.1% Sep 78.2 52.6 65.42007 3.07 -52.7% 78.28 31.60 54.9 1,140 4.6% Oct 73.0 48.0 60.52008 3.08 -52.5% 77.69 38.20 57.9 1,138 4.4% Nov 64.4 42.7 53.62009 4.83 -25.5% 78.25 37.90 58.1 1,115 2.3% Dec 57.8 38.2 48.02010 12.94 99.6% 76.32 40.90 58.6 1,037 -4.8%2011 4.88 -24.7% 76.06 31.70 53.9 993 -8.9% Annual 69.3 46.7 58.02012 4.69 -27.7% 79.50 36.60 58.1 1,070 -1.8%2013 3.56 -45.1% 79 33.5 56.2 990 -9.2%2014 4.50 -30.6% 81 39.0 60.1 924 -15.2%2015 4.62 -28.7% 79 35.5 57.4 706 -35.3%20162017201820192020
PrecipitationPercent
VariationAnnual
(in)
Demand per Service (gpd)
Monthly Average Eto
1) Eto values based on California Irrigation Management Information System (CIMIS), http://wwwcimis.water.ca.gov/cimis/ welcome.jsp, EvapoTranspiration (Eto) Zones Map, Zone 122) PPT, Tmax, Tmin obtained from PRISMwhere, PPT is total montly rainfall, Tmax is average of maximum temperatures for given month, and Tmin is average of minimum temperatures for given month3) Percent variaion based on average of 1980 to present values
Temperature
Temperature (1895 - present)
Precipitation (1895 - present)
BK PAWS 2015 TempRain 4/12/2016

TempRain Chart
BK PAWS 2015 TempRain Chart 4/12/2016
0.00
1.00
2.00
3.00
4.00
5.00
6.00
7.00
8.00
9.00
0.0
10.0
20.0
30.0
40.0
50.0
60.0
70.0
Jan Feb Mar Apr May Jun Jul Aug Sep Oct Nov Dec
Mea
n M
onth
ly R
ainf
all,
inch
es
Mea
n M
onth
ly T
empe
ratu
re, °
F
Average Monthly Temperature, Rainfall, and Monthly Eto
Avg Temp Avg. Rainfall Monthly Average Eto

Wells
California Water Service Company - Bakersfield District Worksheet 14
Water Supply and Demand Analysis and Projections
Groundwater Production Facilities
BK PAWS 2015 Wells 4/12/2016

Indoor Usage Chart
BK PAWS 2015 Indoor Usage Chart 4/12/2016
0
5,000
10,000
15,000
20,000
25,000
30,000
35,000
40,000
45,000
1980 1990 2000 2010 2020 2030 2040
Estim
ated
Indo
or W
ater
Usa
ge (A
FY)
Estimated Indoor Water UsageSingle Family Residential (SFR) Multi Family Residential (MFR) Commercial (COM) Industrial (IND)
Govenment (GOV) Est. Indoor Usage (Historical) Est. Indoor Usage (Projected)

Indoor Usage
California Water Service Company - Bakersfield DistrictWater Supply and Demand Analysis and Projections
Estimated Indoor/Outdoor Water Usage
SFRJan
Usage
MFR Jan Usage
COM Jan Usage
JAN (CCF) AFY AF/Serv AFY GPD/Serv % (CCF) AFY GPD/Serv % (CCF) AFY GPD/Serv %1980 55,891 1,386 0.351 12,305 13,691 314 41% 47,828 1,186 3,332 70% 224,833 5,574 916 66%1981 60,507 1,500 0.368 13,044 14,544 329 41% 48,042 1,191 3,221 66% 230,696 5,720 923 62%1982 58,056 1,439 0.336 11,975 13,415 300 40% 51,406 1,275 3,438 73% 243,899 6,047 960 69%1983 60,168 1,492 0.334 12,019 13,511 298 40% 53,323 1,322 3,334 71% 255,704 6,340 992 68%1984 65,209 1,617 0.346 12,702 14,319 309 36% 59,035 1,464 3,401 68% 267,168 6,624 1,009 65%1985 56,258 1,395 0.288 10,721 12,116 257 31% 64,320 1,595 3,394 66% 267,610 6,635 64%1986 66,167 1,641 0.329 12,521 14,162 293 36% 67,302 1,669 3,379 65% 280,000 6,942 1,014 65%1987 70,568 1,750 0.347 13,366 15,116 310 40% 72,655 1,801 3,559 69% 284,712 7,059 1,021 65%1988 72,191 1,790 0.346 13,354 15,143 309 39% 74,667 1,851 3,675 66% 271,300 6,726 968 63%1989 78,060 1,935 0.366 14,191 16,126 327 41% 80,839 2,004 4,001 70% 307,878 7,633 1,091 71%1990 84,649 2,099 0.385 15,033 17,132 343 44% 88,455 2,193 4,363 76% 291,395 7,225 1,029 66%1991 89,066 2,208 0.374 14,737 16,945 334 45% 82,442 2,044 4,055 74% 302,936 7,511 1,067 71%1992 86,459 2,144 0.325 12,774 14,918 290 34% 80,344 1,992 3,945 70% 277,634 6,883 968 64%1993 94,325 2,339 0.319 12,460 14,799 285 32% 80,984 2,008 3,940 73% 278,870 6,914 966 65%1994 111,817 2,772 0.347 13,347 16,119 309 33% 83,880 2,080 4,069 74% 293,642 7,280 1,019 66%1995 110,041 2,728 0.311 11,716 14,445 277 31% 74,737 1,853 3,615 68% 286,907 7,113 992 64%1996 129,788 3,218 0.342 12,794 16,012 306 33% 85,370 2,117 4,234 74% 312,366 7,745 1,088 63%1997 132,034 3,274 0.318 11,750 15,023 284 31% 78,809 1,954 3,891 68% 309,737 7,679 1,076 62%1998 145,668 3,612 0.328 11,985 15,596 293 39% 79,618 1,974 3,930 70% 311,369 7,720 1,083 67%1999 169,778 4,209 0.355 12,846 17,055 317 36% 82,020 2,034 4,067 69% 323,845 8,029 1,128 65%2000 231,406 5,737 0.442 16,006 21,743 395 44% 92,533 2,294 4,575 73% 348,264 8,635 1,196 66%2001 229,841 5,699 0.412 14,844 20,542 367 42% 96,987 2,405 4,771 81% 386,221 9,576 1,307 73%2002 210,060 5,208 0.346 12,370 17,578 309 35% 86,070 2,134 4,245 70% 343,967 8,528 1,161 63%2003 222,913 5,527 0.341 12,057 17,584 304 34% 80,319 1,991 3,445 60% 315,926 7,833 1,079 60%2004 372,301 9,231 0.493 16,943 26,173 440 51% 198,412 4,919 4,527 117% 318,586 7,899 1,171 66%2005 272,434 6,755 0.319 10,656 17,411 285 36% 106,833 2,649 2,463 71% 295,376 7,323 1,081 62%2006 321,413 7,969 0.345 11,322 19,291 308 34% 105,482 2,615 2,495 72% 306,634 7,602 1,108 62%2007 390,443 9,680 0.396 12,739 22,420 354 42% 108,276 2,685 2,573 77% 356,621 8,842 1,269 69%2008 374,352 9,281 0.369 11,593 20,874 329 40% 98,628 2,445 2,188 67% 354,786 8,796 1,253 67%2009 346,219 8,584 0.324 9,959 18,543 289 35% 109,787 2,722 2,347 73% 327,516 8,120 1,161 63%2010 342,555 8,493 0.298 8,910 17,403 266 35% 97,092 2,407 1,974 68% 295,094 7,316 1,049 61%2011 357,084 8,853 0.287 8,157 17,010 256 36% 107,191 2,658 2,002 71% 299,193 7,418 1,060 62%2012 465,539 11,542 0.345 9,120 20,663 308 40% 111,800 2,772 2,073 71% 304,105 7,540 1,075 61%2013 449,322 11,140 0.310 7,559 18,699 277 40% 110,488 2,739 2,047 71% 302,767 7,507 1,071 61%2014 576,867 14,302 0.375 8,477 22,780 334 53% 118,780 2,945 2,210 79% 333,903 8,279 1,178 67%2015 497,960 12,346 0.201 3,979 16,325 238 50% 111,122 2,755 2,052 82% 333,109 8,259 1,169 82%
2016 19,597 283 2,820 2,077 7,876 1,1112017 19,790 283 2,852 2,077 7,909 1,1112018 19,985 283 2,884 2,077 7,943 1,1112019 20,182 283 2,916 2,077 7,976 1,1112020 20,381 283 2,948 2,077 8,010 1,1112021 20,582 283 2,981 2,077 8,043 1,1112022 20,785 283 3,015 2,077 8,077 1,1112023 20,990 283 3,048 2,077 8,111 1,1112024 21,197 283 3,082 2,077 8,145 1,1112025 21,406 283 3,117 2,077 8,180 1,1112026 21,617 283 3,152 2,077 8,214 1,1112027 21,830 283 3,187 2,077 8,249 1,1112028 22,046 283 3,223 2,077 8,283 1,1112029 22,263 283 3,259 2,077 8,318 1,1112030 22,482 283 3,295 2,077 8,353 1,1112031 22,704 283 3,332 2,077 8,388 1,1112032 22,928 283 3,369 2,077 8,424 1,1112033 23,154 283 3,407 2,077 8,459 1,1112034 23,382 283 3,445 2,077 8,495 1,1112035 23,613 283 3,483 2,077 8,531 1,1112036 23,846 283 3,522 2,077 8,567 1,1112037 24,081 283 3,562 2,077 8,603 1,1112038 24,318 283 3,601 2,077 8,639 1,1112039 24,558 283 3,642 2,077 8,675 1,1112040 24,800 283 3,682 2,077 8,712 1,111
Note: GPD/Service is estimated as the average of the last 5 years for given customer class.
Single Family Residential (SFR) Multi Family Residential (MFR) Commercial (COM)
Year
Metered SFR Indoor Use (Annualized 90% of January
Total)
Indoor Flat Rate Usage
(AFY)
Total SFR Indoor Usage MFR Indoor Use
(Annualized 90% of January Total)
COM Indoor Use (Annualized 90% of January
Total)
BK PAWS 2015 Indoor Usage 4/12/2016

Indoor Usage
California Water Service Company - Bakersfield District Worksheet 16Water Supply and Demand Analysis and Projections
Estimated Indoor/Outdoor Water Usage
IND Jan Usage
GOV Jan Usage Est. Indoor Usage Est. Outdoor Usage Est. Indoor Usage Est. Outdoor Usage
(CCF) AFY GPD/Serv % (CCF) AFY GPD/Serv % AFY AFY % %1980 23,737 589 9,231 81% 35,740 886 2,556 34% 21,926 29,445 43% 57%1981 18,797 466 7,430 78% 41,753 1,035 2,981 38% 22,956 31,261 42% 58%1982 17,122 425 6,747 81% 37,292 925 2,667 36% 22,086 29,317 43% 57%1983 14,169 351 5,763 75% 32,326 801 2,306 29% 22,325 30,349 42% 58%1984 13,319 330 5,651 70% 36,050 894 2,551 27% 23,631 37,878 38% 62%1985 12,884 319 5,647 66% 32,649 809 2,219 25% 21,475 38,717 36% 64%1986 14,370 356 6,480 77% 31,724 787 2,131 24% 23,915 37,377 39% 61%1987 16,677 413 7,664 93% 51,963 1,288 3,503 39% 25,678 34,374 43% 57%1988 12,861 319 5,972 73% 29,009 719 1,944 21% 24,759 36,527 40% 60%1989 12,471 309 5,863 72% 41,112 1,019 2,702 28% 27,092 35,304 43% 57%1990 11,325 281 5,352 74% 57,044 1,414 3,769 38% 28,245 33,813 46% 54%1991 12,108 300 5,743 88% 34,307 851 2,215 29% 27,651 31,424 47% 53%1992 8,942 222 4,181 71% 30,758 763 1,949 24% 24,778 41,658 37% 63%1993 6,895 171 3,324 75% 36,853 914 2,295 28% 24,806 43,401 36% 64%1994 5,289 131 2,691 73% 48,407 1,200 3,015 34% 26,811 45,006 37% 63%1995 4,417 110 2,189 58% 38,508 955 2,388 31% 24,475 44,689 35% 65%1996 6,334 157 3,292 74% 48,861 1,211 3,089 33% 27,241 46,005 37% 63%1997 4,439 110 2,401 57% 35,881 890 2,270 24% 25,656 47,845 35% 65%1998 5,264 131 2,907 71% 34,289 850 2,158 27% 26,271 36,592 42% 58%1999 4,636 115 2,508 69% 41,165 1,021 2,594 29% 28,253 43,967 39% 61%2000 2,253 56 1,249 79% 50,167 1,244 2,934 31% 33,972 41,850 45% 55%2001 1,538 38 834 67% 55,103 1,366 3,055 35% 33,927 40,728 45% 55%2002 1,223 30 684 50% 44,198 1,096 2,449 26% 29,366 48,619 38% 62%2003 1,027 25 617 49% 47,149 1,169 2,194 25% 28,603 51,391 36% 64%2004 1,406 35 834 63% 59,938 1,486 2,320 30% 40,512 38,716 51% 49%2005 1,956 48 1,217 63% 51,503 1,277 1,991 26% 28,708 47,629 38% 62%2006 2,136 53 1,326 73% 61,520 1,525 2,357 30% 31,087 55,217 36% 64%2007 1,893 47 1,203 55% 79,140 1,962 3,026 34% 35,955 46,407 44% 56%2008 1,414 35 946 53% 63,703 1,579 2,375 27% 33,730 48,587 41% 59%2009 1,679 42 1,152 79% 60,984 1,512 2,067 27% 30,939 50,557 38% 62%2010 1,154 29 809 64% 64,887 1,609 2,172 30% 28,764 48,414 37% 63%2011 1,506 37 1,047 67% 48,914 1,213 1,616 22% 28,336 46,727 38% 62%2012 1,410 35 975 63% 83,321 2,066 2,691 31% 33,075 48,522 41% 59%2013 1,236 31 895 61% 87,245 2,163 2,787 32% 31,139 44,894 41% 59%2014 995 25 736 49% 105,983 2,628 3,372 43% 36,656 34,851 51% 49%2015 1,407 35 1,027 61% 71,246 1,766 2,216 42% 29,140 25,892 53% 47%
2016 32 936 2,051 2,536 32,376 46,583 41% 59%2017 32 936 2,082 2,536 32,665 47,035 41% 59%2018 32 936 2,113 2,536 32,956 47,492 41% 59%2019 32 936 2,144 2,536 33,250 47,953 41% 59%2020 32 936 2,176 2,536 33,547 48,420 41% 59%2021 32 936 2,208 2,536 33,847 48,891 41% 59%2022 32 936 2,240 2,536 34,149 49,367 41% 59%2023 32 936 2,274 2,536 34,455 49,848 41% 59%2024 32 936 2,307 2,536 34,764 50,333 41% 59%2025 32 936 2,341 2,536 35,076 50,824 41% 59%2026 32 936 2,376 2,536 35,391 51,321 41% 59%2027 32 936 2,411 2,536 35,709 51,822 41% 59%2028 32 936 2,447 2,536 36,030 52,328 41% 59%2029 32 936 2,483 2,536 36,355 52,840 41% 59%2030 32 936 2,520 2,536 36,682 53,357 41% 59%2031 32 936 2,557 2,536 37,013 53,879 41% 59%2032 32 936 2,595 2,536 37,348 54,407 41% 59%2033 32 936 2,633 2,536 37,685 54,941 41% 59%2034 32 936 2,672 2,536 38,026 55,480 41% 59%2035 32 936 2,712 2,536 38,371 56,024 41% 59%2036 32 936 2,752 2,536 38,718 56,574 41% 59%2037 32 936 2,793 2,536 39,070 57,130 41% 59%2038 32 936 2,834 2,536 39,424 57,692 41% 59%2039 32 936 2,876 2,536 39,783 58,260 41% 59%2040 32 936 2,919 2,536 40,145 58,834 41% 59%
Estimated Indoor/Outdoor UsageIndustrial (IND) Govenment (GOV)
Year
IND Indoor Use (Annualized 90% of January
Total)
GOV Indoor Use (Annualized 90% of January
Total)
BK PAWS 2015 Indoor Usage 4/12/2016

Blank Page
PAGE LEFT BLANK INTENTIONALLY
BK PAWS 2015 Blank Page 4/12/2016