water resources research center publication no. 65
TRANSCRIPT

WATER RESOURCES RESEARCH CENTER
Publication No. 65
NITRIFICATION, DENITRIFICATION, AND SORPTIONDESORPTION OF NH 4-N IN SANDS DURING WATER
MOVEMENT TO SUBSURFACE DRAINS
By
R. S. H.ansell J. G. A. Fiskell D. V. Calvert
Soil Science Department University of Florida
Gainesville


i
NITRIFICATION, DENITRIFICATION, AND SORPTIONDESORPTION OF NH 4-N IN SANDS DURING WATER
MOVEMEN~ TO SUBSURFACE DRAINS
By
R. S. Mansell J. G. A. Fiskell D. V. Calvert
Publication No. 65
Florida Water Resources Research Center
Research Project Technical Completion Report
project Number A-042-FLA
Annual Allotment Agreement Numbers 14-34-0001-0110 14-34-0001-1110
Report Submitted August 23, 1982
The work upon which this report is based was supported in part by funds provided by the United States Department of the Interior. .

ii
TABLE OF CONTENTS
Section
Title .
Table of Contents .
Acknowledgments • . .
Abstract
Chapter 1: Ihtroduction
Chapter 2: Isotopic Tracer Methods for Nitrogen in
Soil-Plant Systems
Chapter 3: Experimental Methods and Procedure
Chapter 4: Results and Discussion
Chapter 5: Summary and Conclusions.
Literature Cited
Appendix: Synopsis of Master of Science Thesis •
Page
i
ii
iii
v
1
5
9
18
70
76
78

iii
ACKNOWLEDGEMENTS
The Soils and Fertilizer Research Branch Division of
Agricultural Development, Tennessee Valley Authority (TVA)
located at the National Fertilizer Development Center near
Muscle Shoals, Alabama supplied the 15N-depleted (NH4)2S04
used in this research. The project inve~tigators are appre-
ciative/to TVA and to Dr. Roland D. Hauck, Research Soil
Scientist with TVA. We are also indebted to Dr. Hauck for
making us aware of the automatic mass spectrometer facility
at the Los Alamos National Laboratory for analyses of
15N/ 14N ratios in water samples.
We wish to acknowledge the University of California,
Los Alamos National Laboratory (LANL) in Los Alamos, New
Mexico for performing nitrogen isotope analyses for the 1300
water and soil samples used in this investigation. We are
particularly appreciative to Dr. B. B. McInteer for pe!mit
ting us to utilize the analytical service of the Los Alamos
National Laboratory.
The authors are indebted to Dr. J. S. Rogers, Agricul-
tural Engineer with the United States Department of Agricul-
ture and University of Florida, for providing water drainage
data from the Soil, Water, Atmosphere, and Plant (SWAP)
research citrus grove ,.,here the field experiment for this
grant was performed.
Acknowledgement is also given to Marc E. Hall, former
Laboratory Technologist II in the Soil Science Department
and Mariano Delacasa, student assistant, for performing COID-

iv
puteranalysis of the data. The investigators also acknowl
edge assistance from Mrs. Jennifer Johnson, former Labora
tory Technologist for preparation of camera-reaqy figures
presented in this ~eport.

v
ABSTRACT
Isotopically labelled (15N-depleted (NH4)2S04) N fer~
tilizer was applied at a rate of 115 kg N/ha to a Florida
citrus grove. located in a subsurface drained Spodosol in
order to determine the fate of applied N. The fertilizer
was applied to one O.22-ha field plot each of shallow-tilled
(ST), deep-tilled (DT) , and deep-limed/tilled (DTL) soil.
Analyses of soil, soil solution, drainage water, and citrus
leaf samples revealed that much of the NH 4-N was nitrified
to form N03-N during the first 42 days after application of
fertilizer. Partially because of a .local drought, most of
the applied N was absorbed by plant roots during the first
134 days and leaching losses in drainage water were less
than 4% of the amount applied. Rates of ~itrification and N
uptake by roots were highest for DTL and lowest for ST
treatments. Selective deep tillage with lime incorporation
of Spodosols appears to be an effective means to manage fer
ti1izerand water resources for citrus and possibly other
agricultural crops without contaminating groundwater
supplies.

1
Chapter 1: Introduction
Acid, sahdy soils with shallow water tables are common
ly utilized in Florida for intensive production of high
value vegetable, ·f·ruit, and horticultural crops. Producti v
ity of these soils using the definition by Hillel (1981) may
be severely restricted by limiting levels of both "chemical
fertility" and "physical fertility". High contents of
silica sand and low contents of colloidal material provide
porous soil matrices that primarily have only short-term
capacity to supply water and nutrients to active plant root
systems. Relatively large pores and low ion exchange capac
ities of the solid particles also result in potential
leaching losses of fertilizer applied to such soils. During
rain storms or when excess irrigation is applied, soluble
nutrients from applied fertilizer may easily be displaced
from the rooting zone of the soil profile and be transported
into underlying groundwater. Obviously, careful management
of fertilizer and soil water for crops growing in these
soils is needed to simultaneously minimize chemical contami
nation of groundwater supplies, maximize the use-efficiency·
of crop roots for nutrients applied in chemical fertilizer,
and optimize the water use-efficiency of crop roots.
Although the average annual rainfall in Florida is high
(1.3 to 1.5 meters) the distribution du~ing the year is
highly nonuniform giving a relat:i,vely dry period during the
win·ter and spring months and a relatively wet period during
the summer and fall months. For crops growing in sandy

2
soils with an impermeable layer located in the profile at'
some depth less than 2 m, ditch or subsurface drainage sys
tems are frequently installed so as to prevent development
of anaerobic soil conditions in the rooting zone during the
wet season. These systems are particularly needed to remove
excess water during' intense thunderstorms from soil areas
with nearly flat topography. However, during the dry, period
the accelerated removal of drainage water may well decrease
the effectiveness of rainfall events and the water use
efficiency of the crop. Leaching loss of soluble fertilizer
nutrients may also be increased as a result of accelerated
water discharge from ditches or subsurface drain tubes
(Mansell, Wheeler and Calvert 19801 Mansell et ale 1977).
Such enhanced leaching of applied fertilizer should be most
evident during the wet period but also would be expected for
large storms even during the dry period. On the one hand
artificial drainage tends to enhance use-efficiency of crops
for'water and fertilizer by permit:t;:ing active growth of the
root system during the wet season, but accelerated leaching
loss of nutrients due to the drainage system tends to
restrict the use-efficiency of applied fertilizer. During
the dry period, the limited water-holding capacity of these
coarse-textured soils requires that irrigation be used to
maintain economically profitable crop yields. Insufficient
irrigation will limit yields whereas excess irrigation
enhances' leaching'loss of fertilizer. Thus effective soil
water management for crops growing in shallow sands must of

3
necessity include both irrigation and drainage practices •
. The effectiveness of soil water management practices for
these soils will ultimately be reflected in the magnitude of
crop yields and in the quality of groundwater.
Results from a 3-year investigation (Mansell et ale
1977, Rogers et ale 1977, Calvert et al. 1981) of fertilizer
leaching losses from an experimental citrus grove located
on a Spodosol at the University at Florida Agricultural Re-
search Center near Ft. Pierce show that significant quan-
tities of N03-N and P0 4-N were removed from the soil through
discharge of drainage water. These losses occurred despite
a management practice of applying small quantities of fer-
tilizer frequently' (every 3 months) to minimize leaching
losses. As much as 22% of 169.52 kg/ha of N (55% of fertil-
izer N was NH 4-N and 45% was N03-N) applied in 4 split ap-'
plications during a 12-month period was lost as N03-N in the
drainage water. However, for treatments which had been
deep-tilled to a depth of 105 cm prior to planting of citrus
trees the average annual loss of N03-N in the drainage water
was equivalent to only 3% of the total N applied as fertil-
izer. The effectiveness of the deep tillage plots in mini~
mizing the leaching loss of N was attributed to increased
retention of applied NH4-N in the top soil due to upward
transport of colloidal material from subsurface horizons and \
to increased potential for denitrification of N03-N in the
soil profile due to slower drainage rates which resulted in
generally higher water contents following rainfall events.

4
A major limitation of the interpretation of some of the
results from this study however was that the applied ferti
lizer N was not labelled with a tracer such as l5N or 14N•
Thus a field investigation was performed to quantita
tively evaluate the fate of lSN-depleted NH: applied as fer
tilizer to a subsurface-drained sandy soil in an experi-
mental citrus grove in South Florida. Isotopically labelled
fertilizer N was applied to plots of a Spodosol which had
previously received shallow- and deep-tillage treatments.
The primary objective of this investigation was to de
termine the influence of movement (leaching), ion exchange,
and transformations (nitrification, denitrification, etc)
upon lSN_ depleted NH: applied as a single fertilizer appli
cation to a tube-drained sandy soil in a citrus grove. A
secondary objective was to evaluate the influence of 3 soil
modifications --- shallow tillage ST, deep tillage DT, and
deep tillage with initial incorporation of limestone into
the profile DTL --- upon the fate of applied lSN_ depleted
NH:. Both objectives require evaluation under field
conditions.
A brief review of the use of lSN and 14N isotopes as a
tracer for fertilizer nitrogen in soil-plant systems will be
given before presenting a description of experimental me-
thods and results.

5
Chapter 2: Isotopic Tracer Methods for
Nitrogen in Soil-Plant Systems
The recovery of fertilizer N applied to a given soil is
commonly determined by both difference (non-tracer) and
isotope tracer methods. Results from these two methods
(Kowalenko 1980) may however lead to different conclusions.
The difference method gives a measure of the net recovery of
fertilizer N after several processes (denitrification,
nitrification, ion exchange, leaching, immobilization, etc.)
have exchanged with and transformed the fertilizer N.
Broadbent and Carlton (1980) have shown that the assumption
in difference method calculations that plant uptake of unla-
beled N is the same in fertilized and unfertilized plots is
not valid. In contrast, 15N and 14N tracer techniques give
a measure of the actual fate of the applied N (Kowalenko
1980) as well as provide more accurate results than the dif-
ference method (Broadbent and Carlton 1980) •. Tracer methods
permit actual measurement of fertilizer recovery as well as
the distribution of recovered N in various chemical
fractions.
Nitrogen tracer techniques (Hauck and Bremner 1976) are
based upon the observation that naturally occurring N com
pounds contain about 0.366 atom % 15N and 99.634 atom %
14N• Addition of a fertilizer with an unusually high
(15N-enriched) or low (15N-depleted) concentration of 15N to
a soil-plant system can thus be used as a tracer. Measured
changes of 15N/14N ratios in samples removed from the system

6
provide a means to investigate transformations of tl;1e,added
fertilizer. The magnitude of the change in the isotope
ratio R from the background level R can be used to calcu-o
late the extent to which the tracer N ,has interac:ted with
and become part of the system. The percentage of N present
in a sample of soil or soil water initially from either
15N-depleted or 15N-enriched material can be calculated
using the relationship
R - R o B = R - R.
o 1
(1 )'
where R. is the isotopic ratio for the tracer material. 1
Hauck and Bremner (1976) state that isotope tracer
methods offer much potential for studying ways tJmaximize
the efficiency of fertilizer nitrogen in crop production.
They state that movement of N into, within, and from soil
b b . ' 15 • can accurately . e 0 talned only by the use of N-depleted
or 15N-enriched fertilizers. .Isotopically labelled ferti
lizer is particularly needed in soil~plant systems
(Broadbent and Carlton 1980) which contain a background of
large amounts of indigeneous N. Although 15N-enriched ma-
terials have been used in most nitrogen tracer studies, use
of 15N-depleted material has gained in popularity due to the
lower cost of those materials. 15 '
However, the use of N-
depleted materials (Hauck and Bremner 1976) is' re'stricted to
experiments where excessive dilution does not'occur in the
soil-plant system. Thus studies of plant uptake or movement

7
of applied nitrogen should be performed for single- rather
than multiple-seasons.
Kowalenko (1980) used 15N-enriched (NH4)2S04 to inves
tigate transport and transformation of fertilizer NH: in
eight micro-size (20-cm diameter) fallow field plots of a
sandy soil in Canada. The 15N-enriched (5.5% enrichment).
fertilizer was applied to the soil at a rate of 184 kg N/ha
in June 1977. Net fertilizer recoveries (as determined by
differences between extracted N in fertilized and unfer-
tilized plots) from the upper 75 cm of the soil profile were
determined to be 117 and 19% of that originally applied,
respectively, for 35 and 102 days after application of the
f t 'l' . f 1 15 , er 1 lzer. Measurements 0 tota N concentratlons
however revealed that recoveries of fertilizer N were ac-
tually 73 and 25% for 35 and 103 days after fertilization.
. " . +'" , Almost all (93%) of the fertlllzer NH4 lnltlally applled was
nitrified within 35 days. If the nitrification was assumed
to have occurred at a constant average rate, then that rate
for this sandy soil would have been 4.89 kg N/ha/day which
was considerably higher than a rate.of 2.30 kg N/ha/day ob
taihed previously by the same author for a clay loam soil.
Both soils had been in fallow prior to the experiments such
that neither soil had crop residues to influence microbial
processes. Although relatively low organic matter content
of the sandy soil suggested limited microbial activity,
tracer data $howed the microbial process for nitrification
to be rapid. Leaching, denitrification, clay fixation of

8
NH~, mineralization, and immobilization all were important.
in the transport and transformation of fertilizer NH~ ap
plied to a sandy soil.

9
Chapter 3: Experimental Methods
and Procedure
An experimE7ntal citrus grove originally developed
(Knipling and Hammond 1971) in 1970 on 9 hectares of
flatwood land at the University of Florida Agricultural
Research Center (A.R.C.) near Fort Pierce was selected as
the location for this investigation. The location of the
experimental site as well as the distribution of Spodosols
over the land area of Florida is shown in Fig. 1. The grove
was established as a cooperative venture between the Univer
sity of Florida Institute of Food and Agricultural Sciences
(IFAS) and the Agricultural Research Service (ARS) of the
United States Department of Agriculture. The IFAS-ARS
effort was designated as the Soil, Water, Atmosphere, and
Plapt Relationships Project (SWAP). The original purpose
for the SWAP grow was to evaluate the influence of deep
tillage, with and without incorporation of.limestone into
the profile, upon subsurface drainage and growth of citrus
in a Spodosol. The SWAP grove was chosen as the site for
this work partially because of the background information on
chemical and physical characteristics that has been accu
mulated (Mansell et ale 1977; Mansell, Wheeler and Calvert
1980; Calvert et ale 1981; Rogers et ale 1977) for the acid,
sandy soils in the grove. Another reason for that choice
was the fact that it is one of the best designed Coastal
Plains experimental drainage sites in the Southeastern
United States.

Fig. 1:
1{)
Figures
Map of Florida showing major land areas of
Spodosols and the location of the .experimental
site.
Location of Spodosols in Florida
N
Spodosols ([[!) Fort Pierce

11
Three O.S-hectare plots of citrus were .selected for
this research. One plot was selected for each of the three
soil profile modification treatments: (i) shallow-tilled
(ST) to lS-cm depth, (ii) deep-tilled (DT) to 10S-cm depth,
and (iii) deep-tilled (DTL) to 105 cm depth with an initial
incorporation of 56 metric tons per ha of dolomitic lime
stone into the profile. All treatments received annual
applications of 2.24 metric tons per ha of limestone to the
soil surface. During the initial deep tillage operation, a
trenching machine incorporated and mixed spodic and underly
ing sandy clay loam material with sandy soil material from
the A horizons. The primary soil type at the site is
Oldsmar fine sand (a member of the sandy siliceous, hyper
thermic family of Alfic Arenic Haplaquods). In undisturbed
profiles, the A horizon of the acid sand has an average
(Calvert et a1. 1981) depth of 82 em and contains about 1%
organic matter. Underneath the A horizon a nearly imperme
able spodic layer ranging in thickness from 10 to 20·':"cm con
tains about 3.5% organic matter. A layer of sandy clay
loam, also with low permeability to water, occurs peneath
the spodic horizon.
Surface drainage in each plot was provided by a system
of elevated beds (38 cm height of bed.crown above t.he bottom
of water furrows) separated by parallel water furrows. The
width of the beds as measured from centers of adjacent water
furrows was 15.2 m. During very intense rain storms any
surface drainage water from each plot was removed by

12
collection ditches at the end of the water furrows.
Subsurface drainage was provided by a system of 10-cm
corrugated plastic tubes buried beneath the soil surface at
an average depth of 107cm and spaced 18.3 m apart. The
drain tubes were located perpendicular to the elevated soil
beds. Two rows6f citrus 7.6-m apart with a spacing of
4.6 m between trees were planted along the top of each bed
in 1970. Water from the center tube in each plot discharged
into a concrete manhole where flow was measured with 30.5
cm, 30 degree, V-notch weirs and Stevens typeF, Model 68
water stage recorders. Pensacola bahiagrass was seeded to
each plot in 1970. A strip of surface along each tree row
was maintained bare of bahiagrass and weeds.
In order to investigate the fate of N in fertilizer ap
plied to these coarse-textured acid soils, lSN~depleted
NH 4-N was applied as (NH4)2S04 in an otherwise complete fer
tiliier to shallow-tilled (ST) and deep-tilled (DT and DTL)
plots. On June 5 (Julian Day 157) of 1980, lSN~depleted
8-2-8 (% N - % P20 S - % K20) fertilizer was applied at a
rate of 115 kg N/ha to selected areas (The shaded area in
the plot diagram in Fig. 2 indicates the fertilized area.)
for each of ST, DT, and DTL plots. A batch of the isotopic-
ally labelled fertilizer (625 kg) was prepared by mixing 232
15 kg of N-depleted (NH4'2S04 (courtesy of Dr. R. D. Hauck,
I
Tennessee Valley Authority, Muscle Shoals, Alabama) with 63
kg of ordinary superphosphate, 84 kg of muriate of potash,
and 246 kg of powdered dolomite. Isotopically labelled

13
fertilizer was broadcast by hand to the elevated beds (but
not to the water furrows) in the shaded area shown in the
plot diagram (Fig. 2) centered about the drain field for the
center drain in each of the three plots. Dots in Fig. 2
designate the locations for citrus trees. Approximately
0.22 ha in each plot received labelled fertilizer. The re-
mainder of each plot was fertilized with the same rate of
non-labelled 8-2-8 fertilizer.
Irrigation was applied immediately after the fertilizer
application to prevent volatilization of NH 4-N due to previ
ous annual applications of limestone to the surface soil.
One gallon cans containing open bottles of.su1furic acid
were placed at selected locations in the treatment plots in
order to tra~ any gaseous NH3 released to the atmosphere.
The acid solutions were later analyzed for N concentration.
During an 8-month period following the application of
15N-dep1eted fertilizer, concentrations of N03-N an~ NH 4-N
were determined in subsurface drainage water, samples of
soil solution, in soil cores, and in selected leaf samples
from citrus trees. When nitrogen concentrations in water,
soil and tissue samples were sufficiently high, ratios of
15 . 14 . t' d' d N-to- N concentra lons were etermlne. The central
drain in each of the selected ST, DT and DTL plots was con-
tinua11y monitored for water flow rates (Data provided by
Dr. J. S. Rogers, Agricultural Engineer, USDA, University of
Florida) and intermittently monitored for water quality sam-
p1es. Automated water samplers (ISCO Model 391) were used

Fig. 2:
r 54.9
m
II1II
14
Schematic diagram (scale: 1-to-695 ern) of experi-
mental citrus plots for ST, DT, and DTL treat-
ments.
PLOT DIAGRAM
.. .. to " " .. .. .. .. I .. .. .. .. I .. ·1 ..
.. .. I .. ..
OIl ..
91.4 -------~~ m ~
N
1
DRAIN USE
OUTLETS

15
to take samples from weirs at the outflow of each drain.
Samples were taken most frequently during periods of drain
discharge after rainfall events. All water samples were
frozen and stored for later analysis.
Soil solution samplers were constructed of medium po
rosity Pyrex glass discs permanently glued to the bottom end
of various lengths of 3/4 inch PVC pipe. Rubber stoppers
were placed in the top end of the pipes to provide an air
pressure seal. The fritted disc samplers were placed at 4
soil depths - 60,75, 90, and 105 cm - and at 6 horizontal
distances from the central drain - 5, 50, 100, 350, 500, and
900 em - along one row of citrus in each plot. Hand
operated air pumps were used to apply approximately 80 cm of
water to each solution sampler during sampling periods. The
samplers were stoppered for 4 to 6 hours to enable extrac
tion of 25 to 100 cm3 of water depending upon the water con
tent of the soil. Solution samples were taken 57 (August
1), 69 (August 13), and 76 (August 20) days after fertilizer
application. Samples were frozen and stored before
analysis.
Soil water suction was determined from mercury
manometer-type tensiometers located at 4 soil depths - 30,
60, 90, and 105 cm - and 6 horizontal distances - 5, 50,
100, 350, 500, and 900 cm - from the central drain in each
treatment. The tensiometers were located along one row of
trees in each plot. Water inside the tensiometers made hy
draulic contact with water in soil pores through a porous

16
ceramic cup at the bottom of each tensiometer. Mercury
manometers permitted measurements of water suction of soil
water.
A hydraulic coring machine was used to take continuous
soil cores down to a depth of 70 cm in the ST plot and to a
depth of 100 cm in each of DT and DTL plots. The holes in
the soil profile were later refilled with inert builders
sand to prevent preferred water flow to drain tubes. Each
core was divided into subsamples corresponding to depths of
0-8, 9-23, 24-38, 39-53, 54-70, 71-84, and 85-100cm. The.
subsamples of soil were frozen and stored until analysis
could be perform. Twelve cores were removed from each of
the tree plots on dates corresponding to 12 (June 15-16), 42
(July 16-17), 75 (August 19-20), and 134 days (October
16-17) after the initial surface application.of labelled
fertilizer. Six of the twelve cores from each plot were
taken near each drain and the remaining cores were taken
from 450 cm lateral distance from each drain. A total of
912 soil samples were collected and analyzed for this inves
tigation.
Leaf samples were collected from six r.ootstock vari
eties for both grapefruit and orange trees once during July
and again in October. The·samples were ground ina Wiley
mill and frozen until analysis could be performed.
All water samples were thawed and analyzed for pH using
a glass electrode, N0 3-N concentration using a nitrate spe
cific ion electrode, NH4~N concentration using the phenolate

17
(EPA 1976) method, and soluble salts using an electrical
conductivity meter. The remaining volume of each sample was
measured. and analyzed for NH 4-N and N03-N using a
.macrokjeldahl procedure (Bremn·er 1965). Soil" samples were
also thawed, extracted with water and 1 N KCl and both
extracts analyzed similarly to that for the water samples.
Leaf samples were dissolved in concentrated H2S04 for total
analyses and the solutions analyzed for N0 3-N and NH 4-N.
After titration, samples containing more than 1.0 mg N were
redistilled by microkjeldahl apparatus into 5 ml of 4% boric
acid and 1 ml of 0.08 N sulfuric acid. Reagent grade
ammonium sulfate was added to all other samples in "order to
increase the N content to 1.0 mg per sample". These solu-
tions were analyzed in duplicate for isotopi.cal ratios
15 14 " Nl N by an automated mass spectrometer at the Los Alamos
National Laboratory near Los Alamos, New Mexico. Isotopic
. () 15 . ( rat lOS for reagent grade NH4 2S04' N-depleted NH4)2S04'
and for soil samples taken from soil that had only been fer-
tilized with unlabelled N materials were used along with the
ratios from the samples to calculate the percentages of" N
derived from the 15N-depleted fertilizer. Approximately
1300 samples of water, soil "extracts, and leaf extracts were
analyzed for isotopic N ratios. Concentrations of labelled
and total N were expressed as mg N/liter of effluent.

18
Chapter 4: Results and Discussion
The shallow tillage (ST) treatment of the Spodosol
located at the SWAP citrus grove is representative of agri-
cultural management practiced on vast areas of similar acid,
sandy soils in Florida. Water and nutrient retention capac
ities of soil in the ST plot (Mansell et ale 1977) have been
demonstrated to be very limited. Recommended cultural prac
tices for agricultural crops growing on this and similar
soils include split application of fertilizer throughout the
growth season and frequent application of relatively small
quantities of water during periods of drought or limited
rainfall. Because of subsurface horizons with low
permeability for water and relatively flat terrain, artifi
cial drainage is often needed to maintain an aerobic root
zone during periods of high rainfall. Because of the high
values of hydraulic conducti vi ty when these s.oils are
water-saturated (Mansell, et ale 1980) rapid rates of drain
age tend to enhance leaching losses of fertilizer nutrients
such as nitrogen.
Deep tillage (DT and DTL treatments) of this soil has
been observed (Mansell et ale 1977) to increase the nutrient
retention capacity by increasing the cation. exchange capaci
ty, to increase the water retention capacity by incorporat
ing colloids from an underlying Spodic horizon, and to
decrease rates of nutrient leaching loss by decreasing
drainage discharge rates. Although this treatment is expen
sive and requires the presence of a subsurface layer high in

19
colloid content, selective deep tillage over limited. soil
zones only in the vicinity of crop rows offers a potential
conservation practice for applied irrigation water and fer
tilizer.
As expected, the subsoil pH in the ST plot was observed
~uring this study (Fig. 3) to be considerably lower than the
DTL plot but higher than the DT plot.. The pH of the top
9 cm of the DTL soil profile was relatively uniform with a
value of about 6.i. The higher pH of the DTL soil is attri
butable to the original incorporation of limestone prior to
the~eep tillage operation. Annual applications of lime
stone however were shown to result in pH values near 6.0 for
the surface soil of all three treatments. These acid, sandy
soils have a predominance (Fiskell and Calvert, 1975) of
variable-charge colloids such as organic matter, iron
oxides, and aluminum oxides; therefore application of lime
stone tends to raise the cation exchange capacity. The
higher pH of the surface soil of ST and DT plots and the
higher pH of both surface and subsurface soil zones in the
DTL plot should therefore preferentially favor microbial
nitrification of applied fertilizer NH 4-N as opposed to the
more acid subsoil conditions of ST and DTL plots.
During the period of this study soil water content
generally was higher between 60 to 90 cm depths (Fig. 4)
than in the uppermost 30 crn of the profi.les for all three
tillage treatments. During periods of drainage discharge
this was particularly true and the subsoil of the deep-

20
Fig. 3: Distributions of soil pH with depth measured on
June 18, 1980 for ST, DT, and DTL tillage
treatments.
SOIL pH 7.0 I 6,0 5P. • 4P.
01
/' /~( 101
20-1 /\ \ 30 I , , , ......, I
tt \ \ \
ST~\
) 80i \
/ • 90"
100

21
Fig. 4: Distributions of soil water content (% by weiqhtl
with depth on June 15, 1980 for ST, DT, and DTL
tillage treatments.
SOIL WATER CONTENT~lo by wt) 00 ?' 4 6 8 1P 1,2 14 1p 18 2,0 2,2 2~ 26 2,8 I fa ...
JULIAN DAY167 10~ ~ " / (15 JUNE 1980)
20
30
.,..... E40 .~
~ 0.. W 01 .-I.
O· If)70
'\

22
tilled plots had generally higher water contents than di~
the shallow-tilled plot. The water-unsaturated condition of
the surface soil in all of the treatments however should
tend to enhance nitrification of applied fertilizer. Previ
ous research (Mansell et ale 1977) has also shown that the
actual water retention capacity of the shallow tilled soil,
in'the ST plot is generally much less than that in deep
tilled soil in DT and DTL plots.
Soil water pressure head values for a 10-day period in
October also indicate that the soil at 90 cm depth was drier
in the ST (Tables 1, 2 and 3) plot versus the DTL plot.
Pressure head values were generally slightly negative in ST
whereas the values were positive in DTL. Negative pressure
heads in the DT, soil however indicated that DT soil was
drier than the DTL soil.
Volatilization losses from applied fertilizer (Table 4)
averaged approximately 0.31 kg/ha of NH4-N for all 3 plots
during the first two months after application of fertilizer.
Losses were 0.24, 0.25, and 0.42 kg/ha of NH 4-N respectively
for ST, DT and DTL plots. Based upon this information we
conclude that volatilization losses of N were sufficiently
small to be insignificant.
The original intent of this investigation was to evalu
ate leaching loss of fertilizer N during a typical summer
rainy period when large quantities of water moved through
the soil to subsurface drains. However, an unexpected
drought occurred during 1980 such that the summer and fall

23 .
Table 1: Soil water pressure head(cm of water) at 0.9 m
depih and lateral distances of 0, .0.5, 1.0, 3.5,
5.0, and 9.0 m from the center drain tube in the
ST plot for 10 days in October 1980.
Lateral Date Distances: 0 0.5 1.0 3.5 5.0 9.0m
- - - - (cm of water) _. - -
. October 20 -6 -8 0 0 -12
II 21 -9 -8 0 0 -12
" 22 -8 -10 -1 +1 -12
II 23 -3 -8 0 -1 -1
" 24 -6 -8 0 -1 -12
II 27 +14 +24 +2 +9
" 28 -10 -12 -4 -2 -12
II 29 -14 -14 -6 -4 -12
II 30 -13 -15 -6 -4 -13
II 31 -16 -17 .... 8 -6 -16

24
Table 2: Soil water pressure head (em of water) at 0.9 m
depth and lateral distances of 0, 0.5, 1.0, 3.5,
5.0, and 9.0 m from the center drain tube in the
DT plot for 10 days in October 1980.
Lateral Date Distance: a 0.5 1.0 3.5 5.0 9.0m
- - - (em of water) - - - ...... -
October 20 -5 -15 -14 -10 -6 -5
" 21 -5 -15 -15 -10 -10 '-5
II 22 -3 -15 -14 -8 -5
" 23 -3 -14 -14 -9 -5
" 24 -3 -15 -14 -8 -4
,II 27 -2 -16 -14 -10 -7
II 28 -2 -15 -16 -10 -8
" 29 -2 -16 --18 -12 -10
II 30 -4 -16 -12 -10
" 31 -4 -20 -14 -10

25
Table 3: Soil water pressure head (cm of water) at 0.9 m
<, depth and lateral distances of 0, 0.5, 1.0, 3.5,
5.0, and 9.0 m from the center drain tube in the
DTL plot for 10 days in October 1980.
Lateral Date Distance: 0 0.5 1.·0 3.5 5.0 9.0m
October 20 +16 +8 +9 +16 +14 +16
" 21 +26 +16 +9 +16 +14 +16
" 22 +16 +8 +10 +14 +11 +16
" 23 +17 +8 +10 +16 +14 +17
" 24 +17 +6 +10 +14 +14
" 27 -9 -12 +9 0
" 28 +16 +3 +2 +8 +8
" 29 +14 +4 +10 +8 +6
" 30 +14 +12 +2 +8 +5
" 31 +14 0 0 +8 +4

26
Table 4. ' Volatilization of NH3 from surface-applied
fertilizer during 1980 as measured by sorption of
Starting Date
June 6
June 10
June 18
June 24
July 1
July 21
Total
*
NH 4-N in containers (cross-sectional surface area.
of 178 cm2 per container). Effective volatiliza-
tion losses of NH 4-N are given as averages for
each plot.
* Sorption Treatment Plots Period ST DT DTL Mean
(days) ------ (kg NH4-N/ha) - - - - -
4 0.0455 0.0371 0.0680 0.0500
8 0.1219 0.1191 O. i427 0.1612
6 0.0197 0.0230 0.0331 0.0253
7 0.0191 0.0169 0.0208 0.0185
20 0.0185 0.0157 0.0197 0.0180,
7 0.0185 0.0416 0.0404 0.0337
0.2432 0.2534 0.4247 0.3067
These values were calculated by dividing measured amounts
of NH4-N sorption per'container 9 NH 4-N/178 cm2 ) by the
conversion factor 1780.
".

t.
27
periods received less rainfall than during normal years.
Total rainfall plus irrigation was only 84 cm during the 196
day (Fig. 5) period between June 18 and December 3. The
rainfall distribution (Figs. 6-11) was such that periods of
net drainage discharge were intermittent during the time of
this study. For the ST, DT, and DTL plots, discharge
occurred during the periods from Jun~ 21 to July 3 (Julian
Days 173 to 185), July 13 to August 2 (Julian Days 195-215),
November 10 to December 5 (Julian Days 315 to 340), and
December 20 to 30 (Julian Days 355 to 365). Water discharge
occurred from the drains for approximately 67 days of the
.196 'day period. Drainage rates were obviously highest for
the shallow tillage plot. Total drainaqe from ST was 30.7
cm (Fig. 6) which amounts to only 37% of the total amount of
rainfall plus irrigation. Thus roughly 63% of the input
water for the 196 day period was assumed to be used during
evcq)otranspiration. Total drainage amounts for DT and DTL
deep-tilled plots were however much less than for ST being
only 5.6 (7%) and 8.5 (10%) cm, respectively. Evapotrans
piration was therefore assumed to account for roughly 93 and
90% of the input water for DT and DTL plots. The evapo
transpiration estimates assume no vertical deep seepage
water loss and only small changes in soil water storage.
Water fluxes or drainage rates were much greater for
the shallow-tilled plot than the deep-tilled plots. For all
drains the maximum water fluxes occurred during November
(Figs. 9, 10, and 11) with values of 3.0, 0.6, and 1.5

Fig. 5:
,.-...
E ~ z o ~ <.9 0::: 0:::
c6 Z
~ W > ~ ....J => 2: => u ~
84
72
60
48
36
7.8
Accumulative amounts (em) of rain ilnd i~rigation
between June 18 (Julian Day 170) and December 31 ..
(Julian Day 366).
JULIAN DAYS

29
Fig. 6: Accumulative Ctrainage (m3 /ha) from the ST tillage
treatment over the period from June 18 to December
31, 1980.
,.-..... CU·
...c -('I') E2800
'-'"
W ~2400 Z
~2000 o ~ 1600 <{
o 1200 W > - 800 t( ..:.J ::J 400 2:
.::J
~
. JULIAN DAYS 180 200 220 240 260 280 300 320 340 360 i' ,.. • •
ST SOIL

Fig. 7:
..--.... ro
..c:: M-
30
Accumulative drain<1.qe (m3 /ha) from thE~ D'l'
treatment over the period from ,-Tune 18 to December
31, 1980.
JULIAN DAYS 180 200 220 240 260 280 300 320 340 360
, •• ••• i • • • , i ' i'
E 560 r .
"--' W .~ 480
Z <{ 400 0:: o ~ 320 <{ 0240 W > - 160 ~ -1 ~80
DT SOIL
-A·
~
U O-hG'P"'"':-~--==~====~==-----~ ~
~

31
Fig. 8: Accumulative drainage (m3 /ha) from the DTL
treatment over the period from June 18 to December
31, 1980.
JULIAN DAYS ,....... 180 200 220 240 260 280 300 320 340 360 CU ' , , ..c -("') E 840 ........... W ~ 720 Z <! 600 l DTL SOIL 0:: o ~480
<! 0 360 W > ~ 240 ....J ::::> 2 120 ::::> U o-~~----------------~--------------~ U· <!

Fig. 9:
>, 280 tU -0 ....... tU 240 .s:::. ....... E 20
~ 16011
.-.J LL 120
0:: w I« 3:
8
32
. . 3 Drainage flux (m/ha/dRY) from the ST treatment
over the period from June 18 to Decemb~r 31, 1980.
JULIAN DAYS 180 200 220 240 60
ST SOIL

33
Fig. 10: Drainage flux (m3 /ha/day) from the DT treatment
over the period from June 18 to December 31, 1980.
~.----- --- .. _._--_. __ .. _----.---> - -------------.-.~-.----- ........ ---- .. ---.--.-------------.-.------ ---. . -----_. __ ...
JULIAN DAYS
t80 200 220 240260 280 300 320 340 360 •
56 ~ as
-,::J .
48
" as ..c
40l " DT SOIL (")
E
32 .x :::> ...J 24 LL.
a:: W 16 ~ . . « 3: 8

Fig. 11:
140 >, cU'
-,::J I 20 "
.~ loot C")
.. E I I
sol .X : ::::> .....J so IJ...
:0:: W 40 t- I '
34
Drainage flux (m3 /ha/day) from the DTL treCltment
over the period from ~Tune 18 to Dece"!tlber 3], 1980.
JULIAN DAYS
I SO, ,200 220 240 2S0 2S0 300 320 340 3S0 , ; • i U, i , cUi
. DTL SOIL
~,'. . 20r~ 0

35
cm/day respectively for ST, DT, and DTL plots. Drainage was
very sma.ll during the summer period for the deep tillage
plots.
Drainage outflow through subsurface tubes has been con
sistently greater for all shallow tillage (ST) treatments at
the SWAP citrus grove than from both deep tillage (DT and
DTL) treatments. Mean annual drainage discharges over the
~O'year period from 1971 through 1980 (Dr. J. S. Rogers.
1982. private communication.) for ST, DT, and DTL treat
ments were 55.4, 33.3, and 28.9 cm.
As expected, the highest concentr~tions of N (the sum
of NH4-N.pluSN03-N) in the drainage water occurred during
the first 2 months after application (Figs. 12, 13, and 14)
of fertilizer. For ST drainage water, maximum N concen
trations of 25 and 11.7 mg/l occurred during 25 and 48 days
after fer.tilization.. For DT soil, maximum N concentrations
of 8.2 and 10.3 mg/1 occurred during 20 and 27 days after
ferti1izati·on. For DTL soil, maximum N concentrations of
6.0 and 13.4 mg/l odcurred 20 and 26 days after fertiliza
tion. Thus N concentrations in drainage water were general
ly higher inST (Mansell, et ale 1980) than for the deep
tilled plots (DT and DTL). The higher N concentrations in
the drainage is largely attributable to the low cation ex
change capacity of this soil. Concentrations of N were
lower during the fall versus the summer for DT and DTL
drainage waters. This observation was true except for an
unexplainable peak that occurred during the latter part of
December.

36
Isotopic N analysis indicated (Figs. 12, 13, and 14)
15 that N from the N-depleted fertilizer accounted for as
much as 50% of the N in drainage water that occurred during
.the summer. This was true for all three plots. The
percentage of N attributable to the labelled fertilizer
decreased .with time during the season. For· example on
November 15 (163 days after application of the ·fertilizer)
15 percentages of N due to the N-depleted fertilizer were 20,
17, and 25% respectively for ST, DT and DTL soils. This
data implies that much of the N being discharged through the
drains was due to residual N from mineralization of soil
org~nic matter. and from previous applications of fertilizer.
Values of nitrogen flux through the drains were cal-
culated by multiplying water flux and N concentrations for
each day that drainage occurred •. This data (Figs. 15, 16,
and 17) indicate that rates of N discharge were greater in
the summer than in the fall for .the shallow tillage treat-
ment, but were greater in the fall than in the summer for
the deep tillage plots. For the ST plot, rates of nitrogen
leaching losses as high as 0.850 kg/day were observed for 2
drainage events during the summer. Much smaller rates of
0.012 and 0.015 kg/day were observed for single summer
drainage events in each of DT and DTL plots. This informa-
tion further substantiates (Mansell et al. 1977) the effec-
tiveness of deep tillage in qecreasing N leaching loss in
these acid sandy soils. Measurements of the area beneath
the curves in Fig. 15 shows th~t total leaching losses of

37
Fig. 12: Concentration (mg/l) of extracted and labelled N
c o .- 8 +-' ro L
~6 OJ· u C4 o U
2
o
(NH 4-N plus N0 3-N) in drainage water from the ST
plot over the period from June 18, 1980 to
February 14, 1981.
Julian Days 180 200 220 240 260 280 3 320 340 360
ST Soil
.-. N03-:N + NH4-N .---. Labelled N
_--A---_____ \-----"'1---· . ----_ .. 1------- 1-. - .. ------- .. -------- --.

38
Fig. 13: Concentration (mg/l) of extracted and labelled
24
20 -13 .-.J --.12 0)
E --10
c o ~8 <U L
~6 <1.>.
u t::4 o U
2
o
N(NH4-N plus N03 ':"N) in drainage wa.ter from the DT
plot over the period from June 18, 1980 to
Februa.ry 14, 1981.
Julian 240
Dr Soil ._. N03-N + NH~N
._--. Labelled N
---------------

· 24
'-"
10 c o .- 8 +-' CU . L +-'6 c Q) u c4 o U
2
o
39
Fig. 14: Concentration (mg/l) of extracted and .labelled
N(NH4-N plus N0 3-N) in drainage water from the DTL
plot over the period from June 18, 1980 to
February 14, 1981.
Julian 180 200 2 0 240
" I .'1
I
DTL Soil .-. N03-N + NH4-N ._-_. Labelled. N
___ lvL J-----vL --\~--...... -- - -''''- - - - - -'"--- - - ---, ...... -

40
Fig. 15: Flux (g/ha/day) of extracted and labelled N(NH 4-N
plus N03-N) in drainage water from the ST
treatment over the period from June 18 to December
~ 840 CU -g
" CU 720 ..&:;
"-0)
600
X ::> 480 ~ lJ..
Z 360 W (!)
0 240 0::: ~
Z 120
0
31, 1980.
JULIAN DAYS
180 200 220 240 260 280 300 .320 340 360
II /I II
II
I,
II
I I
I I
I II I
\
ST SOIL eN0 3 -N+NH 4 -N
• LABELLED N
- --.-.---~~ ---...:---'
- .--,-_._-- -- -- ----- ---- -.- "- ---

41
Fig. 16: Flux (g/ha/day) of extracted and labelled N(NH4-N
plus N03-N) in drainagewat.er from the DT
. treatment over the period from June 18 to December
31, 198"0.
JULIAN DAYS
ISO 200 220 40 260 280 300 320 340 360
~ 2S tU
"'0 , .24 tU
.c , Q
20 DT SOIL
X eNOa-N+NH .. -N. ::::> 16 -LABELLED N ;..J I.L.
Z 1·2 LLJ. (!)
0 ·S 0:: ~
Z __ -e

42
Fig. 17: Flux (g/ha/day) of extracted and labelled N(NH4-N
plus N03-N) iIi drainage water from the DTL
treatment over the period from June .. 18 to December
31, 1980.
JULIAN DAYS
180 200 220 240 260 280 300 '320 340 360
~ 112 as ~
" as 96 .&:.
" DTL.$OIL IC)
80
X ·N03-N+f.'IH4~N
::> 64 • LABELLED N ....J LL
Z 48 W (!)
0 32 c::
t-Z

43
total and lab~lled N were 9.10 and 4.34 kg/ha, respectively,
for the first 196 days after application of the fertilizer.
Thus 48% of the N discharged from the ST drain was attribut-
15 able to the N-depleted (NH4)2S04. Total leaching losses
of N in drainage from the deep-tilled plots were extremely
small.
Distributions of total and labelled·NH4-N with soil
depth are shown for each of the three plots in Figs. 18, ·19,
and 20 for dates corresponding to 12, 42, 75, and 134 days
after application of the fertilizer. For the deep-tilled
plots, NH4-Ncontents in the soil profile were low in com
parison .to those for the shallow-tilled plot. Total NH 4-N
quantities in the soil 12 days after fertilization (Table 5)
were 142.0, 25.9, and 71.4 kg/ha, respectively, for ST, DT,.
and DTL plots. After 42 days from fertilization quantities
of NH4-N had decreased to 57.3, 8.5, and 19.3 kg/ha for ST,
D'l' and DTL plots.. This. data suggests that much of the NH4-N
applied to the deep-tilled plots was either converted to
N03-N during ni"t7rification and/or absorbed by plant roots
from citrus orbahiagrass since volatilization and leaching
losses of N wer~ extremely small. Distributions of total
and labelled ~03-Nin the soil {Figs 21, 22, and 23) do in
fact suggest that nitrification of applied NH 4-N occurred.
A sandy soil in British Columbia, Canada with relatively low
organic carbon content was shown by Kowalenko (1980) to sup
port suprisingly high microbial activity for N transfor
mations. Between 12 and 42 days after fertilization, quan-

44
Fig. 18: Distributions of extracted and isotopLcally
labelled NH4-N in the ST soil profile rluring 1980.
for dates corresponding to 12, 42, 75 and 134 days
after fertilization.
NH4,"N (/l9/ 9) 00 5 10 15
10
/ /
;. /
/ ~. x
:r: 30 I. t- / a.. / w 40 I o· / ... J / x 0 50 / CJ) /
60 I /
:r: ~30 W 0 40 ...J
6 CJ) 50
60
16 JUKE
ST
X EXTRACTE-D • LABELLED·
19 AUGUST
ST
20
X EXTRACTED: • LABELLED
70L-------------~
NH -N (/lg/g) . 4 .
00. 5 10 15
~ 10 \
\ ., E 20 ,
~ I ~ 30 I. a.. , ~40, 16 JULY
ST
20
...J 1 0 50 , CJ) ,
X EXTRACTED . • LABELLED
60
70~----~----~~
NH4-N (/lg/g) 00 5 10 15 20
10 ,...,. E ~20
:r: t- 30 a.. w o ...J 40
o CJ) 50
60
" ~
16 OCTOBER
ST
X EXTRACTED • LABELLED
70~------------~

Fig. 19:
45
Distributions of extracted .and isotopically
labelled NH 4-N in the DT soil profile during 1980
for dates corresponding to 12, 42, 75, and 134
days after fertilization.
NH4-N (lIg / 9) NH4- N (jlg/g) 00 5 10 15 20 00 5 10 15 '20
10 10
20
,po ... ~
::I: 40 16 JUNE ::I: 40 16 JULY
~ DT ~ OT no no w 50 x EXTRACTED W 50 X EXTRACTED 0 • LABELLED 0 • LABELLED
:! 60 0
:! 60 0
C/) C/)
10 10
80 80
90 90
100 100 NH4-N (1I9 / 9) NH4-N (1I9/ 9)
00 5 10 15 20 5 10 1·5 20
10 I
20
e 30 ,... .., '-" e ::I: 40 19 AUGUST ... 40 16 OCTOBER '-"
I- OT ::I: x OT no w 50 ~ 50 0 )( EXTRACTED no )( EXTRACTED
• LABELLED W • LABELLED -l 0 0 60 -l
60 C/) 0
70 C/) 70
80 80
90 90
100 -- 100 ----

Fig. 20:
46
Distributions of extracted and isotopically
labelled NH 4-N in the DTL soil profile during
1980 for dates corresponding to 12, 42, 75, and
134 days after fertilization.
NH4-N <1I9/9) NH4-N (llg/g)
00 5 10 15 00 5 10 15 20
"/ 10 I
10 I I / · x
20 / 20 / I
E 30 I • x
u I v
:r:: 40 / 16 JUNE :r:: 40 16 JULY
I- • OTl I- OTl a.. a.. W 50 x EXTRACTED W 50 X EXTRACTED 0 • LABELLED
0 I • LABELLED ..J ..J (560 <5 60 en en
70 I 70 I
80 80 t 90 90 I
100 100 NH4 -N <lIg/g) NH4-N (llg/g)
0° 5 10 15 20 00 5 10 15 20
x 10 10
20 I 20
,... 30 30
,§ I ,.... E
19 AUGUST u 160CT08ER :r:: 40 "'" 40
I- OTl :r:: OTl a.. I-~ 50, )( EXTRACTED a.. 50 x EXTRACTED
• LABELLED W • LABELLED
:::! 60 0
0 ..J 60 en (5
70 en 70
80 80
90 90
100 100

47
rig. 21: Distributions of extracted and isotopically
labelled N0 3-N in the ST soil profile during 1980
for dates corresponding to 12, 42, 75, and 134
days after fertilization.
N~-N ,<~g/g) N03~N . (~g/ g) O· 5 10 15 00 5 10 15 20 25
0
10
" E 20 u· ,
\oJ
:I: 30 I-0. \ 16 JUNE IJ.J 40 16 JULY
ST C I ST ..J •
x EXTRACTED 0 50 I X EXTRACTED
• LABELLED en I • LABELLED
I .60.
70
N03-N· <f.lg/g) 20 00 5 10 15 ·20
10
" E 20 u
\oJ
:I: 30 I-0.
19 AUGUST I.IJ 40 16 OCTOBER C
ST ST ..J x EXTRACTED ~ 50, X EXTRACTED
• LABELLED
60 1 • LABELLED
70 70

Fig. 22:
48
Distributions of e~tracted nnd isotopically
labelled N03-N in the DT soil· profile during 1980
for dates corresponding to 12, 42, 75 and 134 days
after fertilization.
N0:3-N (1I9 / 9) 00 . 5 10 .15 20
10
20
~ (560 (/)
::t: 40 l-0. W 50 0 ~ (560 (/)
70 I
80 I
90.
100
x
16 JUNE
DT
X EXTRACTED • LABELLED
N0:3-N (1I91 g) 5 10 15 20
19 AUGI.lST DT
X f:XTRA.CTEO • LAB£LLED
20
" E 30 ... '-l
::t: 40 ~ Q.. W 50 o ~ (560 (/)
70
80
90
N03-N (~gl gl . 5 10 15. 20
16 JULY
DT
X ExTRACTED • LABELLED
N03-N (1I9/ 9) 5 10 15 20
160CT08ER DT-
X EXTRACTED • LABELLED
100L-------------~
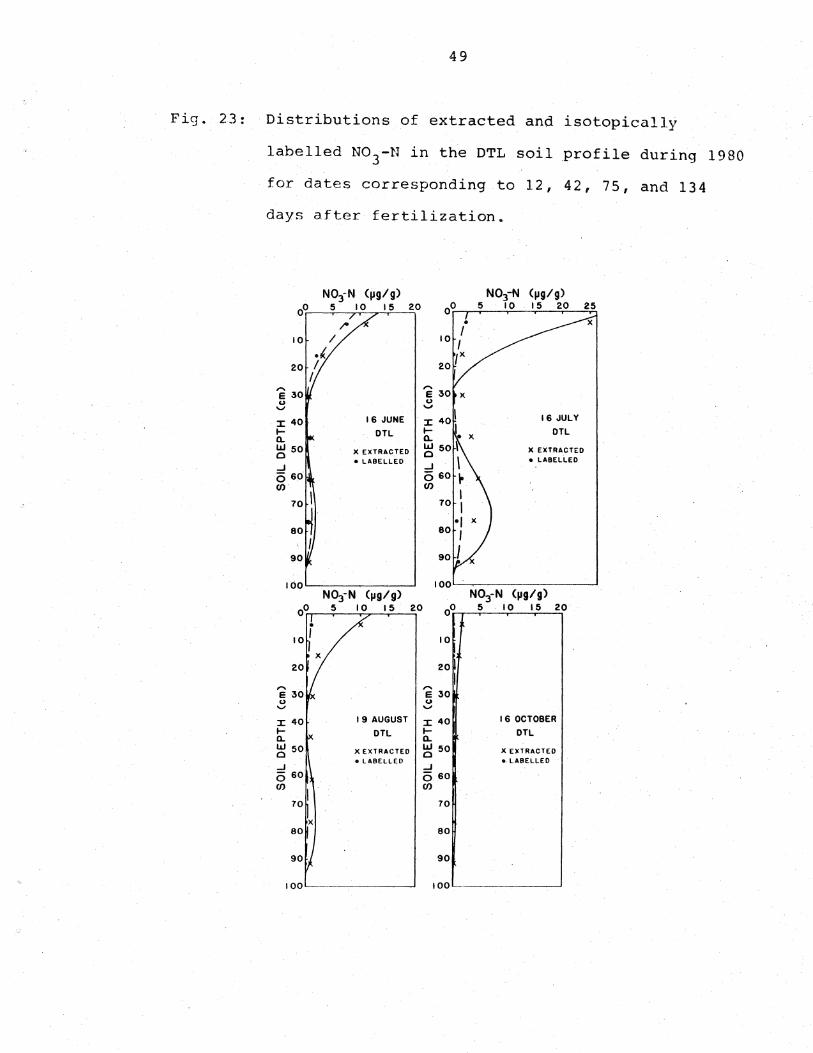
Fig. 23:
49
Distributions of extracted and isotopically
labelled N0 3-N in the DTL soil profile during 1980
for dates corresponding to 12, 42, 75, and 134
days after fertilization.
10
...J (560 en
70 I x
80
90
100
N03-N <1I91 g) 5 10 15 20
16 JUNE
OTL
X EXTRACTED • LABELLED
19 AUGUST
OTL
x EXTRACTED • LABELLED
20
...J (560 en
70
N03-N (lIgl g) 5 10 15 20
16 JULY
OTL
X EXTRACTED • LABELLED
25
100~~--------~--~~
N03-N (1I9/ 9) 5 10 15 20
10
20
,.., E 30 u
'"" ::I: 40 16 OCTOBER t- OlL CL.
~ 50 X EXTRACTED • LABELLED
...J (560 en
70
80
90
100

50
tities (TableS) of total N03-N in the soil increased con
siderably for all treatment p16ts ~n this study but less
d~amatically for the DT soil. After 42 days, the N03-N
quantit~es decreased with time for all treatments probably
due to uptake by plant roots.
Quantities of the soil N due to the applied lSN_
depleted fertilizer are given in Table 6. Twelve days after
fertilization the sum of the labelled NH 4-N and N03-N in the
soil represented 105, 28, and 54% of the fertilizer, respec-
tively, for ST, DT and DTL plots. The low recoveries of la-
belled N in the deep-tilled soils imply that roo~ uptake of
N was much faster during the first 12 days after fertilizer
application than in the ST soil. This deduction assumes the
extraction procedure was 100% effective for DT and DTL
soils. The ratios cif N03-N to NH 4-N for the labelled N in
the soil were 0.2, 1.5, and 0.5 respectively for ST, DT, and
DTL plots. The larger ratios for the DT and DTL plots
suggest that nitrification occurred more rapidly in the
deep-tilled soils than in the shallow-tilled soil during the
first 12 days after fertilization. After 42 days of elapsed
time these ratios were 1.0, 7.8, arid 7.2 for ST, DT, and DTL
plots. These dramatic increases of the N03-N/NH4-N ratios
over a 30-day period indicate that nitr£fication occurred in
all soils. After 134 days of elapsed time, quantities of
labelled N in all soils were less than 3% of the applied
fertilizer, and the ratios of N03-N/NH4-N for ST, DT and DTL
plots were 1. 9, 0.6, and 0.9 respectively.
..

51
Table 5. Mean quantities of extracted NH 4-N and N03-N in
soil profiles from ST, OT, and DTL tillage treat~
Time
ments on dates corresponding to 12, 42, 75, and
ST
134 days after application of 115 kg/ha of
15 N-depleted NH 4-N on June 5, 1980.
NH -N 4 NO -N 3 --B.!!4-N + N03::L.
DT DTL ST DT OTL ST DT DTL (elapsed days)-----(kg/ha)----- ----(kg/ha)----- ------(kg/ha)----
12 142.0 25.9 71.4 40:8 50.6 33.4 182.8 76.5 104.8
42 57.3 8.5 19.3 96.3 58.1 77.3 153.6 66.6 96.6
75 12.2 5.6 14.4 23.9 26.0 30.7 36.1 31.6 45.1
134 10.5 20.5 17.4 19.7 12.1 9.5 30.2 32'.6 26.9

52
Table 6. Mean quantities of isotopically labelled NH4-N and
N03~N in soil profiles from ST, DT, and DTL
tillage treatments on dates corresponding to 12,
42, 75, and 134 days after application of 115
15 kg/ha of N-depleted NH4-N on June 5, 1980.
NH -N 4 NO -N 3 NH -N --4 + N03~
Time ST DT DTL ST DT DTL ST DT DTL (elapsed-days)~-~--(kg/ha)----- -~---(kg/ha)---- -----(kg/ha)-----
12 102.6 13.2 42.7 17.6 19.2 19.7 120.2 32.4 62.4
42 .11. 9. 0.8 2.0 11.5 6.2 14.3 23.4 7.0 16.3
75 1.8 1.0 1.1 3.7 5.6, 3.5 5.5 6.6 4.6
134 1.1 1.9 . 0.9 2.1 1.1 0.8 3.2 3.0 1.7

53
The distributions of total N03-N content in the soil
(Figs. 21, 22 and 23) imply that some downward movement oc
curred through the profile during leaching but that a sink
possibility uptake by plant roots had extracted fertilizer N
from the soil of each of the tillage treatments. Dis
tributions of the sum of N03-N and NH 4-N (Figs. 24, 25 and.
26) also support that hypothesis. Results from the drainage
discharge of N however show that the leaching loss was quite
small during the 6-month period of this study. Previous in
vestigators (Calvert et ale 1977) have shown that citrus
root systems are generally shallower and less extensive in·
the profile for shallow-tilled versus deep-tilled DTL soil.
Thus one should expect more extensive N uptake from citrus
trees growing in DTL soil profiles compared to ST.
Due to the lack of rain and the ·c.orresponding lower
water content of the shallow-tilled soil compared to the
deep-tilled soil, only a very limited number of soil
solution samples were collected during August. Despite the
very small number of samples reported in Tables 7-9, N03-N
was definitely the predominant form of N in the ST soil so
lution. The decrease of the geometric mean concentration of
labelled N with time over this 19~day period implies that
nit~rification occurred. The decrease of the geometric mean
concentration of labelled N implies that plant uptake of N
actively occurred during this period. Samples were more
eaf!ily extracted from the generally wetter DT and DTL soils
as shown by the N concentrations in Tables 10-15. Geometric

Fig. 24:
54
Distributions of extracted and labelled NH 4-N plus
N03-N in the ST soil profile during 1980 for 12,
42, 75, and 134 days after fertilization.
N03,N + NH4-N (lIgl g) N03-N + NH4-N (lIgl g)
0 10 0
20 30 40 10 20 30 40
/.
10 / /
.f x 20 I
....... / " I E / E u u
I '-' t. '-'
::r:: 30 ::r:: 30 • 1-. I l- I a.. f. a.. I UJ 16 JUNE-ST UJ 16 JULY- ST 0 40 f 0 40
I ...J .f x ...J 6 X EXTRACTED 6 . X EXTRACTED (J)
50 I • LABELLED (J) 50 I • LABELLED
I I /
60 ! 60 I . 70 -----.~ - -.----~.- 70
N03-N. NH4-N (lIgl g) N03-N+ NH4-N (1I9 / 9) 20 30 40 10 20 30 40.
20 '"' '"" E E u u '-' '-'
::r:: 30 ::r:: 30 l- I-a.. a.. IJ.J 19 AUGUST- ST IJ.J
40 16 OCTOBER-ST 0 40 0 ...J ...J 6 X EXTRACTED 6 X EXTRACTED (J) 50 • LABELLED (J) 50 • LABELLED
60
70 70 _._---

Fig. 25:
55
Distributions of extracted and labelled NH 4-N plus
N03-N in the DT soil profile during 1980 for 12,
42, 75, and 134 days after fertilization.
N03-N+ NH4-N (~g/g) N~-N + NH4-N (~g/ g)
00 10 20 30 40 "1(" 30 40
10
x
20
30 ~ '" 'E E " " v v
16 JULY-DT 40 16 JUNE-DT 40 :c :c l- I-0.. X EXTRACTED 0.. X EXTRACTED W • LABELLED W • LABELLED 0 50 0 50 ..J ..J 6 6 (J) 60
(J) 60
70 70 I x
BO 80
I 90 90 r 1
N~-N + NH4-N (~g/ g) N03-N • N'14-N (~g/ g) 10 20 30 40
'11' 20 30 40
10
x 20 20
30 30
'" '" E e .. ~ .... I 8 OCT08ER - DT 40 19 AUOUBT- DT 40 :c :c l- I-0.. )C, EXTRACTED 0.. X EXTRACTED W • LABELLED W
50 • LAI[LLtD 0 50 0
d I ~ 0
(J) 80 (J) 80
I 70 I 70
eo eo I
90 I 90
.. -------.-.. --... _._-

Fig. 26:
56
Distributions of extracted and labelled NH 4-N plus
N03-N in the DTL soil profile during 1980 for 12,
42, 75, and 134 days after fertilization.
N03-N· NH4-N (~gl g) NO)-N' NH4-N (~gl g)
00 10 20 30 40 40
10
20
30
'E 'E ~ ~
16 JUNE-DTL 40 :x: :x: l- I-a.. x EXTRACTED a.. l.IJ • LABEllED l.IJ C C ~o
...J ~ 0
CJ) 60 CJ)
70
I 80 80
90
N03-N. NH4-N (~gl g) N~-N+ N~-N (pg/g) 0
0 10 20 30 40 0 10
0 20 30 40
10
20
30
'E '"' E ~ -3
I 9 AUGUST - DTL 40 I 6 OCTOBER- DTl :x: :x: l- I-a.. x EXTRACTED a.. x EXTRACTED l.IJ • LABELLED l.IJ • LABELLED C 50 C 50 ...J ...J 0 0 CJ) 60 CJ) 60
70 70
x 80 80
90 90

57
Table 7. Concentrations (mg/l) of total and labelled N in
soil solution samples from 4 depths and 6 lateral
distances from the central drain in the ST plot on
August 1, 1980 (Julian Day 214). Geometric means
are shown in parentheses.
Total NH 4-N (0.15 mg:/ 1) Soil Lateral DeEth (em)
Distance (cm) : 5 50 100 350 500 900
60
75
90
105 0.38 0.06
Total N03-N (12.90 mg:/l) Soil Lateral DeEth Distance (cm) : 5 50 100 350 500 900 ( cm)
60
75
90
105 10.60 15.70
Labelled NH -N + NO -N (7.89 mg/l) Soil Lateral
4 . 3
Depth Distance (cm) : 5 50 100 350 500 900 (cm)
60
75
90
105 4.70 13.26

58
Table 8. Concentrations (mg/l) of total and labelled N in
Soil DeEth (em)
60
75
90
105
Soil DeEth (em)
60
75
90
105
soil solution samples from 4 depths and 6 lateral
distances from the central drain in the ST plot on
August 13, 1980 (Julian Day 226). Geometric means
shown in parentheses.
Total NH -N (0.32 mg/l ) Lateral 4
Distance (em) : 5 50 100 350 500 900
0.12 7.97 0.95
0.01 0.33
0.34
Total NO -N (12.78 mgt 1) Lateral 3
Distance (em) : 5 !;O 100 350 500 900
11.00 21.0 3.80
84.0 10.00
,...
5.90
__ ...,...."..--.,...---"...----...;;;L;.;.a...;.b...;.e...;;;lo.;.;.l;..;;.e-"-d----N ...... H 4 -N + N03 .... N (0.52 mg/1) Soil Lateral DeEth Distance (em) : 5 ~O 100 350 500 900 (em)
60
75
90
105
0.65
0.52
0.16
0.35

59
Table 9. Concentrations (mg/l) of total and labelled N in
Soil DeEth (cm)
60
75
90
105
Soil DeEth (cm)
60
75
90
105
Soil DeEth ( cm)
60
75
90
105
soil solution samples from 4 depths and 6 lateral
distances from the central drain in the ST plot on
August 20, 1980 (Julian Day 233). Geometric means
shown in parentheses.
Total NH -N (0.11 mg/l) Lateral 4
Distance (cm) : 5 50 100 350 500 900
0.98 0.25
0.01
0.07
Total NO -N (1.19 mg/l) Lateral 3
Distance (cm) : 5 50 100 350 500 900
1.2 2.70
3.30
0.19
Labelled NH4-N + NO -N (0.38 mg/l) Lateral 3
Distance (cm) : ·.5 50 100 350 500 900
0.54 0.74
0.83
0.06

60
Table 10. Concentrations (mg/l) of total and labelled N in
soil solution samples from 4 depths and 6 lateral
distances from the central drain in the DT plot on
August 1, 1980 (Julian Day 214). Geometric means
are shown in parentheses.
Total NH -N (0.50 mg/ l) Soil Lateral 4
DeEth Distance (cm) : 5 50 100 350 500 900 (cm)
60
75
90 0.60 0.49 0.12 0.33
105 0.83 0.93 0.48 0.91
Total NO -N (8.79 mg/l) Soil Lateral·
~ "'" , . 3
DeEth Distance (cm) : 5 50 100 350 500 900 (em)
60 ...
75
90 14.40 8.70 5.50 9.10
105 9.60 9.60 8.70 7.10
Labelled !'lH4.~N + N03 ...;N (4.80 m~/l) Soil Lateral DeEth Distance (cm) : 5 50 100 350 500 900 (cm)
60
75 .,..
90 8.30 7.25 3.28 5.51
105 5.77 8.31 5.36 4.68

61
Table 11. Concentrations (mg/l) of total and labelled N in
soil solution samples from 4 depths and 6 lateral
distances from the central drain in the DT plot on
August 13, 1980 (Julian Day 226). Geometric means
are shown in parentheses.
Total NH -N (0.12 mg/l) Soil Lateral 4
DeEth Distance (cm) : 5 50 100 350 500 900 (cm)
60 0.30
75 0.01 0.09 0.01 0.01 0.01 0.01
90 1.34 0.01 2.49 0.22
105 6.17 0.01 0.60 1.63 0.14 1.74
Total NO -N (9.62 mg/l) Soil Lateral 3
DeEth Distance (cm) : 5 50 100 350 500 900 (cm)
60 6.20
75 14.50 44.50 68.00 38.00 9.40 8.00
90 55.00 29.00 6.20 3.80
105 8.50 39.00 12.50 8.10 5.25 3.65
Soil Lateral Labelled NH4-N + N03-N ( 1. 71 mg/ l)
DeEth (cm)
Distance (cm) : 5 50 100 350 500 900
60 0.16
75 3.47 17.78 29.56 1. 87 0.79 0.20
90 22.46 12.61 0.43 0.10
105 3.51 15.55 5.69 0.48 0.45 0.13

62
Table 12. Concentrations (mg/l) of total and labelled N in
soil solution samples from 4 depths and 6 lateral
distances from the central drain in the DT plot on
August 20, 1980 (Julian Day 233). Geometric means
are shown in parentheses.
·Total NH -N (0.02 mg/l) Soil Lateral 4
DeEth Distance (cm) : 5 50 100 350 500 900 (cm)
60 - 0.01 0.01
75 0.01 0.01 0.01 0.01
90 0.01 0.01 0.01 0.01 0.13
105 0.01 0.01 0.54 0.74
Total NO -N (4.03 mg/l) Soil Lateral 3
DeEth Distance (cm) : 5 50 100 350 500 900 (cm)
60 1.05 1.90
75 18.00 40.00 1. 60 1. 60
90 23.50 52.50 5.75 2.00 0.61
105 7.00 10.00 0.81 0.67
Labelled NH4-N + NO -N (0.51 mg/l) Soil Lateral 3
DeEth Distance (cm) : 5 50 100 350 500 900 (cm)
60 0.57 0.01
75 9.31 21.56 0.08 0.17
90 12.16 28.30 0.29 0.21 0.01
105 3.63 5.39 0.07 0.01

63
Table 13. Concentrations (mg/l) of total and labelled N in
soil solution samples from 4 depths and 6 lateral
distances from the central drain in the DTL plot
on August 1, 1980 (Julian Day 214). Geometric
means are shown in parentheses.
Total NH -N (0 • 18 mg/l) Soil Lateral 4
DeEth Distance (cm) : 5 50 100 350 500 900 (cm)
60 0.05 0.07 0.06 0.29 0.38 0.28
75 0.22 0.04 0.24 0.36 0.41 0.23
90 0.04 0.08 0.43 0.39 0.33 0.34
105 0.06 0.09 0.27 0.38 0.32 0.33
Total NO -N ( 6 • 8 7 mg / 1 ) Soil Lateral 3
DeEth Distance (cm) : 5 50 100 350 500 900 (cm)
60 11.2 18.0 7.1 5.0 4.3 4.3
75 14.3 15.7 6.7 5.0 3.5 4.5
90 13.9 15.0 7.4 6.1 4.1 4.1
105 12.8 13.6 5.2 4.1 4.0 3.3
Labelled NH4-N + NO -N ( 3 . 10 mg:ll) Soil Lateral 3
DeEth Distance (cm) : 5 50 100 350 500 900 (em)
60 7.2 11.5 4.6 2.2 1.7 0.7
75 9.3 10.1 4.4 2.2 1.4 0.8
90 8.9 9.6 5.0 2.7 1.6 0.7
105 8.2 8.7 3.5 1.9 1.6 0.6

64
Table 14. Concentrations (mg/l) of total and.labelled N in
soil solution samples from 4 depths and 6 lateral
distances from the central drain in the DTL plot
on August 13, 1980 (Julian Day 226). Geometric
means are shown in parentheses.
Total NH -N (0.18 mg/l) Soil Lateral 4
DeEth Distance (cm) : 5 50 100 350 500· 900 (cm)
60 0.01 0.01 0.12 0.62
75 0.01 0.24 1. 08 3.04 2.90 5.51
90 0.10 0.20 0.01 0.01 0.49 3.63
105 0.55 0.01 0.10 0.01 1.53 2.20
Total NO -N (14.76 mg/ 1) Soil Lateral 3
DeEth Distance (cm) : 5 50 100 350 500 900 (em)
60 10.50 10.00 32.50 10.50
75 10.00 12.50 42.00 29.00 16.00 34.00
90 10.50 9.40 17.00 17.00 27.50 21.00
105 8.10 20.00 13.50 14.50 21.00 16.00
Labelled NH4-N + NO-N (0.97 mg/l) Soil Lateral 3
DeEth Distance (cm) : 5 50 100 350 500 900 (cm)
60 1.19 0.85 2~67 0.29
75 1.13 1.11 3.66 2.62 3.65 0.95
90 1.20 0.84 1.45 1.39 5.41 0.64
105 0.98 1. 75 1.16 1.19 4.35 0.48

65
Table 15. Concentrations (mg/l) of total and labelled N in
soil solution samples from 4 depths and 6 lateral
distances from the central drain in the DTL plot
on August 20, 1980 (Julian Day 233). Geometric
means shown in parentheses.
Total NH -N (0.13 mg/l) Soil Lateral 4
DeEth Distance (cm) : 5 50 100 350 500 900 (cm)
60 0.01 0.01 0.01 0.28
75 0.82 0.96
90 0.01 0.06 0.23 0.58 0.27 0.26
105 0.43 0.04 0.14 0.72 0.73
Total NO -N (4.14 mg/l) Soil Lateral 3
DeEth Distance (cm) : 5 50 100 350 500 900 ( cm)
60 2.10 2.60 5.30 18.00
75 1.85 29.00
90 4.00 1. 40 3.70 7.50 11.00 8.00
105 1.00 3.20 1. 50 5.30 3.20
Labelled NH4-N + NO -N (0.09 mg/l) Soil Lateral 3
DeEth Distance (cm) : 5 50 100 350 500 900 (cm)
60 0.06 0.07 0.03 0.42
75 0.07 0.19
90 0.11 0.04 0.10 0.05 0.71 0.19
105 0.04 0.08 0.01 0.38 0.09

66
means for DT soil solution were only 0.50, 0.12, and 0.02
mg/l of NH 4-N respectively for 57, 69, and 76 days after
fertilizer application; however, geometric means for N03-N
were 8.79, 9.62, and 4.03 mg/l on these same dates. These
concentrations were much higher however than those observed
in drainage water (Fig. 13) after those dates. This ~bser
vation was probably due to plant uptake combined with a lim
ited number of subsurface drainage periods. This data also
shows that N03-N constitutes the predominant form for N in
the soil solution. Geometric means fOr labelled N for 57,
69, and 76 days after fertili.ation were 4.80, 1.71, and
0.51 mg/l respectively. Thus the concentration of solution
N attributable to the 15N-depleted (NH4)2S04 was observed to
decrease more than 9 times within the 19-day period. This·
information is also consistent with the reasoning that N up
take by plant roots was very significant in this deep-tilled
DT soil. The slight increase in N03-N in soil solution be
tween 57 and 69 days after fertilization further suggests
that some nitrification occurred, but was probably limited
in rate due to acid subsoil conditions.
Geometric mean concentrations of NH4-N in bTL soil so
lution were 0.18, 0.18, and 0.13 mg/l resp~ctively for 57,
69, and 76 days after fertilization; however geometric means
for N03-N were 6.87, 14.76, and 4.14 mg/l on these same
dates. As with DT soil, the N concentrations in soil so
lution were considerably higher than in the drainage
(Fig. 14) water essentially for the same reasons. Nitrate

67
was the dominant form of N in solution and the large in-
crease in N03~N concentration between 57 and 69 days after
fertilization implies nitrification had occurred. Geometric
means for labelled N for 57, 69, and 76 days after fer-
tilization were 3.10, 0.97, and 0.09 mg/l respectively. For
this deep-tilled treatment, the concentration of solution N
attributable to the 15N-depleted (NH4)2S04 was observed to
decrease more than 34 times during the 19-day period. This
observation suggests that rates of N uptake by plant roots
were higher in DTL soil in comparison to DT soil, probably
due to higher pH values in the subsoil .. Calvert et ale
(1977) have shown that citrus yields were higher and that
root systems were deeper in DTL soil compared to DT soil.
Concentrations for selected cations in the DTL soil
solution are presented in Table 16 for 57 days after
application of fertilizer. Geometric mean concentrations
+ +2· +2 -4 . ·-3 for K ,Ca ,and Mg were 9.2 x 10 , 2.15 x 10 , and
-3 2.47 x 10 m.e./l, respectively. The presence of these
relatively high cation concentrations in the soil solution
implies that the ion exchange sites in this soil are
d · 1 . d b d' 1 +2 d +2 . pre omlnant y occuple y lva ent Ca an Mg catlons
which are more competitive than NH: ions for the exchange
sii-es.
Citrus leaves (Table 17) sampled during the summer and
fa~l had 2.28 to 2.69% Nand 12 to 15% of the tissue N was
attributnble to the 15N-depleted fertilizer. Essentially no
difference were observed between the 3 plots.

68
Table 16. Concentrations (mg/l) of K+, ca+ 2 , and Mg+2 ~n
soil solution samples from 4 depths ane; 6 la <era L
distances from the central drain in the DTL l,lot
on August 1, 1980 (Julian Day 214). Geometr:c
means shown in parentheses.
K+ (36 m9:/ 1 ) Soil Lateral DeEth Distance (cm) : 5 50 100 350 500 900 (cm)
60 41 43 26 33 35 31
75 29 25 60 46 41 47
90 52 27 27 41 29 55
105 21 27 48 53 28 32
Ca+ 2 (43 m9:/1) Soil Lateral DeEth Distance (cm) : 5 50 100 350 500 900 (cm)
60 44 41 44 42 56 46
75 39 37 44 39 61 31
90 62 28 44 40 44 29
105 46 43 29 63 46 59
M9:+ 2 (30m9:/1 ) Soil Lateral DeEth Distance (cm) : 5 50 100 350 500 900 (cm)
60 29 26 29 27 48 30
75 27 24 29 28 56 22
90 51 19 29 28 31 21
105 26 28 20 55 30 50

69
Table 17. Mean percentages (%) of N in leaf tissue and per
centages (%) of leaf N that was labelled for
foliage samples taken in July and October of 1980.
Mean values represent 12 rootstock-scion comb in
ations of citrus.
Date
July
October
Percentage N in Leaves
ST
2.69
2.30
DT
2.50
2.28
DTL
2.50
2.30
Percentage Labelled N
ST DT DTL
13.33 15.07 14.73
13.68 13.06 12.67

70
Chapter 5: Summary and Conclusions
During the summer of 1980, 115 kg/ha of N in the form
15 of N-depleted (NH4'2S04 was applied to portions of a
10-year old experimental citrus grove in South Florida for
the purpose of determining the fate of fertilizer N applied
to an acid, sandy soil (Spodosol). The influence of deep
tillage upon the disposition of the applied N was determined
by applying the labelled fertilizer to shallow-tilled (15 cm
depth) ST, deep-tilled (105 cm depth) DT, and limed (56 met
ric tons/ha) plus deep-tilled (105 cm depth) field plots of
a Spodosol with a 10-20 cm thick spodic layer located at ap-
proximately 80 cm depth. All plots have received annual ap-
plications of 2.24 metric tons per ha of limestone. The ST
plot is typical of tillage and liming practices for agricul-
tural crops growing in Florida Spodosols. The citrus grove
was surface-drained by elevated beds and subsurfaced-
drained by 10-cm diameter plastic tubes placed 107 cm deep
and 18.3 m apart. Elevated beds with 2 rows of citrus trees
were oriented perpendicular to the drain tubes, and the area
between tree rows supported a thick Bahiagrass sod. Soil,
soil solution, drainage water, and citrus leaf samples were
taken at selected times during the first six months follow-
ing the application of fertilizer. Chemical analyses were
performed for NH 4-N and N0 3-N concentrations and isotopic
15N/14N ratios were determined. A local drought during the
summer and fall restricted the quantities of drainage as
well as the sampling frequency for soil solution. During

71
typical years as much as 90% of the total annual rainfall
often occurs during the summer and fall seasons.
Accumulative leaching losses of NH 4-N and N0 3-N in
drainage water discharge from the deep-tilled DT and DTL
p19ts were extremely small during the first 196 days after
the application of fertilizer. The small leaching losses
for DT and DTL plots were due to low N concentrations in the
water but more importantly to small water discharge rates.
Drainage water from the shallow-tilled ST ptot resulted in a
slightly larger loss of 4.76 and 4.34 kg/ha respectively of
unlabelled (residual) and labelled nitrogen. Thus the la-
belled N leached from the ST soil represented only 4% of the
15 quantity N-depl~ted fertilizer nitrogen. Concentrations
of residual plus labelled N in ST drainage water were as
high as 25 mg/l during a drainage event which occurred with-
in the first month after fertilization but decreased to
about 1 mg/l within 4 months after fertilization. The rela-
tive influence of N in the drainage water from ST upon water
quality of the downstream canal was small because of the
small volumes of drainage that occurred during 1980.
Nitrogen discharged in drainage water from all plots was
predominantly in the form of N03-N with lesser amounts as
NH 4-N.
Analyses of soil cores to a depth of 70 cm in the ST
plot and 100 cm in the deep-tilled plots revealed that the
15 N-depleted NH 4-N was largely nitrified to the N0 3-N form
within the first 30 days. During the first 12 days

72
nitrification appeared to proceed at faster rates in the
deep-tilled plots as compared to the shallow-tilled plot
possibly due to slightly higher water retention capacity and
higher pH of the DTL subsoil.
Initially, larger quantities of residual and labelled N
(N0 3-N plus NH 4-N) were present in the soil profile for the
ST plot (182.8 kg/hal than for DT (76.5 kg/ha) and DTL
(104.8 kg/ha) plots. The quantities of labelled N in the
soil at that date were equivalent to 105, 28, and 54% of the
15 applied N-depleted (NH4}2S04 for ST, DT, and DTL plots re-
spectively. These data indicate that within 12 days after
fertilizer application, 72 and 46% of the labelled fertiliz-
er N, respectively, had been removed from the profiles for
DT and DTL plots. Virtually all of the labelled N was pre-
sent in the shallow-tilled ST soil, however. Since leaching
losses for the deep-tilled soils were extremely small and
denitrification losses of N03-N were most unlikely due to
the infrequent rainfall during that period, the unaccounted
for N appears to have been absorbed by root systems of
bahiagrass and citrus. Volatilization losses of the applied
(NH4)2S04 were less than 0.5% for all three plots. Earlier
results by.Calvert et ale (1977) showed that fruit yields
were significantly higher and root development more exten-
sive in the.soil profile for the DTL treatment than for ST
treatment. Yields and root development for the DT treat-
ments was intermediate. Shallower root systems in the
shallow-tilled plot would thus be expected to have lower

73
rates of absorption of soil N by actively growing roots than
either of the deep-tilled plots.
Total quantities of N measured in ST, DT, and DTL soil
profiles for 12, 42, 75, and 134 days after fertilization
showed dramatic decreases in labelled as well as residual N
from previous applications of fertilizer. After the first
month, much of the soil N appeared to be coming from
non-fertilizer sources of N, presumably from mineralization
of soil organic matter. By 134 days after fertilization,
15 . less than 3% of the N-depleted fertilizer N was still
present in the soil. These data also imply that most of the
applied fertilizer N was utilized by citrus trees and
bahiagrass within 4.5 months after application. Previous
investigations with non-labelled N (Mansell et ale 1977) and
with higher rainfall amounts during summer months revealed
that an average of 20% of the fertilizer applied to the
shallow-tilled plot of this same citrus grove was leached
over a th·ree-year period. Average leaching losses for the
deep-tilled plots however were much less ( 5%). As seen
from the current investigation where high residual
concentrations of soil N occur from previous fertilizer ap-
15 pl~cations, the use o~ N-depleted fertilizer N provides a
more effective means to study the fate of applied N under
field conditions. Thus results from this study show that
fertilizer use efficiency for labelled N was higher in deep-

74
tilled plots than in the ST plot. Even the N use efficiency
for citrus growing in ST soil however was relatively h i .. gh
due to the low frequency of drainage events during I98u.
As expected, soil solution samples taken 57, 69 aId 7(>,
days after fertilizer application showed that N03-N waf the
predominant N form in solution in all plots. Concentrations
of N in solution decreased during this I9-day period indica
ting that plant roots were actively absorbing N. Mean con
centrations of solution N attributable to the I5N_
depleted (NH4)2S04 in the DTL soil were observed to decrease
more than 34-fold during this 19-day period. Compared to
the DT plot, rates of N uptake by plant roots appeared to be
higher for the DTL plot during that period probably due to
higher pH values observed for the subsoil.
Isotopic analyses of citrus leaves during the summer
and fall showed that 12 to 15% of N in the tissue was attri
butable to the I5N-depleted fertilizer. Concentrations of N
in the tissue did riot vary greatly between plots.
Results from this study using labelled N confirm earli
er investigations (Mansell et ale 1977) that deep tillage
plus lime incorporation into the profile of a Spodosol is an
effective means to enhance root absorption of fertilizer N,
minimize N leaching losses, and thus minimize contamination
of water resources with N03 -N. Shallow development of root
systems, low cation and water retention characteristics, and
high values of saturate4 hydraulic conductivity of shallow
tilled Spodosols provide these acid, sandy soils with po-

75
tential for leaching loss of fertilizer N during periods of
soil drainage. Establishment of narrow (1.0 in wide) zones
of deep tillage with lime only in the vicinity of the soil
where citrus or other agricultural crops are to be located
offers em effective means to increase fertilizer- and water
use effi.ciencies for newly developed Spodosols. Restriction
of the deep tillage operation to only the soil near the crop
rows decreases the cost to a fraction of that required to
deep till entire fields.

76
Literature Cited
1. Bremner, J. M. 1965. Inorganic forms of ni trogerl. In
Methods of Soil Analysis, C. A. Black (Ed). Part 2.
Chapter 84, pp. 1179-1206.
2. Broadbent, F. E. and A. B. Carlton. 1980. Methodology
for field trials with nitrogen-IS-depleted nitrogen.
J. Environ. Qual. 9:236-242.
3. Calvert, D. V., E. H. stewart, R. S. Mansell, J. G. A.
Fiskell, J. S. Rogers, L. S. Allen, and D. A. Graetz.
1981. Leaching losses of nitrate and phosphate from a
Spodosol as influenced by tillage and irrigation level.
Soil and Crop Sci. Soc. Florida Proc. 40:62-71.
4. Calvert, D. V., H. W. Ford, E. H. Stewart and F. G.
Martin. 1977. Growth response of twelve citrus
rootstock combinations on a Spodosol modified by deep
tillage and profile drainage. Proc. of Int. Soc.
Citriculture 1:79-84.
5. Fiskell, J. G. A. and O. V. Calvert. 1975. Effects of
deep tillage, lime in corporation, and drainage on
chemical properties of Spodosol profiles. Soil Sci.
120:132-139.
6. Hauck, R. D. and J. M. Bremner. 1976. Use of tracers
for soil nitrogen research. Advances in Agronomy
28:219-266.
7. Hillel, D. 1980. Fundamentals of Soil Physics.
Academic Press, New York, page 8.

77
8. Kowalenko, C. G. 1980. Transport and transformation
of fertilizer nitrogen in a sandy field plot using
tracer techniques. Soil Sci. 129:218-221.
9. Knipling, E. B. and L. C. Hammond. 1971. The SWAP
study of soil water management for citrus on flatwood
soils in Florida. Soil and Crop Sci. Soc. Florida
Proc. 31:208-210.
10. Mansell, R. S., D. V. Calvert, E. H. Stewart, W. B.
Wheeler, J. S. Rogers, D. A. Graetz, L. H. Allen, A. R.
Overman, and E. B. Knipling. 1977. Fertilizer and
Pesticide Movement from Citrus Groves in Florida
Flatwood Soils. Completion Report for Project
R-800517, Environmental Protection Agency, Environ
mental Research Laboratory, Athens, GA.
11. Mansell, R. S., W. B. Wheeler, and D. V. Calvert.
1980. Leaching losses of two nutrients and an
herbicide from two sandy soils during transient drain
age. Soil Sci. 130:140-150.
12. Rogers, J. So, E. H. Stewart, D. V. Calvert, and R. S.
Mansell. 1977. Water quality from a subsurface
drained citrus grove. Third National Drainage Sympo
sium Proceedings, American Society of Agricultural
Engineers, pp. 99-103.
13. u.S. Environmental Protection Agency. 1976. Nitrogen,
ammonia. In Methods for Chemical Analyses of Water and
Water, U.S. E.P.A. Technical Transfer Manual.
pp . 1 6 9 -1 72 .

78
Appendix: Synopsis from Master of Science Thesis (August
1982) for Miss Ko Hui Liu in the Soil ~ciencc
Department, University of Florida.
Title: Miscible Displacement of Aqueous Solutions of
NH 4-N through ColUmns of Sandy Soil.
A. Summary
Ion exchange for K+ and NH: during miscible displace
ment was studied using water-saturated soil columns of ST
and DTL·soils. The soil in each ca.lumn was initially
"saturated" with 0.03 N KCl prior to each displacement
experiments. During the displacement experiments steady
pore water velocities of 7.8 and 30.1 cm/hr were maintained
in the columns. Potassium in the soil was exchanged with
either 0.03 N NH4Cl or 0.01 N NH4Cl + 0.02 N kCl, and NH: in
the soil was exchanged with either 0.03 NKCl or
0.01 N NH4Cl + 0.02 N KC1.
Adsorption isotherms for NH: were determined and retar
dation R values were computed for each soil These R values
were slightly less than those calculated from BTC's (solute
breakthrough curves). Because of the presence of lime in
the soils, ca2+ and Mg2+ were continually leached out of the
soil columns. The presence of these divalent cations in the
soil solution suppressed the sorption of NH: and K+. The
zero point of charge ZPC of both soils were determined and
found to be 4.8 and 6.1 for ST and DTL soils respectively.
A time study of NH: exchange revealed that ion exchange was
instantaneous.

79
B. Conclusions
Based on the results in this study, the following con-
clusions were made for ion exchange during transport through
ST and DTL soil under water-saturated conditions: (1) The
ZPC of DTL soil was higher than that for ST soil due to a
lower content of organic matter and higher contents of Fe
and Al oxides in the mixed soil. Thus ion exchange in these
soils is dependent both on pH and ionic strength of the so-
lution. (2) Ion exchange was shown to be instantaneous and
thus the use of a kinetic model for ion exchange in these
soils is not justified. (3) Because of the dissolution of
lime during displacement experiments, the presence of ca 2+
and Mg2+ in the system and changes in pH affected the sorp-
+ + tion of K and NH 4 • (4) For these soils, which have been
receiving lime for the last 10 years, it is difficult to
establish a homo-ionic soil. During these laboratory ex':'
periments, the soils were apparently never completely satu
rated with either K+ or NH4+. Thus the ion exchange ob
tained was not only for K+ and NH: but included other ions
2+ 2+ such as Mg and Ca . Due to these considerations, adsorp-
tion isotherms rather than ion exchange isotherms were mea-
sured and used to calculate the retardation factors.
(5) Since ion exchange was shown to be instantaneous the
BTC's in these soils should not have been affected by the
flew velocity imposed. A small apparent velocity effect on
thE translation of BTC's for both K+ and NH: was attributed
to a change in the chemical environment in the system due to

80
changes in pH, ionic strength, and ionic compositi.€>!'l all of
which affect.the retardation of ionic species in these
soils. (6) The ST soil showed no selective adsorption for
+ .+ either K or NH 4 . This was anticipated from the similar
properties of these ions such as ionic radii and charge.
(7) Due to the presence of vermiculite in the DTL soil how
ever, K+ was fixed during ion exchange and transport. This
study shows that even if an ion is fixed or consumed in the
system it is still possible to predict its front during
transport if it is not completely removed from solution.
(8) For the ST soil the displacement studies showed that ion
exchange was reversible for ST soil since all the input
amount of either K+ or NH: were recovered. (9) although the
application of lime to these soils has raised the pH, the
presence of Ca 2+ and Mg2+ in the soils will inhibit the
leaching of either NH+ 4 or K+ when applied to these soils as
fertilizer.