water treatment technology in...
TRANSCRIPT

BANGALORE WATER SUPPLY
AND SEWERAGE BOARD
Water Treatment Technology
in BWSSB
Dr PN Ravindra
Executive Engineer

Water Sources for Bangalore City
Glimpses of Water Treatment History
Till 1895 Unfiltered Water in Karanjee System from a
Number of Tanks such as Dharmambudhi, Sampangi,
Ulsoor, Sankey etc.,
Supplemented by Local Wells and Stepped Ponds.

Hessarghatta Reservoir
From 1896, First Protected Water Supply From Hessarghatta
Lake Across River Arkavathy
Designed for Population of 250,000 at 55 Lpcd.
Chamarajendra Reservoir is 20 kms from Bangalore having
capacity of 747.7 mcft.
Jewel Filters at Malleshwaram
Received Raw Water for Treatment.

Water Treatment Principle
• Clarification
• Filtration
• Disinfection
Aerator
FM
Flash Mixer
Flocculation
Clarifier
Filter
Disinfection
Chlorine
FLOW DIAGRAM
IMPURITIES IN WATER :
• DISSOLVED SALTS
• SETTLABLE SOLIDS
• SUSPENDED SOLIDS
Treated Water

Hessarghatta Raw water qualities
Parameter Minimum Average Maximum
Turbidity (NTU) 20 45 3000
pH 7.0 8.2 8.73
Alkalinity as CaCO3 (mg/L) 20 145 190
Total hardness as CaCO3
(mg/L)40 125 190

Flocculator
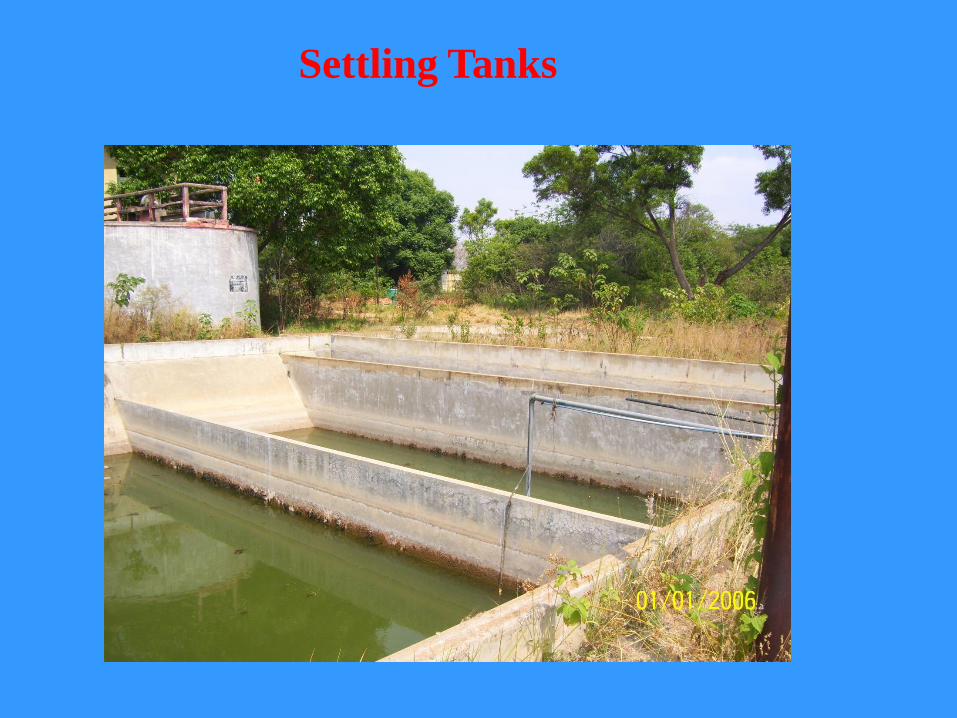
Settling Tanks

Jewell Filter
Jewell Filter Features
Diameter – 5.30 m
Filter Depth – 2.5 m
Media depth – 1.05 m
Numbers – 5
Capacity – 2.5 MLD Each
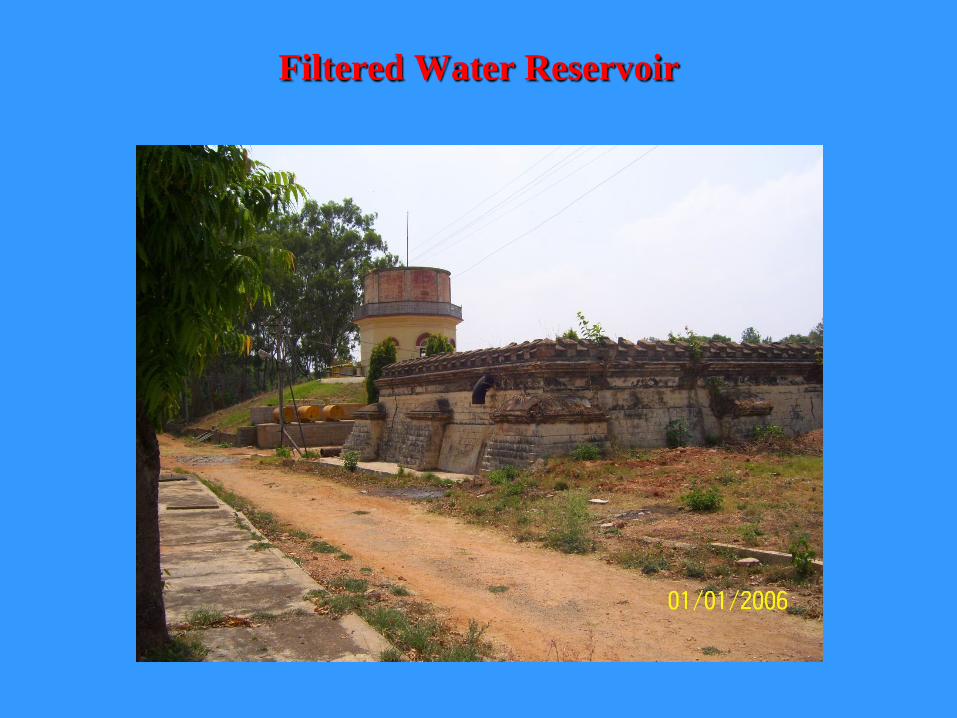
Filtered Water Reservoir

From Time To Time There Were Shortages.
TG Halli Reservoir was Built as per Suggestion of a
Committee Headed by Sir M Visvesvaraya across River
Arkavathy, about 40 Kms from Bangalore and
Commissioned in 1932.
Capacity 55 mcmt later Increased to 95 mcmt
Designed to Provide 72 lpcd later Increased to 90 lpcd
Supply initially 75 MLD, later Increased to 112.5 MLD
and later Upgraded for 140 MLD Capacity.
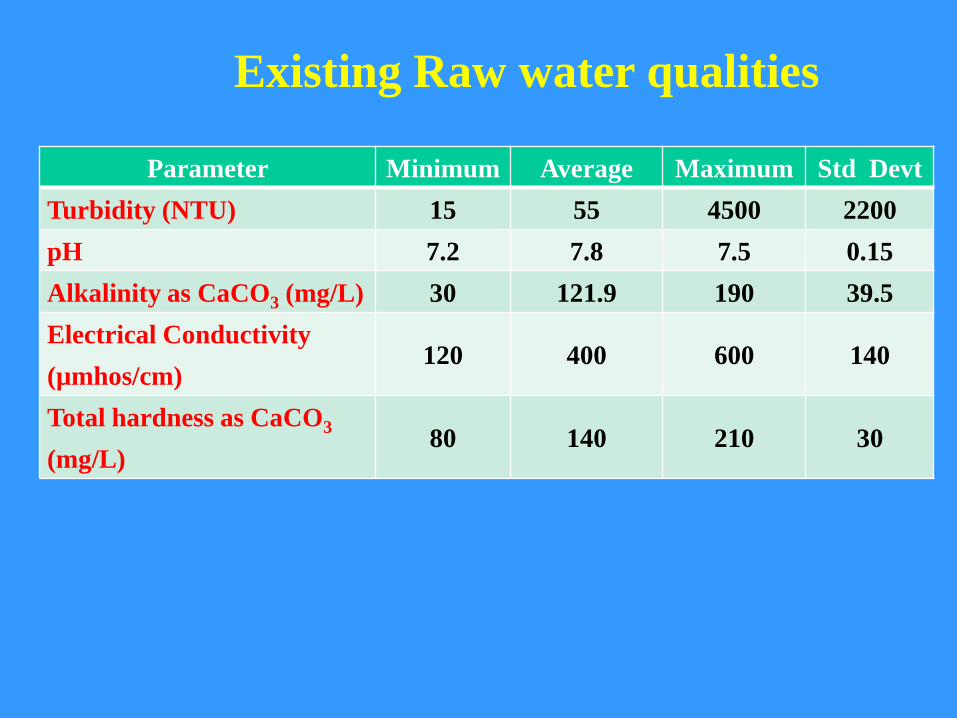
Existing Raw water qualities
Parameter Minimum Average Maximum Std Devt
Turbidity (NTU) 15 55 4500 2200
pH 7.2 7.8 7.5 0.15
Alkalinity as CaCO3 (mg/L) 30 121.9 190 39.5
Electrical Conductivity
(µmhos/cm)120 400 600 140
Total hardness as CaCO3
(mg/L)80 140 210 30
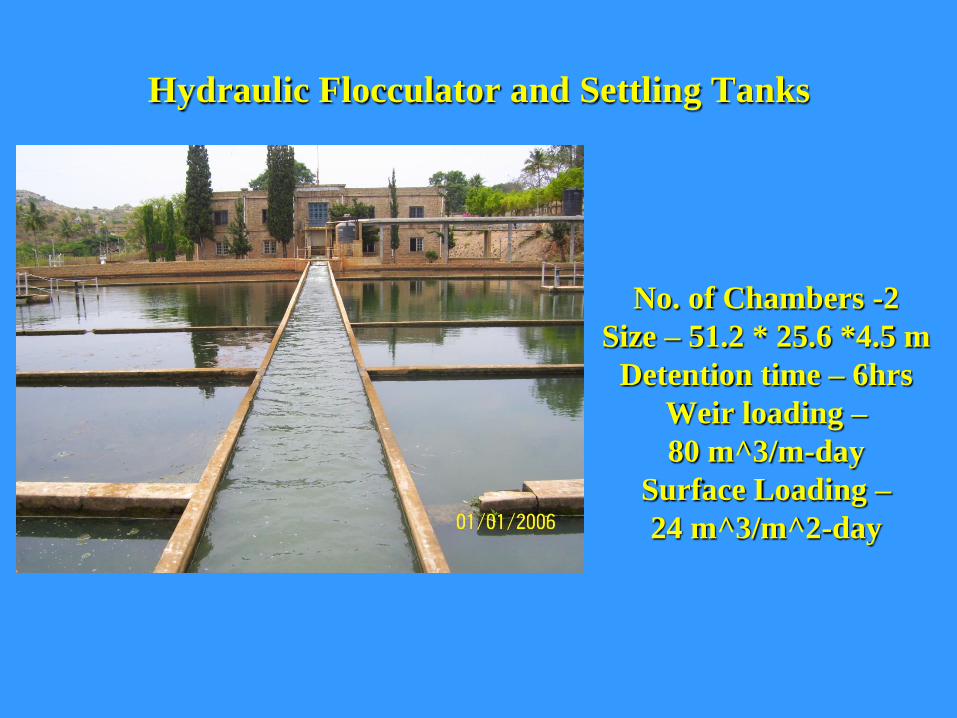
Hydraulic Flocculator and Settling Tanks
No. of Chambers -2
Size – 51.2 * 25.6 *4.5 m
Detention time – 6hrs
Weir loading –
80 m^3/m-day
Surface Loading –
24 m^3/m^2-day

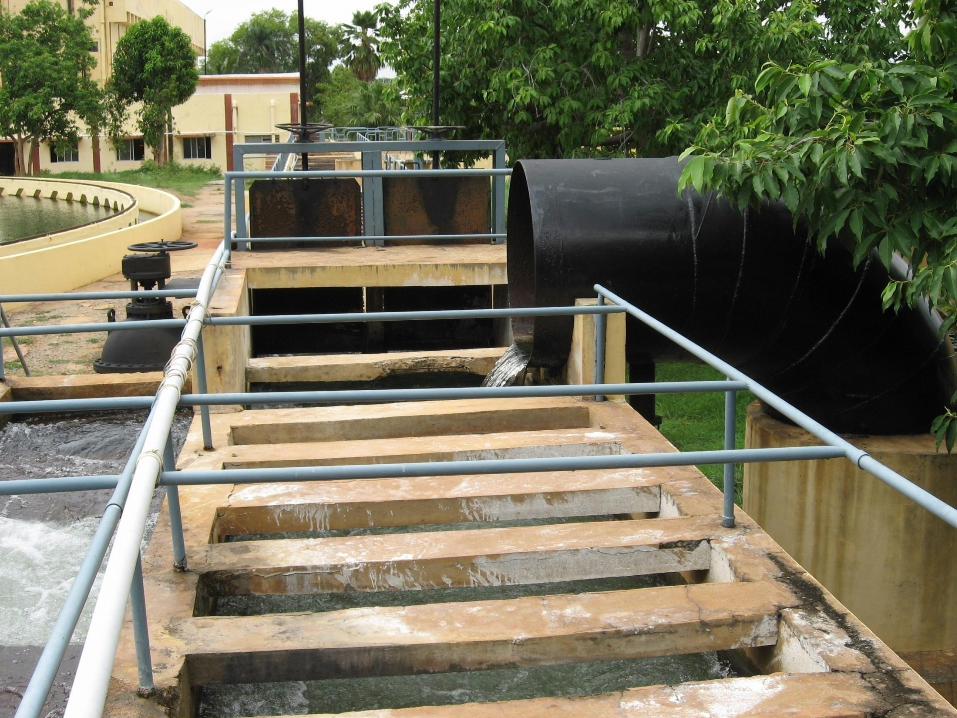
Hydraulic Flocculator

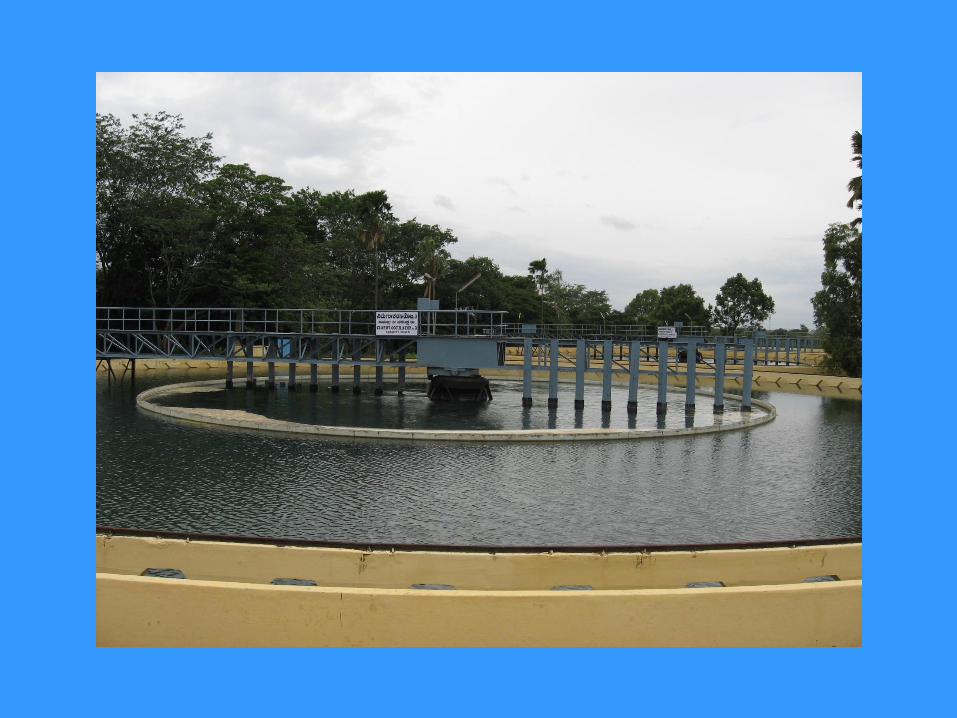
Clariflocculator

Filter Houses
Filter House – 1933
10 nos – 10 MGD
Fitration rate – 3.6 m/hr
Media depth – 0.40 m
Filter House – 1958
8 nos – 12 MGD
Fitration rate – 4.8 m/hr
Media depth – 0.40 m
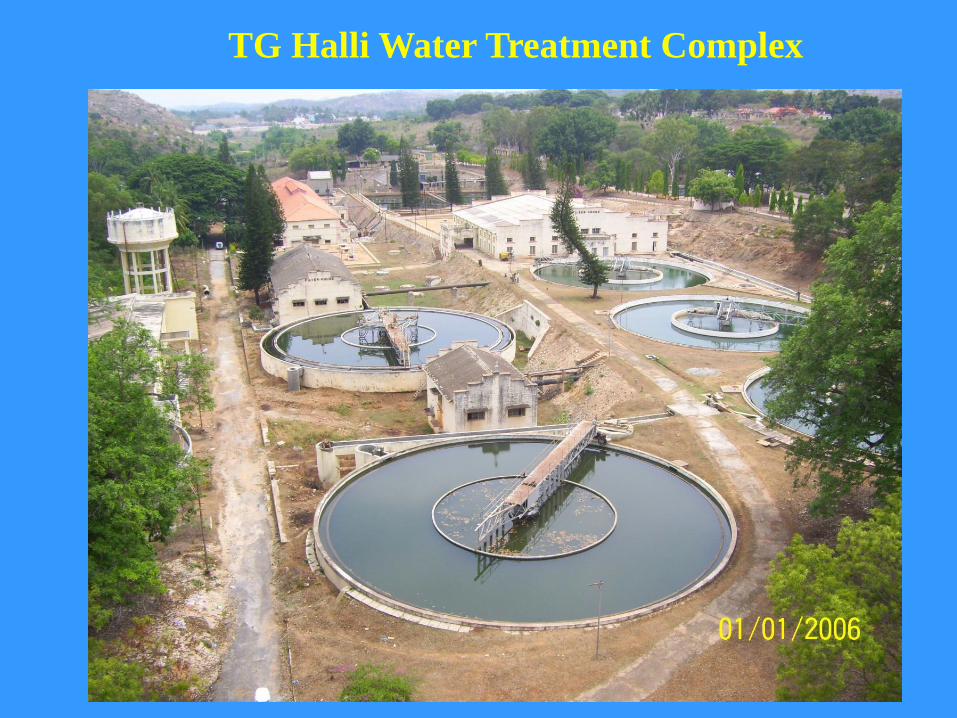
TG Halli Water Treatment Complex

Cauvery Water Supply Stages
River Cauvery, about 100 Kms from Bangalore and
Manometric Head is 450 metres
Cauvery Water
Supply Stages
Commissioning
year
Capacity ,MLD
I Stage 1973 135
II Stage 1982 135
III Stage 1993 270
IV Stage Phase I 2002 270
IV Stage Phase II March 2012 * 500
Total 1310 MLD

94% 0f the time the raw water turbidity is less
than 20 NTU for years 2004 and 2006. In year
2005 when unusual rainfall occurred the raw
water turbidity is still less 20 NTU for 90% of the
time.
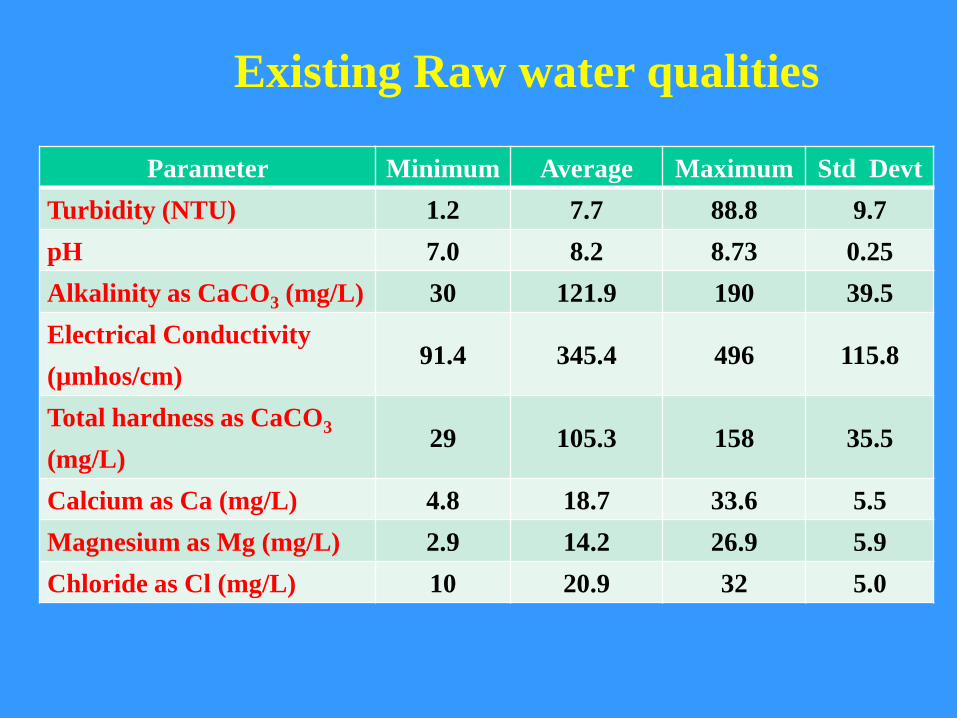
Existing Raw water qualities
Parameter Minimum Average Maximum Std Devt
Turbidity (NTU) 1.2 7.7 88.8 9.7
pH 7.0 8.2 8.73 0.25
Alkalinity as CaCO3 (mg/L) 30 121.9 190 39.5
Electrical Conductivity
(µmhos/cm)91.4 345.4 496 115.8
Total hardness as CaCO3
(mg/L)29 105.3 158 35.5
Calcium as Ca (mg/L) 4.8 18.7 33.6 5.5
Magnesium as Mg (mg/L) 2.9 14.2 26.9 5.9
Chloride as Cl (mg/L) 10 20.9 32 5.0

Existing/Proposed Water Treatments Plants
Stages Processes Capacities
Stage IConventional Clariflocculator
with Rapid Sand Filters135 MLD
Stage II Conventional Clariflocculator
with Rapid Sand Filters
135 MLD
Stage III Conventional Clariflocculator
with Rapid Sand Filters
270 MLD
Stage IV,
Phase IPulsator Clarifier with Aquazur
Filters
270 MLD
Stage IV,
Phase
II
Dissolved Air Flotation with
Aquazur Filters500 MLD

Direct Filtration
RAPID
MIX
Media
FILTRATION
Clearwell
Chlorine
To
Distribution
Coagulant (alum
or PACL)
Chlorine
During low turbidity period water is
directly applied to the filters
During high turbidity period water is
passed through sedimentation basins
before applied to filters
THANK YOU

THANK YOU
THANK YOU

Existing WTPs
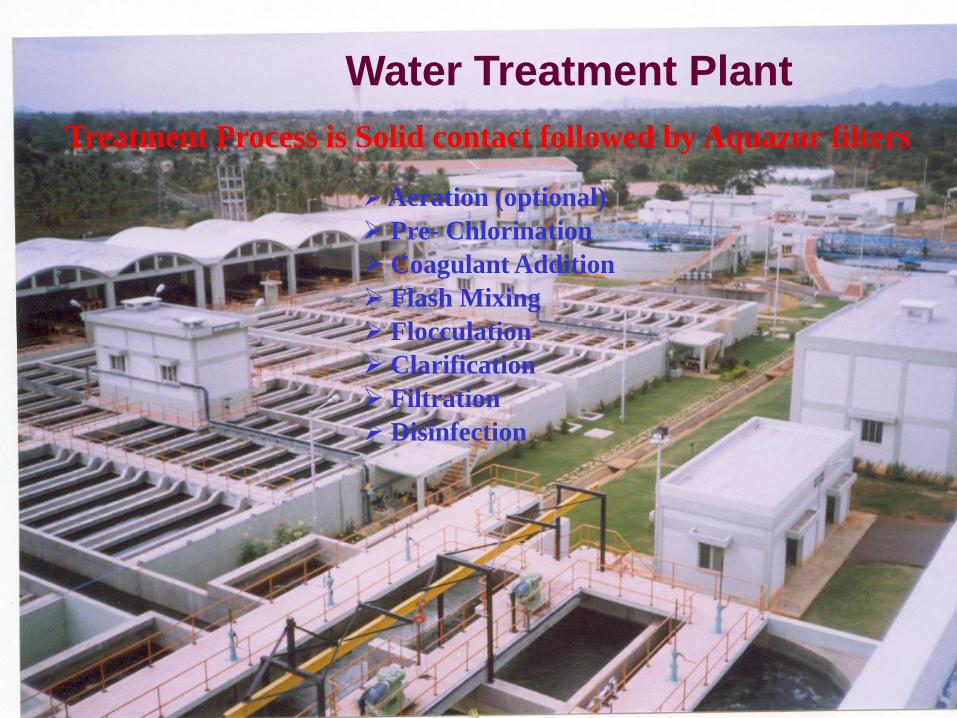
Aeration (optional)
Pre- Chlorination
Coagulant Addition
Flash Mixing
Flocculation
Clarification
Filtration
Disinfection
Treatment Process is Solid contact followed by Aquazur filters
Water Treatment Plant

Existing WTP Stage IV Phase I

THE PULSATOR TECHNOLOGY
•Pulsating Sludge Blanket Clarifier
•Flat Bottom RCC Tank
•Even water distribution over entire floor
•Sludge withdrawal across width of tank

PRINCIPLE OF FILTRATION
• SAND FILTRATIONSAND MEDIA FUNCTION
GRADED / UNIFORM
• MEDIA CLOGGINGFACTORS AFFECTING
TURBIDITY, FLOW RATE,
GRAIN SIZE
• FEATURES OF
•AQUAZUR-VDEEP FILTER BED
POSITIVE PRESSURE IN BED
AIR/WATER BACKWASH + SWEEP

Filters

AQUAZUR - FALSE FLOOR

Existing Water Treatments Plants – Unit Process
Parameter Stage I Stage II Stage III
Stage IV,
Phase
I
Flocculator retention time
(min)30 33 29 41
Clarifier retention time
(min)100 167 171 58
Clarifier surface loading
rate (m3/m2/h)1.98 1.63 1.60 2.65
Weir loading rate (m3/m/h) 15.9 15.1 15.1 -

Existing Water Treatment PlantsBasis of Design for Filtration Process
Parameter Stage I Stage II Stage III Stage IV Ph I
Filtration rate (m/h) 6.0 6.0 6.0 7.58
Air scour rate (m/h)
Duration (min)
None
-
36
2 to 3
Not known
4 to 5
55
1
Combined air-water
rate (m/h)
Duration (min)
55.0 (air )
7.5(water)
5
55.0 (air )
7.5 (wate)
5
55.0 (air )
7.5 (water)
5
55.0 (air )
7.5 (water)
5
Waterwash ratem/h)
Duration (min)
19.7
20
24
4 to 5
20
4 to 5
15
5
Cross waterwash
m/h)
Duration (min)
7.5 to 9.0
8+
7.5 to 9.0
8+
7.5 to 9.0
8+
7.5 to 9.0
8+
Backwash frequency
(Once in--)24 hrs 24 hrs 24 hrs 72 hrs
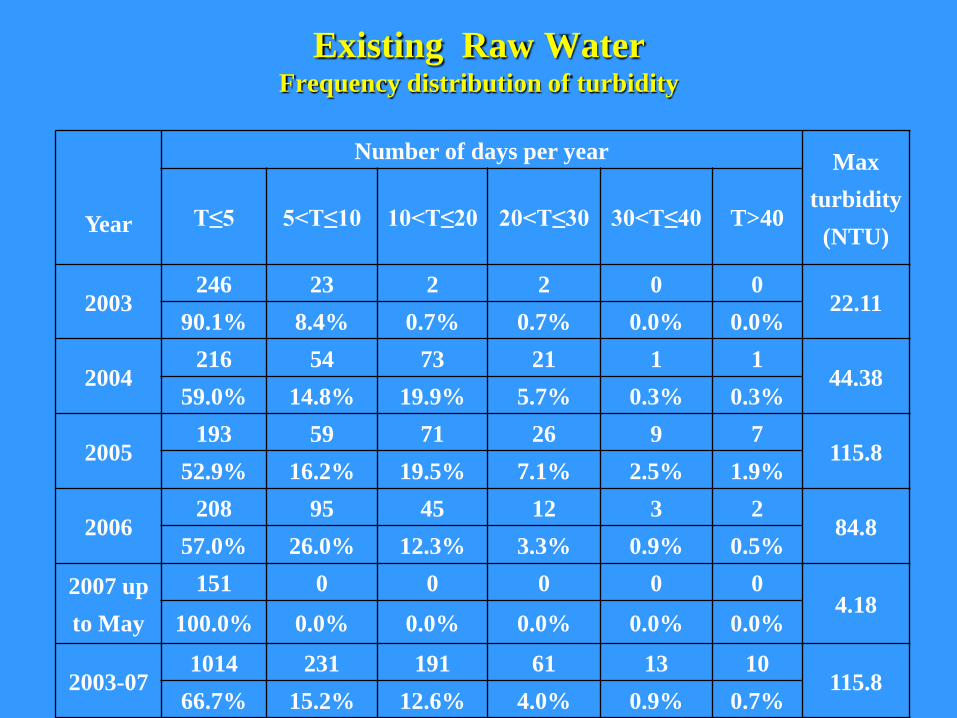
Existing Raw Water Frequency distribution of turbidity
Year
Number of days per year Max
turbidity
(NTU)T≤5 5<T≤10 10<T≤20 20<T≤30 30<T≤40 T>40
2003246 23 2 2 0 0
22.1190.1% 8.4% 0.7% 0.7% 0.0% 0.0%
2004216 54 73 21 1 1
44.3859.0% 14.8% 19.9% 5.7% 0.3% 0.3%
2005193 59 71 26 9 7
115.852.9% 16.2% 19.5% 7.1% 2.5% 1.9%
2006208 95 45 12 3 2
84.857.0% 26.0% 12.3% 3.3% 0.9% 0.5%
2007 up
to May
151 0 0 0 0 04.18
100.0% 0.0% 0.0% 0.0% 0.0% 0.0%
2003-071014 231 191 61 13 10
115.866.7% 15.2% 12.6% 4.0% 0.9% 0.7%

Year Range
Raw
water
Turbidity
(NTU)
Settled water Turbidity
(NTU)
Stage I Stage II Stage III
2005
minimum
mean
maximum
1.20
8.90
88.80
0.98
5.14
29.30
1.00
6.23
28.00
1.09
5.60
38.00
2006
minimum
mean
maximum
1.20
6.50
71.30
1.10
4.52
14.20
1.10
5.16
20.70
1.20
4.68
17.20
2007
minimum
mean
maximum
1.29
6.76
78.18
1.20
5.52
22.20
1.25
6.06
24.10
1.20
4.68
17.20
Raw and Settled Water Turbidity

Year Range Raw water
Turbidity
(NTU)
Filtered Water Turbidity (NTU)
Stage I Stage II Stage III
2005 minimum
mean
maximum
1.20
8.90
88.80
0.60
3.21
19.50
0.66
4.27
21.00
0.48
2.46
16.00
2006 minimum
mean
maximum
1.20
6.50
71.30
0.90
2.47
10.00
0.90
3.26
14.00
0.80
2.25
13.00
2007 minimum
mean
maximum
1.29
6.76
78.18
1.20
3.84
11.50
1.00
3.05
16.50
0.80
2.84
14.50
Raw and Filtered Water Turbidity
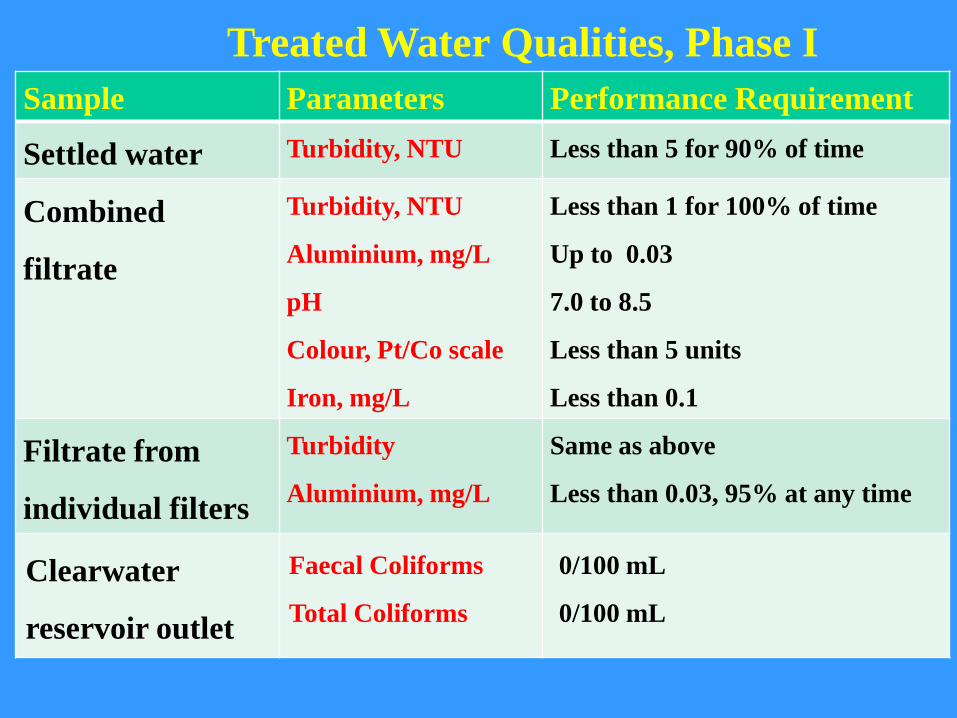
Treated Water Qualities, Phase I
Sample Parameters Performance Requirement
Settled water Turbidity, NTU Less than 5 for 90% of time
Combined
filtrate
Turbidity, NTU
Aluminium, mg/L
pH
Colour, Pt/Co scale
Iron, mg/L
Less than 1 for 100% of time
Up to 0.03
7.0 to 8.5
Less than 5 units
Less than 0.1
Filtrate from
individual filters
Turbidity
Aluminium, mg/L
Same as above
Less than 0.03, 95% at any time
Clearwater
reservoir outlet
Faecal Coliforms
Total Coliforms
0/100 mL
0/100 mL
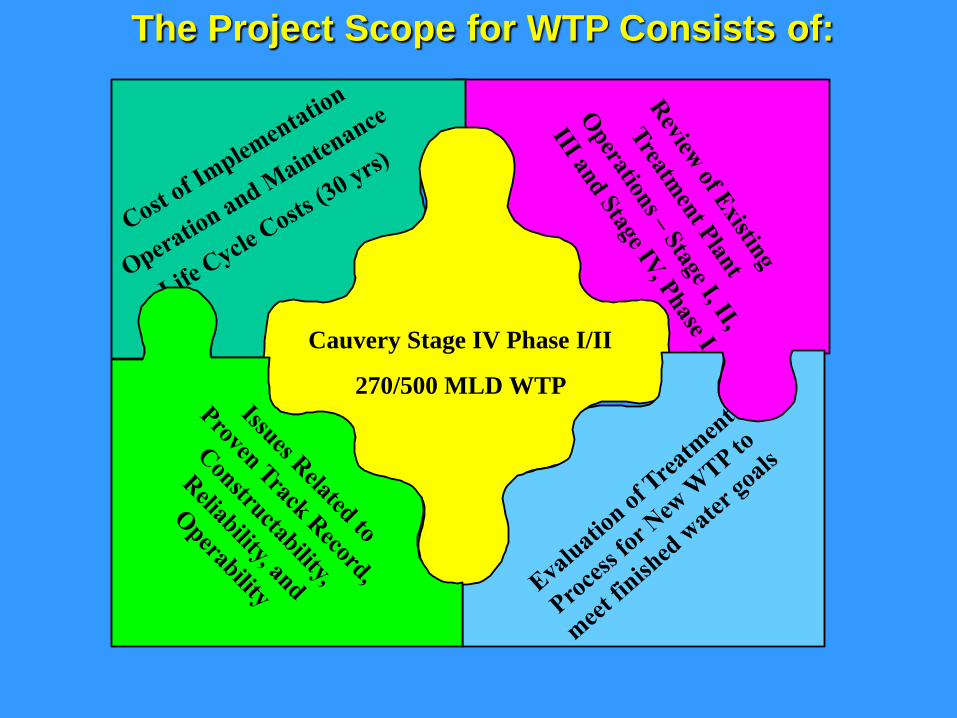
Cauvery Stage IV Phase I/II
270/500 MLD WTP
The Project Scope for WTP Consists of:

Review of Existing WTP and
Raw Water Quality
• Raw water quality with statistical analysis:
increase in levels of TOC, EDCs, Planktons
• Unit processes and their design parameters
• Alum dose and Alum feeding system
• Removal efficiency of settled water and Filtration
unit along with related problems attributed to low
removal efficiency
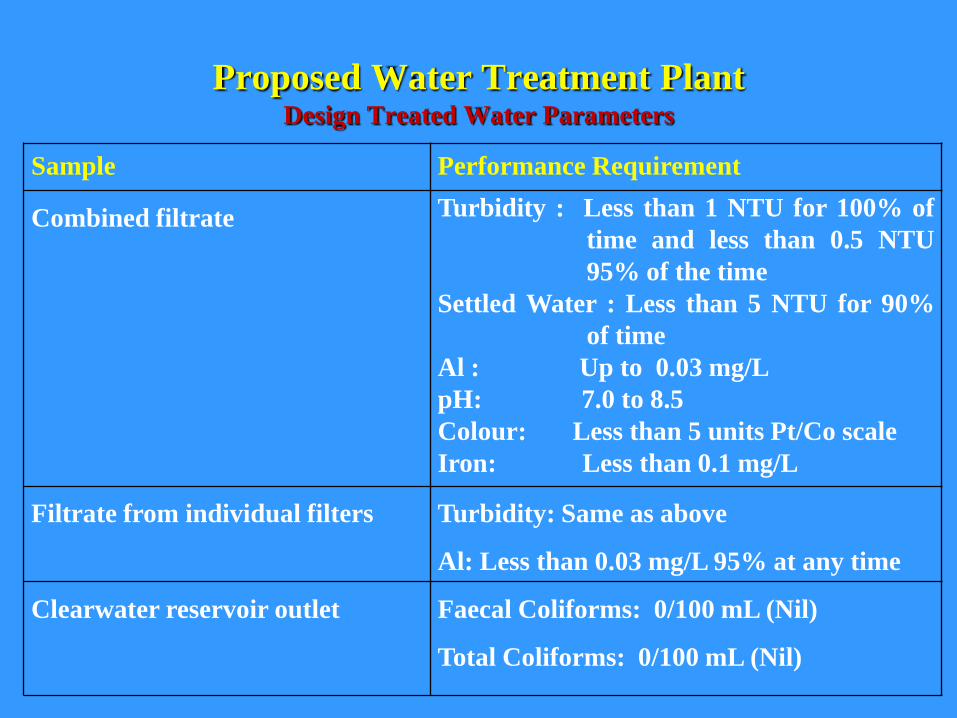
Proposed Water Treatment Plant Design Treated Water Parameters
Sample Performance Requirement
Combined filtrate Turbidity : Less than 1 NTU for 100% of
time and less than 0.5 NTU
95% of the time
Settled Water : Less than 5 NTU for 90%
of time
Al : Up to 0.03 mg/L
pH: 7.0 to 8.5
Colour: Less than 5 units Pt/Co scale
Iron: Less than 0.1 mg/L
Filtrate from individual filters Turbidity: Same as above
Al: Less than 0.03 mg/L 95% at any time
Clearwater reservoir outlet Faecal Coliforms: 0/100 mL (Nil)
Total Coliforms: 0/100 mL (Nil)
Aeration
Pre- Chlorination
Coagulant Addition
Flash Mixing
Flocculation
Claification/Sedimentation
Filtration
Disinfection
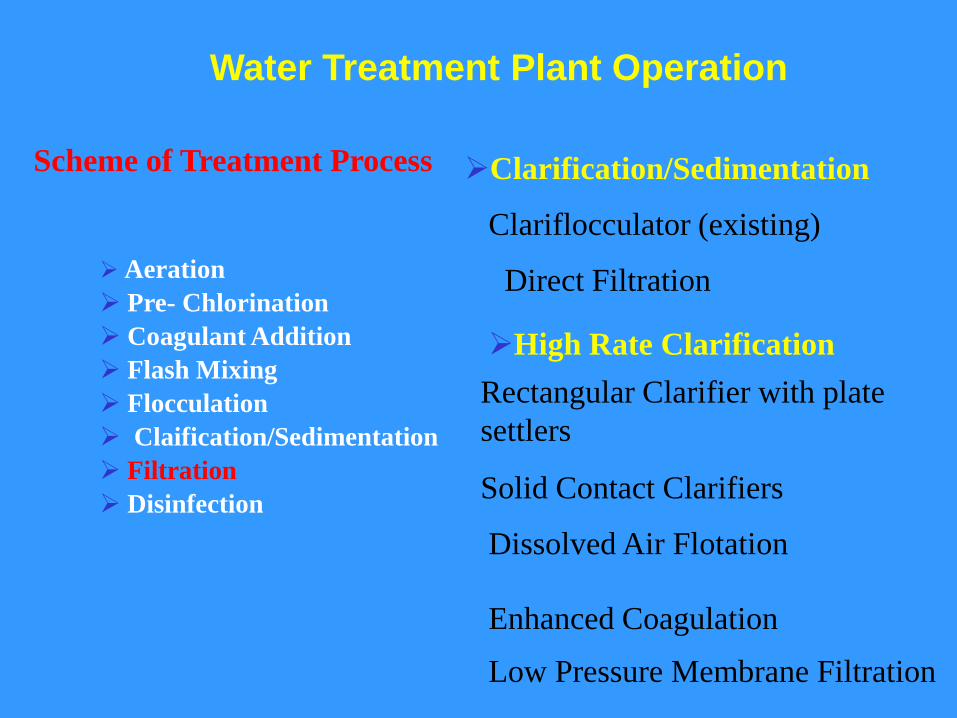
Water Treatment Plant Operation
Scheme of Treatment Process
Direct Filtration
Clariflocculator (existing)
Rectangular Clarifier with plate
settlers
Solid Contact Clarifiers
Dissolved Air Flotation
Enhanced Coagulation
Low Pressure Membrane Filtration
Clarification/Sedimentation
High Rate Clarification

Rectangular
Sedimentation
Basins
a

Inclined Plates


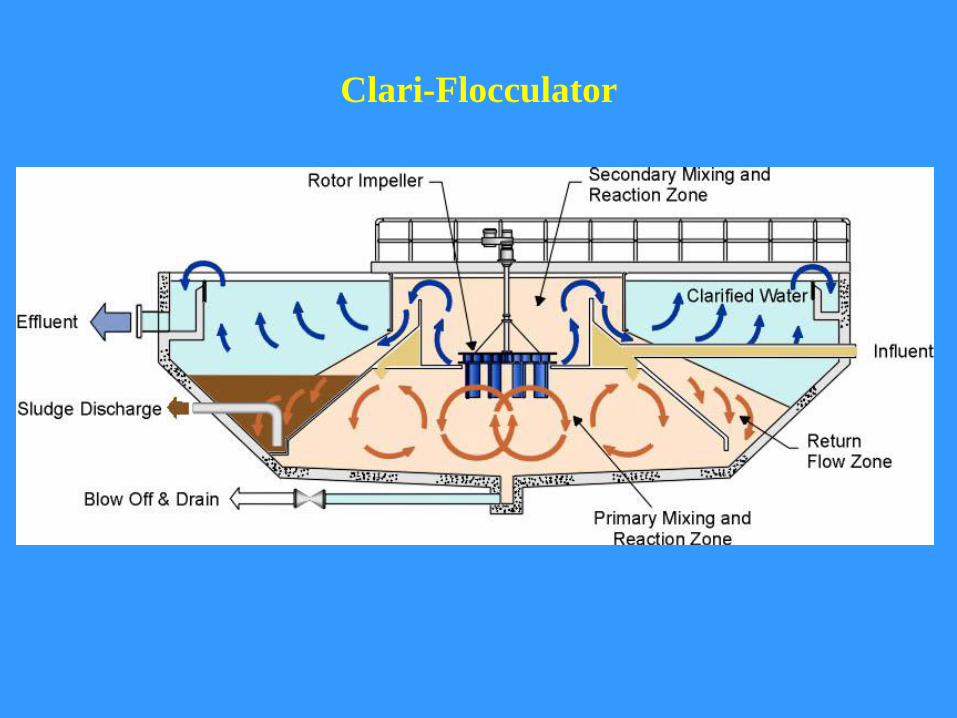
Clari-Flocculator

Pulsator (Solids Blanket Clarifier)
Collection laterals
Vacuum pump
Vent valveVacuum chamber
Collection channel
Sludge drawoff lines
Sludge concentrator
Distribution channelDistribution lateralsParallel plates

NEW TRENDS - DAF
HIGH PERFORMANCE DISSOLVED AIR FLOTATION CLARIFIER. VELOCITIES
10-12 TIMES HIGHER THAN CONVENTIONAL CLARIFIER.
MAIN AREA OF APPLICATION – LOW TURBIDITY ( ~ 30 PPM SS) WATERS
T = 10 à 20
mnT = 5 à 10 mnU F =25 à 40
m/h
10% RECYCLEAIR

Primary difference between conventional and
dissolved air flotation
Gravity Settlement
Buoyancy Flotation
Air bubble
Attachment of bubblesto flocs

Typical DAF Arrangement

Ballasted Flocculation
Actiflo Process
Or Ballasted
Flocculation
FILTRATION
Chlorine
Clearwell
To
Distribution
Raw
Water
Chlorine
Coagulant (alum
or PACL)
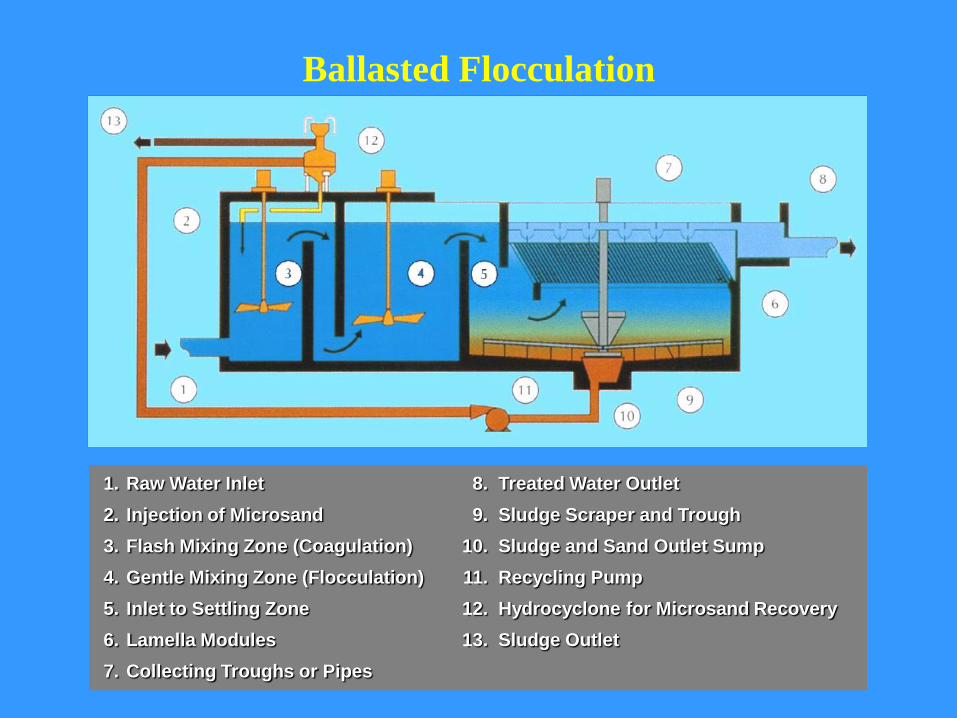
Ballasted Flocculation
1.
2.
3.
4.
5.
6.
7.
Raw Water Inlet
Injection of Microsand
Flash Mixing Zone (Coagulation)
Gentle Mixing Zone (Flocculation)
Inlet to Settling Zone
Lamella Modules
Collecting Troughs or Pipes
8.
9.
10.
11.
12.
13.
Treated Water Outlet
Sludge Scraper and Trough
Sludge and Sand Outlet Sump
Recycling Pump
Hydrocyclone for Microsand Recovery
Sludge Outlet
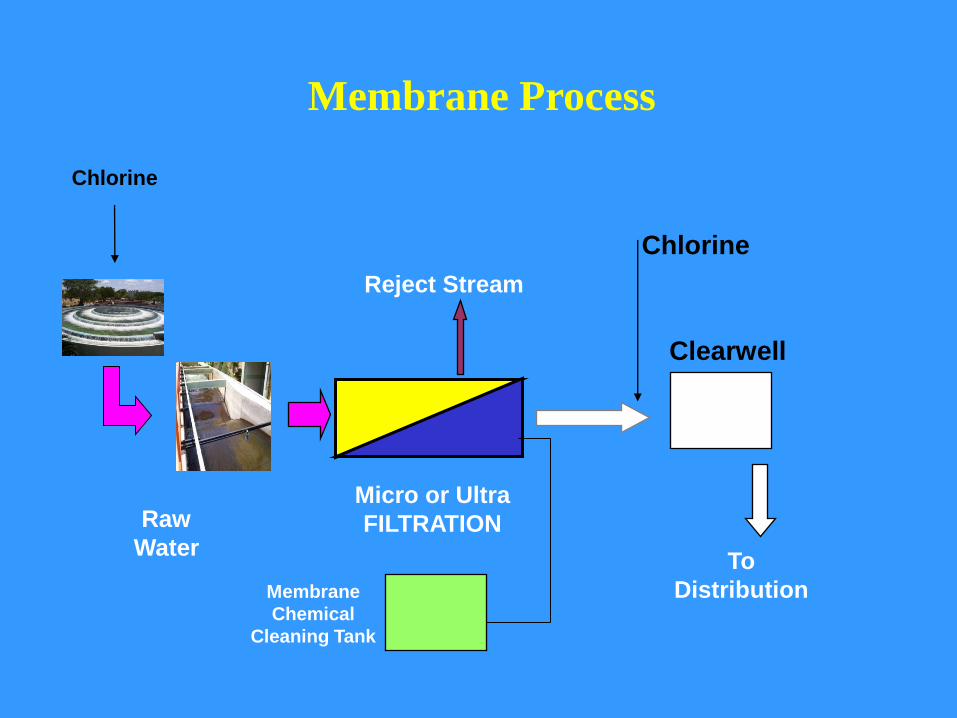
Membrane Process
Micro or Ultra
FILTRATION
Chlorine
Clearwell
To
Distribution
Reject Stream
Raw
Water
Chlorine
Membrane
Chemical
Cleaning Tank

Membrane Filtration
Submerged type
Filtered Water
Process Tank(Influent)
X-Section
Membrane
Layer
Inner Reinforcing
Structure

Common sludge treatment process flow for all
Water Treatment Plants
Waste
Water
Collectio
n
Tank
Thickner
Pump
House
Thickner
Sludge
Sump &
pump
House
Centrifuge
Sludge
for
Disposal
To raw
Water
Channel
To raw
Water
Channel
Sludge
Dewatering
Waste
Water
Collection
Tank
Sludge water from
Clarifier

Footprint for New WTP
No.5
No.4
No.3
No.2
No.1
PretreatmentBasins – (conventional or
Solids contact basins)
ClearWell
BackwashBasins
FilterBuilding
PumpStation
ServiceBuilding
Conventional
Treatment Plant
(with our without
plates)

No.5
No.4
No.3
No.2
No.1
Actiflow or DAFUnits
ClearWell
BackwashBasins
FilterBuilding
PumpStation
ServiceBuilding
Footprint for New WTP
High Rate –
Clarification
Plant
No.5
No.4
No.3
No.2
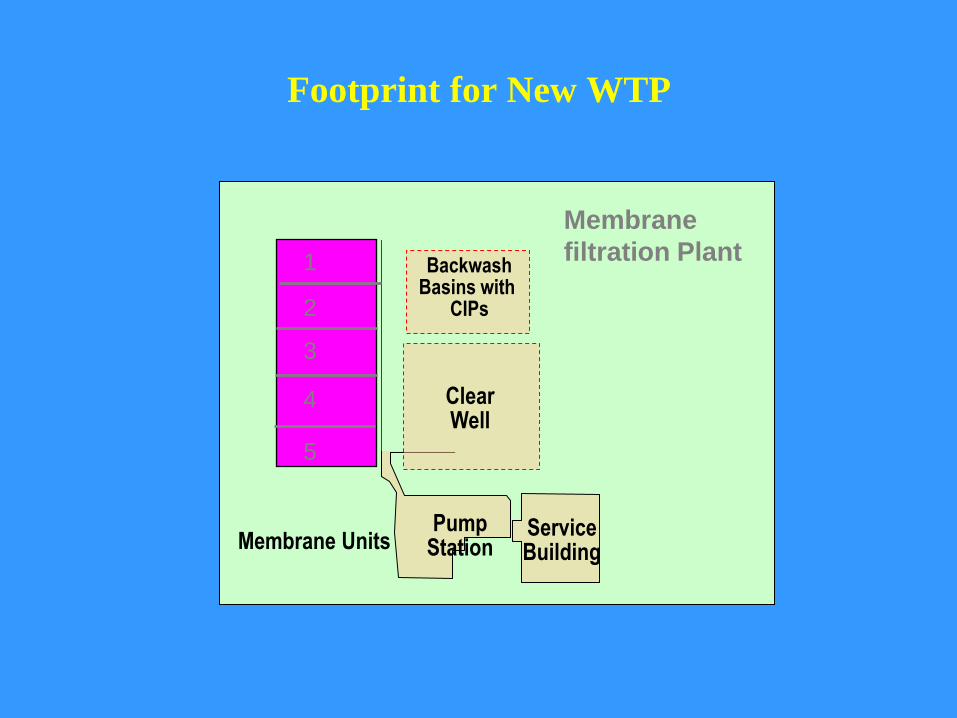
Membrane Units
FilterBuilding
PumpStation
ServiceBuilding
Footprint for New WTP
Membrane
filtration PlantBackwash
Basins with CIPs
ClearWell
5
4
2
1
3
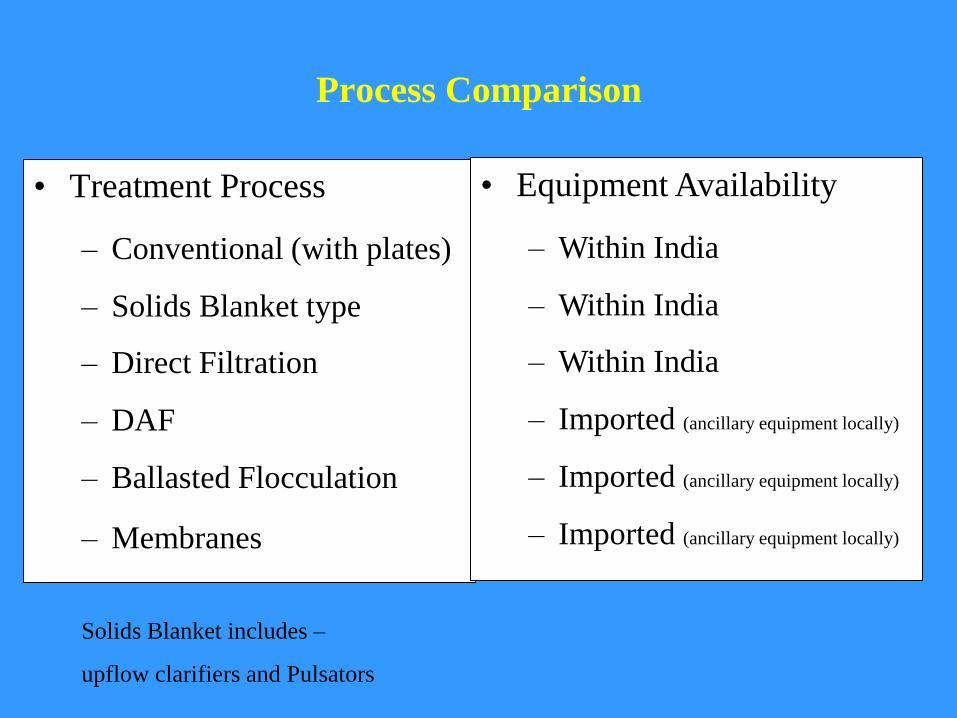
Process Comparison
• Treatment Process
– Conventional (with plates)
– Solids Blanket type
– Direct Filtration
– DAF
– Ballasted Flocculation
– Membranes
Solids Blanket includes –
upflow clarifiers and Pulsators
• Equipment Availability
– Within India
– Within India
– Within India
– Imported (ancillary equipment locally)
– Imported (ancillary equipment locally)
– Imported (ancillary equipment locally)
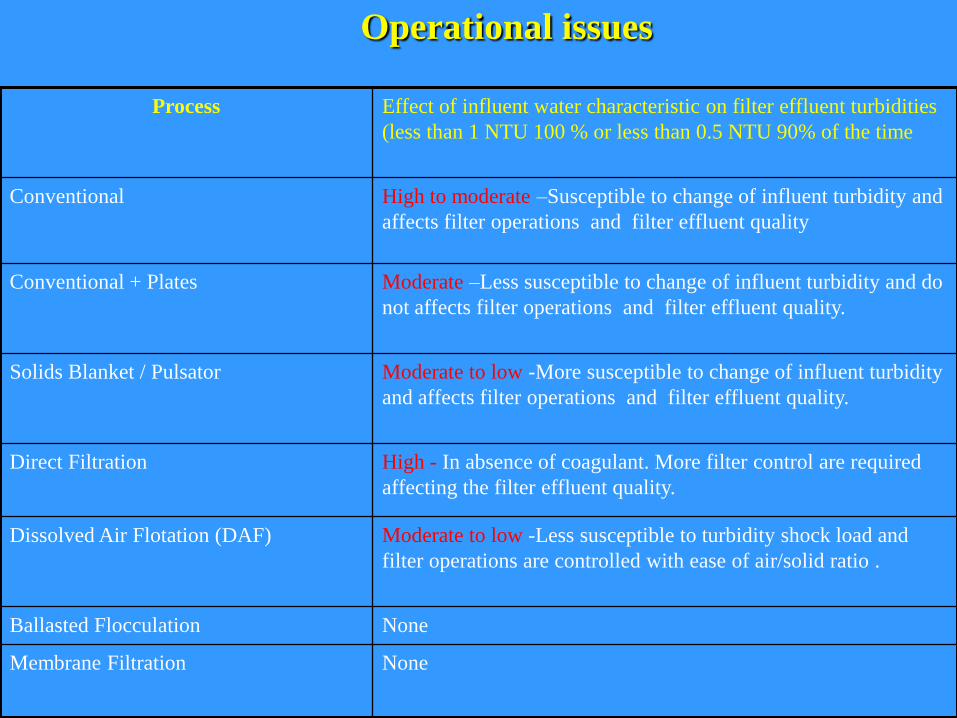
Operational issues
Process Effect of influent water characteristic on filter effluent turbidities
(less than 1 NTU 100 % or less than 0.5 NTU 90% of the time
Conventional High to moderate –Susceptible to change of influent turbidity and
affects filter operations and filter effluent quality
Conventional + Plates Moderate –Less susceptible to change of influent turbidity and do
not affects filter operations and filter effluent quality.
Solids Blanket / Pulsator Moderate to low -More susceptible to change of influent turbidity
and affects filter operations and filter effluent quality.
Direct Filtration High - In absence of coagulant. More filter control are required
affecting the filter effluent quality.
Dissolved Air Flotation (DAF) Moderate to low -Less susceptible to turbidity shock load and
filter operations are controlled with ease of air/solid ratio .
Ballasted Flocculation None
Membrane Filtration None

Operational issues
Process Chemicals Required O & M issuesExpansion feasibility
Conventional Low to moderate Coagulant
dose + Disinfectant
Low to Moderate – can be
expanded with plates
Conventional + Plates Low to moderate Coagulant
dose + Disinfectant
Moderate
No expansion feasibility
Solids Blanket / Pulsator High Coagulant dose +
Disinfectant
High
No expansion feasibility
Direct Filtration Low Coagulant dose + filter
aid polymer + Disinfectant
Moderate to High - Operation of
Filters is Critical – Plant can be
expanded
Dissolved Air Flotation
(DAF)
Moderate Coagulant dose +
Disinfectant
High
plant can not be expanded
Ballasted Flocculation Moderate Coagulant dose +
Disinfectant + Micro-sand
High
plant can be expanded with
increase in overflow rate - limited
Membrane
Pressure
Vacuum
Disinfectant and Membrane
cleaning chemicals
Moderate
plant can be expanded with
modular approach

CAPITAL COST, O & M COST (Annual / 30 years)
0
200
400
600
800
1000
1200
1400
1600
1800
2000
Conventional
Plant with SS
Plate Settlers
Conventional
Plant with PVC
Plate Settlers
Solids Blanket
Clarifiers
Direct Filtration Dissolved Air
Flotation
Ballasted
Flocculation
Membrane
Filtration
Capital Cost
O & M (Annual Cost)
O & M (30 years)
Selected Option

Breakdown of Cost Components (budgetary estimates)
Process Civil Mechanical +
Piping
Electrical &
Instrumentation
Percent of overall capital costs
Conventional Plant 50% 29% 19%
Conventional Plant
with Plate Settlers50% 29% 19%
Solids Blanket
Clarifiers45% 36% 22%
Direct Filtration 38% 35% 24%
Dissolved Air
Flotation31% 42% 26%
Ballasted
Flocculation28% 43% 26%
Membrane
Filtration13% 66% 24%

-20%
0%
20%
40%
60%
80%
100%
Conventional
Plant with
Plate Settlers
Solids Blanket
Clarifiers
Direct
Filtration
Dissolved Air
Flotation
Ballasted
Flocculation
Membrane
Filtration
CAPEx % Higher with Direct Filtration
OPEx % higher with Direct Filtration – 30 Yr.
scenario
Selected Option
Comparison of Capex and Opex

Cost Comparison
Process Capital
Costs
O&M
costs (7
years)
O&M
costs
(30 Yr
scenario)
Millions of Rupees
Conventional
Plant with Plate
Settlers with SS
2250 61 265
Solids Blanket
Clarifiers2380 66 286
Direct Filtration 1515 51 151
Dissolved Air
Flotation2300 45 224
Ballasted
Flocculation2493 88 291
Membrane
Filtration2465 106 185
CAPEx %
Higher with
Direct
Filtration
48%
57%
52%
65%
62%
OPEx %
higher with
Direct
Filtration – 30
Yr. scenario
75%
89%
48%
92%
22%

Final Words
• BWSSB has moved along with advancement in
technology
• Gradual increase of Planktons, TOC, EDCs
and THM precursors in Raw water, posing
challenge for tackling such contaminants
• Analysing water for 33 critical parameters as
per BIS 10500
