water use of texas utilities - 2017 biennial report · water utilities must use the methods...
TRANSCRIPT

Water Use of Texas Water
Utilities2017 Biennial Report
85th Legislative Session


Water Use of Texas Water Utilities
Biennial Report to the Texas Legislature Bech Bruun, Chairman
Kathleen Jackson, Member
Peter Lake, Member
Jeff Walker, Executive Administrator
January 1, 2017


Water Use of Texas Water Utilities
Table of Contents
1 Executive Summary ................................................................................................................................................... 1
2 Introduction.................................................................................................................................................................. 2
Purpose of Report ............................................................................................................................................ 2
Ability for Water Utilities to Report ........................................................................................................... 3
Data Challenges ................................................................................................................................................ 3
3 Historical Water Use .................................................................................................................................................. 4
4 Sector-Based Water Use .......................................................................................................................................... 4
Water Use by Utility Size ............................................................................................................................... 9
5 Daily Water Use ....................................................................................................................................................... 11
6 Future and Related Efforts ................................................................................................................................... 12
Utility Efforts to Measure Water Use by Sectors ............................................................................... 12
TWDB Online Data-Collection Efforts.................................................................................................... 13
7 Conclusion ................................................................................................................................................................. 13
8 Appendix A – General Description of Senate Bill 181 ............................................................................... 14
Development of the Data Collection and Reporting Program .................................................... 14
Water Use Calculation Methodology .................................................................................................... 15
9 Appendix B – Sector Descriptions ..................................................................................................................... 16
10 Appendix C – List of Analyzed Water Utilities in 2015 ........................................................................... 19

Water Use of Texas Water Utilities
1
1 Executive Summary Texas’ diminished water supplies during 2011, the worst single-year drought in the state’s recorded history, reminded Texans of the importance of understanding how they use water. Both now and in the future, it is vital that Texans understand their water use so they can use it more efficiently.
In that same year, the 82nd Texas Legislature enacted Senate Bill 181, directing the Texas Water Development Board (TWDB) and the Texas Commission on Environmental Quality (TCEQ) to develop a uniform method for calculating water use and a related reporting program for municipalities and water utilities with more than 3,300 connections. In response to that legislation, the TWDB and TCEQ, in conjunction with the Water Conservation Advisory Council, developed Guidance and Methodology for Reporting on Water Conservation and Water Use for water utilities and the public (www.twdb.texas.gov/conservation/doc/SB181Guidance.pdf). The Guidance document sets out the necessary methods for calculating uniform water use.
Water utilities must use the methods prescribed in the Guidance document when they respond to the TWDB’s annual Water Use Survey.
From the 2015 Water Use Survey of nearly all community public water systems in the state, more than 350 water utilities served more than 3,300 customer connections and were able to categorize their water use sufficiently to be analyzed in this report. Significant findings from these utilities include the following:
• On average, 57 percent of metered municipal water is delivered to single-family and multi-family residential customers.
• In general, as utilities become larger, the relative percentage of their metered water delivered to residential sectors decreases, and deliveries to non-residential sectors increase. The utilities were analyzed in four size categories; in the smallest category, residential sectors averaged 69 percent of total deliveries, while in the largest, an average of 48 percent of the deliveries went to residential connections.
• Nearly two-thirds of these utilities were municipality-owned, although all types of ownership were represented by at least one utility.
• While the average per-person volume of all metered water varied greatly between utilities, the average per-person volume of water delivered to residential customers varied much less.
Water Use of Texas Water Utilities
2
This report finds that the pattern and volume of utility water usage can vary significantly, but there also appear to be commonalities that might allow utilities with similar customer profiles to share ideas and strategies regarding water conservation and drought management programs. In addition, more utilities are making progress in being able to categorize to whom they deliver water, and how much. With this knowledge, water utilities will be able to select the most appropriate conservation and/or drought management strategies, measure their implementation, and identify areas of further potential water savings.
2 Introduction As documented in regional and state water plans, planning for the state’s water supply is essential to avoid negative economic impacts and ensure the health and safety of the citizens of Texas. Of all the identified strategies to ensure future water supply, conservation is often the least expensive. In order for Texas water utilities to develop effective programs to save water, they must have a comprehensive understanding of how that water is used. Such understanding requires measuring water use and interpreting the meaning of those metrics. That necessary understanding is the basis of the Senate Bill 181 legislation and this biennial report (see Appendix A for a description of Senate Bill 181).
Purpose of Report
Sector-based reporting, the ability to report how much water was used by various customer sectors, can be highly beneficial to water providers by providing more specific information regarding customers and their usage. When utility water use data is limited to the total volume of water diverted and the population served, total gallons per capita per day is the default metric often used to evaluate performance. This can be misleading, however, because of highly variable water use profiles. It is important to keep in mind that the more detailed the information obtained per water use sector, the greater the understanding of how water is being used and where opportunities for conservation exist.
Detailed information about amounts of water delivered to the different customer sectors can be used by a utility for internal evaluation purposes and as a planning tool in evaluating their own conservation programs and system needs. In addition, such detailed information allows the utility to develop better targets and goals to be included in conservation plans and water utility profiles. Similarly, state planning efforts can benefit from higher resolution, sector-based water data that improves understanding of water use and conservation opportunities for various types of water use throughout the state.

Water Use of Texas Water Utilities
3
Ability for Water Utilities to Report
The Texas Legislature and water professionals recognize that many utilities’ customer accounting and billing systems may not be able to categorize their customers and their water use. While single-family residential accounts are generally easy to identify due to the small size of the meter, the institutional, commercial, and industrial customers are often grouped together. How the water is used within the institutional, commercial, and industrial sectors may not be distinguishable by the meter size or volume of water used by the customer. Because of the possible difficulties in reporting water use by the specified categories, Senate Bill 181 specified that the TCEQ may not adopt a rule requiring an entity to report data that is more detailed than a utility’s existing billing system is able to produce directly (Texas Water Code §16.404). The TCEQ may, however, require that billing systems purchased after September 1, 2011, be capable of reporting such detailed information. Regardless of the replacement rate of billing systems, some water utilities in the state are already working to categorize their customers with existing billing systems.
Data Challenges
In the past, small water utilities have not needed to categorize their customers. Because of limited resources, sector-based water use reporting could be difficult and burdensome for them. This report utilizes the connection threshold of 3,300, therefore, limits the statewide analysis of water use to populations of roughly more than 9,900 persons. Many counties within the state of Texas do not have a single utility that meet this requirement, thus this report is better understood as an analysis of urban utility water use and not an overall picture of all water use.
The data from the TWDB’s Water Use Survey used to prepare this report is self-reported, and the classification of customer accounts and the reporting of such information takes time for the utility to prepare. Analyzing changes over time becomes problematic when a utility responds one year but not the next, as this can show a decrease in sector volumes. Occasionally, utilities do not submit their annual reports. When that happens they are not eligible for TWDB funding or water right permits from TCEQ. However, as utilities grow accustomed to and improve the resolution of their sector-based data, apparent changes in sector volume over time may also be a result of a more accurate reclassification of the data.

Water Use of Texas Water Utilities
4
3 Historical Water Use Water use can vary significantly from year to year depending on weather. For that reason, it is beneficial to look at long-term trends over time. In 1999, reporting total water use data through the Water Use Survey became mandatory for water utilities, greatly increasing the reliability of water use data around the state. Overall, municipal water use peaked during the drought in 2011 (Figure 1).1 Thereafter, municipal water use declined as the drought continued to 2014 and even after the drought receded.
Figure 1 – Municipal water use over time (in acre-feet per year)
0
1,000,000
2,000,000
3,000,000
4,000,000
5,000,000
6,000,000
2010 2011 2012 2013 2014
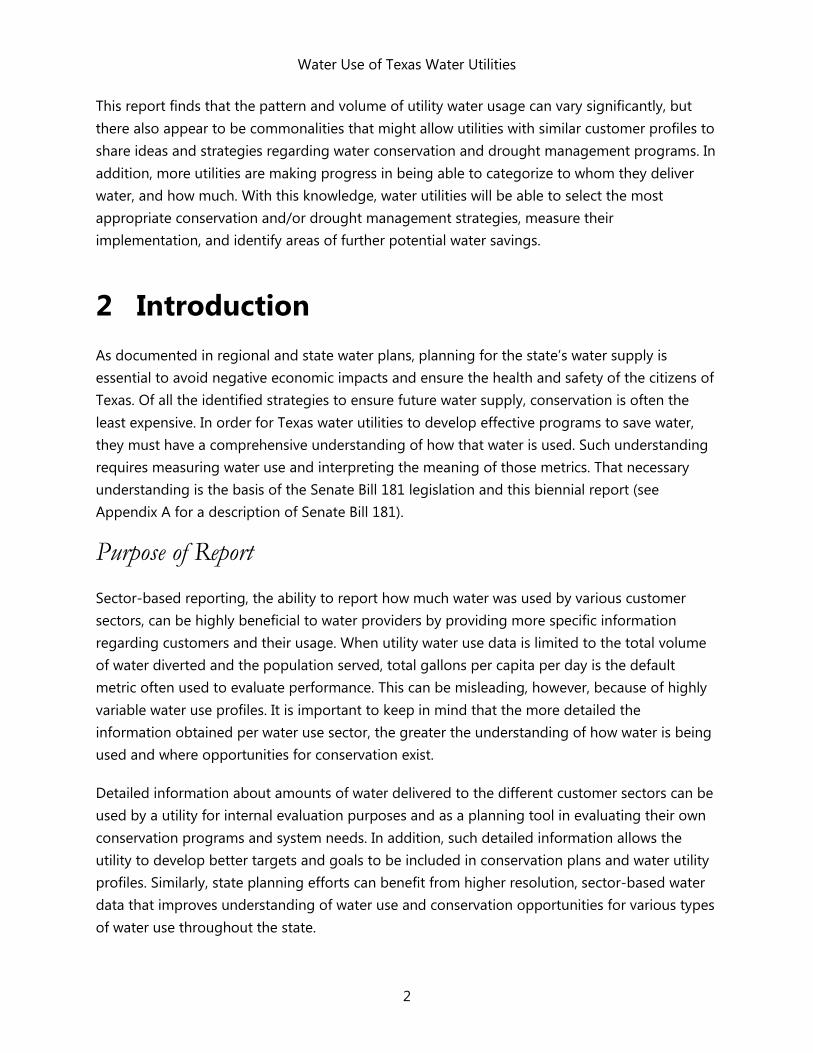
4 Sector-Based Water Use Categorizing water use into six sectors first became standardized in the 2012 reporting year (see Appendix B for definitions of each sector). Between 2012 and 2015, water use within almost all sectors has remained relatively stable (Figure 2). However, water use for each category could have actually declined over time when accounting for utilities reclassifying water use within the “other” sector. The sector with the largest volume, the single-family sector, mimics the historical
1 Municipal water use does not include water volumes sold to large manufacturing, mining, or steam-electric power facilities.

Water Use of Texas Water Utilities
5
total water use with a peak in volume in 2013 and then decreases each subsequent year. Over this same time period, the state’s population as a whole grew by over 1.3 million people, or 5 percent.2
A notable feature of the data is the “other” sector, in which every subsequent year has decreased in volume. An “Other” sector was initially included in the 2012 and 2013 water use surveys in order to capture water volumes from water systems that were not able to break out their water use. Beginning 2014, the Water Use Survey only includes legislation-specific categories. Starting with 2016 data, the online Water Use Survey will require utilities to categorize all metered water use into the appropriate sector. The decline in reported “other” sector water use reveals the improvement of categorization of water use over time.
2 U.S. Census Bureau population estimates - http://factfinder.census.gov/faces/tableservices/jsf/pages/productview.xhtml?src=bkmk
Water Use of Texas Water Utilities
6
Figure 2 – Historical sector-based water use (in billions of gallons)
In 2015, TWDB sent annual water use surveys to more than 4,000 public water systems. Each water utility, whether municipal owned, a district, a water supply corporation, or an investor-owned utility, may own one or more of the surveyed public water systems. Three hundred fifty-three utilities met the criteria of serving more than 3,300 connections (Figure 3). Nearly two-thirds of these utilities were municipality owned, although all types of ownership were represented by at least one utility. Of the more than 350 utilities, 311 were able to categorize at least 90 percent of their metered water use into one or more of the water use categories (see Appendix C for a listing of all 353 utilities).
0
50
100
150
200
250
300
350
400
450
500
2012 2013 2014 2015
Single-Family
Commercial
Industrial
Multi-Family
Institutional
Other
Agricultural

Water Use of Texas Water Utilities
7
Figure 3 – Analyzed water utilities by ownership type
Over half of the metered water was delivered to residential customers consisting of single-family (47 percent) and multi-family (10 percent) customers (Figure 4). However, the multi-family volumes area likely under reported, as many utilities have historically included apartment complexes with the commercial accounts. “Other” water use, which includes uncategorized metered water use, still accounts for more water than agricultural use even at its lowest reported volume.
Figure 4 – Sector-based water use (2015) Sectors shown as a percentage of total metered water.
Between 2013 and 2015, reported single-family residential water use decreased significantly for utilities within urban counties and many suburban counties (Figure 5). This may, to some degree, reflect conservation and drought management efforts implemented during 2011 and the following years. Most notably the limits on outdoor landscape irrigation, generally applied to residential, commercial, and institutional customers; however, identifying a definitive cause of changes would require an analysis of each utility. Some changes in volume may also be a result of reclassification of water use, for instance, from commercial to institutional. Note that the 3,300 connection requirement limits any analysis on more rural counties around the state and the impact of their conservation efforts.
227 88
28 9
1
0% 10% 20% 30% 40% 50% 60% 70%
MunicipalityDistrict/Authority
Water Supply CorporationInvestor Owned Utility
County
47% 21%
16% 10%
4% 1% 1%
0% 10% 20% 30% 40% 50% 60%
Single-FamilyCommercial
IndustrialMulti-FamilyInstitutional
OtherAgricultural

Water Use of Texas Water Utilities
8
Figure 5 – Change in reported water use by sector from 2013 to 2015 (in billions of gallons) Counties may be represented by one or more utilities. Multi-family and agricultural sectors are not included due to limited data.

Water Use of Texas Water Utilities
9
Water Use by Utility Size
Each utility serves a different customer base; however, it is instructive to categorize water utilities into general size categories to examine if there are common characteristics within the utilities of a similar size. The following section summarizes water use information for four general size categories based upon the total connections reported in the TCEQ’s Safe Drinking Water Information System:
• Medium water utilities – 3,300 to 16,667 connections (generally 10,000 to 50,000 population)
• Medium-large water utilities – 16,668 to 33,333 connections (generally 50,000 to 100,000 population)
• Large water utilities – 33,334 to 166,666 connections (generally 100,000 population to 500,000 population)
• Metropolitan water utilities – more than 166,666 connections (generally more than 500,000 population)
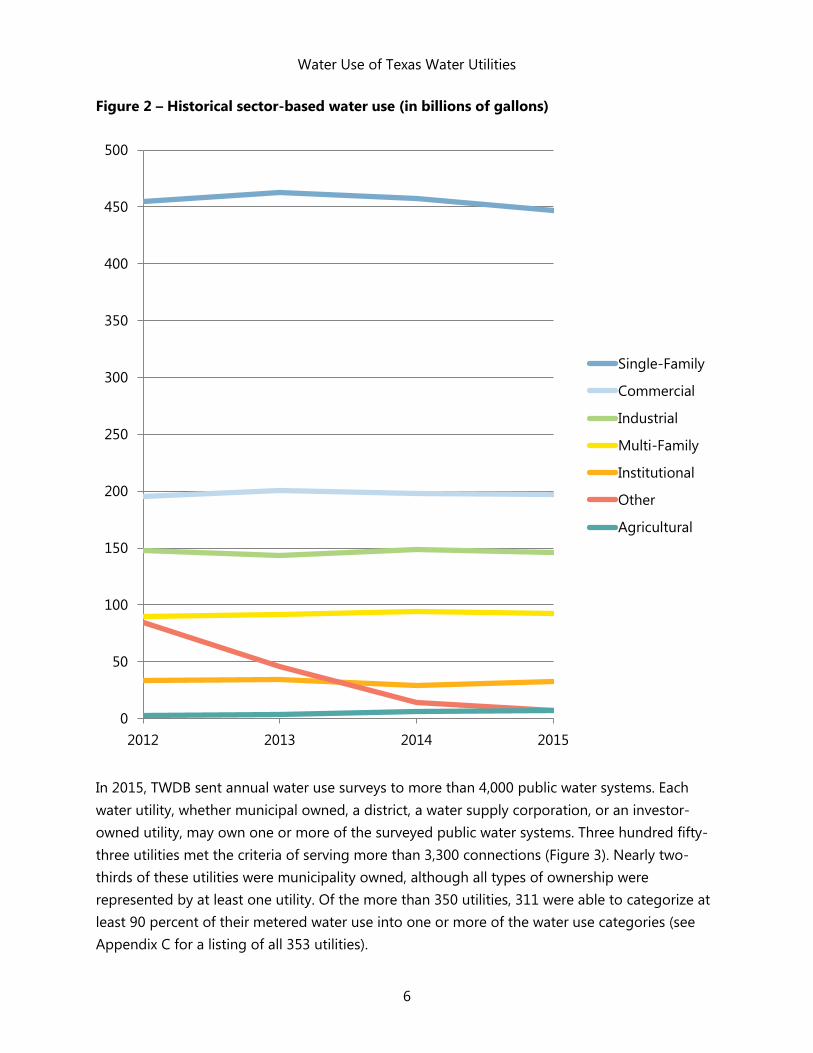
The criterion of 3,300 connections was set in Senate Bill 181. The category of “medium” is used to distinguish such systems from the small-system designation of utilities with less than 3,300 connections used by the U.S. Environmental Protection Agency’s Drinking Water Infrastructure Needs Survey and Assessment. The additional break points for the size categories were selected for this report based upon population thresholds for various local government development powers, such as extra-territorial jurisdiction buffer size and eligibility for federal Community Development Block Grants. The vast majority of water utilities fall into the medium category (Figure 6).
It is generally the case that smaller utilities will have a greater percentage of their water used for single-family residences (Figure 7). As a community and its water utility grows, more multi-family, institutional, commercial, and industrial customers tend to be established. Furthermore, agricultural water use tends to decrease as a utility becomes larger and more urbanized. There seems to be little trend in the “other” sector and may expose a limitation of the data.
Although there are strong trends between size and associated sector water use, there are utilities which serve almost 100 percent of their water to single family homes. Conversely, some utilities may serve significantly more industrial, commercial, or institutional customers. The customer base of utilities is unique to the water demands of their location, other utilities in the surrounding area, and available water sources. For example, the industrial sector of metropolitan utilities is heavily weighted by City of Houston’s response of 48 percent industrial use.
Water Use of Texas Water Utilities
10
Figure 6 – Analyzed water utilities by size (2015)
Figure 7 – Sector-based water use by size (2015) Sectors with less than 3 percent are not labeled on the chart. Percentages may not total to 100 percent due to rounding.
284
34
29
6
0% 10% 20% 30% 40% 50% 60% 70% 80% 90%
Medium
Large
Medium-Large
Metropolitan
63% 57%
53%
35%
17% 19%
23%
24%
8% 7% 10%
26%
6% 7%
10% 13% 4%
4% 4% 3% 4%
0%
10%
20%
30%
40%
50%
60%
70%
80%
90%
100%
Medium Medium-Large Large Metropolitan
Agricultural
Other
Institutional
Multi-Family
Industrial
Commercial
Single-Family

Water Use of Texas Water Utilities
11
5 Daily Water Use Comparing gallons per capita daily water use is often difficult due to variations in assumptions and calculations. Senate Bill 181 legislation directed the TWDB and TCEQ to develop a uniform methodology of calculating the total and residential water use in gallons per capita daily. The average total gallons per capita daily generally increases with the size of the utility due to the fact that larger utilities tend to have more institutional, commercial, and industrial customers which will increase the gallons per capita daily; more water is used, but not necessarily by residents.
In regard to per capita water use, as shown in Table 1, no correlation appears between the average residential (single-family and multi-family) water use gallons per capita daily, often referred to as ”GPCD,” and the size category of the utility. This may be due to the difficulty in refining the connection count and water use reporting of multi-family facilities, but it may also be that there is little variation in the average single-family residential water use between utilities of a different size, as shown in Table 1. A larger variation may occur when examining other characteristics, including: the geographic location of the utility, the residential water rates, or automatic irrigation characteristics of residential lots.
Table 1 – Average per-capita daily water use by utility size for 2015 (in gallons) Using the 2010 U.S. Census average persons-per-household size for Texas of 2.75.
Medium Medium-large Large Metropolitan
All analyzed utilities
Residential 84 92 88 91 88
Total water use 111 127 129 173 138
When water use by sector is available, the average per-connection daily water use better characterizes the utility and their customers. When daily water use per connection is calculated, the water use variation between different customer sectors becomes apparent (Table 2). The higher per-connection water usage for multi-family connections is possibly an indication of the difficulty faced by utilities in determining the number of apartment units/connections versus a master meter for an entire apartment complex. Instructions in the Water Use Survey specify the intent to collect the number of housing units rather than a count of the master connections for each apartment complex. The types of facilities within commercial, industrial, institutional, and agricultural sectors can greatly vary in water use and are not represented in this report.

Water Use of Texas Water Utilities
12
Table 2 – Average per-connection daily water use by utility size for 2015 (in gallons)
Medium Medium-large Large Metropolitan All analyzed
utilities
Single-family residential 228 253 248 207 229
Multi-family residential 263 260 218 607 345
Commercial 767 1,076 1,223 1,335 1,134
Industrial 27,236 19,527 9,300 10,063 10,945
Institutional 1,956 2,081 2,013 5,958 2,565
Agricultural 759 1,122 562 0 851
Total water use 305 348 356 476 383
6 Future and Related Efforts
Utility Efforts to Measure Water Use by Sectors
As previously noted, 2012 was the first year that water utilities were surveyed for their categorical water use and the number of connections, as specified in Senate Bill 181. Of the 353 water utilities analyzed, 311 were able to categorize 90 percent or more of their 2015 metered water use. This represents a slight increase in the number of utilities able to report at that level in the 2015 report (304 utilities). The decrease in the volume of metered water categorized as Other in Figure 2 shows that utilities are increasing their ability to account for water in the six sectors cited in the statute. Utility efforts shown in the increase of information reported provide encouragement in the resolve to better understand utility water use.

Water Use of Texas Water Utilities
13
TWDB Online Data-Collection Efforts
The 83rd Texas Legislature (2013) appropriated funds for the TWDB to consolidate online reporting for the Water Use Survey, Water Loss Audit, and the Conservation Plan Annual Report.3 As was noted earlier, the information analyzed in this report was collected in the Water Use Survey due to its annual and near universal collection of data from community public water systems, which are the building blocks of water utilities. The integration of the data collection between the survey, the audit, and the Conservation Plan Annual Report will provide a unique opportunity to view how utilities use, lose, and conserve their water. In 2016, the two reports (with existing online tools), the Water Use Survey and the Water Loss Audit, were integrated such that all common information entered into the survey will automatically be populated in the audit’s online form. A subsequent phase of the project, intended to be operational in January 2017, will entail the creation of an online reporting tool for the Conservation Plan Annual Report. Similar to the Survey-Audit integration, any common data entered into the first two forms will be populated in the Conservation Annual Report.
7 Conclusion Texas water utilities are increasing their ability to understand their individual customer base and the volume of water delivered to customers. This will allow Texans to better understand how water is being used by their water utilities. Such knowledge will assist utilities to better focus their water conservation efforts and programs on the customer sectors for which the results will be most cost effective to their system.
3 83rd Texas Legislature, General Appropriations Act, page VI-61, paragraph 24

Water Use of Texas Water Utilities
14
8 Appendix A – General Description of Senate Bill 181 In 2011, the 82nd Texas Legislature passed Senate Bill 181 to address the calculation and reporting of water usage by municipalities and water utilities for state water planning and other purposes. Through amendments to Chapter 16 of the Texas Water Code, this legislation established a consistent method for reporting water use data and to improve conservation reporting procedures.
Texas Water Code §16.053(e) requires that regional water plans include information on projected water use and conservation in the regional water planning area, as well as the implementation of projects and water conservation strategies necessary to meet the state’s water demands based on these projections. Evaluating implementation of such conservation strategies is dependent upon utilities measuring their water use in a consistent manner over time.
Senate Bill 181 added §16.403 and §16.404 to the Texas Water Code. Section 16.403, Water Use Reporting, requires the TWDB and the TCEQ, in consultation with the Water Conservation Advisory Council (WCAC), to develop a uniform, consistent methodology for calculating water use and a guidance document for reporting on water conservation. Municipalities and water utilities with more than 3,300 connections are to use these methodologies in their efforts to develop water conservation plans and prepare annual reports and five-year implementation reports. Section 16.404, Rules and Standards, directs the TWDB and the TCEQ to require an entity to report the most detailed level of water use data that the entity is capable of producing.
Senate Bill 181 required that by January 1 of 2015 and of each subsequent odd-numbered year, the TWDB shall submit to the legislature a report regarding the statewide water usage by water utilities in the residential, industrial, agricultural, commercial, and institutional sectors, as well as the data collection and reporting program developed.
Development of the Data Collection and Reporting Program
The development of the reporting methodology was conducted by a committee described as the “Senate Bill 181 Committee,” composed of staff from the TWDB and the TCEQ, as well as interested members of the WCAC. The committee met periodically in late 2011 and early 2012 to discuss rules, definitions, calculations, guidance documents, and other requirements pertaining to the implementation of the bill. Documents developed by the Senate Bill 181

Water Use of Texas Water Utilities
15
Committee were posted on the TWDB’s website for public review and resulted in the Guidance and Methodology for Reporting on Water Conservation and Water Use.4 Much of the following information can be found in the guidance document available on the TWDB’s website.
Water Use Calculation Methodology
Senate Bill 181 stated that “a sector-based water use metric, adjusted for variables in water use by municipalities and water utilities, is necessary in order to provide an accurate comparison of water use and water conservation among municipalities and water utilities” (Texas Water Code §16.403(a)(6)). The TWDB and TCEQ, in consultation with the WCAC, were tasked to develop a uniform, consistent methodology and guidance for calculating water use and conservation to be used by a municipality or water utility in developing water conservation plans and preparing reports required under this code. At a minimum, this sector-based methodology and guidance was required by Senate Bill 181 (Texas Water Code §16.403(b)) to include
• a method of calculating total water use by a municipality or water utility, including water billed and nonrevenue water used, and a method of calculating water use for each sector of water users served by a municipality or water utility;
• a method of calculating total water use by a municipality or water utility in gallons per capita per day;
• a method of classifying water users within sectors; • a method of calculating water use in the residential sector that includes both single-
family and multi-family residences, in gallons per capita per day; • a method of calculating water use in the industrial, agricultural, commercial, and
institutional sectors that is not dependent on a municipality’s population or the number of customers served by a water utility;
• guidelines on the use of service populations by a municipality or water utility in developing a per-capita-based method of calculation, including guidance on the use of permanent and temporary populations in making calculations.
The results of the collaboration between the TWDB, TCEQ, and WCAC in developing the methodology and guidance can be found in Guidance and Methodology for Reporting on Water Conservation and Water Use.

Water Use of Texas Water Utilities
16
9 Appendix B – Sector Descriptions Total Water Use and Residential Water Use
The legislature directed the TWDB and the TCEQ, in consultation with the Water Conservation Advisory Council, to develop “a uniform, consistent methodology and guidance for calculating water use,” including total water use in gallons per capita daily and residential (single-family and multi-family) in gallons per capita daily (Texas Water Code §16.403b). The previously mentioned Senate Bill 181 Committee developed such methodology and guidance and a full description of such gallons per capita daily figures can be found in Guidance and Methodology for Reporting on Water Conservation and Water Use.4
Total Water Use
“Total gallons per capita per day takes into account all water use sectors that a system may have including residential, industrial, commercial, institutional, and agricultural. This metric then divides the total volume of water taken into the system by a population number even though not all of the water use may be population-dependent” (Guidance, p, 29).
Residential Water Use
“Residential gallons per capita per day - the total gallons sold for residential use by a public water supplier divided by the residential population served and then divided by the number of days in the year” (Texas Administrative Code Chapter 288.1) (Guidance, p. 33).
Single-family Residential
Single-family residential use is defined as the use of water that is delivered to single residences, which applies to indoor and outdoor uses. Single-family residential use is a classification of housing where a single detached dwelling is a free-standing residential building. However, duplexes are also included in the single-family residential sector due to the similarity in water use and the common practice of allowing duplexes within single-family residential zoning areas.
4 www.twdb.texas.gov/conservation/doc/SB181Guidance.pdf (Hereafter referred to as Guidance.)

Water Use of Texas Water Utilities
17
Multi-family Residential
Multi-family residential use is a classification of housing where multiple separate housing units for residents are contained within one building or several buildings within one complex. Water use and the number of units (connections) is often difficult for utilities to report as the apartment complex may be categorized as commercial and the complex may have a single meter.
Institutional
Institutional use is defined as the use of water by an establishment dedicated to public service, such as a school, university, church, hospital, nursing home, prison, or government facility. All facilities dedicated to public service are considered institutional regardless of ownership. (Guidance, p. 15)
Commercial
Commercial use is defined as the use of water by a place of business, such as a hotel, restaurant, or office building. This does not include multi-family residences or agricultural, industrial, or institutional users. (Guidance, p. 14)
Industrial
Industrial use is defined as the use of water in processes designed to convert materials of a lower order of value into forms having greater usability and commercial value, and the development of power by means other than hydroelectric, but does not include agricultural use. (Guidance, p. 14)
Agricultural
Agricultural use is defined as any water use involving agriculture, including irrigation. Agriculture is defined to include the following activities:
• Cultivating the soil to produce crops for human food, animal feed, or planting seed, or for the production of fibers
• The practice of floriculture, viticulture, silviculture, and horticulture, including the cultivation of plants in containers or non-soil media by a nursery grower
• Raising, feeding, or keeping animals for breeding purposes or for the production of food or fiber, leather, pelts, or other tangible products having a commercial value
• Raising or keeping equine animals • Wildlife management

Water Use of Texas Water Utilities
18
• Planting cover crops, including cover crops cultivated for transplantation, or leaving land idle for the purpose of participating in any governmental program or normal crop or livestock rotation procedure. (Guidance, p. 14)

Water Use of Texas Water Utilities
19
10 Appendix C – List of Analyzed Water Utilities in 2015 (FWSD = Fresh Water Supply District; MUD = Municipal Utility District; SUD = Special Utility District; WCID = Water Control and Improvement District; WSC = Water Supply Corporation)
Acton MUD Agua SUD Aqua Texas Aqua WSC Atascosa Rural WSC Benbrook Water Authority Benton City WSC Bethesda WSC Bi-County WSC Bolivar Peninsula SUD Bolivar WSC Bridgestone MUD Brookesmith SUD Brushy Creek MUD Caddo Basin SUD Canyon Lake Water Service Cash SUD City of Abilene City of Addison City of Alamo City of Alice City of Allen City of Alvin City of Amarillo City of Andrews City of Angleton City of Anna City of Aransas Pass City of Arlington City of Athens City of Austin
City of Azle City of Balch Springs City of Bastrop City of Bay City City of Baytown City of Beeville City of Bellmead City of Belton City of Big Spring City of Boerne City of Bonham City of Borger City of Brenham City of Bridge City City of Brownfield City of Brownsville City of Brownwood City of Bryan City of Buda City of Burkburnett City of Burleson City of Canyon City of Carrollton City of Carthage City of Cedar Hill City of Cedar Park City of Celina City of Cibolo City of Cleburne City of Clute City of College Station
City of Colleyville City of Colony City of Conroe City of Converse City of Copperas Cove City of Corpus Christi City of Corsicana City of Crosbyton City of Crowley City of Cuero City of Dalhart City of Dallas City of Deer Park City of Denison City of Denton City of Desoto City of Donna City of Dumas City of Duncanville City of Eagle Pass City of Edinburg City of El Campo City of Elgin City of Ennis City of Euless City of Fairview City of Farmers Branch City of Fate City of Forest Hill City of Forney City of Fort Stockton

Water Use of Texas Water Utilities
19
City of Fort Worth City of Fredericksburg City of Freeport City of Friendswood City of Gainesville City of Galena Park City of Galveston City of Garland City of Georgetown City of Glenn Heights City of Graham City of Granbury City of Grand Prairie City of Grapevine City of Groves City of Haltom City City of Harker Heights City of Harlingen City of Henderson City of Hereford City of Hewitt City of Hidalgo City of Highland Park City of Highland Village City of Hitchcock City of Horseshoe Bay City of Houston City of Humble City of Huntsville City of Hurst City of Hutto City of Ingleside City of Irving City of Jacksonville City of Jasper City of Jersey Village City of Katy City of Kerrville City of Kilgore
City of Killeen City of Kingsville City of Kyle City of La Marque City of La Porte City of Lake Jackson City of Lamesa City of Lancaster City of Laredo City of League City City of Leander City of Levelland City of Lewisville City of Lockhart City of Longview City of Lubbock City of Lufkin City of Mabank City of Mansfield City of Marshall City of Mcallen City of Mckinney City of Mercedes City of Mesquite City of Midland City of Midlothian City of Mineral Wells City of Mission City of Mount Pleasant City of Murphy City of Nacogdoches City of Navasota City of Nederland City of New Braunfels City of North Richland Hills City of Odessa City of Orange City of Palestine City of Paris
City of Pasadena City of Pearland City of Pecos City of Pflugerville City of Pharr City of Plainview City of Plano City of Pleasanton City of Port Arthur City of Port Lavaca City of Port Neches City of Portland City of Princeton City of Richardson City of Richland Hills City of Richmond City of Rio Grande City City of Robinson City of Rockport City of Rockwall City of Roma City of Rosenberg City of Round Rock City of Rowlett City of Royse City City of Sachse City of Saginaw City of San Angelo City of San Benito City of San Juan City of San Marcos City of Schertz City of Seabrook City of Seagoville City of Seguin City of Sherman City of Silsbee City of Snyder City of South Houston

Water Use of Texas Water Utilities
20
City of Southlake City of Stephenville City of Sugarland City of Sulphur Springs City of Sweetwater City of Taylor City of Terrell City of Texarkana City of Texas City City of Tomball City of Tyler City of Universal City City of Uvalde City of Vernon City of Victoria City of Waco City of Watauga City of Waxahachie City of Weatherford City of Webster City of Weslaco City of West University Place City of Wichita Falls City of Woodway City of Wylie Clear Brook City MUD Clear Lake City Water Authority Corix Utilities Texas Crystal Clear WSC Cypress Hill MUD 1 Cypress Springs SUD Del Rio Utilities Commission Denton County FWSD 1-A Denton County FWSD 7 East Cedar Creek FWSD East Central WSC-General Water Distribution System (East Central WSC)
East Fork SUD East Rio Hondo WSC El Paso Water Utilities Public Service Board Fort Bend County MUD 23 Fort Bend County MUD 25 Fort Bend County MUD 30 Fort Bend County WCID 2 G M WSC Galveston County WCID 1 Goforth SUD Green Valley SUD Gum Springs WSC Harris County FWSD 51 Harris County FWSD 61 Harris County MUD 102 Harris County MUD 120 Harris County MUD 157 Harris County MUD 165 Harris County MUD 167 Harris County MUD 168 Harris County MUD 200 Harris County MUD 26 Harris County MUD 285 Harris County MUD 368 Harris County MUD 386 Harris County MUD 55 Harris County MUD 71 Harris County MUD 81 Harris County MUD 82 Harris County Utility District 6 Harris County WCID 109 Harris County WCID 36 Hilco United Services H-M-W SUD Horizon Regional MUD Hudson WSC Johnson County SUD Jonah Water SUD
Kempner WSC Kingsland WSC Laguna Madre Water District Lake Cities Municipal Utility Authority Lake Livingston Water Supply And Sewer Service Lakeway MUD Lamar County Water Supply District Langham Creek Utility District Lee County WSC Lindale Rural WSC Lumberton MUD Manville WSC Mauriceville SUD Memorial Villages Water Authority Military Highway WSC Monarch Utilities I Montgomery County MUD 46 Montgomery County MUD 47 Montgomery County MUD 60 Montgomery County MUD 9 Mountain Peak SUD MSEC Enterprises Mustang SUD New Caney MUD Newport MUD North Alamo WSC North Austin MUD 1 Northtown MUD Northwest Harris County MUD 5 Northwest Park MUD Nueces County WCID 3 Nueces County WCID 4 Orange County WCID 1 Pampa Municipal Water System

Water Use of Texas Water Utilities
21
Pecan Grove MUD 1 Perryton Municipal Water System Porter SUD Quadvest Quail Valley Utility District Rayford Road MUD Red River Authority of Texas Remington MUD 1 Rockett SUD S S WSC San Antonio Water System Sardis Lone Elm WSC Sharyland WSC
Southern Montgomery County MUD Southern Utilities Spring Creek Utility District Springs Hill WSC Sunbelt FWSD The Consolidated WSC Timber Lane Utility District Town of Corinth Town of Flower Mound Town of Little Elm Town of Prosper Travis County WCID 17 Tri SUD
Trinity Bay Conservation District Walnut Creek SUD Wellborn SUD Wells Branch MUD West Cedar Creek MUD West Travis County Public Utility Agency Wickson Creek SUD Windermere Utility Zapata County
*City of Beaumont, City of Bedford, City of Bellaire, City of University Park, and US Air Force–Medina & Lackland Facility were excluded from sector-based analysis due to incomplete data.