water use of texas water utilities · water use of texas water utilities, january 1, ......
TRANSCRIPT

Report to the 84th Texas LegislatureJanuary 2015
Water Use of Texas Water Utilities


WATER USE OF TEXAS WATER UTILITIES A BIENNIAL REPORT TO THE TEXAS LEGISLATURE, JANUARY 1, 2015

This page is intentionally blank.

Table of Contents
1 Executive Summary ........................................................................................................................................................ 1
2 Introduction ................................................................................................................................................................ ....... 2
2.1 General Description of Senate Bill 181 .......................................................................................................... 2
2.2 Development of the Data Collection and Reporting Program ................................................................. 2
2.3 Water Use Calculation Methodology .............................................................................................................. 3
2.3.1 Total Water Use and Residential Water Use ....................................................................................... 3
2.3.2 Water Use Sector Descriptions ................................................................................................................ 4
3 Statewide Water Use ....................................................................................................................................................... 5
4 Utility Water Use ............................................................................................................................................................. 6
4.1 Ability of Water Utilities to Report .................................................................................................................. 6
4.2 2013 Water Use by Sector ................................................................................................................................... 6
4.2.1 Residential Water Use ............................................................................................................................... 10
4.2.2 Institutional ................................................................................................................................................... 11
4.2.3 Commercial .................................................................................................................................................. 11
4.2.4 Industrial........................................................................................................................................................ 11
4.2.5 Agricultural .................................................................................................................................................. 12
4.2.6 Complete Reporting Water Utilities ..................................................................................................... 12
4.3 2013 Water Use by Utility Size ....................................................................................................................... 13
5 Water Use in Gallons Per Capita Daily .................................................................................................................. 19
6 Future and Related Efforts .......................................................................................................................................... 20
6.1 Utility Efforts to Measure Water Use by Sectors ...................................................................................... 20
6.2 TWDB Online Data-Collection Efforts ........................................................................................................ 20
7 Conclusion ................................................................................................................................................................ ....... 21
8 Appendix A – List of Analyzed Water Utilities ................................................................................................... 22
9 Appendix B – Utilities with Significant Water Use in Single Sector ............................................................ 25
10 Appendix C - Complete Reporting Utilities .......................................................................................................... 27


Water Use Of Texas Water Utilities, January 1, 2015
1
1 EXECUTIVE SUMMARY Since 2011, Texans have been forced to reconsider how they use their water. That year produced the worst single-year drought in recorded history, and more than 1,000 public water systems enacted voluntary or mandatory water restrictions for their customers. The following year saw a continuation of restrictions by water utilities on how individuals and businesses used water, but it also saw the completion of the 2012 State Water Plan, in which approximately 20 percent of the 2060 municipal water needs are expected to be met by conservation activities of utilities. Now, and in the future, it is vital that Texans understand how they use water and how to use it most efficiently.
In 2011, the 82nd Texas Legislature enacted Senate Bill 181, directing the Texas Water Development Board (TWDB) and the Texas Commission on Environmental Quality (TCEQ) to develop a uniform method for calculating water use and a related reporting program for municipalities and water utilities. This report provides a description of the reporting program, as well as information regarding the customers and the volumes delivered of responding Texas water utilities.
The TWDB and TCEQ staffs, in conjunction with the Water Conservation Advisory Council, have developed a uniform and consistent method of calculating water use and have provided such guidance to water utilities and the public. From the 2013 data collected, 304 water utilities met the size and data-quality requirements to be analyzed in this report. Significant findings of the reporting from these utilities include:
• More than two-thirds of these utilities were municipal-owned, although all types of ownership were represented by at least one utility.
• On average, the majority of metered water (58 percent) is delivered to single-family and multi-family residential customers.
• Thirty-four utilities, or 11 percent of the total analyzed, reported significant deliveries to customers in the non-residential sectors (institutional, commercial, and industrial). For such utilities, the water delivered to residential customers represented a much smaller portion of the volume delivered, an average of only 35 percent.
• In general, as utilities become larger, the relative percentage of their metered water delivered to residential sectors decreases, and deliveries to non-residential sectors increase. The utilities were analyzed in four size categories; in the smallest category, residential sectors averaged 69 percent of total deliveries, while in the largest, an average of 48 percent of the deliveries went to residential connections.
• While the per-person volume of all metered water varied greatly between utilities, the per-person volume of water delivered to residential customers varied much less.
This report finds that the pattern and volume of utility water usage can vary significantly, but there also appear to be commonalities that might allow utilities with similar customer profiles to share ideas and strategies. In addition, more utilities are making progress in being able to categorize to whom they deliver water, and how much. As demands on the water supply of Texas utilities increase, whether through droughts that may occur next year, or in 50 years, it will be essential to understand how the water is used. With this knowledge, water utilities will be able to customize and maximize their conservation efforts to make the most of this precious resource.

Water Use Of Texas Water Utilities, January 1, 2015
2
2 INTRODUCTION As documented in regional and state water plans, as well as reported in the media throughout the past several drought years, planning for the state’s water supply is essential to avoid negative economic impacts and ensure the health and safety of the citizens of Texas. Of all the identified strategies to ensure future water supply, conservation is, generally speaking, the least expensive. To use our current water supply more efficiently is usually less expensive than developing new supplies. However, in order for Texas water utilities to develop effective programs to save water, they must have a comprehensive understanding of how that water is used. Such understanding requires measuring water use and interpreting the meaning of those metrics. That needed understanding is the basis of the Senate Bill 181 legislation and this biennial report.
2.1 GENERAL DESCRIPTION OF SENATE BILL 181 In 2011, the 82nd Texas Legislature passed Senate Bill 181 to address the calculation and reporting of water usage by municipalities and water utilities for state water planning and other purposes. Through amendments to Chapter 16 of the Texas Water Code, this legislation established a consistent method for reporting water use data and to improve conservation reporting procedures.
Texas Water Code §16.053(e) requires that regional water plans include information on projected water use and conservation in the regional water planning area, as well as the implementation of projects and water conservation strategies necessary to meet the state’s water demands based on these projections. Evaluating implementation of such conservation strategies is dependent upon utilities measuring their water use in a consistent manner over time.
Prompted by the legislature’s call to track water use over time and evaluate the effects of water conservation programs, Senate Bill 181 added §16.403 and §16.404 to the Texas Water Code. Section 16.403, Water Use Reporting, requires the TWDB and the TCEQ, in consultation with the Water Conservation Advisory Council, to develop a uniform, consistent methodology for calculating water use and a guidance document for reporting on water conservation. Municipalities and water utilities with more than 3,300 connections are to use these methodologies in their efforts to develop water conservation plans and prepare annual reports and five-year implementation reports. Section 16.404, Rules and Standards, directs the TWDB and the TCEQ to require an entity to report the most detailed level of water use data that the entity is capable of producing.
Senate Bill 181 required that by January 1, of 2015 and of each subsequent odd-numbered year, the TWDB shall submit to the legislature a report regarding the statewide water usage by water utilities in the residential, industrial, agricultural, commercial, and institutional sectors, as well as the data collection and reporting program developed.
2.2 DEVELOPMENT OF THE DATA COLLECTION AND REPORTING PROGRAM The development of the reporting methodology was conducted by a committee described as the “Senate Bill 181 Committee”, composed of staff from the TWDB and the TCEQ, as well as interested members of the Water Conservation Advisory Council. The committee met periodically in late 2011 and early 2012 to

Water Use Of Texas Water Utilities, January 1, 2015
3
discuss rules, definitions, calculations, guidance documents, and other requirements pertaining to the implementation of the bill. Documents developed by the Senate Bill 181 Committee were posted on the TWDB’s website for public review and resulted in the Guidance and Methodology for Reporting on Water Conservation and Water Use.1 Much of the following information can be found in the guidance document available on the TWDB’s website.
2.3 WATER USE CALCULATION METHODOLOGY Senate Bill 181 stated that “a sector-based water use metric, adjusted for variables in water use by municipalities and water utilities, is necessary in order to provide an accurate comparison of water use and water conservation among municipalities and water utilities” (Texas Water Code §16.403(a)(6)). The TWDB and TCEQ, in consultation with the Water Conservation Advisory Council, were tasked to develop a uniform, consistent methodology and guidance for calculating water use and conservation to be used by a municipality or water utility in developing water conservation plans and preparing reports required under this code. At a minimum, this sector-based methodology and guidance was required by Senate Bill 181 (Texas Water Code §16.403(b)) to include:
• A method of calculating total water use by a municipality or water utility, including water billed and nonrevenue water used, and a method of calculating water use for each sector of water users served by a municipality or water utility.
• A method of calculating total water use by a municipality or water utility in gallons per capita per day.
• A method of classifying water users within sectors. • A method of calculating water use in the residential sector that includes both single-family and
multi-family residences, in gallons per capita per day. • A method of calculating water use in the industrial, agricultural, commercial, and institutional
sectors that is not dependent on a municipality’s population or the number of customers served by a water utility.
• Guidelines on the use of service populations by a municipality or water utility in developing a per-capita-based method of calculation, including guidance on the use of permanent and temporary populations in making calculations.
2.3.1 TOTAL WATER USE AND RESIDENTIAL WATER USE The legislature directed the TWDB and the TCEQ, in consultation with the Water Conservation Advisory council, to develop “a uniform, consistent methodology and guidance for calculating water use…” including total water use in gallons per capita daily and residential (single-family and multi-family) in gallons per capita daily (Texas Water Code §16.403b). The previously mentioned Senate Bill 181 Committee developed such methodology and guidance and a full description of such gallons per capita daily figures can be found in the guidance document1.
Total Water Use “Total gallons per capita per day takes into account all water use sectors that a system may have including residential, industrial, commercial, institutional, and agricultural. This metric then divides the total
1 http://www.twdb.texas.gov/conservation/doc/SB181Guidance.pdf. (Hereafter referred to as Guidance.)

Water Use Of Texas Water Utilities, January 1, 2015
4
volume of water taken into the system by a population number even though not all of the water use may be population-dependent,” (Guidance, p. 29).
Residential Water Use “Residential gallons per capita per day - the total gallons sold for residential use by a public water supplier divided by the residential population served and then divided by the number of days in the year,” (Texas Administrative Code Chapter 288.1) (Guidance, p. 33).
2.3.2 WATER USE SECTOR DESCRIPTIONS Single-Family Residential Single-family residential use is defined as the use of water that is delivered to single residences, which applies to indoor and outdoor uses. Single-family residential use is a classification of housing where a single detached dwelling is a free-standing residential building. However, duplexes are also included in the single-family residential sector due to the similarity in water use and the common practice of allowing duplexes within single-family residential zoning areas.
Multi-Family Residential Multi-family residential use is a classification of housing where multiple separate housing units for residents are contained within one building or several buildings within one complex. Water use and the number of units (connections) are often difficult for utilities to report as the apartment complex may be categorized as commercial and the complex may have a single meter.
Institutional Institutional use is defined as the use of water by an establishment dedicated to public service, such as a school, university, church, hospital, nursing home, prison, or government facility. All facilities dedicated to public service are considered institutional regardless of ownership (Guidance, p. 15).
Commercial Commercial use is defined as the use of water by a place of business, such as a hotel, restaurant, or office building. This does not include multi-family residences or agricultural, industrial, or institutional users (Guidance, p. 14).
Industrial Industrial use is defined as the use of water in processes designed to convert materials of a lower order of value into forms having greater usability and commercial value, and the development of power by means other than hydroelectric, but does not include agricultural use (Guidance, p. 14).
Agricultural Agricultural use is defined as any water use involving agriculture, including irrigation. Agriculture is defined to include the following activities:
• Cultivating the soil to produce crops for human food, animal feed, or planting seed, or for the production of fibers.
• The practice of floriculture, viticulture, silviculture, and horticulture, including the cultivation of plants in containers or non-soil media by a nursery grower.

Water Use Of Texas Water Utilities, January 1, 2015
5
• Raising, feeding, or keeping animals for breeding purposes or for the production of food or fiber, leather, pelts, or other tangible products having a commercial value.
• Raising or keeping equine animals. • Wildlife management. • Planting cover crops, including cover crops cultivated for transplantation, or leaving land
idle for the purpose of participating in any governmental program or normal crop or livestock rotation procedure (Guidance, p. 14).
Benefits of Sector-Based Water Data Sector-based reporting can be highly beneficial to water providers by providing more specific information regarding such customers and their usage. With well-defined and consistent analysis of data and information per sector, water providers and user groups can develop more effective conservation initiatives and programs.
When a utility only knows the total volume of water diverted and the population served, total gallons per capita per day is by default the single metric often used to evaluate performance. This can be misleading because of highly variable water use profiles. It is important to keep in mind that the more detailed the information obtained per water use sector, the greater the understanding of how water is being used and where opportunities for conservation exist.
Total gallons per capita per day can be used by a utility for internal evaluation purposes and as a planning tool in evaluating their own conservation programs and system needs. Total gallons per capita per day and population-based sectors, targets, and goals should be considered by public water suppliers when developing utility profiles and water conservation plans, as required by the state. Similarly, state planning efforts can benefit from higher-resolution, sector-based water data that improves understanding of water use and conservation opportunities for various types of water use throughout the state.
3 STATEWIDE WATER USE At the time of this report, the most recent statewide water use summary was for the year 2012. Such water use volumes are developed based on the TWDB annual survey of water systems and industrial facilities, and estimated volumes, particularly for the irrigation and livestock usage. The largest category of water use in Texas is for irrigated agriculture at 58 percent of the state’s water use (Table 1). Second to irrigation is the municipal sector at 28 percent, which is composed of residential, institutional, and commercial water use. Some small-scale or light industrial water usage is included in the municipal sector while large-scale or self-supplied manufacturing firms are represented in the manufacturing sector.

Water Use Of Texas Water Utilities, January 1, 2015
6
Table 1. Statewide Water Use Summary, 2012 Water Use Sector 2012 Water Use Estimate
(Acre-Feet1) Percentage of Total
State Water Use Irrigation 9,490,008 59 Livestock 269,413 2 Manufacturing 1,090,041 7 Mining 165,833 1 Municipal 4,470,999 28 Steam-Electric Power 526,251 3 Texas 16,012,545 1One acre-foot equals 325,851 gallons. While the six water use summary categories are similar to the utility water use sectors as described in Senate Bill 181, there is not a direct comparison. Most of the utility water use described later in this report would be included in the general municipal category, with lesser amounts being delivered to the manufacturing and steam-electric power categories. The analysis of utility water use indicates that some water is being delivered for field irrigation, livestock, and mining purposes, but at much lower levels than for the other categories.
4 UTILITY WATER USE
4.1 ABILITY OF WATER UTILITIES TO REPORT The Texas Legislature and water professionals recognize that many utilities’ customer accounting and billing systems may not be able to categorize their customers and their water use. While single-family residential accounts are generally easy to identify due to the small size of the meter, the institutional, commercial, and industrial customers are often grouped together. How the water is used within the institutional, commercial, and industrial sectors may not be distinguishable by the meter size or volume of water used by the customer. Because of the possible difficulties in reporting water use by the specified categories, Senate Bill 181 specified that the TCEQ may not adopt a rule requiring an entity to report data that is more detailed than a utility’s existing billing system is able to produce directly (Texas Water Code §16.404). The TCEQ may however require that billing systems purchased after September 1, 2011, be capable of reporting such detailed information. Regardless of the replacement of billing systems, some water utilities in the state are working to categorize their customers with existing billing systems (See GARLAND, TEXAS on p. 7).
4.2 2013 WATER USE BY SECTOR While 2012 is the most recent year for which statewide water use estimates are compiled by the TWDB, 2013 data is available for sector water usage reported by water utilities through the annual water use survey and the conservation plan annual reports administered by the TWDB. Because the water use survey is sent to nearly all of the community public water systems in the state and would represent the most complete set of information, the following analysis is based on responses to the 2013 water use survey.

Water Use Of Texas Water Utilities, January 1, 2015
7
TWDB staff sent water use surveys to more than 4,000 public water systems in 2013. Each water utility, whether municipal-owned, a district, a water supply corporation, or an investor-owned utility, may own
one or more of the surveyed public water systems. After summing the water system information by the owning utility, it was determined that 344 utilities met the criteria of serving more than 3,300 connections. Of the 344 utilities, 304 were able to categorize at least 90 percent of their metered water use into one or more of the six water use categories specified in Senate Bill 181: single-family residential, multi-family residential, institutional, commercial, industrial, and agricultural. The 304 water utilities are owned by a variety of entities: municipal-owned utilities (206) make up 68 percent of the total, followed by districts (68 utilities or 22 percent), water supply corporations (19 utilities or 6 percent), authorities (5 utilities or 2 percent), investor-owned utilities (5 utilities or 2 percent) and a single county-owned utility (Figure 1). The data analyzed and presented in this section of the report represents the metered water used (delivered) that was self-reported by the water utilities. See Appendix A for a listing of all 304 utilities.
GARLAND, TEXAS – RENOVATION OF A UTILITY BILLING SYSTEM
The City of Garland has proactively taken up the challenge to categorize all of its customer accounts. Garland, located in North Texas with a population of 230,000 and more than 87,000 metered customer accounts, undertook a project in February of 2014 to categorize all of its metered accounts. The project required the involvement of multiple departments of the city: Customer Service, Garland Water Utility, and Information Technology.
Garland currently uses the Banner billing application from Ventyx, and, because the customization of such a third-party application would be expensive, the Customer Service staff was able to identify an existing “Dwelling Type” data field within the application that could be repurposed to hold the new categories of water use. While more than 70 percent of Garland’s metered connections are for single-family residences and could be easily categorized, the remainder of the metered customers required manual categorization by Garland Water Utility staff.
City staff adjusted approximately 15 percent, or approximately 13,000, of the customer accounts in the existing billing system between February and April, and by July was able to finalize the changes in the system. The result is that Garland became one of 31 water utilities in this report’s analysis that was able to report water use in five of the six utility customer categories, the sixth sector being the infrequently-reported agriculture sector. In addition to the customer categorization, the project required the creation of new reports to display the water utility’s use, connection counts, and billing by category.
Garland and its regional water provider, the North Texas Municipal Water District, have experienced significant impacts from the current drought and, in response, have enacted a range of water conservation measures. The City’s efforts to report water use by the various categories of customers will allow Garland Water Utility staff to select the most appropriate conservation strategies, measure their success, and identify areas of further potential water savings.

Water Use Of Texas Water Utilities, January 1, 2015
8
Figure 1. Analyzed Water Utilities by Ownership Type
When the averages are weighted by the volumetric size of the utility, the percentage of water for residential uses is 58 percent due to the influence of a number of very large water systems (Table 2). Thirty-four water utilities are identified as providing significant percentages of their water to the institutional, commercial, and industrial sectors2 (Figure 2). For such institutional, commercial, and industrial-focused utilities, the weighted average of water use going to residential uses is 37 percent, with both the commercial and industrial categories utilizing nearly a third of the metered water use (Figure 3).
Figure 2. Count of Analyzed Water Utilities, Including Those with Significant Multi-Family, Institutional, Commercial, and Industrial (ICI) Water Use
2 Identification criteria of utilities with significant institutional, commercial, and industrial usage includes: single-family residential being less than half of the metered usage and percentages of one or more of the three categories (institutional, commercial, or industrial) being more than 30 percent of the total metered usage.
Authority 2%
County <1%
District 22%
Investor Owned Utility
2%
Municipal 68%
Water Supply Corporation
6%
261
9
3
19
12 34
General Utilities
Significant Multi-FamilyUtilitiesSignificant ICI(Institutional) UtilitiesSignificant ICI(Commercial) UtilitiesSignificant ICI (Industrial)Utilities
Significant ICI

Water Use Of Texas Water Utilities, January 1, 2015
9
Table 2. Average Categorical Percentage of Metered Water Use
Tot
al
Res
iden
tial
Sing
le-F
amily
R
esid
entia
l
Mul
ti-Fa
mily
R
esid
entia
l
Inst
itutio
nal
Com
mer
cial
Indu
stri
al
Agr
icul
tura
l
Oth
er1
All Utilities (344) 58% 48% 10% 4% 21% 15% <1% 2%
Significant ICI2 Utilities (34)
35% 25% 10% 4% 30% 31% <1% 1%
1An “Other” sector was included in the 2012 and 2013 water use survey in order to capture water volumes from water systems which were not able to break out their water use. The 2014 water use survey will include only the legislation-specified categories. 2ICI refers to the institutional, commercial, and industrial sectors.
Figure 3. Water Use by Sector for All Water Utilities and Water Utilities with Significant ICI (Institutional, Commercial, and Industrial) Water Deliveries (Categories with less than one percent are not labeled on chart)
48%
25%
10%
10%
4%
4%
21%
30%
15% 31%
2%
0%
10%
20%
30%
40%
50%
60%
70%
80%
90%
100%
All Utilities (304) Significant ICI Utilities (34)
Other
Agriculture
Industrial
Commercial
Institution
Multi-Family
Single-Family

Water Use Of Texas Water Utilities, January 1, 2015
10
4.2.1 RESIDENTIAL WATER USE Single-Family Residential All of the 304 analyzed water utilities were able to report single-family residential water use and such use represented on average 48 percent of metered water provided by water utilities, although the percentage varies quite significantly from a low of 11 percent to a high of 100 percent. The average water use per single-family residential connection per day is 246 gallons. This average per-connection daily use of 246 gallons should not be confused with a per-person daily residential water use volume. The 2012 residential gallons per capita daily of surveyed water systems that were able to report residential water use in the annual TWDB water use survey is estimated to be 86 gallons3. While the set of water systems used to calculate both values is different, if the per-connection use of 246 gallons is divided by the 2010 U.S. Census average persons-per-household for Texas of 2.75, the result is 89 gallons per person. Thus, the per-connection daily use is consistent with other estimates of water use.
Multi-Family Residential Despite the challenges that utilities face in categorizing accounts, 226 of the 304 utilities reported a volume for multi-family residential for an average of 10 percent of the metered water provided by utilities. The average residential water use per multi-family connection is 367 gallons per day. This average is more than the single-family residential average and may be indicative of the difficulty faced by utilities in determining the number of apartment units/connections versus a master meter for an entire apartment complex.
Nine water utilities reported multi-family water use constituting a large percentage of their metered water use and can be described as Significant Multi-Family Utilities4 (Table 3). Of such utilities, three are city-owned utilities and six are municipal utility districts. See Appendix B, Table B1 for the listing of significant multi-family utilities.
Table 3. Significant Multi-Family Utilities – Weighted Average Categorical Percentage of Metered Water Use (9 Utilities)
Single- Family
Residential
Multi-Family
Residential Institutional Commercial Industrial Agricultural Other
28% 45% 3% 16% 3% 2% 2%
3 The gallons per capita daily of 86 is an average per-person residential water use of those water systems that have been able to report in the Texas Water Development Board’s annual water use survey the residential (single-family and multi-family) water use and an applicable population served or connection count. This analysis was based upon each applicable surveyed public water system, regardless of size. However, due to the inability of some systems to report the data, the residential gallons per capita daily does not represent a statewide average. Additional information can be found at http://www.twdb.state.tx.us/waterplanning/waterusesurvey/estimates/index.asp. 4 Significant Multi-Family Utilities are those utilities who reported their single-family residential water use as less than half of the metered total volume and the multi-family water use as more than 30 percent of the metered total.

Water Use Of Texas Water Utilities, January 1, 2015
11
4.2.2 INSTITUTIONAL Of the utilities, 165 reported institutional water use, for an overall average of 4 percent of all utilities’ metered water delivered. On average, institutional customers used 16,473 gallons per day per connection, although the types of facility are not known and could greatly affect the average daily use.
Three water utilities reported significant usage by institutional customers5 (Table 4). The average volume reported delivered to institutional customers was 39 percent of the total water use. All three utilities provide water to one or more Texas Department of Criminal Justice units. See Appendix B, Table B2 for the listing of significant institutional water use.
Table 4. Significant Institution Utilities – Weighted Average Categorical Percentage of Metered Water Use (3 Utilities)
Single- Family
Residential
Multi-Family
Residential Institutional Commercial Industrial Agricultural Other
17% 6% 39% 13% 25% <1% 0%
4.2.3 COMMERCIAL Of the 304 utilities, 289 reported water use for the commercial sector, for an average of 21 percent of the metered water delivered and an average daily water use per connection of 229 gallons. Nineteen utilities reported delivering a significant portion of metered water to commercial customers6 (Table 5). On average, these utilities provided 48 percent of their metered water to commercial customers. See Appendix B, Table B3 for the listing of significant commercial water use.
Table 5. Significant Commercial Utilities – Weighted Average Categorical Percentage of Metered Water Use (19 Utilities)
Single- Family
Residential
Multi-Family
Residential Institutional Commercial Industrial Agricultural Other
38% 2% 7% 48% 5% <1% 0%
4.2.4 INDUSTRIAL One hundred twenty utilities reported industrial water use with a weighted average of 15 percent of total metered water used and 13,214 gallons per connection. Twelve water utilities can be described as having
5 Significant Institution Utilities are those utilities who reported their single-family residential water use as less than half of the metered total volume and the institutional water use as more than 30 percent of the metered total. 6 Commercial Weighted Utilities are those utilities who reported their single-family residential water use as less than 50 percent of the metered total volume and the commercial water use as more than 30 percent of the metered total.

Water Use Of Texas Water Utilities, January 1, 2015
12
significant industrial use7, providing an average of 46 percent of their metered water to industrial customers (Table 6). See Appendix B, Table B4 for the listing of significant industrial water use.
Table 6. Significant Industrial Utilities – Weighted Average Categorical Percentage of Metered Water Use (16 Utilities)
Single- Family
Residential
Multi-Family
Residential Institutional Commercial Industrial Agricultural Other
19% 14% 1% 20% 46% <1% 1%
4.2.5 AGRICULTURAL Of the 304 water utilities, only 51 reported delivering water for agricultural purposes for an average of 0.3 percent of the total metered water use. Five water utilities reported providing more than 10 percent of their metered water use to agricultural customers: City of Bellmead, City of Levelland, Fort Bend County Water Control and Improvement District 2, Laguna Madre Water District, and the City of League City8. Specific agricultural sales information was not collected in the water use survey to identify what types of firms used such water.
4.2.6 COMPLETE REPORTING WATER UTILITIES It was previously acknowledged that reporting water use by customer categories can be difficult for water utilities as it may require the revamping of existing billing systems. However, 31 water utilities reported in each of the five water use categories (not including agriculture) and ranged in size from the City of Ingleside (3,618 connections) to the City of Austin (213,296 connections). As can be seen in Figure 4, while single family customers account for an average of 80 percent of the utilities’ connections, such customers account for 49 percent of the water use (Figure 4). Inversely, the institutional, commercial, and industrial sectors on average account for 7, 1, and 0.2 percent of the connections, but account for an average of 22, 5, and 10 percent of the metered water use statewide. See Appendix B for a listing of complete reporting utilities.
7 Industrial Weighted Utilities are those utilities who reported their single-family residential water use as less than 50 percent of the metered total volume and the industrial water use as more than 30 percent of the metered total. 8 The City of Bellaire, located in southwest Harris County, also reported delivering 18 percent of their metered water to agricultural customers. However, based on previous surveys, this may have been a miscategorization of the customers and volumes.

Water Use Of Texas Water Utilities, January 1, 2015
13
Figure 4. Percentage of Volume and Metered Connections of Complete Reporting Utilities (Categories with less than one percent are not labeled on chart)
4.3 2013 WATER USE BY UTILITY SIZE Each utility has a different customer base to serve; however, it is helpful to categorize water utilities into general size categories to examine if there are common characteristics within the utilities of a similar size. For example, it is generally assumed that smaller utilities will have a greater percentage of their water used for single-family residences. As a community and its water utility grows, more multi-family, institutional, commercial, and industrial customers tend to be established. The following section summarizes water use information for four general size categories based upon the total connections reported in the TCEQ’s Safe Drinking Water Information System:
• Medium Water Utilities9 – 3,300 to 16,667 connections (generally 9,900 to 50,000 population) • Medium-Large Water Utilities – 16,668 to 33,333 connections (generally 50,000 to 100,000
population) • Large Water Utilities – 33,334 to 166,666 connections (generally 100,000 to 500,000
population) • Metropolitan Water Utilities – more than 166,666 connections (generally more than 500,000
population)
9 The category of “Medium” is used to distinguish such systems from the small-system designation of utilities with less than 3,300 used by the U.S. Environmental Protection Agency’s Drinking Water Infrastructure Needs Survey and Assessment.
80%
49%
12%
14%
7%
22%
0%
10%
20%
30%
40%
50%
60%
70%
80%
90%
100%
Metered Connections Metered Volume
Other
Agriculture
Industrial
Commercial
Institution
Multi-Family
Single-Family

Water Use Of Texas Water Utilities, January 1, 2015
14
The criteria of 3,300 connections were set in Senate Bill 181. The additional break points for the size categories were selected for this report based upon population thresholds for various local government development powers, such as extra-territorial jurisdiction buffer size and eligibility for federal Community Development Block Grants (Figure 5).
Figure 5. Count of Water Utilities by Size Category
Medium-Sized Water Utilities By far, the largest number of water utilities (237) is in the medium category with 3,300 to 16,667 connections (Figure 5). Sixty-one percent of such utilities (145) are municipal-owned, with 29 percent being districts (68), and the remainder being made up of other types of water utilities. In 2013, the utilities reported delivering a combined 600,779 acre-feet of metered water, for an average of 2,535 acre-feet per utility. Average single-family residential made up 63 percent of the metered water use, the highest of any size sector (Figure 6).
The medium-sized sector included 35 utilities which provided significant percentages of their total use to one of the institutional, commercial, or industrial sectors10 (Figure 6). The average categorical water use of such utilities can be seen in Figure 6. For such utilities, the average percentage of metered water delivered to single-family residences dropped to 31 percent, while the percentage of water delivered to commercial and industrial sectors increased substantially, from 17 to 27 percent and from 7 to 28 percent (Figure 6).
Single-family connections used an average of 232 gallons per day, while multi-family connections used 264 (Table 7). Instructions in the water use survey specify the intent in collecting the number of housing units rather than a count of the master connections for each apartment complex. The higher per- 10 Identification criteria of utilities with significant institutional, commercial, or industrial usage includes: single-family residential being less than half of the metered usage, and one or more of the institutional, commercial, or industrial sector percentages being more than 30 percent of the total metered usage.
Medium, 237
Medium/Large, 31
Large, 30
Metropolitan, 6

Water Use Of Texas Water Utilities, January 1, 2015
15
connection water usage for multi-family connections appears to suggest that some of the connections may represent a single meter for multiple housing units (apartments) rather than counting each unit as a connection. Within the significant other, each institutional connection uses an average of 1,463 gallons per day, commercial connections use 791 gallons per day, and industrial connections use 21,053 gallons per day.
Figure 6. Water Use by Sector for All Medium-Sized Water Utilities and Medium-Sized Water Utilities with Significant Institutional, Commercial, and Industrial (ICI) Water Deliveries (Categories with less than one percent are not labeled on chart)
63%
31%
6%
7%
4%
5%
17%
27%
7%
28%
0%
10%
20%
30%
40%
50%
60%
70%
80%
90%
100%
All Utilities (237) Significant ICI Utilities (27)
Other
Agriculture
Industrial
Commercial
Institution
Multi-Family
Single-Family

Water Use Of Texas Water Utilities, January 1, 2015
16
Table 7. Average Per-Connection Daily Water Use (Gallons) by Utility Size
Sing
le-F
amily
R
esid
entia
l
Mul
ti-Fa
mily
R
esid
entia
l1
Inst
itutio
nal
Com
mer
cial
Indu
stri
al
Agr
icul
tura
l
Oth
er2
Medium Utilities (237) 232 264 1,463 791 21,053 777 1,049 Medium Significant ICI4 Utilities (27) 228 270 2,267 1,154 119,405 2,268 1,099
Medium-Large Utilities3 (31) 300 233 3,374 1,276 40,663 1,482 1,322
Medium-Large Significant ICI Utilities (5) 288 116 7,140 1,880 104,185 2,614 1,047
Large Utilities (30) 271 224 3,004 1,377 29,474 1,533 2,875
Large Significant ICI Utilities (5) 246 452 4,385 1,695 181,548 0 600,994
Metropolitan Utilities (6) 229 689 1,721 6,625 11,126 0 6,429 1High per-connection water use per Multi-Family connection may be indicative of the use of a single-metered connection for the complex, which would produce high per-connection rates rather than an accurate measure of each multi-family unit’s water usage. 2An “Other” sector was included in the 2012 and 2013 Water Use Survey in order to capture water volumes from water systems which were not able to break out their water use. The 2014 water use survey will include only the legislation-specified categories. 3City of San Marcos data is not included due to issues with the connection data. 4 ICI refers to the institutional, commercial, and industrial sectors.
Medium-Large Water Utilities The number of water utilities in the next category of utility size between 16,668 and 33,333 connections drops considerably to 31 utilities. Nearly all of these utilities are municipal-owned, with the exception of two water supply corporations, two investor-owned utilities, and a water authority. In 2013, these utilities delivered a combined 301,556 acre-feet of metered water, for an average of 9,728 acre-feet per utility.
The medium-large utilities provide 67 percent of their metered water to residential users: 60 percent to single-family, and 7 percent to multi-family. The average percentage of water use by commercial sectors is the second largest category of water use as a percentage of the total at 17 percent. Five of these utilities would constitute having significant institutional, commercial, or industrial usage, with a diversity of water usage similar to what was seen in the medium-sized water systems. Utilities with the significant institutional, commercial, or industrial usage include the cities of Bryan, Georgetown, Huntsville, Longview, and San Marcos (Figure 7).

Water Use Of Texas Water Utilities, January 1, 2015
17
Figure 7. Water Use by Sector for All Medium-Large Water Utilities and Medium-Large Water Utilities with Significant Institutional, Commercial, and Industrial (ICI) Water Deliveries Residential water use per connection for the medium-large systems is similar to that of the medium systems. However, for the institutional, commercial, and industrial categories, the daily water use per connection increased significantly in the institutional and commercial sectors: institutional use increased to 7,140 gallons and commercial increased to 1,880 gallons (Table 7).
Large Water Utilities The number of large water utilities with between 33,333 and 16,667 connections (generally between 100,000 and 500,000 residents) is very similar to the previous category: 30 water utilities and 5 utilities with significant institutional, commercial, or industrial water use. The utilities reported delivering 734,862 acre-feet of water in 2013, an average of 24,495 acre-feet per utility. While still more than half of the water of the utilities is being delivered to single-family residences (52 percent), it is a decrease from the percentages delivered by smaller utilities (Figure 8 and Table 7). The water use sector percentages for utilities with significant institutional, commercial, and industrial is similar to other such systems in the smaller size categories: residential use ranged between 38 and 44 percent and the combined institutional, commercial, and industrial usage ranged between 53 and 60 percent of the total metered usage.
60%
39%
7%
3%
5%
9%
17%
22%
7%
22%
5% 5%
0%
10%
20%
30%
40%
50%
60%
70%
80%
90%
100%
All Utilities (31) Significant ICI Utilities (5)
Other
Agriculture
Industrial
Commercial
Institution
Multi-Family
Single-Family

Water Use Of Texas Water Utilities, January 1, 2015
18
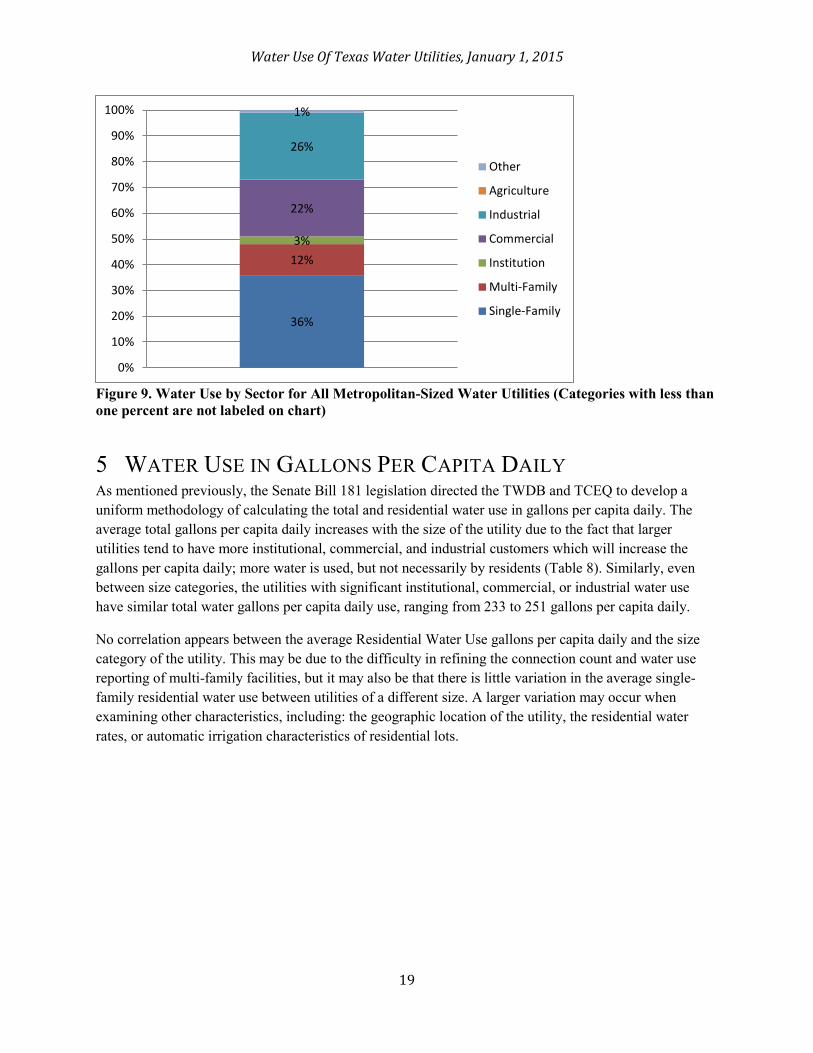
Figure 8. Water Use by Sector for All Large-Sized Water Utilities and Large-Sized Water Utilities with Significant Institutional, Commercial, and Industrial (ICI) Water deliveries. (Categories with less than one percent are not labeled on chart.) Metropolitan Water Utilities The six metropolitan water utilities, with total connections greater than 16,667 or roughly 500,000 population or greater, reported delivering more than 1,222,054 acre-feet of metered water to customers. These utilities show an even more pronounced decrease in the average percentage of water use delivered to the single family sector compared to smaller utilities, while the industrial sector received a substantially larger percentage of the metered water (Figure 9). One thing to note, however, is that this average is heavily weighted by the response of the City of Houston, reporting 47 percent of its metered water being used by industry.
52%
38%
9%
6%
4%
3%
24%
30%
8% 20%
3% 2%
0%
10%
20%
30%
40%
50%
60%
70%
80%
90%
100%
All Utilities (30) Significant ICI Utilities (5)
Other
Agriculture
Industrial
Commercial
Institution
Multi-Family
Single-Family
Water Use Of Texas Water Utilities, January 1, 2015
19
Figure 9. Water Use by Sector for All Metropolitan-Sized Water Utilities (Categories with less than one percent are not labeled on chart)
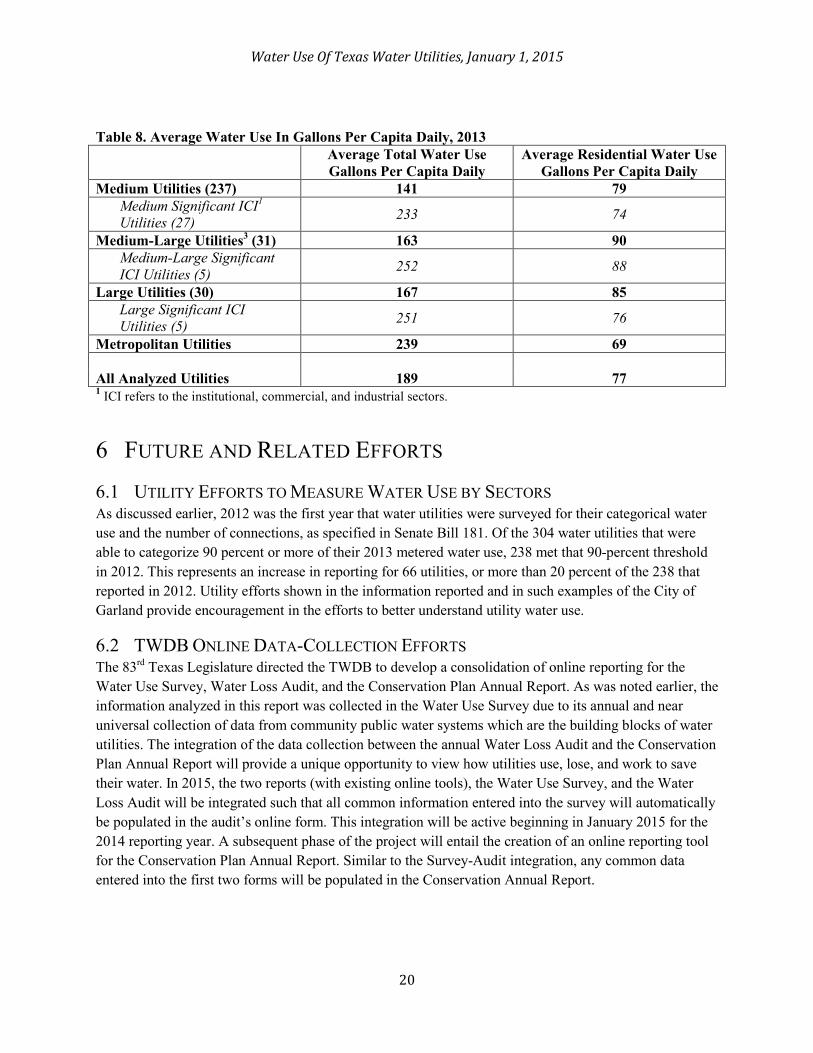
5 WATER USE IN GALLONS PER CAPITA DAILY As mentioned previously, the Senate Bill 181 legislation directed the TWDB and TCEQ to develop a uniform methodology of calculating the total and residential water use in gallons per capita daily. The average total gallons per capita daily increases with the size of the utility due to the fact that larger utilities tend to have more institutional, commercial, and industrial customers which will increase the gallons per capita daily; more water is used, but not necessarily by residents (Table 8). Similarly, even between size categories, the utilities with significant institutional, commercial, or industrial water use have similar total water gallons per capita daily use, ranging from 233 to 251 gallons per capita daily.
No correlation appears between the average Residential Water Use gallons per capita daily and the size category of the utility. This may be due to the difficulty in refining the connection count and water use reporting of multi-family facilities, but it may also be that there is little variation in the average single-family residential water use between utilities of a different size. A larger variation may occur when examining other characteristics, including: the geographic location of the utility, the residential water rates, or automatic irrigation characteristics of residential lots.
36%
12% 3%
22%
26%
1%
0%
10%
20%
30%
40%
50%
60%
70%
80%
90%
100%
Other
Agriculture
Industrial
Commercial
Institution
Multi-Family
Single-Family
Water Use Of Texas Water Utilities, January 1, 2015
20
Table 8. Average Water Use In Gallons Per Capita Daily, 2013 Average Total Water Use
Gallons Per Capita Daily Average Residential Water Use
Gallons Per Capita Daily Medium Utilities (237) 141 79
Medium Significant ICI1 Utilities (27) 233 74
Medium-Large Utilities3 (31) 163 90 Medium-Large Significant ICI Utilities (5) 252 88
Large Utilities (30) 167 85 Large Significant ICI Utilities (5) 251 76
Metropolitan Utilities 239 69 All Analyzed Utilities 189 77 1 ICI refers to the institutional, commercial, and industrial sectors.
6 FUTURE AND RELATED EFFORTS
6.1 UTILITY EFFORTS TO MEASURE WATER USE BY SECTORS As discussed earlier, 2012 was the first year that water utilities were surveyed for their categorical water use and the number of connections, as specified in Senate Bill 181. Of the 304 water utilities that were able to categorize 90 percent or more of their 2013 metered water use, 238 met that 90-percent threshold in 2012. This represents an increase in reporting for 66 utilities, or more than 20 percent of the 238 that reported in 2012. Utility efforts shown in the information reported and in such examples of the City of Garland provide encouragement in the efforts to better understand utility water use.
6.2 TWDB ONLINE DATA-COLLECTION EFFORTS The 83rd Texas Legislature directed the TWDB to develop a consolidation of online reporting for the Water Use Survey, Water Loss Audit, and the Conservation Plan Annual Report. As was noted earlier, the information analyzed in this report was collected in the Water Use Survey due to its annual and near universal collection of data from community public water systems which are the building blocks of water utilities. The integration of the data collection between the annual Water Loss Audit and the Conservation Plan Annual Report will provide a unique opportunity to view how utilities use, lose, and work to save their water. In 2015, the two reports (with existing online tools), the Water Use Survey, and the Water Loss Audit will be integrated such that all common information entered into the survey will automatically be populated in the audit’s online form. This integration will be active beginning in January 2015 for the 2014 reporting year. A subsequent phase of the project will entail the creation of an online reporting tool for the Conservation Plan Annual Report. Similar to the Survey-Audit integration, any common data entered into the first two forms will be populated in the Conservation Annual Report.

Water Use Of Texas Water Utilities, January 1, 2015
21
7 CONCLUSION Texas water utilities are increasing their ability to understand their individual customer base and the volume of water delivered to customers. This will allow Texans to better understand how water is being used by their water utilities. Consequently, such knowledge will allow the utilities to focus their water conservation efforts and programs on the customer sectors for which the results will be most cost-effective.

Water Use Of Texas Water Utilities, January 1, 2015
22
8 APPENDIX A – LIST OF ANALYZED WATER UTILITIES (FWSD = Fresh Water Supply District; MUD = Municipal Utility District; SUD = Special Utility District; WCID = Water Control and Improvement District; WSC = Water Supply Corporation)
Table A1. Analyzed Water Utilities ACTON MUD CITY OF HUNTSVILLE CITY OF WHITE SETTLEMENT
AGUA SUD CITY OF HURST CITY OF WICHITA FALLS
AMARILLO MUNICIPAL WATER SYSTEM
CITY OF HUTTO CITY OF WOODWAY
AQUA WSC CITY OF INGLESIDE CITY OF WYLIE
ATASCOSA RURAL WSC CITY OF JACINTO CITY CLEAR BROOK CITY MUD
BENBROOK WATER AUTHORITY CITY OF JACKSONVILLE CLEAR LAKE CITY WATER AUTHORITY
BENTON CITY WSC CITY OF JASPER CNP UTILITY DISTRICT
BETHESDA WSC CITY OF KATY CRYSTAL CLEAR WSC
BORGER MUNICIPAL WATER SYSTEM
CITY OF KELLER CYPRESS SPRINGS SUD
BRIDGESTONE MUD CITY OF KERRVILLE DALHART MUNICIPAL WATER SYSTEM
BROOKESMITH SPECIAL UTILITY DISTRICT
CITY OF KILGORE DALLAS COUNTY WCID 6
BROWNSVILLE PUBLIC UTILITIES BOARD
CITY OF KILLEEN DALLAS WATER UTILITY
BRUSHY CREEK MUD CITY OF KINGSVILLE DEL RIO UTILITIES COMMISSION
CADDO BASIN SUD CITY OF KYLE EAST CEDAR CREEK FWSD
CANYON LAKE WATER SERVICE COMPANY
CITY OF LA MARQUE EAST CENTRAL WSC
CANYON MUNICIPAL WATER SYSTEM
CITY OF LA PORTE EAST RIO HONDO WSC
CASH SUD CITY OF LAKE JACKSON EL JARDIN WSC
CHISHOLM TRAIL SUD CITY OF LAMESA EL PASO WATER UTILITIES PUBLIC SERVICE B
CITY OF ABILENE CITY OF LANCASTER FORT BEND COUNTY MUD 23
CITY OF ALAMO CITY OF LAREDO FORT BEND COUNTY MUD 25
CITY OF ALICE CITY OF LEAGUE CITY FORT BEND COUNTY WCID 2
CITY OF ALLEN CITY OF LEANDER GALVESTON COUNTY WCID 1
CITY OF ALVIN CITY OF LEVELLAND G-M WSC
CITY OF ANDREWS CITY OF LEWISVILLE GOFORTH SUD
CITY OF ANGLETON CITY OF LIBERTY GREEN VALLEY SUD
CITY OF ANNA CITY OF LIVINGSTON HARLINGEN WATER WORKS SYSTEM
CITY OF ARANSAS PASS CITY OF LOCKHART HARRIS COUNTY FWSD 51
CITY OF ARLINGTON CITY OF LONGVIEW HARRIS COUNTY FWSD 61
CITY OF ATHENS CITY OF LUBBOCK HARRIS COUNTY MUD 102
CITY OF AUSTIN CITY OF MABANK HARRIS COUNTY MUD 120
CITY OF BASTROP CITY OF MANSFIELD HARRIS COUNTY MUD 165
CITY OF BAY CITY CITY OF MARSHALL HARRIS COUNTY MUD 168
CITY OF BAYTOWN CITY OF MCKINNEY HARRIS COUNTY MUD 200 CRANBROOK

Water Use Of Texas Water Utilities, January 1, 2015
23
CITY OF BEAUMONT WATER UTILITY
CITY OF MERCEDES HARRIS COUNTY MUD 26
CITY OF BEEVILLE CITY OF MESQUITE HARRIS COUNTY MUD 368
CITY OF BELLAIRE CITY OF MIDLAND HARRIS COUNTY MUD 53
CITY OF BELLMEAD CITY OF MIDLOTHIAN HARRIS COUNTY MUD 55 HERITAGE PARK
CITY OF BELTON CITY OF MINERAL WELLS HARRIS COUNTY MUD 71
CITY OF BIG SPRING CITY OF MISSION HARRIS COUNTY MUD 81
CITY OF BOERNE CITY OF MONAHANS HARRIS COUNTY WCID 109
CITY OF BONHAM CITY OF MOUNT PLEASANT HARRIS COUNTY WCID 36
CITY OF BRENHAM CITY OF MURPHY HMW SUD
CITY OF BRIDGE CITY CITY OF NACOGDOCHES HORIZON REGIONAL MUD
CITY OF BROWNFIELD CITY OF NEDERLAND JOHNSON COUNTY SUD
CITY OF BROWNWOOD CITY OF NORTH RICHLAND HILLS JONAH WATER SUD
CITY OF BRYAN CITY OF ODESSA KEMPNER WSC
CITY OF BURKBURNETT CITY OF ORANGE LAGUNA MADRE WATER DISTRICT
CITY OF BURLESON CITY OF PAMPA LAKE CITIES MUNICIPAL UTILITY AUTHORITY
CITY OF CARROLLTON CITY OF PARIS LAKE LIVINGSTON WSC
CITY OF CARTHAGE CITY OF PASADENA LAKEWAY MUD
CITY OF CEDAR HILL CITY OF PECOS LAMAR COUNTY WATER SUPPLY DISTRICT
CITY OF CEDAR PARK CITY OF PHARR LEE COUNTY WSC
CITY OF CIBOLO CITY OF PLANO LINDALE RURAL WSC
CITY OF CLEBURNE CITY OF PLEASANTON LUMBERTON MUD
CITY OF CLUTE CITY OF PORT LAVACA MCALLEN PUBLIC UTILITY
CITY OF COLLEGE STATION CITY OF PORT NECHES MILITARY HWY WSC PROGRESO
CITY OF CONROE CITY OF PORTLAND MISSION BEND MUD 2
CITY OF CONVERSE CITY OF RICHARDSON MONARCH UTILITIES LP
CITY OF COPPELL CITY OF RICHMOND MONTGOMERY COUNTY MUD 46
CITY OF COPPERAS COVE CITY OF RIO GRANDE CITY MONTGOMERY COUNTY MUD 47
CITY OF CORINTH CITY OF ROBINSON MONTGOMERY COUNTY MUD 60
CITY OF CORPUS CHRISTI CITY OF ROCKPORT MONTGOMERY COUNTY MUD 7
CITY OF CORSICANA CITY OF ROCKWALL MOUNTAIN PEAK SUD
CITY OF CROWLEY CITY OF ROMA MUSTANG SUD
CITY OF DENISON CITY OF ROSENBERG NEW BRAUNFELS UTILITIES
CITY OF DENTON CITY OF ROUND ROCK NORTH ALAMO WSC
CITY OF DESOTO CITY OF ROWLETT NORTHWEST HARRIS COUNTY MUD 5
CITY OF DONNA CITY OF SACHSE NORTHWEST PARK MUD
CITY OF DUNCANVILLE CITY OF SAGINAW NUECES COUNTY WCID 4
CITY OF EAGLE PASS CITY OF SAN ANGELO ORANGE COUNTY WCID 1
CITY OF EDINBURG CITY OF SAN BENITO PECAN GROVE MUD
CITY OF EL CAMPO CITY OF SAN MARCOS PERRYTON MUNICIPAL WATER SYSTEM
CITY OF ENNIS CITY OF SCHERTZ PORTER SUD

Water Use Of Texas Water Utilities, January 1, 2015
24
CITY OF EULESS CITY OF SEABROOK QUADVEST INC
CITY OF FARMERS BRANCH CITY OF SEAGOVILLE QUAIL VALLEY UTILITY DISTRICT
CITY OF FORNEY CITY OF SEGUIN RAYFORD ROAD MUD
CITY OF FORT STOCKTON CITY OF SHERMAN RED RIVER AUTHORITY
CITY OF FORT WORTH CITY OF SNYDER REMINGTON MUD 1
CITY OF FREDERICKSBURG CITY OF SOUTH HOUSTON ROCKETT SUD
CITY OF FREEPORT CITY OF SOUTHLAKE S S WSC
CITY OF FRIENDSWOOD CITY OF STEPHENVILLE SAN ANTONIO WATER SYSTEM
CITY OF GAINESVILLE CITY OF SUGAR LAND SARDIS LONE ELM WSC
CITY OF GARLAND CITY OF SULPHUR SPRINGS SHARYLAND WSC
CITY OF GEORGETOWN CITY OF SWEETWATER SOUTHERN MONTGOMERY COUNTY MUD
CITY OF GLENN HEIGHTS CITY OF TERRELL SOUTHERN UTILITIES COMPANY
CITY OF GRAHAM CITY OF TEXAS CITY SPRINGS HILL WSC
CITY OF GRANBURY CITY OF THE COLONY TIMBER LANE UTILITY DISTRICT
CITY OF GRAND PRAIRIE CITY OF TOMBALL TOWN OF FAIRVIEW
CITY OF GRAPEVINE CITY OF TYLER TOWN OF FLOWER MOUND
CITY OF GREENVILLE CITY OF UNIVERSAL CITY TOWN OF HIGHLAND PARK
CITY OF GROVES CITY OF UNIVERSITY PARK TOWN OF LITTLE ELM EAST
CITY OF HALTOM CITY CITY OF UVALDE TOWN OF PROSPER
CITY OF HENDERSON CITY OF VERNON TRAVIS COUNTY WCID 17
CITY OF HEREFORD CITY OF VICTORIA TRI SUD
CITY OF HEWITT CITY OF WACO TRINITY BAY CONSERVATION DISTRICT
CITY OF HIDALGO CITY OF WATAUGA WALNUT CREEK SUD
CITY OF HIGHLAND VILLAGE CITY OF WEATHERFORD WELLBORN SUD
CITY OF HILLSBORO CITY OF WEBSTER WELLS BRANCH MUD 1
CITY OF HONDO CITY OF WESLACO WEST CEDAR CREEK MUD
CITY OF HOUSTON CITY OF WEST UNIVERSITY PLACE WEST TRAVIS COUNTY REGIONAL WS
CITY OF HUMBLE CITY OF WHARTON WINDERMERE COMMUNITY
ZAPATA COUNTY WATER WORKS

Water Use Of Texas Water Utilities, January 1, 2015
25
9 APPENDIX B – UTILITIES WITH SIGNIFICANT WATER USE IN SINGLE SECTOR (MUD = Municipal Utility District; WCID = Water Control and Improvement District)
Table B1. Utilities with Significant Multi-Family Water Use
Utility Multi-Family Water Use as Percent of Total Metered Volume
CITY OF CLUTE 30 CITY OF FORNEY 49 CITY OF SAN MARCOS 42 CNP UTILITY DISTRICT 62 HARRIS COUNTY MUD 168 39 HARRIS COUNTY MUD 200 CRANBROOK 64 MISSION BEND MUD 2 51 SOUTHERN MONTGOMERY COUNTY MUD 32 WELLS BRANCH MUD 1 39
Table B2. Utilities with Significant Institutional Water Use
Utility Institution Water Use as Percent of Total Metered Volume
CITY OF BEEVILLE 51 CITY OF LIVINGSTON 48 CITY OF HUNTSVILLE 35

Water Use Of Texas Water Utilities, January 1, 2015
26
Table B3. Utilities with Significant Commercial Water Use
Utility Commercial Water Use As Percent Of Total Metered Volume
CITY OF BRYAN 41 CITY OF CONROE 43 CITY OF ENNIS 36 CITY OF FARMERS BRANCH 45 CITY OF FREEPORT 45 CITY OF GEORGETOWN 38 CITY OF GRANBURY 50 CITY OF HILLSBORO 47 CITY OF HUMBLE 58 CITY OF JACKSONVILLE 44 CITY OF LAKE JACKSON 43 CITY OF LIBERTY 39 CITY OF MIDLOTHIAN 33 CITY OF SOUTH HOUSTON 30 CITY OF TOMBALL 48 CITY OF WACO 54 CITY OF WEBSTER 54 DALLAS WATER UTILITY 49 FORT BEND COUNTY WCID 2 32
Table B4. Utilities With Significant Industrial Water Use
Utility Industrial Water Use As Percent Of Total Metered Volume
BORGER MUNICIPAL WATER SYSTEM 73 CITY OF CARTHAGE 36 CITY OF CLEBURNE 42 CITY OF HEREFORD 39 CITY OF HOUSTON 73 CITY OF LONGVIEW 37 CITY OF MARSHALL 35 CITY OF MOUNT PLEASANT 62 CITY OF NACOGDOCHES 30 CITY OF PARIS 75 CITY OF SEGUIN 43 CITY OF VERNON 38

Water Use Of Texas Water Utilities, January 1, 2015
27
10 APPENDIX C - COMPLETE REPORTING UTILITIES (SUD = Special Utility District; WCID = Water Control and Improvement District)
Utility Sing
le-F
amily
R
esid
entia
l
Mul
ti-Fa
mily
R
esid
entia
l
Inst
itutio
nal
Com
mer
cial
Indu
stri
al
AMARILLO MUNICIPAL WATER SYSTEM 46 5 26 9 13 BORGER MUNICIPAL WATER SYSTEM 19 1 4 2 73 BROWNSVILLE PUBLIC UTILITIES BOARD 59 8 27 4 3 CANYON LAKE WATER SERVICE COMPANY 81 1 12 6 <1 CITY OF ANDREWS 70 3 7 20 <1 CITY OF AUSTIN 40 24 28 1 7 CITY OF BEEVILLE 26 7 16 51 0 CITY OF BURKBURNETT 60 2 12 23 3 CITY OF CARROLLTON 52 18 23 4 3 CITY OF CONVERSE 80 7 9 2 2 CITY OF CORSICANA 50 9 20 5 16 CITY OF FREEPORT 30 11 45 6 9 CITY OF GARLAND 60 12 16 4 7 CITY OF GREENVILLE 45 14 27 8 6 CITY OF HENDERSON 44 3 10 21 22 CITY OF INGLESIDE 58 8 16 2 16 CITY OF LEWISVILLE 39 22 28 10 1 CITY OF MOUNT PLEASANT 22 3 11 2 62 CITY OF NEDERLAND 66 10 17 3 3 CITY OF PORT NECHES 65 7 5 5 18 CITY OF RICHARDSON 49 12 15 9 15 CITY OF ROCKWALL 71 5 21 3 <1 CITY OF TERRELL 42 13 29 7 8 CITY OF VERNON 41 4 11 6 38 CLEAR LAKE CITY WATER AUTHORITY 66 15 15 4 <1 GALVESTON COUNTY WCID 1 68 16 11 4 1 JOHNSON COUNTY SUD 86 3 6 1 3 LAGUNA MADRE WATER DISTRICT 35 21 22 3 3

Water Use Of Texas Water Utilities, January 1, 2015
28
Utility Sing
le F
amily
R
esid
entia
l
Mul
ti-Fa
mily
R
esid
entia
l
Inst
itutio
nal
Com
mer
cial
Indu
stri
al
LAMAR COUNTY WATER SUPPLY DISTRICT 92 3 2 0 2 MONARCH UTILITIES LP 93 2 6 <1 <1 TOWN OF FLOWER MOUND 87 1 6 5 <1