waterway ecological health monitoring report · 2.3.2 macroinvertebrate community index (mci) 3...
TRANSCRIPT
Freshwater Macroinvertebrate Fauna Biological Monitoring Programme Annual State of the Environment
Monitoring Report 2015-2016
Technical Report 2016-33 (and Report DS056)
Taranaki Regional Council ISSN: (Online) Private Bag 713 Document No: 1716915 (Word) STRATFORD Document No: (Pdf) February 2017


Executive summary
Section 35 of the Resource Management Act requires local authorities to undertake monitoring of the region’s environment, including land, air, and fresh and marine water quality. The Taranaki Regional Council initiated the freshwater biological component of the State of Environment Monitoring (SEM) programme for Taranaki in the 1995-96 monitoring year. The macroinvertebrate component was separated from the microfloral component in the 2002-03 year. The latter programme was broadened to incorporate recently-developed techniques and is reported separately. This report covers the 2015-2016 monitoring year. Biological surveys were performed in spring (October 2015 mainly through to November 2015 with some wet weather delay extending through to December 2015) and summer (February to March 2016). Each seasonal survey assessed the macroinvertebrate communities at 59 sites in 26 rivers and streams. Two new sites were added in the 2015-2016 year, in the upper Waitara River and in the lower Whenuakura River, because of the need for the Council put in place adequate representative monitoring of the region’s proposed Freshwater Management Units (as required by the National Policy Statement on Fresh Water). The Hangatahua (Stony) River was selected as a river with high conservation value and the Maketawa Stream was selected having been identified in the Regional Freshwater Plan for its regionally important recreational value. The Waitara, Manganui, Patea, Waiwhakaiho and the Mangaehu Rivers were chosen as examples of waterways with large catchments and multiple human impacts, arising in either the Egmont National Park or the eastern hill country. The Waingongoro River was included in the programme as a river under intensive usage with more recent wastes diversions out of the river, and the Waiongana Stream as a stream from which there is a major water abstraction (although not currently exercised). The Timaru, Mangaoraka, Waiokura (added in 2007) and Punehu Streams were included as streams within primary agricultural catchments. The Kaupokonui River, Mangorei Stream and Waimoku Stream were selected to monitor the progress of riparian planting in these catchments. These catchments had been targeted in management policies for riparian planting initiatives. The Katikara and Kapoaiaia streams are western Taranaki streams also targeted for riparian planting initiatives, which have been part of the monitoring programme since 2000. The Tangahoe River was included in 2007 to monitor land use changes in an eastern hill country catchment. The Kurapete Stream was added to the programme as an example of a small seepage ringplain stream where significant improvements to a major point source discharge have been implemented. The Waiau Stream is an example of a northern lowland catchment. The Mangawhero and Mangati Streams were selected as examples of small, degraded streams. The Huatoki Stream was selected as an example of a stream influenced by urbanisation and also in part by riparian vegetation while the Herekawe Stream, on the western outskirts of the New Plymouth urban area (with a lengthy consent monitoring record), has been added in order to monitor the impact of relatively recent community walkway planting initiatives. The Whenuakura River was selected as a large river draining the eastern hill country. For sites located in lower catchments the proportion of ‘sensitive’ taxa in the macroinvertebrate communities generally have been lower in summer than in spring, coincident with lower flows, higher water temperatures, less scouring, and increased smothering of habitats by more widespread algal growth within rivers and streams in summer. During the 2015-2016 period, the median spring score (104 units) was eight units

higher than the median summer score (96 units) but the seasonal difference in scores was not statistically significant. As is typical in catchments worldwide, the proportion of ‘sensitive’ taxa in the macroinvertebrate communities decreased down the length of the waterways, which was reflected in the deterioration in generic stream ‘health’ from ‘very good’ in the upper reaches though ‘good’ in mid-reaches to ‘fair’ to ‘good’ in the lower reaches. A large number of sites (11 sites with historical data) recorded new historical maximum MCI scores, while one decrease in historical minimum score was recorded (in the lower reaches of the Tangahoe River), in the 2015-2016 period. Evaluations of generic stream ‘health’ have also been performed and assessments of current scores compared with predictive measures based on altitude and distance for ringplain streams arising from within the National Park and for all sites in relation to River Environment Classification (REC) predictions. The trends through time have been evaluated and will continue to be assessed on an annual basis as the SEM programme continues. Only ten of the fifty-nine sites monitored have shown any indications of deterioration over the full 21 year period of monitoring, with only one site having a statistically significant deterioration in MCI scores (a result of headwater erosion effects inside the National Park). On the other hand, thirty sites have shown statistically significant improvements, all but five of which were of ecological importance. Roughly equal numbers of these sites were located in the lower reaches of ringplain catchments as in mid catchment reaches. Generally, in lower catchment sites the macroinvertebrate communities tend to be very ‘tolerant’ of the cumulative impacts of organic enrichment. Significant improvement of (predominantly ‘fair’) biological stream ‘health’ at the lowest sites is unlikely to be detected until habitat improvements occur by way of substantial catchment-wide initiatives such as riparian planting and diversion of point source surface water dairy treatment ponds systems wastes discharges to land irrigation. Notably, the data now shows that the proportion of lower catchment sites showing significant improvement over 21 years (52%) is almost the same as the proportion of mid catchment sites (60%). For the first time, trends in the most recent ten years of data were also calculated. Eleven of 51 sites still showed statistically significant improvement over this shorter period (with one showing deterioration), and three sites still showed statistically significant improvements after FDR adjustment (the most rigorous test for determining whether a trend is statistically significant) using this more limited dataset. These results can be compared with, respectively, 30 and 16 sites with trends with the same degrees of significance across the entire history of record. This appears to be due to three reasons. Firstly, trends at several sites appear to have plateaued recently, which is only to be expected if interventions such as riparian management have already been completed or have been largely paused for several years. Furthermore, substrate instability and sedimentation caused by extensive headwater erosion events in recent years have affected the macroinvertebrate communities at upper sites in the Stony River (in particular), Katikara Stream, Maketawa Stream, Waiwhakaiho River, and Timaru Stream on occasions within this period. Most of these sites did continue to show recovery from these impacts during the 2015–2016 period. Finally, the smaller dataset has less power to detect statistically significant differences within a background of natural fluctuations even if real ecological improvements are occurring.

The recommendations for the 2016-2017 monitoring year provide for the freshwater biological component of the SEM monitoring to be maintained by way of the same macroinvertebrate faunal programme and for time trend reporting on the full data set and the most recent ten year dataset (to detect recent trends) to be performed annually.


i
Table of contents Page
1. Introduction 1
2. Monitoring activity 2
2.1 Introduction 2
2.2 Monitoring methodology 2
2.3 Environmental parameters and indicators 2
2.3.1 Taxonomic richness 2
2.3.2 Macroinvertebrate Community Index (MCI) 3
2.3.2.1 Predictice measures using the MCI 4
2.3.3 Semi Quantitative MCI (SQMCIs) 4
2.4 Trend analysis 4
2.5 Site locations 5
3. Results and discussion 14
3.1 Flows and water temperatures 14
3.2 Macroinvertebrate communities 16
3.2.1 Hangatahua (Stony) River 16
3.2.1.1 Mangatete Road site (STY000300) 17 3.2.1.3 SH 45 site (STY000400) 21 3.2.1.4 Discussion 24
3.2.2 Timaru Stream 25
3.2.2.1 Carrington Road site (TMR000150) 25 3.2.2.2 SH45 site (TMR000375) 28 3.2.2.3 Discussion 32
3.2.3 Mangaoraka Stream 33
3.2.3.1 Corbett Road site (MRK000420) 33 3.2.3.2 Discussion 36
3.2.4 Waiongana Stream 37
3.2.4.1 State Highway 3a site (WGA000260) 37 3.2.4.2 Devon Road site (WGA000450) 40 3.2.4.3 Discussion 44
3.2.5 Waiwhakaiho River 45
3.2.5.1 National Park site (WKH000100) 45 3.2.5.2 Egmont Village site (WKH000500) 49 3.2.5.3 Constance Street site (WKH000920) 52 3.2.5.4 Site adjacent to Lake Rotomanu (WKH000950) 56 3.2.5.5 Discussion 60
3.2.6 Mangorei Stream 61
3.2.6.1 SH3 site (MGE000970) 61 3.2.6.2 Discussion 65
3.2.7 Manganui River 65
3.2.7.1 State Highway 3 site (MGN000195) 65 3.2.7.2 Bristol Road site (MGN000427) 69

ii
3.2.7.3 Discussion 72
3.2.8 Maketawa Stream 72
3.2.8.1 Derby Road site (MKW000200) 73 3.2.8.2 Tarata Road site (MKW000300) 76 3.2.8.3 Discussion 80
3.2.9 Waitara River 81
3.2.9.1 Autawa Road site (WTR000540) 81 3.2.9.2 Community composition 82 3.2.9.3 Temporal trends in 1995 to 2016 data 82 3.2.9.4 Mamaku Road site (WTR000850) 83 3.2.9.5 Community composition 84 3.2.9.6 Temporal trends in 1996 to 2016 data 85 3.2.9.7 Temporal trends in 2006 to 2016 data 85 3.2.9.8 Discussion 86
3.2.10 Mangati Stream 86
3.2.10.1 Site downstream of railbrige (MGT000488) 87 3.2.10.2 Te Rima Place, Bell Block site (MGT000520) 90 3.2.10.3 Discussion 94
3.2.11 Waimoku Stream 94
3.2.11.1 Lucy’s Gully site (WMK000100) 94 3.2.11.2 Oakura Beach site (WMK000298) 98 3.2.11.3 Discussion 101
3.2.12 Waiau Stream 102
3.2.12.1 Inland North site (WAI000110) 102 3.2.12.2 Discussion 105
3.2.13 Punehu Stream 106
3.2.13.1 Wiremu Road site (PNH000200) 106 3.2.13.2 SH 45 site (PNH000900) 109 3.2.13.3 Discussion 113
3.2.14 Patea River 114
3.2.14.1 Barclay Road site (PAT000200) 114 3.2.14.2 Swansea Road site (PAT000315) 118 3.2.14.3 Skinner Road site (PAT000360) 121 3.2.14.4 Discussion 125
3.2.15 Mangaehu River 126
3.2.15.1 Raupuha Road site (MGH000950) 126 3.2.15.2 Discussion 129
3.2.16 Waingongoro River 130
3.2.16.1 Site near National Park boundary (WGG000115) 130 3.2.16.2 Opunake Road site (WGG000150) 133 3.2.16.3 Eltham Road site (WGG000500) 137 3.2.16.4 Stuart Road site (WGG000665) 141 3.2.16.5 SH45 site (WGG000895) 145 3.2.16.6 Ohawe Beach site (WGG000995) 149 3.2.16.7 Discussion 153
3.2.17 Mangawhero Stream 154
3.2.17.1 Site upstream of the Eltham Municipal WWTP discharge (MWH000380) 154
iii
3.2.17.2 Site downstream of the Mangawharawhara Stream confluence (MWH000490) 157
3.2.17.3 Discussion 161
3.2.18 Huatoki Stream 162
3.2.18.1 Hadley Drive site (HTK000350) 162 3.2.18.2 Huatoki Domain site (HTK000425) 166 3.2.18.3 Site near coast (HTK000745) 169 3.2.18.4 Discussion 173
3.2.19 Kaupokonui River 174
3.2.19.1 Opunake Road site (KPK000250) 174 3.2.19.2 Site upstream of the Kaponga oxidation ponds system
(KPK000500) 178 3.2.19.3 Site upstream of Kapuni railbridge (KPK000660) 182 3.2.19.4 Upper Glenn Road site (KPK000880) 186 3.2.19.5 Kaupokonui Beach site (KPK000990) 190 3.2.19.6 Discussion 194
3.2.20 Katikara Stream 195
3.2.20.1 Carrington Road site (KTK000150) 195 3.2.20.2 Coastal site (KTK000248) 199 3.2.20.3 Discussion 203
3.2.21 Kapoaiaia Stream 204
3.2.21.1 Wiremu Road site (KPA000250) 204 3.2.21.2 Wataroa Road site (KPA000700) 208 3.2.21.3 Upstream of coast site (KPA000950) 212 3.2.21.4 Discussion 216
3.2.22 Kurapete Stream 217
3.2.22.1 Site upstream of Inglewood WWTP (KRP000300) 217 3.2.22.2 Site approximately 6km downstream of the Inglewood WWTP
outfall (KRP000660) 221 3.2.22.3 Discussion 225
3.2.23 Waiokura Stream 225
3.2.23.1 Skeet Road site (WKR000500) 226 3.2.23.2 Manaia golf course site (WKR000700) 229 3.2.23.3 Discussion 232
3.2.24 Tangahoe River 233
3.2.24.1 Upper Tangahoe Valley Road site (TNH000090) 233 3.2.24.2 Tangahoe Valley Road bridge site (TNH000200) 236 3.2.24.3 Site downstream of railbridge (TNH000515) 238 3.2.24.4 Discussion 241
3.2.25 Whenuakura River 242
3.2.25.1 Whenuakura River at Nicholson Road site (WNR000450) 242 3.2.25.2 Discussion 244
3.2.26 Herekawe Stream 244
3.2.26.1 Centennial Drive site (HRK000085) 244 3.2.26.2 Discussion 248
4. General discussion and conclusions 249
4.1 Macroinvertebrate fauna communities 249

iv
4.1.1 Spring surveys 250
4.1.1.1 Historical SEM 250 4.1.1.2 Predictive TRC ringplain altitude/distance models 252
4.1.2 Summer surveys 259
4.1.2.1 Historical SEM 259 4.1.2.2 Predictive TRC ringplain altitude/distance models 261
4.1.3 Stream ‘health’ categorisation 271
4.1.4 Comments 273
4.2 Macroinvertebrate fauna MCI trends 274
5. Summary 276
6. Recommendations from the 2014-2015 report 277
7. Recommendations for 2016-2017 277
8. Acknowledgements 278
9. References 279
Appendix I Macroinvertebrate faunal 2015-2016 tables 284
Appendix II Summary of SEM sites’ information, 2015-2016 and historical MCI scores, predicted scores and 1995-2016 trends 338

v
List of tables
Table 1 Macroinvertebrate abundance categories 2
Table 2 Generic MCI gradation of biological water quality conditions adapted for Taranaki streams and rivers 3
Table 3 Freshwater biological monitoring sites in the State of the Environment Monitoring programme 7
Table 4 Duration since freshes at sampling sites in the 2015-2016 SEM biomonitoring programme 14
Table 5 Water temperature recorded at the times of SEM biological monitoring surveys 15
Table 6 Results from SEM surveys performed in the Stony River at Mangatete Road together with spring 2015 and summer 2016 results 17
Table 7 Characteristic taxa [abundant (A), very abundant (VA), extremely abundant (XA)] recorded in the Stony River at Mangatete Road between 1995 and February 2015 [43 surveys] and by the spring 2015 and summer 2015 surveys 18
Table 8 Results from SEM surveys performed in the Stony River at SH 45 together with spring 2015 and summer 2016 results 21
Table 9 Characteristic taxa [abundant (A), very abundant (VA), extremely abundant (XA)] recorded in the Stony River at SH 45 between 1995 and February 2015 [43 surveys] and by the spring 2015 and summer 2016 surveys 22
Table 10 Results of previous surveys performed in the Timaru Stream at Carrington Road, together with spring 2015 and summer 2016 results 25
Table 11 Characteristic taxa [abundant (A), very abundant (VA), extremely abundant (XA)] recorded in the Timaru Stream at Carrington Road between 1995 and February 2015 [40 surveys], and by the spring 2015 and summer 2016 surveys 26
Table 12 Results of previous surveys performed in the Timaru Stream at SH45, together with spring 2015 and summer 2016 results 28
Table 13 Characteristic taxa [abundant (A), very abundant (VA), extremely abundant (XA)] recorded in the Timaru Stream at SH45 between 1995 and February 2015 [40 surveys], and by the spring 2015 and summer 2016 surveys 29
Table 14 Results of previous surveys performed in Mangaoraka Stream at Corbett Road, together with spring 2015 and summer 2016 results 33
Table 15 Characteristic taxa (abundant, very abundant, extremely abundant) recorded in the Mangaoraka Stream at Corbett Road, between 1995 and February 2015 [40 surveys], and by the spring 2015 and summer 2016 surveys 34
Table 16 Results of previous surveys performed in the Waiongana Stream at SH3a together with spring 2015 and summer 2016 results 37
Table 17 Characteristic taxa [abundant (A), very abundant (VA), extremely abundant (XA)] recorded in the Waiongana Stream at SH3a between 1995 and February 2015 [41 surveys], and by the spring 2015 and summer 2016 surveys 38

vi
Table 18 Results of previous surveys performed in the Waiongana Stream at Devon Road together with spring 2015 and summer 2016 results 41
Table 19 Characteristic taxa [abundant (A), very abundant (VA), extremely abundant (XA)] recorded in the Waiongana Stream at Devon Road between 1995 and February 2015 [40 surveys], by the spring 2015 and summer 2016 surveys 42
Table 20 Results of previous surveys performed in the Waiwhakaiho River at National Park together with spring 2015 and summer 2016 results 45
Table 21 Characteristic taxa [abundant (A), very abundant (VA), extremely abundant (XA)] recorded in the Waiwhakaiho River at the National Park between 1995 and February 2015 [26 surveys], and by the spring 2015 and summer 2016 surveys 46
Table 22 Results of previous surveys performed in the Waiwhakaiho River at Egmont Village together with spring 2015 and summer 2016 results 49
Table 23 Characteristic taxa [abundant (A), very abundant (VA), extremely abundant (XA)] recorded in the Waiwhakaiho River at Egmont Village between 1995 and February 2015 [40 surveys], and by the spring 2015 and summer 2016 surveys 50
Table 24 Results of previous surveys performed in the Waiwhakaiho River at Constance Street, New Plymouth, together with spring 2015 and summer 2016 results 52
Table 25 Characteristic taxa [abundant (A), very abundant (VA), extremely abundant (XA)] recorded in the Waiwhakaiho River at Constance Street between 1995 and February 2015 [43 surveys], and by the spring 2015 and summer 2016 surveys 54
Table 26 Results of previous surveys performed in the Waiwhakaiho River the site adjacent to Lake Rotomanu, together with spring 2015 and summer 2016 results 56
Table 27 Characteristic taxa [abundant (A), very abundant (VA), extremely abundant (XA)] recorded in the Waiwhakaiho River at the site adjacent to Lake Rotomanu between 1995 and February 2015 [39 surveys], and by the spring 2015 and summer 2016 surveys 58
Table 28 Results of previous surveys performed in the Mangorei Stream at SH 3 together with spring 2015 and summer 2016 results 61
Table 29 Characteristic taxa [abundant (A), very abundant (VA), extremely abundant (XA)] recorded in the Mangorei Stream at SH3 between 2002 and February 2015 [26 surveys], and by the spring 2015 and summer 2016 surveys 62
Table 30 Results of previous surveys performed in the Manganui River u/s of railway bridge (SH 3), together with spring 2015 and summer 2016 results 65
Table 31 Characteristic taxa [abundant (A), very abundant (VA), extremely abundant (XA)] recorded in the Manganui River at SH3 between 1995 and February 2015 [41 surveys], and by the spring 2015 and summer 2016 surveys 66
Table 32 Results of previous surveys performed in the Manganui River at Bristol Road together with spring 2015 and summer 2016 results 69
Table 33 Characteristic taxa [abundant (A), very abundant (VA), extremely abundant (XA)] recorded in the Manganui River at Bristol Road between

vii
1995 and February 2015 [38 surveys], and by the spring 2015 and summer 2016 70
Table 34 Results of previous surveys performed in the Maketawa Stream at Derby Road together with spring 2015 and summer 2016 results 73
Table 35 Characteristic taxa [abundant (A), very abundant (VA), extremely abundant (XA)] recorded in the Maketawa Stream at Derby Road between 1995 and February 2015 [31 surveys], and by the spring 2015 and summer 2016 surveys 74
Table 36 Results of previous surveys performed in the Maketawa Stream at Tarata Road together with spring 2015 and summer 2016 results 76
Table 37 Characteristic taxa [abundant (A), very abundant (VA), extremely abundant (XA)] recorded in the Maketawa Stream at Tarata Road between 1995 and March 2015 [30 surveys], and by the spring 2015 and summer 2016 surveys 77
Table 38 Results of the spring 2015 and summer 2016 surveys performed in the Waitara River at Autawa Road 81
Table 39 Characteristic taxa [abundant (A), very abundant (VA), extremely abundant (XA)] recorded in the Waitara River at Mamaku Road by the spring 2015 and summer 2016 surveys 82
Table 40 Results of previous surveys performed in the Waitara River at Mamaku Road together with spring 2014 and summer 2015 results 83
Table 41 Characteristic taxa [abundant (A), very abundant (VA), extremely abundant (XA)] recorded in the Waitara River at Mamaku Road between 1995 and February 2015 [40 surveys], and by the spring 2015 and summer 2016 surveys 84
Table 42 Results of previous surveys performed in the Mangati Stream at the site downstream of the railbridge, together with spring 2015 and summer 2016 results 87
Table 43 Characteristic taxa [abundant (A), very abundant (VA), extremely abundant (XA)] recorded in the Mangati Stream at the site downstream of the railbridge between 1995 and February 2015 [41 surveys], and by the spring 2015 and summer 2016 surveys 88
Table 44 Results of previous surveys performed in the Mangati Stream at Te Rima Place, Bell Block together with spring 2015 and summer 2016 results 90
Table 45 Characteristic taxa [abundant (A), very abundant (VA), extremely abundant (XA)] recorded in the Mangati Stream at Te Rima Place, Bell Block between 1995 and February 2015 [41 surveys], and by the spring 2015 and summer 2016 surveys 91
Table 46 Results of previous surveys performed in the Waimoku Stream at Lucy’s Gully, together with spring 2015 and summer 2016 results 94
Table 47 Characteristic taxa [abundant (A), very abundant (VA), extremely abundant (XA)] recorded in the Waimoku Stream at Lucy’s Gully between 1999 and March 2015 [32 surveys], and by the spring 2015 and summer 2016 surveys 95
Table 48 Results of previous surveys performed in the Waimoku Stream at Oakura Beach together with spring 2015 and summer 2016 results 98
Table 49 Characteristic taxa [abundant (A), very abundant (VA), extremely abundant (XA)] recorded in the Waimoku Stream at Oakura Beach

viii
between 1999 and March 2015 [32 surveys], and by the spring 2015 and summer 2016 surveys 99
Table 50 Results of previous surveys performed in Waiau Stream at Inland North Road, together with spring 2015 and summer 2016 results 102
Table 51 Characteristic taxa [abundant (A), very abundant (VA), extremely abundant (XA)] recorded in the Waiau Stream at Inland North Road between 1998 and February 2015 [33 surveys], and by the spring 2015 and summer 2016 surveys 103
Table 52 Results of previous surveys performed in the Punehu Stream at Wiremu Road together with spring 2015 and summer 2016 results 106
Table 53 Characteristic taxa [abundant (A), very abundant (VA), extremely abundant (XA)] recorded in the Punehu Stream at Wiremu Road between 1995 and February 2015 [40 surveys], and by the spring 2015 and summer 2016 surveys 107
Table 54 Results of previous surveys performed in the Punehu Stream at SH 45 together with spring 2015 and summer 2016 results 110
Table 55 Characteristic taxa [abundant (A), very abundant (VA), extremely abundant (XA)] recorded in the Punehu Stream at SH 45 between 1995 and February 2015 [40 surveys], and by the spring 2015 and summer 2016 surveys 111
Table 56 Results of previous surveys performed in the Patea River at Barclay Road, together with spring 2015 and summer 2016 results 114
Table 57 Characteristic taxa [abundant (A), very abundant (VA), extremely abundant (XA)] recorded in the Patea River at Barclay Road between 1995 and February 2015 [40 surveys], and by the spring 2015 and summer 2016 surveys 115
Table 58 Results of previous surveys performed in the Patea River at Swansea Road, together with spring 2015 and summer 2016 results 118
Table 59 Characteristic taxa [abundant (A), very abundant (VA), extremely abundant (XA)] recorded in the Patea River at Swansea Road between 1995 and February 2015 [40 surveys], and by the spring 2015 and summer 2016 surveys 119
Table 60 Results of previous surveys performed in the Patea River at Skinner Road, together with spring 2015 and summer 2016 results 121
Table 61 Characteristic taxa [abundant (A), very abundant (VA), extremely abundant (XA)] recorded in the Patea River at Skinner Road between 1995 and February 2015 [40 surveys], and by the spring 2015 and summer 2016 surveys 123
Table 62 Results of previous surveys performed in the Mangaehu River at Raupuha Road, together with spring 2015 and summer 2016 results 126
Table 63 Characteristic taxa [abundant (A), very abundant (VA), extremely abundant (XA)] recorded in the Mangaehu River at Raupuha Road between 1995 and February 2015 [40 surveys], and by the spring 2015 and summer 2016 surveys 127
Table 64 Results of previous surveys performed in the Waingongoro River 700m downstream of the National Park, together with spring 2015 and summer 2016 results 130
ix
Table 65 Characteristic taxa [abundant (A), very abundant (VA), extremely abundant (XA)] recorded in the Waingongoro River 700 m downstream of the National Park between 1995 and February 2015 [40 surveys], and by the spring 2015 and summer 2016 surveys 131
Table 66 Results of previous surveys performed in the Waingongoro River at Opunake Road together with spring 2015 and summer 2016 results. 133
Table 67 Characteristic taxa [abundant (A), very abundant (VA), extremely abundant (XA)] recorded in the Waingongoro River at Opunake Road between 1995 and February 2015 [38 surveys], and by the spring 2015 and summer 2016 surveys 135
Table 68 Results of previous surveys performed in the Waingongoro River at Eltham Road, together with spring 2015 and summer 2016 results. 137
Table 69 Characteristic taxa [abundant (A), very abundant (VA), extremely abundant (XA)] recorded in the Waingongoro River at Eltham Road between 1995 and February 2015 [44 surveys], and by the spring 2015 and summer 2016 surveys 139
Table 70 Results of previous surveys performed in the Waingongoro River at Stuart Road, together with spring 2015 and summer 2016 results. 141
Table 71 Characteristic taxa [abundant (A), very abundant (VA), extremely abundant (XA)] recorded in the Waingongoro River at Stuart Road between 1995 and February 2015 [40 surveys], and by the spring 2015 and summer 2016 surveys 143
Table 72 Results of previous surveys performed in the Waingongoro River at SH45, together with spring 2015 and summer 2016 results 145
Table 73 Characteristic taxa [abundant (A), very abundant (VA), extremely abundant (XA)] recorded in the Waingongoro River at SH45 between 1995 and February 2015 [41 surveys], and by the spring 2015 and summer 2016 surveys 147
Table 74 Results of previous surveys performed in the Waingongoro River at the Ohawe Beach site, together with spring 2015 and summer 2016 results 149
Table 75 Characteristic taxa [abundant (A), very abundant (VA), extremely abundant (XA)] recorded in the Waingongoro River at the Ohawe Beach site between 1995 and February 2015 [40 surveys], and by the spring 2015 and summer 2016 surveys 150
Table 76 Results of previous surveys performed in Mangawhero Stream upstream of Eltham WWTP, together with spring 2015 and summer 2016 results 154
Table 77 Characteristic taxa [abundant (A), very abundant (VA), extremely abundant (XA)] recorded in the Mangawhero Stream upstream of Eltham WWTP between 1995 and February 2015 [40 surveys], and by the spring 2015 and summer 2016 surveys 155
Table 78 Results of previous surveys performed in the Mangawhero Stream downstream of the Mangawharawhara Stream confluence, together with spring 2015 and summer 2016 results 157
Table 79 Characteristic taxa [abundant (A), very abundant (VA), extremely abundant (XA)] recorded in the Mangawhero Stream downstream of the Mangawharawhara Stream confluence, between 1995 and February 2015 [40 surveys], and by the spring 2015 and summer 2016 surveys 159
Table 80 Results of previous surveys performed in the Huatoki Stream at Hadley Drive together with spring 2014 and summer 2015 results 162
x
Table 81 Characteristic taxa [abundant (A), very abundant (VA), extremely abundant (XA)] recorded in the Huatoki Stream at Hadley Drive, between 1996 and February 2015 [38 surveys], and by the spring 2015 and summer 2016 surveys 163
Table 82 Results of previous surveys performed at Huatoki Stream in Huatoki Domain, together with spring 2015 and summer 2016 results 166
Table 83 Characteristic taxa [abundant (A), very abundant (VA), extremely abundant (XA)] recorded in the Huatoki Stream at Huatoki Domain, between 1996 and February 2015 [38 surveys], and by the spring 2015 and summer 2016 surveys 167
Table 84 Results of previous surveys performed in Huatoki Stream at the site near the coast, together with spring 2015 and summer 2016 results 169
Table 85 Characteristic taxa [abundant (A), very abundant (VA), extremely abundant (XA)] recorded in the Huatoki Stream at the site near the coast, between 1996 and 2015 [38 surveys], and by the spring 2015 and summer 2016 surveys 171
Table 86 Results of previous surveys performed in the Kaupokonui River at Opunake Road, together with spring 2015 and summer 2016 results 175
Table 87 Characteristic taxa [abundant (A), very abundant (VA), extremely abundant (XA)] recorded in the Kaupokonui River at Opunake Road between 1995 and February 2015 [33 surveys], and by the spring 2015 and summer 2016 surveys 176
Table 88 Results of previous surveys performed in the Kaupokonui River at the site upstream of the Kaponga oxidation ponds system together with spring 2015 and summer 2016 results 178
Table 89 Characteristic taxa [abundant (A), very abundant (VA), extremely abundant (XA)] recorded in the Kaupokonui River upstream of the Kaponga oxidation ponds system between 1995 and February 2015 [36 surveys], and by the spring 2015 and summer 2016 surveys 179
Table 90 Results of previous surveys performed in the Kaupokonui River upstream of Kapuni railbridge, together with spring 2015 and summer 2016 results 182
Table 91 Characteristic taxa [abundant (A), very abundant (VA), extremely abundant (XA)] recorded in the Kaupokonui River upstream of Kapuni railbridge between 1995 and February 2015 [38 surveys], and by the spring 2015 and summer 2016 surveys 183
Table 92 Results of previous surveys performed in the Kaupokonui River at Upper Glenn Road, together with spring 2015 and summer 2016 results 186
Table 93 Characteristic taxa [abundant (A), very abundant (VA), extremely abundant (XA)] recorded in the Kaupokonui River at Upper Glenn Road between 1995 and February 2015 [40 surveys], and by the spring 2015 and summer 2016 surveys 187
Table 94 Results of previous surveys performed in the Kaupokonui River at the Kaupokonui Beach site, together with spring 2015 and summer 2016 results 190
Table 95 Characteristic taxa [abundant (A), very abundant (VA), extremely abundant (XA)] recorded in the Kaupokonui River at the Kaupokonui Beach site between 1999 and February 2015 [32 surveys], and by the spring 2015 and summer 2016 surveys 191

xi
Table 96 Results of previous surveys performed in the Katikara Stream at Carrington Road, together with spring 2015 and summer 2016 results 195
Table 97 Characteristic taxa [abundant (A), very abundant (VA), extremely abundant (XA)] recorded in the Katikara Stream at Carrington Road between 1999 and February 2015 [32 surveys], and by the spring 2015 and summer 2016 surveys 197
Table 98 Results of previous surveys performed in the Katikara Stream near the coast together with spring 2015 and summer 2016 199
Table 99 Characteristic taxa [abundant (A), very abundant (VA), extremely abundant (XA)] recorded in the Katikara Stream near the mouth between October 2000 and February 2015 [30 surveys], and by the spring 2015 and summer 2016 surveys 201
Table 100 Results of previous surveys performed in the Kapoaiaia Stream at Wiremu Road together with the spring 2015 and summer 2016 results 204
Table 101 Characteristic taxa [abundant (A), very abundant (VA), extremely abundant (XA)] recorded in the Kapoaiaia Stream at Wiremu Road between 1995 and February 2015 [32 surveys], and by the spring 2015 and summer 2016 surveys 205
Table 102 Results of previous surveys performed in the Kapoaiaia Stream at Wataroa Road, together with spring 2015 and summer 2016 results 208
Table 103 Characteristic taxa [abundant (A), very abundant (VA), extremely abundant (XA)] recorded in the Kapoaiaia Stream at Wataroa Road between 1995 and February 2015 [32 surveys], and by the spring 2015 and summer 2016 surveys 209
Table 104 Results of previous surveys performed in the Kapoaiaia Stream at the site upstream of the coast together with spring 2015 and summer 2016 results 212
Table 105 Characteristic taxa [abundant (A), very abundant (VA), extremely abundant (XA)] recorded in the Kapoaiaia Stream at the site upstream of the coast between 1995 and February 2015 [32 surveys], and by the spring 2015 and summer 2016 surveys 213
Table 106 Results of previous surveys performed in the Kurapete Stream upstream of Inglewood WWTP, together with spring 2015 and summer 2016 results 217
Table 107 Characteristic taxa (abundant, very abundant, extremely abundant) recorded in the Kurapete Stream upstream of Inglewood WWTP, between 1996 and February 2015 [41 surveys], and by the spring 2015 and summer 2016 surveys 218
Table 108 Results of previous surveys performed in the Kurapete Stream at the site 6km downstream of the Inglewood WWTP outfall together with spring 2015 and summer 2016 results 221
Table 109 Characteristic taxa (abundant, very abundant, extremely abundant) recorded in the Kurapete Stream at the site 6 km downstream of Inglewood WWTP outfall, between 1996 and February 2015 [41 surveys], and by the spring 2015 and summer 2016 surveys 222
Table 110 Results of previous surveys performed in the Waiokura Stream at Skeet Road, together with spring 2015 and summer 2016 results 226
Table 111 Characteristic taxa [abundant (A), very abundant (VA), extremely abundant (XA)] recorded in the Waiokura Stream at Skeet Road, between 2003 and February 2015 [21 surveys], and by the spring 2015 and summer 2016 surveys 227
xii
Table 112 Results of previous surveys performed at Waiokura Stream at Manaia golf course, together with spring 2015 and summer 2016 results 229
Table 113 Characteristic taxa [abundant (A), very abundant (VA), extremely abundant (XA)] recorded in the Waiokura Stream at the Manaia golf course, between 2007 and February 2015 [16 surveys], and by the spring 2015 and summer 2016 surveys 230
Table 114 Results of previous surveys performed in the Tangahoe River at upper Tangahoe Valley Road, together with spring 2015 and summer 2016 results 233
Table 115 Characteristic taxa (abundant, very abundant, extremely abundant) recorded in the Tangahoe River at upper Tangahoe Valley Road between 2007 and February 2015 [16 surveys], and by the spring 2015 and summer 2016 surveys 234
Table 116 Results of previous surveys performed in the Tangahoe River at Tangahoe Valley Road bridge, together with spring 2015 and summer 2016 results 236
Table 117 Characteristic taxa (abundant, very abundant, extremely abundant) recorded in the Tangahoe River at Tangahoe Valley Road bridge between 2007 and February 2015 [16 surveys], and by the spring 2015 and summer 2016 surveys 237
Table 118 Results of previous surveys performed in the Tangahoe River d/s of railbridge, together with spring 2015 and summer 2016 results 239
Table 119 Characteristic taxa (abundant, very abundant, extremely abundant) recorded in the Tangahoe River d/s of the railbridge between 1995 and February 2015 [17 surveys], and by the spring 2015 and summer 2016 surveys 240
Table 120 Results of previous surveys performed in the Whenuakura River at Nicholson Road, together with spring 2015 and summer 2016 results 242
Table 121 Characteristic taxa [abundant (A), very abundant (VA), extremely abundant (XA)] recorded in the Whenuakura River at Nicholson Road for the spring 2015 and summer 2016 surveys 243
Table 122 Results of previous surveys performed in Herekawe Stream at Centennial Drive, together with spring 2015 and summer 2016 results 245
Table 123 Characteristic taxa [abundant (A), very abundant (VA), extremely abundant (XA)] recorded in the Herekawe Stream at Centennial Drive between 1998 and February 2015 [41 surveys], and by the spring 2015 and summer 2016 surveys 246
Table 124 Percentages of spring and summer MCI scores for ringplain sites with sources arising in the National Park in relation to Stark and Fowles (2009) predicted (altitude and distance from National Park) scores and REC scores (Lethwick, 1998) 269
Table 125 Percentages of sites with median SEM scores (1995-2016) showing significant differences (> 10 MCI units) from the various predicted scores 270
Table 126 Ranking of five best and worst sites’ median MCI scores (1995-2016) based on deviation from predictive scores 270
Table 127 Stream ‘health’ site assessments according to catchment reach (in terms of median MCI score) 273

xiii
Table 128 Summary of Mann-Kendall test results for MCI scores trended over time (1995-2016) for 53 Taranaki streams/rivers (p with FDR applied) (significant p<0.05 and p<0.01) 274
Table 129 Macroinvertebrate fauna of the Stony River: spring SEM survey sampled on 8 December 2015 286
Table 130 Macroinvertebrate fauna of the Stony River: summer SEM survey sampled on 1 February 2016 287
Table 131 Macroinvertebrate fauna of the Timaru Stream: spring SEM survey sampled on 8 December 2015 288
Table 132 Macroinvertebrate fauna of the Timaru Stream: summer SEM survey sampled on 1 February 2016 289
Table 133 Macroinvertebrate fauna of the Mangaoraka Stream: spring SEM survey sampled on 15 October 2015 290
Table 134 Macroinvertebrate fauna of the Mangaoraka Stream: summer SEM survey sampled on 31 March 2016 291
Table 135 Macroinvertebrate fauna of the Waiongana Stream: spring SEM survey sampled on 14 October 2015 292
Table 136 Macroinvertebrate fauna of the Waiongana Stream: summer SEM survey sampled on 15 February 2016 293
Table 137 Macroinvertebrate fauna of the Waiwhakaiho River: spring SEM survey sampled on 21 December 2015 294
Table 138 Macroinvertebrate fauna of the Waiwhakaiho River: summer SEM survey sampled 16 March 2016 295
Table 139 Macroinvertebrate fauna of the Mangorei Stream: spring SEM survey sampled on 21 December 2015 296
Table 140 Macroinvertebrate fauna of the Mangorei Stream: summer SEM survey sampled on 16 March 2016 297
Table 141 Macroinvertebrate fauna of the Manganui River: spring SEM survey sampled on 14 October 2015 298
Table 142 Macroinvertebrate fauna of the Manganui River: summer SEM survey sampled on 16 February 2016 299
Table 143 Macroinvertebrate fauna of the Maketawa Stream: SEM spring survey sampled on 14 October 2015 300
Table 144 Macroinvertebrate fauna of the Maketawa Stream: summer SEM survey sampled on 16 February 2016 301
Table 145 Macroinvertebrate fauna of the Waitara River: spring SEM survey sampled on 15 October 2015 302
Table 146 Macroinvertebrate fauna of the Waitara River: summer SEM survey sampled on 15 February 2016 303
Table 147 Macroinvertebrate fauna of the Mangati Stream: spring SEM survey sampled on 19 November 2015 304
Table 148 Macroinvertebrate fauna of the Mangati Stream: summer SEM survey sampled on 10 February 2016 305
Table 149 Macroinvertebrate fauna of the Waimoku Stream: spring SEM survey sampled on 8 December 2015 306
Table 150 Macroinvertebrate fauna of the Waimoku Stream: summer SEM survey sampled on 1 February 2016 307

xiv
Table 151 Macroinvertebrate fauna of the Waiau Stream: spring SEM survey sampled on 15 October 2015 308
Table 152 Macroinvertebrate fauna of the Waiau Stream: summer SEM survey sampled on 31 March 2016 309
Table 153 Macroinvertebrate fauna of the Punehu Stream: spring SEM survey sampled on 12 October 2015 310
Table 154 Macroinvertebrate fauna of the Punehu Stream: summer SEM survey sampled on 10 March 2016 311
Table 155 Macroinvertebrate fauna of the Patea River: spring SEM survey sampled on 12 October 2015 312
Table 156 Macroinvertebrate fauna of the Patea River: summer SEM survey sampled on 29 February 2016 313
Table 157 Macroinvertebrate fauna of the Mangaehu River: spring SEM survey sampled on 12 October 2015 314
Table 158 Macroinvertebrate fauna of the Mangaehu River: summer SEM survey sampled on 10 February 2015 315
Table 159 Macroinvertebrate fauna of the Waingongoro River: spring SEM survey sampled on 7 October 2015 316
Table 160 Macroinvertebrate fauna of the Waingongoro River: summer SEM survey sampled on 1 March 2016 317
Table 161 Macroinvertebrate fauna of the Mangawhero Stream: spring SEM survey sampled on 7 October 2015 318
Table 162 Macroinvertebrate fauna of the Mangawhero Stream: summer SEM survey sampled on 1 March 2016 319
Table 163 Macroinvertebrate fauna of the Huatoki Stream: spring SEM survey sampled on 15 October 2015 320
Table 164 Macroinvertebrate fauna of the Huatoki Stream: summer SEM survey sampled on 8 March 2016 321
Table 165 Macroinvertebrate fauna of the Kaupokonui River: spring SEM survey sampled on 16 October 2015 322
Table 166 Macroinvertebrate fauna of the Kaupokonui Stream: summer SEM survey sampled on 19 February 2015 323
Table 167 Macroinvertebrate fauna of the Katikara Stream: spring SEM survey sampled on 12 October 2015 324
Table 168 Macroinvertebrate fauna of the Katikara Stream: summer SEM survey sampled on 10 March 2016 325
Table 169 Macroinvertebrate fauna of the Kapoaiaia Stream: spring SEM survey sampled on 12 October 2015 326
Table 170 Macroinvertebrate fauna of the Kapoaiaia Stream: summer SEM survey sampled on 10 March 2016 327
Table 171 Macroinvertebrate fauna of the Kurapete Stream: spring SEM survey sampled on 15 October 2015 328
Table 172 Macroinvertebrate fauna of the Kurapete Stream: summer SEM survey sampled on 31 March 2016 329
Table 173 Macroinvertebrate fauna of the Waiokura Stream:spring SEM survey sampled on 16 October 2015 330

xv
Table 174 Macroinvertebrate fauna of the Waiokura Stream: summer SEM survey sampled on 9 February 2016 331
Table 175 Macroinvertebrate fauna of the Tangahoe River: spring SEM survey sampled on 14 October 2015 332
Table 176 Macroinvertebrate fauna of the Tangahoe River: summer SEM survey sampled on 15 March 2016 333
Table 177 Macroinvertebrate fauna of the Whenuakura River: spring SEM survey sampled on 334
Table 178 Macroinvertebrate fauna of the Whenuakura River: summer SEM survey sampled on 335
Table 179 Macroinvertebrate fauna of the Herekawe Stream: spring SEM survey sampled 12 October 2015 336
Table 180 Macroinvertebrate fauna of the Herekawe Stream: summer SEM survey sampled on 8 March 2016 337
List of figures
Figure 1 Location of macroinvertebrate fauna sampling sites for the 2015-2016 SEM programme 8
Figure 2 Numbers of taxa and MCI values in the Hangatahua (Stony) River at Mangatete Road 17
Figure 3 LOWESS trend plot of MCI data at Mangatete Road site 19
Figure 4 Ten year LOWESS trend plot of ten years of MCI data at Mangatete Road site 20
Figure 5 Numbers of taxa and MCI values in the Hangatahua (Stony) River at SH 45 21
Figure 6 LOWESS trend plot of MCI data at SH 45 site 23
Figure 7 LOWESS trend plot of ten years of MCI data at SH 45 site 24
Figure 8 Numbers of taxa and MCI values in the Timaru Stream at Carrington Road 25
Figure 9 LOWESS trend plot of MCI data at the Carrington Road site 27
Figure 10 LOWESS trend plot of ten years of MCI data at the Carrington Road site 28
Figure 11 Numbers of taxa and MCI values in the Timaru Stream at State Highway 45 29
Figure 12 LOWESS trend plot of MCI data at the SH45 site 31
Figure 13 LOWESS trend plot of ten years of data at the SH45 site 32
Figure 14 Numbers of taxa and MCI values in the Mangaoraka Stream at Corbett Road 33
Figure 15 LOWESS trend plot of MCI data at the Corbett Road site, Mangaoraka Stream 35
Figure 16 LOWESS trend plot of ten years of MCI data at the Corbett Road site 36
Figure 17 Numbers of taxa and MCI values in the Waiongana Stream at State Highway 3A 37
xvi
Figure 18 LOWESS trend plot of MCI data at the SH3a site 39
Figure 19 LOWESS trend plot of ten years of MCI data at the SH3a site, Waiongana Stream 40
Figure 20 Numbers of taxa and MCI values in the Waiongana Stream at Devon Road 41
Figure 21 LOWESS trend plot of MCI data at the Devon Road site 43
Figure 22 LOWESS trend plot of ten years of MCI data at the Devon Road site 44
Figure 23 Numbers of taxa and MCI values in the Waiwhakaiho River at Egmont National Park 46
Figure 24 LOWESS trend plot of MCI data at the National Park site 48
Figure 25 LOWESS trend plot of ten years of MCI data at the National Park site 48
Figure 26 Numbers of taxa and MCI values in the Waiwhakaiho River at Egmont Village 49
Figure 27 LOWESS trend plot of MCI data at the Egmont Village site 51
Figure 28 LOWESS trend plot of MCI data at the Egmont Village site 52
Figure 29 Numbers of taxa and MCI values in the Waiwhakaiho River at Constance Street 53
Figure 30 LOWESS trend plot of MCI data at the Constance Street site 55
Figure 31 LOWESS trend plot of ten years of MCI data at the Constance Street site 56
Figure 32 Numbers of taxa and MCI values in the Waiwhakaiho River at Lake Rotomanu 57
Figure 33 LOWESS trend plot of MCI data at the site adjacent to Lake Rotomanu 59
Figure 34 LOWESS trend plot of ten years of MCI data at the site adjacent to Lake Rotomanu 60
Figure 35 Numbers of taxa and MCI values in the Mangorei Stream at SH3 61
Figure 36 LOWESS trend plot of MCI data at the SH3 site, Mangorei Stream 64
Figure 37 LOWESS trend plot of ten years of ten years of MCI data at the SH3 site 64
Figure 38 Numbers of taxa and MCI values in the Manganui River above the railway bridge (SH3) 66
Figure 39 LOWESS trend plot of MCI data at the SH3 site, Manganui River 68
Figure 40 LOWESS trend plot of MCI data at the SH3 site, Manganui River 68
Figure 41 Numbers of taxa and MCI values in the Manganui River at Bristol Road 69
Figure 42 LOWESS trend plot of MCI data at the Bristol Road site, Manganui River 71
Figure 43 LOWESS trend plot of ten years of MCI data at the Bristol Road site, Manganui River 72
Figure 44 Number of taxa and MCI values in the Maketawa Stream at Derby Road 73
Figure 45 LOWESS trend plot of MCI data at the Derby Road site, Maketawa Stream 75
Figure 46 LOWESS trend plot of ten years of MCI data at the Derby Road site, Maketawa Stream 76
Figure 47 Number of taxa and MCI values in the Maketawa Stream at Tarata Road 77
Figure 48 LOWESS trend plot of MCI data at the Tarata Road site 79
Figure 49 LOWESS trend plot of ten years of MCI data at the Tarata Road site, Maketawa Stream 80
Figure 50 Numbers of taxa and MCI values in the Waitara River upstream of Methanex at Mamaku Road 81

xvii
Figure 51 Numbers of taxa and MCI values in the Waitara River upstream of Methanex at Mamaku Road 83
Figure 52 LOWESS trend plot of MCI data for the Mamaku Road site, Waitara River 85
Figure 53 LOWESS trend plot of ten years of MCI data for the Mamaku Road site, Waitara River 86
Figure 54 Numbers of taxa and MCI values in the Mangati Stream downstream of the railbridge 87
Figure 55 LOWESS trend plot of MCI data at the Mangati Stream site downstream of the railbridge 89
Figure 56 LOWESS trend plot of ten years of MCI data at the Mangati Stream site downstream of the railbridge 90
Figure 57 Numbers of taxa and MCI values in the Mangati Stream at Te Rima Place footbridge 91
Figure 58 LOWESS trend plot of MCI data at the Mangati stream site at Te Rima Place, Bell Block 93
Figure 59 LOWESS trend plot of ten years of MCI data at the Mangati Stream site at Te Rima Place, Bell Block 93
Figure 60 Numbers of taxa and MCI values in the Waimoku Stream at Lucy’s Gully 95
Figure 61 LOWESS trend plot of MCI data at the Lucy’s Gully site, Waimoku Stream 97
Figure 62 LOWESS trend plot of ten years of MCI data at the Lucy’s Gully site, Waimoku Stream 97
Figure 63 Numbers of taxa and MCI values in the Waimoku Stream at Oakura Beach 98
Figure 64 LOWESS trend plot of MCI data at the Oakura Beach site, Waimoku Stream 100
Figure 65 LOWESS trend plot of ten years of MCI data at the Oakura Beach site, Waimoku Stream 101
Figure 66 Numbers of taxa and MCI values in the Waiau Stream at the Inland North Road site 102
Figure 67 LOWESS trend plot of MCI data at the Inland North Road site, Waiau Stream 104
Figure 68 LOWESS trend plot of ten years of MCI data at the Inland North Road site, Waiau Stream 105
Figure 69 Numbers of taxa and MCI values in the Punehu Stream at Wiremu Road 106
Figure 70 LOWESS trend plot of MCI data at the Wiremu Road site, Punehu Stream 108
Figure 71 LOWESS trend plot of ten years MCI data at the Wiremu Road site, Punehu Stream 109
Figure 72 Numbers of taxa and MCI values in the Punehu Stream at SH 45 110
Figure 73 LOWESS trend plot of MCI data at the SH 45 site, Punehu Stream 112
Figure 74 LOWESS trend plot of ten years of MCI data at the SH 45 site, Punehu Stream 113
Figure 75 Numbers of taxa and MCI values in the Patea River at Barclay Road 114
Figure 76 LOWESS trend plot of MCI data at the Barclay Road site, Patea River 117
Figure 77 LOWESS trend plot of MCI data at the Barclay Road site, Patea River 117
Figure 78 Numbers of taxa and MCI values in the Patea River at Swansea Road 118
xviii
Figure 79 LOWESS trend plot of MCI data at the Swansea Road site, Patea River 120
Figure 80 LOWESS trend plot of ten years of MCI data at the Swansea Road site, Patea River 121
Figure 81 Numbers of taxa and MCI values in the Patea River at Skinner Road 122
Figure 82 LOWESS trend plot of MCI data at the Skinner Road site, Patea River 124
Figure 83 LOWESS trend plot of ten years of MCI data at the Skinner Road site, Patea River 125
Figure 84 Numbers of taxa and MCI values in the Mangaehu River at Raupuha Road 126
Figure 85 LOWESS trend plot of MCI data for the Raupuha Road site, Mangaehu River 128
Figure 86 LOWESS trend plot of ten years of MCI data for the Raupuha Road site, Mangaehu River 129
Figure 87 Numbers of taxa and MCI values in the Waingongoro River 700 m d/s National Park 130
Figure 88 LOWESS trend plot of MCI data at the site near the National Park, Waingongoro River 132
Figure 89 LOWESS trend plot of ten years of MCI data at the site near the National Park, Waingongoro River 133
Figure 90 Numbers of taxa and MCI values in the Waingongoro River at Opunake Road 134
Figure 91 LOWESS trend plot of MCI data at the Opunake Road site, Waingongoro River 136
Figure 92 LOWESS trend plot of ten years of MCI data at the Opunake Road site, Waingongoro River 137
Figure 93 Numbers of taxa and MCI values in the Waingongoro River at Eltham Road 138
Figure 94 LOWESS trend plot of MCI data at the Eltham Road site, Waingongoro River 140
Figure 95 LOWESS trend plot of ten years of MCI data at the Eltham Road site, Waingongoro River 141
Figure 96 Numbers of taxa and MCI values in the Waingongoro River at Stuart Road 142
Figure 97 LOWESS trend plot of MCI data at the Stuart Road site, Waingongoro River 144
Figure 98 LOWESS trend plot of ten years of MCI data at the Stuart Road site, Waingongoro River 145
Figure 99 Numbers of taxa and MCI values in the Waingongoro River 150 m u/s of SH45 146
Figure 100 LOWESS trend plot of MCI data for the SH45 site, Waingongoro River 148
Figure 101 LOWESS trend plot of ten years of MCI data for the SH45 site, Waingongoro River 149
Figure 102 Numbers of taxa and MCI values in the Waingongoro River at the Ohawe Beach site 150
Figure 103 LOWESS trend plot of MCI data at the Ohawe Beach site, Waingongoro River 152

xix
Figure 104 LOWESS trend plot of ten years of MCI data at the Ohawe Beach site, Waingongoro River 152
Figure 105 Numbers of taxa and MCI values in the Mangawhero Stream upstream of Eltham WWTP 154
Figure 106 LOWESS trend plot of MCI data at site upstream of the Eltham WWTP discharge, Mangawhero Stream 156
Figure 107 LOWESS trend plot of ten years of MCI data at site upstream of the Eltham WWTP discharge, Mangawhero Stream 157
Figure 108 Numbers of taxa and MCI values in the Mangawhero Stream downstream of the railbridge and Mangawharawhara Stream confluence 158
Figure 109 LOWESS trend plot of MCI data at the Mangawhero Stream site downstream 160
Figure 110 LOWESS trend plot of ten years of MCI data at the Mangawhero Stream site downstream 161
Figure 111 Numbers of taxa and MCI values in the Huatoki Stream at the end of Hadley Drive 162
Figure 112 LOWESS trend plot of MCI data in the Huatoki Stream at the Hadley Drive site 165
Figure 113 LOWESS trend plot of ten years of MCI data in the Huatoki Stream at the Hadley Drive site 165
Figure 114 Numbers of taxa and MCI values in the Huatoki Stream at the Huatoki Domain 166
Figure 115 LOWESS trend plot of MCI data in the Huatoki Stream for the Huatoki Domain site 168
Figure 116 LOWESS trend plot of ten years of MCI data in the Huatoki Stream for the Huatoki Domain site 169
Figure 117 Numbers of taxa and MCI values in the Huatoki Stream at Molesworth Street (near coast) 170
Figure 118 LOWESS trend plot of MCI data for the site in the Huatoki Stream near the coast 172
Figure 119 LOWESS trend plot of ten years of MCI data for the site in the Huatoki Stream near the coast 173
Figure 120 Numbers of taxa and MCI values in the Kaupokonui River at Opunake Road 175
Figure 121 LOWESS trend plot of MCI data in the Kaupokonui River at the Opunake Road site 177
Figure 122 LOWESS trend plot of ten years of MCI data in the Kaupokonui River at the Opunake Road site 178
Figure 123 Numbers of taxa and MCI values in the Kaupokonui River upstream of Kaponga oxidation pond system 179
Figure 124 LOWESS trend plot of MCI data at the site in the Kaupokonui River upstream of the Kaponga oxidation ponds system 181
Figure 125 LOWESS trend plot of ten years of MCI data in the Kaupokonui River at the site upstream of the Kaponga oxidation ponds system 182
Figure 126 Numbers of taxa and MCI values in the Kaupokonui River upstream of Kapuni railbridge 183
xx
Figure 127 LOWESS trend plot of MCI data in the Kaupokonui River at the site upstream of Kapuni railbridge 185
Figure 128 LOWESS trend plot of ten years of MCI data in the Kaupokonui River at the site upstream of Kapuni railbridge 186
Figure 129 Numbers of taxa and MCI values in Kaupokonui River at Upper Glenn Road 187
Figure 130 LOWESS trend plot of MCI data in the Kaupokonui River at the Upper Glenn Road site 189
Figure 131 LOWESS trend plot of ten years of MCI data in the Kaupokonui River at the Upper Glenn Road site 190
Figure 132 Numbers of taxa and MCI values in the Kaupokonui River at the Kaupokonui Beach site 191
Figure 133 LOWESS trend plot of MCI data in the Kaupokonui River at the Kaupokonui Beach site 193
Figure 134 LOWESS trend plot of MCI data in the Kaupokonui River at the Kaupokonui Beach site 194
Figure 135 Numbers of taxa and MCI values in the Katikara Stream at Carrington Road 196
Figure 136 LOWESS trend plot of MCI data in the Katikara Stream at the Carrington Road site 198
Figure 137 LOWESS trend plot of ten years of MCI data in the Katikara Stream at the Carrington Road site 199
Figure 138 Numbers of taxa and MCI values in the Katikara Stream 200m u/s of the coast 200
Figure 139 LOWESS trend plot of MCI data in the Katikara Stream at the coastal site 202
Figure 140 LOWESS trend plot of ten years of MCI data in the Katikara Stream at the coastal site 203
Figure 141 Numbers of taxa MCI values in the Kapoaiaia Stream at Wiremu Road 205
Figure 142 LOWESS trend plot of MCI data in the Kapoaiaia Stream at the Wiremu Road site 207
Figure 143 LOWESS trend plot of ten years of MCI data in the Kapoaiaia Stream at the Wiremu Road site 208
Figure 144 Numbers of taxa and MCI values in the Kapoaiaia Stream at Wataroa Road 209
Figure 145 LOWESS trend plot of MCI data in the Kapoaiaia Stream at the Wataroa Road site 211
Figure 146 LOWESS trend plot of ten years of MCI data in the Kapoaiaia Stream at the Wataroa Road site 212
Figure 147 Numbers of taxa and MCI values in the Kapoaiaia Stream at the Cape Egmont (upstream of coast) site 213
Figure 148 LOWESS trend plot of MCI data at the site upstream of the coast 215
Figure 149 LOWESS trend plot of ten years of MCI data in the Kapoaiaia Stream at the site upstream of the coast 216
Figure 150 Numbers of taxa and MCI values in the Kurapete Stream upstream of the Inglewood WWTP 217
Figure 151 LOWESS trend plot of MCI data in the Kurapete Stream at the site upstream of the Inglewood WWTP 220

xxi
Figure 152 LOWESS trend plot of ten years of MCI data in the Kurapete Stream at the site upstream of the Inglewood WWTP 220
Figure 153 Numbers of taxa and MCI values in the Kurapete Stream, 6 km downstream of the Inglewood WWTP outfall 221
Figure 154 LOWESS trend plot of MCI data in the Kurapete Stream for the site 6 km downstream of the Inglewood WWTP outfall 223
Figure 155 LOWESS trend plot of ten years of MCI data in the Kurapete Stream for the site 6 km downstream of the Inglewood WWTP outfall 224
Figure 156 Numbers of taxa and MCI values in the Waiokura Stream at Skeet Road 226
Figure 157 LOWESS trend plot of MCI data in the Waiokura Stream at the Skeet Road site 228
Figure 158 LOWESS trend plot of MCI data in the Waiokura Stream at the Skeet Road site 229
Figure 159 Numbers of taxa and MCI values in the Waiokura Stream at Manaia Golf course 230
Figure 160 LOWESS trend plot of MCI data in the Waiokura Stream for the Manaia golf course 232
Figure 161 Numbers of taxa and MCI values in the Tangahoe River at Upper Tangahoe Valley Road 233
Figure 162 LOWESS trend plot of MCI data in the Tangahoe River for the upper Tangahoe Valley site 235
Figure 163 Numbers of taxa and MCI values in the Tangahoe River at Tangahoe Valley Road bridge 236
Figure 164 LOWESS trend plot of MCI data in the Tangahoe River for the Tangahoe Valley Road bridge site 238
Figure 165 Numbers of taxa and MCI values in the Tangahoe River downstream of the railbridge 239
Figure 166 LOWESS trend plot of MCI data for the Tangahoe River site downstream of the railbridge 241
Figure 167 Numbers of taxa and MCI values in the Tangahoe River at Upper Tangahoe Valley Road 243
Figure 168 Numbers of taxa and MCI values in the Herekawe Stream upstream of Centennial Drive 245
Figure 169 LOWESS trend plot of MCI data in the Herekawe Stream at the Centennial Drive site 247
Figure 170 LOWESS trend plot of ten years of MCI data in the Herekawe Stream at the Centennial Drive site 248
Figure 171 Spring 2015 MCI scores in relation to SEM historical median values 251
Figure 172 Spring 2015 MCI scores in relation to predicted altitude scores 253
Figure 173 Spring 2015 MCI scores in relation to predicted downstream distance scores 256
Figure 175 Summer 2016 MCI scores in relation to SEM historical median values 260
Figure 176 Summer 2016 MCI scores in relation to predicted altitude scores 262
Figure 177 Summer 2016 MCI scores in relation to predicted downstream distance scores 265
Figure 178 Summer 2016 MCI scores in relation to REC predictive values 268

xxii
Figure 179 Generic biological ‘health’ (based on median MCI) and trends in biological quality for SEM sites, 1995 to 2016 272

1
Introduction 1.The Resource Management Act 1991 (RMA) established new requirements for local authorities to undertake environmental monitoring. Section 35 of the RMA requires local authorities to monitor, among other things, the state of the environment of their region or district, to the extent that is appropriate to enable them to effectively carry out their functions under the Act.
To this effect, the Taranaki Regional Council (‘the Council’) has established a state of the environment monitoring (SEM) programme for the region. This programme is outlined in the Council’s ‘State of the Environment Monitoring Procedures Document’, which was prepared in 1997. The monitoring programme is based on the significant resource management issues that were identified in the Council’s Regional Policy Statement for Taranaki (1994).
The SEM programme is made up of a number of individual monitoring activities, many of which are undertaken and managed on an annual basis (from 1 July to 30 June). For these annual monitoring activities, summary reports are produced following the end of each monitoring year (i.e., after 30 June). Where possible, individual consent monitoring programmes have been integrated within the SEM programme to save duplication of effort and minimise costs. The purpose of annual SEM reports is to summarise monitoring activity results for the year, and provide an interpretation of these results, together with an update of trends in the data.
Annual SEM reports act as ‘building blocks’ towards the preparation of regular regional state of the environment reports. The Council’s first, or baseline, state of the environment report was prepared in 1996 (TRC, 1996c), summarising the region’s progress in improving environmental quality in Taranaki over the past two decades. The second regional state of the environment report was published (TRC, 2003) and discussed the data gathered over the inaugural five year monitoring period. With the completion of the first ten years of the programme in mid 2005, a report on trends (at 60 sites) in biological stream ‘health’ was completed (Stark and Fowles, 2006), with a subsequent report focusing on the interpretation of significant trends (TRC, 2006). The third regional state of the environment report published in 2009 (TRC, 2009a) encompassed data from 1995 to 2007 and included trending (at 53 sites) for the twelve year period. The fourth regional state of the environment report published in 2015 (TRC, 2015) includes data trended for the 18-year period (to mid 2013) at 53 of the 57 sites. Subsequent annual SEM reports consider trends in stream health for all sites as the data record for each monitoring activity increases with time.
This report summarises the results for the sites surveyed in the freshwater biological SEM programme over the 2015-2016 monitoring year, the twenty-first year of this programme.

2
Monitoring activity 2. Introduction 2.1
The Council commenced the freshwater biological SEM programme in spring 1995. The 2015-2016 monitoring year was therefore the twenty-first year in which this SEM programme was undertaken. This report presents the results from the sites surveyed in the 2015-2016 monitoring year. The methodology for the programme is fully described in TRC (1997b) and summarised below.
Monitoring methodology 2.2The standard ‘400 ml kick-sampling’ and rarely the ‘400 ml sweep-net- sampling’ techniques were used to collect streambed (benthic) macroinvertebrates from various sampling sites in selected catchments in the Taranaki region (detailed in section 2.4 and TRC, 1997b). The ‘kick-sampling’ technique is very similar to Protocol C1 (hard-bottomed, semi-quantitative) and the ‘sweep-net- sampling’ technique is very similar to Protocol C2 of the New Zealand Macroinvertebrate Working Group (NZMWG) protocols for macroinvertebrate samples in wadeable streams (Stark et al, 2001). Surveys of all sites are normally performed twice during the monitoring year, once during spring (October to December) and once during summer (February and March). Sampling dates for each site are detailed in Table 3. Samples were preserved with Kahle’s Fluid for later sorting and identification under a stereomicroscope according to Taranaki Regional Council methodology using protocol P1 of NZMWG protocols for sampling macroinvertebrates in wadeable streams (Stark et al. 2001). Macroinvertebrate taxa were placed in abundance categories for each sample (Table 1).
Table 1 Macroinvertebrate abundance categories
Environmental parameters and indicators 2.3 Taxonomic richness 2.3.1
The number of macroinvertebrate taxa found in each sample is used as an indicator of the richness of the community at each site. A high taxonomic richness does not necessarily mean a pristine, healthy community. Sites with mild nutrient enrichment will often have higher taxonomic richnesses than pristine sites and therefore caution is required when evaluating sites based on taxonomic richness (Stark and Maxted, 2007).
Abundance category Number of individuals
R (rare) 1-4
C (common) 5-19
A (abundant) 20-99
VA (very abundant) 100-499
XA (extremely abundant) 500+

3
Macroinvertebrate Community Index (MCI) 2.3.2Stark (1985) developed a scoring system for macroinvertebrate taxa according to their sensitivity to organic pollution in stony New Zealand streams. Highly ‘sensitive’ taxa were assigned the highest scores of 9 or 10, while the most ‘tolerant’ forms scored 1. Sensitivity scores for certain taxa have been modified in accordance with Taranaki experience (see TRC, 1997b). By averaging the scores obtained from a list of taxa taken from one site and multiplying by a scaling factor of 20, a Macroinvertebrate Community Index (MCI) value was obtained. The MCI is a measure of the overall sensitivity of macroinvertebrate communities to the effects of organic pollution. More ‘sensitive’ communities inhabit less polluted waterways. A refinement of Stark’s classification (Stark, 1985, Boothroyd and Stark, 2000; and Stark and Maxted, 2007) has been made in order to grade the biological ‘health’ based upon MCI ranges. This gradation is presented in Table 2.
Table 2 Generic MCI gradation of biological water quality conditions adapted for Taranaki streams and rivers
TRC Grading MCI Colour Code Stark’s
classification
Excellent >140
Excellent Very Good 120-140
Good 100-119 Good
Fair 80-99 Fair
Poor 60-79
Poor Very Poor <60
This generic adaption is considered to provide more resolution of stream ‘health’ in the context of more precise upper and lower MCI score bands, than the earlier grading classification (Stark and Fowles, 2015). Despite the acknowledgement that the boundaries between gradings may be fuzzy (Stark and Maxted, 2007), these gradings can assist with the assessment of trends in long term temporal data. When the same number of replicate samples are collected per site, the detectable difference method may be used to assess the significance of MCI score differences. Stark (1998) provides statistically significant detectable differences for the protocols used by TRC (10.8 MCI units). Therefore, if differences between MCI scores are greater than 10 units, then they can be considered significantly different. In practice this means a result more than 10 units above a score would be regarded as significantly higher, and a result more than 10 units below a score would be significantly lower. Between season and long term median MCI scores and/or taxa richnesses may also be compared using t-tests (Stark and Maxted, 2007).

4
Predictice measures using the MCI 2.3.2.1 Data from ringplain rivers and streams that source of flow was within Egmont National Park was used to establish relationships between MCI scores and altitude and distance from stream/river source (National Park boundary) on the ringplain. These generic relationships for predicting MCI in ringplain streams/rivers have been established as:
MCI = 84.427 + 0.102A [where A= altitude (masl)]; and MCI = 131.717 – 25.825 log10 D [where D = distance from source (km)]
and have been based upon more than 2400 TRC surveys of about 300 ringplain ‘control’ sites over the period from 1980 to 2008. These generic predictive relationships have a margin of error of ±10 units (Stark and Fowles, 2009). River and stream data from throughout the Taranaki Region for ‘control’ sites from both SEM and compliance monitoring has also been compiled and useful statistics produced based on steam type and altitude (TRC, 2015c). This data has the advantage that it also contains data for all rivers and streams and is based on raw data and therefore is not as constrained as a predictive value produced by a mathematical equation. Leathwick (2009, pers comm.) has also developed predictive scores based upon the River Environmental Classification (REC) system for New Zealand rivers and streams (Snelder et al, 2004). REC classifies and maps river and stream environments in a spatial framework for management purposes. It provides a context for inventories of river/stream resources and a spatial framework for effects assessment, policy development, developing monitoring programmes, and interpretations of state of the environment reporting.
Semi Quantitative MCI (SQMCIs) 2.3.3A semi-quantitative MCI value (SQMCIs) (Stark 1998 & 1999) has also been calculated for the taxa present at each site by multiplying each taxon score by a loading factor (related to its abundance), totalling these products, and dividing by the sum of the loading factors (Stark, 1998, 1999). The loading factors were 1 for rare (R), 5 for common (C), 20 for abundant (A), 100 for very abundant (VA) and 500 for extremely abundant (XA). Unlike the MCI, the SQMCIs is not multiplied by a scaling factor of 20, so that its corresponding range of values is 20x lower. A difference of more than 0.83 units is considered statistically significant. In this report, the index is used to emphasize the numerical dominance of certain taxa where this is relevant to the interpretation of community structure. However, Stark and Maxted (2007) considered the MCI to be a more appropriate index than the SQMCIs for State of the Environment monitoring and discussion, and in this report emphasis will be placed on the MCI.
Trend analysis 2.4State of the environment (SEM) macroinvertebrate data collected at SEM sites in the region over the twenty-one year (1995-2016) and last ten year (2006-2016) periods

5
under standard TRC programme protocols were analysed for trends over time. The MCI, a surrogate for stream health, was selected as the most appropriate index for use in the assessment of time trends (see Stark and Maxted, 2007). MCI trend data was first visually inspected using a scatter plot of MCI data vs time with LOWESS [Locally Weighted Scatterplot] fit (tension of 0.4) to create a smoothed, moving average trendline. MCI data was then statistically analysed for trends over time using the Mann-Kendall test at the 5% level of significance (‘cut-off’ point), followed by false discovery rate (FDR) analysis for sites with a minimum of ten years continuous data recorded (Stark and Fowles, 2006). The significance of a site’s trend (i.e. the strength of the trend) was calculated according to the statistical probability of occurrence (p-value), as long as similar numbers of samples were collected for analysis which has been the case with the TRC programme. A Kendall tau coefficient was also produced which indicated whether the trend was positive or negative and the magnitude of the trend. A trend may be statistically significant but have no ecological importance, or vice versa. The consideration of ecological importance may be supported by best professional judgment (BPJ) of a freshwater ecologist with knowledge of the region’s rivers and streams. However, it is likely that the strongest trends (lowest p-values) would also have the greatest ecological importance. In relation to the indicator of stream ‘health’, the MCI, the estimation error for this index is 10.8 units (Stark 1998) for the sampling protocols used by TRC. Therefore, although a statistically significant temporal trend may be found for a site’s data, if the LOWESS range of MCI scores is less than 11 units, the best professional judgment may eliminate this from a list of significant results. Also, to place these trends in perspective, each site may be assessed against graduations (bands of MCI values) of stream health. In this instance, Stark’s (1985) categories have been refined (using BPJ) as illustrated in Section 2.3.3 above (Stark & Fowles, 2015).
Site locations 2.5All sites in the freshwater biological SEM programme for the Taranaki region are illustrated in Figure 1 and described in Table 3. The biological programme for the 2015-2016 period involved the continuation of a riparian vegetation monitoring component incorporating five sites in the Kaupokonui River (see Table 3) and five sites in western Taranaki ring plain streams (Katikara Stream and Kapoaiaia Stream). Evaluations of the effects of, and recovery from, extensive erosion in the headwaters of the Waiaua River had been included in this programme. These surveys commenced in December 1998 and the two sites on the Waiaua River were incorporated into the SEM biological monitoring programmes since the initial documentation of the effects and recovery was established. This river continued to be affected by headwater erosion in more recent years. Therefore, the programme was reviewed in 2006 and the Waiaua River excluded from the SEM programme. The Kurapete Stream (upstream and 5.5km downstream of the Inglewood oxidation pond system) has been monitored throughout the SEM period, using the appropriate SEM protocols, and has been included in the programme. Two additional sites in the

6
Waiwhakaiho River catchment were included in 2002-2003 in recognition of the importance of this major catchment and a further two additional eastern hill country sites in the Whenuakura and Waitara Rivers were added in 2015-2016 to improve the representativeness of the monitoring programme, particularly in the light of the requirement of the National Policy Statement on Fresh Water that the Council undertakes representative monitoring across all Freshwater Management Units within the region. The Council has identified prospective FMUs and has adjusted its monitoring programmes in anticipation of these being confirmed in due course.

7
Table 3 Freshwater biological monitoring sites in the State of the Environment Monitoring programme
Type River/stream Site Site code GPS location Distance
from Nat Park (km)
Altitude (masl)
Spring sampling
date
Summer sampling
date E N
Conservation Hangatahua (Stony) R
Hangatahua (Stony) R
Mangatete Road
SH45
STY000300
STY000400
1677460
1674632
5657823
5661558
7.3
12.5
160
70
8 Dec 15
8 Dec 15
1 Feb 16
1 Feb 16
Maketawa S
Maketawa S
Opp Derby Road
Tarata Road
MKW000200
MKW000300
1702192
1708784
5656304
5665231
2.3
15.5
380
150
14 Oct 15
14 Oct 15
16 Feb 16
16 Feb 16
Large catchment/
multiple impacts
Waiwhakaiho R
Waiwhakaiho R
Waiwhakaiho R
Waiwhakaiho R
National Park SH3 (Egmont Village)
Constance St (NP)
Adjacent to L Rotomanu
WKH000100
WKH000500
WKH000920
WKH000950
1696096
1698297
1695827
1696587
5658351
5666893
2677271
2678336
0
10.6
26.6
28.4
460
175
20
2
21 Dec 15
21 Dec 15
21 Dec 15
21 Dec 15
16 Mar 16
16 Mar 16
16 Mar 16
16 Mar 16
Mangorei S SH3 MGE000970 1696094 5671500 21.6 90 21 Dec 15 16 Mar 16
Manganui R
Manganui R
SH3
Bristol Road
MGN000195
MGN000427
1708871
1711210
5651282
5667887
8.7
37.9
330
140
14 Oct 15
14 Oct 15
16 Feb 16
16 Feb 16
Patea R
Patea R
Patea R
Barclay Rd
Swansea Rd
Skinner Rd
PAT000200
PAT000315
PAT000360
1702620
1711801
1715919
5646598
5644382
5644681
1.9
12.9
19.2
500
300
240
12 Oct 15
12 Oct 15
12 Oct 15
29 Feb 16
29 Feb 16
29 Feb 16
Large catchment/
multiple impacts/ hill country
Waitara R
Waitara R
Autawa Road
Mamaku Road
WTR000540
WTR000850
1720719
1708384
5663669
5678739
N/A
N/A
100
15
15 Oct 15
15 Oct 15
15 Feb 16
15 Feb 16
Intensive usage Waingongoro R
Waingongoro R
Waingongoro R
Waingongoro R
Waingongoro R
Waingongoro R
700m d/s Nat Park
Opunake Rd
Eltham Rd
Stuart Rd
SH45
Ohawe Beach
WGG000115
WGG000150
WGG000500
WGG000665
WGG000895
WGG000995
1700835
1705692
1710576
1709784
1704042
1702531
5645086
5642523
5634824
5632049
5618667
5617624
0.7
7.2
23.0
29.6
63.0
66.6
540
380
200
180
40
10
7 Oct 15
7 Oct 15
7 Oct 15
7 Oct 15
7 Oct 15
7 Oct 15
1 Mar 16
1 Mar 16
1 Mar 16
1 Mar 16
1 Mar 16
1 Mar 16
Primary agricultural
Timaru S
Timaru S
Carrington Road
SH45
TMR000150
TMR000375
1684423
1679509
5659634
5665554
0
10.9
420
100
8 Dec 15
8 Dec 15
1 Feb 16
1 Feb 16
Mangaoraka S Corbett Road MRK000420 1702538 5676320 N/A 60 15 Oct 15 31 Mar 16
Punehu S
Punehu S
Wiremu Rd
SH45
PNH000200
PNH000900
1687323
1677946
5637020
5627786
4.4
20.9
270
20
12 Oct 15
12 Oct 15
10 Mar 16
10 Mar 16
Waiokura S
Waiokura S
Skeet Rd
Manaia Golf Course
WKR000500
WKR000700
1698807
1697636
5628892
5622019
N/A
N/A
150
70
16 Oct 15
16 Oct 15
9 Feb 16
9 Feb 16
Eastern hill country Tangahoe R
Tangahoe R
Tangahoe R
Upper Valley
Tangahoe Vly Rd bridge
d/s rail bridge
TNH000090
TNH000200
TNH000515
1725340
1719126
1715751
5626101
5622681
5612470
N/A
N/A
N/A
85
65
15
14 Oct 15
14 Oct 15
14 Oct 15
15 Mar 16
15 Mar 16
15 Mar 16
Whenuakura R Nicholson Rd WNR000450 1732757 5598479 N/A 20 14 Oct 15 15 Mar 16
Mangaehu R Raupuha Rd MGH000950 1726300 5639062 N/A 120 12 Oct 15 26 Feb 16
Riparian
Wes
tern
Waimoku S
Waimoku S
Lucy’s Gully
Beach
WMK000100
WMK000298
1681324
1681725
5666240
5669851
0
4.0
160
1
12 Dec 15
12 Dec 15
1 Feb 16
1 Feb 16
Katikara S
Katikara S
Carrington Road
Beach
KTK000150
KTK000248
1683566
1676597
5657855
5667473
0
18.1
420
5
12 Oct 15
12 Oct 15
10 Mar 16
10 Mar 16
Kapoaiaia S
Kapoaiaia S
Kapoaiaia S
Wiremu Road
Wataroa Road
Cape Egmont
KPA000250
KPA000700
KPA000950
1678009
1672739
1665690
5652025
5652272
5652452
5.7
13.5
25.2
240
140
20
12 Oct 15
12 Oct 15
12 Oct 15
10 Mar 16
10 Mar 16
10 Mar 16
Sou
ther
n
Kaupokonui R
Kaupokonui R
Kaupokonui R
Kaupokonui R
Kaupokonui R
Opunake Road
U/s Kaponga oxi ponds
U/s Lactose Co.
Upper Glenn Road
Near mouth
KPK000250
KPK000500
KPK000660
KPK000880
KPK000990
1698088
1698609
1697613
1693026
1691209
5639231
5634423
5629791
5622705
5620444
3.3
9.2
15.5
25.7
31.1
380
260
170
60
5
16 Oct 15
16 Oct 15
16 Oct 15
16 Oct 15
16 Oct 15
9 Feb 16
9 Feb 16
9 Feb 16
9 Feb 16
9 Feb 16
Small degraded (‘poor’) catchment
Mangati S
Mangati S
D/s railway line
Te Rima Pl, Bell Block
MGT000488
MGT000520
1700095
1699385
5678043
5679103
N/A
N/A
30
20
19 Nov 15
19 Nov 15
10 Feb 16
10 Feb 16
Mangawhero S
Mangawhero S
u/s Eltham WWT Plant
d/s Mangawharawhara S
MWH000380
MWH000490
1712475
1710795
5633431
5632738
N/A
N/A
200
190
7 Oct 15
7 Oct 15
1 Mar 16
1 Mar 16
Kurapete S
Kurapete S
u/s Inglewood WWT Plant
6 km d/s Inglewood WWTP
KRP000300
KRP000660
1705087
1709239
5665510
5667481
N/A
N/A
180
120
15 Oct 15
15 Oct 15
31 Mar 16
31 Mar 16
Urbanisation Huatoki S
Huatoki S
Huatoki S
Hadley Drive
Huatoki Domain
Molesworth St
HTK000350
HTK000425
HTK000745
1693349
1693041
1692800
5671486
5673404
5676424
N/A
N/A
N/A
60
30
5
15 Oct 15
15 Oct 15
15 Oct 15
8 Mar 16
8 Mar 16
8 Mar 16
Herekawe S Centennial Drive HRK000085 1688283 5674972 N/A 5 12 Oct 15 8 Mar 16
Northern lowland catchment
Waiau S Inland North Road WAI000110 1714587 5680018 N/A 50 15 Oct 15 31 Mar 16
Major abstraction Waiongana S
Waiongana S
SH3a
Devon Road
WGA000260
WGA000450
1705159
1704063
5669554
5680381
16.1
31.2
140
20
14 Oct 15
14 Oct 15
15 Feb 16
15 Feb 16

8
Figure 1 Location of macroinvertebrate fauna sampling sites for the 2015-2016 SEM programme

9
Two sites in the Maketawa Stream were also added as a result of a commitment to continue the documentation of conditions in this catchment following the investigation of baseline water quality conditions during the 2000-2002 period (Stark, 2003). Three sites in the Tangahoe River were established in the 2007-2008 period for the purposes of monitoring land use changes (afforestation) in an eastern hill country catchment. The two sites in the Waiokura Stream were also added in the 2007-2008 period as a long term monitoring commitment to the collaborative best practice dairying catchment project. One site in the Herekawe Stream (a long term consent monitoring site) was incorporated into the programme in the 2008-2009 period for the purpose of monitoring the local initiatives of walkway establishment and riparian planting of this small catchment on the western outskirts of the New Plymouth urban area. The Hangatahua (Stony) River was selected for the SEM programme as a waterway of high conservation value. The headwaters of the river are the Ahukawakawa swamp within Egmont National Park, and several tributaries that begin above the tree line on the north-west of Mount Taranaki. Once the river leaves the National Park boundary its catchment becomes very narrow so that it receives little water from surrounding farmland before reaching the sea. This factor and the protection order on the catchment maintains good water quality in the river. However, exceptions occur from time to time after headwater erosion events when sedimentation and scouring of the riverbed may be particularly severe. The sites at Mangatete Road and State Highway 45 are approximately seven kilometres and twelve kilometres downstream of the National Park boundary respectively. The Timaru and Mangaoraka Streams were chosen for the SEM programme as examples of streams within primary agricultural catchments. The Timaru Stream arises within the National Park boundary, near the peak of Pouakai, in the Pouakai Range. Upon leaving this range, the stream flows along the edge of the Kaitake Range (also part of the National Park) and receives several tributaries that flow through adjacent agricultural land. From the edge of the Kaitake Range, the stream flows north through agricultural land to the sea. Carrington Road crosses the stream within the National Park boundary and State Highway 45 is six kilometres downstream of the confluence with the first farmland tributary. The Mangaoraka Stream rises below the National Park boundary near Egmont Road and flows north through farmland for its entire length before joining the Waiongana Stream near the coast. Corbett Road is 26 kilometres downstream of the source. The Waiongana Stream was included in the SEM programme as an example of a stream with a major water abstraction. The stream originates within the National Park, near the North Egmont visitor’s centre. After crossing the park boundary, it flows north-east through agricultural land to the sea. State Highway 3a crosses the stream fifteen kilometres downstream of the National Park boundary, and the intake for the Waitara industrial water supply is a further five kilometres downstream of that. Devon Road is 30 kilometres downstream of the National Park boundary. The Waiwhakaiho, Manganui, Waitara, and Mangaehu Rivers were selected for the SEM programme as examples of waterways with large catchments and multiple impacts from human land uses including plantation forestry, rural, urban and industrial. They arise either on Mt Taranaki or in the eastern hill country, before flowing across the ring plain.

10
The Waiwhakaiho River and its headwater tributaries arise above the tree line on the north face of Mount Taranaki. Upon leaving the National Park, the river flows north through agricultural and industrial land for 27 kilometres to the sea. The river passes under State Highway 3 near Egmont Village, nine kilometres downstream of the National Park boundary. The sites at Constance Street and adjacent to Lake Rotomanu are included in the lower Waiwhakaiho River industrial discharges monitoring programme. The site adjacent to Lake Rotomanu has replaced the site immediately downstream of the Mangaone Stream that was used in the 1995-96 State of the Environment monitoring survey. This allows the State of the Environment monitoring programme to better integrate with the industrial monitoring programme. The Mangorei Stream is the principal tributary catchment in the lower reaches, downstream of the major abstraction of water for hydroelectric and community supply purposes. Occasional headwater erosion events have been documented in the upper river with an instance of severe (orange) discolouration in spring 2014 due to release of iron oxide from a small headwater tributary. The source of the Manganui River is situated above the tree line on the eastern slopes of Mount Taranaki. After leaving the National Park, the river flows east and then north through agricultural land for 44 kilometres before joining the Waitara River. State Highway 3 is eight kilometres downstream of the National Park boundary. At Tariki Road, much of the flow of the Manganui River is diverted through the Motukawa hydroelectric power scheme to the Waitara River. Therefore, except when the Tariki weir is overtopping, most of the water in the Manganui River at Bristol Road (14 kilometres downstream of the diversion) comes from tributaries such as the Mangamawhete, Waitepuke, Maketawa, and Ngatoro Streams. Like the Manganui River, these streams originate high on the eastern slopes of Mount Taranaki. They flow through agricultural land before joining the river. The Maketawa Stream provides a valued trout and native fish habitat. Sites were included in the upper and lower reaches of the stream. The small Kurapete Stream, which rises as seepage to the west of Inglewood, was included to monitor trends in relation to the removal of the town’s Wastewater Treatment Plant’s discharge from this tributary of the lower Manganui River in 2000. Sites were included upstream and nearly six km downstream of where the discharge was located. The Waitara River flows south-west and then north-west out of the eastern hill country through a mix of agricultural land and native forest before passing through the town of Waitara and out to sea. It has a different character from the steep ring plain rivers and carries a high silt load. The Autawa Road site is located 46 km from the coast. This site was only added during the current reporting period, to increase the number of eastern hill country sites being monitored. The Mamaku Road site is located six km upstream of the coast above any tidal influence. This site is also part of the monitoring programme for the stormwater discharge from the Waitara Valley Methanex plant to the Waitara River. The Mangaehu River originates in the eastern hill country and flows south-west through agricultural land for most of its length before joining the Patea River, ten kilometres upstream of Lake Rotorangi. Raupuha Road crosses the river less than one kilometre upstream of the confluence with the Patea River.

11
The Tangahoe River is a smaller eastern hill country catchment which flows through agricultural land, some of which has undergone afforestation in the upper reaches. Fonterra extracts dairy company processing waters in the lower reaches near the coast, south of Hawera township. The Whenuakura River is an eastern hill country river which primarily flows through agricultural land. It has a high silt load and is consequently highly turbid. The only site located on the Whenuakura River at Nicholson Road was included during this reporting period, to increase the number of eastern hill country rivers being monitored. The Mangati Stream was chosen for the SEM programme as an example of a small, degraded stream. Only five kilometres in length, the stream rises in farmland and flows north through the Bell Block industrial area and suburbs to the sea. The site downstream of the railway line is upstream of all industrial discharges to the stream. The site at Te Rima Place is located within a suburban park, downstream of all Bell Block industrial discharges. Both sites are part of the Mangati Stream industrial monitoring programme. The Waimoku Stream originates in Egmont National Park where it flows down Lucy’s Gully in the Kaitake Ranges. Once the stream leaves the park it flows through farmland for three and a half kilometres, and through the coastal township of Oakura for about 200 metres, before entering the sea. It was included in the SEM programme in the 1999-2000 monitoring year to monitor the effects of a riparian planting programme in the catchment. Sampling sites are located in Lucy’s Gully under native forest, and in Oakura township, about 100 metres upstream of the sea. The Waiau Stream originates in farmland near Tikorangi, and is a small catchment to the north of the Waitara River. It flows for 12.5 km to the sea. The stream was included in the SEM programme in the 1999-2000 monitoring year as an example of a northern lowland catchment. The sampling site at Inland North Road is located in a pasture setting. The Punehu Stream is representative of a south-western Taranaki catchment subject primarily to intensive agricultural land use with water quality affected by diffuse source run-off and point source discharges from dairy shed treatment pond effluents particularly in the Mangatawa Stream, a small lower reach tributary. No industrial discharges to the stream system are known to occur. Both sites were Taranaki ring plain survey sites (TCC, 1984) and the lower site near the coast remains a NIWA hydrological recording station as a representative basin. The upstream site is representative of relatively unimpacted stream water quality although it lies approximately two km below the National Park boundary. The small seepage fed, ringplain Waiokura Stream drains an intensively dairy-farmed catchment. The Fonterra, Kapuni factory irrigates wastewater within the mid reaches of this catchment. The catchment is the subject of a (five region) collaborative long term study of best practice dairying catchments (Wilcock et al, 2009).

12
The Patea River rises on the eastern slopes of Mt Taranaki, within the National Park and is a trout fishery of regional significance, particularly upstream of Lake Rotorangi (formed by the Patea dam) in its mid reaches. Site 1 (at Barclay Road) is representative of the upper catchment adjacent to the National Park above agricultural impacts. Site 2 (at Swansea Road), which is integrated with special order consent monitoring programmes, was also a ring plain survey site, and is representative of developed farmland drainage and is downstream of Stratford township (urban run-off, but upstream of the rubbish tip and oxidation pond discharges and the combined cycle power station discharge). Site 3 (at Skinner Road) is an established hydrological recorder station downstream of these discharges and the partly industrialised Kahouri Stream catchment. The Waingongoro River rises on the south-eastern slopes of Mount Taranaki within the National Park and is one of the longest of the ring plain rivers, with a meandering 67 km of river length from the National Park boundary prior to entering the Tasman Sea at Ohawe Beach. The river is the principal trout fishery in Taranaki and is also utilised for water abstraction purposes and up until mid 2010, received treated industrial and municipal wastes discharges in mid-catchment at Eltham. Site 1 (near the National Park boundary) is representative of high water quality conditions with minimal agricultural impacts. Site 2, six km further downstream (at Opunake Road) represents agricultural impacts, still in the upper reaches of the river while site 3 (at Eltham Road) a further 16 km downstream remains representative of the impacts of farmland drainage and some water abstraction while upstream of the major Eltham point source discharges from a meatworks and the municipal wastewater treatment plant. The meatworks wastewaters were diverted to spring and summer land irrigation in the mid 2000s and treated wastewater subsequently has continued to be irrigated onto farmland in this manner. The Eltham municipal wastes were permanently diverted by pipeline to Hawera in June 2010. The Stuart Road site, a further six km downstream is located below these discharges with a major portion of the meatworks discharge diverted to land irrigation (spring through late summer) since the early 2000s and the Eltham WWTP discharge diverted out of the catchment by pipeline to the Hawera WWTP in July 2010. A further two sites (SH45 and Ohawe Beach) are located 33 km and 37 km downstream of Stuart Road in the intensively developed farmland lower reaches of the catchment. River flow recording sites are located at Eltham Road and SH45. The Mangawhero Stream is a relatively small, swamp-fed catchment rising to the east of Eltham in the Ngaere Swamp and draining developed farmland. The upper site is located in the mid reaches of the stream upstream of the point source discharge from the Eltham municipal wastewater treatment plant while the lower site is located a further three km downstream, below the Mangawharawhara Stream confluence, near the confluence with the Waingongoro River. Apart from the municipal point source discharge, which was diverted out of the stream in July 2010 (see above), the catchment is predominantly developed farmland. The Huatoki Stream was sampled as part of the State of the Environment monitoring programme for the first time in the 1997-1998 monitoring year. The stream rises one kilometre outside the National Park boundary on the foothills of the Pouakai Range. It flows through agricultural land for 12.5 km to the outskirts of New Plymouth where it enters native forest reserve. The stream flows for four and a half kilometres alongside walkways and beneath the central business district of New Plymouth
13
before entering the sea next to Puke Ariki Landing. Within New Plymouth it flows through a culvert in a flood retention dam and over a small weir in the Huatoki Reserve prior to the business section of the city. Beautification works adjacent to ‘Centre City’ near the stream mouth (in 2010) involved the creation of a weir and fish pass immediately upstream of the lowest site which subsequently has altered the flow regime at this site and created a run-like habitat with intermittent flow variability rather than the previous riffle habitat. The Herekawe Stream is a small seepage stream on the western boundary of New Plymouth. It drains a mainly urban catchment and receives stormwater discharges particularly in its lower reaches. Recent completion of a walkway and riparian planting community project now warrants the inclusion of the consent monitoring ‘control’ site at Centennial Drive for monitoring the effectiveness of these initiatives. The Kaupokonui River rises on the southern slopes of Mt Taranaki within the National Park. It drains an intensively farmed dairy catchment. The principal point source discharges to the river occur in the mid-reaches from the Kaponga oxidation pond system, and cooling water from NZMP (Kapuni) Ltd. The river has patchy riparian vegetation cover and has been targeted for intensive riparian management initiatives. Site 1 is two and a half kilometres downstream of the National Park boundary and has high water quality, with minor agricultural impacts. Toward the mid-reaches, site 2 (six kilometres further downstream) is subject to some agricultural impacts, but is a short distance upstream of the Kaponga oxidation ponds’ system discharge. A further six kilometres downstream, site 3 is upstream of wastes irrigation, cooling water discharges and factory abstraction. The Upper Glenn Road (site 4) is a further 10 km downstream, below all of the factory’s activities and is a river flow hydrological recording site. The final site 5, is located near the mouth of the river, 5 km below site 4, upstream of any tidal influence at Kaupokonui beach domain camping ground. Two western catchments, the Katikara Stream and Kapoaiaia Stream, were included in the programme to monitor trends in relation to riparian planting. Such riparian planting initiatives have been concentrated in certain catchments where current riparian vegetation is poor. The Katikara Stream rises on the western slopes of Mt Taranaki, passing through primarily agricultural land in the relatively short distance to the sea. The Kapoaiaia Stream also rises from Mt Taranaki on the western side but south of the Katikara Stream. The Kapoaiaia Stream drains agricultural land throughout its entire catchment below the National Park boundary, passing through Pungarehu township at SH45 before entering the sea at Cape Egmont. A hydrological telemetry recorder is located at Cape Egmont.

14
Results and discussion 3. Flows and water temperatures 3.1
Hydrological flow recorders continuously monitor water levels in the Mangaoraka, Waiongana, Punehu, and Kapoaiaia Streams, and the Waiwhakaiho, Manganui, Stony, Patea, Mangaehu, Waingongoro, Kaupokonui, Waitara and Whenuakura Rivers. Flow conditions are therefore known for these watercourses. The proximity of previous freshes (elevated flows) for each site surveyed, are summarised in Table
4, with flow assessments extrapolated from nearby catchments for sites where flow recorders did not exist.
Table 4 Duration since freshes at sampling sites in the 2015-2016 SEM biomonitoring programme
River/stream Site
Spring survey Summer survey
(days after flow above) (days after flow above)
3 x median 7 x median 3 x median 7 x median
Hangatahua (Stony) R Hangatahua (Stony) R
Mangatete Road SH45
(7) (7)
(17) (17)
(12) (12)
(12) (12)
Timaru S Timaru S
Carrington Road SH45
(7) (7)
(17) (17)
(12) (12)
(12) (12)
Mangaoraka S Corbett Road 14 14 7 42
Waiongana S Waiongana S
SH3a Devon Road
12 12
13 13
27 27
27 27
Waiwhakaiho R Waiwhakaiho R Waiwhakaiho R Waiwhakaiho R
National Park SH3 (Egmont Village) Constance St (NP) Adjacent Lake Rotomanu
8 8 8 8
20 20 20 20
27 27 27 27
27 27 27 27
Mangorei S SH3 (8) (20) (27) (27)
Manganui R Manganui R
SH3 Bristol Road
11 12
12 12
28 28
28 29
Maketawa S Maketawa S
opp Derby Road Tarata Road
(12) (12)
(13) (13)
(28) (28)
(28) (28)
Waitara R Waitara R
Autawa Road Mamaku Road
12 12
46 46
26 26
38 38
Mangati S Mangati S
D/s railway line Te Rima Pl, Bell Block
(15) (15)
(15) (15)
(22) (22)
(33) (33)
Waimoku S Waimoku S
Lucy’s Gully Beach
(7) (7)
(17) (17)
(12) (12)
(12) (12)
Waiau S Inland North Road (14) (14) (7) (42)
Punehu S Punehu S
Wiremu Rd SH45
9 9
9 9
21 21
21 21
Patea R Patea R Patea R
Barclay Rd Swansea Rd Skinner Rd
10 10 10
31 31 31
12 12 12
12 12 12
Mangaehu R Raupuha Road 7 21 38 158
Mangawhero S Mangawhero S
u/s Eltham WWT Plant d/s Mangawharawhara S
(9) (9)
(25) (25)
(12) (12)
(12) (12)
Waingongoro R Waingongoro R Waingongoro R Waingongoro R Waingongoro R Waingongoro R
900m d/s Nat Park Opunake Rd Eltham Rd Stuart Rd SH45 Ohawe Beach
15 15 15 15 14 14
15 15 15 15 26 26
12 12 12 12 12 12
12 12 12 12 12 12
Huatoki S Huatoki S Huatoki S
Hadley Drive Huatoki Domain Molesworth St
(14) (14) (14)
(14) (14) (14)
(19) (19) (19)
(19) (19) (19)
Kaupokonui R Kaupokonui R Kaupokonui R Kaupokonui R Kaupokonui R
Opunake Rd U/s Kaponga oxi ponds U/s Lactose Co. Glenn Rd Beach
22 22 22 22 22
24 24 24 24 24
21 21 21 21 21
138 138 138 138 138
Katikara S Katikara S
Carrington Road Near mouth
(9) (9)
(32) (32)
(21) (21)
(21) (21)
Kapoaiaia S Kapoaiaia S Kapoaiaia S
Wiremu Road Wataroa Road Near coast
9 9 9
20 20 20
21 21 21
21 21 21
Kurapete S Kurapete S
u/s Inglewood WWTP 6km d/s Inglewood WWTP
(14) (14)
(14) (14)
(7) (7)
(42) (42)
Tangahoe R Tangahoe R Tangahoe R
Upper Valley Tangahoe Valley Road d/s railbridge
(16) (16) (16)
(32) (32) (32)
(24) (24) (24)
(26) (26) (26)
Whenuakura R Nicholson Road 11 21 24 26
Waiokura S Waiokura S
Skeet Road Manaia Golf-Course
(16) (16)
(30) (30)
(144) (144)
(158) (158)
Herekawe S Centennial Drive (9) (32) (19) (19)
NB: ( ) = extrapolation from nearby catchment

15
Spot water temperatures recorded at each site at the time of sampling during spring 2015 and summer 2016 SEM biomonitoring surveys are summarised in Table 5.
Table 5 Water temperature recorded at the times of SEM biological monitoring surveys
Watercourse Spring 2015 Summer 2016
Hangatahua (Stony) River 13.3-13.5 20.1-22.2
Timaru Stream 11.2-13.3 16.7-20.4
Mangaoraka Stream 13.5 16.3
Waiongana Stream 12.9-14.9 20.2-24.3
Waiwhakaiho River 14.0-19.8 11.5-21.1
Mangorei Stream 17.6 17.6
Manganui River 9.6-13.1 17.2-20.4
Maketawa Stream 10.4-11.9 14.1-18.2
Waitara River 14.7-15.0 24.5-25.1
Mangati Stream 13.1-16.1 19.1-20.3
Waimoku Stream 11.7 15.6
Waiau Stream 12.6 15.1
Punehu Stream 10.5-13.2 18.6-18.8
Patea River 12.2-15.0 13.1-19.3
Mangaehu River 14.1 20.8
Mangawhero Stream 13.4-14.0 18.0-18.9
Waingongoro River 7.4-15.5 13.1-21.0
Huatoki Stream 11.8-12.8 18.2-18.8
Kaupokonui River 8.1-13.0 14.8-21.9
Katikara Stream 9.4-15.2 13.8-16.9
Kapoaiaia Stream 11.8-14.2 16.7-18.6
Kurapete Stream 11.4-13.6 14.6-15.2
Tangahoe River 14.1-14.6 16.4-17.3
Whenuakura River 14.2 18.4
Waiokura Stream 11.5-12.3 16.5-18.8
Herekawe Stream 15.2 18.5
The spring 2015 surveys were undertaken mainly in October while a few more northerly rivers and streams were sampled in late November and December due to persistent freshes preventing earlier sampling. Spring surveys were conducted 7 to 22 days after a moderate fresh (> 3x median flow). Water temperatures ranged from 8.1˚C to 19.8˚C (Table 5) with higher altitude sites typically recording lower temperatures than lower altitude sites.
The summer 2016 surveys were conducted over February and March. Rivers and streams had relatively low flows due to the drier conditions which was normal for summer conditions. Surveys were performed 7-144 days after a moderate fresh. Summer water temperatures were higher than those recorded during spring and ranged from 11.5°C to 21.9°C (Table 5). These ranges tended to be typical of most past summer surveys.

16
Macroinvertebrate communities 3.2Lists of the taxa found during spring 2015 and summer 2016 surveys, together with taxa richness, MCI scores and other appropriate indices for each site are tabulated and attached as Appendix I. These results are discussed below on a stream by stream basis for the sites and seasons (spring and summer) in which the surveys were conducted. Data from previous surveys are also presented for each site and results to date are illustrated as appropriate.
Hangatahua (Stony) River 3.2.1Prior to the commencement of the SEM programme (in 1995), three samples had been collected from the site at State Highway 45. During the 1999-2000 monitoring year, an extra survey was performed in July 1999, and an extra site (STY000260, near the end of Saunders Road) was included in all three surveys, in order to closely monitor the recovery of the Stony River following massive sand drifts in the channel. This extra monitoring was not performed in subsequent monitoring years until 2004, following the very heavy rainfall events in late summer. In the winter of 1996 a massive drift of sand moved down the Hangatahua River and devastated macroinvertebrate communities, following a major erosion event in the headwaters of the river. Few macroinvertebrate taxa were found in the river in the spring of 1996 (Figure 2 and Figure 4). Since then sand has continued to affect the macroinvertebrate communities of the river, although some recovery was observed in the communities in March and November 1997, January and February 1999, late 2000, and again in 2002-2003. At these times greater numbers and varieties of macroinvertebrates were recorded on the riverbed. The very high MCI score of 160 recorded at SH45 in November 1998 (Figure 2) was the result of a community consisting of only one taxon (and just a single individual) which was highly sensitive to pollution. The MCI is not a good indicator of water quality when only a small number of taxa are present and is not typically the index used to assess the impacts of sedimentation in stony streams. However, the MCI has some value in the assessment of recovery of the faunal community with time and has some value in trend evaluation. A further massive sand drift moved down the river following very heavy February 2004 rainfall and significant flood flows in late February, some three weeks prior to the summer 2004 survey. An additional survey was performed in late winter 2004 to document the continuing effects of sand/sediment drift (see Figures 2 and 3), some three months prior to the late spring survey. Further erosion effects occurred in late 2006 delaying the spring 2006 survey and during the latter months of 2007 while significant sand and scoria bed-scouring and sedimentation occurred down the river in mid year and again in spring 2008 delaying the ‘spring’ survey until early in 2009. No large scale significant headwater erosion events were recorded between spring 2009 and summer 2014 but there was a headwater erosion event in February 2014. There have been no major headwater erosion events since February 2014 though minor bed-scouring and sedimentation effects continued to impact during the 2015-2016 period. The results of spring 2015 and summer 2016 surveys are presented in Table 129 and Table 130, Appendix I.
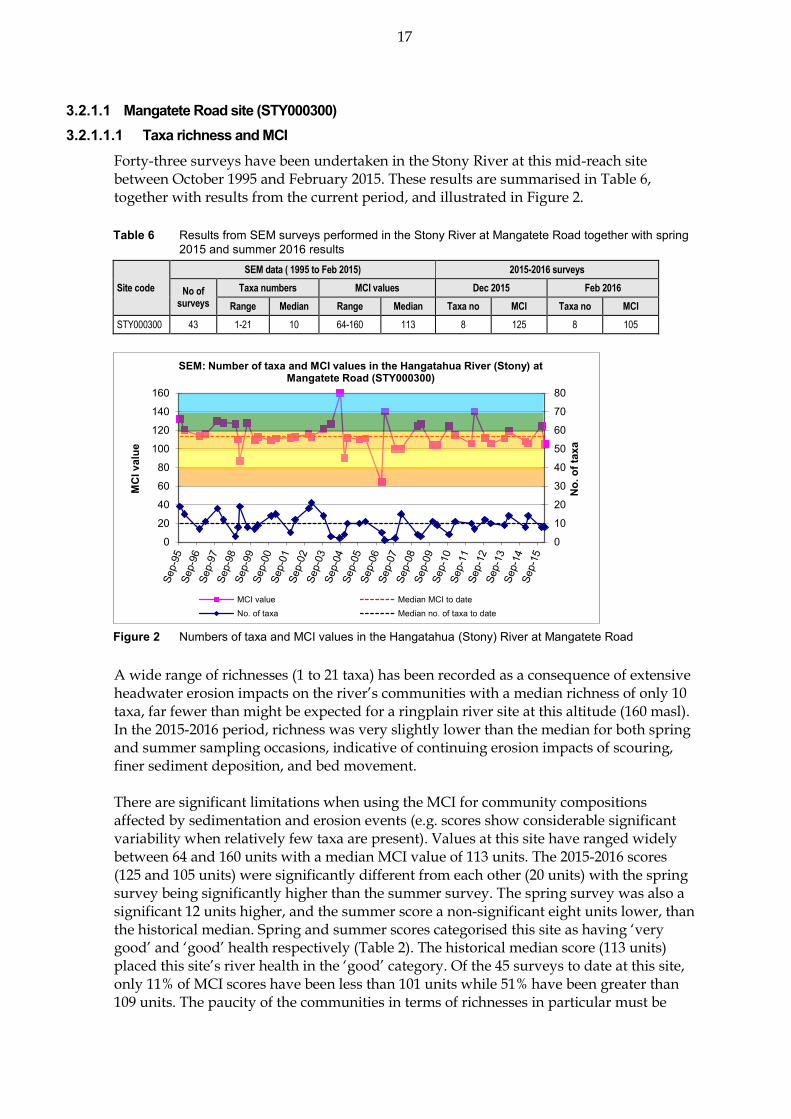
17
Mangatete Road site (STY000300) 3.2.1.1 Taxa richness and MCI 3.2.1.1.1
Forty-three surveys have been undertaken in the Stony River at this mid-reach site between October 1995 and February 2015. These results are summarised in Table 6, together with results from the current period, and illustrated in Figure 2.
Table 6 Results from SEM surveys performed in the Stony River at Mangatete Road together with spring 2015 and summer 2016 results
Site code
SEM data ( 1995 to Feb 2015) 2015-2016 surveys
No of surveys
Taxa numbers MCI values Dec 2015 Feb 2016
Range Median Range Median Taxa no MCI Taxa no MCI
STY000300 43 1-21 10 64-160 113 8 125 8 105
Figure 2 Numbers of taxa and MCI values in the Hangatahua (Stony) River at Mangatete Road A wide range of richnesses (1 to 21 taxa) has been recorded as a consequence of extensive headwater erosion impacts on the river’s communities with a median richness of only 10 taxa, far fewer than might be expected for a ringplain river site at this altitude (160 masl). In the 2015-2016 period, richness was very slightly lower than the median for both spring and summer sampling occasions, indicative of continuing erosion impacts of scouring, finer sediment deposition, and bed movement. There are significant limitations when using the MCI for community compositions affected by sedimentation and erosion events (e.g. scores show considerable significant variability when relatively few taxa are present). Values at this site have ranged widely between 64 and 160 units with a median MCI value of 113 units. The 2015-2016 scores (125 and 105 units) were significantly different from each other (20 units) with the spring survey being significantly higher than the summer survey. The spring survey was also a significant 12 units higher, and the summer score a non-significant eight units lower, than the historical median. Spring and summer scores categorised this site as having ‘very good’ and ‘good’ health respectively (Table 2). The historical median score (113 units) placed this site’s river health in the ‘good’ category. Of the 45 surveys to date at this site, only 11% of MCI scores have been less than 101 units while 51% have been greater than 109 units. The paucity of the communities in terms of richnesses in particular must be
0
10
20
30
40
50
60
70
80
0
20
40
60
80
100
120
140
160
No. o
f tax
a
MCI
val
ue
SEM: Number of taxa and MCI values in the Hangatahua River (Stony) at Mangatete Road (STY000300)
MCI value Median MCI to dateNo. of taxa Median no. of taxa to date

18
taken into account at the site, where headwater erosion effects have been very pronounced and the substrate remains relatively mobile and well-scoured.
Community composition 3.2.1.1.2Characteristic macroinvertebrate taxa in the communities at this site prior to the 2015-2016 period are listed in Table 7.
Table 7 Characteristic taxa [abundant (A), very abundant (VA), extremely abundant (XA)] recorded in the Stony River at Mangatete Road between 1995 and February 2015 [43 surveys] and by the spring 2015 and summer 2015 surveys
Taxa List MCI
score A VA XA Total %
Surveys
Spring 2015
Summer 2016
ANNELIDA (WORMS) Oligochaeta 1 1 1 2
EPHEMEROPTERA (MAYFLIES) Deleatidium 8 10 13 9 32 74 VA VA
PLECOPTERA (STONEFLIES) Zelandoperla 8 14 1 15 35
COLEOPTERA (BEETLES) Elmidae 6 12 2 14 33
TRICHOPTERA (CADDISFLIES) Hydropsyche (Aoteapsyche) 4 4 4 9
Costachorema 7 5 5 12
Hydrobiosis 5 1 1 2
Oxyethira 2 1 1 2
DIPTERA (TRUE FLIES) Aphrophila 5 1 1 2
Eriopterini 5 4 4 9
Maoridiamesa 3 2 1 3 7
Orthocladiinae 2 6 1 7 16
Prior to the current 2015-2016 period, twelve taxa have characterised this site’s communities on survey occasions. These have comprised two ‘highly sensitive’, five ‘moderately sensitive’, and five ‘tolerant’ taxa. The only predominant taxon has been the ‘highly sensitive’ taxon [ubiquitous mayfly (Deleatidium)]. This taxon and elmid beetles are often present (frequently in large numbers) on unstable shingle-cobble substrates (Death, 2000). Only the mayfly Deleatidium of the characteristic taxa was dominant in the spring and summer communities. These results were indicative of the significant reduction in diversity of characteristic taxa due to headwater erosion impacts and unstable substrate. The lack of abundances of midge taxa on both occasions was coincident with the presence of minimal periphyton mats cover on the cobble-boulder substrate; an indication of the instability of the substrate and limited recovery from scouring/erosion events. The similarity of the characteristic taxa on the two occasions and particularly the single numerically dominant taxon was reflected in the SQMCIs scores which were the same between seasons (Table 129 and Table 130), with the high values due to the numerical abundance and dominance of the mayfly Deleatidium.
Predicted river ‘health’ 3.2.1.1.3The Stony River at Mangatete Road is 7.3 km downstream of the National Park boundary at an altitude of 160 masl. Relationships for ringplain streams developed between MCI and site altitude and distance from the National Park boundary (Stark and Fowles, 2009) predict MCI values of 101 (altitude) and 109 (distance) for this site. The historical site median (113 units) was significantly higher (Stark and Fowles, 2009) than the predictive value for altitude (12 units) but was not significantly different to the predictive value for distance (4 units). The spring 2015 score (125 units) was significantly higher than the

19
STY000300
1994 1996 1998 2000 2002 2004 2006 2008 2010 2012 2014 2016Year
0
20
40
60
80
100
120
140
160
180
MC
I va
lue
predictive values for both altitude and distance, while the summer 2016 survey score was significantly higher than the altitude (11 units) but not significantly different to the distance predictive values (3 units). The median value for ringplain streams of similar altitude arising within the National Park (TRC, 2015c) was 108 units. The historical site median (113 units) was not significantly different to this value. The spring score was significantly higher but not the summer score. The REC predicted MCI value (Leathwick, et al. 2009) was 128 units. The historical site median is significantly lower than this value. The spring score was not significantly different but the summer score was significantly lower.
Temporal trends in 1995 to 2016 data 3.2.1.1.4A LOWESS trend plot with a moving average (tension 0.4) trendline was produced (Figure 3). A non-parametric statistical trend analysis of the MCI data using the Mann-Kendall test was then performed on 21 years of SEM results (1995-2016) from the site in the Stony River at Mangatete Road. The MCI has been chosen as the preferable indicator of ‘stream/river health’ for SEM trend reporting purposes.
Figure 3 LOWESS trend plot of MCI data at Mangatete Road site
Although an overall slight decreasing trend in MCI scores has been found, particularly over the first six years, this has not been statistically significant. The trendline at this site has a range of MCI scores of about 15 units indicative of some important ecological variability over the period, not surprisingly given the erosion effect documented earlier and further emphasised by the wide range of individual scores, particularly since 2004. Overall the trendline shows ‘good’ generic river ‘health’ (Table 2); deteriorating slightly from ‘very good’ (prior to 1999). However, the majority of the variability has been caused by severe headwater erosion events at varying intervals over the period.
Temporal trends in 2006 to 2016 data 3.2.1.1.5A LOWESS trend plot with a moving average (tension 0.4) trendline was produced (Figure 4). A non-parametric statistical trend analysis of the MCI data using the Mann-Kendall test was then performed on the most recent ten years of SEM results (2006-2016) from the site in the Stony River at Mangatete Road.
N = 45 Kendall tau = - 0.177 p level = 0.087 FDR p = 0.139

20
Figure 4 Ten year LOWESS trend plot of ten years of MCI data at Mangatete Road site
Although an overall slight increasing trend in MCI scores has been found, particularly over the first three years, this has not been statistically significant. The site has a LOWESS-smoothed MCI range of about 40 units indicative of some important ecological variability over the period associated with headwater erosion events. Overall this smoothed trend line shows ‘good’ generic river ‘health’ (Table 2). The majority of the variability (one survey in 2007) has been caused by one severe headwater erosion event.
STY000300
2006 2008 2010 2012 2014 2016 2018Year
0
20
40
60
80
100
120
140
160M
CI
valu
e
N = 20 Kendall tau = 0.092 p level = 0.572 FDR p = 0.748

21
SH 45 site (STY000400) 3.2.1.3 Taxa richness and MCI 3.2.1.3.1
Forty-three surveys have been undertaken in the Stony River at this lower reach site between October 1995 and February 2015. These results are summarised in Table 8, together with results from the current period, and illustrated in Figure 5.
Table 8 Results from SEM surveys performed in the Stony River at SH 45 together with spring 2015 and summer 2016 results
Site code
SEM data ( 1995 to Feb 2015) 2015-2016 surveys
No of surveys
Taxa numbers MCI values Dec 2015 Feb 2015
Range Median Range Median Taxa no MCI Taxa no MCI
STY000400 43 0-18 9 0-160 109 10 112 8 113
Figure 5 Numbers of taxa and MCI values in the Hangatahua (Stony) River at SH 45
A wide range of richnesses (0 to 18 taxa) has been recorded mainly as a consequence of extensive headwater erosion impacts on the river’s communities, with a median richness of only nine taxa, far fewer than would be expected for a ringplain river site at this altitude (70 m asl) [e.g. median of 18 taxa (TRC, 2015a)]. In the 2015-2016 period richnesses were within one taxon of this site’s historical median at the time of the two sampling occasions, but indicative of continuing erosion impacts of scouring, finer sediment deposition, and bed movement at this site. There are significant limitations when using the MCI for community compositions affected by sedimentation and erosion events (e.g. scores show considerable variability when relatively few taxa are present). Values at this site have ranged widely between 0 and 160 units with a median MCI value of 109 units. The MCI score for the spring 2015 survey (105 units) was not significantly different to the summer 2016 survey (113 units) and both surveys were ranged from within three to four units above the historical median (Figure 4). They categorised this site as having ‘good’ (spring and summer) health (Table 2). Of the 45 surveys to date at this site, only 7% of MCI scores have been less than 92 units while 76% have been greater than 103 units. However, the paucity of numbers and richnesses (in both seasons) should be recognised in this assessment given the historical impacts of headwater erosion effects along the length of the river channel.
0
10
20
30
40
50
60
70
80
0
20
40
60
80
100
120
140
160
No. o
f tax
a
MCI
val
ue
SEM: Number of taxa and MCI values in the Hangatahua River (Stony) at SH 45 (STY000400)
MCI value Median MCI to dateNo. of taxa Median no. of taxa to date

22
Community composition 3.2.1.3.2Characteristic macroinvertebrate taxa in the communities at this site prior to the 2015-2016 period are listed in Table 9.
Table 9 Characteristic taxa [abundant (A), very abundant (VA), extremely abundant (XA)] recorded in the Stony River at SH 45 between 1995 and February 2015 [43 surveys] and by the spring 2015 and summer 2016 surveys
Taxa List MCI score
A VA XA Total %
Surveys
Spring 2015
Summer 2016
ANNELIDA (WORMS) Oligochaeta 1 1 1 2
EPHEMEROPTERA (MAYFLIES) Deleatidium 8 10 11 10 31 72 XA XA
PLECOPTERA (STONEFLIES) Zelandoperla 8 9 9 21
COLEOPTERA (BEETLES) Elmidae 6 7 7 16 A A
TRICHOPTERA (CADDISFLIES) Hydropsyche (Aoteapsyche) 4 7 7 16 A
Costachorema 7 4 1 5 12 A
Hydrobiosis 5 4 4 9
Oxyethira 2 1 1 2
DIPTERA (TRUE FLIES) Aphrophila 5 1 1 2
Eriopterini 5 1 1 2
Maoridiamesa 3 1 2 3 7
Orthocladiinae 2 8 2 10 23 A
Prior to the current 2015-2016 period, twelve taxa have characterised this site’s communities on survey occasions. These have been comprised of two ‘highly sensitive’, five ‘moderately sensitive’, and five ‘tolerant’ taxa. Only one taxon has been predominant; a ‘highly sensitive’ taxon [the ubiquitous mayfly (Deleatidium)]. This taxon is often present on unstable shingle-cobble substrates (Death, 2000). Only four of the characteristic taxa were dominant in the ‘spring’ community [and three in the summer community, with the mayfly taxon (Deleatidium) extremely abundant in both ‘spring’ and summer communities. Both these results were indicative of a paucity of characteristic taxa due to preceding headwater erosion impacts and/or substrate instability. The relative paucity of midge taxa recorded in both seasons was consistent with only thin periphyton mat layers on the mobile cobble-boulder substrate. The overall dominance by the one ‘highly sensitive’ taxon was reflected in the very similar, high ‘spring’ and summer SQMCIs scores which were within 0.1 unit.
Predicted river ‘health’ 3.2.1.3.3The Stony River at SH 45 is 12.5 km downstream of the National Park boundary at an altitude of 70 m asl. Relationships for ringplain streams developed between MCI and site altitude and distance from the National Park boundary (Stark and Fowles, 2009) predict MCI values of 92 (altitude) and 103 (distance) for this site. The historical site median (109 units) was significantly higher (Stark, 1998) than the predictive altitude value (23 units) but not significantly different to the distance predictive value (10 units). The spring 2015 and summer 2016 surveys scores were both significantly higher than the altitude predictive value and but not significantly higher than the distance predictive value. The historical median score (109 units) was significantly higher than other ringplain streams of similar altitude arising within the National Park (98 units) (TRC, 2015c) but was significantly lower than the REC predicted score of 115 units.
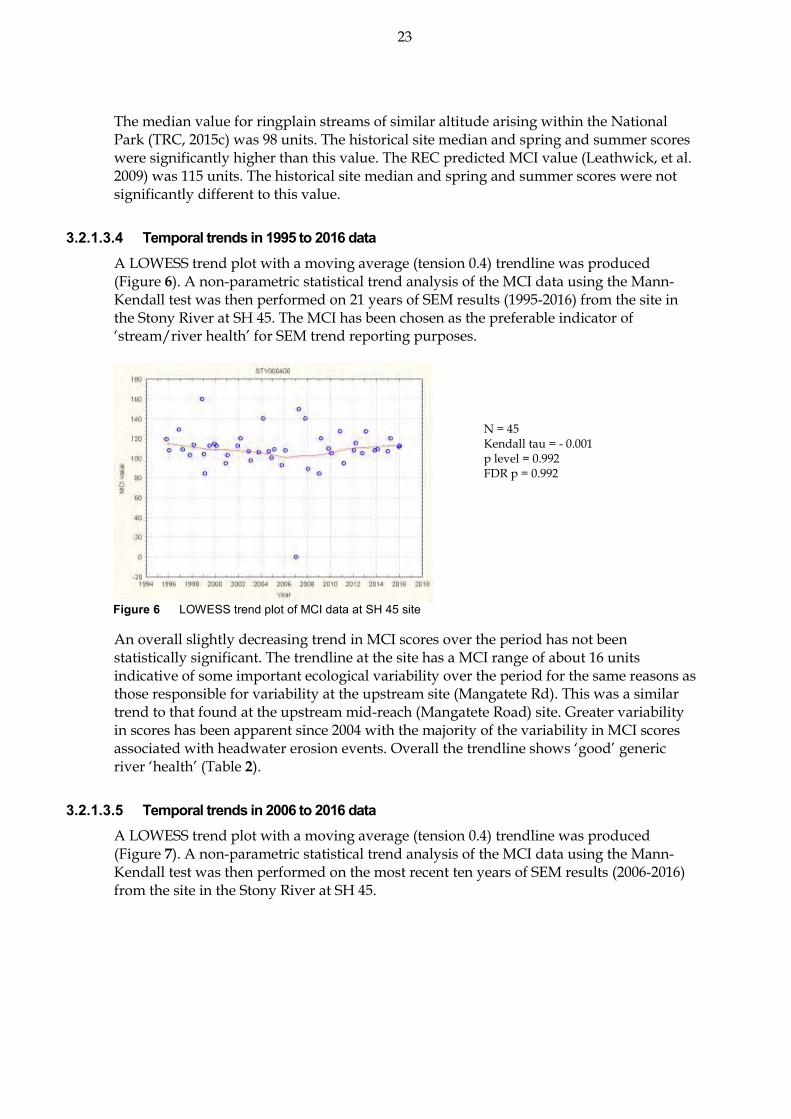
23
The median value for ringplain streams of similar altitude arising within the National Park (TRC, 2015c) was 98 units. The historical site median and spring and summer scores were significantly higher than this value. The REC predicted MCI value (Leathwick, et al. 2009) was 115 units. The historical site median and spring and summer scores were not significantly different to this value.
Temporal trends in 1995 to 2016 data 3.2.1.3.4A LOWESS trend plot with a moving average (tension 0.4) trendline was produced (Figure 6). A non-parametric statistical trend analysis of the MCI data using the Mann-Kendall test was then performed on 21 years of SEM results (1995-2016) from the site in the Stony River at SH 45. The MCI has been chosen as the preferable indicator of ‘stream/river health’ for SEM trend reporting purposes.
Figure 6 LOWESS trend plot of MCI data at SH 45 site An overall slightly decreasing trend in MCI scores over the period has not been statistically significant. The trendline at the site has a MCI range of about 16 units indicative of some important ecological variability over the period for the same reasons as those responsible for variability at the upstream site (Mangatete Rd). This was a similar trend to that found at the upstream mid-reach (Mangatete Road) site. Greater variability in scores has been apparent since 2004 with the majority of the variability in MCI scores associated with headwater erosion events. Overall the trendline shows ‘good’ generic river ‘health’ (Table 2).
Temporal trends in 2006 to 2016 data 3.2.1.3.5A LOWESS trend plot with a moving average (tension 0.4) trendline was produced (Figure 7). A non-parametric statistical trend analysis of the MCI data using the Mann-Kendall test was then performed on the most recent ten years of SEM results (2006-2016) from the site in the Stony River at SH 45.
N = 45 Kendall tau = - 0.001 p level = 0.992 FDR p = 0.992

24
Figure 7 LOWESS trend plot of ten years of MCI data at SH 45 site An overall slightly increasing trend in MCI scores over the period has not been statistically significant. The site has a LOWESS-smoothed MCI range of about 30 units indicative of some important ecological variability over the period associated with headwater erosion events. This was a similar trend to that found at the upstream mid-reach (Mangatete Road) site. Overall this smoothed trend line shows ‘good’ generic river ‘health’ (Table 2).
Discussion 3.2.1.4Due to the major influence of historic and relatively frequent headwater erosion events, scouring, and instability of the river bed; seasonal and spatial differences in macroinvertebrate communities in the Stony River often have not been as pronounced as elsewhere in ringplain streams. MCI scores at each site showed seasonal variation between spring and summer surveys. There was a significant decrease in score at the downstream site of 20 units under spring conditions but no significant difference between the two sites under summer conditions. The large, significant difference in spring scores was largely due to two ‘rare’ taxa which skewed the results and removal of both would give both sites the same MCI score. Additionally, there was no difference in SQMCIs score (7.6 units) between the two sites at the time of the survey. The paucity of the communities at both sites due to erosion events should be noted on both occasions.
STY000400
2006 2008 2010 2012 2014 2016 2018Year
-40
-20
0
20
40
60
80
100
120
140
160
180M
CI
valu
e
N = 20 Kendall tau = 0.106 p level = 0.512 FDR p = 0.742

25
Timaru Stream 3.2.2In the 2008-2009 period severe headwater erosion events had impacted upon the macroinvertebrate communities of the upper reaches of this stream in particular (TRC, 2009). The results found in the 2015-2016 surveys are presented in Table 131 and Table 132, Appendix I.
Carrington Road site (TMR000150) 3.2.2.1 Taxa richness and MCI 3.2.2.1.1
Forty surveys have been undertaken at this upper reach site in the Timaru Stream inside the National Park boundary at Carrington Road between October 1995 and February 2015. These results are summarised in Table 10, together with the results from the current period, and illustrated in Figure 8.
Table 10 Results of previous surveys performed in the Timaru Stream at Carrington Road, together with spring 2015 and summer 2016 results
Site code
SEM data ( 1995 to Feb 2015) 2015-2016 surveys
No of surveys
Taxa numbers MCI values Dec 2015 Feb 2016
Range Median Range Median Taxa no MCI Taxa no MCI
TMR000150 40 8-33 26 119-144 138 24 146 31 144
Figure 8 Numbers of taxa and MCI values in the Timaru Stream at Carrington Road Taxa richness was typically moderately high for the site (median richness of 26 taxa) with only one low result in December 2008 (eight taxa) due to headwater erosion effects over the 2008-2009 period which markedly reduced richness. The median richness was similar to the typical richness (28 taxa) in ringplain streams and rivers near the National Park boundary over 400 m in altitude (TRC, 2015c). During the 2015-2016 period, spring (24 taxa) and summer (31 taxa) richnesses were similar to the median and typical ringplain stream richnesses indicating a relatively stable community. MCI values have had a wider range (25 units) at this site than typical of a site near the National Park boundary due to the low value (119 units) after the 2008-2009 headwater erosion period. However, the median value (138 units) is slightly higher than typical upper reach sites elsewhere on the ringplain (134 units). The spring 2015 score (146 units) and the summer 2016 score (144 units) were slightly higher the historical median and
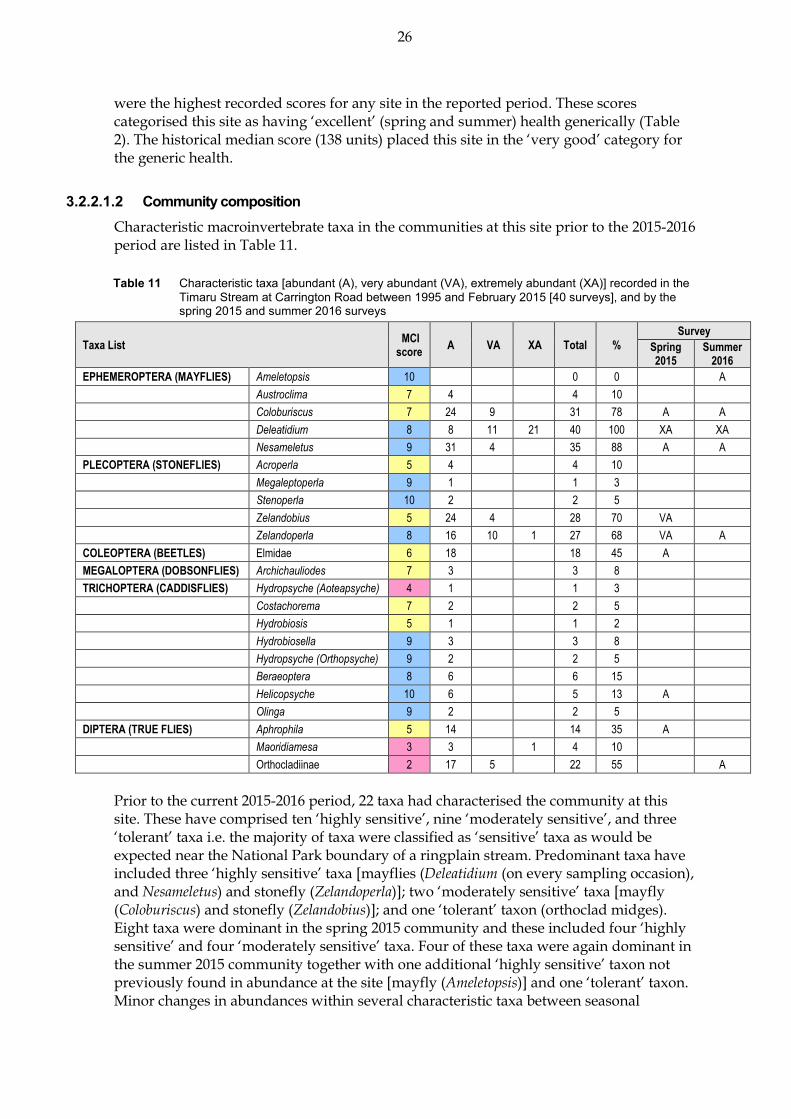
26
were the highest recorded scores for any site in the reported period. These scores categorised this site as having ‘excellent’ (spring and summer) health generically (Table 2). The historical median score (138 units) placed this site in the ‘very good’ category for the generic health.
Community composition 3.2.2.1.2Characteristic macroinvertebrate taxa in the communities at this site prior to the 2015-2016 period are listed in Table 11.
Table 11 Characteristic taxa [abundant (A), very abundant (VA), extremely abundant (XA)] recorded in the Timaru Stream at Carrington Road between 1995 and February 2015 [40 surveys], and by the spring 2015 and summer 2016 surveys
Taxa List MCI score
A VA XA Total %
Survey
Spring 2015
Summer 2016
EPHEMEROPTERA (MAYFLIES) Ameletopsis 10 0 0 A
Austroclima 7 4 4 10
Coloburiscus 7 24 9 31 78 A A
Deleatidium 8 8 11 21 40 100 XA XA
Nesameletus 9 31 4 35 88 A A
PLECOPTERA (STONEFLIES) Acroperla 5 4 4 10
Megaleptoperla 9 1 1 3
Stenoperla 10 2 2 5
Zelandobius 5 24 4 28 70 VA
Zelandoperla 8 16 10 1 27 68 VA A
COLEOPTERA (BEETLES) Elmidae 6 18 18 45 A
MEGALOPTERA (DOBSONFLIES) Archichauliodes 7 3 3 8
TRICHOPTERA (CADDISFLIES) Hydropsyche (Aoteapsyche) 4 1 1 3
Costachorema 7 2 2 5
Hydrobiosis 5 1 1 2
Hydrobiosella 9 3 3 8
Hydropsyche (Orthopsyche) 9 2 2 5
Beraeoptera 8 6 6 15
Helicopsyche 10 6 5 13 A
Olinga 9 2 2 5
DIPTERA (TRUE FLIES) Aphrophila 5 14 14 35 A
Maoridiamesa 3 3 1 4 10
Orthocladiinae 2 17 5 22 55 A
Prior to the current 2015-2016 period, 22 taxa had characterised the community at this site. These have comprised ten ‘highly sensitive’, nine ‘moderately sensitive’, and three ‘tolerant’ taxa i.e. the majority of taxa were classified as ‘sensitive’ taxa as would be expected near the National Park boundary of a ringplain stream. Predominant taxa have included three ‘highly sensitive’ taxa [mayflies (Deleatidium (on every sampling occasion), and Nesameletus) and stonefly (Zelandoperla)]; two ‘moderately sensitive’ taxa [mayfly (Coloburiscus) and stonefly (Zelandobius)]; and one ‘tolerant’ taxon (orthoclad midges). Eight taxa were dominant in the spring 2015 community and these included four ‘highly sensitive’ and four ‘moderately sensitive’ taxa. Four of these taxa were again dominant in the summer 2015 community together with one additional ‘highly sensitive’ taxon not previously found in abundance at the site [mayfly (Ameletopsis)] and one ‘tolerant’ taxon. Minor changes in abundances within several characteristic taxa between seasonal
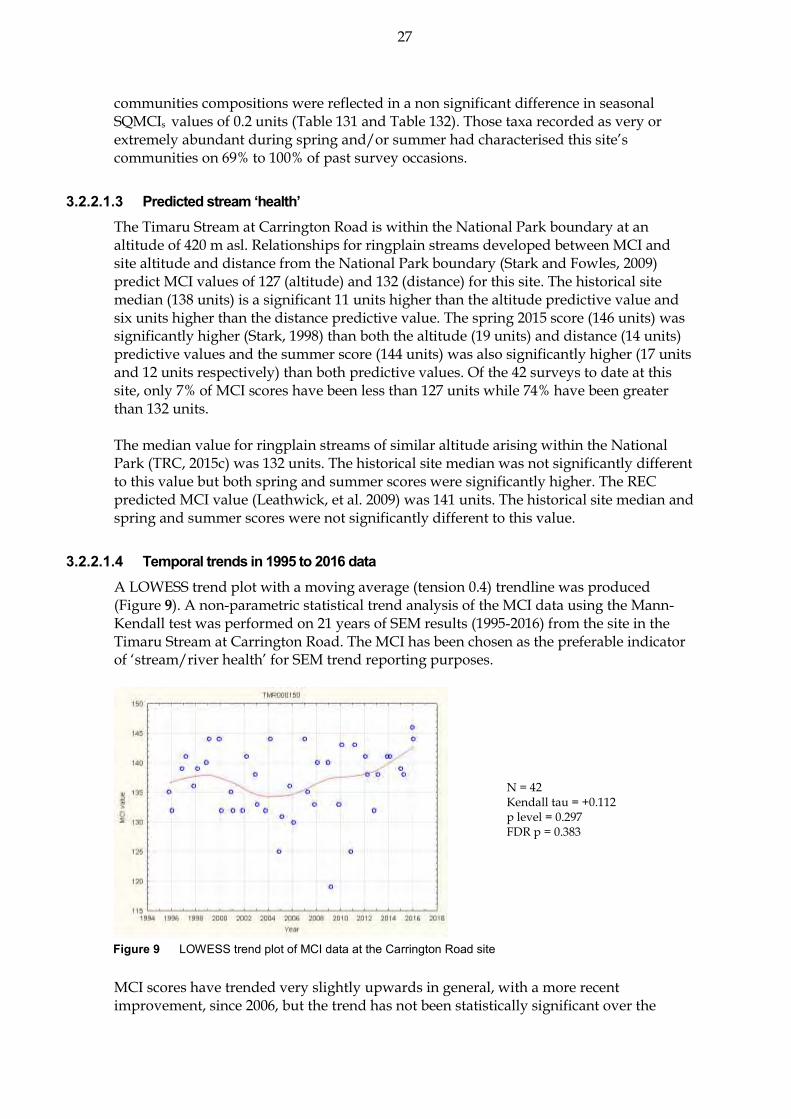
27
N = 42 Kendall tau = +0.112 p level = 0.297 FDR p = 0.383
communities compositions were reflected in a non significant difference in seasonal SQMCIs values of 0.2 units (Table 131 and Table 132). Those taxa recorded as very or extremely abundant during spring and/or summer had characterised this site’s communities on 69% to 100% of past survey occasions.
Predicted stream ‘health’ 3.2.2.1.3The Timaru Stream at Carrington Road is within the National Park boundary at an altitude of 420 m asl. Relationships for ringplain streams developed between MCI and site altitude and distance from the National Park boundary (Stark and Fowles, 2009) predict MCI values of 127 (altitude) and 132 (distance) for this site. The historical site median (138 units) is a significant 11 units higher than the altitude predictive value and six units higher than the distance predictive value. The spring 2015 score (146 units) was significantly higher (Stark, 1998) than both the altitude (19 units) and distance (14 units) predictive values and the summer score (144 units) was also significantly higher (17 units and 12 units respectively) than both predictive values. Of the 42 surveys to date at this site, only 7% of MCI scores have been less than 127 units while 74% have been greater than 132 units. The median value for ringplain streams of similar altitude arising within the National Park (TRC, 2015c) was 132 units. The historical site median was not significantly different to this value but both spring and summer scores were significantly higher. The REC predicted MCI value (Leathwick, et al. 2009) was 141 units. The historical site median and spring and summer scores were not significantly different to this value.
Temporal trends in 1995 to 2016 data 3.2.2.1.4A LOWESS trend plot with a moving average (tension 0.4) trendline was produced (Figure 9). A non-parametric statistical trend analysis of the MCI data using the Mann-Kendall test was performed on 21 years of SEM results (1995-2016) from the site in the Timaru Stream at Carrington Road. The MCI has been chosen as the preferable indicator of ‘stream/river health’ for SEM trend reporting purposes.
Figure 9 LOWESS trend plot of MCI data at the Carrington Road site
MCI scores have trended very slightly upwards in general, with a more recent improvement, since 2006, but the trend has not been statistically significant over the

28
N = 20 Kendall tau = +0.195 p level = 0.230 FDR p = 0.559
period. The trendline had a range over nine units which was not ecologically important. The trendline scores have been indicative of ‘very good’ generic stream health (Table 2) throughout the period.
Temporal trends in 2007 to 2016 data 3.2.2.1.5A LOWESS trend plot with a moving average (tension 0.4) trendline was produced (Figure 10). A non-parametric statistical trend analysis of the MCI data using the Mann-Kendall test was performed on the most recent ten years of SEM results (2006-2016) from the site in the Timaru Stream at Carrington Road.
Figure 10 LOWESS trend plot of ten years of MCI data at the Carrington Road site
MCI scores have trended very slightly upwards in general but the trend has not been statistically significant over the period. The LOWESS-smoothed MCI scores have ranged over seven units which has not been ecologically important. Smoothed scores have been indicative of ‘very good’ generic stream health (Table 2) to ‘excellent’ health since 2014.
SH45 site (TMR000375) 3.2.2.2 Taxa richness and MCI 3.2.2.2.1
Forty surveys have been undertaken in the Timaru Stream at this lower, mid-reach site at SH45 between October 1995 and February 2015. These results are summarised in Table 12, together with the results from the current period, and illustrated in Figure 11.
Table 12 Results of previous surveys performed in the Timaru Stream at SH45, together with spring 2015 and summer 2016 results
Site code
SEM data ( 1995 to Feb 2015) 2015-2016 surveys
No of surveys
Taxa numbers MCI values Dec 2015 Feb 2016
Range Median Range Median Taxa no MCI Taxa no MCI
TMR000375 40 13-35 27 89-120 102 32 114 26 105
TMR000150
2006 2008 2010 2012 2014 2016 2018Year
115
120
125
130
135
140
145
150
MC
I va
lue
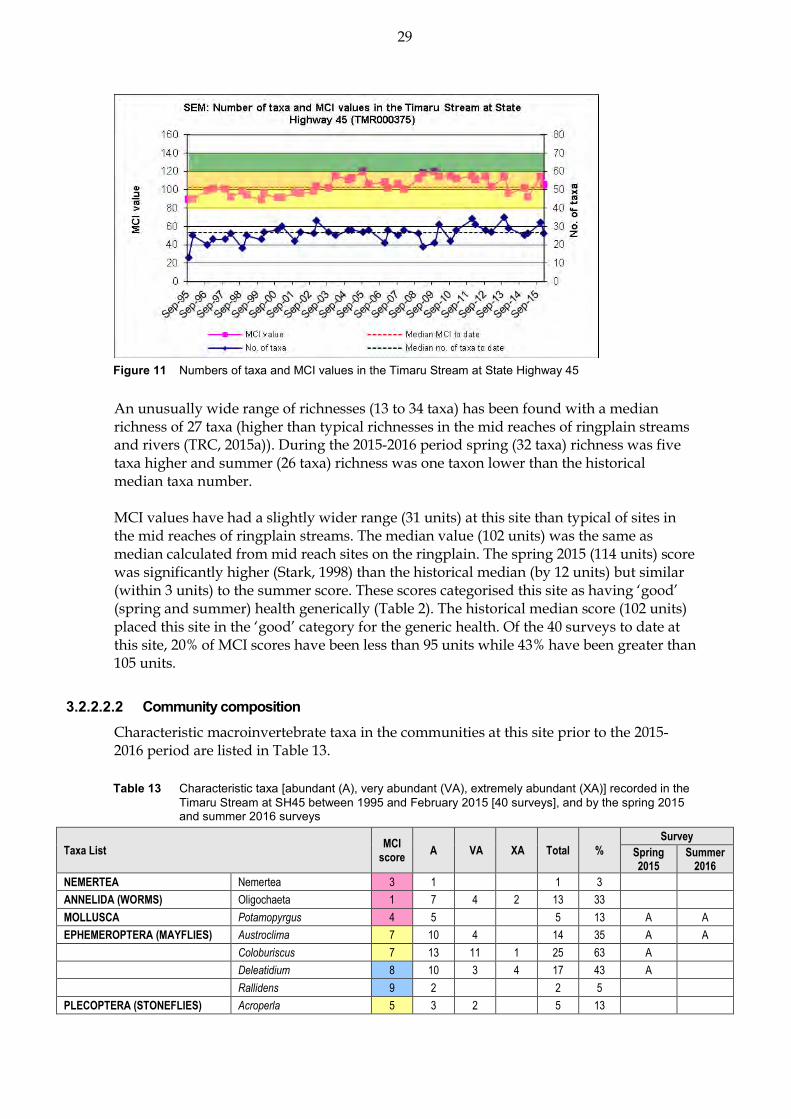
29
Figure 11 Numbers of taxa and MCI values in the Timaru Stream at State Highway 45
An unusually wide range of richnesses (13 to 34 taxa) has been found with a median richness of 27 taxa (higher than typical richnesses in the mid reaches of ringplain streams and rivers (TRC, 2015a)). During the 2015-2016 period spring (32 taxa) richness was five taxa higher and summer (26 taxa) richness was one taxon lower than the historical median taxa number. MCI values have had a slightly wider range (31 units) at this site than typical of sites in the mid reaches of ringplain streams. The median value (102 units) was the same as median calculated from mid reach sites on the ringplain. The spring 2015 (114 units) score was significantly higher (Stark, 1998) than the historical median (by 12 units) but similar (within 3 units) to the summer score. These scores categorised this site as having ‘good’ (spring and summer) health generically (Table 2). The historical median score (102 units) placed this site in the ‘good’ category for the generic health. Of the 40 surveys to date at this site, 20% of MCI scores have been less than 95 units while 43% have been greater than 105 units.
Community composition 3.2.2.2.2Characteristic macroinvertebrate taxa in the communities at this site prior to the 2015-2016 period are listed in Table 13.
Table 13 Characteristic taxa [abundant (A), very abundant (VA), extremely abundant (XA)] recorded in the Timaru Stream at SH45 between 1995 and February 2015 [40 surveys], and by the spring 2015 and summer 2016 surveys
Taxa List MCI
score A VA XA Total %
Survey
Spring 2015
Summer 2016
NEMERTEA Nemertea 3 1 1 3
ANNELIDA (WORMS) Oligochaeta 1 7 4 2 13 33
MOLLUSCA Potamopyrgus 4 5 5 13 A A
EPHEMEROPTERA (MAYFLIES) Austroclima 7 10 4 14 35 A A
Coloburiscus 7 13 11 1 25 63 A
Deleatidium 8 10 3 4 17 43 A
Rallidens 9 2 2 5
PLECOPTERA (STONEFLIES) Acroperla 5 3 2 5 13

30
Taxa List MCI
score A VA XA Total %
Survey
Spring 2015
Summer 2016
Zelandobius 5 1 2 3 8
Zelandoperla 8 14 2 1 17 43
COLEOPTERA (BEETLES) Elmidae 6 16 6 22 55 VA A
MEGALOPTERA (DOBSONFLIES) Archichauliodes 7 17 3 20 50 A A
TRICHOPTERA (CADDISFLIES) Hydropsyche (Aoteapsyche) 4 16 18 3 37 93 VA A
Costachorema 7 10 1 11 28 A
Hydrobiosis 5 9 9 23 A
Neurochorema 6 8 8 20 A
Beraeoptera 8 1 5 1 7 18
Confluens 5 1 1 3
Oxyethira 2 6 2 8 20
Pycnocentrodes 5 10 7 2 19 48 A VA
DIPTERA (TRUE FLIES) Aphrophila 5 16 20 1 37 93 A A
Maoridiamesa 3 23 6 2 31 78 A
Orthocladiinae 2 23 11 4 38 95
Tanytarsini 3 9 1 10 25 A A
Empididae 3 5 5 13
Muscidae 3 5 5 13
Austrosimulium 3 14 14 35 A
Prior to the current 2015-2016 period, relatively large number (27) of taxa had characterised the community at this site on occasions. These have comprised four ‘highly sensitive’, twelve ‘moderately sensitive’, and eleven ‘tolerant’ taxa i.e. a minority of ‘highly sensitive‘ taxa and a downstream increase in the proportion of ‘tolerant’ taxa as would be expected in the mid reaches compared with the upper reaches of a ringplain stream. Predominant taxa have included no ‘highly sensitive’ taxa, three ‘moderately sensitive’ taxa [mayfly (Coloburiscus), elmid beetles, and cranefly (Aphrophila)], and three ‘tolerant’ taxa [net-building caddisfly (Hydropsyche-Aoteapsyche) and midges (Maoridiamesa and orthoclads)]. Fourteen of the historically characteristic taxa were dominant in the spring 2015 community. These comprised one ‘highly sensitive taxon, five ‘moderately sensitive’ and eight ‘tolerant’ taxa; whereas five ‘moderately sensitive’ and three ‘tolerant’ taxa comprised the dominant taxa of the summer community. Eight of these 14 taxa were dominant in both spring and summer communities (Table 13) and combined with the similarity in ratios of ‘moderately sensitive’ to ‘tolerant’ taxa were reflected in the seasonal SQMCIs scores (Table 131 and Table 132) which decreased by only 0.2 units in summer.
Predicted stream ‘health’ 3.2.2.2.3The Timaru Stream at SH45 is 10.9 km downstream of the National Park boundary at an altitude of 100 m asl. Relationships for ringplain streams developed between MCI and site altitude and distance from the National Park boundary (Stark and Fowles, 2009), predict MCI values of 95 (altitude) and 105 (distance) for this site. The historical site median (102) is seven units higher than the altitude prediction and three units lower than the distance predictive value. The spring survey score (114 units) was significantly higher than the altitude predictive value (19 units) and distance predictive value (12 units) while the summer score (105 units) was not significantly different to either the altitude (10 units) or distance (no difference) predictive values.

31
N = 42 Kendall tau = +0.406 p level < 0.001 FDR p < 0.001
The median value for ringplain streams of similar altitude arising within the National Park (TRC, 2015c) was 102 units. The historical site median and summer score were not significantly different to this value but spring score was significantly higher. The REC predicted MCI value (Leathwick, et al. 2009) was 117 units. The historical site median and summer score were significantly lower than this value but spring score was not significantly different.
Temporal trends in 1995 to 2016 data 3.2.2.2.4A LOWESS trend plot with a moving average (tension 0.4) trendline was produced (Figure 12). A non-parametric statistical trend analysis of the MCI data using the Mann-Kendall test was then performed on 21 years of SEM results (1995-2016) from the site in the Timaru Stream at SH45. The MCI has been chosen as the preferable indicator of ‘stream/river health’ for SEM trend reporting purposes.
Figure 12 LOWESS trend plot of MCI data at the SH45 site
MCI scores have shown a strong improvement over time (statistically significant), particularly since 2001, with most of the more recent scores (since 2004) well above scores recorded toward the start of the monitoring period. The trendline had a range over 18 units, an ecologically important range. No obvious explanations have been apparent for the trend but a possible reason may be related to improved management of dairy shed wastes disposal in the catchment above this SH45 site. The trendline indicated an improvement in generic stream ‘health’ (Table 2) from ‘fair’ to ‘good’, but there has been a recent return to the ‘fair’ category as the trend has been decreasing at the site since 2011, possibly due to dairy farm intensification.
Temporal trends in 2006 to 2016 data 3.2.2.2.5A LOWESS trend plot with a moving average (tension 0.4) trendline was produced (Figure 13). A non-parametric statistical trend analysis of the MCI data using the Mann-Kendall test was then performed on the most recent ten years of SEM results (2006-2016) from the site in the Timaru Stream at SH45.
TMR000375
1994 1996 1998 2000 2002 2004 2006 2008 2010 2012 2014 2016 2018Year
85
90
95
100
105
110
115
120
125
MC
I va
lue

32
N = 20 Kendall tau = -0.135 p level = 0.406 FDR p = 0.742
Figure 13 LOWESS trend plot of ten years of data at the SH45 site
MCI scores have not shown any statistically significant improvement over the last ten years and overall there has been a decreasing trend. This contrasts with the full dataset which shows a significant, positive trend. An increasing trend from 2007-2010 has been offset by declines from 2010-2014. The LOWESS-smoothed scores have ranged over 12 units. Smoothed MCI scores have indicated ‘good’ generic stream ‘health’ (Table 2).
Discussion 3.2.2.3Seasonal MCI values typically remained very similar between spring and summer at the National Park boundary site where historical median scores have been within two units (Appendix II), over the 21 year period, whereas a greater summer decrease of nine units was found at the lower mid reach site where a difference of four units in seasonal historical median scores has been found (Appendix II). Seasonal communities at the upper site shared 22 common taxa (71% of the 31 taxa found at this site in 2015-2016), a moderately high percentage typical of communities at an upper reach site. This compared with 21 shared common taxa (68% of the 34 taxa found in 2015-2016) at the lower mid reaches site (SH45), a similar seasonal change in community structure at the further downstream site. The two sites shared 15 common taxa (37% of the 41 taxa at upper and mid reach sites) in spring and 13 common taxa (30% of 44 taxa) in summer, indicative of the dissimilarity in spatial community structures in spring and typically more so in summer. MCI score typically fell in a downstream direction in both spring (by 32 units) and in summer (by 39 units), over a stream distance of 10.9 km downstream from the National Park boundary.
TMR000375
2006 2008 2010 2012 2014 2016 2018Year
80
85
90
95
100
105
110
115
120
125M
CI
valu
e
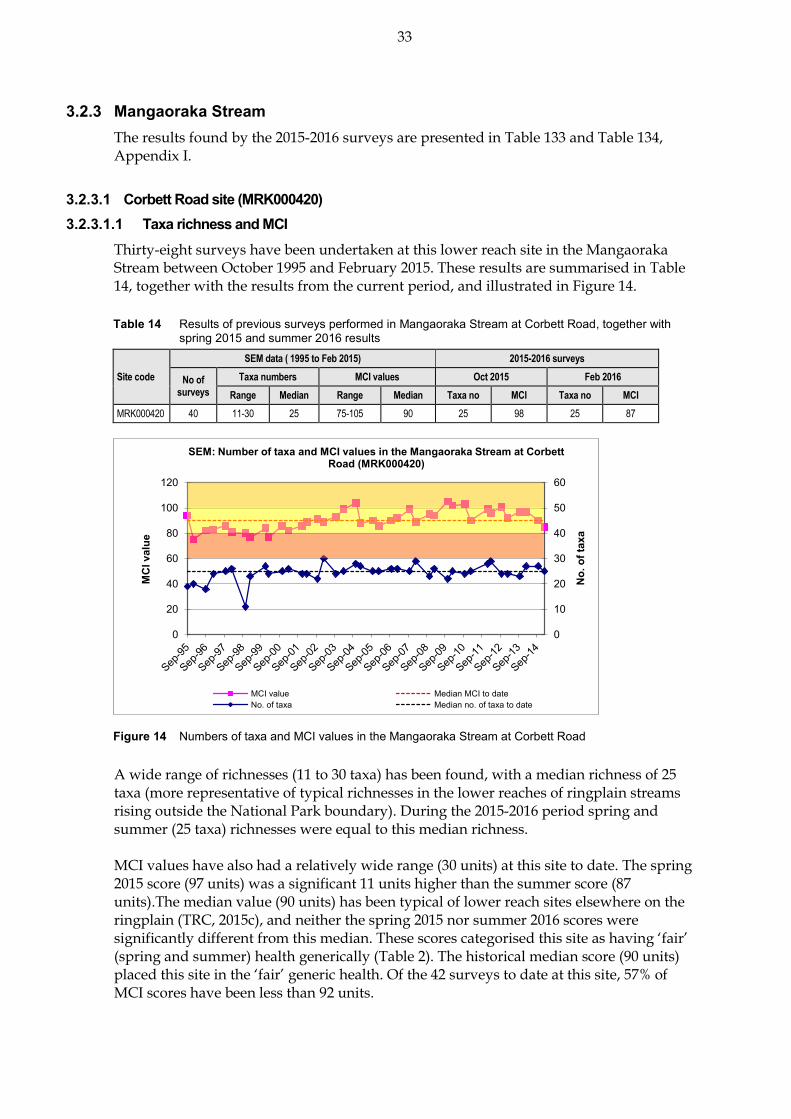
33
0
10
20
30
40
50
60
0
20
40
60
80
100
120
No. o
f tax
a
MCI
val
ue
SEM: Number of taxa and MCI values in the Mangaoraka Stream at Corbett Road (MRK000420)
MCI value Median MCI to dateNo. of taxa Median no. of taxa to date
Mangaoraka Stream 3.2.3The results found by the 2015-2016 surveys are presented in Table 133 and Table 134, Appendix I.
Corbett Road site (MRK000420) 3.2.3.1 Taxa richness and MCI 3.2.3.1.1
Thirty-eight surveys have been undertaken at this lower reach site in the Mangaoraka Stream between October 1995 and February 2015. These results are summarised in Table 14, together with the results from the current period, and illustrated in Figure 14.
Table 14 Results of previous surveys performed in Mangaoraka Stream at Corbett Road, together with spring 2015 and summer 2016 results
Site code
SEM data ( 1995 to Feb 2015) 2015-2016 surveys
No of surveys
Taxa numbers MCI values Oct 2015 Feb 2016
Range Median Range Median Taxa no MCI Taxa no MCI
MRK000420 40 11-30 25 75-105 90 25 98 25 87
Figure 14 Numbers of taxa and MCI values in the Mangaoraka Stream at Corbett Road
A wide range of richnesses (11 to 30 taxa) has been found, with a median richness of 25 taxa (more representative of typical richnesses in the lower reaches of ringplain streams rising outside the National Park boundary). During the 2015-2016 period spring and summer (25 taxa) richnesses were equal to this median richness. MCI values have also had a relatively wide range (30 units) at this site to date. The spring 2015 score (97 units) was a significant 11 units higher than the summer score (87 units).The median value (90 units) has been typical of lower reach sites elsewhere on the ringplain (TRC, 2015c), and neither the spring 2015 nor summer 2016 scores were significantly different from this median. These scores categorised this site as having ‘fair’ (spring and summer) health generically (Table 2). The historical median score (90 units) placed this site in the ‘fair’ generic health. Of the 42 surveys to date at this site, 57% of MCI scores have been less than 92 units.

34
Community composition 3.2.3.1.2Characteristic macroinvertebrate taxa in the communities at this site prior to the 2015-2016 period are listed in Table 15.
Table 15 Characteristic taxa (abundant, very abundant, extremely abundant) recorded in the Mangaoraka Stream at Corbett Road, between 1995 and February 2015 [40 surveys], and by the spring 2015 and summer 2016 surveys
Taxa List MCI
score A VA XA Total %
Survey
Spring 2015 Summer 2016
PLATYHELMINTHES (FLATWORMS) Cura 3 1 1 3
NEMERTEA Nemertea 3 6 6 15 A
ANNELIDA (WORMS) Oligochaeta 1 24 7 31 78 A A
MOLLUSCA Latia 5 2 2 5
Physa 3 1 1 3
Potamopyrgus 4 17 12 5 34 85 A VA
CRUSTACEA Ostracoda 1 1 1 3
EPHEMEROPTERA (MAYFLIES) Austroclima 7 13 9 1 23 58 A
Coloburiscus 7 4 4 10
Deleatidium 8 5 2 7 18 A
Zephlebia group 7 3 3 8
PLECOPTERA (STONEFLIES) Zelandobius 5 13 2 15 38 VA
COLEOPTERA (BEETLES) Elmidae 6 6 11 11 28 70 A VA
MEGALOPTERA (DOBSONFLIES) Archichauliodes 7 20 20 50 A
TRICHOPTERA (CADDISFLIES) Hydropsyche (Aoteapsyche) 4 13 15 7 35 88 A
Costachorema 7 3 3 8
Hydrobiosis 5 27 2 29 73 A
Neurochorema 6 3 3 8
Oxyethira 2 5 1 6 15
Pycnocentria 7 2 2 5
Pycnocentrodes 5 16 10 2 28 70 XA
DIPTERA (TRUE FLIES) Aphrophila 5 15 6 21 53
Maoridiamesa 3 7 3 10 25 A
Orthocladiinae 2 24 7 31 78 A
Tanytarsini 3 9 2 11 28
Empididae 3 6 6 15
Muscidae 3 2 2 5
Austrosimulium 3 12 12 30 A
Prior to the current 2015-2016 period, 28 taxa had characterised the community at this site on occasions. These have comprised only one ‘highly sensitive’, 13 ‘moderately sensitive’, and 14 ‘tolerant’ taxa i.e. a high proportion of ‘tolerant’ taxa as would be expected in the lower reaches of a ringplain stream. Predominant taxa have included five ‘moderately sensitive’ taxa [mayfly (Austroclima), elmid beetles, free-living caddisfly (Hydrobiosis), stony-cased caddisfly (Pycnocentrodes), and cranefly (Aphrophila)], and four ‘tolerant’ taxa [oligochaete worms, snail (Potamopyrgus), net-building caddisfly (Hydropsyche-Aoteapsyche), and orthoclad midges]. Nine of the historically characteristic taxa were dominant in the spring, 2015 community comprising six of the predominant taxa (above) together with another ‘highly sensitive

35
N = 42 Kendall tau = +0.445 p level < 0.001 FDR p < 0.001
taxon, a ‘moderately sensitive’ taxon and a ‘tolerant’ taxon. The summer, 2016 community was characterised by three of the taxa dominant in spring, together with an additional two ‘moderately sensitive’ and three ‘tolerant’ taxa. Of these eight taxa, five were predominant taxa. There were two fewer ‘sensitive’ taxa and one more ‘tolerant’ taxon in the summer compared to spring. The decrease in ‘sensitive’ summer dominant taxa and increase in dominant ‘tolerant’ taxa did not result in an altered SQMCIs scores between these sampling occasions (Table 133 and Table 134). The taxa which were recorded as very abundant or extremely abundant during spring and/ or summer had characterised this site’s communities on 38% to 85% of past surveys.
Predicted stream ‘health’ 3.2.3.1.3The Mangaoraka Stream rises below the National Park boundary and the site at Corbett Road is in the lower reaches at an altitude of 60 m asl. The median value for ringplain streams of similar altitude arising within the National Park (TRC, 2015c) was 79 units. The historical site median (11 units) and spring (19 units) scores were significantly higher but the summer score not significantly different to this value. The REC predicted MCI value (Leathwick, et al. 2009) was 92 units. The historical site median, spring and summer score were not significantly different to this value.
Temporal trends in 1995 to 2016 data 3.2.3.1.4A LOWESS trend plot with a moving average (tension 0.4) trendline was produced (Figure 15). A non-parametric statistical trend analysis of the MCI data using the Mann-Kendall test was then performed on 21 years of SEM results (1995-2016) from the site in the Mangaoraka Stream at Corbett Road. The MCI has been chosen as the preferable indicator of ‘stream/river health’ for SEM trend reporting purposes.
Figure 15 LOWESS trend plot of MCI data at the Corbett Road site, Mangaoraka Stream
This site’s MCI scores have shown a highly significant improvement (p< 0.01 after FDR). Scores improved from 1995 to 2011 but have since decreased from 2011 to 2016. However, the latest scores remain above most scores recorded prior to 2000. The trendline has varied over an ecologically important range of 16 units during the period. SEM physicochemical monitoring at this site had illustrated significant improvements in aspects of organic loadings at this site in the lower reaches of the stream prior to mid 2008. This was coincident with more rigorous surveillance monitoring of nearby

36
N = 20 Kendall tau = - 0.096 p level = 0.553 FDR p = 0.742
quarrying and waste disposal activities and good dairy shed wastewater disposal compliance performance during that period although more recently, aspects of poorer overall water quality (i.e. increased bacteriological numbers and increasing trends in certain nutrient species) have been recorded (TRC, 2014) despite the apparent improvement in biological communities. The trendline was indicative of ‘fair’ generic stream health (Table 2).
Temporal trends in 2006 to 2016 data 3.2.3.1.5A LOWESS trend plot with a moving average (tension 0.4) trendline was produced (Figure 16). A non-parametric statistical trend analysis of the MCI data using the Mann-Kendall test was then performed on ten years of SEM results (2006-2016) from the site in the Mangaoraka Stream at Corbett Road.
Figure 16 LOWESS trend plot of ten years of MCI data at the Corbett Road site
This site’s MCI scores have shown a non-significant decline in MCI scores which contrasts markedly with the highly significant improvement found using the full dataset. Scores improved from 2006 to 2011 but have since decreased from 2011 to 2016. SEM physicochemical monitoring at this site had illustrated recently aspects of poorer overall water quality (i.e. increased bacteriological numbers and increasing trends in certain nutrient species) have been recorded (TRC, 2014) which probably the main reason for the decline in macroinvertebrate health. The trendline was indicative of ‘fair’ generic stream health (Table 2).
Discussion 3.2.3.2Seasonal MCI values typically decreased between spring and summer at this lower reach site (by three units) but there was a larger than normal, significant decrease of 11 MCI units recorded during the current monitoring period. However, this was largely due to the higher than normal spring score of 98 units as opposed to a large decrease in the summer score (Appendix II). The percentage composition of ‘tolerant’ taxa increased by 12% in the summer community but the seasonal communities still shared a moderately high number of common taxa (16 taxa; 47% of the 34 taxa found at this site in 2015-2016).
MRK000420
2006 2008 2010 2012 2014 2016 2018Year
80
85
90
95
100
105
110
MC
I va
lue

37
Waiongana Stream 3.2.4The results found by the 2015-2016 surveys are presented in Table 135 and Table 136, Appendix I.
State Highway 3a site (WGA000260) 3.2.4.1 Taxa richness and MCI 3.2.4.1.1
Forty-one surveys have been undertaken at this mid reach site in the Waiongana Stream between October 1995 and February 2015. These results are summarised in Table 16, together with the results from the current period, and illustrated in Figure 17.
Table 16 Results of previous surveys performed in the Waiongana Stream at SH3a together with spring 2015 and summer 2016 results
Site code
SEM data ( 1995 to Feb 2015) 2015-2016 surveys
No of surveys
Taxa numbers MCI values Oct 2015 Feb 2016
Range Median Range Median Taxa no MCI Taxa no MCI
WGA000260 41 12-30 24 82-112 96 24 104 9 96
Figure 17 Numbers of taxa and MCI values in the Waiongana Stream at State Highway 3A
A wide range of richnesses (12 to 30 taxa) has been found; with a median richness of 24 taxa (more representative of typical richnesses in the mid-reaches of ringplain streams and rivers. During the 2015-2016 period, the spring (24 taxa) richness was equal to the historical median but the summer (nine taxa) richness was a significant 15 taxa below both the historical median and spring survey and was three taxa lower than the previous lowest recorded taxa richness for the site. MCI values have also had a relatively wide range (30 units) at this site, relatively typical of a site in the mid reaches of a ringplain stream. The median value (96 units) also has been typical of mid-reach sites elsewhere on the ringplain (TRC, 2015c). The spring 2015 (104 units) and summer 2016 (96 units) scores were not significantly differenct from each other and eight units above (spring) and equal with (summer) the historical median. These scores categorised this site as having ‘good’ (spring) and ‘fair’ (summer) health generically (Table 2). The historical median score (96 units) placed this site in the ‘fair’
38
category. Of the 41 surveys to date at this site, 65% of MCI scores have been less than 99 units while only 26% have been greater than 100 units.
Community composition 3.2.4.1.2Characteristic macroinvertebrate taxa in the communities at this site prior to the 2015-2016 period are listed in Table 17.
Table 17 Characteristic taxa [abundant (A), very abundant (VA), extremely abundant (XA)] recorded in the Waiongana Stream at SH3a between 1995 and February 2015 [41 surveys], and by the spring 2015 and summer 2016 surveys
Taxa List MCI score
A VA XA Total %
Surveys
Spring 2015
Summer 2016
NEMERTEA Nemertea 3 2 2 5
ANNELIDA (WORMS) Oligochaeta 1 20 1 21 51
MOLLUSCA Potamopyrgus 4 14 4 18 44 A
CRUSTACEA Paracalliope 5 1 1 2
EPHEMEROPTERA (MAYFLIES) Austroclima 7 4 4 10
Coloburiscus 7 3 1 4 10 A
Deleatidium 8 8 10 3 21 51 VA
PLECOPTERA (STONEFLIES) Zelandobius 5 0 0 A
COLEOPTERA (BEETLES) Elmidae 6 15 14 3 32 78 A A
MEGALOPTERA (DOBSONFLIES) Archichauliodes 7 13 13 32
TRICHOPTERA (CADDISFLIES) Hydropsyche (Aoteapsyche) 4 17 10 27 66
Costachorema 7 12 1 13 32
Hydrobiosis 5 18 2 20 49
Neurochorema 6 3 3 7
Beraeoptera 8 0 0 A
Oxyethira 2 8 1 9 22
Pycnocentrodes 5 11 2 13 32 A
DIPTERA (TRUE FLIES) Aphrophila 5 19 15 1 35 85 A
Maoridiamesa 3 15 11 2 28 68 VA
Orthocladiinae 2 15 11 10 36 88 VA
Tanytarsini 3 12 3 1 16 39
Empididae 3 7 7 17
Muscidae 3 6 6 15
Austrosimulium 3 3 3 7
Prior to the current 2015-2016 period, 22 taxa have characterised the community at this site on occasions. These have comprised one ‘highly sensitive’, ten ‘moderately sensitive’, and eleven ‘tolerant’ taxa i.e. a relatively even balance of ‘sensitive’ and ‘tolerant’ taxa as would be expected in the mid-reaches of a ringplain stream. Predominant taxa have included one ‘highly sensitive’ taxon [mayfly (Deleatidium)], two ‘moderately sensitive’ taxa [elmid beetles and cranefly (Aphrophila)], and four ‘tolerant’ taxa [oligochaete worms, net-building caddisfly (Hydropsyche-Aoteapsyche), and midges (Maoridiamesa and orthoclads)]. Five of these seven predominant taxa were dominant in the spring 2015 community together with another two historically characteristic (‘moderately sensitive’) taxa and two new characteristic taxa, the ‘highly sensitive’ caddisfly Beraeoptera and ‘moderately sensitive’ stonefly Zelandobius (Table 17). There were significant, large decreases in the numerical abundances of taxa during the summer survey. Only one taxon from the nine taxa characteristic of the spring survey was abundant in the summer

39
N = 43 Kendall tau = +0.231 p level = 0.029 FDR p = 0.049
survey and only two taxa were abundant in total, ‘tolerant’ snails (Potamopyrgus) and ‘moderately sensitive’ elmid beetles. Though taxa abundances were vastly different there was only a small, insignificant, difference of 0.2 units in SQMCIs scores between spring and summer (Table 135 and Table 136). This was largely due to characteristic taxa having similar ratios between ‘sensitive’ and ‘tolerant’ taxa in spring and summer. The three taxa recorded as very abundant during spring had characterised this site’s communities on 51% to 88% of past survey occasions while the only two taxa that characterised this site’s communities during summer had characterised this site’s communities on 44% and 78% of past survey occasions.
Predicted stream ‘health’ 3.2.4.1.3The Waiongana Stream site at SH3a is 16.1 km downstream of the National Park boundary at an altitude of 140 m asl. Relationships for ringplain streams developed between MCI and site altitude and distance from the National Park boundary (Stark and Fowles, 2009) predict MCI values of 99 (altitude) and 100 (distance) for this site. The historical site median (96 units) is three units lower than the altitude prediction and four units below the distance predictive value, while the spring 2015 survey score (104 units) was within four to five units higher than both predictive values while the summer 2016 score (96 units) was three to four units lower than both predictive values. The median value for ringplain streams of similar altitude arising within the National Park (TRC, 2015c) was 102 units. The historical site median and spring and summer scores was not significantly different to this value. The REC predicted MCI value (Leathwick, et al. 2009) was 99 units. The historical site median and spring and summer scores were not significantly different to this value.
Temporal trends in 1995 to 2016 data 3.2.4.1.4A LOWESS trend plot with a moving average (tension 0.4) trendline was produced (Figure 18). A non-parametric statistical trend analysis of the MCI data using the Mann-Kendall test was performed on 21 years of SEM results (1995-2016) from the site in the Waiongana Stream at SH3a. The MCI has been chosen as the preferable indicator of ‘stream/river health’ for SEM trend reporting purposes.
Figure 18 LOWESS trend plot of MCI data at the SH3a site
WGA000260
1994 1996 1998 2000 2002 2004 2006 2008 2010 2012 2014 2016 2018Year
80
85
90
95
100
105
110
115
MC
I va
lue

40
N = 20 Kendall tau = +0.316 p level = 0.051 FDR p = 0.200
There has been a significant positive trend in the MCI scores (FDR at p <0.05) with a steady improvement in scores between 2001 and 2004 followed by a decline in scores until 2008, and another steady increase more recently. This site’s trendline had a range of nine units indicative of marginal ecologically important variability over the period. Overall, the trendline was indicative of ‘fair’ generic stream health (Table 2) for the majority of the period, improving toward ‘good’ ‘health’ briefly in 2004 and again between 2011 and 2012.
Temporal trends in 2006 to 2016 data 3.2.4.1.5A LOWESS trend plot with a moving average (tension 0.4) trendline was produced (Figure 19). A non-parametric statistical trend analysis of the MCI data using the Mann-Kendall test was performed on ten years of SEM results (2006-2016) from the site in the Waiongana Stream at SH3a.
Figure 19 LOWESS trend plot of ten years of MCI data at the SH3a site, Waiongana Stream
There has been a non-significant positive trend in the MCI scores (FDR at p >0.05) with a steady improvement in scores between 2007 and 2004 followed by a slight decline in scores from 2013. The lack of a positive significant result in contrast with the full dataset was probably due to the large gains in macroinvertebrate health that occurred during the late 1990s not being incorporated into the analysis. Overall, smoothed scores remained indicative of ‘fair’ generic stream health (Table 2) for the majority of the period, improving toward ‘good’ ‘health’ briefly between 2011 and 2013.
Devon Road site (WGA000450) 3.2.4.2 Taxa richness and MCI 3.2.4.2.1
Forty surveys have been undertaken at this lower reach site at SH45 in the Waiongana Stream between October 1995 and February 2015. These results are summarised in Table
18, together with the results from the current period, and illustrated in Figure 20.
WGA000260
2006 2008 2010 2012 2014 2016 2018Year
80
85
90
95
100
105
110
115
MC
I va
lue

41
Table 18 Results of previous surveys performed in the Waiongana Stream at Devon Road together with spring 2015 and summer 2016 results
Site code
SEM data ( 1995 to Feb 2015) 2015-2016 surveys
No of surveys
Taxa numbers MCI values Oct 2015 Feb 2016
Range Median Range Median Taxa no MCI Taxa no MCI
WGA000450 40 12-29 22 72-102 90 21 96 22 91
Figure 20 Numbers of taxa and MCI values in the Waiongana Stream at Devon Road
A wide range of richness (12 to 29 taxa) has been found with a median richness of 22 taxa, more representative of typical richnesses in ringplain streams and rivers in the lower reaches. During the 2015-2016 period, spring (21 taxa) and summer (22 taxa) richnesses were very similar to one another (one taxon difference) and one to two taxa above the median taxa number. MCI scores have had a relatively wide range (30 units) at this site typical of sites in the lower reaches of ringplain streams. The median value (90 units) also has been typical of lower reach sites elsewhere on the ringplain (TRC, 2015c), with the spring 2015 (96 units) and summer 2015 (91 units) scores within the range typical for such a site and within two units of the historical median score. These scores categorized this site as having ‘fair’ (spring and summer) health generically (Table 2). The historical median score (90 units) placed this site in the ‘fair’ category for generic health. Of the 42 surveys to date at this site, 38% of MCI scores have been less than 86 units while only 26% have been greater than 93 units.

42
Community composition 3.2.4.2.2Characteristic macroinvertebrate taxa in the communities at this site prior to the 2015-2016 period are listed in Table 19.
Table 19 Characteristic taxa [abundant (A), very abundant (VA), extremely abundant (XA)] recorded in the Waiongana Stream at Devon Road between 1995 and February 2015 [40 surveys], by the spring 2015 and summer 2016 surveys
Taxa List MCI score
A VA XA Total %
Survey
Spring 2015
Summer 2016
NEMERTEA Nemertea 3 3 3 8
ANNELIDA (WORMS) Oligochaeta 1 20 10 1 31 78 VA VA
MOLLUSCA Ferrissia 3 1 1 3
Latia 5 2 2 5
Potamopyrgus 4 10 7 9 26 65 VA
CRUSTACEA Paracalliope 5 2 2 5
Paratya 3 1 1 3
EPHEMEROPTERA (MAYFLIES) Austroclima 7 4 4 10
Deleatidium 8 5 3 8 20 A
PLECOPTERA (STONEFLIES) Zelandobius 5 1 1 3 A
COLEOPTERA (BEETLES) Elmidae 6 8 13 21 53 A VA
MEGALOPTERA (DOBSONFLIES) Archichauliodes 7 8 8 20 A
TRICHOPTERA (CADDISFLIES) Hydropsyche (Aoteapsyche) 4 9 14 4 27 68 XA
Costachorema 7 2 2 5
Hydrobiosis 5 14 2 16 40 A
Neurochorema 6 3 3 8 A
Oxyethira 2 7 1 8 20
Pycnocentrodes 5 9 7 2 18 45 A VA
DIPTERA (TRUE FLIES) Aphrophila 5 16 2 18 45 A
Maoridiamesa 3 12 5 17 43 A
Orthocladiinae 2 22 10 2 34 85 VA A
Tanytarsini 3 10 4 14 35 VA
Empididae 3 1 1 3
Muscidae 3 3 3 8 A
Austrosimulium 3 6 6 15
Prior to the current 2015-2016 period, 25 taxa have characterised the community at this site on occasions. These have comprised one ‘highly sensitive’, 11 ‘moderately sensitive’, and 13 ‘tolerant’ taxa i.e. a majority of ‘tolerant’ taxa as would be expected in the lower reaches of a ringplain stream. Predominant taxa have included no ‘highly sensitive’ taxa; one ‘moderately sensitive’ taxon [elmid beetles]; and four ‘tolerant’ taxa [oligochaete worms, snail (Potamopyrgus), net-building caddisfly (Hydropsyche-Aoteapsyche), and orthoclad midges]. Seven of the historically characteristic taxa were dominant in the spring 2015 community. These seven taxa comprised one ‘highly sensitive’, three ‘moderately sensitive’ and three ‘tolerant’ taxa; whereas six ‘moderately sensitive’ and six ‘tolerant’ taxa comprised the dominant taxa in the summer community. Four of the 15 taxa were dominant in both spring and summer communities (Table 19). Increases in numerical abundances within six ‘moderately sensitive’ taxa in particular in summer were reflected in the significantly higher (by 1.0 unit) SQMCIs score at that time (Table 135 and Table 136). All taxa recorded as very or extremely abundant during spring and /or summer had characterised this site’s communities on 35% to 85% of past surveys.
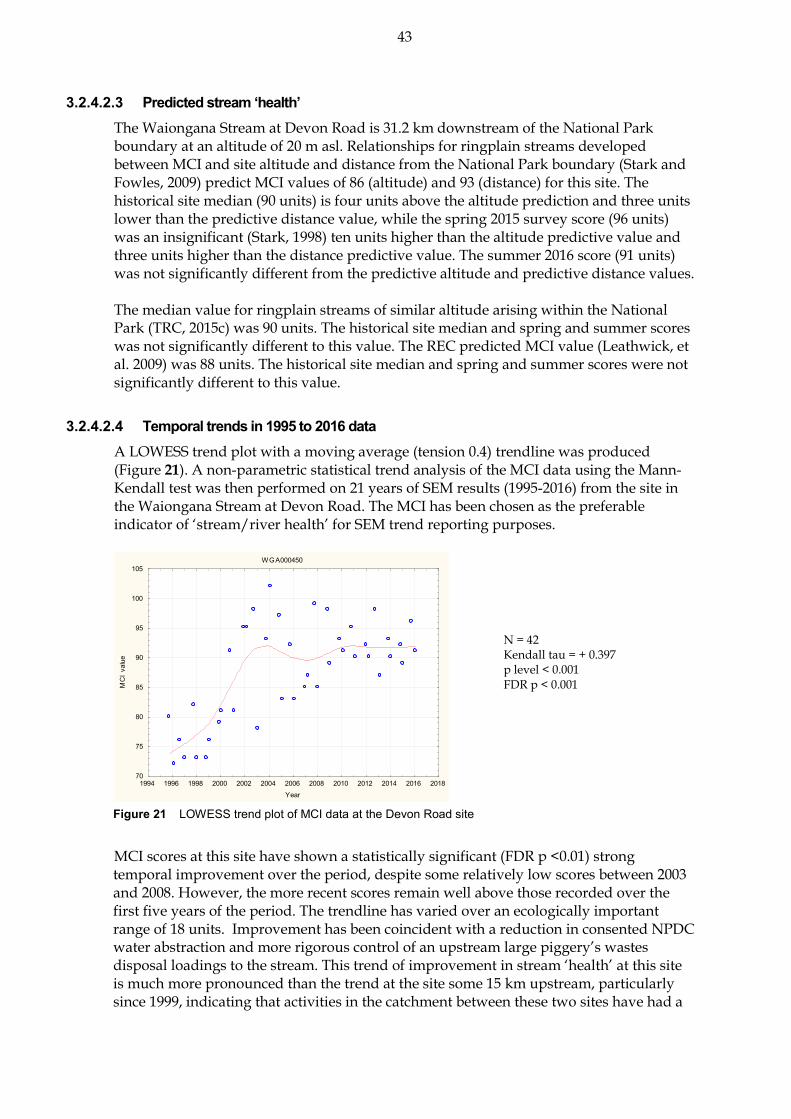
43
N = 42 Kendall tau = + 0.397 p level < 0.001 FDR p < 0.001
Predicted stream ‘health’ 3.2.4.2.3The Waiongana Stream at Devon Road is 31.2 km downstream of the National Park boundary at an altitude of 20 m asl. Relationships for ringplain streams developed between MCI and site altitude and distance from the National Park boundary (Stark and Fowles, 2009) predict MCI values of 86 (altitude) and 93 (distance) for this site. The historical site median (90 units) is four units above the altitude prediction and three units lower than the predictive distance value, while the spring 2015 survey score (96 units) was an insignificant (Stark, 1998) ten units higher than the altitude predictive value and three units higher than the distance predictive value. The summer 2016 score (91 units) was not significantly different from the predictive altitude and predictive distance values. The median value for ringplain streams of similar altitude arising within the National Park (TRC, 2015c) was 90 units. The historical site median and spring and summer scores was not significantly different to this value. The REC predicted MCI value (Leathwick, et al. 2009) was 88 units. The historical site median and spring and summer scores were not significantly different to this value.
Temporal trends in 1995 to 2016 data 3.2.4.2.4A LOWESS trend plot with a moving average (tension 0.4) trendline was produced (Figure 21). A non-parametric statistical trend analysis of the MCI data using the Mann-Kendall test was then performed on 21 years of SEM results (1995-2016) from the site in the Waiongana Stream at Devon Road. The MCI has been chosen as the preferable indicator of ‘stream/river health’ for SEM trend reporting purposes.
Figure 21 LOWESS trend plot of MCI data at the Devon Road site
MCI scores at this site have shown a statistically significant (FDR p <0.01) strong temporal improvement over the period, despite some relatively low scores between 2003 and 2008. However, the more recent scores remain well above those recorded over the first five years of the period. The trendline has varied over an ecologically important range of 18 units. Improvement has been coincident with a reduction in consented NPDC water abstraction and more rigorous control of an upstream large piggery’s wastes disposal loadings to the stream. This trend of improvement in stream ‘health’ at this site is much more pronounced than the trend at the site some 15 km upstream, particularly since 1999, indicating that activities in the catchment between these two sites have had a
WGA000450
1994 1996 1998 2000 2002 2004 2006 2008 2010 2012 2014 2016 2018Year
70
75
80
85
90
95
100
105
MC
I va
lue

44
N = 20 Kendall tau = + 0.108 p level = 0.505 FDR p = 0.742
significant influence.
Overall the trendline has indicated an improvement in generic stream ‘health’ (Table 2) from consistently ‘poor’ prior to 2000 to ‘fair’ where it has remained over the last fifteen years.
Temporal trends in 2007 to 2016 data 3.2.4.2.5A LOWESS trend plot with a moving average (tension 0.4) trendline was produced (Figure 22). A non-parametric statistical trend analysis of the MCI data using the Mann-Kendall test was then performed on the most recent ten years of SEM results (2007-2016) from the site in the Waiongana Stream at Devon Road.
Figure 22 LOWESS trend plot of ten years of MCI data at the Devon Road site
MCI scores at this site have shown a non-statistically significant (FDR p >0.05) minor improvement though the trendline has remained relatively stable over the last eight years.
This contrasts with the highly significant improvements found using the full dataset suggesting improvements have plateaued at the site. Overall the trendline has indicated ‘fair’ generic stream ‘health’ (Table 2).
Discussion 3.2.4.3Typical taxa richnesses were recorded during the spring survey at both the mid-reach (SH3a) and lower reach (Devon Road) sites, but the lowest ever recorded taxa richness for the mid-reach site was recorded during the summer survey although the lower reach site again had a typical richness recorded. No obvious habitat disturbance or change in water quality was noted at the time of the summer survey and the low taxa richness was probably related to some sort of disturbance or impact from upstream of the site. The catchment above the site contains farmland and part of the township of Inglewood and a contaminant could come from either an agricultural or industrial source. Coincident with the decrease in taxa richness and abundances, MCI values decreased (by eight units) between spring and summer at the mid- reach site where the historical median summer decrease has only been two units. A more typical decrease (of five units)
WGA000450
2006 2008 2010 2012 2014 2016 2018Year
75
80
85
90
95
100
105
MC
I va
lue

45
was found at the lower reach site where a larger historical median summer decrease of six units has been recorded (Appendix II). Seasonal communities at the mid-reach site (SH3a) shared only one common taxa (10% of the 10 taxa found at this site in 2015-2016) compared with four shared common taxa (27% of the 30 taxa found in 2015-2016) at the lower reach site, an atypically high level of dissimilarity for the summer community structure at both sites. The two sites shared 19 common taxa (73% of the 26 taxa) in spring, indicative of similar community structures, and seven common taxa (29% of 24 taxa) in summer which was largely due to the low taxa richness at the middle-reach site during summer. MCI score typically decreased in a downstream direction in spring (by eight units) and in summer (by five units), over a stream distance of 15.1 km downstream from the National Park boundary.
Waiwhakaiho River 3.2.5An additional site was established in the upper reaches of the Waiwhakaiho River for the 2002-2003 SEM programme, to complement the three sites in the central to lower reaches of this large ringplain river, in recognition of its importance as a water resource and particularly its proximity to New Plymouth city. The site was established a short distance inside the National Park boundary at an elevation of 460 m asl. The results from the 2015-2016 surveys are presented in Table 137 and Table 138, Appendix I.
National Park site (WKH000100) 3.2.5.1 Taxa richness and MCI 3.2.5.1.1
Twenty-six surveys have previously been undertaken at this upper reach site just inside the National Park boundary in the Waiwhakaiho River between November 2002 and February 2015. These results are summarised in Table 20, together with the results from the current period, and illustrated in Figure 23.
Table 20 Results of previous surveys performed in the Waiwhakaiho River at National Park together with spring 2015 and summer 2016 results
Site code
SEM data ( 1995 to Feb 2015) 2015-2016 surveys
No of surveys
Taxa numbers MCI values Dec 2015 Mar 2016
Range Median Range Median Taxa no MCI Taxa no MCI
WKH000100 26 4-29 20 115-147 129 23 130 14 131
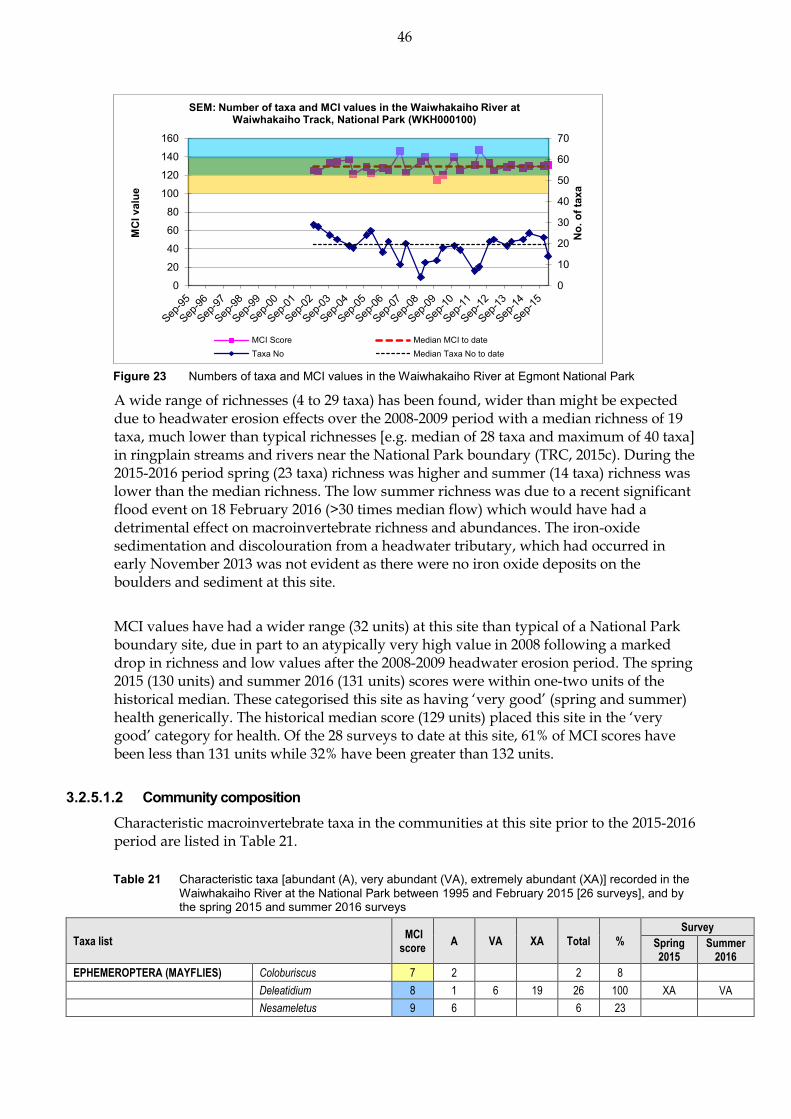
46
Figure 23 Numbers of taxa and MCI values in the Waiwhakaiho River at Egmont National Park
A wide range of richnesses (4 to 29 taxa) has been found, wider than might be expected due to headwater erosion effects over the 2008-2009 period with a median richness of 19 taxa, much lower than typical richnesses [e.g. median of 28 taxa and maximum of 40 taxa] in ringplain streams and rivers near the National Park boundary (TRC, 2015c). During the 2015-2016 period spring (23 taxa) richness was higher and summer (14 taxa) richness was lower than the median richness. The low summer richness was due to a recent significant flood event on 18 February 2016 (>30 times median flow) which would have had a detrimental effect on macroinvertebrate richness and abundances. The iron-oxide sedimentation and discolouration from a headwater tributary, which had occurred in early November 2013 was not evident as there were no iron oxide deposits on the boulders and sediment at this site.
MCI values have had a wider range (32 units) at this site than typical of a National Park boundary site, due in part to an atypically very high value in 2008 following a marked drop in richness and low values after the 2008-2009 headwater erosion period. The spring 2015 (130 units) and summer 2016 (131 units) scores were within one-two units of the historical median. These categorised this site as having ‘very good’ (spring and summer) health generically. The historical median score (129 units) placed this site in the ‘very good’ category for health. Of the 28 surveys to date at this site, 61% of MCI scores have been less than 131 units while 32% have been greater than 132 units.
Community composition 3.2.5.1.2Characteristic macroinvertebrate taxa in the communities at this site prior to the 2015-2016 period are listed in Table 21.
Table 21 Characteristic taxa [abundant (A), very abundant (VA), extremely abundant (XA)] recorded in the Waiwhakaiho River at the National Park between 1995 and February 2015 [26 surveys], and by the spring 2015 and summer 2016 surveys
Taxa list MCI score
A VA XA Total %
Survey
Spring 2015
Summer 2016
EPHEMEROPTERA (MAYFLIES) Coloburiscus 7 2 2 8
Deleatidium 8 1 6 19 26 100 XA VA
Nesameletus 9 6 6 23
0
10
20
30
40
50
60
70
0
20
40
60
80
100
120
140
160
No.
of t
axa
MC
I val
ue
SEM: Number of taxa and MCI values in the Waiwhakaiho River at Waiwhakaiho Track, National Park (WKH000100)
MCI Score Median MCI to dateTaxa No Median Taxa No to date

47
PLECOPTERA (STONEFLIES) Megaleptoperla 9 9 9 35 A
Zelandoperla 8 7 10 4 21 81 VA A
COLEOPTERA (BEETLES) Elmidae 6 7 13 4 24 92 VA A
TRICHOPTERA (CADDISFLIES) Hydropsyche (Aoteapsyche) 4 1 1 4
Costachorema 7 2 2 8
Hydrobiosella 9 1 1 4
Beraeoptera 8 5 3 8 31 A
Olinga 9 1 1 4
DIPTERA (TRUE FLIES) Aphrophila 5 8 3 11 42 VA
Eriopterini 5 3 3 12
Maoridiamesa 3 1 1 4
Orthocladiinae 2 2 2 8
Prior to the current 2015-2016 period, 15 taxa had characterised the community at this site on occasions. These have comprised seven ‘highly sensitive’, five ‘moderately sensitive’, and three ‘tolerant’ taxa i.e. a majority of ‘sensitive’ taxa as would be expected near the National Park boundary of a ringplain stream. However, there have been fewer numerically dominant taxa than are typical in the upper reaches of a ringplain stream. Predominant taxa have included two ‘highly sensitive’ taxa [mayfly (Deleatidium on every sampling occasion) and stonefly (Zelandoperla)]; one ‘moderately sensitive’ taxon [elmid beetles]; but no ‘tolerant’ taxa. Six of these historically characteristic taxa were dominant in the spring 2015 community and three of the same taxa were again dominant in the summer 2016 community together. No ‘tolerant’ taxa were dominant on either sampling occasion coincident with minimal periphyton substrate cover at this site. The spring survey closely mirrored 2014-2015 results but the more sparsely populated summer community was overall more typical for the site. The relatively few taxa recorded as very or extremely abundant during spring and/or summer had characterised this site’s communities on 42% to 100% of past surveys. There was no significant difference in SQMCIS score (0.2 units) between seasons (Table 137 and Table 138).
Predicted stream ‘health’ 3.2.5.1.3The Waiwhakaiho River site at the National Park is just inside the National Park boundary at an altitude of 460 m asl. Relationships for ringplain streams developed between MCI and site altitude and distance from the National Park boundary (Stark and Fowles, 2009) predict MCI values of 131 (altitude) and 132 (distance) for this site. The historical site median (129 units) was only two units lower than the altitude prediction and three units lower than the distance predictive value, with the spring 2015 survey score (130 units) only one to two units lower than predictive values and the summer 2016 score (131 units) only two to three units lower than both predictive values. The median value for ringplain streams of similar altitude arising within the National Park (TRC, 2015c) was 134 units. The historical site median and spring and summer scores were not significantly different to this value. The REC predicted MCI value (Leathwick, et al. 2009) was 137 units. The historical site median and spring and summer scores were also not significantly different to this value.
Temporal trends in 2003 to 2016 data 3.2.5.1.4A LOWESS trend plot with a moving average (tension 0.4) trendline was produced (Figure 24). A non-parametric statistical trend analysis of the MCI data using the Mann-

48
Kendall test was then performed on 14 years of SEM results (2003-2016) from the site in the Waiwhakaiho River at the National Park. The MCI has been chosen as the preferable indicator of ‘stream/river health’ for SEM trend reporting purposes.
Figure 24 LOWESS trend plot of MCI data at the National Park site
No significant temporal trend in MCI scores has been found over the 14 year monitoring period at this site within the National Park. The trendline has a range of five units have consistently indicated ‘very good’ generic (Table 2) river health over the period.
Temporal trends in 2006 to 2016 data 3.2.5.1.5A LOWESS trend plot with a moving average (tension 0.4) trendline was produced (Figure 25). A non-parametric statistical trend analysis of the MCI data using the Mann-Kendall test was then performed on the most recent ten years of SEM results (2006-2016) from the site in the Waiwhakaiho River at the National Park.
Figure 25 LOWESS trend plot of ten years of MCI data at the National Park site
No significant trend in MCI scores has been found over the ten year monitoring period at this site within the National Park consistent with the full 14 year dataset. The trendline
WKH000100
2002 2004 2006 2008 2010 2012 2014 2016 2018Year
110
115
120
125
130
135
140
145
150
MC
I va
lue
WKH000100
2006 2008 2010 2012 2014 2016 2018Year
110
115
120
125
130
135
140
145
150
MC
I va
lue
N = 28 Kendall tau = +0.102 p level = 0.445 FDR p = 0.549
N = 20 Kendall tau = +0.056 p level = 0.716 FDR p = 0.812

49
had a range of only five units which consistently indicated ‘very good’ generic (Table 2) river health over the period.
Egmont Village site (WKH000500) 3.2.5.2 Taxa richness and MCI 3.2.5.2.1
Thirty-eight surveys have been undertaken in the Waiwhakaiho River at this mid-reach site at SH 3, Egmont Village (above the Mangorei Power Scheme) between October 1995 and February 2015. These results are summarised in Table 22, together with the results from the current period, and illustrated in Figure 26.
Table 22 Results of previous surveys performed in the Waiwhakaiho River at Egmont Village together with spring 2015 and summer 2016 results
Site code
SEM data ( 1995 to Feb 2015) 2015-2016 surveys
No of surveys
Taxa numbers MCI values Dec 2015 Mar 2016
Range Median Range Median Taxa no MCI Taxa no MCI
WKH000500 40 14-32 23 87-122 110 26 125 22 111
Figure 26 Numbers of taxa and MCI values in the Waiwhakaiho River at Egmont Village
A wide range of richnesses (14 to 32 taxa) has been found; wider than might be expected, with a median richness of 23 taxa (more representative of typical richnesses in the mid reaches of ringplain streams and rivers (TRC, 2015c)). During the 2015-2016 period spring (26 taxa) and summer (22 taxa) richnesses were similar to each other and to the median taxa number to date. MCI values have had a slightly wider range (35 units) at this site than typical of sites in the mid reaches of ringplain rivers. The median value (110 units) has been relatively typical of mid reach sites elsewhere on the ringplain however with the spring 2015 (125 units) and summer, 2015 (111 units) scores typical for such a site and from five units higher to two units lower than the historical median. These scores categorised this site as having ‘very good’ (spring) and ‘good’ (summer) health generically. The historical median score (110 units) placed this site in the ‘good’ category for generic health.
0
10
20
30
40
50
60
70
0
20
40
60
80
100
120
140
No. o
f tax
a
MCI
val
ue
SEM: Number of taxa and MCI values in the Waiwhakaiho River at Egmont Village (WKH000500)
MCI value Median MCI to dateNo. of taxa Median no. of taxa to date

50
Community composition 3.2.5.2.2Characteristic macroinvertebrate taxa in the communities at this site prior to the 2015-2016 period are listed in Table 23.
Table 23 Characteristic taxa [abundant (A), very abundant (VA), extremely abundant (XA)] recorded in the Waiwhakaiho River at Egmont Village between 1995 and February 2015 [40 surveys], and by the spring 2015 and summer 2016 surveys
Taxa List MCI score
A VA XA Total %
Survey
Spring 2015
Summer 2016
NEMATODA Nematoda 3 1 1 3
ANNELIDA (WORMS) Oligochaeta 1 6 2 8 20
EPHEMEROPTERA (MAYFLIES) Coloburiscus 7 11 2 13 33
Deleatidium 8 10 3 20 33 83 XA VA
Nesameletus 9 3 3 8
PLECOPTERA (STONEFLIES) Zelandoperla 8 3 3 8
COLEOPTERA (BEETLES) Elmidae 6 16 9 25 63 VA
MEGALOPTERA (DOBSONFLIES) Archichauliodes 7 2 2 5
TRICHOPTERA (CADDISFLIES) Hydropsyche (Aoteapsyche) 4 17 9 1 27 68 A
Costachorema 7 13 2 15 38 A
Hydrobiosis 5 5 1 6 15
Neurochorema 6 5 5 13
Beraeoptera 8 1 1 3
Oxyethira 2 6 1 1 8 20 VA
Pycnocentrodes 5 5 5 13
DIPTERA (TRUE FLIES) Aphrophila 5 22 11 33 83 A A
Eriopterini 5 2 2 5
Maoridiamesa 3 18 16 1 35 88 A A
Orthocladiinae 2 15 14 7 36 90 A VA
Tanytarsini 3 4 6 10 25 A
Empididae 3 2 2 5
Muscidae 3 4 4 10
Austrosimulium 3 1 1 3
Prior to the current 2015-2016 period, 23 taxa had characterised the community at this site on occasions. These have comprised four ‘highly sensitive’, nine ‘moderately sensitive’, and ten ‘tolerant’ taxa i.e. a minority of ‘highly sensitive’ taxa and in comparison with the National Park site, a (downstream) increase in ‘tolerant’ taxa as would be expected in the mid reaches of a ringplain river. Predominant taxa have included one ‘highly sensitive’ taxon [mayfly (Deleatidium)]; two ‘moderately sensitive’ taxa [elmid beetles and cranefly (Aphrophila)]; and three ‘tolerant’ taxa [free-living caddisfly (Aoteapsyche) and midges (Maoridiamesa and orthoclads)]. Six characteristic taxa were dominant in the spring 2015 community and seven characteristic taxa in the summer community. These characteristic taxa comprised one ‘highly sensitive’, three ‘moderately sensitive’ and two ‘tolerant’ taxa in spring and one ‘highly sensitive’, one ‘moderately sensitive’, and five ‘tolerant’ taxa in summer. Four of these nine taxa were dominant in both spring and summer communities (Table 23). A decrease in the abundances of ‘highly sensitive’ mayfly (Deleatidium) and ‘moderately sensitive’ elmid beetles and caddisfly (Costachorema) coupled with an

51
N = 42 Kendall tau = +0.365 p level < 0.001 FDR p = 0.002
increase in ‘tolerant’ characteristic taxa in summer resulted in a highly significant decrease of 3.1 SQMCIS units in the summer survey (Table 137 and Table 138). Of the very or extremely abundant taxa in the 2015-2016 period, the ‘highly sensitive’ mayfly (Deleatidium), and ‘tolerant’ elmid beetles, caddisfly (Oxyethira) and orthoclad midges have characterised this site’s communities on 20% to 90% of survey occasions to date.
Predicted stream ‘health’ 3.2.5.2.3The Waiwhakaiho River site at Egmont Village is 10.6 km downstream of the National Park boundary at an altitude of 175 m asl. Relationships for ringplain streams developed between MCI and site altitude and distance from the National Park boundary (Stark and Fowles, 2009), predict MCI values of 102 (altitude) and 105 (distance) for this site. The historical site median (110) is eight units higher than the altitude prediction and five units higher than the distance predictive value while the spring, 2014 (115 units) and summer 2015 (108 units) scores were higher than both predictive values, by three to a significant 13 units. Of the 40 surveys to date at this site, only 15% of MCI scores have been less than 102 units while 68% have been greater than 105 units. The median value for ringplain streams of similar altitude arising within the National Park (TRC, 2015c) was 108 units. The historical site median and summer scores were not significantly different to this value but the spring score was significantly higher (17 units). The REC predicted MCI value (Leathwick, et al. 2009) was 115 units. The historical site median and spring and summer scores were not significantly different to this value.
Temporal trends in 1995 to 2016 data 3.2.5.2.4A LOWESS trend plot with a moving average (tension 0.4) trendline was produced (Figure 27). A non-parametric statistical trend analysis of the MCI data using the Mann-Kendall test was then performed on 21 years of SEM results (1995-2016) from the site in the Waiwhakaiho River at Egmont Village. The MCI has been chosen as the preferable indicator of ‘stream/river health’ for SEM trend reporting purposes.
Figure 27 LOWESS trend plot of MCI data at the Egmont Village site
WKH000500
1994 1996 1998 2000 2002 2004 2006 2008 2010 2012 2014 2016 2018Year
85
90
95
100
105
110
115
120
125
130
MC
I va
lue

52
N = 20 Kendall tau = +0.136 p level = 0.401 FDR p = 0.742
A positive significant positive trend in MCI scores (FDR p=0.002) has been found during the 21 year period indicating an overall improvement in macroinvertebrate health at the site. After some initial deterioration in scores, there has been a steady improvement since 1999. While the individual scores were indicative of ‘good’ to ‘fair’ generic river health (Table 2) over the first five years, the trendline had a range of 14 units which indicated that river health had consistently remained ‘good’ since 2000.
Temporal trends in 2006 to 2016 data 3.2.5.2.5A LOWESS trend plot with a moving average (tension 0.4) trendline was produced (Figure 28). A non-parametric statistical trend analysis of the MCI data using the Mann-Kendall test was then performed on the ten most recent years of SEM results (2005-2016) from the site in the Waiwhakaiho River at Egmont Village.
Figure 28 LOWESS trend plot of MCI data at the Egmont Village site
A minor non-significant positive trend in MCI scores (FDR p> 0.05) has been found contrasting with the highly significant trend found for the full dataset. MCI scores over the last ten years have been relatively similar to each other with some minor variation indicating macroinvertebrate health has plateaued at the site. The trendline was indicative of ‘good’ macroinvertebrate health (Table 2).
Constance Street site (WKH000920) 3.2.5.3 Taxa richness and MCI 3.2.5.3.1
Forty-three surveys have been undertaken in the Waiwhakaiho River at this lower reach site at Constance Street, New Plymouth (below the Mangorei Power Scheme) between 1995 and February 2015. These results are summarised in Table 24, together with the results from the current period, and illustrated in Figure 29.
Table 24 Results of previous surveys performed in the Waiwhakaiho River at Constance Street, New Plymouth, together with spring 2015 and summer 2016 results
Site code
SEM data ( 1995 to Feb 2015) 2015-2016 surveys
No of surveys
Taxa numbers MCI values Dec 2015 Mar 2016
Range Median Range Median Taxa no MCI Taxa no MCI
WKH000920 43 12-29 20 71-110 94 18 92 18 93
WKH000500
2006 2008 2010 2012 2014 2016 2018Year
90
95
100
105
110
115
120
125
130
MC
I va
lue

53
Figure 29 Numbers of taxa and MCI values in the Waiwhakaiho River at Constance Street
A wide range of richnesses (12 to 29 taxa) has been found with a median richness of 20 taxa (more representative of typical richnesses in the lower reaches of ringplain streams and rivers (TRC, 2015c)). During the 2015-2016 period, spring (18 taxa) and summer (18 taxa) richnesses were the same and only two taxa lower than the median richness. MCI values have had a wide range (39 units) at this site, typical of sites in the lower reaches of ringplain streams and rivers. The median value (94 units) has been relatively typical of scores at lower reach sites elsewhere on the ringplain (TRC, 2015c). The spring 2015 (92 units) and summer 2016 (93 units) scores were very similar to each other and relatively typical of scores for such a site. They were only one-two units below the historical median. These scores categorised this site as having ‘fair’ (spring and summer) health generically (Table 2). The historical median score (94 units) placed this site in the ‘fair’ category. Of the 45 surveys to date at this site, 16% of MCI scores have been less than 86 units while 38% have been greater than 95 units.
0
10
20
30
40
50
60
0
20
40
60
80
100
120
No.
of t
axa
MC
I val
ue
SEM: Number of taxa and MCI values in the Waiwhakaiho River at Constance Street (WKH000920)
MCI value Median MCI to dateNo. of taxa Median no. of taxa to date

54
Community composition 3.2.5.3.2Characteristic macroinvertebrate taxa in the communities at this site prior to the 2015-2016 period are listed in Table 25.
Table 25 Characteristic taxa [abundant (A), very abundant (VA), extremely abundant (XA)] recorded in the Waiwhakaiho River at Constance Street between 1995 and February 2015 [43 surveys], and by the spring 2015 and summer 2016 surveys
Taxa List MCI
scores A VA XA Total %
Survey
Spring 2015
Summer 2016
NEMERTEA Nemertea 3 1 1 2
ANNELIDA (WORMS) Oligochaeta 1 12 7 5 24 59 VA VA
MOLLUSCA Potamopyrgus 4 2 2 4 10
CRUSTACEA Paratya 3 1 1 2
EPHEMEROPTERA (MAYFLIES) Austroclima 7 1 1 2
Coloburiscus 7 5 5 12
Deleatidium 8 13 7 2 22 54 A
COLEOPTERA (BEETLES) Elmidae 6 10 2 12 29
Staphylinidae 5 1 1 2
TRICHOPTERA (CADDISFLIES) Hydropsyche (Aoteapsyche) 4 18 13 1 32 78 VA A
Costachorema 7 5 1 6 15
Hydrobiosis 5 8 8 20
Neurochorema 6 1 1 2
Oxyethira 2 7 5 12 29 A
DIPTERA (TRUE FLIES) Aphrophila 5 7 1 8 20 A
Maoridiamesa 3 14 5 1 20 49 A
Orthocladiinae 2 22 13 5 40 98 A
Tanytarsini 3 15 3 18 44
Muscidae 3 3 3 7
Austrosimulium 3 4 4 10
Prior to the current 2015-2016 period, 20 taxa had characterised the community at this site on occasions. These have comprised one ‘highly sensitive’, eight ‘moderately sensitive’, and eleven ‘tolerant’ taxa i.e. a minority of ‘highly sensitive’ taxa with a downstream increased proportion of ‘tolerant’ taxa (compared to the characteristic taxa in the upper and mid-reaches) as would be expected in the lower reaches of a ringplain river. Predominant taxa have included one ‘highly sensitive’ taxa [ubiquitous mayfly (Deleatidium)]; no ‘moderately sensitive’ taxa; but three ‘tolerant’ taxa [oligochaete worms, net-building caddisfly (Hydropsyche-Aoteapsyche), and orthoclad midges]. Only five of the historically characteristic taxa were dominant in the spring 2015 community and four characteristic taxa were present in the summer 2016 community. These characteristic taxa comprised one ‘moderately sensitive’ and four ‘tolerant’ taxa in the spring survey and one ‘highly sensitive’ and three ‘tolerant’ taxa in the summer community. Only two of these seven taxa were dominant in both spring and summer communities (Table 25). Despite these dissimilarities in seasonal dominances there was a minimal decrease of 0.2 unit between spring and summer SQMCIs scores, mainly due to the predominance of ‘tolerant’ taxa in both seasons’ communities (Table 137 and Table 138). Those taxa dominant in spring and/or summer surveys that were very abundant had characterised this site’s communities on 59% to 78% of past survey occasions.
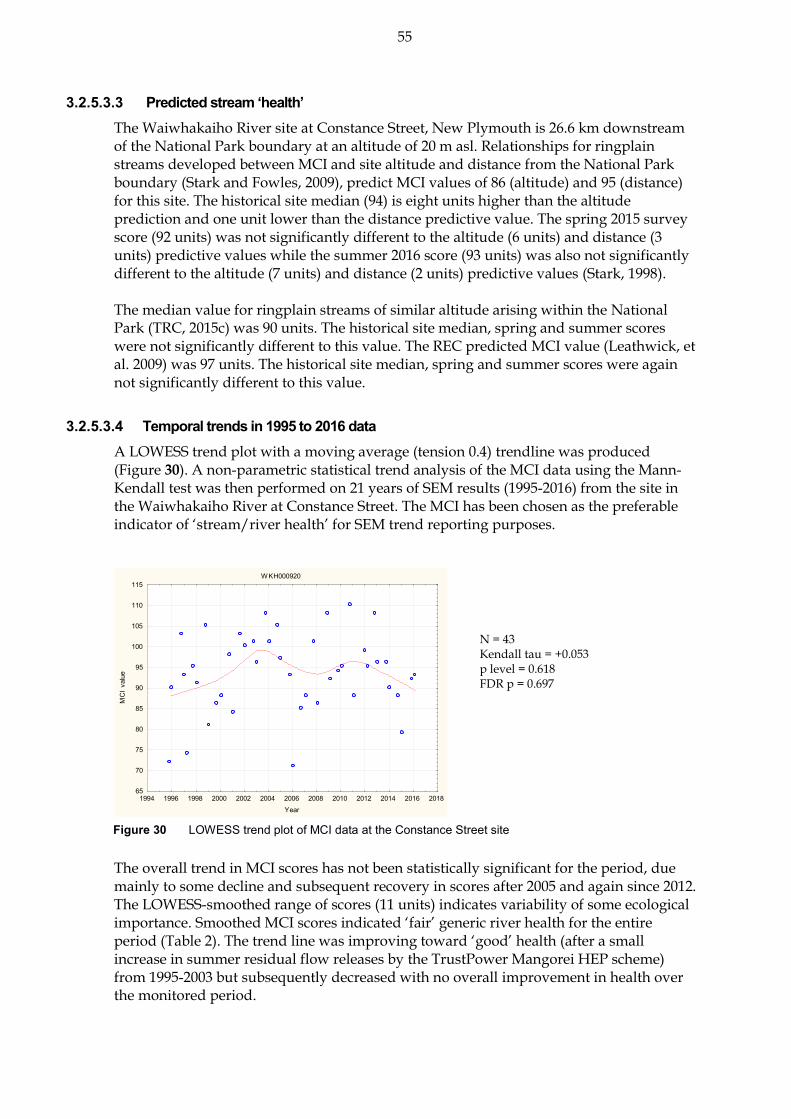
55
N = 43 Kendall tau = +0.053 p level = 0.618 FDR p = 0.697
Predicted stream ‘health’ 3.2.5.3.3The Waiwhakaiho River site at Constance Street, New Plymouth is 26.6 km downstream of the National Park boundary at an altitude of 20 m asl. Relationships for ringplain streams developed between MCI and site altitude and distance from the National Park boundary (Stark and Fowles, 2009), predict MCI values of 86 (altitude) and 95 (distance) for this site. The historical site median (94) is eight units higher than the altitude prediction and one unit lower than the distance predictive value. The spring 2015 survey score (92 units) was not significantly different to the altitude (6 units) and distance (3 units) predictive values while the summer 2016 score (93 units) was also not significantly different to the altitude (7 units) and distance (2 units) predictive values (Stark, 1998). The median value for ringplain streams of similar altitude arising within the National Park (TRC, 2015c) was 90 units. The historical site median, spring and summer scores were not significantly different to this value. The REC predicted MCI value (Leathwick, et al. 2009) was 97 units. The historical site median, spring and summer scores were again not significantly different to this value.
Temporal trends in 1995 to 2016 data 3.2.5.3.4A LOWESS trend plot with a moving average (tension 0.4) trendline was produced (Figure 30). A non-parametric statistical trend analysis of the MCI data using the Mann-Kendall test was then performed on 21 years of SEM results (1995-2016) from the site in the Waiwhakaiho River at Constance Street. The MCI has been chosen as the preferable indicator of ‘stream/river health’ for SEM trend reporting purposes.
Figure 30 LOWESS trend plot of MCI data at the Constance Street site
The overall trend in MCI scores has not been statistically significant for the period, due mainly to some decline and subsequent recovery in scores after 2005 and again since 2012. The LOWESS-smoothed range of scores (11 units) indicates variability of some ecological importance. Smoothed MCI scores indicated ‘fair’ generic river health for the entire period (Table 2). The trend line was improving toward ‘good’ health (after a small increase in summer residual flow releases by the TrustPower Mangorei HEP scheme) from 1995-2003 but subsequently decreased with no overall improvement in health over the monitored period.
WKH000920
1994 1996 1998 2000 2002 2004 2006 2008 2010 2012 2014 2016 2018Year
65
70
75
80
85
90
95
100
105
110
115
MC
I va
lue

56
N = 20 Kendall tau = -0.054 p level = 0.974 FDR p = 0.974
Temporal trends in 2006 to 2016 data 3.2.5.3.5A LOWESS trend plot with a moving average (tension 0.4) trendline was produced (Figure 31). A non-parametric statistical trend analysis of the MCI data using the Mann-Kendall test was then performed on the most recent ten years of SEM results (2006-2016) from the site in the Waiwhakaiho River at Constance Street.
Figure 31 LOWESS trend plot of ten years of MCI data at the Constance Street site
The overall trend in MCI scores has not been statistically significant which matches that of the full dataset. The trendline was indicative of ‘fair’ generic river health for the entire period (Table 2).
Site adjacent to Lake Rotomanu (WKH000950) 3.2.5.4 Taxa richness and MCI 3.2.5.4.1
Thirty-nine surveys have been undertaken in the Waiwhakaiho River at this lower reach site adjacent to Lake Rotomanu between March 1997 and February 2015. These results are summarised in Table 26, together with the results from the current period, and illustrated in Figure 32.
Table 26 Results of previous surveys performed in the Waiwhakaiho River the site adjacent to Lake Rotomanu, together with spring 2015 and summer 2016 results
Site code
SEM data ( 1995 to Feb 2015) 2015-2016 surveys
No of surveys
Taxa numbers MCI values Dec 2015 Mar 2016
Range Median Range Median Taxa no MCI Taxa no MCI
WKH000950 39 12-30 21 70-111 88 19 79 19 99
WKH000920
2006 2008 2010 2012 2014 2016 2018Year
70
75
80
85
90
95
100
105
110
115
MC
I va
lue
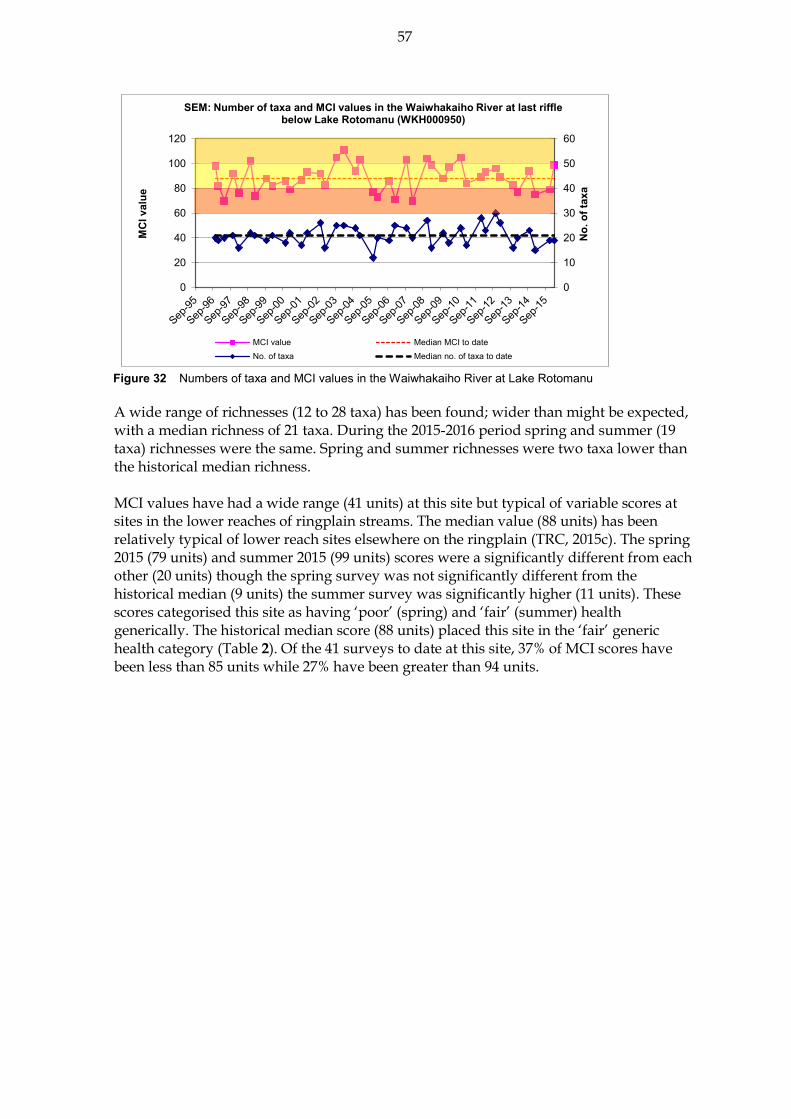
57
Figure 32 Numbers of taxa and MCI values in the Waiwhakaiho River at Lake Rotomanu A wide range of richnesses (12 to 28 taxa) has been found; wider than might be expected, with a median richness of 21 taxa. During the 2015-2016 period spring and summer (19 taxa) richnesses were the same. Spring and summer richnesses were two taxa lower than the historical median richness. MCI values have had a wide range (41 units) at this site but typical of variable scores at sites in the lower reaches of ringplain streams. The median value (88 units) has been relatively typical of lower reach sites elsewhere on the ringplain (TRC, 2015c). The spring 2015 (79 units) and summer 2015 (99 units) scores were a significantly different from each other (20 units) though the spring survey was not significantly different from the historical median (9 units) the summer survey was significantly higher (11 units). These scores categorised this site as having ‘poor’ (spring) and ‘fair’ (summer) health generically. The historical median score (88 units) placed this site in the ‘fair’ generic health category (Table 2). Of the 41 surveys to date at this site, 37% of MCI scores have been less than 85 units while 27% have been greater than 94 units.
0
10
20
30
40
50
60
0
20
40
60
80
100
120
No.
of t
axa
MC
I val
ue
SEM: Number of taxa and MCI values in the Waiwhakaiho River at last riffle below Lake Rotomanu (WKH000950)
MCI value Median MCI to dateNo. of taxa Median no. of taxa to date

58
Community composition 3.2.5.4.2Characteristic macroinvertebrate taxa in the communities at this site prior to the 2015-2016 period are listed in Table 27.
Table 27 Characteristic taxa [abundant (A), very abundant (VA), extremely abundant (XA)] recorded in the Waiwhakaiho River at the site adjacent to Lake Rotomanu between 1995 and February 2015 [39 surveys], and by the spring 2015 and summer 2016 surveys
Taxa List
MCI A VA XA Total %
Survey
Spring 2015
Summer 2016
NEMERTEA Nemertea 3 3 3 8
ANNELIDA (WORMS) Oligochaeta 1 14 8 11 33 85 A
MOLLUSCA Physa 3 1 1 3
Potamopyrgus 4 11 2 2 15 38 A
CRUSTACEA Paratya 3 6 2 8 21
EPHEMEROPTERA (MAYFLIES) Coloburiscus 7 1 1 3
Deleatidium 8 7 2 1 10 26
COLEOPTERA (BEETLES) Elmidae 6 6 2 8 21 A
TRICHOPTERA (CADDISFLIES) Hydropsyche (Aoteapsyche) 4 12 11 4 27 69 A A
Costachorema 7 2 2 5
Hydrobiosis 5 3 3 8
Oxyethira 2 14 1 15 38 A
DIPTERA (TRUE FLIES) Aphrophila 5 9 4 13 33 A
Maoridiamesa 3 9 10 19 49 A
Orthocladiinae 2 12 16 11 39 100 A A
Tanytarsini 3 11 5 16 41
Empididae 3 1 1 3
Muscidae 3 1 1 3
Austrosimulium 3 1 1 3
Prior to the current 2015-2016 period, 19 taxa had characterised the community at this site on occasions. These have comprised one ‘highly sensitive’, five ‘moderately sensitive’, and thirteen ‘tolerant’ taxa i.e. a minority of ‘sensitive’ taxa and a high proportion of ‘tolerant’ taxa as would be expected in the lower reaches of a ringplain river. Predominant taxa have included no ‘highly sensitive’ or ‘moderately sensitive’ taxa; but three ‘tolerant’ taxa (oligochaete worms, net-building caddisfly (Hydropsyche-Aoteapsyche), and orthoclad midges). Eight of the historically characteristic taxa were dominant in the spring 2015 community. These were comprised of two ‘moderately sensitive’ taxa and six ‘tolerant’ taxa. Only two ‘tolerant’ taxa comprised the dominant taxa of the summer 2016 community. Two of the eight taxa were dominant in both spring and summer communities (Table 27). There was a non-significant difference in SQMCIs scores (0.2 units) between spring and summer (Table 137 and Table 138) largely due to the fact that ‘tolerant’ taxa dominated the samples in both spring and summer . The most abundant ‘tolerant’ oligochaete worms, snail (Potamopyrgus), and midges (orthoclads and Maoridiamesa) have characterised this site’s communities on 38% to 100% of past survey occasions.
Predicted stream ‘health’ 3.2.5.4.3The Waiwhakaiho River at the site adjacent to Lake Rotomanu is 28.4 km downstream of the National Park boundary at an altitude of 2 m asl. Relationships for ringplain streams

59
N = 41 Kendall tau = +0.064 p level = 0.556 FDR, p = 0.640
developed between MCI and site altitude and distance from the National Park boundary (Stark and Fowles, 2009), predict MCI values of 85 (altitude) and 94 (distance) for this site. The historical site median (88) is three units higher than the altitude prediction and six units lower than the distance predictive value. The spring 2015 survey score (79 units) was not significantly different to the altitude predictive value (6 units) but was significantly lower than the distance predictive value (15 units). The summer 2016 survey was significantly higher than the altitude predictive value (14 units) but not significantly different to the distance predictive value (5 units). The median value for ringplain streams of similar altitude arising within the National Park (TRC, 2015c) was 90 units. The historical site median and summer scores were not significantly different to this value but the spring score was significantly lower (11 units). The REC predicted MCI value (Leathwick, et al. 2009) was 97 units. The historical site median and summer scores were not significantly different to this value but the spring score was significantly lower (18 units).
Temporal trends in 1995 to 2016 data 3.2.5.4.4A LOWESS trend plot with a moving average (tension 0.4) trendline was produced (Figure 33). A non-parametric statistical trend analysis of the MCI data using the Mann-Kendall test was then performed on 21 years of SEM results (1995-2016) from the site in the Waiwhakaiho River adjacent to Lake Rotomanu. The MCI has been chosen as the preferable indicator of ‘stream/river health’ for SEM trend reporting purposes.
Figure 33 LOWESS trend plot of MCI data at the site adjacent to Lake Rotomanu
Overall, MCI scores have shown no statistically significant trend. There was an improvement from 1995 to 2003 but since 2004, there has been a steady decline in scores toward scores typically found in the first two years of the programme followed by another improvement and subsequent decline, relatively similar trends to those found at the nearest upstream site (Constance St). The trendline covered a range of scores (12 units) of marginal ecological importance which showed slightly more variability over the 2007 to 2015 period. The trendline indicated ‘fair’ generic stream ‘health’ (Table 2) throughout the period.
WKH000950
1996 1998 2000 2002 2004 2006 2008 2010 2012 2014 2016 2018Year
65
70
75
80
85
90
95
100
105
110
115
MC
I va
lue

60
N = 20 Kendall tau = -0.106 p level = 0.514 FDR, p = 0.742
Temporal trends in 2007 to 2016 data 3.2.5.4.5A LOWESS trend plot with a moving average (tension 0.4) trendline was produced (Figure 34). A non-parametric statistical trend analysis of the MCI data using the Mann-Kendall test was then performed on the most recent ten years of SEM results (2007-2016) from the site in the Waiwhakaiho River adjacent to Lake Rotomanu.
Figure 34 LOWESS trend plot of ten years of MCI data at the site adjacent to Lake Rotomanu
Overall, MCI scores have shown no statistically significant trend congruent with the full dataset results. There was an improvement from 2007 to 2010 but then there was a subsequent decline in the trendline from 2010. The trendline has indicated ‘fair’ generic stream ‘health’ (Table 2) throughout the period.
Discussion 3.2.5.5Seasonal MCI values typically decreased between spring and summer at the four survey sites with the summer decrease greater the further downstream the site was located (Appendix II). However, for the current reported period only the mid-reach site showed a decrease (14 units) and the two lower reach sites showed increases by one and 20 units respectively in a downstream direction. The upper catchment site also increased (but only by one unit) in summer. The MCI scores fell in a downstream direction between the upper site and the furthest downstream lower reaches site by a highly significant 51 units in spring and 32 units in summer, over a river distance of 28.7 km indicative of the poorer proceeding water quality at the lower sites. The atypically large spring decrease was caused by the low score of 79 units recorded at the bottom site. There was a significant decrease of 13 units between the bottom site and the closest upstream site located a few hundred metres upstream above the confluence of the Mangaone Stream which was suggestive that the Mangaone Stream, which runs through an industrial area, had a negative impact on the water quality at the bottom Waiwhakaiho River site preceding the spring survey. Community composition varied markedly through the length of the river surveyed. A total of 41 taxa were recorded in spring, of which only six taxa were present at all four sites. These included four ‘moderately sensitive’ and two ‘tolerant’ taxa with no taxa abundant at all four sites. A slightly lower total of 36 taxa were recorded in the summer survey, of which only four taxa were present at all four sites, three of which were also
WKH000950
2006 2008 2010 2012 2014 2016 2018Year
70
80
90
100
110
MC
I va
lue
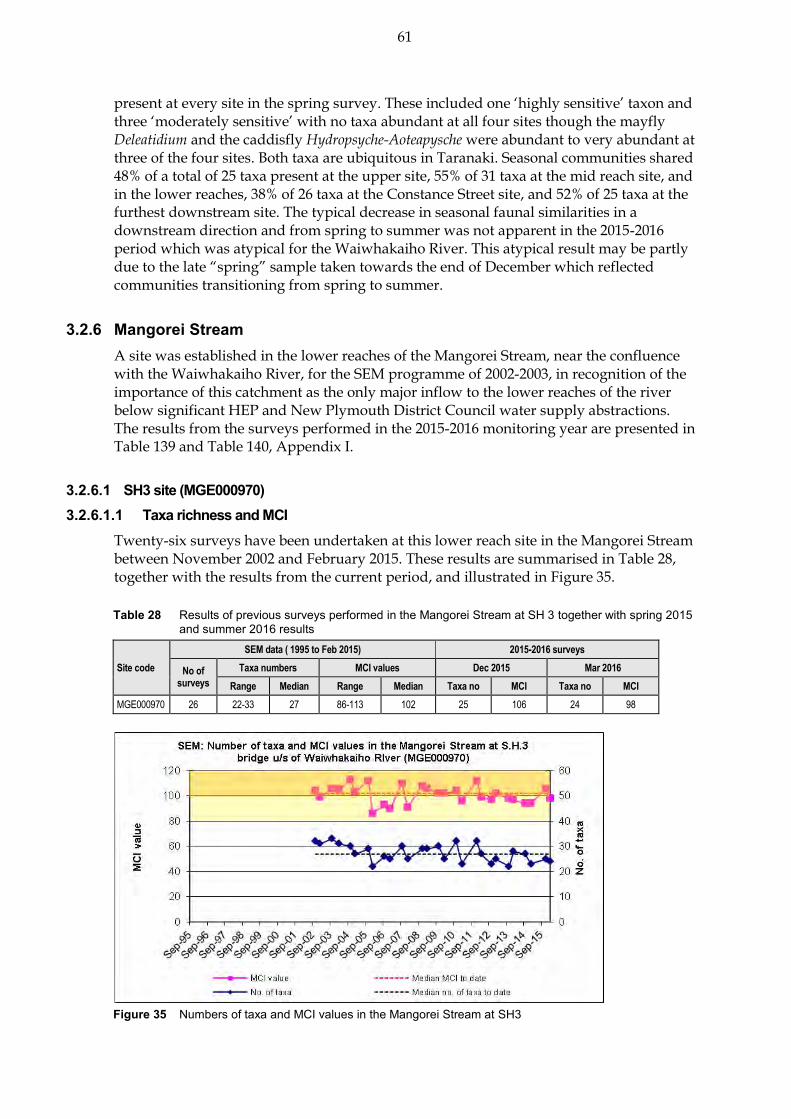
61
present at every site in the spring survey. These included one ‘highly sensitive’ taxon and three ‘moderately sensitive’ with no taxa abundant at all four sites though the mayfly Deleatidium and the caddisfly Hydropsyche-Aoteapysche were abundant to very abundant at three of the four sites. Both taxa are ubiquitous in Taranaki. Seasonal communities shared 48% of a total of 25 taxa present at the upper site, 55% of 31 taxa at the mid reach site, and in the lower reaches, 38% of 26 taxa at the Constance Street site, and 52% of 25 taxa at the furthest downstream site. The typical decrease in seasonal faunal similarities in a downstream direction and from spring to summer was not apparent in the 2015-2016 period which was atypical for the Waiwhakaiho River. This atypical result may be partly due to the late “spring” sample taken towards the end of December which reflected communities transitioning from spring to summer.
Mangorei Stream 3.2.6A site was established in the lower reaches of the Mangorei Stream, near the confluence with the Waiwhakaiho River, for the SEM programme of 2002-2003, in recognition of the importance of this catchment as the only major inflow to the lower reaches of the river below significant HEP and New Plymouth District Council water supply abstractions. The results from the surveys performed in the 2015-2016 monitoring year are presented in Table 139 and Table 140, Appendix I.
SH3 site (MGE000970) 3.2.6.1 Taxa richness and MCI 3.2.6.1.1
Twenty-six surveys have been undertaken at this lower reach site in the Mangorei Stream between November 2002 and February 2015. These results are summarised in Table 28, together with the results from the current period, and illustrated in Figure 35.
Table 28 Results of previous surveys performed in the Mangorei Stream at SH 3 together with spring 2015 and summer 2016 results
Site code
SEM data ( 1995 to Feb 2015) 2015-2016 surveys
No of surveys
Taxa numbers MCI values Dec 2015 Mar 2016
Range Median Range Median Taxa no MCI Taxa no MCI
MGE000970 26 22-33 27 86-113 102 25 106 24 98
Figure 35 Numbers of taxa and MCI values in the Mangorei Stream at SH3

62
A moderate range of richnesses (22 to 33 taxa) has been found with a relatively high median richness of 27 taxa [more representative of typical richnesses in upper and middle reaches of ringplain streams and rivers (TRC, 2015c)]. During the 2015-2016 period, spring (25 taxa) and summer (26 taxa) richnesses were very similar to each other and the historical median richness. MCI values have had a relatively wide range (27 units) at this site, typical of a site in the lower reaches of a ringplain stream. However, the median value (102 units) has been more typical of mid-reach sites elsewhere on the ringplain. Both the spring 2015 (105 units) and summer 2016 (99 units) scores were similar to the historical median. These scores categorised this site as having ‘good’ (spring) and ‘fair’ (summer) health generically (Table 2). The historical median score (102 units) placed this site in the ‘good’ health category.
Community composition 3.2.6.1.2Characteristic macroinvertebrate taxa in the communities at this site prior to the 2015-2016 period are listed in Table 29.
Table 29 Characteristic taxa [abundant (A), very abundant (VA), extremely abundant (XA)] recorded in the Mangorei Stream at SH3 between 2002 and February 2015 [26 surveys], and by the spring 2015 and summer 2016 surveys
Taxa List MCI
score A VA XA Total %
Survey
Spring 2015
Summer 2016
NEMERTEA Nemertea 3 2 2 8 A
ANNELIDA (WORMS) Oligochaeta 1 9 6 1 16 62
MOLLUSCA Potamopyrgus 4 7 2 9 35 A
EPHEMEROPTERA (MAYFLIES) Austroclima 7 13 2 15 58 A
Coloburiscus 7 7 4 11 42 A
Deleatidium 8 11 2 4 17 65 A
PLECOPTERA (STONEFLIES) Zelandobius 5 6 3 9 35
Zelandoperla 8 2 2 8
COLEOPTERA (BEETLES) Elmidae 6 17 1 18 69 A A
MEGALOPTERA (DOBSONFLIES) Archichauliodes 7 18 1 19 73 A
TRICHOPTERA (CADDISFLIES) Hydropsyche (Aoteapsyche) 4 8 10 5 23 88 A VA
Costachorema 7 3 3 12
Hydrobiosis 5 8 4 12 46
Neurochorema 6 5 5 19
Confluens 5 3 3 12
Oxyethira 2 8 2 10 38 A A
Pycnocentrodes 5 3 3 6 23
DIPTERA (TRUE FLIES) Aphrophila 5 8 12 20 77 A
Maoridiamesa 3 10 1 11 42
Orthocladiinae 2 16 9 25 96 A
Tanytarsini 3 10 5 1 16 62 A A
Empididae 3 6 6 23
Muscidae 3 1 1 4
Austrosimulium 3 20 1 21 81 VA A

63
Prior to the current 2015-2016 period, 24 taxa have characterised the community at this site on occasions. These have comprised two ‘highly sensitive’, eleven ‘moderately sensitive’, and eleven ‘tolerant’ taxa i.e. an increased proportion of ‘tolerant’ taxa as would be expected toward the lower reaches of a ringplain stream. Predominant taxa have included one ‘highly sensitive’ taxon [mayfly (Deleatidium)]; six ‘moderately sensitive’ taxa [mayflies (Austroclima and Coloburiscus), elmid beetles, dobsonfly (Archichauliodes), free-living caddisfly (Hydrobiosis), and cranefly (Aphrophila)]; and five ‘tolerant’ taxa [oligochaete worms, net-building caddisfly (Hydropsyche-Aoteapsyche), midges (orthoclads and tanytarsids), and sandfly (Austrosimulium)]. There were eight characteristic taxa in the spring 2015 community comprising one ‘highly sensitive’ taxon, three ‘moderately sensitive’ taxa and four ‘tolerant’ taxa. There were ten characteristic taxa in the summer 2016 community comprising three ‘moderately sensitive’ taxa and seven ‘tolerant’ taxa (Table 29). There was no significant difference in SQMCIs scores (0.1 units) between spring and summer despite the decrease in abundant ‘highly sensitive’ taxa and an increase in the number of abundant ‘tolerant’ taxa. This was due to small variations within categories, i.e. very abundant sandfly Austrosimilium with a tolerance value of 3 went from ‘very abundant’ to only ‘abundant’ while a subsequent increase in the caddisfly Hydropsyche-Aoteapsyche with a higher tolerance value of 4 from ‘abundant’ to ‘very abundant’ had a large influence in the SQMCIs scores (Table 139 and Table 140). The two taxa recorded as very abundant during spring and/or summer had characterised this site’s communities on 81% and 88% of past survey occasions.
Predicted stream ‘health 3.2.6.1.3The Mangorei Stream site at SH3 is 15.6 km downstream of the National Park boundary at an altitude of 90 m asl. Relationships for ringplain streams developed between MCI and site altitude and distance from the National Park boundary (Stark and Fowles, 2009) predict MCI values of 94 (altitude) and 101 (distance) for this site. The historical site median (102 units) is eight units higher than the altitude prediction and one unit above the distance predictive value. The spring 2014 and summer 2015 scores (94 units) were equal with the predictive value for altitude and seven units lower than the predictive value for distance. Of the 26 surveys to date at this site, 15% of MCI scores have been less than 94 units while 54% have been greater than 101 units. The median value for ringplain streams of similar altitude arising within the National Park (TRC, 2015c) was 90 units. The historical site median and summer scores were not significantly different to this value but the spring score was significantly lower (11 units). The REC predicted MCI value (Leathwick, et al. 2009) was 97 units. The historical site median and summer scores were not significantly different to this value but the spring score was significantly lower (18 units).
Temporal trends in 1995 to 2016 data 3.2.6.1.4A LOWESS trend plot with a moving average (tension 0.4) trendline was produced (Figure 36). A non-parametric statistical trend analysis of the MCI data using the Mann-Kendall test was then performed on 21 years of SEM results (1995-2016) from the site in the Mangorei Stream at SH3. The MCI has been chosen as the preferable indicator of ‘stream/river health’ for SEM trend reporting purposes.

64
N = 28 Kendall tau = - 0.199 p level = 0.137 FDR p = 0.202
N = 20 Kendall tau = -0.080 p level = 0.620 FDR p = 0.753
Figure 36 LOWESS trend plot of MCI data at the SH3 site, Mangorei Stream
While the trendline showed slight initial improvement over the first three years, followed by a steady decline, between 2005 and 2011 there had been further improvement in scores towards those recorded earlier in the programme, followed by a steady decline since 2010. The overall decline over the thirteen year period has not been a statistically significant at this site. The trendline range of scores (11 units) has been indicative of marginal ecological importance in variability. During the period, these smoothed MCI scores have been consistently indicative of ‘good’ generic stream health (Table 2) with some deterioration to ‘fair’ health between 2006 and 2008 prior to some recovery, followed by a more recent decline to ‘fair’ health since 2013.
Temporal trends in 2006 to 2016 data 3.2.6.1.5A LOWESS trend plot with a moving average (tension 0.4) trendline was produced (Figure 37). A non-parametric statistical trend analysis of the MCI data using the Mann-Kendall test was then performed on the ten most recent years of SEM results (2006-2016) from the site in the Mangorei Stream at SH3.
Figure 37 LOWESS trend plot of ten years of ten years of MCI data at the SH3 site
MGE000970
2002 2004 2006 2008 2010 2012 2014 2016 2018Year
80
85
90
95
100
105
110
115M
CI
valu
e
MGE000970
2006 2008 2010 2012 2014 2016 2018Year
80
85
90
95
100
105
110
115
MC
I va
lue

65
A non-significant negative trend occurred over the ten years congruent with the full dataset. While smoothed MCI scores showed slight initial improvement over the first two years this was followed by a steady decline between 2010 and 2015. During the period, the trendline has been indicative of ‘fair’ generic health over the 2007-2008 period increasing to ‘good’ generic stream health (Table 2) between 2009-2013 before decreasing back to ‘fair’ health.
Discussion 3.2.6.2MCI values showed a typical decrease between spring (106 units) and summer (98 units) surveys at this lower reach (SH3) site which was more pronounced than the historical median summer decrease of only three units (Appendix II). The lower summer score was coincident with the summer survey recording higher levels of filamentous periphyton which would favour more ‘tolerant’ taxa. Spring and summer communities at this site shared 18 common taxa (58% of the 31 taxa found in 2015-2016), a moderately high percentage of common taxa for these two seasonal surveys at this site.
Manganui River 3.2.7The results found by the 2015-2016 surveys are presented in Table 141 and Table 142, Appendix I.
State Highway 3 site (MGN000195) 3.2.7.1 Taxa richness and MCI 3.2.7.1.1
Forty surveys have been undertaken at this mid reach site in the Manganui River between September 1995 and February 2015. These results are summarised in Table 30 together with the results from the current period, and illustrated in Figure 38.
Table 30 Results of previous surveys performed in the Manganui River u/s of railway bridge (SH 3), together with spring 2015 and summer 2016 results
Site code
SEM data ( 1995 to Feb 2015) 2015-2016 surveys
No of surveys
Taxa numbers MCI values Oct 2015 Feb 2016
Range Median Range Median Taxa no MCI Taxa no MCI
MGN000195 42 12-26 21 113-143 126 20 133 24 121
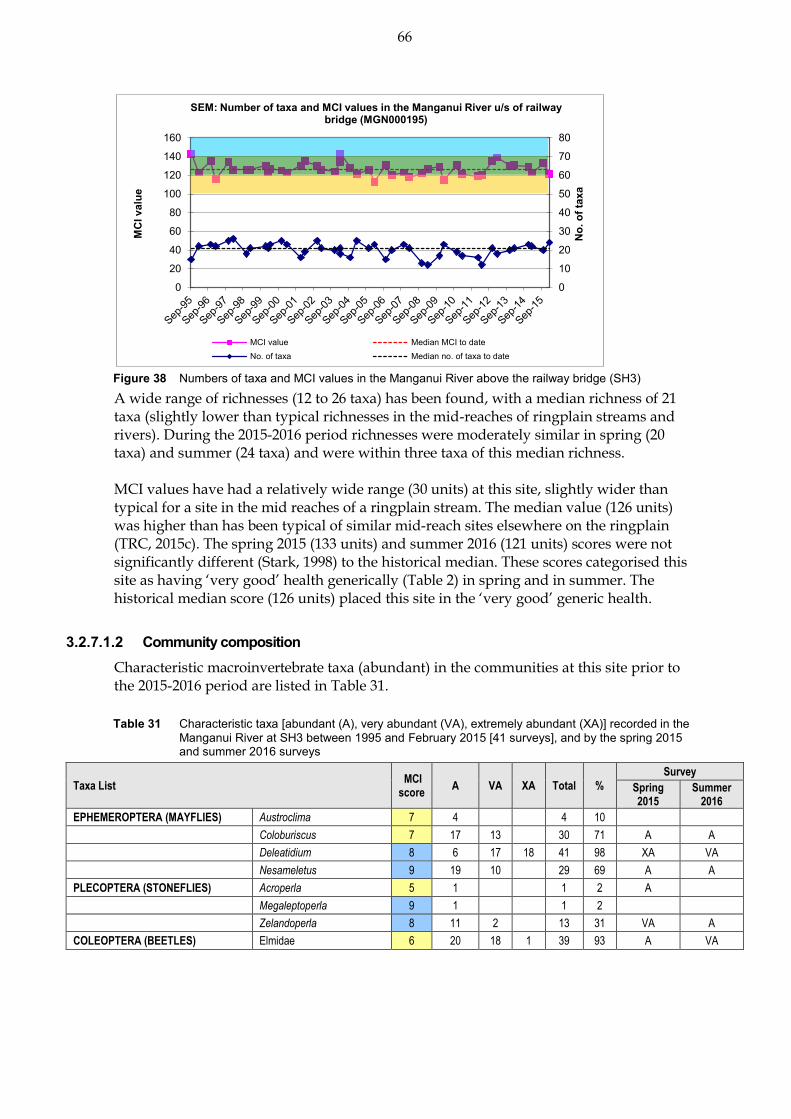
66
Figure 38 Numbers of taxa and MCI values in the Manganui River above the railway bridge (SH3)
A wide range of richnesses (12 to 26 taxa) has been found, with a median richness of 21 taxa (slightly lower than typical richnesses in the mid-reaches of ringplain streams and rivers). During the 2015-2016 period richnesses were moderately similar in spring (20 taxa) and summer (24 taxa) and were within three taxa of this median richness. MCI values have had a relatively wide range (30 units) at this site, slightly wider than typical for a site in the mid reaches of a ringplain stream. The median value (126 units) was higher than has been typical of similar mid-reach sites elsewhere on the ringplain (TRC, 2015c). The spring 2015 (133 units) and summer 2016 (121 units) scores were not significantly different (Stark, 1998) to the historical median. These scores categorised this site as having ‘very good’ health generically (Table 2) in spring and in summer. The historical median score (126 units) placed this site in the ‘very good’ generic health.
Community composition 3.2.7.1.2Characteristic macroinvertebrate taxa (abundant) in the communities at this site prior to the 2015-2016 period are listed in Table 31.
Table 31 Characteristic taxa [abundant (A), very abundant (VA), extremely abundant (XA)] recorded in the Manganui River at SH3 between 1995 and February 2015 [41 surveys], and by the spring 2015 and summer 2016 surveys
Taxa List MCI score
A VA XA Total %
Survey
Spring 2015
Summer 2016
EPHEMEROPTERA (MAYFLIES) Austroclima 7 4
4 10
Coloburiscus 7 17 13
30 71 A A
Deleatidium 8 6 17 18 41 98 XA VA
Nesameletus 9 19 10
29 69 A A
PLECOPTERA (STONEFLIES) Acroperla 5 1
1 2 A
Megaleptoperla 9 1
1 2
Zelandoperla 8 11 2
13 31 VA A
COLEOPTERA (BEETLES) Elmidae 6 20 18 1 39 93 A VA
0
10
20
30
40
50
60
70
80
0
20
40
60
80
100
120
140
160
No.
of t
axa
MC
I val
ue
SEM: Number of taxa and MCI values in the Manganui River u/s of railway bridge (MGN000195)
MCI value Median MCI to dateNo. of taxa Median no. of taxa to date

67
Taxa List MCI score
A VA XA Total %
Survey
Spring 2015
Summer 2016
MEGALOPTERA (DOBSONFLIES) Archichauliodes 7 4
4 10
TRICHOPTERA (CADDISFLIES) Hydropsyche (Aoteapsyche) 4 15 2
17 40
A
Hydrobiosis 5 1
1 2
Beraeoptera 8 7 4
11 26 A A
Olinga 9
0
A
Pycnocentrodes 5 3 1
4 10
A
DIPTERA (TRUE FLIES) Aphrophila 5 21 2
23 55 A A
Eriopterini 5 3
3 7
Austrosimulium 3 1
1 2
Prior to the current 2015-2016 period, 16 taxa have characterised the community at this site on occasions. These have comprised five ‘highly sensitive’, nine ‘moderately sensitive’, and two ‘tolerant’ taxa i.e. a higher proportion of ‘sensitive’ taxa than might be expected in the mid-reaches of a ringplain stream. Predominant taxa have included two ‘highly sensitive’ taxa [mayflies (Deleatidium and Nesameletus)] and three ‘moderately sensitive’ taxa [mayfly (Coloburiscus), elmid beetles, and cranefly (Aphrophila)]; but no ‘tolerant’ taxa. Four ‘highly sensitive’ taxa and four ‘moderately sensitive taxa’ were dominant in the spring 2015 community while the summer 2016 community had five ‘highly sensitive’ taxa, four ‘moderately sensitive’ taxa’ and one ‘tolerant’ dominant taxa which included a new dominant taxa, the ‘highly sensitive’ caddisfly Olinga (Table 31). Despite some decreases in abundances within some ‘sensitive’ taxa in summer, seasonal SQMCIs values (7.7 and 7.2 units) were relatively similar (Table 141 and Table 142). The three taxa recorded as extremely or very abundant during spring and/or summer had characterised this site’s communities on 31% to 98% of past survey occasions.
Predicted stream ‘health’ 3.2.7.1.3The Manganui River site at SH3 is 8.7 km downstream of the National Park boundary at an altitude of 330 m asl. Relationships for ringplain streams developed between MCI and site altitude and distance from the National Park boundary (Stark and Fowles, 2009) predict MCI values of 118 (altitude) and 107 (distance) for this site. The historical site median (126 units) is seven units higher than the altitude prediction and a significant (Stark, 1998) 19 units above the distance predictive value. The spring 2015 survey score (133 units) was significantly higher by 15 to 26 units than both predictive values while the summer, 2015 score (121 units) was also higher (by three to a significant 14 units) than the predictive values. Of the 44 surveys to date at this site, no MCI scores have been less than 107 units while 91% have been greater than 118 units. The median value for ringplain streams of similar altitude arising within the National Park (TRC, 2015c) was 119 units. The historical site median and summer scores were not significantly different to this value but the spring score was significantly higher (14 units). The REC predicted MCI value (Leathwick, et al. 2009) was 124 units. The historical site median, spring and summer scores were all not significantly different to this value.
Temporal trends in 1995 to 2016 data 3.2.7.1.4A LOWESS trend plot with a moving average (tension 0.4) trendline was produced (Figure 39). A non-parametric statistical trend analysis of the MCI data using the Mann-Kendall test was then performed on 21 years of SEM results (1995-2016) from the site in

68
N = 44 Kendall tau = -0.073 p level = 0.482 FDR p = 0.581
N = 20 Kendall tau = +0.198 p level = 0.221 FDR p = 0.559
the Manganui River at SH3. The MCI has been chosen as the preferable indicator of ‘stream/river health’ for SEM trend reporting purposes.
Figure 39 LOWESS trend plot of MCI data at the SH3 site, Manganui River
A trend of very slight overall decrease in MCI scores was identified (more accentuated over the first twelve years) which however, has not been statistically significant for the 21 year period. The scores (range of 9 units) represented no ecological importance in terms of variability. These trendline consistently indicated ‘very good’ generic river health (Table 2) over the entire period.
Temporal trends in 2006 to 2016 data 3.2.7.1.5A LOWESS trend plot with a moving average (tension 0.4) trendline was produced (Figure 40). A non-parametric statistical trend analysis of the MCI data using the Mann-Kendall test was then performed on the ten most recent years of SEM results (2006-2016) from the site in the Manganui River at SH3.
Figure 40 LOWESS trend plot of MCI data at the SH3 site, Manganui River
A minor, positive, non-significant trend was identified for the ten year period which was largely congruent with the full dataset results and indicated that little change had
MGN000195
1994 1996 1998 2000 2002 2004 2006 2008 2010 2012 2014 2016 2018Year
110
115
120
125
130
135
140
145
MC
I va
lue
MGN000195
2006 2008 2010 2012 2014 2016 2018Year
110
115
120
125
130
135
140
145
MC
I va
lue

69
occurred at the site. The trendline consistently indicated ‘very good’ generic river health (Table 2) over the entire period.
Bristol Road site (MGN000427) 3.2.7.2 Taxa richness and MCI 3.2.7.2.1
Forty surveys have been undertaken at this lower reach site at Bristol Road in the Manganui River between October 1995 and February 2015. These results are summarised in Table 32 together with the results from the current period, and illustrated in Figure 41.
Table 32 Results of previous surveys performed in the Manganui River at Bristol Road together with spring
2015 and summer 2016 results
Site code
SEM data ( 1995 to Feb 2015) 2015-2016 surveys
No of surveys
Taxa numbers MCI values Oct 2015 Feb 2016
Range Median Range Median Taxa no MCI Taxa no MCI
MGN000427 40 15-26 20 77-115 98 23 110 22 95
Figure 41 Numbers of taxa and MCI values in the Manganui River at Bristol Road
A moderate range of richnesses (15 to 26 taxa) has been found with a median richness of 20 taxa which is representative of typical richnesses in ringplain streams and rivers in the lower reaches. During the 2015-2016 period, spring (23 taxa) and summer (22 taxa) richnesses were very similar to each other and to the historical median richness. MCI scores have had a wide range (38 units) at this site, typical of sites in the lower reaches of streams elsewhere on the ringplain although this site was located at an atypically higher altitude of 140 m asl for a lower reach site more than 37 km downstream from the National Park boundary. The median value (98 units) has been higher than typical of lower reach ringplain sites (TRC, 2015c). The spring 2015 score (110 units) was significantly higher (12 units) than the historical median while the lower summer score (95 units) was three units lower than the historical median. These scores categorised this site as having ‘good’ (spring) and ‘fair’ (summer) health generically (Table 2). The historical median score (98 units) placed this site in the ‘fair’ category for generic health. Of the 42 surveys to date at this site, only 13% of MCI scores have been less than 91 units while 40% have been greater than 99 units.
0
10
20
30
40
50
60
70
80
0
20
40
60
80
100
120
140
160
No. o
f tax
a
MCI
val
ue
SEM: Number of taxa and MCI values in the Manganui River at Bristol Road (MGN000427)
MCI value Median MCI to dateNo. of taxa Median no. of taxa to date
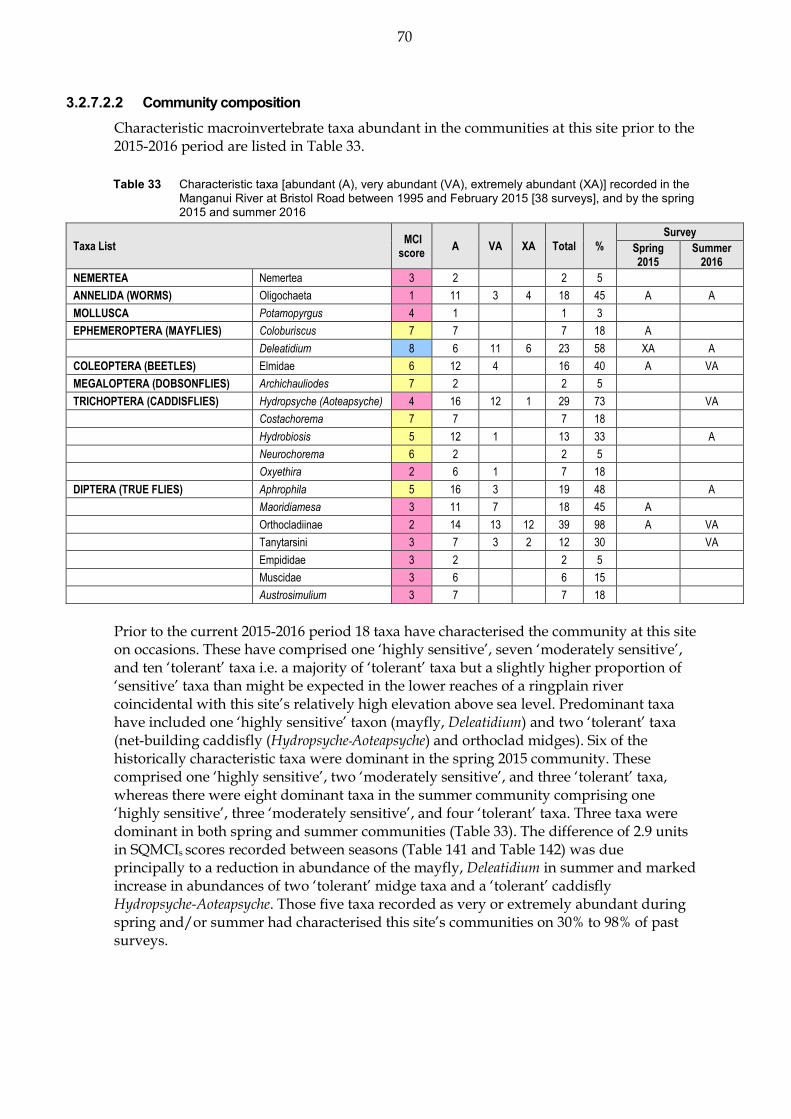
70
Community composition 3.2.7.2.2Characteristic macroinvertebrate taxa abundant in the communities at this site prior to the 2015-2016 period are listed in Table 33.
Table 33 Characteristic taxa [abundant (A), very abundant (VA), extremely abundant (XA)] recorded in the Manganui River at Bristol Road between 1995 and February 2015 [38 surveys], and by the spring 2015 and summer 2016
Taxa List MCI score
A VA XA Total %
Survey
Spring 2015
Summer 2016
NEMERTEA Nemertea 3 2 2 5
ANNELIDA (WORMS) Oligochaeta 1 11 3 4 18 45 A A
MOLLUSCA Potamopyrgus 4 1 1 3
EPHEMEROPTERA (MAYFLIES) Coloburiscus 7 7 7 18 A
Deleatidium 8 6 11 6 23 58 XA A
COLEOPTERA (BEETLES) Elmidae 6 12 4 16 40 A VA
MEGALOPTERA (DOBSONFLIES) Archichauliodes 7 2 2 5
TRICHOPTERA (CADDISFLIES) Hydropsyche (Aoteapsyche) 4 16 12 1 29 73 VA
Costachorema 7 7 7 18
Hydrobiosis 5 12 1 13 33 A
Neurochorema 6 2 2 5
Oxyethira 2 6 1 7 18
DIPTERA (TRUE FLIES) Aphrophila 5 16 3 19 48 A
Maoridiamesa 3 11 7 18 45 A
Orthocladiinae 2 14 13 12 39 98 A VA
Tanytarsini 3 7 3 2 12 30 VA
Empididae 3 2 2 5
Muscidae 3 6 6 15
Austrosimulium 3 7 7 18
Prior to the current 2015-2016 period 18 taxa have characterised the community at this site on occasions. These have comprised one ‘highly sensitive’, seven ‘moderately sensitive’, and ten ‘tolerant’ taxa i.e. a majority of ‘tolerant’ taxa but a slightly higher proportion of ‘sensitive’ taxa than might be expected in the lower reaches of a ringplain river coincidental with this site’s relatively high elevation above sea level. Predominant taxa have included one ‘highly sensitive’ taxon (mayfly, Deleatidium) and two ‘tolerant’ taxa (net-building caddisfly (Hydropsyche-Aoteapsyche) and orthoclad midges). Six of the historically characteristic taxa were dominant in the spring 2015 community. These comprised one ‘highly sensitive’, two ‘moderately sensitive’, and three ‘tolerant’ taxa, whereas there were eight dominant taxa in the summer community comprising one ‘highly sensitive’, three ‘moderately sensitive’, and four ‘tolerant’ taxa. Three taxa were dominant in both spring and summer communities (Table 33). The difference of 2.9 units in SQMCIs scores recorded between seasons (Table 141 and Table 142) was due principally to a reduction in abundance of the mayfly, Deleatidium in summer and marked increase in abundances of two ‘tolerant’ midge taxa and a ‘tolerant’ caddisfly Hydropsyche-Aoteapsyche. Those five taxa recorded as very or extremely abundant during spring and/or summer had characterised this site’s communities on 30% to 98% of past surveys.

71
N = 42 Kendall tau = +0.137 p level = 0.200 FDR p = 0.287
Predicted stream ‘health’ 3.2.7.2.3The Manganui River site at Bristol Road is 37.9 km downstream of the National Park boundary at an altitude of 140 m asl. Relationships for ringplain streams developed between MCI and site altitude and distance from the National park boundary (Stark and Fowles, 2009) predict MCI values of 99 (altitude) and 91 (distance) for this site. The historical site median (98 units) is very similar to the altitude prediction and seven units higher than the predictive distance value, while the spring 2015 survey score (110 units) was significantly higher than the predictive altitude and predictive distance values. The summer score (95 units) was not significantly different to the predictive values. The median value for ringplain streams of similar altitude arising within the National Park (TRC, 2015c) was 119 units. The historical site median and summer scores were not significantly different to this value but the spring score was significantly higher (14 units). The REC predicted MCI value (Leathwick, et al. 2009) was 124 units. The historical site median, spring and summer scores were all not significantly different to this value.
Temporal trends in 1995 to 2016 data 3.2.7.2.4A LOWESS trend plot with a moving average (tension 0.4) trendline was produced (Figure 42). A non-parametric statistical trend analysis of the MCI data using the Mann-Kendall test was then performed on 21 years of SEM results (1995-2016) from the site in the Manganui River at SH3. The MCI has been chosen as the preferable indicator of ‘stream/river health’ for SEM trend reporting purposes.
Figure 42 LOWESS trend plot of MCI data at the Bristol Road site, Manganui River
The slight overall positive trend in MCI scores was not statistically significant. Neither has the ecological variability in the trendline of seven units been of ecological importance. The trendline was indicative of ‘fair’ generic river health at this site almost throughout the 21 year period improving to ‘good’ over the last few years.
Temporal trends in 2006 to 2016 data 3.2.7.2.5A LOWESS trend plot with a moving average (tension 0.4) trendline was produced (Figure 43). A non-parametric statistical trend analysis of the MCI data using the Mann-Kendall test was then performed on the ten most recent years of SEM results (2006-2016) from the site in the Manganui River at SH3.
MGN000427
1994 1996 1998 2000 2002 2004 2006 2008 2010 2012 2014 2016 2018Year
75
80
85
90
95
100
105
110
115
120
MC
I va
lue

72
N = 20 Kendall tau = +0.237 p level = 0.145 FDR p = 0.410
Figure 43 LOWESS trend plot of ten years of MCI data at the Bristol Road site, Manganui River
The positive non-significant trend in MCI scores was congruent with results from the full dataset. The trendline was indicative of ‘fair’ generic river health from 2007-2010 and then improved to ‘good’ health from 2010 onwards.
Discussion 3.2.7.3The seasonal MCI values decreased by a significant 12 units between spring and summer at the mid-reach (SH3) site. Though this was consistent with the historical seasonal median trend where summer scores decreased in summer by seven units though the amount of change was larger than normal. A further, larger, decrease (15 units) was recorded at the lower reach site where the historical median summer score has been six units lower over the twenty-one year period (Appendix II). The larger decrease was due to a higher than normal spring score with the summer score only one unit lower than the historical median. Seasonal communities at the mid-reach site (SH3) shared 14 common taxa (48% of the 29 taxa found at this site in 2015-2016) compared with 14 shared common taxa (44% of the 32 taxa found in 2015-2016) at the lower reach site (Bristol Road), indicating very similar seasonal change in community structure at the lower reach site. The two sites shared 14 common taxa (48% of the 29 taxa) in spring and 14 common taxa (44% of 32 taxa) in summer, indicative of the nearly equivalent dissimilarity in spatial community structures in both spring and summer. MCI score typically fell in a downstream direction in both spring (by 12 units) and typically slightly more so in summer (by 15 units), over a stream distance of 29.2 km downstream from the National Park boundary. Using the long-term median SEM MCI scores for both sites (Appendix II), the amount of decline for spring was seven units and for summer six units. Therefore, the amount of decline over the 2015-2016 period was higher for both spring and summer than the typical amount of decline for the stream.
Maketawa Stream 3.2.8Two sites, originally surveyed as components of the Maketawa catchment baseline investigation (Stark, 2003), were included in the 2002-03 SEM programme in recognition of the fisheries significance of this sub-catchment of the Manganui River catchment. The
MGN000427
2006 2008 2010 2012 2014 2016 2018Year
75
80
85
90
95
100
105
110
115M
CI
valu
e

73
results from the surveys performed in the 2015-2016 monitoring year are presented in Table 143 and Table 144, Appendix I.
Derby Road site (MKW000200) 3.2.8.1 Taxa richness and MCI 3.2.8.1.1
Twenty-nine surveys have been undertaken at this upper reach site in the Maketawa Stream between March 1998 and February 2015. These results are summarised in Table 34 together with the results from the current period, and illustrated in Figure 44.
Table 34 Results of previous surveys performed in the Maketawa Stream at Derby Road together with spring 2015 and summer 2016 results
Site code
SEM data ( 1995 to Feb 2015) 2015-2016 surveys
No of surveys
Taxa numbers MCI values Oct 2015 Feb 2016
Range Median Range Median Taxa no MCI Taxa no MCI
MKW000200 31 8-33 23 100-141 128 29 130 22 120
Figure 44 Number of taxa and MCI values in the Maketawa Stream at Derby Road
A very wide range of richnesses (8 to 33 taxa) has been found as a result of marked reductions in richness due to the impacts of previous headwater erosion events, with a median richness of 23 taxa (slightly lower than typical richnesses found in the upper reaches of ringplain streams and rivers). During the 2015-2016 period, spring (29 taxa) and summer (22 taxa) richnesses were somewhat dissimilar but above this median richness and indicative of recovery from previous erosion events (Figure 44). MCI values have had a very wide range (41 units) at this site, atypical of a site in the upper reaches of a ringplain stream mainly due to headwater erosion effects referenced above. The median value (128 units) however, has been more typical of upper reach sites elsewhere on the ringplain, with the spring 2015 (130 units) and summer 2016 (120 units) scores not significantly different from each other or the historical median (Stark, 1998). These scores categorised this site as having ‘very good’ generic health (Table 2) in both spring and summer. The historical median score (128 units) placed this site in the ‘very good’ category for generic health. Of the 33 surveys to date at this site, 21% of MCI scores have been less than 121 units while 61% have been greater than 123 units.
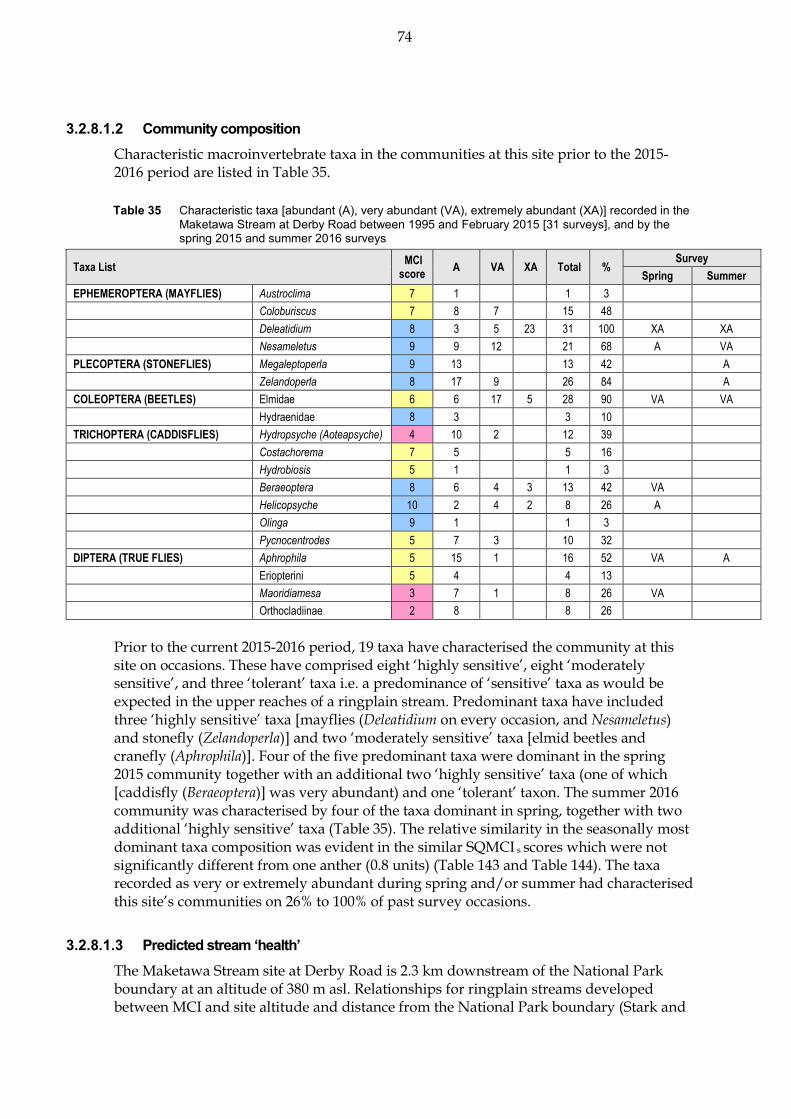
74
Community composition 3.2.8.1.2Characteristic macroinvertebrate taxa in the communities at this site prior to the 2015-2016 period are listed in Table 35.
Table 35 Characteristic taxa [abundant (A), very abundant (VA), extremely abundant (XA)] recorded in the Maketawa Stream at Derby Road between 1995 and February 2015 [31 surveys], and by the spring 2015 and summer 2016 surveys
Taxa List MCI score
A VA XA Total % Survey
Spring Summer
EPHEMEROPTERA (MAYFLIES) Austroclima 7 1 1 3
Coloburiscus 7 8 7 15 48
Deleatidium 8 3 5 23 31 100 XA XA
Nesameletus 9 9 12 21 68 A VA
PLECOPTERA (STONEFLIES) Megaleptoperla 9 13 13 42 A
Zelandoperla 8 17 9 26 84 A
COLEOPTERA (BEETLES) Elmidae 6 6 17 5 28 90 VA VA
Hydraenidae 8 3 3 10
TRICHOPTERA (CADDISFLIES) Hydropsyche (Aoteapsyche) 4 10 2 12 39
Costachorema 7 5 5 16
Hydrobiosis 5 1 1 3
Beraeoptera 8 6 4 3 13 42 VA
Helicopsyche 10 2 4 2 8 26 A
Olinga 9 1 1 3
Pycnocentrodes 5 7 3 10 32
DIPTERA (TRUE FLIES) Aphrophila 5 15 1 16 52 VA A
Eriopterini 5 4 4 13
Maoridiamesa 3 7 1 8 26 VA
Orthocladiinae 2 8 8 26
Prior to the current 2015-2016 period, 19 taxa have characterised the community at this site on occasions. These have comprised eight ‘highly sensitive’, eight ‘moderately sensitive’, and three ‘tolerant’ taxa i.e. a predominance of ‘sensitive’ taxa as would be expected in the upper reaches of a ringplain stream. Predominant taxa have included three ‘highly sensitive’ taxa [mayflies (Deleatidium on every occasion, and Nesameletus) and stonefly (Zelandoperla)] and two ‘moderately sensitive’ taxa [elmid beetles and cranefly (Aphrophila)]. Four of the five predominant taxa were dominant in the spring 2015 community together with an additional two ‘highly sensitive’ taxa (one of which [caddisfly (Beraeoptera)] was very abundant) and one ‘tolerant’ taxon. The summer 2016 community was characterised by four of the taxa dominant in spring, together with two additional ‘highly sensitive’ taxa (Table 35). The relative similarity in the seasonally most dominant taxa composition was evident in the similar SQMCI s scores which were not significantly different from one anther (0.8 units) (Table 143 and Table 144). The taxa recorded as very or extremely abundant during spring and/or summer had characterised this site’s communities on 26% to 100% of past survey occasions.
Predicted stream ‘health’ 3.2.8.1.3The Maketawa Stream site at Derby Road is 2.3 km downstream of the National Park boundary at an altitude of 380 m asl. Relationships for ringplain streams developed between MCI and site altitude and distance from the National Park boundary (Stark and

75
N = 33 Kendall tau = -0.054 p level = 0.659 FDR p = 0.728
Fowles, 2009) predict MCI values of 123 (altitude) and 121 (distance) for this site. The historical site median (128 units) is five units higher than the altitude prediction and seven units above the distance predictive value. The spring 2015 survey score (130 units) was not significantly different (7-9 units higher) than the predictive values while the summer 2016 score (120 units) was also not significantly different (1-3 units higher). The median value for ringplain streams of similar altitude arising within the National Park (TRC, 2015c) was 129 units. The historical site median, spring and summer scores were not significantly different to this value. The REC predicted MCI value (Leathwick, et al. 2009) was 130 units. The historical site median, spring and summer scores were also not significantly different to this value.
Temporal trends in 1998 to 2016 data 3.2.8.1.4A LOWESS trend plot with a moving average (tension 0.4) trendline was produced (Figure 45). A non-parametric statistical trend analysis of the MCI data using the Mann-Kendall test was then performed on 18 years of SEM results (1998-2016) from the site in the Maketawa Stream at Derby Road. The MCI has been chosen as the preferable indicator of ‘stream/river health’ for SEM trend reporting purposes.
Figure 45 LOWESS trend plot of MCI data at the Derby Road site, Maketawa Stream
No significant temporal trend in the overall very slight decline in MCI scores has been found over the 18 year monitoring period at this relatively pristine site. Scores decreased following the headwater erosion events, prior to recovery over the more recent five-year period. The variability in the trendline (range 12 units) represented some ecological importance during the period accentuated by the impact of headwater erosion events during 2008. Overall, the trendline remained indicative of ‘very good’ generic stream health (Table 2) for the majority of the period, dropping toward ‘good’ health briefly between 2008 and 2010.
Temporal trends in 2006 to 2016 data 3.2.8.1.5A LOWESS trend plot with a moving average (tension 0.4) trendline was produced (Figure 46). A non-parametric statistical trend analysis of the MCI data using the Mann-
MKW000200
1996 1998 2000 2002 2004 2006 2008 2010 2012 2014 2016 2018Year
95
100
105
110
115
120
125
130
135
140
145
MC
I va
lue

76
N = 20 Kendall tau = +0.069 p level = 0.669 FDR p = 0.776
Kendall test was then performed on the ten most recent years of SEM results (2006-2016) from the site in the Maketawa Stream at Derby Road.
Figure 46 LOWESS trend plot of ten years of MCI data at the Derby Road site, Maketawa Stream
No significant trend in the MCI scores has been found over the ten year monitoring period. There was a slight positive trend in contrast with the small negative trend of the full dataset but as both trends were highly non-significant the differences were largely meaningless. Overall, the trendline remained indicative of ‘very good’ generic stream health (Table 2) for the majority of the period, dropping toward ‘good’ health briefly between 2008 and 2010 due to the headwater erosion event.
Tarata Road site (MKW000300) 3.2.8.2 Taxa richness and MCI 3.2.8.2.1
Thirty surveys have been undertaken at this mid-reach site at Tarata Road in the Maketawa Stream between March 1998 and February 2016. These results are summarised in Table 36, together with the results from the current period, and illustrated in Figure 47.
Table 36 Results of previous surveys performed in the Maketawa Stream at Tarata Road together with spring 2015 and summer 2016 results
Site code
SEM data ( 1995 to Feb 2015) 2015-2016 surveys
No of surveys
Taxa numbers MCI values Oct 2015 Feb 2016
Range Median Range Median Taxa no MCI Taxa no MCI
MKW000300 30 12-31 22 90-117 107 21 119 22 111
MKW000200
2006 2008 2010 2012 2014 2016 2018Year
95
100
105
110
115
120
125
130
135
140
145
MC
I va
lue

77
Figure 47 Number of taxa and MCI values in the Maketawa Stream at Tarata Road A wide range of richnesses (12 to 31 taxa) has been found; wider than might be expected, with a median richness of 22 taxa which is more representative of typical richnesses in the mid-reaches of ringplain streams and rivers. During the 2015-2016 period, spring (21 taxa) and summer (22 taxa) richnesses were very similar to the median taxa number indicating minimal change in habitat between seasons. MCI scores have had a relatively wide range (27 units) at this site, more typical of sites in the mid to lower reaches of ringplain streams. The median value (107 units) has been relatively typical of mid-reach sites elsewhere on the ringplain (TRC, 2015c). The spring 2015 (119 units) score was the highest recorded value for the site and significantly higher than the median value (12 units) while the summer 2016 (111 units) score was within the range typical for the site and not significantly different to the historical median (4 units) (Stark, 1998). These scores categorized this site as having ‘good’ (spring and summer) health generically (Table 2). The historical median score (107 units) placed this site in the ‘good’ category for generic health. Of the 32 surveys to date at this site, 28% of MCI scores have been less than 100 units while 66% have been greater than 101 units.
Community composition 3.2.8.2.2Characteristic macroinvertebrate taxa abundant in the communities at this site prior to the 2015-2016 period are listed in Table 37.
Table 37 Characteristic taxa [abundant (A), very abundant (VA), extremely abundant (XA)] recorded in the Maketawa Stream at Tarata Road between 1995 and March 2015 [30 surveys], and by the spring 2015 and summer 2016 surveys
Taxa List MCI
score A VA XA Total %
Survey
Spring Summer
ANNELIDA (WORMS) Oligochaeta 1 2 3 2 7 23
EPHEMEROPTERA (MAYFLIES) Austroclima 7 3 3 10
Coloburiscus 7 12 4 16 53 XA A
Deleatidium 8 4 7 10 21 70 XA VA
Nesameletus 9 1 1 3
PLECOPTERA (STONEFLIES) Acroperla 5 1 1 3
COLEOPTERA (BEETLES) Elmidae 6 8 3 11 37 A
MEGALOPTERA (DOBSONFLIES) Archichauliodes 7 3 3 10
TRICHOPTERA (CADDISFLIES) Hydropsyche (Aoteapsyche) 4 11 7 1 19 63 VA

78
Taxa List MCI
score A VA XA Total %
Survey
Spring Summer
Costachorema 7 11 2 13 43 A
Hydrobiosis 5 8 8 27
Neurochorema 6 3 3 10
Beraeoptera 8 3 3 10 A
Confluens 5 2 2 7
Oxyethira 2 1 3 4 13
Pycnocentrodes 5 1 2 3 10
DIPTERA (TRUE FLIES) Aphrophila 5 18 6 24 80 A VA
Maoridiamesa 3 11 9 2 22 73 A A
Orthocladiinae 2 16 8 3 27 90 A VA
Tanytarsini 3 5 3 1 9 30
Empididae 3 1 1 3
Muscidae 3 4 4 13
Austrosimulium 3 1 1 2 7
Prior to the current 2015-2016 period 23 taxa have characterised the community at this site on occasions. These have comprised three ‘highly sensitive’, eleven ‘moderately sensitive’, and nine ‘tolerant’ taxa i.e. a predominance of ‘sensitive’ taxa as might be expected in the mid-reaches of a ringplain stream. Predominant taxa have included one ‘highly sensitive’ taxon [mayfly (Deleatidium)]; two ‘moderately sensitive’ taxa, [mayfly (Coloburiscus) and cranefly (Aphrophila)]; and three ‘tolerant’ taxa [net-building caddisfly (Hydropsyche- Aoteapsyche) and midges (orthoclads and Maoridiamesa)]. Five of these historically predominant characteristic taxa were dominant in the spring 2015 community together with one additional historically characteristic taxon. Overall, these comprised two ‘highly sensitive’, two ‘moderately sensitive’, and two ‘tolerant’ taxa. In contrast, the summer community had eight dominant taxa comprising one ‘highly sensitive’, four ‘moderately sensitive’ and three ‘tolerant‘ taxa (Table 37). In total six characteristic taxa were present in both spring and summer communities but there were significant changes in abundance categories for several of those taxa as well as a large increase in the ‘tolerant’ net-building caddisfly (Hydropsyche- Aoteapsyche) resulting in a significant decrease in SQMCIs score of 2.3 units (Table 143 and Table 144). The two taxa recorded as very or extremely abundant during spring and/or summer had characterised this site’s communities on 53% to 90% of past survey occasions.
Predicted stream ‘health’ 3.2.8.2.3The Maketawa Stream site at Tarata Road is 15.5 km downstream of the National Park boundary at an altitude of 150 m asl. Relationships for ringplain streams developed between MCI and site altitude and distance from the National Park boundary (Stark and Fowles, 2009), predict MCI values of 100 (altitude) and 101 (distance) for this site. The historical site median (107 units) is seven units above the altitude prediction and six units above the predictive distance values while the spring 2015 survey score (119 units) was significantly higher (18-19 units) while the summer score (111 units) was significantly higher than the altitude predictive score (11 units) but not the distance predictive score (10 units). The median value for ringplain streams of similar altitude arising within the National Park (TRC, 2015c) was 102 units. The historical site median and summer scores were not significantly different to this value but the spring value was significantly higher (17

79
N = 32 Kendall tau = +0.397 p level < 0.001 FDR p = 0.004
units). The REC predicted MCI value (Leathwick, et al. 2009) was 111 units. The historical site median, spring and summer scores were also not significantly different to this value.
Temporal trends in 2000 to 2016 data 3.2.8.2.4A LOWESS trend plot with a moving average (tension 0.4) trendline was produced (Figure 48). A non-parametric statistical trend analysis of the MCI data using the Mann-Kendall test was then performed on 16 years of SEM results (2000-2016) from the site in the Maketawa Stream at Tarata Road. The MCI has been chosen as the preferable indicator of ‘stream/river health’ for SEM trend reporting purposes.
Figure 48 LOWESS trend plot of MCI data at the Tarata Road site
The positive trend in MCI scores found over the 16 year monitoring period has been statistically significant (FDR p >0.01). Ecological variability in LOWESS-smoothed scores (which have ranged over 17 units) has been important ecologically with scores indicative of ‘good’ generic stream health (Table 2) trending downward to ‘fair’ stream health, between 2005 and 2009 before returning to ‘good’ health where it currently remains.
Temporal trends in 2006 to 2016 data 3.2.8.2.5A LOWESS trend plot with a moving average (tension 0.4) trendline was produced (Figure 49). A non-parametric statistical trend analysis of the MCI data using the Mann-Kendall test was then performed on ten years of SEM results (2006-2016) from the site in the Maketawa Stream at Tarata Road.

80
N = 20 Kendall tau = +0.614 p level < 0.001 FDR p = 0.008
Figure 49 LOWESS trend plot of ten years of MCI data at the Tarata Road site, Maketawa Stream
The positive trend in MCI scores found over the ten year monitoring period has been statistically highly significant (FDR p >0.01) which was congruent with the full dataset results indicating relative recent improvements in macroinvertebrate health at the site as evidenced in the trendline markedly increasing from 2008 onwards. The trendline was indicative of ‘good’ generic stream health (Table 2) trending downward to ‘fair’ stream health, between 2005 and 2009 before returning to ‘good’ health where it currently remains.
Discussion 3.2.8.3Seasonal MCI values were not significantly different between spring and summer at the upper (Derby Road) site (ten units) and the lower (Tarata Road) site (eight units). Seasonal MCI scores typically fell at both sites with the Derby Road site having a decrease of eight units between spring and summer historical medians and the Tarata Road site a decrease of five units between the spring and summer historical medians (Appendix II). Seasonal communities at the upper reach site shared 20 common taxa (65% of the 31 taxa found at the Derby Road site in 2015-2016) compared with 14 shared common taxa (48% of the 29 taxa found in 2015-2016) at the Tarata Road site. The contrasting seasonal changes in community structures at the two sites were typically more pronounced at the Tarata Road site in the mid reaches of the stream. The two sites shared 17 common taxa (52% of the 33 taxa) in spring and 15 common taxa (52% of 29 taxa) in summer, indicating a reasonably difference in macroinvertebrate community structure between sites for both spring and summer surveys. The spring MCI score for the Tarata site was the highest recorded at the site to date and was congruent with the time trend analysis indicating highly significant improvement in the macroinvertebrate community at the site over time. Improvements in macroinvertebrate health at the site were likely in relation to higher levels of fencing and riparian planting in the catchment in combination with a reduction in point source inputs from farm oxidation ponds with effluent now being discharged to land.
MKW000300
2006 2008 2010 2012 2014 2016 2018Year
85
90
95
100
105
110
115
120
125M
CI
valu
e
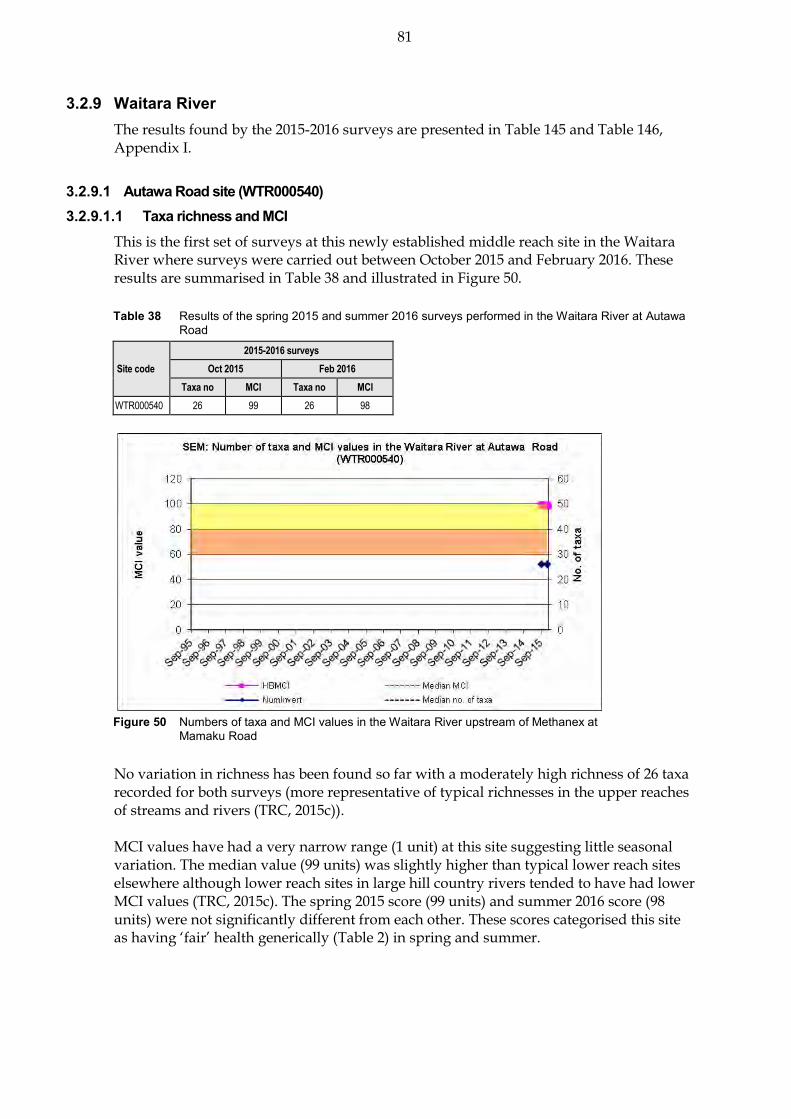
81
Waitara River 3.2.9The results found by the 2015-2016 surveys are presented in Table 145 and Table 146, Appendix I.
Autawa Road site (WTR000540) 3.2.9.1 Taxa richness and MCI 3.2.9.1.1
This is the first set of surveys at this newly established middle reach site in the Waitara River where surveys were carried out between October 2015 and February 2016. These results are summarised in Table 38 and illustrated in Figure 50.
Table 38 Results of the spring 2015 and summer 2016 surveys performed in the Waitara River at Autawa Road
Site code
2015-2016 surveys
Oct 2015 Feb 2016
Taxa no MCI Taxa no MCI
WTR000540 26 99 26 98
Figure 50 Numbers of taxa and MCI values in the Waitara River upstream of Methanex at
Mamaku Road
No variation in richness has been found so far with a moderately high richness of 26 taxa recorded for both surveys (more representative of typical richnesses in the upper reaches of streams and rivers (TRC, 2015c)). MCI values have had a very narrow range (1 unit) at this site suggesting little seasonal variation. The median value (99 units) was slightly higher than typical lower reach sites elsewhere although lower reach sites in large hill country rivers tended to have had lower MCI values (TRC, 2015c). The spring 2015 score (99 units) and summer 2016 score (98 units) were not significantly different from each other. These scores categorised this site as having ‘fair’ health generically (Table 2) in spring and summer.

82
Community composition 3.2.9.2Characteristic macroinvertebrate taxa in the communities at this site for the 2015-2016 period are listed in Table 39.
Table 39 Characteristic taxa [abundant (A), very abundant (VA), extremely abundant (XA)] recorded in the Waitara River at Mamaku Road by the spring 2015 and summer 2016 surveys
Taxa List MCI A VA XA Total %
Survey
Spring 2015
Summer 2016
ANNELIDA (WORMS) Oligochaeta 1 1 1 50 A
MOLLUSCA Potamopyrgus 4 1 1 50 A
EPHEMEROPTERA (MAYFLIES) Austroclima 7 1 1 50 A
Deleatidium 8 1 1 50 XA
PLECOPTERA (STONEFLIES) Acroperla 5 1 1 50 A
COLEOPTERA (BEETLES) Elmidae 6 2 2 100 A A
TRICHOPTERA (CADDISFLIES) Hydropsyche (Aoteapsyche) 4 1 1 50 VA
Pycnocentrodes 5 1 1 50 A
DIPTERA (TRUE FLIES) Aphrophila 5 1 1 2 100 A VA
Orthocladiinae 2 1 1 50 A
Tanytarsini 3 1 1 50 A
There were 11 characteristic taxa recorded at the site during the current 2015-2016 period. The spring survey recorded six characteristic taxa, one ‘highly sensitive’ taxon, three ‘moderately sensitive’ taxa, and two ‘tolerant’ taxa. The only ‘highly sensitive’ taxon, the mayfly Deleatidium, was also the most abundant taxa recorded being extremely abundant during the spring survey. The summer survey recorded seven characteristic taxa, four ‘moderately sensitive’ taxa and three ‘tolerant’ taxa. This was a similar level to the spring survey but only two characteristic taxa occurred during both spring and summer surveys and specifically the mayfly Deleatidium was no longer abundant at the site while the ‘tolerant’ caddisfly Hydropsyche-Aoteapsyche, which was previously not ‘abundant’, was now ‘very abundant’ (Table 39). These changes in characteristic taxa resulted in a large re decrease in SQMCIs scores of 2.4 units from spring to summer which was coincident with an increase in filamentous algae at the site (Table 145 and Table 146).
Predicted stream ‘health’ 3.2.9.2.1The Waitara River site at Autawa Road, at an altitude of 100 m asl, is in the middle reaches of a river draining a catchment comprised of hill country. The median value for ringplain streams of similar altitude for eastern hill country streams (TRC, 2015c) was 93 units. The spring and summer scores were not significantly different to this value. The REC predicted MCI value (Leathwick, et al. 2009) was 110 units. The spring and summer scores were significantly lower than this value.
Temporal trends in 1995 to 2016 data 3.2.9.3Insufficient data exists to perform a time trend analysis on the data.

83
Mamaku Road site (WTR000850) 3.2.9.4 Taxa richness and MCI 3.2.9.4.1
Forty surveys have been undertaken at this lower reach site in the Waitara River between November 1995 and February 2015. These results are summarised in Table 40, together with the results from the current period, and illustrated in Figure 51.
Table 40 Results of previous surveys performed in the Waitara River at Mamaku Road together with spring 2014 and summer 2015 results
Site code
SEM data ( 1995 to Feb 2015) 2015-2016 surveys
No of surveys
Taxa numbers MCI values Oct 2015 Feb 2016
Range Median Range Median Taxa no MCI Taxa no MCI
WTR000850 40 9-32 18 64-107 86 26 100 15 85
Figure 51 Numbers of taxa and MCI values in the Waitara River upstream of Methanex at
Mamaku Road
A very wide range of richnesses (9 to 32 taxa) has been found with a moderate median richness of 19 taxa (more representative of typical richnesses in the lower reaches of streams and rivers (TRC, 2015c)). During the 2015-2016 period, spring and summer richnesses (17 and 16 taxa respectively) were slightly lower than this median richness. MCI values have had a very wide range (43 units) at this site which has not been unusual for sites in the lower reaches of large rivers. The historical median value (86 units) has also been typical of lower reach sites elsewhere although lower reach sites in large hill country rivers tended to have had lower MCI values (TRC, 2015c). The spring 2015 score (100 units) was significantly higher than the historical median coincidental with patchy periphyton mats but no filamentous algal substrate cover. The summer 2016 score (85 units) was significantly lower than the spring survey (15 units) and one unit below the historical median when filamentous algae were widespread during a lengthy low flow period. These scores categorised this site as having ‘good’ health during the spring survey and ‘fair’ health during the summer survey (Table 2). The historical median score (86 units) placed this site in the ‘fair’ category. Of the 42 surveys to date at this river site, 12% of MCI scores have been less than 75 units while 52% have been greater than 86 units.

84
Community composition 3.2.9.5Characteristic macroinvertebrate taxa in the communities at this site prior to the 2015-2016 period are listed in Table 41.
Table 41 Characteristic taxa [abundant (A), very abundant (VA), extremely abundant (XA)] recorded in the Waitara River at Mamaku Road between 1995 and February 2015 [40 surveys], and by the spring 2015 and summer 2016 surveys
Taxa List MCI score
A VA XA Total %
Survey
Spring 2015
Summer 2016
NEMERTEA Nemertea 3 2 2 5
ANNELIDA (WORMS) Oligochaeta 1 11 8 7 26 65
Branchiura 1 1 1 3
Polychaeta 3 2 2 5
MOLLUSCA Latia 5 8 2 10 25
Potamopyrgus 4 10 6 2 18 45 A
CRUSTACEA Tanaidacea 3 1 1 3
Paratya 3 11 2 13 33
EPHEMEROPTERA (MAYFLIES) Deleatidium 8 10 4 14 35 VA
COLEOPTERA (BEETLES) Elmidae 6 1 1 3
TRICHOPTERA (CADDISFLIES) Hydropsyche (Aoteapsyche) 4 9 14 1 24 60 A
Oxyethira 2 9 1 1 11 28 A
Pycnocentrodes 5 4 4 10
DIPTERA (TRUE FLIES) Aphrophila 5 13 2 15 38
Maoridiamesa 3 4 4 10
Orthocladiinae 2 15 11 4 30 75 A A
Tanytarsini 3 9 3 12 30
Austrosimulium 3 1 1 3
Prior to the current 2015-2016 period, 18 taxa have characterised the community at this site on occasions. These have comprised one ‘highly sensitive’, four ‘moderately sensitive’, and thirteen ‘tolerant’ taxa i.e. a high proportion of ‘tolerant’ taxa as would be expected in the lower reaches of a ringplain/hill-country river. Predominant taxa have included only three ‘tolerant’ taxa [oligochaete worms, net-building caddisfly (Hydropsyche- Aoteapsyche), and orthoclad midges]. Only one of the predominant taxa was dominant in the spring 2015 community together with one other historically characteristic ‘highly sensitive’ taxon the mayfly Deleatidium. The summer 2016 community was characterised by four ‘tolerant’ taxa which included only one taxon from the spring 2015 survey (Table 41). As a result of these seasonal differences in characteristic taxa, particularly the decrease in numbers of the ‘highly sensitive’ mayfly taxon and increase in the number of characteristic ‘tolerant’ taxa in the summer survey, there was a highly significant decrease in SQMCIs score of 3.1 units in summer (Table 145 and Table 146). The taxon recorded as very or extremely abundant during spring/summer had characterised this site’s communities on 35% of past survey occasions.
Predicted stream ‘health’ 3.2.9.5.1The Waitara River site at Mamaku Road, at an altitude of 15 m asl, is in the lower reaches of a river draining a catchment comprised of both hill country and ringplain sub-catchments.

85
N = 42 Kendall tau = +0.269 p level = 0.012 FDR p = 0.024
The median value for ringplain streams of similar altitude arising in eastern hill country (TRC, 2015c) was 78 units. The historical site median and summer scores were not significantly different to this value but the spring value was significantly higher (22 units). The REC predicted MCI value (Leathwick, et al. 2009) was 98 units. The historical site median and summer scores were significantly lower than this value (by 12 and 13 units respectively) but the spring score was not significantly different.
Temporal trends in 1996 to 2016 data 3.2.9.6A LOWESS trend plot with a moving average (tension 0.4) was produced (Figure 52). A non-parametric statistical trend analysis of the MCI data using the Mann-Kendall test was then performed on 20 years of SEM results (1996-2016) from the site in the Waitara River at Mamaku Road. The MCI has been chosen as the preferable indicator of ‘stream/river health’ for SEM trend reporting purposes.
Figure 52 LOWESS trend plot of MCI data for the Mamaku Road site, Waitara River
An improvement in MCI scores over the first ten years of monitoring has resulted in an overall significant (p < 0.05 after FDR) positive trend for the 21 year period. This is coincident with work stabilising hill country slopes using vegetation (e.g. poplars) to reduce sediment runoff in this large, predominantly eastern hill country catchment. The trendline range (18 units) has been ecologically important over the period. The trendline has been indicative of a general improvement from ‘poor’ (in the first few years) to ‘fair’ generic river health (Table 2).
Temporal trends in 2006 to 2016 data 3.2.9.7A LOWESS trend plot with a moving average (tension 0.4) trendline was produced (Figure 53). A non-parametric statistical trend analysis of the MCI data using the Mann-Kendall test was then performed on the most recent ten years of SEM results (1996-2016) from the site in the Waitara River at Mamaku Road.
WTR000850
1994 1996 1998 2000 2002 2004 2006 2008 2010 2012 2014 2016 2018Year
60
65
70
75
80
85
90
95
100
105
110
MC
I va
lue

86
N = 20 Kendall tau = +0.085 p level = 0.600 FDR p = 0.753
Figure 53 LOWESS trend plot of ten years of MCI data for the Mamaku Road site, Waitara River
No significant change in MCI scores over the ten years of monitoring has occurred contrasting with the significant improvement from the full dataset. This was largely due to the large improvement over the first ten years of the full 21 year monitoring period. The trendline has been indicative of ‘fair’ generic river health (Table 2).
Discussion 3.2.9.8Seasonal MCI values were not significantly different between spring and summer at the upper (Autawa Road) site (one unit) but were significantly different at the lower (Mamaku Road) site (15 units). MCI scores typically fell in a downstream direction for the Mamaku Road site recording a decrease of ten units between spring and summer historical medians (Appendix II). Seasonal communities at the middle reach site shared 17 common taxa (49% of the 35 taxa found at the Autawa Road site in 2015-2016) compared with 12 shared common taxa (41% of the 29 taxa found in 2015-2016) at the Mamaku Road site. The relatively similar seasonal changes in community structures at the two sites were more pronounced at the Mamaku Road site in the lower reaches of the river. The two sites shared 21 common taxa (68% of the 31 taxa) in spring and 11 common taxa (37% of 30 taxa) in summer, indicating a reasonably difference in macroinvertebrate community structure between sites for the summer survey but not the spring survey. Large increases in filamentous algae during summer contributed to changes in the macroinvertebrate communities at both sites but particularly in the lower reach site causing decreases in MCI (1 and 15 units) and SQMCIs
(2.4 and 3.1 units) scores.
Mangati Stream 3.2.10The results found by the 2015-2016 surveys are presented in Table 147 and Table 148, Appendix I.
WTR000850
2006 2008 2010 2012 2014 2016 2018Year
60
70
80
90
100
110M
CI
valu
e

87
Site downstream of railbrige (MGT000488) 3.2.10.1 Taxa richness and MCI 3.2.10.1.1
Forty-one surveys have been undertaken at this site in the mid reaches of this small lowland, coastal stream draining an industrial catchment between September 1995 and February 2015. These are summarised in Table 42, together with the results from the current period, and illustrated in Figure 54.
Table 42 Results of previous surveys performed in the Mangati Stream at the site downstream of the railbridge, together with spring 2015 and summer 2016 results
Site code
SEM data ( 1995 to Feb 2015) 2015-2016 surveys
No of surveys
Taxa numbers MCI values Nov 2015 Feb 2016
Range Median Range Median Taxa no MCI Taxa no MCI
MGT000488 41 9-29 16 56-91 78 16 81 12 72
Figure 54 Numbers of taxa and MCI values in the Mangati Stream downstream of the railbridge A very wide range of richnesses (9 to 29 taxa) has been found; with a median richness of 16 taxa (a typical richness in Taranaki lowland coastal streams (TRC, 2015c)). During the 2015-2016 period, the spring survey (16 taxa) recorded a higher taxa richness than the summer survey (12 taxa) which had a slightly lower richness than was typical for the site. MCI values have had a wide range (35 units) at this site, relatively typical of a site in a small coastal stream. The median historical value (78 units) has also been typical of such streams and the spring 2015 (81 units) and summer 2016 (72 units) scores were not significantly different to the historical median or from each other (Stark, 1998). These scores categorised this site as having ‘fair’ health in spring and ‘poor’ health in summer (Table 2). The historical median score (78 units) placed this site in the ‘poor’ health category for the generic method of assessment.
Community composition 3.2.10.1.2Characteristic macroinvertebrate taxa in the communities at this site prior to the 2015-2016 period are listed in Table 43.
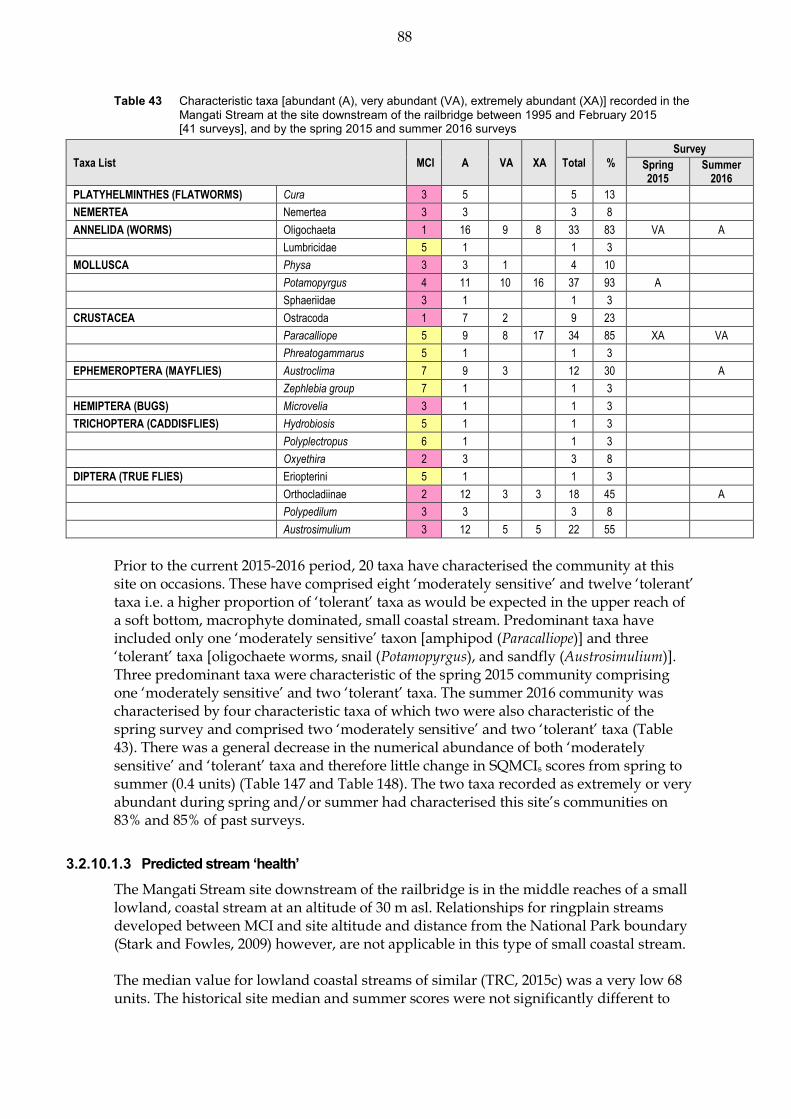
88
Table 43 Characteristic taxa [abundant (A), very abundant (VA), extremely abundant (XA)] recorded in the Mangati Stream at the site downstream of the railbridge between 1995 and February 2015 [41 surveys], and by the spring 2015 and summer 2016 surveys
Taxa List MCI A VA XA Total %
Survey
Spring 2015
Summer 2016
PLATYHELMINTHES (FLATWORMS) Cura 3 5 5 13
NEMERTEA Nemertea 3 3 3 8
ANNELIDA (WORMS) Oligochaeta 1 16 9 8 33 83 VA A
Lumbricidae 5 1 1 3
MOLLUSCA Physa 3 3 1 4 10
Potamopyrgus 4 11 10 16 37 93 A
Sphaeriidae 3 1 1 3
CRUSTACEA Ostracoda 1 7 2 9 23
Paracalliope 5 9 8 17 34 85 XA VA
Phreatogammarus 5 1 1 3
EPHEMEROPTERA (MAYFLIES) Austroclima 7 9 3 12 30 A
Zephlebia group 7 1 1 3
HEMIPTERA (BUGS) Microvelia 3 1 1 3
TRICHOPTERA (CADDISFLIES) Hydrobiosis 5 1 1 3
Polyplectropus 6 1 1 3
Oxyethira 2 3 3 8
DIPTERA (TRUE FLIES) Eriopterini 5 1 1 3
Orthocladiinae 2 12 3 3 18 45 A
Polypedilum 3 3 3 8
Austrosimulium 3 12 5 5 22 55
Prior to the current 2015-2016 period, 20 taxa have characterised the community at this site on occasions. These have comprised eight ‘moderately sensitive’ and twelve ‘tolerant’ taxa i.e. a higher proportion of ‘tolerant’ taxa as would be expected in the upper reach of a soft bottom, macrophyte dominated, small coastal stream. Predominant taxa have included only one ‘moderately sensitive’ taxon [amphipod (Paracalliope)] and three ‘tolerant’ taxa [oligochaete worms, snail (Potamopyrgus), and sandfly (Austrosimulium)]. Three predominant taxa were characteristic of the spring 2015 community comprising one ‘moderately sensitive’ and two ‘tolerant’ taxa. The summer 2016 community was characterised by four characteristic taxa of which two were also characteristic of the spring survey and comprised two ‘moderately sensitive’ and two ‘tolerant’ taxa (Table 43). There was a general decrease in the numerical abundance of both ‘moderately sensitive’ and ‘tolerant’ taxa and therefore little change in SQMCIs scores from spring to summer (0.4 units) (Table 147 and Table 148). The two taxa recorded as extremely or very abundant during spring and/or summer had characterised this site’s communities on 83% and 85% of past surveys.
Predicted stream ‘health’ 3.2.10.1.3The Mangati Stream site downstream of the railbridge is in the middle reaches of a small lowland, coastal stream at an altitude of 30 m asl. Relationships for ringplain streams developed between MCI and site altitude and distance from the National Park boundary (Stark and Fowles, 2009) however, are not applicable in this type of small coastal stream. The median value for lowland coastal streams of similar (TRC, 2015c) was a very low 68 units. The historical site median and summer scores were not significantly different to

89
this value but the spring score was significantly higher (by 13 units). The REC predicted MCI value (Leathwick, et al. 2009) was 80 units. The historical site median, spring and summer scores were significantly lower than this value.
Temporal trends in 1995 to 2016 data 3.2.10.1.4A LOWESS trend plot with a moving average (tension 0.4) trendline was produced (Figure 55). A non-parametric statistical trend analysis of the MCI data using the Mann-Kendall test was then performed on 21 years of SEM results (1995-2016) from the site in the Mangati Stream at the site downstream of the railbridge. The MCI has been chosen as the preferable indicator of ‘stream/river health’ for SEM trend reporting purposes.
Figure 55 LOWESS trend plot of MCI data at the Mangati Stream
site downstream of the railbridge
There was a non-significant positive overall trend identified in the MCI scores. The trendline had a range of nine units indicative of marginal ecological importance over the period. Overall, the trendline was indicative of ‘poor’ generic stream health (Table 2) throughout most of the period.
Temporal trends in 2006 to 2016 data 3.2.10.1.5A LOWESS trend plot with a moving average (tension 0.4) trendline was produced (Figure 56). A non-parametric statistical trend analysis of the MCI data using the Mann-Kendall test was then performed on ten years of SEM results (2006-2016) from the site in the Mangati Stream at the site downstream of the railbridge.
MGT000488
1994 1996 1998 2000 2002 2004 2006 2008 2010 2012 2014 2016 2018Year
50
55
60
65
70
75
80
85
90
95
MC
I va
lue
N = 43 Kendall tau = +0.109 p level = 0.304 FDR p = 0.383

90
Figure 56 LOWESS trend plot of ten years of MCI data at the
Mangati Stream site downstream of the railbridge
There was a non-significant positive overall trend identified in the MCI scores congruent with the full dataset indicating no major change in the macroinvertebrate community at the site. Overall, the trendline remained indicative of ‘poor’ generic stream health (Table 2) throughout most of the period except between 2012-2015 when it was in ‘fair’ health.
Te Rima Place, Bell Block site (MGT000520) 3.2.10.2 Taxa richness and MCI 3.2.10.2.1
Forty-one surveys have been undertaken at this lower reach site at SH45 in the Mangati Stream between October 1995 and February 2015. These results are summarised in Table
44, together with the results from the current period, and illustrated in Figure 57.
Table 44 Results of previous surveys performed in the Mangati Stream at Te Rima Place, Bell Block together with spring 2015 and summer 2016 results
Site code
SEM data ( 1995 to Feb 2015) 2015-2016 surveys
No of surveys
Taxa numbers MCI values Nov 2015 Feb 2016
Range Median Range Median Taxa no MCI Taxa no MCI
MGT000520 41 3-22 10 44-78 65 21 76 14 79
MGT000488
2006 2008 2010 2012 2014 2016 2018Year
50
55
60
65
70
75
80
85
90
95M
CI
valu
e
N = 20 Kendall tau = + 0.257 p level = 0.114 FDR p = 0.341
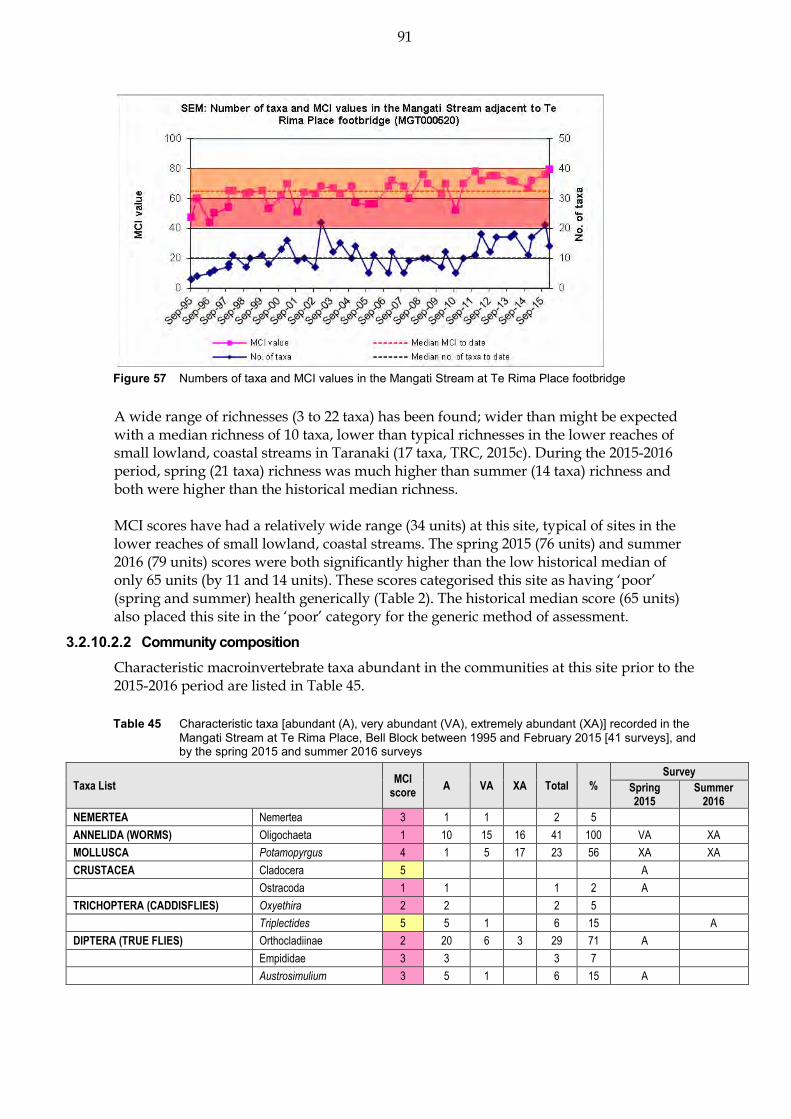
91
Figure 57 Numbers of taxa and MCI values in the Mangati Stream at Te Rima Place footbridge
A wide range of richnesses (3 to 22 taxa) has been found; wider than might be expected with a median richness of 10 taxa, lower than typical richnesses in the lower reaches of small lowland, coastal streams in Taranaki (17 taxa, TRC, 2015c). During the 2015-2016 period, spring (21 taxa) richness was much higher than summer (14 taxa) richness and both were higher than the historical median richness. MCI scores have had a relatively wide range (34 units) at this site, typical of sites in the lower reaches of small lowland, coastal streams. The spring 2015 (76 units) and summer 2016 (79 units) scores were both significantly higher than the low historical median of only 65 units (by 11 and 14 units). These scores categorised this site as having ‘poor’ (spring and summer) health generically (Table 2). The historical median score (65 units) also placed this site in the ‘poor’ category for the generic method of assessment.
Community composition 3.2.10.2.2Characteristic macroinvertebrate taxa abundant in the communities at this site prior to the 2015-2016 period are listed in Table 45.
Table 45 Characteristic taxa [abundant (A), very abundant (VA), extremely abundant (XA)] recorded in the Mangati Stream at Te Rima Place, Bell Block between 1995 and February 2015 [41 surveys], and by the spring 2015 and summer 2016 surveys
Taxa List MCI
score A VA XA Total %
Survey
Spring 2015
Summer 2016
NEMERTEA Nemertea 3 1 1 2 5
ANNELIDA (WORMS) Oligochaeta 1 10 15 16 41 100 VA XA
MOLLUSCA Potamopyrgus 4 1 5 17 23 56 XA XA
CRUSTACEA Cladocera 5 A
Ostracoda 1 1 1 2 A
TRICHOPTERA (CADDISFLIES) Oxyethira 2 2 2 5
Triplectides 5 5 1 6 15 A
DIPTERA (TRUE FLIES) Orthocladiinae 2 20 6 3 29 71 A
Empididae 3 3 3 7
Austrosimulium 3 5 1 6 15 A

92
Prior to the current 2015-2016 period small numbers of taxa (up to nine) have been characteristic of the community at this site on occasions. These have been comprised of one ‘moderately sensitive’ and eight ‘tolerant’ taxa i.e. a majority of ‘tolerant’ taxa as would be expected in the lower reaches of a small lowland, coastal ringplain stream. Predominant taxa have included three ‘tolerant’ taxa [oligochaete worms, snail (Potamopyrgus), and orthoclad midges]. Five historically characteristic taxa (all ‘tolerant’ taxa) and one new characteristic taxon ‘moderately sensitive’ crustacean Cladocera were dominant in the spring 2015 community. There were three characteristic taxa in the summer community comprising one ‘‘moderately sensitive’ taxon and two ‘tolerant’ taxa. The two most numerically abundant taxa, oligochaete worms and mud snails were dominant during both spring and summer surveys (Table 45). The increase in abundance of ‘very tolerant’ oligochaete worms in summer was reflected in the difference in seasonal SQMCIs scores which decreased by 0.9 units in summer (Table 147 and Table 148). The two taxa recorded as very or extremely abundant during spring and/or summer had characterised this site’s communities on 56% to 100% of past surveys.
Predicted stream ‘health’ 3.2.10.2.3The Mangati Stream at Te Rima Place, Bell Block is in the lower, more gravel-bottomed reaches of a small lowland, coastal stream at an altitude of 20 m asl. Relationships for ringplain streams developed between MCI and site altitude and distance from the National Park boundary (Stark and Fowles, 2009) however, are not applicable in this type of small coastal stream. The median value for lowland coastal streams of similar (TRC, 2015c) was 79 units. The spring and summer scores were not significantly different to this value but the historic median was significantly lower (by 14 units). The REC predicted MCI value (Leathwick, et al. 2009) was 88 units. The historical site median and spring scores were significantly lower than this value (by 23 and 12 units) but the summer score was not significantly different.
Temporal trends in 1995 to 2016 data 3.2.10.2.4A LOWESS trend plot with a moving average (tension 0.4) trendline was produced (Figure 58). A non-parametric statistical trend analysis of the MCI data using the Mann-Kendall test was then performed on 21 years of SEM results (1995-2016) from the site in the Mangati Stream at Te Rima Place. The MCI has been chosen as the preferable indicator of ‘stream/river health’ for SEM trend reporting purposes.
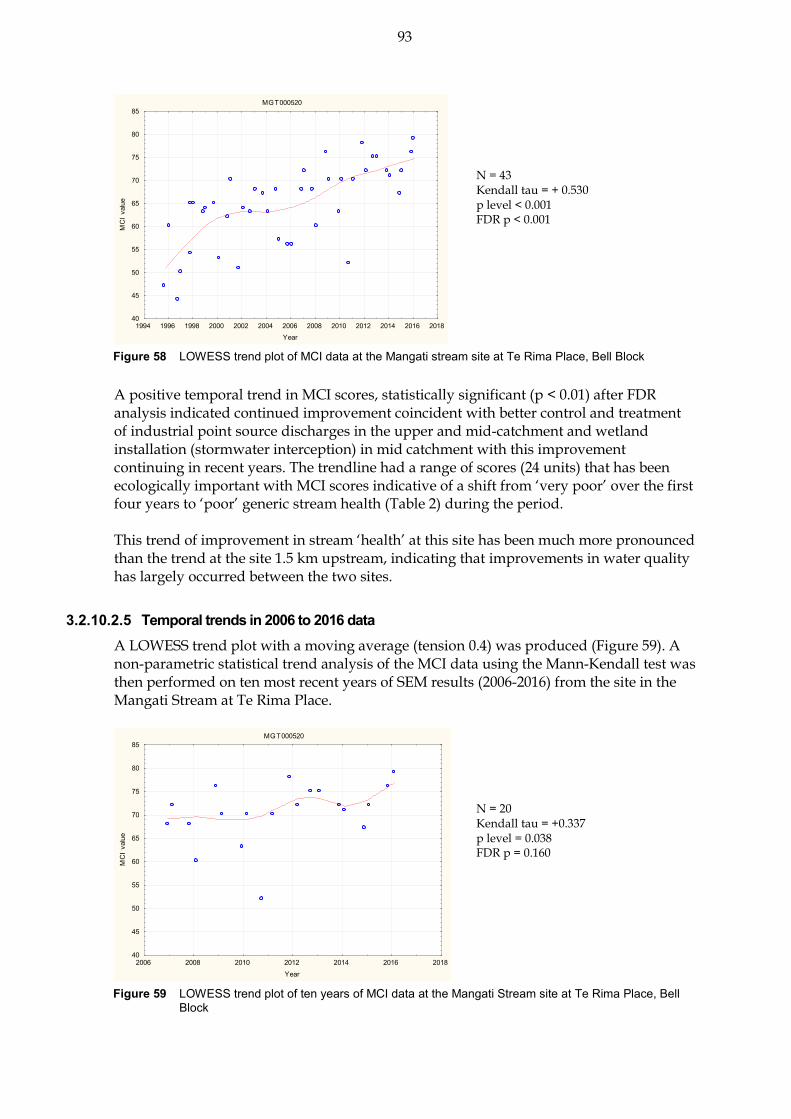
93
Figure 58 LOWESS trend plot of MCI data at the Mangati stream site at Te Rima Place, Bell Block
A positive temporal trend in MCI scores, statistically significant (p < 0.01) after FDR analysis indicated continued improvement coincident with better control and treatment of industrial point source discharges in the upper and mid-catchment and wetland installation (stormwater interception) in mid catchment with this improvement continuing in recent years. The trendline had a range of scores (24 units) that has been ecologically important with MCI scores indicative of a shift from ‘very poor’ over the first four years to ‘poor’ generic stream health (Table 2) during the period. This trend of improvement in stream ‘health’ at this site has been much more pronounced than the trend at the site 1.5 km upstream, indicating that improvements in water quality has largely occurred between the two sites.
Temporal trends in 2006 to 2016 data 3.2.10.2.5A LOWESS trend plot with a moving average (tension 0.4) was produced (Figure 59). A non-parametric statistical trend analysis of the MCI data using the Mann-Kendall test was then performed on ten most recent years of SEM results (2006-2016) from the site in the Mangati Stream at Te Rima Place.
Figure 59 LOWESS trend plot of ten years of MCI data at the Mangati Stream site at Te Rima Place, Bell
Block
MGT000520
1994 1996 1998 2000 2002 2004 2006 2008 2010 2012 2014 2016 2018Year
40
45
50
55
60
65
70
75
80
85M
CI
valu
e
MGT000520
2006 2008 2010 2012 2014 2016 2018Year
40
45
50
55
60
65
70
75
80
85
MC
I va
lue
N = 43 Kendall tau = + 0.530 p level < 0.001 FDR p < 0.001
N = 20 Kendall tau = +0.337 p level = 0.038 FDR p = 0.160
94
There was a positive, non-significant trend after FDR adjustment over the ten year period contrasting with the highly significant, positive trend over the full dataset. Only minor variation in the trendline has occurred over this period with a variation of about seven units over the time period though the trend was significant (p < 0.05) before FDR adjustment. The large improvements over the full dataset, especially over the first ten years are not so apparent in the most recent ten years hence no statistically significant trend. The trendline was indicative of ‘poor’ generic stream health (Table 2) during the period.
Discussion 3.2.10.3Seasonal MCI values showed a non significant decrease of nine units between spring and summer at the upstream site and increased by three units at the lower site. This contrasts with the normally large, significant decrease (18 units) at the upper site during summer but was in keeping with the small, non significant increase (1 unit) at the lower site between the spring and summer historic medians (Appendix II). Both sites were generally healthier than normal with the bottom site recording its highest eve MCI score to date which still classed it as being in ‘poor’ health but was only one unit away from being in ‘fair’ health. Seasonal communities at the upper reach site shared seven common taxa (35% of the 20 taxa found at this site in 2015-2016) compared with ten shared common taxa (40% of the 25 taxa) at the lower reaches site, a more pronounced seasonal change in community structure at the lower reach site. The two sites shared 11 taxa (44% of the 25 taxa) in spring and only four taxa (18% of 22 taxa) in summer, indicative of the dissimilarity in spatial community structures in summer in particular.
Waimoku Stream 3.2.11The results found by the 2015-2016 surveys are presented in Table 149 and Table 150, Appendix I.
Lucy’s Gully site (WMK000100) 3.2.11.1 Taxa richness and MCI 3.2.11.1.1
Thirty-two surveys have been undertaken at this upper reach site in the Waimoku Stream (in the Kaitake Ranges) between December 1999 and March 2015. These results are summarised in Table 46, together with the results from the current period, and illustrated in Figure 60.
Table 46 Results of previous surveys performed in the Waimoku Stream at Lucy’s Gully, together with spring 2015 and summer 2016 results
Site code
SEM data ( 1995 to Mar 2015) 2015-2016 surveys
No of surveys
Taxa numbers MCI values Dec 2015 Feb 2016
Range Median Range Median Taxa no MCI Taxa no MCI
WMK000100 32 22-38 31 121-141 131 33 135 34 128

95
Figure 60 Numbers of taxa and MCI values in the Waimoku Stream at Lucy’s Gully
A moderate range of richnesses (22 to 38 taxa) has been found, with a median richness of 31 taxa which is more representative of typical richnesses in the upper reaches of ringplain streams and rivers. During the 2015-2016 period, spring (33 taxa) and summer (34 taxa) richnesses were very similar, and within three taxa of the historical median richness. MCI values also have had a moderate range (20 units) at this site, slightly wider than typical of a site in the upper reaches of a ringplain stream. The median value (131 units) however, has been typical of upper reach sites elsewhere on the ringplain (TRC, 2015c), and the spring 2015 (135 units) and summer 2016 (128 units) scores were not significantly different from each other or from the historical median (Stark, 1998). These scores categorised this site as having ’very good’ health generically (Table 2) in both spring and summer surveys. The historical median score (131 units) placed this site in the ‘very good’ health category. Of the 34 surveys to date at this site, no MCI scores have been less than 101 units while 35% have been greater than 132 units.
Community composition 3.2.11.1.2Characteristic macroinvertebrate taxa in the communities at this site prior to the 2015-2016 period are listed in Table 47.
Table 47 Characteristic taxa [abundant (A), very abundant (VA), extremely abundant (XA)] recorded in the Waimoku Stream at Lucy’s Gully between 1999 and March 2015 [32 surveys], and by the spring 2015 and summer 2016 surveys
Taxa List MCI
score A VA XA Total %
Survey
Spring 2015
Summer 2016
ANNELIDA (WORMS) Oligochaeta 1 2 1 3 9
MOLLUSCA Potamopyrgus 4 5 5 15
EPHEMEROPTERA (MAYFLIES) Austroclima 7 15 8 1 24 73 VA
Coloburiscus 7 6 26 1 33 100 A A
Deleatidium 8 16 13 29 88 A
Ichthybotus 8 1 1 3
Zephlebia group 7 19 10 29 88 VA A
PLECOPTERA (STONEFLIES) Austroperla 9 25 25 76 A A

96
Taxa List MCI
score A VA XA Total %
Survey
Spring 2015
Summer 2016
Stenoperla 10 2 2 6
Zelandobius 5 1 1 3
COLEOPTERA (BEETLES) Elmidae 6 2 2 6
Ptilodactylidae 8 5 5 15
MEGALOPTERA (DOBSONFLIES) Archichauliodes 7 3 1 4 12
TRICHOPTERA (CADDISFLIES) Hydrobiosella 9 7 7 21 A
Hydropsyche (Orthopsyche) 9 14 19 33 100 VA VA
DIPTERA (TRUE FLIES) Orthocladiinae 2 16 2 1 19 58 A
Polypedilum 3 7 1 8 24 A
Prior to the current 2015-2016 period, 17 taxa have characterised the community at this site on occasions. These have comprised seven ‘highly sensitive’, six ‘moderately sensitive’, and four ‘tolerant’ taxa i.e. a very high proportion of ‘sensitive’ taxa as would be expected in the upper reaches of a ringplain stream within the National Park’s Kaitake Ranges. Predominant taxa have included three ‘highly sensitive’ taxa [mayfly (Deleatidium), stonefly (Austroperla), and free-living caddisfly (Hydropsyche-Orthopsyche)]; three ‘moderately sensitive’ taxa [mayflies (Austroclima, Coloburiscus, and Zephlebia group)]; and one ‘tolerant’ taxon [orthoclad midges]. Four of these predominant taxa were characteristic of the spring 2015 community together with one other ‘tolerant’ taxon. The summer 2016 community was characterised by all seven predominant taxa and one ‘highly sensitive’ taxon. Four characteristic taxa occurred during both spring and summer surveys (Table 47). Though there were changes in the numerical abundance within the characteristic taxa these did not result in any significant change in SQMCIs scores (0.4 units) between surveys. Taxa recorded as very abundant during spring and/or summer had characterised this site’s communities on 73% to 100% of past surveys.
Predicted stream ‘health’ 3.2.11.1.3The Waimoku Stream site at Lucy’s Gully is within the Kaitake Ranges of the National Park boundary but at an altitude of 160 m asl and only 4km from the coast. Relationships for ringplain streams developed between MCI and site altitude and distance from the National Park boundary (Stark and Fowles, 2009) predict MCI values of 101 (altitude) and 132 (distance) for this site. The historical site median (131 units) is significantly 30 units higher than the altitude prediction and one unit less than the distance predictive value. The spring 2015 survey score (135 units) was four units above the distance predictive value while the summer score (128 units) was three units below the distance predictive value. The median value for lowland coastal streams of similar (TRC, 2015c) was 108 units. The historical median, spring and summer scores were all significantly higher indicating that the site had healthier macroinvertebrate communities compared with similar streams in Taranaki. The REC predicted MCI value (Leathwick, et al. 2009) was 128 units. The historical site median, spring and summer scores were not significantly different to that score.
97
Temporal trends in 2000 to 2016 data 3.2.11.1.4A LOWESS trend plot with a moving average (tension 0.4) trendline was produced (Figure 61). A non-parametric statistical trend analysis of the MCI data using the Mann-Kendall test was then performed on 16 years of SEM results (2000-2016) from the site in the Waimoku Stream at Lucy’s Gully. The MCI has been chosen as the preferable indicator of ‘stream/river health’ for SEM trend reporting purposes.
Figure 61 LOWESS trend plot of MCI data at the Lucy’s Gully site, Waimoku Stream
No significant temporal trend in MCI scores has been found over the seventeen year period at this pristine site within the National Park. The trendline range of scores (four units) has not been ecologically important and these MCI scores have continuously indicated ‘very good’ generic stream health (Table 2).
Temporal trends in 2006 to 2016 data 3.2.11.1.5A LOWESS trend plot with a moving average (tension 0.4) trendline was produced (Figure 62). A non-parametric statistical trend analysis of the MCI data using the Mann-Kendall test was then performed on ten years of SEM results (2006-2016) from the site in the Waimoku Stream at Lucy’s Gully.
Figure 62 LOWESS trend plot of ten years of MCI data at the Lucy’s Gully site, Waimoku Stream
WMK000100
1998 2000 2002 2004 2006 2008 2010 2012 2014 2016 2018Year
120
122
124
126
128
130
132
134
136
138
140
142
MC
I va
lue
WMK000100
2006 2008 2010 2012 2014 2016 2018Year
120
122
124
126
128
130
132
134
136
138
140
142
MC
I va
lue
N = 34 Kendall tau = +0.013 p level = 0.915 FDR p = 0.932
N = 20 Kendall tau = -0.011 p level = 0.947 FDR p = 0.974

98
No significant temporal trend in MCI scores has been found over the ten year period at this pristine site within the National Park congruent with the results of the full dataset. The trendline has continuously indicated ‘very good’ generic stream health (Table 2).
Oakura Beach site (WMK000298) 3.2.11.2 Taxa richness and MCI 3.2.11.2.1
Thirty surveys have been undertaken at this lower reach site at Oakura Beach in the Waimoku Stream between December 1999 and March 2015. These results are summarised in Table 46, together with the results from the current period, and illustrated in Figure 63.
Table 48 Results of previous surveys performed in the Waimoku Stream at Oakura Beach together with spring 2015 and summer 2016 results
Site code
SEM data ( 1995 to Mar 2015) 2015-2016 surveys
No of surveys
Taxa numbers MCI values Dec 2015 Feb 2016
Range Median Range Median Taxa no MCI Taxa no MCI
WMK000298 32 10-27 21 75-101 92 29 105 24 96
Figure 63 Numbers of taxa and MCI values in the Waimoku Stream at Oakura Beach
A wide range of richness (10 to 27 taxa) has been found; wider than might be expected, with a median richness of 20 taxa which was more representative of typical richnesses in ringplain streams and rivers in the lower reaches. During the 2015-2016 period, spring (29 taxa) and summer (24 taxa) richnesses were relatively similar and within two taxa of the median taxa number coincident with patchy periphyton substrate cover in spring and more widespread cover in summer. MCI scores have had a relatively wide range (26 units) at this site, typical of sites in the lower reaches of ringplain streams. The historical median value (92 units) has been relatively typical of lower reach sites elsewhere on the ringplain though this stream has a reasonably intact catchment so might be expected to have a higher historical median than what it actually does. The spring 2015 (105 units) score was significantly higher than the historical median (by 13 units) and was also the highest recorded MCI score at the site to date while the summer 2016 (96 units) score was not significantly different to the
99
historical median. These scores categorised this site as having ‘good’ (spring) and ‘fair’ (summer) health generically (Table 2). The historical median score (92 units) placed this site in the ‘fair’ category for health. Of the 34 surveys to date at this site, 20% of MCI scores have been less than 85 units while no scores have been greater than 105 units.
Community composition 3.2.11.2.2Characteristic macroinvertebrate taxa in the communities at this site prior to the 2015-2016 period are listed in Table 49.
Table 49 Characteristic taxa [abundant (A), very abundant (VA), extremely abundant (XA)] recorded in the
Waimoku Stream at Oakura Beach between 1999 and March 2015 [32 surveys], and by the spring 2015 and summer 2016 surveys
Taxa List MCI score
A VA XA Total %
Survey
Spring 2015
Summer 2016
NEMERTEA Nemertea 3 3 3 9
ANNELIDA (WORMS) Oligochaeta 1 16 7 1 24 75
MOLLUSCA Potamopyrgus 4 4 9 9 22 69 XA XA
Sphaeriidae 3 1 1 3
CRUSTACEA Ostracoda 1 1 1 3
Paratya 3 1 1 3
EPHEMEROPTERA (MAYFLIES) Austroclima 7 7 7 22 VA A
Coloburiscus 7 5 5 16 VA
Deleatidium 8 2 2 6
Zephlebia group 7 2 2 6 A
COLEOPTERA (BEETLES) Elmidae 6 1 1 2 6
TRICHOPTERA (CADDISFLIES) Hydrobiosis 5 6 6 19 A A
Oxyethira 2 3 3 9
Pycnocentrodes 5 1 1 3 A
Triplectides 5 4 4 13
DIPTERA (TRUE FLIES) Aphrophila 5 8 8 25
Maoridiamesa 3 3 3 9 A VA
Orthocladiinae 2 12 11 7 30 94 A VA
Polypedilum 3 4 1 5 16 A VA
Empididae 3 2 2 6
Austrosimulium 3 10 2 12 38
Prior to the current 2015-2016 period 19 taxa have characterised the community at this site on occasions. These have comprised one ‘highly sensitive’, six ‘moderately sensitive’, and twelve ‘tolerant’ taxa i.e. a majority of ‘tolerant’ taxa as would be expected in the lower reaches of a ringplain stream. Predominant taxa have included no ‘highly’ or ‘moderately sensitive’ taxa, but three ‘tolerant’ taxa [oligochaete worms, snail (Potamopyrgus), and orthoclad midges]. Eight of the historically characteristic taxa were dominant in the spring 2015 community. These included four ‘moderately sensitive’ and four ‘tolerant’ taxa. There were seven characteristic taxa in the summer survey comprising three ‘moderately sensitive’ and four ‘tolerant’ taxa. There were a high number of taxa (six taxa) that were dominant in both spring and summer communities (Table 49). However, due to increases in the numerical dominance within several characteristic ‘tolerant’ taxa and decreases in the numerical abundance in two ‘moderately sensitive’ characteristic taxa during summer there was a significant decrease in SQMCIS score (1.1 units) between
100
seasons. The taxa recorded as very or extremely abundant during spring and/or summer has characterised this site’s communities on 16% to 94% of past surveys’ occasions.
Predicted stream ‘health’ 3.2.11.2.3The Waimoku Stream at Oakura Beach site at an altitude of 1 m asl is only 4 km downstream of the National Park boundary. Relationships for ringplain streams developed between MCI and site altitude and distance from the National Park boundary (Stark and Fowles, 2009) predict MCI values of 85 (altitude) and 116 (distance) for this site. The historical site median (92 units) is slightly higher (by seven units) than the altitude prediction but a significant 24 units lower than the predictive distance value, due to the atypically short distance between the National Park boundary and the coast for a ringplain stream. The spring 2015 and summer 2016 scores (105 and 96 units) were higher than the predictive altitude value by a significant 20 units and 11 units and significantly lower than the distance predictive value by 11 and 20 units. The median value for ringplain streams of similar altitude (TRC, 2015c) was 90 units. The historical median, spring and summer scores were all significantly higher indicating that the site had healthier macroinvertebrate communities compared with similar streams in Taranaki. The REC predicted MCI value (Leathwick, et al. 2009) was 103 units. The historical site median, spring and summer scores were not significantly different to that score.
Temporal trends in 2000 to 2016 data 3.2.11.2.4A LOWESS trend plot with a moving average (tension 0.4) trendline was produced (Figure 64). A non-parametric statistical trend analysis of the MCI data using the Mann-Kendall test was then performed on 16 years of SEM results (2000-2016) from the site in the Waimoku Stream at Oakura Beach. The MCI has been chosen as the preferable indicator of ‘stream/river health’ for SEM trend reporting purposes.
Figure 64 LOWESS trend plot of MCI data at the Oakura Beach site, Waimoku Stream
An overall positive significant trend in MCI scores has been recorded during the sixteen year monitoring period (FDR p < 0.01) indicating an improvement in macroinvertebrate health. The range of trendline scores (13 units) has been of ecological significance over
WMK000298
1998 2000 2002 2004 2006 2008 2010 2012 2014 2016 2018Year
70
75
80
85
90
95
100
105
110
MC
I va
lue
N = 34 Kendall tau = +0.378 p level = 0.002 FDR p = 0.004

101
this period. Improvements in the amount of riparian fencing and planting of waterways in the catchment have probably contributed to these ecologically significant The trendline has consistently indicated ‘fair’ generic stream health (Table 2) at this site in the lower reaches of the stream.
Temporal trends in 2006 to 2016 data 3.2.11.2.5A LOWESS trend plot with a moving average (tension 0.4) trendline was produced (Figure 65). A non-parametric statistical trend analysis of the MCI data using the Mann-Kendall test was then performed on ten most recent years of SEM results (2006-2016) from the site in the Waimoku Stream at Oakura Beach.
Figure 65 LOWESS trend plot of ten years of MCI data at the Oakura Beach site, Waimoku Stream
A positive non-significant trend in MCI scores has been recorded during the ten year monitoring period contrasting with the positive highly significant improvement found in the full dataset. Some improvement was apparent in the trend plot from 2007 to 2008 and 2012 onwards but overall the trend was not strong enough to be statistically significant. The trendline has consistently indicated ‘fair’ generic stream health (Table 2) at this site in the lower reaches of the stream.
Discussion 3.2.11.3Spring and summer scores were not significantly different from each other or from the historical median at the upper reach Lucy’s Gully site and lower reach Oakura Beach. This suggested that there was little seasonal change in macroinvertebrate community health at both sites which was consistent with past survey results (Appendix II). Seasonal communities at the upper reach site shared 27 common taxa (68% of the 40 taxa) compared with 21 shared common taxa (66% of the 32 taxa) at the); a very similar but atypical seasonal difference in community structure as the lower site usually had a lower proportion of shared taxa. The two sites shared 15 common taxa (32% of the 47 taxa) in spring and 15 common taxa (35% of 43 taxa) in summer, indicative of the dissimilarity in spatial community structures in spring and to a slightly lesser extent in summer.
WMK000298
2006 2008 2010 2012 2014 2016 2018Year
70
75
80
85
90
95
100
105
110
MC
I va
lue
N = 20 Kendall tau = +0.220 p level = 0.175 FDR p = 0.471
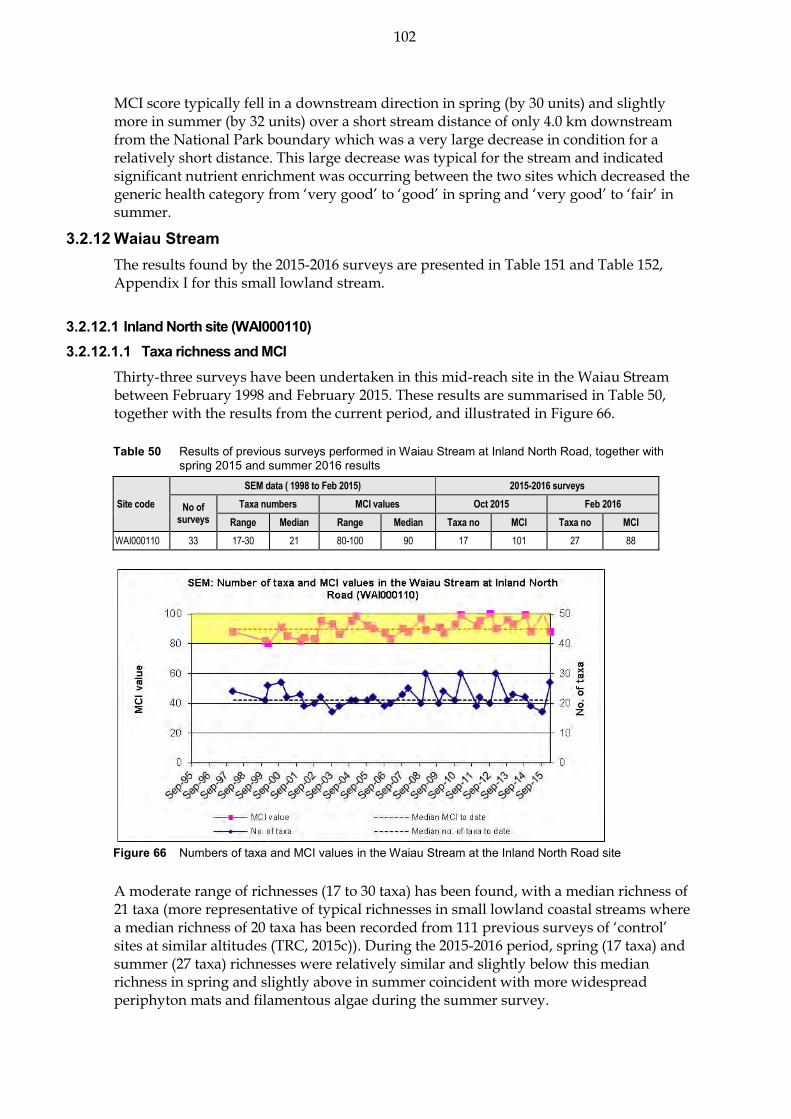
102
MCI score typically fell in a downstream direction in spring (by 30 units) and slightly more in summer (by 32 units) over a short stream distance of only 4.0 km downstream from the National Park boundary which was a very large decrease in condition for a relatively short distance. This large decrease was typical for the stream and indicated significant nutrient enrichment was occurring between the two sites which decreased the generic health category from ‘very good’ to ‘good’ in spring and ‘very good’ to ‘fair’ in summer.
Waiau Stream 3.2.12The results found by the 2015-2016 surveys are presented in Table 151 and Table 152, Appendix I for this small lowland stream.
Inland North site (WAI000110) 3.2.12.1 Taxa richness and MCI 3.2.12.1.1
Thirty-three surveys have been undertaken in this mid-reach site in the Waiau Stream between February 1998 and February 2015. These results are summarised in Table 50, together with the results from the current period, and illustrated in Figure 66.
Table 50 Results of previous surveys performed in Waiau Stream at Inland North Road, together with spring 2015 and summer 2016 results
Site code
SEM data ( 1998 to Feb 2015) 2015-2016 surveys
No of surveys
Taxa numbers MCI values Oct 2015 Feb 2016
Range Median Range Median Taxa no MCI Taxa no MCI
WAI000110 33 17-30 21 80-100 90 17 101 27 88
Figure 66 Numbers of taxa and MCI values in the Waiau Stream at the Inland North Road site
A moderate range of richnesses (17 to 30 taxa) has been found, with a median richness of 21 taxa (more representative of typical richnesses in small lowland coastal streams where a median richness of 20 taxa has been recorded from 111 previous surveys of ‘control’ sites at similar altitudes (TRC, 2015c)). During the 2015-2016 period, spring (17 taxa) and summer (27 taxa) richnesses were relatively similar and slightly below this median richness in spring and slightly above in summer coincident with more widespread periphyton mats and filamentous algae during the summer survey.

103
MCI values have had a moderate range (20 units) to date at this site. The median value (90 units) is more typical of scores at sites in the lower reaches of small lowland streams and rivers, however. The spring 2015 (101 units) score was significantly higher than the historical maximum by 11 units (Stark, 1998), while the summer score (88 units) was not significantly different. These scores categorised this site as having ‘good’ (spring) and ‘fair’ (summer) health (Table 2). The historical median score (90 units) placed this site in the ‘fair’ category for the generic method of assessment.
Community composition 3.2.12.1.2Characteristic macroinvertebrate taxa in the communities at this site prior to the 2015-2016 period are listed in Table 51.
Table 51 Characteristic taxa [abundant (A), very abundant (VA), extremely abundant (XA)] recorded in the Waiau Stream at Inland North Road between 1998 and February 2015 [33 surveys], and by the spring 2015 and summer 2016 surveys
Taxa List MCI A VA XA Total %
Survey
Spring 2015
Summer 2016
NEMERTEA Nemertea 3 4 4 12
ANNELIDA (WORMS) Oligochaeta 1 16 6 22 67 A A
MOLLUSCA Latia 5 12 12 36 A
Potamopyrgus 4 5 16 11 32 97 A XA
CRUSTACEA Paracalliope 5 10 5 1 16 48
EPHEMEROPTERA (MAYFLIES) Austroclima 7 14 15 1 30 91 VA A
Coloburiscus 7 1 1 3
PLECOPTERA (STONEFLIES) Zelandobius 5 1 1 3 A
COLEOPTERA (BEETLES) Elmidae 6 6 22 5 33 100 VA VA
MEGALOPTERA (DOBSONFLIES) Archichauliodes 7 A
TRICHOPTERA (CADDISFLIES) Hydropsyche (Aoteapsyche) 4 16 14 1 31 94 A VA
Hydrobiosis 5 12 12 36 A
Hudsonema 6 3 3 9
Oxyethira 2 7 7 21 A
Pycnocentria 7 12 3 15 45 A VA
Pycnocentrodes 5 13 12 2 27 82 VA VA
DIPTERA (TRUE FLIES) Aphrophila 5 14 2 16 48 A
Maoridiamesa 3 1 1 3
Orthocladiinae 2 18 5 23 70 A A
Polypedilum 3 1 1 3
Tanytarsini 3 1 1 3
Austrosimulium 3 6 6 18
ACARINA (MITES) Acarina 5 1 1 3
Prior to the current 2015-2016 period, 23 taxa had characterised the community at this site on occasions. These have comprised 13 ‘moderately sensitive’ and ten ‘tolerant’ taxa i.e. an absence of ‘highly sensitive’ taxa and a relatively high proportion of ‘tolerant’ taxa as would be expected in the mid reaches of a lowland, coastal stream. Predominant taxa have included four ‘moderately sensitive’ taxa [amphipod (Paracalliope), mayfly (Austroclima), elmid beetles, and stony-cased caddisfly

104
(Pycnocentrodes)] and four ‘tolerant’ taxa [oligochaete worms, snail (Potamopyrgus), net-building caddisfly (Hydropsyche -Aoteapsyche), and orthoclad midges]. Nine of the historically characteristic taxa were dominant in the spring 2015 community and comprised six of the predominant taxa. The summer 2016 community was characterised by 12 taxa, six of which were also dominant in the spring survey (Table 51). Despite some decreases in the numerical abundance of some ‘moderately sensitive’ taxa and increases in ‘tolerant’ at the time of the summer survey there was minimal change in SQMCIs scores (0.8 unit) between seasons (Table 151 and Table 152). All taxa which were recorded as very and/or extremely abundant during spring and/or summer had characterised this site’s communities on 45% to 100% of past surveys.
Predicted stream ‘health’ 3.2.12.1.3The Waiau Stream rises at an elevation of less than 100 m asl as seepage beyond the ringplain and the site at Inland North Road is in the mid reaches at an altitude of 50 m asl. Relationships for ringplain streams developed between MCI and site altitude (Stark and Fowles, 2009), therefore are not applicable in this type of small lowland coastal stream. The median value for coastal streams of similar altitude (TRC, 2015c) was 78 units. The historical median and spring scores were significantly higher than the median value but there was no significant difference for the summer survey. The REC predicted MCI value (Leathwick, et al. 2009) was 103 units. The historical site median and summer scores were significantly lower than this value but there was no significant difference for the spring survey.
Temporal trends in 1998 to 2016 data 3.2.12.1.4A LOWESS trend plot with a moving average (tension 0.4) trendline was produced (Figure 67). A non-parametric statistical trend analysis of the MCI data using the Mann-Kendall test was then performed on 17 years of SEM results (1998-2016) from the site in the Waiau Stream at Inland North Road. The MCI has been chosen as the preferable indicator of ‘stream/river health’ for SEM trend reporting purposes.
Figure 67 LOWESS trend plot of MCI data at the Inland North
Road site, Waiau Stream
N = 35 Kendall tau = +0.387 p level = 0.001 FDR p = 0.003

105
A significant positive temporal trend in MCI scores has been found (FDR p < 0.01) over the 17 year monitoring term at this site. The trend had two dips where scores declined and the current period is in the second of the two dips. The trendline range of scores (11 units) has been of significant ecological importance. Trendline scores have been indicative of ‘fair’ generic stream health (Table 2) throughout the period.
Temporal trends in 2006 to 2016 data 3.2.12.1.5A LOWESS trend plot with a moving average (tension 0.4) trendline was produced (Figure 68). A non-parametric statistical trend analysis of the MCI data using the Mann-Kendall test was then performed on the most recent ten years of SEM results (2006-2016) from the site in the Waiau Stream at Inland North Road.
Figure 68 LOWESS trend plot of ten years of MCI data at the
Inland North Road site, Waiau Stream
A non-significant positive trend in MCI scores after FDR adjustment was found in contrast with the highly significant result from the full dataset. However, the trend was significant prior to FDR adjustment. The trendline shows a marked increase from 2007-2012 but a subsequent decrease from 2012 onwards meant the overall positive trend was weak. The trendline range of scores have been indicative of ‘fair’ generic stream health (Table 2) throughout the period.
Discussion 3.2.12.2Seasonal MCI values typically decreased between spring and summer by a significant 13 units at this mid reach site of a lowland stream coincident with a more widespread seasonal increase in periphyton mats substrate cover. Historical seasonal median scores (Appendix II) have indicated a four unit summer decrease at this site. Seasonal communities at this site shared 15 common taxa (52% of the 29 taxa found at this site in 2015-2016), a moderate percentage of common taxa for this mid reach site in a lowland, coastal stream. The large, significant, seasonal difference of 13 units in MCI values reflected a drop in the health of the macroinvertebrate community during summer at the site which was likely
WAI000110
2006 2008 2010 2012 2014 2016 2018Year
78
80
82
84
86
88
90
92
94
96
98
100
102
MC
I va
lue
N = 20 Kendall tau = +0.349 p level = 0.032 FDR p = 0.147

106
due to a combination of seasonal factors (warmer water temperatures and less flushing flows) and nutrient enrichment promoting periphyton growth at the site.
Punehu Stream 3.2.13The results of the spring and summer (2015-2016) surveys are summarised in Table 153 and Table 154, Appendix I.
Wiremu Road site (PNH000200) 3.2.13.1 Taxa richness and MCI 3.2.13.1.1
Forty surveys have been undertaken in the Punehu Stream between October 1995 and February 2015 at this open, upper mid-reach site in farmland, 4 km downstream of the National Park These results are summarised in Table 52 together with the results from the current period, and illustrated in Figure 69.
Table 52 Results of previous surveys performed in the Punehu Stream at Wiremu Road together with spring 2015 and summer 2016 results
Site code
SEM data ( 1995 to Feb 2015) 2015-2016 surveys
No of surveys
Taxa numbers MCI values Oct 2015 Mar 2016
Range Median Range Median Taxa no MCI Taxa no MCI
PNH000200 40 19-31 27 104-137 122 30 124 29 129
Figure 69 Numbers of taxa and MCI values in the Punehu Stream at Wiremu Road
A moderate range of richnesses (19 to 31 taxa) has been found with a median richness of 27 taxa (more representative of typical richnesses in the mid reaches of ringplain streams and rivers (TRC, 2015c)). During the 2015-2016 period, spring richness (30 taxa) and summer (29 taxa) richnesses were very similar to each other and to the median richness. MCI values have had a moderate range (33 units) at this site, typical of a site in the (upper) mid reaches of a ringplain stream in more open farmland. The median value (123 units) has been typical of mid reach sites elsewhere on the ringplain (TRC, 2015c). The spring 2015 (133 units) and summer 2015 (126 units) scores were not significantly different from each other or to the historical median (Stark, 1998). These scores
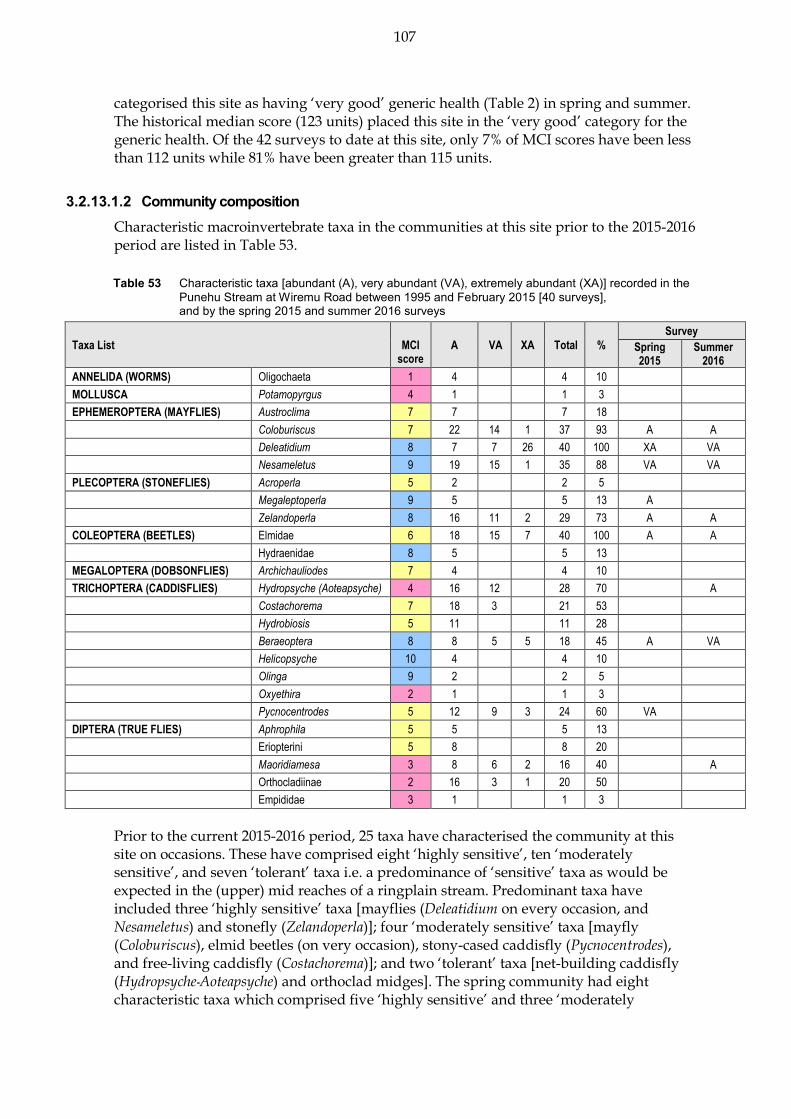
107
categorised this site as having ‘very good’ generic health (Table 2) in spring and summer. The historical median score (123 units) placed this site in the ‘very good’ category for the generic health. Of the 42 surveys to date at this site, only 7% of MCI scores have been less than 112 units while 81% have been greater than 115 units.
Community composition 3.2.13.1.2Characteristic macroinvertebrate taxa in the communities at this site prior to the 2015-2016 period are listed in Table 53.
Table 53 Characteristic taxa [abundant (A), very abundant (VA), extremely abundant (XA)] recorded in the Punehu Stream at Wiremu Road between 1995 and February 2015 [40 surveys], and by the spring 2015 and summer 2016 surveys
Taxa List
MCI score
A VA XA Total %
Survey
Spring 2015
Summer 2016
ANNELIDA (WORMS) Oligochaeta 1 4 4 10
MOLLUSCA Potamopyrgus 4 1 1 3
EPHEMEROPTERA (MAYFLIES) Austroclima 7 7 7 18
Coloburiscus 7 22 14 1 37 93 A A
Deleatidium 8 7 7 26 40 100 XA VA
Nesameletus 9 19 15 1 35 88 VA VA
PLECOPTERA (STONEFLIES) Acroperla 5 2 2 5
Megaleptoperla 9 5 5 13 A
Zelandoperla 8 16 11 2 29 73 A A
COLEOPTERA (BEETLES) Elmidae 6 18 15 7 40 100 A A
Hydraenidae 8 5 5 13
MEGALOPTERA (DOBSONFLIES) Archichauliodes 7 4 4 10
TRICHOPTERA (CADDISFLIES) Hydropsyche (Aoteapsyche) 4 16 12 28 70 A
Costachorema 7 18 3 21 53
Hydrobiosis 5 11 11 28
Beraeoptera 8 8 5 5 18 45 A VA
Helicopsyche 10 4 4 10
Olinga 9 2 2 5
Oxyethira 2 1 1 3
Pycnocentrodes 5 12 9 3 24 60 VA
DIPTERA (TRUE FLIES) Aphrophila 5 5 5 13
Eriopterini 5 8 8 20
Maoridiamesa 3 8 6 2 16 40 A
Orthocladiinae 2 16 3 1 20 50
Empididae 3 1 1 3
Prior to the current 2015-2016 period, 25 taxa have characterised the community at this site on occasions. These have comprised eight ‘highly sensitive’, ten ‘moderately sensitive’, and seven ‘tolerant’ taxa i.e. a predominance of ‘sensitive’ taxa as would be expected in the (upper) mid reaches of a ringplain stream. Predominant taxa have included three ‘highly sensitive’ taxa [mayflies (Deleatidium on every occasion, and Nesameletus) and stonefly (Zelandoperla)]; four ‘moderately sensitive’ taxa [mayfly (Coloburiscus), elmid beetles (on very occasion), stony-cased caddisfly (Pycnocentrodes), and free-living caddisfly (Costachorema)]; and two ‘tolerant’ taxa [net-building caddisfly (Hydropsyche-Aoteapsyche) and orthoclad midges]. The spring community had eight characteristic taxa which comprised five ‘highly sensitive’ and three ‘moderately

108
sensitive’ taxa. The summer 2016 community also had eight characteristic taxa including four ‘highly sensitive’ taxa, two ‘moderately sensitive’ taxa and two ‘tolerant’ taxa. The two surveys shared six characteristic taxa (Table 53). Despite these seasonal taxa differences, minimal significant differences in numerical dominances between seasons were reflected in the identical seasonal high SQMCIs scores (7.9 units) (Table 153 and Table 154). All taxa recorded as very or extremely abundant during spring and/or summer had characterised this site’s communities on 60% to 100% of the past surveys.
Predicted stream ‘health’ 3.2.13.1.3The Punehu Stream site at Wiremu Road is 4.4 km downstream of the National Park boundary at an altitude of 270 m asl. Relationships for ringplain streams developed between MCI and site altitude and distance from the National Park boundary (Stark and Fowles, 2009), predict MCI values of 112 (altitude) and 115 (distance) for this site. The historical site median (123 units) is a significant 11 units higher than the altitude prediction and a non-significant eight units above the distance predictive value. The spring 2015 survey score (124 units) was significantly (Stark, 1998) higher than the altitude predictive value but not the distance predictive value while the summer 2016 score (129 units) was significantly higher than both the altitude (by 17 units) and distance (by 14 units) predictive values. The median value for ringplain streams of similar altitude (TRC, 2015c) was 113 units. The spring and summer scores were significantly higher than the median value but there was no significant difference for the historical survey. The REC predicted MCI value (Leathwick, et al. 2009) was 121 units. The historical site median, spring and summer scores were not significantly different than this value.
Temporal trends 1995 to 2016 3.2.13.1.4A LOWESS trend plot with a moving average (tension 0.4) trendline was produced (Figure 69). A non-parametric statistical trend analysis of the MCI data using the Mann-Kendall test was then performed on 21 years of SEM results (1995-2016) from the site in the Punehu Stream at Wiremu Road. The MCI has been chosen as the preferable indicator of ‘stream/river health’ for SEM trend reporting purposes.
Figure 70 LOWESS trend plot of MCI data at the Wiremu
Road site, Punehu Stream
N = 42 Kendall tau = +0.337 p level = 0.002 FDR p = 0.004

109
A steady increase in MCI scores had been apparent between 2002 and 2007, and again since 2010, resulting in the positive trend in scores over the entire period which has been statistically significant (FDR p<0.01 level). The range of LOWESS-smoothed scores (15 units) has been of ecological importance, particularly since 2002 (coincident with localised riparian fencing and planting of the true left-bank of the stream). Overall, smoothed MCI scores were indicative of ‘good’ generic stream health (Table 2) until 2001 improving to ‘very good’ health after 2004 where it remains.
Temporal trends 2007 to 2016 3.2.13.1.5A LOWESS trend plot with a moving average (tension 0.4) trendline was produced (Figure 69). A non-parametric statistical trend analysis of the MCI data using the Mann-Kendall test was then performed on the ten most recent years of SEM results (2006-2016) from the site in the Punehu Stream at Wiremu Road.
Figure 71 LOWESS trend plot of ten years MCI data at the
Wiremu Road site, Punehu Stream
A positive, non-significant trend was found which contrasts with the highly significant, positive trend found in the full dataset. A small but steady increase in MCI scores had occurred between 2009 and 2014 but a subsequent decline resulted in no overall significant trend. Overall, the trendline range of scores were indicative of ‘very good’ generic stream health (Table 2).
SH 45 site (PNH000900) 3.2.13.2 Taxa richness and MCI 3.2.13.2.1
Forty surveys have been undertaken at this lower reach site at SH 45 in the Punehu Stream between October 1995 and February 2015. These results are summarised in Table 52, together with the results from the current period, and illustrated in Figure 72.
PNH000200
2006 2008 2010 2012 2014 2016 2018Year
105
110
115
120
125
130
135
140
MC
I va
lue
N = 20 Kendall tau = +0.171 p level = 0.291 FDR p = 0.619
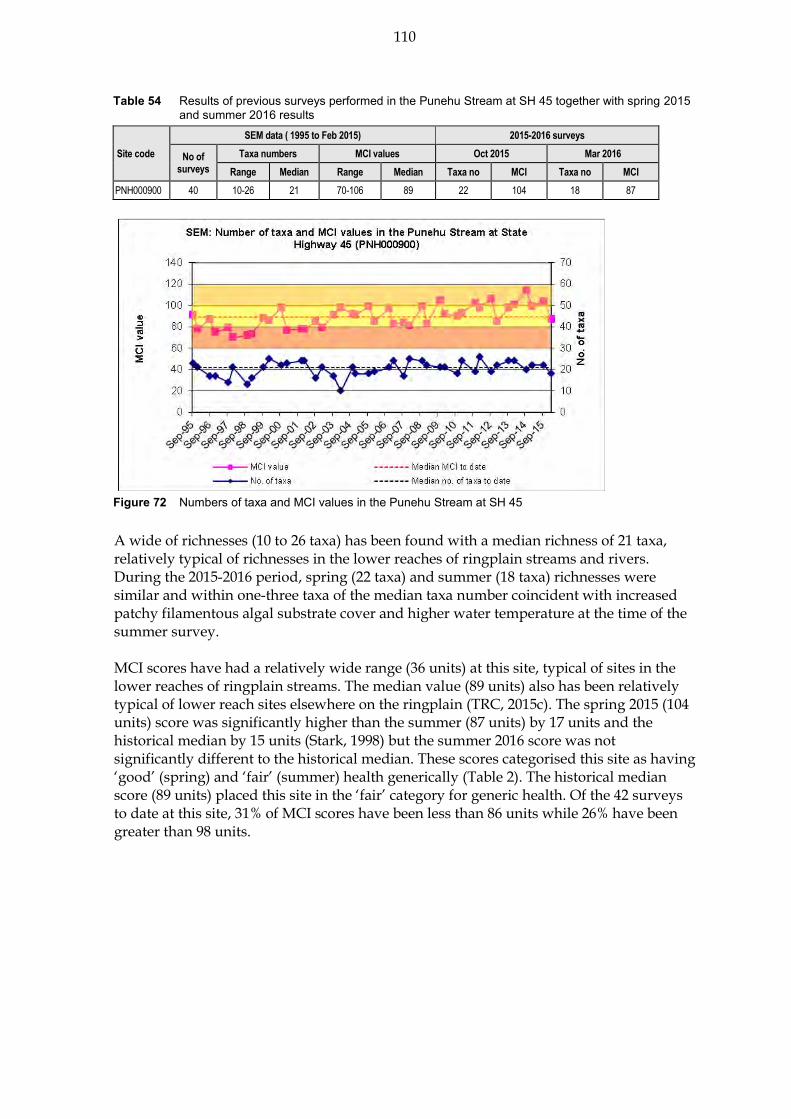
110
Table 54 Results of previous surveys performed in the Punehu Stream at SH 45 together with spring 2015 and summer 2016 results
Site code
SEM data ( 1995 to Feb 2015) 2015-2016 surveys
No of surveys
Taxa numbers MCI values Oct 2015 Mar 2016
Range Median Range Median Taxa no MCI Taxa no MCI
PNH000900 40 10-26 21 70-106 89 22 104 18 87
Figure 72 Numbers of taxa and MCI values in the Punehu Stream at SH 45
A wide of richnesses (10 to 26 taxa) has been found with a median richness of 21 taxa, relatively typical of richnesses in the lower reaches of ringplain streams and rivers. During the 2015-2016 period, spring (22 taxa) and summer (18 taxa) richnesses were similar and within one-three taxa of the median taxa number coincident with increased patchy filamentous algal substrate cover and higher water temperature at the time of the summer survey. MCI scores have had a relatively wide range (36 units) at this site, typical of sites in the lower reaches of ringplain streams. The median value (89 units) also has been relatively typical of lower reach sites elsewhere on the ringplain (TRC, 2015c). The spring 2015 (104 units) score was significantly higher than the summer (87 units) by 17 units and the historical median by 15 units (Stark, 1998) but the summer 2016 score was not significantly different to the historical median. These scores categorised this site as having ‘good’ (spring) and ‘fair’ (summer) health generically (Table 2). The historical median score (89 units) placed this site in the ‘fair’ category for generic health. Of the 42 surveys to date at this site, 31% of MCI scores have been less than 86 units while 26% have been greater than 98 units.

111
Community composition 3.2.13.2.2Characteristic macroinvertebrate taxa in the communities at this site prior to the 2015-2016 period are listed in Table 53.
Table 55 Characteristic taxa [abundant (A), very abundant (VA), extremely abundant (XA)] recorded in the Punehu Stream at SH 45 between 1995 and February 2015 [40 surveys], and by the spring 2015 and summer 2016 surveys
Taxa List MCI
score A VA XA Total %
Survey
Spring 2015
Summer 2016
ANNELIDA (WORMS) Oligochaeta 1 18 8 4 30 75 A
MOLLUSCA Potamopyrgus 4 17 4 21 53 VA
EPHEMEROPTERA (MAYFLIES) Austroclima 7 5 5 13
Coloburiscus 7 6 1 7 18 VA
Deleatidium 8 3 6 9 18 45 XA
PLECOPTERA (STONEFLIES) Acroperla 5 1 1 3
Zelandobius 5 1 1 3
COLEOPTERA (BEETLES) Elmidae 6 11 7 8 26 65
MEGALOPTERA (DOBSONFLIES) Archichauliodes 7 10 10 25
TRICHOPTERA (CADDISFLIES) Hydropsyche (Aoteapsyche) 4 11 6 4 21 53 A
Hydrobiosis 5 15 1 16 40
Beraeoptera 8 2 2 5
Oxyethira 2 4 4 10
Pycnocentrodes 5 4 10 3 17 43 VA A
DIPTERA (TRUE FLIES) Aphrophila 5 14 4 18 45 A
Maoridiamesa 3 11 7 18 45
Orthocladiinae 2 20 6 7 33 83 A A
Polypedilum 3 1 1 3 A
Tanytarsini 3 8 2 10 25 A
Ceratopogonidae 3 1 1 3
Empididae 3 6 6 15
Muscidae 3 2 2 5
Austrosimulium 3 5 5 13 A
Prior to the current 2015-2016 period 21 taxa have characterised the community at this site on occasions. These have comprised one ‘highly sensitive’, nine ‘moderately sensitive’, and eleven ‘tolerant’ taxa i.e. a higher proportion of ‘tolerant’ taxa as might be expected in the lower reaches of a ringplain stream. Predominant taxa have included no ‘highly sensitive’ taxa; one ‘moderately sensitive’ taxon [elmid beetles], and four ‘tolerant’ taxa [oligochaete worms, snail (Potamopyrgus), net-building caddisfly (Hydropsyche-Aoteapsyche), and orthoclad midges]. Only four of the historically characteristic taxa, one of which had been predominant, were dominant in the spring 2015 community. These were comprised of one ‘highly sensitive’, two ‘moderately sensitive’, and one ‘tolerant’ taxa. whereas six of these taxa and two additional ‘tolerant’ taxa (one of which [midge (Polypedilum)] had previously not been characteristic at this site) were dominant in summer 2015. These were comprised of one ‘highly sensitive’, four ‘moderately sensitive’, and three ‘tolerant’ taxa. Six of these ten taxa were dominant in both spring and summer communities (Table 53). An increase in the proportional dominance by ‘tolerant’ taxa and decrease in numerical abundances within three ‘sensitive’ taxa caused a large decrease in the summer SQMCIs score of 3.4 unit (Table 153 and Table 154). The five taxa recorded as

112
very or extremely abundant during spring and summer had characterised this site’s communities on 18% to 43% of past survey occasions.
Predicted stream ‘health’ 3.2.13.2.3The Punehu Stream site at SH 45 is 20.9 km downstream of the National Park boundary at an altitude of 20 m asl. Relationships for ringplain streams developed between MCI and site altitude and distance from the National Park boundary (Stark and Fowles, 2009), predict MCI values of 86 (altitude) and 98 (distance) for this site. The historical site median (89 units) was only three units above the altitude prediction and a non-significant (Stark, 1998) nine units lower than the distance predictive value. The spring 2015 survey score (104 units) was a significant 18 units above the altitude predictive value but was not significantly different to the distance predictive value. The summer 2016 score (87 units) was not significantly different to the altitude or distance predictive values. The median value for ringplain streams of similar altitude (TRC, 2015c) was 90 units. The historical spring score was significantly higher than the median value but there was no significant difference for the historical median and summer survey score. The REC predicted MCI value (Leathwick, et al. 2009) was 100 units. The historical site median and summer scores were significantly lower than this value but there was no significant difference for the spring survey.
Temporal trends in 1995 to 2016 3.2.13.2.4A LOWESS trend plot with a moving average (tension 0.4) trendline was produced (Figure 73). A non-parametric statistical trend analysis of the MCI data using the Mann-Kendall test was then performed on 21 years of SEM results (1995-2016) from the site in the Punehu Stream at SH 45. The MCI has been chosen as the preferable indicator of ‘stream/river health’ for SEM trend reporting purposes.
Figure 73 LOWESS trend plot of MCI data at the SH 45 site, Punehu Stream
This site’s MCI scores have shown a strong positive temporal trend over the 21 year period which was statistically significant (p<0.01) after FDR application.
PNH000900
1994 1996 1998 2000 2002 2004 2006 2008 2010 2012 2014 2016 2018Year
65
70
75
80
85
90
95
100
105
110
115
120
MC
I va
lue
N = 42 Kendall tau = +0.479 p level < 0.001 FDR p < 0.001
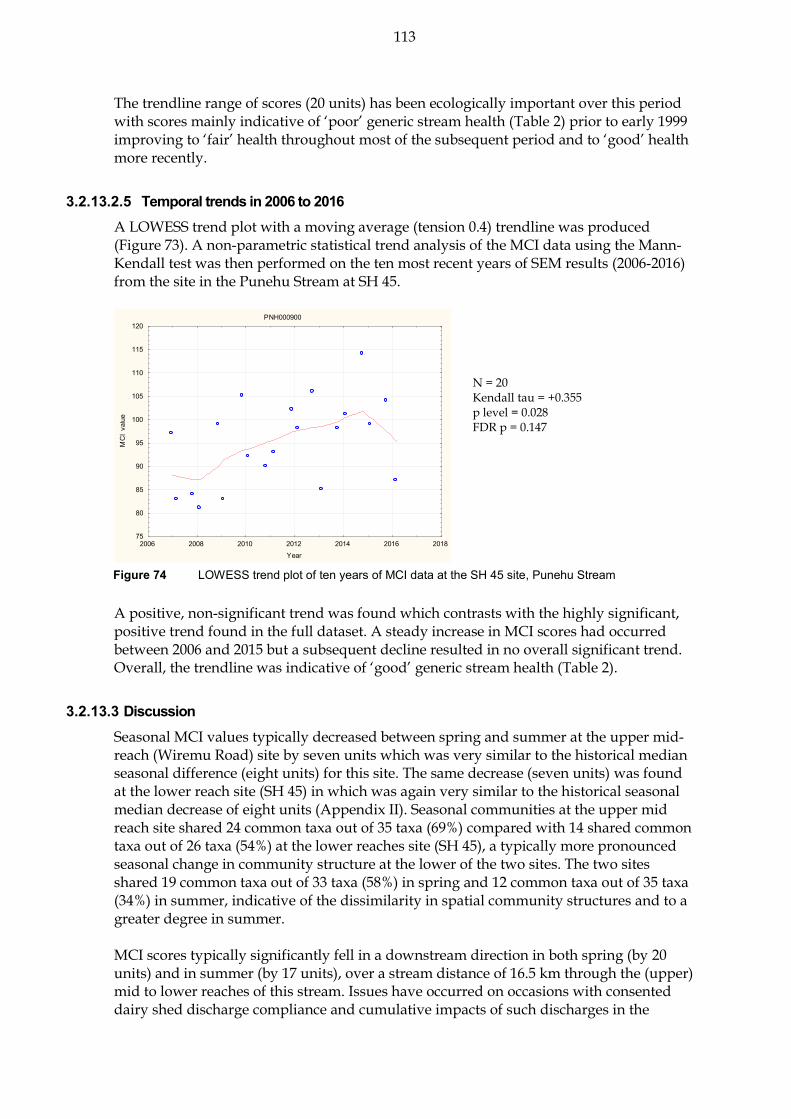
113
The trendline range of scores (20 units) has been ecologically important over this period with scores mainly indicative of ‘poor’ generic stream health (Table 2) prior to early 1999 improving to ‘fair’ health throughout most of the subsequent period and to ‘good’ health more recently.
Temporal trends in 2006 to 2016 3.2.13.2.5A LOWESS trend plot with a moving average (tension 0.4) trendline was produced (Figure 73). A non-parametric statistical trend analysis of the MCI data using the Mann-Kendall test was then performed on the ten most recent years of SEM results (2006-2016) from the site in the Punehu Stream at SH 45.
Figure 74 LOWESS trend plot of ten years of MCI data at the SH 45 site, Punehu Stream
A positive, non-significant trend was found which contrasts with the highly significant, positive trend found in the full dataset. A steady increase in MCI scores had occurred between 2006 and 2015 but a subsequent decline resulted in no overall significant trend. Overall, the trendline was indicative of ‘good’ generic stream health (Table 2).
Discussion 3.2.13.3Seasonal MCI values typically decreased between spring and summer at the upper mid-reach (Wiremu Road) site by seven units which was very similar to the historical median seasonal difference (eight units) for this site. The same decrease (seven units) was found at the lower reach site (SH 45) in which was again very similar to the historical seasonal median decrease of eight units (Appendix II). Seasonal communities at the upper mid reach site shared 24 common taxa out of 35 taxa (69%) compared with 14 shared common taxa out of 26 taxa (54%) at the lower reaches site (SH 45), a typically more pronounced seasonal change in community structure at the lower of the two sites. The two sites shared 19 common taxa out of 33 taxa (58%) in spring and 12 common taxa out of 35 taxa (34%) in summer, indicative of the dissimilarity in spatial community structures and to a greater degree in summer. MCI scores typically significantly fell in a downstream direction in both spring (by 20 units) and in summer (by 17 units), over a stream distance of 16.5 km through the (upper) mid to lower reaches of this stream. Issues have occurred on occasions with consented dairy shed discharge compliance and cumulative impacts of such discharges in the
PNH000900
2006 2008 2010 2012 2014 2016 2018Year
75
80
85
90
95
100
105
110
115
120
MC
I va
lue
N = 20 Kendall tau = +0.355 p level = 0.028 FDR p = 0.147

114
Mangatawa Stream sub-catchment in the local vicinity of the lower site (TRC, 2011 and Fowles, 2014). Changes in macroinvertebrate community structure at the lower site, especially when compared with the upper mid-reach site, reflect ongoing issues with nutrient enrichment.
Patea River 3.2.14The results of spring and summer (2015-2016) surveys are presented in Table 155 and Table 156, Appendix I.
Barclay Road site (PAT000200) 3.2.14.1 Taxa richness and MCI 3.2.14.1.1
Forty surveys have been undertaken at this upper reach, shaded site adjacent to the National Park boundary in the Patea River between October 1995 and February 2016. These results are summarised in Table 56, together with the results from the current period, and illustrated in Figure 75.
Table 56 Results of previous surveys performed in the Patea River at Barclay Road, together with spring 2015 and summer 2016 results
Site code
SEM data ( 1995 to Feb 2015) 2015-2016 surveys
No of surveys
Taxa numbers MCI values Oct 2015 Feb 2016
Range Median Range Median Taxa no MCI Taxa no MCI
PAT000200 40 24-35 30 127-145 138 28 135 29 141
Figure 75 Numbers of taxa and MCI values in the Patea River at Barclay Road
A moderate range of richnesses (24 to 35 taxa) has been found with a relatively high median richness of 31 taxa, typical of richnesses in ringplain streams and rivers near the National Park boundary. During the 2015-2016 period spring richness (28 taxa) was similar to the historical median. The summer richness (29 taxa) was within one taxon of the spring richness and two taxa within the historical median richness. This was coincident with very thin periphyton mat layers on the predominantly stony-bouldery substrate of this shaded site on both survey occasions.

115
MCI values have had a moderate range (18 units) at this site, typical of a National Park boundary site. The high median value (138 units) has been typical of upper reach sites elsewhere on the ringplain (TRC, 2015c) and the spring 2015 (135 units) and summer 2016 (141 units) scores continued this trend for such a site. Both seasonal scores were within three units of the historical median score. They categorised this site as having ‘very good’ (spring and summer) health generically (Table 2). The historical median score (138 units) placed this site in the ‘very good’ for generic health. Of the 42 surveys to date at this site, no MCI scores have been less than 125 units while 64% have been greater than 135 units.
Community composition 3.2.14.1.2Characteristic macroinvertebrate taxa in the communities at this site prior to the 2015-2016 period are listed in Table 57.
Table 57 Characteristic taxa [abundant (A), very abundant (VA), extremely abundant (XA)] recorded in the Patea River at Barclay Road between 1995 and February 2015 [40 surveys], and by the spring 2015 and summer 2016 surveys
Taxa List MCI score
A VA XA Total %
Survey
Spring 2015
Summer 2016
EPHEMEROPTERA (MAYFLIES) Austroclima 7 7 1 8 20
Coloburiscus 7 10 21 9 40 100 A VA
Deleatidium 8 6 5 29 40 100 VA VA
Nesameletus 9 6 6 15
PLECOPTERA (STONEFLIES) Acroperla 5 1 1 3
Austroperla 9 1 1 3
Megaleptoperla 9 15 15 38
Zelandobius 5 15 15 38 A
Zelandoperla 8 23 9 32 80 A
COLEOPTERA (BEETLES) Elmidae 6 30 4 34 85 A
Hydraenidae 8 12 12 30 A
MEGALOPTERA (DOBSONFLIES) Archichauliodes 7 7 7 18
TRICHOPTERA (CADDISFLIES) Costachorema 7 1 1 2 5
Hydrobiosis 5 1 1 3
Hydrobiosella 9 2 2 5
Hydropsyche (Orthopsyche) 9 25 2 27 68 A
Beraeoptera 8 15 4 19 48 A
Helicopsyche 10 13 1 14 35 A
Olinga 9 1 1 3
Zelolessica 7 1 1 3
DIPTERA (TRUE FLIES) Aphrophila 5 31 6 37 93
Orthocladiinae 2 15 1 16 40
Polypedilum 3 3 3 8

116
Prior to the current 2015-2016 period, 23 taxa had characterised the community at this site on occasions. These have comprised eleven ‘highly sensitive’, ten ‘moderately sensitive’, and only two ‘tolerant’ taxa i.e. a majority of ‘highly sensitive’ taxa as would be expected near the National Park boundary of a ringplain river. Predominant taxa have included three ‘highly sensitive’ taxa [mayfly (Deleatidium on every sampling occasion), stonefly (Zelandoperla), and caddisfly (Hydropsyche-Orthopsyche)]; three ‘moderately sensitive’ taxa [mayfly (Coloburiscus on every occasion), elmid beetles, and cranefly (Aphrophila)]; but no ‘tolerant’ taxa. Six of the characteristic taxa were dominant in the spring 2015 community, three of which were predominant taxa. Two of these taxa again were dominant in the summer 2016 community together with two additional ‘highly sensitive’ and one ‘moderately sensitive’ taxa, all of which have been historically characteristic of this site. Four other ‘sensitive’ taxa which had been dominant in spring were not characteristic taxa of the community in summer. Despite some variability amongst the ‘highly’ and ‘moderately’ sensitive taxa dominances, the numerical dominance by two taxa in both seasons resulted in seasonal SQMCIs values which were the same (Table 155 and Table
156). The two taxa recorded as very or extremely abundant during spring and/or summer had characterized this site’s communities on 100% of past surveys.
Predicted stream ‘health’ 3.2.14.1.3The Patea River site at Barclay Road is 1.9 km downstream of the National Park boundary at an altitude of 500 m asl. Some bush cover extends from the National Park adjacent to most of the reach upstream of this site which is situated in farmland. Relationships for ringplain streams developed between MCI and site altitude and distance from the National Park boundary (Stark and Fowles, 2009) predict MCI values of 135 (altitude) and 125 (distance) for this site. The historical site median (138 units) is only three units higher than the altitude prediction but a significant 13 units above the distance predictive value. The spring 2015 score (135 units) was not significantly different to the altitude and distance predictive values and summer, 2016 score (141 units) was also not significantly different to the altitude predictive value but significantly higher than the distance predictive value by 16 units. The median value for ringplain streams of similar altitude (TRC, 2015c) was 134 units. The historical spring, summer and historical median scores were all not significantly different to this value. The REC predicted MCI value (Leathwick, et al. 2009) was 129 units. The historical site median and spring scores were not significantly different to this value and the summer score was significantly higher than this value by 12 units.
Temporal trends in 1995 to 2016 data 3.2.14.1.4A LOWESS trend plot with a moving average (tension 0.4) trendline was produced (Figure 76). A non-parametric statistical trend analysis of the MCI data using the Mann-Kendall test was then performed on 16 years of SEM results (1995-2016) from the site in the Patea River at Barclay Road. The MCI has been chosen as the preferable indicator of ‘stream/river health’ for SEM trend reporting purposes.

117
Figure 76 LOWESS trend plot of MCI data at the Barclay Road site, Patea River
No statistically significant temporal trend in MCI scores has been found at this upper catchment site over the twenty-one year monitoring period during which there has been a minimal overall trend of slight improvement. Neither has the range of LOWESS-smoothed scores (five units) shown ecological importance. Smoothed MCI scores have consistently indicated ‘very good’, bordering on ‘excellent’, generic river health (Table 2) at this relatively pristine site just outside the National Park boundary.
Temporal trends in 2006 to 2016 data 3.2.14.1.5A LOWESS trend plot with a moving average (tension 0.4) trendline was produced (Figure 76). A non-parametric statistical trend analysis of the MCI data using the Mann-Kendall test was then performed on the most recent ten years of SEM results (2006-2016) from the site in the Patea River at Barclay Road.
Figure 77 LOWESS trend plot of MCI data at the Barclay Road site, Patea River
No statistically significant trend in MCI scores has been found at this upper catchment site over the ten year monitoring period congruent with the results of the full dataset. Minimal change in MCI scores has occurred. The trendline range of scores have consistently indicated ‘very good’, generic river health (Table 2).
PAT000200
2006 2008 2010 2012 2014 2016 2018Year
130
132
134
136
138
140
142
144
146
MC
I va
lue
N = 42 Kendall tau = +0.073 p value = 0.493 FDR p = 0.581
N = 20 Kendall tau = +0.039 p value = 0.811 FDR p = 0.899

118
Swansea Road site (PAT000315) 3.2.14.2 Taxa richness and MCI 3.2.14.2.1
Thirty-eight surveys have been undertaken in the Patea River at this mid-reach site at Swansea Road, Stratford between October 1995 and February 2015. These results are summarised in Table 58, together with the results from the current period, and illustrated in Figure 78.
Table 58 Results of previous surveys performed in the Patea River at Swansea Road, together with spring 2015 and summer 2016 results
Site code
SEM data ( 1995 to Feb 2015) 2015-2016 surveys
No of surveys
Taxa numbers MCI values Oct 2015 Feb 2016
Range Median Range Median Taxa no MCI Taxa no MCI
PAT000315 40 20-32 26 99-130 111 22 114 21 113
Figure 78 Numbers of taxa and MCI values in the Patea River at Swansea Road
A moderate range of richnesses (20 to 32 taxa) has been found, with a median richness of 26 taxa, typical of richnesses in the mid reaches of ringplain streams and rivers. During the 2015-2016 period, spring (22 taxa) and summer (21 taxa) richnesses were similar to each other but slightly lower than the median taxa number coincident with minimal substrate periphyton cover during spring and summer. MCI values have had a relatively wide range (31 units) at this site, more so than typical of many sites in the mid reaches of ringplain rivers. The median value (111 units) has been relatively typical of scores in mid-reach sites elsewhere on the ringplain. The spring 2015 (114 units) and summer 2016 (113 units) scores were very similar to each other and to the historical median. These scores categorised this site as having ‘good’ (spring and summer) health generically (Table 2). The historical median score (111 units) placed this site in the ‘good’ category for generic health. Of the 42 surveys to date at this site, only 7% of MCI scores have been less than 103 units while 33% have been greater than 115 units.
Community composition 3.2.14.2.2Characteristic macroinvertebrate taxa in the communities at this site prior to the 2015-2016 period are listed in Table 59.

119
Table 59 Characteristic taxa [abundant (A), very abundant (VA), extremely abundant (XA)] recorded in the Patea River at Swansea Road between 1995 and February 2015 [40 surveys], and by the spring 2015 and summer 2016 surveys
Taxa List MCI A VA XA Total %
Survey
Spring 2015
Summer 2016
ANNELIDA (WORMS) Oligochaeta 1 7 1 8 20
EPHEMEROPTERA (MAYFLIES) Austroclima 7 12 1 13 33 A
Coloburiscus 7 8 23 9 40 100 VA VA
Deleatidium 8 10 2 21 33 83 VA VA
Nesameletus 9 13 3 16 40
PLECOPTERA (STONEFLIES) Acroperla 5 4 4 10 A
Zelandoperla 8 10 1 11 28
COLEOPTERA (BEETLES) Elmidae 6 18 7 25 63 A
Hydraenidae 8 8 8 20 A
MEGALOPTERA (DOBSONFLIES) Archichauliodes 7 16 1 17 43
TRICHOPTERA (CADDISFLIES) Hydropsyche (Aoteapsyche) 4 11 11 6 28 70 A VA
Costachorema 7 21 21 53
Hydrobiosis 5 4 1 5 13
Neurochorema 6 4 4 10
Beraeoptera 8 7 1 8 20 A
Confluens 5
Pycnocentrodes 5 4 4 10 A
DIPTERA (TRUE FLIES) Aphrophila 5 22 13 35 88 A
Eriopterini 5 1 1 3 VA A
Maoridiamesa 3 14 9 2 25 63
Orthocladiinae 2 21 6 8 35 88 A
Tanytarsini 3 7 3 10 25
Muscidae 3 2 2 5
Austrosimulium 3 8 2 10 25
Prior to the current 2015-2016 period, 23 taxa had characterised the community at this site on occasions. These have comprised five ‘highly sensitive’, eleven ‘moderately sensitive’, and seven ‘tolerant’ taxa i.e. a minority of ‘highly sensitive’ taxa and a downstream increase in ‘tolerant’ taxa as would be expected in the mid reaches of a ringplain river. Predominant taxa have included one ‘highly sensitive’ taxon [mayfly (Deleatidium)]; four ‘moderately sensitive’ taxa [mayfly (Coloburiscus), elmid beetles, free-living caddisfly (Costachorema), and cranefly (Aphrophila)]; and three ‘tolerant’ taxa [net-building caddisfly (Hydropsyche- Aoteapsyche) and midges (Maoridiamesa and orthoclads)]. Ten of these historically characteristic taxa (five predominant taxa) were dominant in the spring 2015 community. These comprised two ‘highly sensitive’, six ‘moderately sensitive’, and two ‘tolerant’ taxa, whereas the summer community consisted of six characteristic taxa comprised of two ‘highly sensitive’, three ‘moderately sensitive’, and one ‘tolerant’ taxa. Four taxa were dominant in both spring and summer communities (Table 59). Little change in the proportion of ‘sensitive’ and ‘tolerant’ taxa resulted in similar SQMCIs scores for spring and summer (Table 155 and Table 156). The six taxa found as very and/or extremely abundant by the seasonal surveys have characterised this site’s communities on 3% to 100% of past survey occasions.

120
Predicted stream ‘health’ 3.2.14.2.3The Patea River site at Swansea Road, Stratford is 12.9 km downstream of the National Park boundary at an altitude of 300 m asl. Relationships for ringplain streams developed between MCI and site altitude and distance from the National Park boundary (Stark and Fowles, 2009), predict MCI values of 115 (altitude) and 103 (distance) for this site. The historical site median (111) was a non-significant four units lower than the altitude prediction and eight units higher than the distance predictive value. The spring 2015 survey score (114 units) was not significantly different to the altitude predictive value but was significantly higher than the distance predictive value (by 11 units). The summer 2016 score (113 units) was not significantly different to the altitude and distance predictive values. The median value for ringplain streams of similar altitude (TRC, 2015c) was 119 units. The historical spring, summer and historical median scores were all not significantly different to this value. The REC predicted MCI value (Leathwick, et al. 2009) was 112 units. The historical spring, summer and historical median scores were all not significantly different to this value.
Temporal trends in 1995 to 2016 data 3.2.14.2.4A LOWESS trend plot with a moving average (tension 0.4) trendline was produced (Figure 79). A non-parametric statistical trend analysis of the MCI data using the Mann-Kendall test was then performed on 21 years of SEM results (1995-2016) from the site in the Patea River at Swansea Road. The MCI has been chosen as the preferable indicator of ‘stream/river health’ for SEM trend reporting purposes.
Figure 79 LOWESS trend plot of MCI data at the Swansea Road site, Patea River
The small positive temporal trend in MCI scores was not statistically significant over the 21 year period. The trendline range of scores (six units) was of no ecological importance. The trendline range of scores consistently indicated ‘good’ generic river health (Table 2) throughout the monitoring period.
PAT000315
1994 1996 1998 2000 2002 2004 2006 2008 2010 2012 2014 2016 2018Year
95
100
105
110
115
120
125
130
135
MC
I va
lue
N = 42 Kendall tau = +0.167 p value = 0.120 FDR p = 0.181

121
Temporal trends in 2006 to 2016 data 3.2.14.2.5A LOWESS trend plot with a moving average (tension 0.4) trendline was produced (Figure 80). A non-parametric statistical trend analysis of the MCI data using the Mann-Kendall test was then performed on ten years of SEM results (2006-2016) from the site in the Patea River at Swansea Road.
Figure 80 LOWESS trend plot of ten years of MCI data at the Swansea Road site, Patea River
The small positive trend in MCI scores was not statistically significant over the ten year period congruent with the results of the full dataset. The trendline range of scores consistently indicated ‘good’ generic river health (Table 2) throughout the monitoring period.
Skinner Road site (PAT000360) 3.2.14.3 Taxa richness and MCI 3.2.14.3.1
Forty surveys have been undertaken in the Patea River at this mid-reach site at Skinner Road (some 6 km downstream of the Swansea Road, Stratford site), between October 1995 and February 2015. These results are summarised in Table 60, together with the results from the current period, and illustrated in Figure 82.
Table 60 Results of previous surveys performed in the Patea River at Skinner Road, together with spring 2015 and summer 2016 results
Site code
SEM data ( 1995 to Feb 2015) 2015-2016 surveys
No of surveys
Taxa numbers MCI values Oct 2015 Feb 2016
Range Median Range Median Taxa no MCI Taxa no MCI
PAT000360 40 15-33 23 86-105 98 21 99 20 96
PAT000315
2006 2008 2010 2012 2014 2016 2018Year
95
100
105
110
115
120
125
130
MC
I va
lue
N = 20 Kendall tau = +0.129 p value = 0.426 FDR p = 0.742

122
Figure 81 Numbers of taxa and MCI values in the Patea River at Skinner Road
A wide range of richnesses (15 to 33 taxa) has been found with a median richness of 23 taxa (more representative of typical richnesses in the mid-reaches of ringplain streams and rivers). During the 2015-2016 period spring (21 taxa) and summer (20 taxa) richnesses were very similar to each other and to the historical median richness coincident with no change in the widespread periphyton cover at the site between seasons. MCI values have had a moderate range (19 units) at this site, typical of sites in the mid-reaches of ringplain streams and rivers. The median value (98 units) has been relatively typical of the scores at mid-reach sites elsewhere on the ringplain (TRC, 2015c). The spring 2015 (99 units) and summer 2016 (96 units) scores were very similar to each other and typical of scores for such a site. They were both within two units of the historical median and categorised this site as having ‘fair’ (spring and summer) health generically (Table 2). The historical median score (98 units) placed this site in the ‘fair’ category for generic health. Of the 42 surveys to date at this site, 57% of MCI scores have been less than 99 units while no scores have been greater than 105 units, indicative of some acceleration in deterioration in river ‘health’ through the reach below Swansea Road (in the township), by comparison with the historical record at this nearest upstream site.
Community composition 3.2.14.3.2Characteristic macroinvertebrate taxa in the communities at this site prior to the 2015-2016 period are listed in Table 61.

123
Table 61 Characteristic taxa [abundant (A), very abundant (VA), extremely abundant (XA)] recorded in the Patea River at Skinner Road between 1995 and February 2015 [40 surveys], and by the spring 2015 and summer 2016 surveys
Taxa List MCI score
A VA XA Total %
Survey
Spring 2015
Summer 2016
NEMERTEA Nemertea 3 5 5 13
ANNELIDA (WORMS) Oligochaeta 1 13 7 7 27 68 A
MOLLUSCA Potamopyrgus 4 7 3 10 25
CRUSTACEA Paracalliope 5 1 1 3
EPHEMEROPTERA (MAYFLIES) Austroclima 7 1 1 3
Coloburiscus 7 12 2 14 35 A
Deleatidium 8 4 7 8 19 48 VA VA
PLECOPTERA (STONEFLIES) Acroperla 5 2 2 5
COLEOPTERA (BEETLES) Elmidae 6 16 16 32 80 A
MEGALOPTERA (DOBSONFLIES) Archichauliodes 7 18 18 45
TRICHOPTERA (CADDISFLIES) Hydropsyche (Aoteapsyche) 4 16 11 6 33 83 A VA
Costachorema 7 13 13 33
Hydrobiosis 5 16 4 20 50
Oxyethira 2 3 1 4 10
Pycnocentrodes 5 7 2 9 23 A
DIPTERA (TRUE FLIES) Aphrophila 5 20 10 1 31 78 VA
Maoridiamesa 3 11 16 6 33 83 VA
Orthocladiinae 2 17 17 6 40 100 A VA
Tanytarsini 3 14 6 20 50 A
Empididae 3 2 2 5
Muscidae 3 8 8 20
Austrosimulium 3 8 8 20
Prior to the current 2015-2016 period, 22 taxa had characterised the community at this site on occasions. These have comprised only one ‘highly sensitive’ taxon, but ten ‘moderately sensitive’ and eleven ‘tolerant’ taxa i.e. a minority of ‘highly sensitive’ taxa and relatively high proportions of ‘moderately sensitive’ and ‘tolerant’ taxa as would be expected in the mid-reaches of a ringplain river. Predominant taxa have included no ‘highly sensitive’ taxa, three ‘moderately sensitive’ taxa [elmid beetles, free-living caddisfly (Hydrobiosis), and cranefly (Aphrophila)], and four ‘tolerant’ taxa [oligochaete worms, net-building caddisfly (Hydropsyche-Aoteapsyche), and midges (Maoridiamesa and orthoclads)]. Seven of the historically characteristic taxa (three of the predominant taxa) were dominant in the spring 2015 community. These comprised one ‘highly sensitive’, three ‘moderately sensitive’, and three ‘tolerant’ taxa. The summer community consisted of six characteristic taxa comprising one ‘highly sensitive’, one ‘moderately sensitive’, and four ‘tolerant’ taxa. Three of these twelve taxa were dominant in both spring and summer communities (Table 61). A more typical increase in summer numerical dominance within four ‘tolerant’ taxa and decrease in the abundance of the three characteristic ‘moderately sensitive’, were reflected in the decrease of 0.7 units in SQMCIs scores between spring and summer (Table
155 and Table 156). The nine taxa found as very and/or extremely abundant by the seasonal surveys have characterised this site’s communities on 48% to 100% of past survey occasions.

124
Predicted stream ‘health’ 3.2.14.3.3The Patea River site at Skinner Road is 19.2 km downstream of the National Park boundary at an altitude of 240 m asl. Relationships for ringplain streams developed between MCI and site altitude and distance from the National Park boundary (Stark and Fowles, 2009), predict MCI values of 109 (altitude) and 99 (distance) for this site. The historical site median (98) is a significant (Stark, 1998) 11 units lower than the altitude prediction but only one unit lower than the distance predictive value. The spring 2015 and summer 2016 surveys’ scores (101 units) were eight units lower than the altitude predictive value and two units above the predicted distance value. The median value for ringplain streams of similar altitude (TRC, 2015c) was 101 units. The historical spring, summer and historical median scores were all not significantly different to this value. The REC predicted MCI value (Leathwick, et al. 2009) was 109 units. The historical spring score was not significantly different to this value but the summer and historical median were significantly below the REC predictive value by 13 units and 11 units respectively.
Temporal trends in 1995 to 2016 data 3.2.14.3.4A LOWESS trend plot with a moving average (tension 0.4) trendline was produced (Figure 82). A non-parametric statistical trend analysis of the MCI data using the Mann-Kendall test was then performed on 21 years of SEM results (1995-2016) from the site in the Patea River at Skinner Road. The MCI has been chosen as the preferable indicator of ‘stream/river health’ for SEM trend reporting purposes.
Figure 82 LOWESS trend plot of MCI data at the Skinner Road site, Patea River
The small positive temporal trend in MCI scores over the 21 year period has not been statistically significant. An apparent decline in scores between 2004 and 2008 has been followed by some improvement followed by a more recent plateau in scores. The very small range of LOWESS-smoothed scores (three units) has had no ecological importance over the period. Smoothed MCI scores consistently indicated ‘fair’ generic river health (Table 2).
PAT000360
1994 1996 1998 2000 2002 2004 2006 2008 2010 2012 2014 2016 2018Year
84
86
88
90
92
94
96
98
100
102
104
106
MC
I va
lue
N = 42 Kendall tau = +0.123 p value = 0.250 FDR p = 0.340
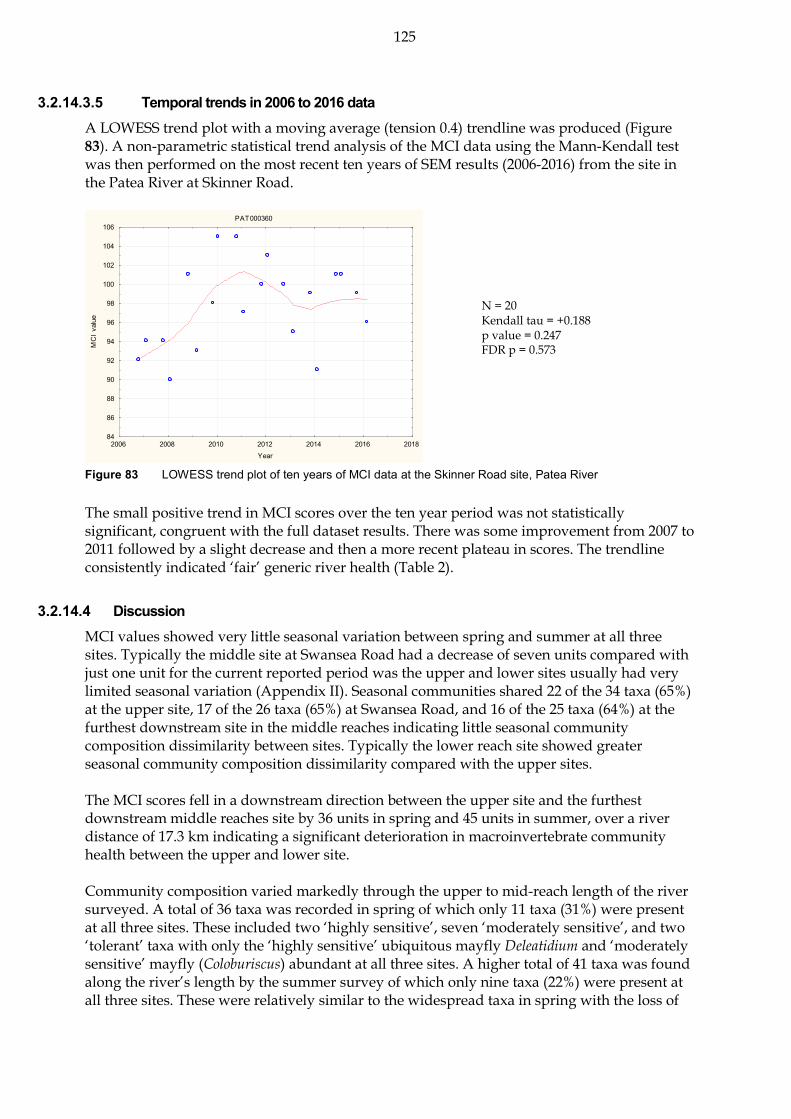
125
Temporal trends in 2006 to 2016 data 3.2.14.3.5A LOWESS trend plot with a moving average (tension 0.4) trendline was produced (Figure 83). A non-parametric statistical trend analysis of the MCI data using the Mann-Kendall test was then performed on the most recent ten years of SEM results (2006-2016) from the site in the Patea River at Skinner Road.
Figure 83 LOWESS trend plot of ten years of MCI data at the Skinner Road site, Patea River
The small positive trend in MCI scores over the ten year period was not statistically significant, congruent with the full dataset results. There was some improvement from 2007 to 2011 followed by a slight decrease and then a more recent plateau in scores. The trendline consistently indicated ‘fair’ generic river health (Table 2).
Discussion 3.2.14.4MCI values showed very little seasonal variation between spring and summer at all three sites. Typically the middle site at Swansea Road had a decrease of seven units compared with just one unit for the current reported period was the upper and lower sites usually had very limited seasonal variation (Appendix II). Seasonal communities shared 22 of the 34 taxa (65%) at the upper site, 17 of the 26 taxa (65%) at Swansea Road, and 16 of the 25 taxa (64%) at the furthest downstream site in the middle reaches indicating little seasonal community composition dissimilarity between sites. Typically the lower reach site showed greater seasonal community composition dissimilarity compared with the upper sites. The MCI scores fell in a downstream direction between the upper site and the furthest downstream middle reaches site by 36 units in spring and 45 units in summer, over a river distance of 17.3 km indicating a significant deterioration in macroinvertebrate community health between the upper and lower site.
Community composition varied markedly through the upper to mid-reach length of the river surveyed. A total of 36 taxa was recorded in spring of which only 11 taxa (31%) were present at all three sites. These included two ‘highly sensitive’, seven ‘moderately sensitive’, and two ‘tolerant’ taxa with only the ‘highly sensitive’ ubiquitous mayfly Deleatidium and ‘moderately sensitive’ mayfly (Coloburiscus) abundant at all three sites. A higher total of 41 taxa was found along the river’s length by the summer survey of which only nine taxa (22%) were present at all three sites. These were relatively similar to the widespread taxa in spring with the loss of
PAT000360
2006 2008 2010 2012 2014 2016 2018Year
84
86
88
90
92
94
96
98
100
102
104
106
MC
I va
lue
N = 20 Kendall tau = +0.188 p value = 0.247 FDR p = 0.573

126
one ‘highly sensitive’ taxon and addition of two ‘moderately sensitive’ taxa. Only the one ‘highly sensitive’ mayfly taxon and two ‘moderately sensitive’ taxa were abundant at all three sites in summer. These dissimilarities in spatial community structure along the surveyed length (upper to mid-reaches) of the Patea River were much less pronounced between seasons than what has previously been found though were similar to the previous 2014-2015 reporting period which suggests the macroinvertebrate community structure along the length of the Patea River is becoming more stable.
Mangaehu River 3.2.15The results found by the 2015-2016 surveys are presented in Table 154 and Table 155 Appendix I for this single site in the lower reaches of a large hill country river.
Raupuha Road site (MGH000950) 3.2.15.1 Taxa richness and MCI 3.2.15.1.1
Forty surveys have been undertaken at this lower reach site in the Mangaehu River between October 1995 and February 2015. These results are summarised in Table 62, together with the results from the current period, and illustrated in Figure 84.
Table 62 Results of previous surveys performed in the Mangaehu River at Raupuha Road, together with spring 2015 and summer 2016 results
Site code
SEM data ( 1995 to Feb 2015) 2015-2016 surveys
No of surveys
Taxa numbers MCI values Oct 2015 Feb 2016
Range Median Range Median Taxa no MCI Taxa no MCI
MGH000950 40 13-26 19 77-104 92 20 101 23 92
Figure 84 Numbers of taxa and MCI values in the Mangaehu River at Raupuha Road
A relatively wide range of richnesses (13 to 26 taxa) has been found with a moderate median richness of 19 taxa (slightly above typical richnesses in the lower reaches of hill country rivers, although generally at lower altitudes (TRC, 2015c)). During the 2015-2016 period, spring (20 taxa) and summer (23 taxa) richnesses were similar to each other despite more widespread summer substrate periphyton cover, and either equal to or slightly higher than the historical median richness.

127
MCI values have had a relatively wide range (27 units) at this site more typical of a site in the lower reaches of streams and rivers. The median value (92 units) has been typical of lower reach sites. The spring 2015 (101 units) and summer 2015 (92 units) scores showed a typical summer decrease but were not significantly different from each other or from the historic median. These scores categorised this site as having ‘good’ and ‘fair’ health generically (Table 2) in spring and summer respectively. The historical median score (92 units) placed this site in the ’fair’ category for the generic method of assessment.
Community composition 3.2.15.1.2Characteristic macroinvertebrate taxa in the communities at this site prior to the 2015-2016 period are listed in Table 63.
Table 63 Characteristic taxa [abundant (A), very abundant (VA), extremely abundant (XA)] recorded in the Mangaehu River at Raupuha Road between 1995 and February 2015 [40 surveys], and by the spring 2015 and summer 2016 surveys
Taxa List
Date
MCI A VA XA Total %
Survey
Sample Number Spring 2015
Summer 2016
NEMERTEA Nemertea 3 1 1 3
ANNELIDA (WORMS) Oligochaeta 1 2 2 4 10
MOLLUSCA Potamopyrgus 4 9 1 10 25 A
CRUSTACEA Paracalliope 5 4 1 5 13
EPHEMEROPTERA (MAYFLIES) Austroclima 7 9 3 12 30 A
Coloburiscus 7 3 3 8
Deleatidium 8 5 1 6 15
Mauiulus 5 1 1 3
Zephlebia group 7 4 4 10 A
PLECOPTERA (STONEFLIES) Acroperla 5 7 1 8 20 A
COLEOPTERA (BEETLES) Elmidae 6 4 4 10
TRICHOPTERA (CADDISFLIES) Hydropsyche (Aoteapsyche) 4 14 9 23 58 VA
Costachorema 7 8 8 20
Hydrobiosis 5 14 5 19 48
Oxyethira 2 2 2 5
Pycnocentrodes 5 10 8 18 45 A
DIPTERA (TRUE FLIES) Aphrophila 5 13 19 32 80 VA
Maoridiamesa 3 16 12 28 70
Orthocladiinae 2 19 16 3 38 95 A
Tanytarsini 3 13 5 18 45 A
Empididae 3 4 4 10
Muscidae 3 7 7 18
Austrosimulium 3 5 1 6 15
Prior to the current 2015-2016 period, 23 taxa have characterised the community at this site on occasions. These have comprised one ‘highly sensitive’, eleven ‘moderately sensitive’, and 11 ‘tolerant’ taxa i.e. a high proportion of ‘tolerant’ taxa as would be expected in the lower reaches of an eastern hill-country river. Predominant taxa have included only one ‘moderately sensitive’ taxon [cranefly (Aphrophila)] and three ‘tolerant’ taxa [net-building caddisfly (Hydropsyche-Aoteapsyche) and midges (Maoridiamesa and orthoclads)]. Only two non-predominant ‘moderately sensitive’ taxa were characteristic

128
in the spring 2015 community. The summer 2016 community was characterised by seven taxa, three ‘moderately sensitive’ taxa and four ‘tolerant’ taxa. No taxa were characteristic for both surveys (Table 63). Due to the increase in ‘tolerant’ taxa during summer there was a significant difference of 1.1 units in the seasonal SQMCIs scores (Table 157 and Table 158). Those taxa recorded as very abundant during spring and/or summer surveys had been characteristic of this site’s communities on 58 to 80% of past survey occasions.
Predicted stream ‘health’ 3.2.15.1.3The Mangaehu River site at Raupuha Road, at an altitude of 100 m asl, is in the lower reaches of a river draining an eastern hill country catchment. Relationships for ringplain streams and river developed between MCI and altitude and distance from the National Park (Stark and Fowles, 2009) are therefore not appropriate for this river. The median value for large eastern hill country rivers of similar altitude (TRC, 2015c) was 93 units. The historical spring, summer and historical median scores were all not significantly different to this value. The REC predicted MCI value (Leathwick, et al. 2009) was 117 units. The historical spring, summer and historical median scores were all significantly lower than this value.
Temporal trends in 1995 to 2016 data 3.2.15.1.4A LOWESS trend plot with a moving average (tension 0.4) trendline was produced (Figure 85). A non-parametric statistical trend analysis of the MCI data using the Mann-Kendall test was then performed on 16 years of SEM results (1995-2016) from the site in the Mangaehu River at Raupuha Road. The MCI has been chosen as the preferable indicator of ‘stream/river health’ for SEM trend reporting purposes.
Figure 85 LOWESS trend plot of MCI data for the Raupuha Road site, Mangaehu River
A significant positive temporal trend in MCI scores (p<0.01 after FDR) was found at this lower reach, hill country river site. This trend is partially explained by an apparent reduction in river bed sedimentation possibly related to fewer severe flood events particularly since 2000 with scores tending to plateau between in 2004 and 2008 before improving steadily again since then. Work has also been undertaken encouraging farmers
MGH000950
1994 1996 1998 2000 2002 2004 2006 2008 2010 2012 2014 2016 2018Year
75
80
85
90
95
100
105
110
MC
I va
lue
N = 42 Kendall tau = +0.576 p value < 0.001 FDR p < 0.001
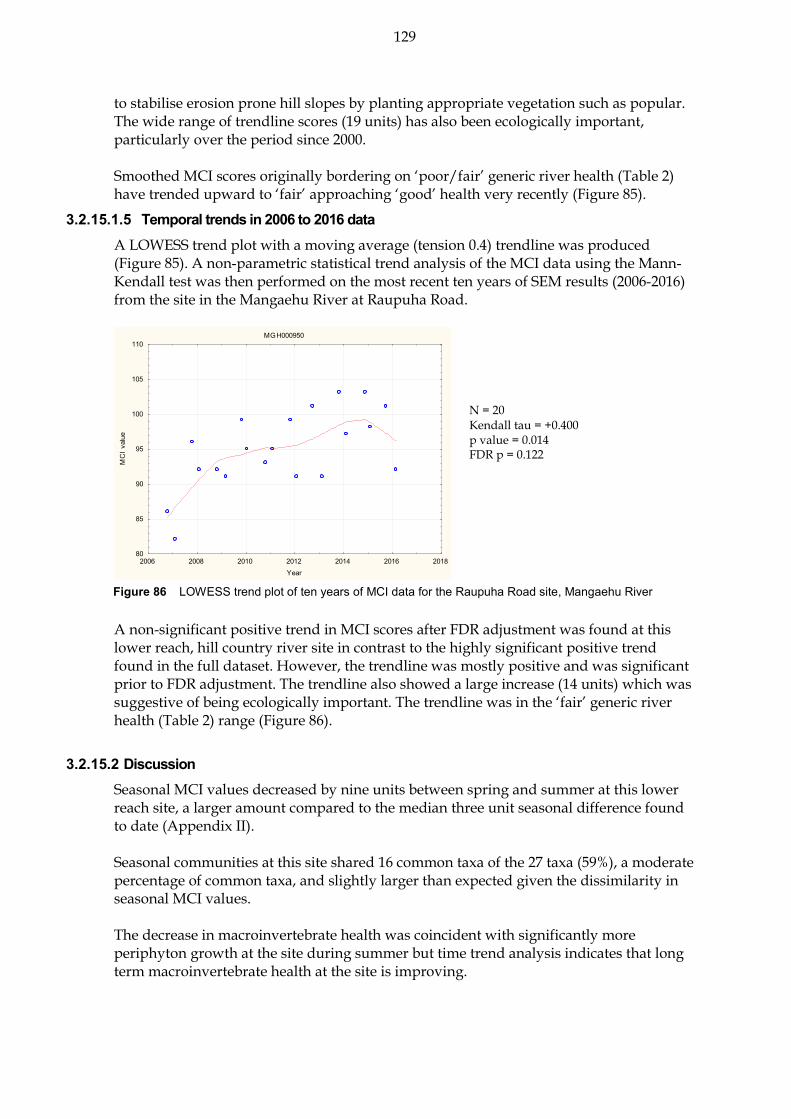
129
to stabilise erosion prone hill slopes by planting appropriate vegetation such as popular. The wide range of trendline scores (19 units) has also been ecologically important, particularly over the period since 2000. Smoothed MCI scores originally bordering on ‘poor/fair’ generic river health (Table 2) have trended upward to ‘fair’ approaching ‘good’ health very recently (Figure 85).
Temporal trends in 2006 to 2016 data 3.2.15.1.5A LOWESS trend plot with a moving average (tension 0.4) trendline was produced (Figure 85). A non-parametric statistical trend analysis of the MCI data using the Mann-Kendall test was then performed on the most recent ten years of SEM results (2006-2016) from the site in the Mangaehu River at Raupuha Road.
Figure 86 LOWESS trend plot of ten years of MCI data for the Raupuha Road site, Mangaehu River
A non-significant positive trend in MCI scores after FDR adjustment was found at this lower reach, hill country river site in contrast to the highly significant positive trend found in the full dataset. However, the trendline was mostly positive and was significant prior to FDR adjustment. The trendline also showed a large increase (14 units) which was suggestive of being ecologically important. The trendline was in the ‘fair’ generic river health (Table 2) range (Figure 86).
Discussion 3.2.15.2Seasonal MCI values decreased by nine units between spring and summer at this lower reach site, a larger amount compared to the median three unit seasonal difference found to date (Appendix II). Seasonal communities at this site shared 16 common taxa of the 27 taxa (59%), a moderate percentage of common taxa, and slightly larger than expected given the dissimilarity in seasonal MCI values. The decrease in macroinvertebrate health was coincident with significantly more periphyton growth at the site during summer but time trend analysis indicates that long term macroinvertebrate health at the site is improving.
MGH000950
2006 2008 2010 2012 2014 2016 2018Year
80
85
90
95
100
105
110
MC
I va
lue
N = 20 Kendall tau = +0.400 p value = 0.014 FDR p = 0.122

130
Waingongoro River 3.2.16The results of the spring summer (2015-2016) surveys are summarised in Table 159 and Table 160, Appendix I.
Site near National Park boundary (WGG000115) 3.2.16.1 Taxa richness and MCI 3.2.16.1.1
Forty surveys have been undertaken at this upper reach site, 700m downstream of the National Park boundary in the Waingongoro River, between October 1995 and February 2015. These results are summarised in Table 64, together with the results from the current period, and illustrated in Figure 87.
Table 64 Results of previous surveys performed in the Waingongoro River 700m downstream of the National Park, together with spring 2015 and summer 2016 results
Site code
SEM data ( 1995 to Feb 2015) 2015-2016 surveys
No of surveys
Taxa numbers MCI values Oct 2015 Mar 2016
Range Median Range Median Taxa no MCI Taxa no MCI
WGG000115 40 24-40 32 122-139 132 29 132 26 144
Figure 87 Numbers of taxa and MCI values in the Waingongoro River 700 m d/s National Park
A relatively wide range of richnesses (24 to 40 taxa) has been found with a high median richness of 32 taxa, typical of richnesses in ringplain streams and rivers near the National Park boundary. During the 2015-2016 period, spring (29 taxa) and summer (26 taxa) richnesses were similar and slightly less than the median taxa number.
MCI values have had a moderate range (17 units) at this site, more typical of a National Park boundary site. The median value (132 units) also has been typical of upper reach sites elsewhere on the ringplain (TRC, 2015c). The spring 2015 (132 units) and summer 2016 (144 units) scores were significantly different from each, with the summer score being significantly higher than the spring score. The summer score was also significantly higher than the historical median and was the highest MCI score ever recorded at the site being five units higher than the next highest recorded score. The MCI scores categorised this site as having ‘excellent’ (spring) and ‘very good’ (summer) health generically (Table

131
2). The historical median score (132 units) placed this site in the ‘very good’ category for generic health. Of the 42 surveys to date at this site, 29% of MCI scores have been less than 130 units while one (2%) has been greater than 140 units.
Community composition 3.2.16.1.2Characteristic macroinvertebrate taxa in the communities at this site prior to the 2015-2016 period are listed in Table 65.
Table 65 Characteristic taxa [abundant (A), very abundant (VA), extremely abundant (XA)] recorded in the Waingongoro River 700 m downstream of the National Park between 1995 and February 2015 [40 surveys], and by the spring 2015 and summer 2016 surveys
Taxa List MCI A VA XA Total %
Survey
Spring 2015
Summer 2016
EPHEMEROPTERA (MAYFLIES) Austroclima 7 19 5 24 60
Coloburiscus 7 8 17 15 40 100 VA VA
Deleatidium 8 7 7 26 40 100 VA XA
Nesameletus 9 17 4 1 22 55 A
PLECOPTERA (STONEFLIES) Acroperla 5 3 3 8
Austroperla 9 3 3 8
Megaleptoperla 9 34 2 36 90 A
Stenoperla 10 3 3 8
Zelandobius 5 2 2 5
Zelandoperla 8 11 21 8 40 100 A XA
COLEOPTERA (BEETLES) Elmidae 6 19 21 40 100 A A
Hydraenidae 8 22 4 26 65 A A
MEGALOPTERA (DOBSONFLIES) Archichauliodes 7 7 7 18
TRICHOPTERA (CADDISFLIES) Hydropsyche (Aoteapsyche) 4 31 5 36 90 A
Beraeoptera 8 19 11 1 31 78 VA A
Helicopsyche 10 19 2 21 53
Olinga 9 22 4 26 65 A A
Pycnocentrodes 5 1 1 3
Zelolessica 7 11 2 13 33
DIPTERA (TRUE FLIES) Aphrophila 5 19 21 40 100 A A
Maoridiamesa 3 2 2 5
Orthocladiinae 2 17 1 18 45
Prior to the current 2015-2016 period, 22 taxa had characterised the community at this site on occasions. These have comprised ten ‘highly sensitive’, nine ‘moderately sensitive’, and three ‘tolerant’ taxa i.e. a high proportion of ‘highly sensitive’ taxa as might be expected in the upper reaches of a ringplain river near the National Park. Predominant taxa have included eight ‘highly sensitive’ taxa [mayflies (Nesameletus and Deleatidium), stoneflies (Megaleptoperla and Zelandoperla), hydraenid beetles, and cased caddisflies (Beraeoptera, Helicopsyche, and Olinga)]; four ‘moderately sensitive’ taxa [mayflies (Coloburiscus and Austroclima), elmid beetles, and cranefly (Aphrophila)]; and only one ‘tolerant’ taxon [free-living caddisfly (Hydropsyche-Aoteapsyche)]. Five of these taxa have been characteristic of communities on every occasion to date. Eight of the historically characteristic taxa (all predominant taxa) were dominant in the spring 2015 community. These comprised five ‘highly sensitive’ taxa and three ‘moderately sensitive’ taxa. The summer community was characterised by eleven taxa which comprised seven ‘highly sensitive’ taxa, three ‘moderately sensitive’ taxa, and one ‘tolerant’. Eight of these eleven

132
taxa were dominant in both spring and summer communities which was typical for the site. All five taxa dominant on every previous survey occasion were included amongst these eight taxa (Table 65). The relatively similar seasonal numerical dominances by high proportions of ‘sensitive’ taxa were reflected in the high SQMCIs scores during both spring and summer surveys which were a non-significant 0.4 units apart (Table 159 and Table 160). Taxa recorded as very or extremely abundant during spring and/or summer had characterised this site’s communities on 78 to 100% of past survey occasions.
Predicted stream ‘health’ 3.2.16.1.3The Waingongoro River site near the National Park is 0.7 km downstream of the National Park boundary at an altitude of 540 m asl. Relationships for ringplain streams developed between MCI and site altitude and distance from the National Park boundary (Stark and Fowles, 2009) predict MCI values of 140 (altitude) and 132 (distance) for this site. The historical site median and spring score (both 132 units) were eight units lower than the altitude prediction and equal with the distance predictive value. The summer 2016 score (144 units) was not significantly different from the altitude predictive value but was significantly higher than the distance predictive value. The median value for a ringplain river arising within the National Park at similar altitude (TRC, 2015c) was 134 units. The historical spring, summer and historical median scores were all not significantly different to this value. The REC predicted MCI value (Leathwick, et al. 2009) was 131 units. The historical spring and historical median scores were not significantly different to this value but the summer score was significantly higher.
Temporal trends in 1995 to 2016 data 3.2.16.1.4A LOWESS trend plot with a moving average (tension 0.4) trendline was produced (Figure 88). A non-parametric statistical trend analysis of the MCI data using the Mann-Kendall test was then performed on 21 years of SEM results (1995-2016) from the site in the Waingongoro River near the National Park. The MCI has been chosen as the preferable indicator of ‘stream/river health’ for SEM trend reporting purposes.
Figure 88 LOWESS trend plot of MCI data at the site near the
National Park, Waingongoro River
WGG000115
1994 1996 1998 2000 2002 2004 2006 2008 2010 2012 2014 2016 2018Year
120
122
124
126
128
130
132
134
136
138
140
142
144
146
MCI
val
ue
N = 43 Kendall tau = +0.167 p value = 0.115 FDR p = 0.179

133
A temporal trend of some improvement in MCI scores has been found over the 21 year period. This has not been statistically significant at the 5% level however, although previously (prior to 2008) there had been a statistically significant improvement over the earlier period (1995-2007). After 2007 there was some decline followed by some very recent improvement but the overall trendline range of scores (eight units) remains less than ecologically important. Throughout the period, smoothed MCI scores have indicated ‘very good’ generic river health (Table 2).
Temporal trends in 2006 to 2016 data 3.2.16.1.5A LOWESS trend plot with a moving average (tension 0.4) was produced (Figure 89). A non-parametric statistical trend analysis of the MCI data using the Mann-Kendall test was then performed on the most recent ten years of SEM results (2006-2016) from the site in the Waingongoro River near the National Park.
Figure 89 LOWESS trend plot of ten years of MCI data at the site
near the National Park, Waingongoro River
A highly non-significant negative trend in MCI scores was found at this site. The full dataset showed a very minor positive trend but both trends were not significant. The trendline was in the ‘very good’ generic river health (Table 2) range.
Opunake Road site (WGG000150) 3.2.16.2 Taxa richness and MCI 3.2.16.2.1
Thirty-eight surveys have been undertaken in the Waingongoro River at this upper mid-reach site at Opunake Road (approximately 7km downstream of the National Park) between October 1995 and February 2015. These results are summarised in Table 66, together with the results from the current period, and illustrated in Figure 90.
Table 66 Results of previous surveys performed in the Waingongoro River at Opunake Road together with spring 2015 and summer 2016 results.
Site code
SEM data ( 1995 to Feb 2015) 2015-2016 surveys
No of surveys
Taxa numbers MCI values Oct 2015 Mar 2016
Range Median Range Median Taxa no MCI Taxa no MCI
WGG000150 40 23-39 28 119-139 130 23 124 25 125
WGG000115
2006 2008 2010 2012 2014 2016 2018Year
120
122
124
126
128
130
132
134
136
138
140
142
144
146
MC
I va
lue
N = 20 Kendall tau = -0.005 p value = 0.973 FDR p = 0.974
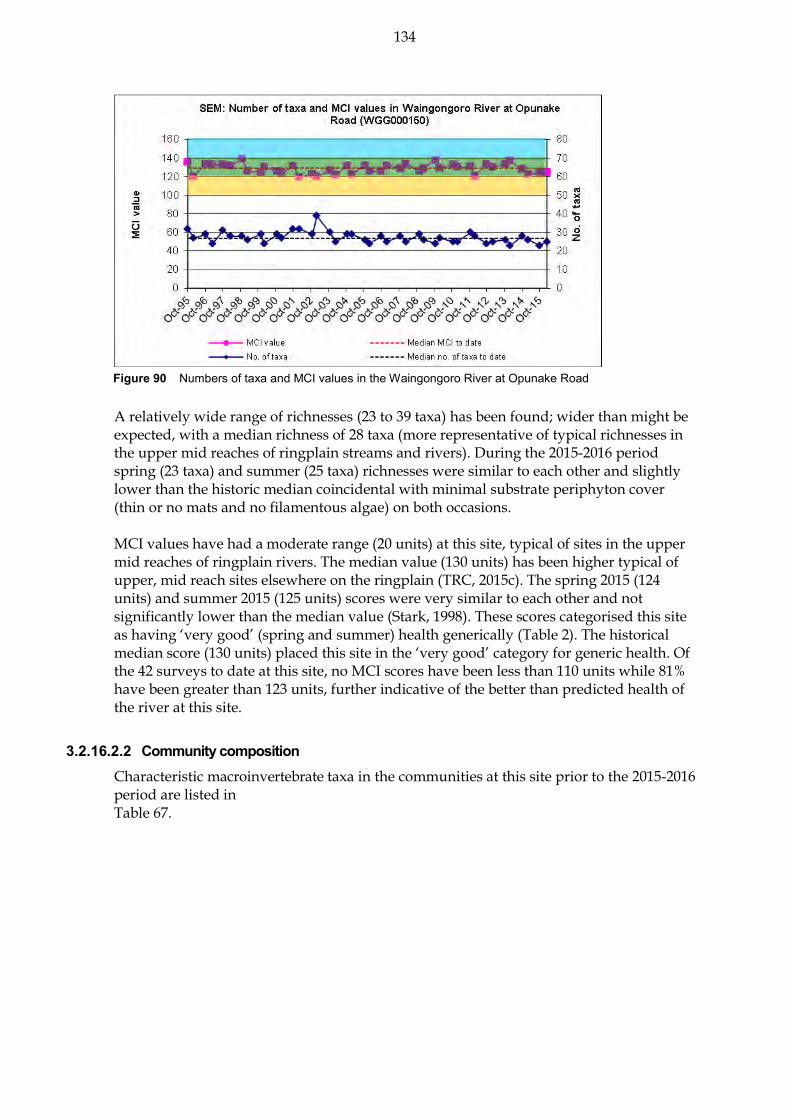
134
Figure 90 Numbers of taxa and MCI values in the Waingongoro River at Opunake Road
A relatively wide range of richnesses (23 to 39 taxa) has been found; wider than might be expected, with a median richness of 28 taxa (more representative of typical richnesses in the upper mid reaches of ringplain streams and rivers). During the 2015-2016 period spring (23 taxa) and summer (25 taxa) richnesses were similar to each other and slightly lower than the historic median coincidental with minimal substrate periphyton cover (thin or no mats and no filamentous algae) on both occasions. MCI values have had a moderate range (20 units) at this site, typical of sites in the upper mid reaches of ringplain rivers. The median value (130 units) has been higher typical of upper, mid reach sites elsewhere on the ringplain (TRC, 2015c). The spring 2015 (124 units) and summer 2015 (125 units) scores were very similar to each other and not significantly lower than the median value (Stark, 1998). These scores categorised this site as having ‘very good’ (spring and summer) health generically (Table 2). The historical median score (130 units) placed this site in the ‘very good’ category for generic health. Of the 42 surveys to date at this site, no MCI scores have been less than 110 units while 81% have been greater than 123 units, further indicative of the better than predicted health of the river at this site.
Community composition 3.2.16.2.2Characteristic macroinvertebrate taxa in the communities at this site prior to the 2015-2016 period are listed in Table 67.
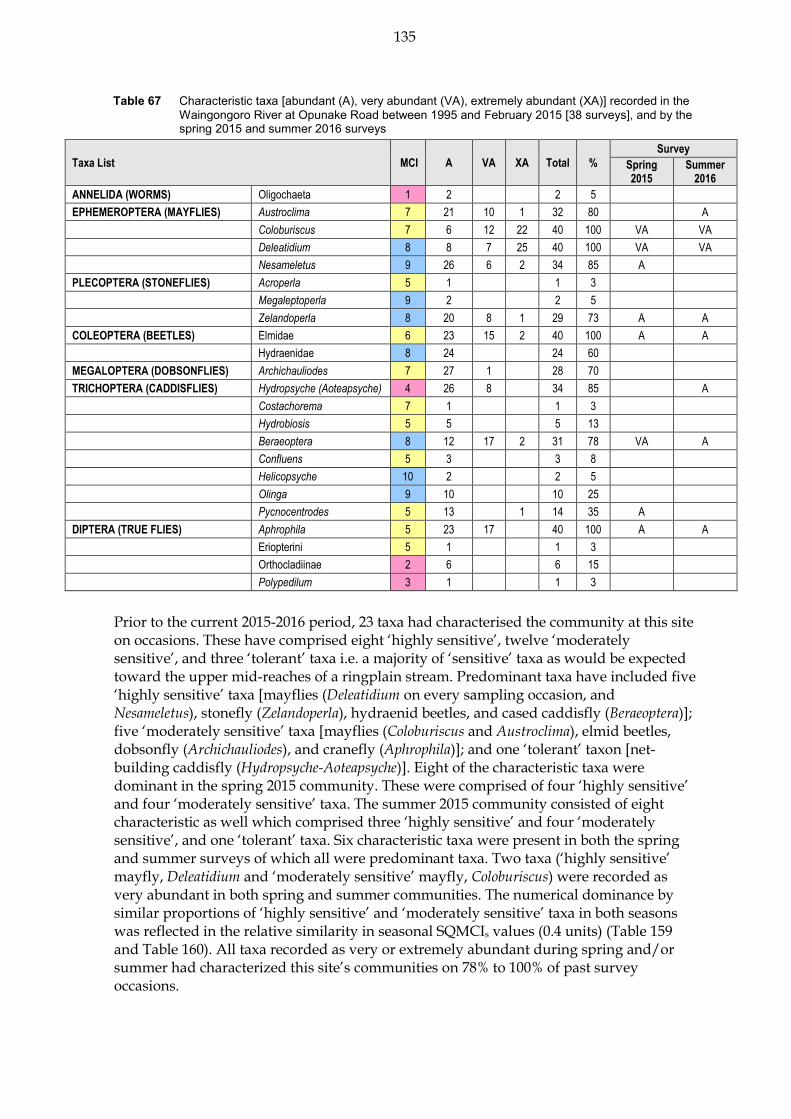
135
Table 67 Characteristic taxa [abundant (A), very abundant (VA), extremely abundant (XA)] recorded in the Waingongoro River at Opunake Road between 1995 and February 2015 [38 surveys], and by the spring 2015 and summer 2016 surveys
Taxa List MCI A VA XA Total %
Survey
Spring 2015
Summer 2016
ANNELIDA (WORMS) Oligochaeta 1 2 2 5
EPHEMEROPTERA (MAYFLIES) Austroclima 7 21 10 1 32 80 A
Coloburiscus 7 6 12 22 40 100 VA VA
Deleatidium 8 8 7 25 40 100 VA VA
Nesameletus 9 26 6 2 34 85 A
PLECOPTERA (STONEFLIES) Acroperla 5 1 1 3
Megaleptoperla 9 2 2 5
Zelandoperla 8 20 8 1 29 73 A A
COLEOPTERA (BEETLES) Elmidae 6 23 15 2 40 100 A A
Hydraenidae 8 24 24 60
MEGALOPTERA (DOBSONFLIES) Archichauliodes 7 27 1 28 70
TRICHOPTERA (CADDISFLIES) Hydropsyche (Aoteapsyche) 4 26 8 34 85 A
Costachorema 7 1 1 3
Hydrobiosis 5 5 5 13
Beraeoptera 8 12 17 2 31 78 VA A
Confluens 5 3 3 8
Helicopsyche 10 2 2 5
Olinga 9 10 10 25
Pycnocentrodes 5 13 1 14 35 A
DIPTERA (TRUE FLIES) Aphrophila 5 23 17 40 100 A A
Eriopterini 5 1 1 3
Orthocladiinae 2 6 6 15
Polypedilum 3 1 1 3
Prior to the current 2015-2016 period, 23 taxa had characterised the community at this site on occasions. These have comprised eight ‘highly sensitive’, twelve ‘moderately sensitive’, and three ‘tolerant’ taxa i.e. a majority of ‘sensitive’ taxa as would be expected toward the upper mid-reaches of a ringplain stream. Predominant taxa have included five ‘highly sensitive’ taxa [mayflies (Deleatidium on every sampling occasion, and Nesameletus), stonefly (Zelandoperla), hydraenid beetles, and cased caddisfly (Beraeoptera)]; five ‘moderately sensitive’ taxa [mayflies (Coloburiscus and Austroclima), elmid beetles, dobsonfly (Archichauliodes), and cranefly (Aphrophila)]; and one ‘tolerant’ taxon [net-building caddisfly (Hydropsyche-Aoteapsyche)]. Eight of the characteristic taxa were dominant in the spring 2015 community. These were comprised of four ‘highly sensitive’ and four ‘moderately sensitive’ taxa. The summer 2015 community consisted of eight characteristic as well which comprised three ‘highly sensitive’ and four ‘moderately sensitive’, and one ‘tolerant’ taxa. Six characteristic taxa were present in both the spring and summer surveys of which all were predominant taxa. Two taxa (‘highly sensitive’ mayfly, Deleatidium and ‘moderately sensitive’ mayfly, Coloburiscus) were recorded as very abundant in both spring and summer communities. The numerical dominance by similar proportions of ‘highly sensitive’ and ‘moderately sensitive’ taxa in both seasons was reflected in the relative similarity in seasonal SQMCIs values (0.4 units) (Table 159 and Table 160). All taxa recorded as very or extremely abundant during spring and/or summer had characterized this site’s communities on 78% to 100% of past survey occasions.

136
N = 43 Kendall tau = +0.011 p value = 0.915 FDR p = 0.932
Predicted stream ‘health’ 3.2.16.2.3The Waingongoro River site at Opunake Road is 7.2 km downstream of the National Park boundary at an altitude of 380 m asl. Relationships for ringplain streams developed between MCI and site altitude and distance from the National Park boundary (Stark and Fowles, 2009), predict MCI values of 123 (altitude) and 110 (distance) for this site. The historical site median (130) is seven units higher than the altitude prediction and a significant (Stark, 1998) 20 units higher than the distance predictive value. The spring 2015 and summer 2016 survey scores (124 units and 125 units)) were not significantly different to the altitude predictive value but were significantly higher than the distance predictive value (Stark, 1998). The median value for a ringplain river arising within the National Park at similar altitude (TRC, 2015c) was 129 units. The historical spring, summer and historical median scores were all not significantly different to this value. The REC predicted MCI value (Leathwick, et al. 2009) was 124 units. The historical spring, summer and historical median scores were also not significantly different to this value.
Temporal trends in 1995 to 2016 data 3.2.16.2.4A LOWESS trend plot with a moving average (tension 0.4) trendline was produced (Figure 91). A non-parametric statistical trend analysis of the MCI data using the Mann-Kendall test was then performed on 21 years of SEM results (1995-2016) from the site in the Waingongoro River at Opunake Road. The MCI has been chosen as the preferable indicator of ‘stream/river health’ for SEM trend reporting purposes.
Figure 91 LOWESS trend plot of MCI data at the Opunake Road site, Waingongoro River
An overall temporal trend of virtually no change in MCI scores has occurred in the upper mid-reaches of the river (some seven km below the National Park). The trendline range of scores (six units) has not been ecologically important over the 21 year period. Localised erosion had caused sediment deposition on the riverbed during 1999 with a subsequent five year decline in MCI scores which was of minor ecological importance (six units). This decline ceased with a gradual improvement in MCI scores towards earlier levels over the latter twelve years. The erosion event was very localised and site specific, as corresponding biological and physiochemical monitoring data showed no significant trends at the nearest downstream site (Eltham Road). The trendline range of scores have
137
N = 20 Kendall tau = -0.097 p value = 0.551 FDR p = 0.742
been consistently indicative of ‘very good’ generic river health although trending downward toward ‘good’ immediately following the erosion event (Table 2).
Temporal trends in 2006 to 2016 data 3.2.16.2.5A LOWESS trend plot with a moving average (tension 0.4) trendline was produced (Figure 92). A non-parametric statistical trend analysis of the MCI data using the Mann-Kendall test was then performed on the ten more recent years of SEM results (2007-2016) from the site in the Waingongoro River at Opunake Road. The MCI has been chosen as the preferable indicator of ‘stream/river health’ for SEM trend reporting purposes.
Figure 92 LOWESS trend plot of ten years of MCI data at the Opunake Road site, Waingongoro River
A minor non-significant negative trend in MCI scores has occurred in the upper mid-reaches of the river (some seven km below the National Park). Though a large decrease in the trend was apparent from 2014 to 2015 overall the trend was highly non-significant congruent with the results from the full dataset. The trendline was indicative of ‘very good’ generic river health ‘good’ (Table 2).
Eltham Road site (WGG000500) 3.2.16.3 Taxa richness and MCI 3.2.16.3.1
Forty-two surveys have been undertaken in the Waingongoro River at this mid-reach site at Eltham Road between October 1995 and February 2016. These results are summarised in Table 68, together with the results from the current period, and illustrated in Figure 93.
Table 68 Results of previous surveys performed in the Waingongoro River at Eltham Road, together with spring 2015 and summer 2016 results.
Site code
SEM data ( 1995 to Feb 2015) 2015-2016 surveys
No of surveys
Taxa numbers MCI values Oct 2015 Mar 2016
Range Median Range Median Taxa no MCI Taxa no MCI
WGG000500 44 16 - 32 23 91-124 102 15 112 15 109
WGG000150
2006 2008 2010 2012 2014 2016 2018Year
118
120
122
124
126
128
130
132
134
136
138
140
MC
I va
lue
138
Figure 93 Numbers of taxa and MCI values in the Waingongoro River at Eltham Road
A wide range of richnesses (16 to 32 taxa) has been found with a median richness of 23 taxa, typical of richnesses in the mid reaches of ringplain streams and rivers. During the 2015-2016 period spring (15 taxa) and summer (15 taxa) richnesses were equivalent and were lower than the historical median taxa number by eight taxa coincident with relatively little periphyton habitat on the riverbed. MCI values have had a relatively wide range (33 units) at this site, more typical of sites in the mid reaches of ringplain rivers. The historical median value (102 units) has been typical of mid reach sites elsewhere on the ringplain (TRC, 2015c) with the spring 2015 (112 units) and summer 2016 (109 units) scores showing little seasonal variation and were both non-significantly higher than the historical median (coincident with minimal periphyton substrate cover in spring and summer respectively). These scores categorised this site as having ‘good’ (spring and summer) health generically (Table 2). The historical median score (102 units) placed this site in the ‘good’ category for generic health. Of the 46 surveys to date at this site, 11% of MCI scores have been less than 97 units while 28% have been greater than 105 units, with the majority of these higher scores in more recent years.
Community composition 3.2.16.3.2Characteristic macroinvertebrate taxa in the communities at this site prior to the 2015-2016 period are listed in Table 69.

139
Table 69 Characteristic taxa [abundant (A), very abundant (VA), extremely abundant (XA)] recorded in the Waingongoro River at Eltham Road between 1995 and February 2015 [44 surveys], and by the spring 2015 and summer 2016 surveys
Taxa List MCI score
A VA XA Total %
Survey
Spring 2015
Summer 2016
NEMERTEA Nemertea 3 4 4 9
ANNELIDA (WORMS) Oligochaeta 1 7 5 12 27
MOLLUSCA Potamopyrgus 4 6 1 7 16
EPHEMEROPTERA (MAYFLIES) Austroclima 7 9 3 12 27
Coloburiscus 7 19 8 27 61 A A
Deleatidium 8 3 8 22 33 75 VA XA
Nesameletus 9 1 1 2
PLECOPTERA (STONEFLIES) Zelandobius 5 6 1 7 16 A
COLEOPTERA (BEETLES) Elmidae 6 10 21 11 42 95 A A
Hydraenidae 8 1 1 2
MEGALOPTERA (DOBSONFLIES) Archichauliodes 7 24 2 26 59
TRICHOPTERA (CADDISFLIES) Hydropsyche (Aoteapsyche) 4 11 16 10 37 84 VA
Costachorema 7 16 16 36
Hydrobiosis 5 24 3 27 61 A
Beraeoptera 8 1 1 2
Oxyethira 2 2 2 5
Pycnocentrodes 5 11 2 13 30 A
DIPTERA (TRUE FLIES) Aphrophila 5 9 9 20
Eriopterini 5 7 7 16
Maoridiamesa 3 10 5 2 17 39
Orthocladiinae 2 15 6 3 24 55
Tanytarsini 3 8 1 9 20
Ceratopogonidae 3 1 1 2
Empididae 3 3 3 7
Austrosimulium 3 13 13 30
Prior to the current 2015-2016 period, 25 taxa had characterised the community at this site on occasions. These have comprised four ‘highly sensitive’, ten ‘moderately sensitive’, and eleven ‘tolerant’ taxa i.e. a minority of ‘highly sensitive’ taxa and a downstream increase in ‘tolerant’ taxa as would be expected in the mid reaches of a ringplain river. Predominant taxa have included one ‘highly sensitive’ taxon [mayfly (Deleatidium)]; four ‘moderately sensitive’ taxa [mayfly (Coloburiscus), elmid beetles, free-living caddisfly (Hydrobiosis), and dobsonfly (Archichauliodes)]; and two ‘tolerant’ taxa [free-living caddisfly (Hydropsyche-Aoteapsyche) and orthoclad midges]. The spring 2015 community consisted of five historically characteristic taxa. These comprised one ‘highly sensitive’ and four ‘moderately sensitive’ taxa. The summer 2016 community consisted of five historically characteristic taxa. These comprised one ‘highly sensitive’, three ‘moderately sensitive’, and one ‘tolerant’ taxa. Three of the seven characteristic taxa were present in both spring and summer surveys (Table 69). There was little difference between SQMCIs scores (0.2 units) as increases in the ‘tolerant’ caddisfly Hydropsyche-Aoteapsyche were balanced out by increases in the ‘highly sensitive’ mayfly Deleatidium (Table 159 and Table 160). The two taxa recorded as very or extremely abundant during spring and/or summer have characterised this site’s communities on 75% to 84% of past survey occasions.

140
Predicted stream ‘health’ 3.2.16.3.3The Waingongoro River site at Eltham Road is 23.0 km downstream of the National Park boundary at an altitude of 200 m asl. Relationships for ringplain streams developed between MCI and site altitude and distance from the National Park boundary (Stark and Fowles, 2009), predict MCI values of 105 (altitude) and 97 (distance) for this site. The historical site median (102) is three units lower than the altitude prediction and five units higher than the distance predictive value. The spring 2015 and summer survey scores (112 and 109 units) were not significantly different to the attitude predictive value but were significantly higher than the distance predictive value (Stark, 1998). The median value for a ringplain river arising within the National Park at similar altitude (TRC, 2015c) was 101 units. The historical spring score was significantly higher (by 11 units) than this value but the summer and historical median scores were not significantly different. The REC predicted MCI value (Leathwick, et al. 2009) was 110 units. The historical spring, summer and historical median scores were not significantly different to this value.
Temporal trends in 1995 to 2016 data 3.2.16.3.4A LOWESS trend plot with a moving average (tension 0.4) was produced (Figure 94). A non-parametric statistical trend analysis of the MCI data using the Mann-Kendall test was then performed on 21 years of SEM results (1995-2016) from the site in the Waingongoro River at Eltham Road. The MCI has been chosen as the preferable indicator of ‘stream/river health’ for SEM trend reporting purposes.
Figure 94 LOWESS trend plot of MCI data at the Eltham Road site, Waingongoro River
A significant positive temporal trend in MCI scores has been found over the 21 year period (FDR p< 0.01). This has been more pronounced since 2001 but scores plateaued for about three years before a more recent further improvement and another most recent plateau in scores. The trendline range of scores (11 units) has been of marginal ecological importance over the 21 year period due to the recent plateau in scores. The trendline MCI scores consistently bordered averaged ‘fair’ generic health (Table 2) prior to 2003 and since then have been in the ‘good’ category.
WGG000500
1994 1996 1998 2000 2002 2004 2006 2008 2010 2012 2014 2016 2018Year
85
90
95
100
105
110
115
120
125
130
MC
I va
lue
N = 46 Kendall tau = +0.448 p value < 0.001 FDR p < 0.001
141
Temporal trends in 2006 to 2016 data 3.2.16.3.5A LOWESS trend plot with a moving average (tension 0.4) trendline was produced (Figure 94). A non-parametric statistical trend analysis of the MCI data using the Mann-Kendall test was then performed on the most recent ten years of SEM results (2006-2016) from the site in the Waingongoro River at Eltham Road.
Figure 95 LOWESS trend plot of ten years of MCI data at the Eltham Road site, Waingongoro River
A non-significant positive trend in MCI scores has been found over the ten year period in contrast with the full dataset which had a positive, highly significant, trend. However, the trend was significant before FDR adjustment with the trendline increasing from 101 to 108 MCI units though two declines in the trendline are also evident. The trendline was in the ‘good’ generic health category (Table 2).
Stuart Road site (WGG000665) 3.2.16.4 Taxa richness and MCI 3.2.16.4.1
Thirty-eight surveys have been undertaken in the Waingongoro River at this mid-reach site at Stuart Road between October 1995 and February, 2015. These results are summarised in Table 70, together with the results from the current period, and illustrated in Figure 96.
Table 70 Results of previous surveys performed in the Waingongoro River at Stuart Road, together with spring 2015 and summer 2016 results.
Site code
SEM data ( 1995 to Feb 2015) 2015-2016 surveys
No of surveys
Taxa numbers MCI values Oct 2015 Mar 2016
Range Median Range Median Taxa no MCI Taxa no MCI
WGG000665 40 14-30 20 77-111 95 19 96 21 89
WGG000500
2006 2008 2010 2012 2014 2016 2018Year
90
95
100
105
110
115
120
125
130
MC
I va
lue
N = 22 Kendall tau = +0.367 p value = 0.017 FDR p = 0.122
142
Figure 96 Numbers of taxa and MCI values in the Waingongoro River at Stuart Road
A wide range of richnesses (14 to 30 taxa) has been found with a median richness of 20 taxa (more representative of typical richnesses in the mid reaches of ringplain streams and rivers). During the 2015-2016 period spring (19 taxa) and summer (21 taxa) richnesses were very similar to each other and to the historic median (20). MCI values have had a moderately wide range (34 units) at this site, typical of sites in the mid reaches of ringplain rivers. The median value (95 units) has been lower than typical of mid reach sites elsewhere on the ringplain (TRC, 2015c). The spring 2015 (96 units) and summer 2016 (89 units) scores significantly were not significantly different from each other or to the historic median. These scores categorised this site as having ‘fair’ (spring and summer) health generically (Table 2). The historical median score (95 units) placed this site in the ‘fair’ category for generic health. Of the 42 surveys to date at this site, 45% of MCI scores have been less than 94 units while only 21% have been greater than 103 units.
Community composition 3.2.16.4.2Characteristic macroinvertebrate taxa in the communities at this site prior to the 2015-2016 period are listed in Table 71.
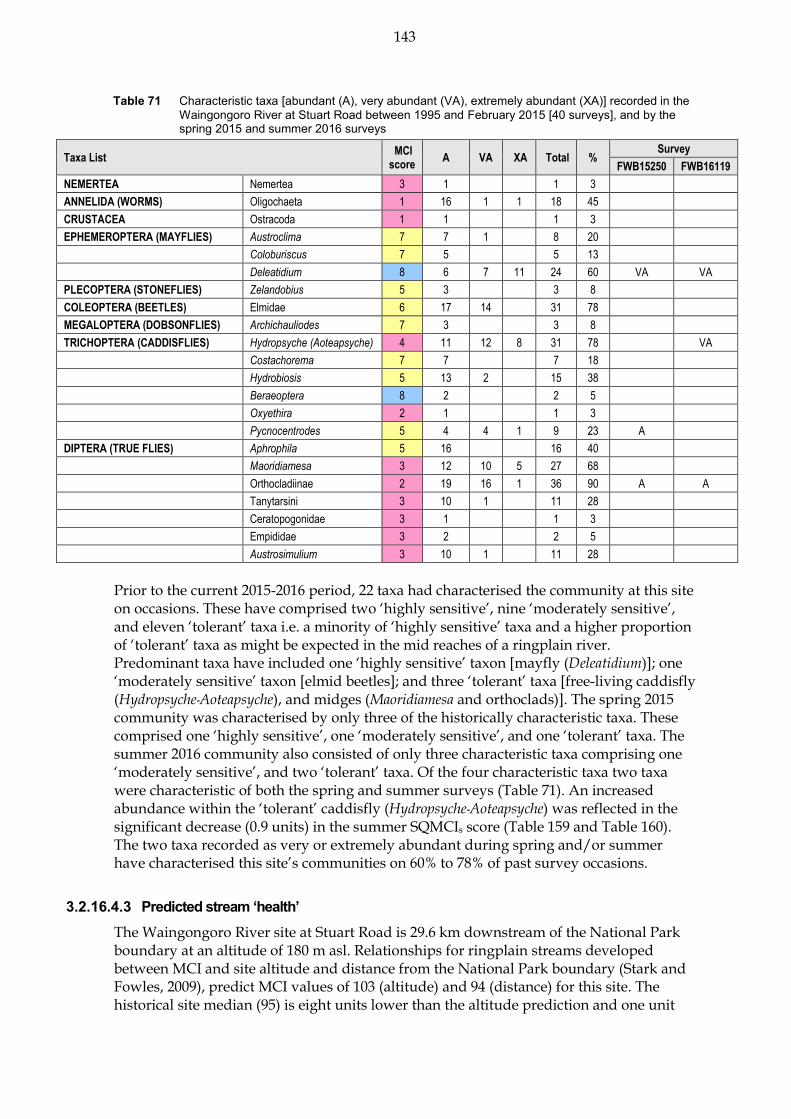
143
Table 71 Characteristic taxa [abundant (A), very abundant (VA), extremely abundant (XA)] recorded in the Waingongoro River at Stuart Road between 1995 and February 2015 [40 surveys], and by the spring 2015 and summer 2016 surveys
Taxa List MCI score
A VA XA Total % Survey
FWB15250 FWB16119
NEMERTEA Nemertea 3 1 1 3
ANNELIDA (WORMS) Oligochaeta 1 16 1 1 18 45
CRUSTACEA Ostracoda 1 1 1 3
EPHEMEROPTERA (MAYFLIES) Austroclima 7 7 1 8 20
Coloburiscus 7 5 5 13
Deleatidium 8 6 7 11 24 60 VA VA
PLECOPTERA (STONEFLIES) Zelandobius 5 3 3 8
COLEOPTERA (BEETLES) Elmidae 6 17 14 31 78
MEGALOPTERA (DOBSONFLIES) Archichauliodes 7 3 3 8
TRICHOPTERA (CADDISFLIES) Hydropsyche (Aoteapsyche) 4 11 12 8 31 78 VA
Costachorema 7 7 7 18
Hydrobiosis 5 13 2 15 38
Beraeoptera 8 2 2 5
Oxyethira 2 1 1 3
Pycnocentrodes 5 4 4 1 9 23 A
DIPTERA (TRUE FLIES) Aphrophila 5 16 16 40
Maoridiamesa 3 12 10 5 27 68
Orthocladiinae 2 19 16 1 36 90 A A
Tanytarsini 3 10 1 11 28
Ceratopogonidae 3 1 1 3
Empididae 3 2 2 5
Austrosimulium 3 10 1 11 28
Prior to the current 2015-2016 period, 22 taxa had characterised the community at this site on occasions. These have comprised two ‘highly sensitive’, nine ‘moderately sensitive’, and eleven ‘tolerant’ taxa i.e. a minority of ‘highly sensitive’ taxa and a higher proportion of ‘tolerant’ taxa as might be expected in the mid reaches of a ringplain river. Predominant taxa have included one ‘highly sensitive’ taxon [mayfly (Deleatidium)]; one ‘moderately sensitive’ taxon [elmid beetles]; and three ‘tolerant’ taxa [free-living caddisfly (Hydropsyche-Aoteapsyche), and midges (Maoridiamesa and orthoclads)]. The spring 2015 community was characterised by only three of the historically characteristic taxa. These comprised one ‘highly sensitive’, one ‘moderately sensitive’, and one ‘tolerant’ taxa. The summer 2016 community also consisted of only three characteristic taxa comprising one ‘moderately sensitive’, and two ‘tolerant’ taxa. Of the four characteristic taxa two taxa were characteristic of both the spring and summer surveys (Table 71). An increased abundance within the ‘tolerant’ caddisfly (Hydropsyche-Aoteapsyche) was reflected in the significant decrease (0.9 units) in the summer SQMCIs score (Table 159 and Table 160). The two taxa recorded as very or extremely abundant during spring and/or summer have characterised this site’s communities on 60% to 78% of past survey occasions.
Predicted stream ‘health’ 3.2.16.4.3The Waingongoro River site at Stuart Road is 29.6 km downstream of the National Park boundary at an altitude of 180 m asl. Relationships for ringplain streams developed between MCI and site altitude and distance from the National Park boundary (Stark and Fowles, 2009), predict MCI values of 103 (altitude) and 94 (distance) for this site. The historical site median (95) is eight units lower than the altitude prediction and one unit
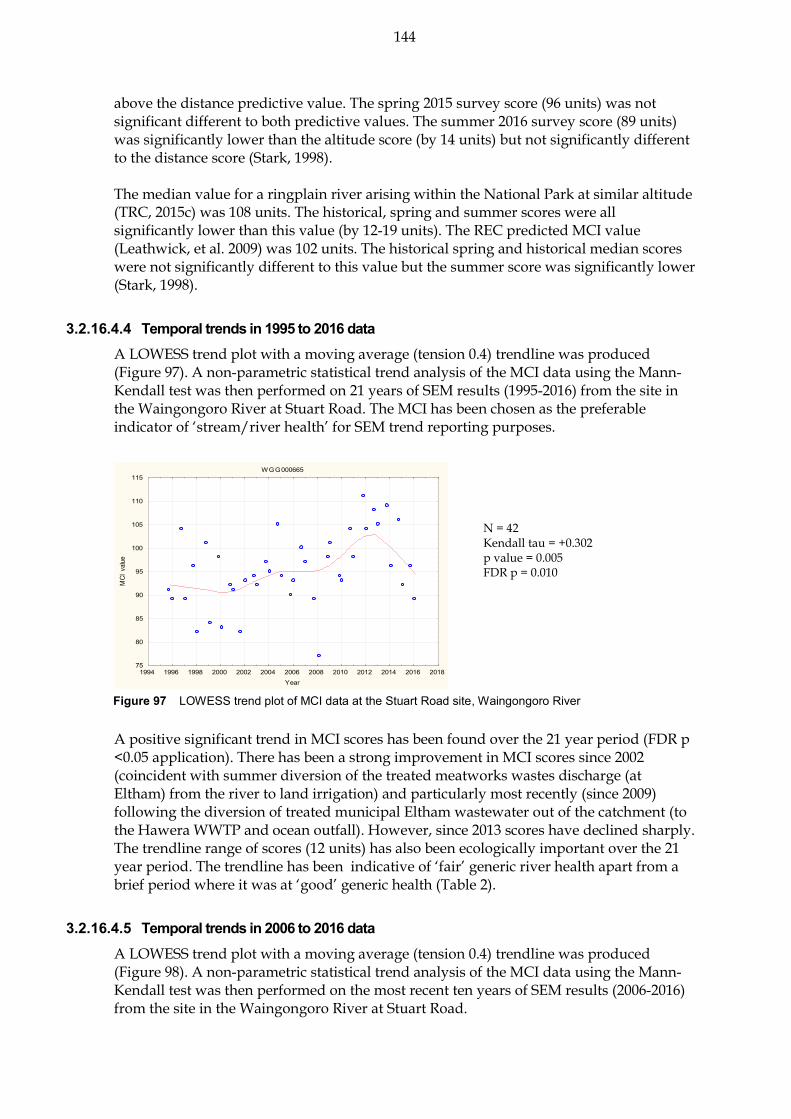
144
N = 42 Kendall tau = +0.302 p value = 0.005 FDR p = 0.010
above the distance predictive value. The spring 2015 survey score (96 units) was not significant different to both predictive values. The summer 2016 survey score (89 units) was significantly lower than the altitude score (by 14 units) but not significantly different to the distance score (Stark, 1998). The median value for a ringplain river arising within the National Park at similar altitude (TRC, 2015c) was 108 units. The historical, spring and summer scores were all significantly lower than this value (by 12-19 units). The REC predicted MCI value (Leathwick, et al. 2009) was 102 units. The historical spring and historical median scores were not significantly different to this value but the summer score was significantly lower (Stark, 1998).
Temporal trends in 1995 to 2016 data 3.2.16.4.4A LOWESS trend plot with a moving average (tension 0.4) trendline was produced (Figure 97). A non-parametric statistical trend analysis of the MCI data using the Mann-Kendall test was then performed on 21 years of SEM results (1995-2016) from the site in the Waingongoro River at Stuart Road. The MCI has been chosen as the preferable indicator of ‘stream/river health’ for SEM trend reporting purposes.
Figure 97 LOWESS trend plot of MCI data at the Stuart Road site, Waingongoro River
A positive significant trend in MCI scores has been found over the 21 year period (FDR p <0.05 application). There has been a strong improvement in MCI scores since 2002 (coincident with summer diversion of the treated meatworks wastes discharge (at Eltham) from the river to land irrigation) and particularly most recently (since 2009) following the diversion of treated municipal Eltham wastewater out of the catchment (to the Hawera WWTP and ocean outfall). However, since 2013 scores have declined sharply. The trendline range of scores (12 units) has also been ecologically important over the 21 year period. The trendline has been indicative of ‘fair’ generic river health apart from a brief period where it was at ‘good’ generic health (Table 2).
Temporal trends in 2006 to 2016 data 3.2.16.4.5A LOWESS trend plot with a moving average (tension 0.4) trendline was produced (Figure 98). A non-parametric statistical trend analysis of the MCI data using the Mann-Kendall test was then performed on the most recent ten years of SEM results (2006-2016) from the site in the Waingongoro River at Stuart Road.
WGG000665
1994 1996 1998 2000 2002 2004 2006 2008 2010 2012 2014 2016 2018Year
75
80
85
90
95
100
105
110
115
MCI
valu
e

145
N = 20 Kendall tau = +0.117 p value = 0.471 FDR p = 0.742
Figure 98 LOWESS trend plot of ten years of MCI data at the Stuart Road site, Waingongoro River
A positive non-significant trend in MCI scores has been found over the ten year period in contrast to the positive significant trend found in the full dataset. An increase in the trendline from 2009 to 2013 was coupled with a larger decline from 2013 onwards. The trendline was indicative of ‘fair’ generic river health apart from a brief period where it was at ‘good’ generic health (Table 2).
SH45 site (WGG000895) 3.2.16.5 Taxa richness and MCI 3.2.16.5.1
Forty-one surveys have been undertaken in the Waingongoro River at this lower reach site at SH45 between October 1995 and February, 2015. These results are summarised in Figure 106, together with the results from the current period, and illustrated in Figure 99.
Table 72 Results of previous surveys performed in the Waingongoro River at SH45, together with spring 2015 and summer 2016 results
Site code
SEM data ( 1995 to Feb 2015) 2015-2016 surveys
No of surveys
Taxa numbers MCI values Oct 2015 Mar 2016
Range Median Range Median Taxa no MCI Taxa no MCI
WGG000895 41 16-24 20 73-106 95 13 83 24 94
WGG000665
2006 2008 2010 2012 2014 2016 2018Year
75
80
85
90
95
100
105
110
115
MC
I va
lue
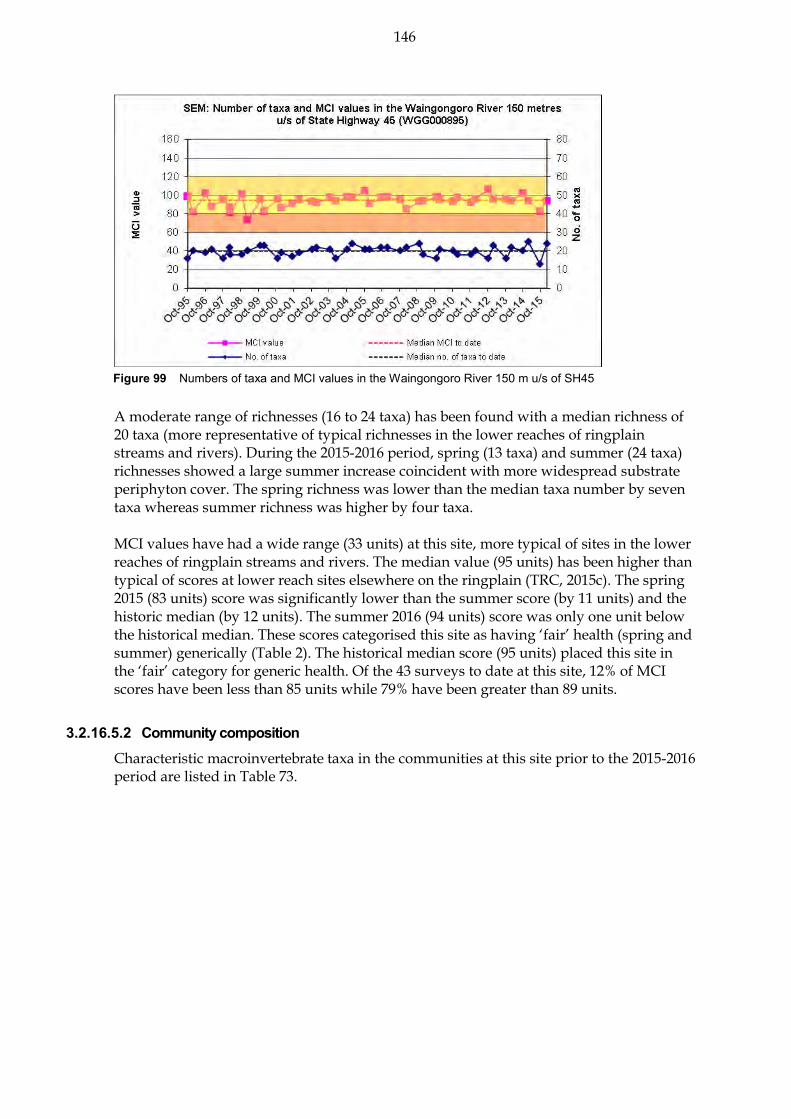
146
Figure 99 Numbers of taxa and MCI values in the Waingongoro River 150 m u/s of SH45
A moderate range of richnesses (16 to 24 taxa) has been found with a median richness of 20 taxa (more representative of typical richnesses in the lower reaches of ringplain streams and rivers). During the 2015-2016 period, spring (13 taxa) and summer (24 taxa) richnesses showed a large summer increase coincident with more widespread substrate periphyton cover. The spring richness was lower than the median taxa number by seven taxa whereas summer richness was higher by four taxa. MCI values have had a wide range (33 units) at this site, more typical of sites in the lower reaches of ringplain streams and rivers. The median value (95 units) has been higher than typical of scores at lower reach sites elsewhere on the ringplain (TRC, 2015c). The spring 2015 (83 units) score was significantly lower than the summer score (by 11 units) and the historic median (by 12 units). The summer 2016 (94 units) score was only one unit below the historical median. These scores categorised this site as having ‘fair’ health (spring and summer) generically (Table 2). The historical median score (95 units) placed this site in the ‘fair’ category for generic health. Of the 43 surveys to date at this site, 12% of MCI scores have been less than 85 units while 79% have been greater than 89 units.
Community composition 3.2.16.5.2Characteristic macroinvertebrate taxa in the communities at this site prior to the 2015-2016 period are listed in Table 73.

147
Table 73 Characteristic taxa [abundant (A), very abundant (VA), extremely abundant (XA)] recorded in the Waingongoro River at SH45 between 1995 and February 2015 [41 surveys], and by the spring 2015 and summer 2016 surveys
Taxa List MCI A VA XA Total %
Survey
Spring 2015
Summer 2016
NEMERTEA Nemertea 3 3 3 7
ANNELIDA (WORMS) Oligochaeta 1 19 12 3 34 83 A
Lumbricidae 5 4 4 10
MOLLUSCA Latia 5 2 2 5
Potamopyrgus 4 13 17 8 38 93 XA
EPHEMEROPTERA (MAYFLIES) Austroclima 7 3 1 4 10
Deleatidium 8 12 6 5 23 56 A
PLECOPTERA (STONEFLIES) Zelandobius 5 4 4 10
COLEOPTERA (BEETLES) Elmidae 6 14 12 7 33 80
MEGALOPTERA (DOBSONFLIES) Archichauliodes 7 4 4 10
TRICHOPTERA (CADDISFLIES) Hydropsyche (Aoteapsyche) 4 14 17 9 40 98 VA
Costachorema 7 2 2 5
Hydrobiosis 5 16 2 18 44
Pycnocentrodes 5 9 16 13 38 93 VA VA
DIPTERA (TRUE FLIES) Aphrophila 5 7 3 10 24
Maoridiamesa 3 13 5 18 44
Orthocladiinae 2 13 7 1 21 51 A
Polypedilum 3 A
Tanytarsini 3 4 1 5 12
Austrosimulium 3 6 6 15 A
Prior to the current 2015-2016 period, 19 taxa had characterised the community at this site on occasions. These have comprised one ‘highly sensitive’, ten ‘moderately sensitive’, and eight ‘tolerant’ taxa i.e. a minority of ‘highly sensitive’ taxa and relatively high proportion of ‘tolerant’ taxa as would be expected in the lower reaches of a ringplain river. Predominant taxa have included one ‘highly sensitive’ taxon [mayfly (Deleatidium)]; two ‘moderately sensitive’ taxa [elmid beetles and caddisfly (Pycnocentrodes)]; and four ‘tolerant’ taxa [oligochaete worms, snail (Potamopyrgus), net-building caddisfly (Hydropsyche-Aoteapsyche), and orthoclad midges)]. The spring 2015 community consisted of three historically characteristic taxa. These comprised one ‘highly sensitive’, one ‘moderately sensitive’, and one ‘tolerant’ taxa. The summer 2016 community consisted of six characteristic taxa comprising one ‘moderately sensitive’ and five ‘tolerant’ taxa. Out of the eight characteristic taxa only one taxon was present in both spring and summer (Table 73). Despite the differences in seasonal dominances and an increase in abundance of ‘tolerant’ snails (Potamopyrgus) and caddisfly (Hydropsyche-Aoteapsyche) a small, non-significant, decrease of 0.7 units in SQMCIs score occurred during summer (Table 159 and Table 160). The three taxa recorded as very abundant during spring and/or summer have characterised this site’s communities on 93% to 98% of past survey occasions.
Predicted stream ‘health’ 3.2.16.5.3The Waingongoro River site at SH45 is 63.0 km downstream of the National Park boundary at an altitude of 40 m asl. Relationships for ringplain streams developed between MCI and site altitude and distance from the National Park boundary (Stark and

148
Fowles, 2009), predict MCI values of 89 (altitude) and 85 (distance) for this site. The historical site median (95) is six units higher than the altitude prediction and ten units higher than the predictive distance value. The spring 2015 survey (83 units) and summer 2016 scores (94 units) were both not significantly different to either predictive values (Stark, 1998). The median value for a ringplain river arising within the National Park at similar altitude (TRC, 2015c) was 93 units. The historical, spring and summer scores were all not significantly different to the TRC, 2015c value. The REC predicted MCI value (Leathwick, et al. 2009) was 92 units. The historical, spring and summer scores were also not significantly different to this value (Stark, 1998).
Temporal trends in 1995 to 2016 data 3.2.16.5.4A LOWESS trend plot with a moving average (tension 0.4) trendline was produced (Figure 100). A non-parametric statistical trend analysis of the MCI data using the Mann-Kendall test was then performed on 21 years of SEM results (1995-2016) from the site in the Waingongoro River at SH45. The MCI has been chosen as the preferable indicator of ‘stream/river health’ for SEM trend reporting purposes.
Figure 100 LOWESS trend plot of MCI data for the SH45 site, Waingongoro River
A positive trend in MCI scores has been found over the 21 year period, particularly since 2000 followed by a general plateauing in trend since 2005, but the overall trend has not been statistically significant. The narrow trendline range (5 units) of scores has not been ecologically important. The range of trendline scores have consistently indicated ‘fair’ generic river health (Table 2) throughout the period.
Temporal trends in 2006 to 2016 data 3.2.16.5.5A LOWESS trend plot with a moving average (tension 0.4) trendline was produced (Figure 101). A non-parametric statistical trend analysis of the MCI data using the Mann-Kendall test was then performed on 21 years of SEM results (1995-2016) from the site in the Waingongoro River at SH45.
WGG000895
1994 1996 1998 2000 2002 2004 2006 2008 2010 2012 2014 2016 2018Year
70
75
80
85
90
95
100
105
110
MC
I va
lue
N = 43 Kendall tau = +0.130 p value = 0.218 FDR p = 0.304

149
Figure 101 LOWESS trend plot of ten years of MCI data for the SH45 site, Waingongoro River
A negative, non-significant trend in MCI scores has been found over the ten year period. Generally, there appears to have been little change over the ten year period apart from a minor decrease from 2007 to 2008. The trendline consistently indicated ‘fair’ generic river health (Table 2) throughout the period.
Ohawe Beach site (WGG000995) 3.2.16.6 Taxa richness and MCI 3.2.16.6.1
Forty surveys have been undertaken in the Waingongoro River at this lower reach site at Ohawe Beach between October 1995 and February 2015. These results are summarised in Table 74, together with the results from the current period, and illustrated in Figure 102.
Table 74 Results of previous surveys performed in the Waingongoro River at the Ohawe Beach site, together with spring 2015 and summer 2016 results
Site code
SEM data ( 1995 to Feb 2015) 2015-2016 surveys
No of surveys
Taxa numbers MCI values Oct 2015 Mar 2016
Range Median Range Median Taxa no MCI Taxa no MCI
WGG000995 40 12-25 18 69-100 91 18 91 14 86
WGG000895
2006 2008 2010 2012 2014 2016 2018Year
75
80
85
90
95
100
105
110M
CI
valu
e
N = 20 Kendall tau = -0.081 p value = 0.614 FDR p = 0.753

150
Figure 102 Numbers of taxa and MCI values in the Waingongoro River at the Ohawe Beach site
A wide range of richnesses (12 to 25 taxa) has been found, with a median richness of 18 taxa. During the 2015-2016 period, spring (18 taxa) and summer (14 taxa) richnesses were four taxa apart with the spring richness the same as the historic richness while the summer richness was four taxa less than the historical median coincident with lower levels of filamentous algal substrate cover. MCI values have had a relatively wide range (31 units) at this site, typical of sites in the lower reaches of ringplain streams and rivers. The median value (91 units) has been more typical of scores at lower reach sites elsewhere on the ringplain (TRC, 2015c). The spring 2015 (91 units) and summer 2016 (86 units) scores were not significantly different to each other and from the historic median. These scores categorised this site as having ‘fair’ health generically in spring and summer (Table 2). The historical median score (91 units) placed this site in the ‘fair’ category for generic health. Of the 42 surveys to date at this site, 29% of MCI scores have been less than 85 units while 67% have been greater than 85 units.
Community composition 3.2.16.6.2Characteristic macroinvertebrate taxa in the communities at this site prior to the 2015-2016 period are listed in Table 75.
Table 75 Characteristic taxa [abundant (A), very abundant (VA), extremely abundant (XA)] recorded in the Waingongoro River at the Ohawe Beach site between 1995 and February 2015 [40 surveys], and by the spring 2015 and summer 2016 surveys
Taxa List MCI A VA XA Total %
Survey
Spring 2015
Summer 2016
ANNELIDA (WORMS) Oligochaeta 1 14 8 6 28 70 A
Lumbricidae 5 1 1 3
MOLLUSCA Potamopyrgus 4 20 12 32 80 VA A
CRUSTACEA Paratya 3 2 2 5
EPHEMEROPTERA (MAYFLIES) Austroclima 7 2 2 5
Deleatidium 8 4 5 9 23
PLECOPTERA (STONEFLIES) Zelandobius 5 1 1 3
COLEOPTERA (BEETLES) Elmidae 6 12 10 22 55
TRICHOPTERA (CADDISFLIES) Hydropsyche (Aoteapsyche) 4 14 17 8 39 98 A
Costachorema 7 1 1 3
Hydrobiosis 5 3 3 8
Pycnocentrodes 5 11 11 11 33 83 XA A
DIPTERA (TRUE FLIES) Aphrophila 5 8 8 20
Maoridiamesa 3 11 13 6 30 75
Orthocladiinae 2 13 14 11 38 95 A A
Tanytarsini 3 7 7 18
Ephydridae 4 2 2 5
Austrosimulium 3 4 4 10
Prior to the current 2015-2016 period, 17 taxa had characterised the community at this site on occasions. These have comprised one ‘highly sensitive’, seven ‘moderately sensitive’, and nine ‘tolerant’ taxa i.e. a lower proportion of ‘sensitive’ taxa and a higher proportion of ‘tolerant’ taxa as would be expected in the lower reaches of a ringplain river.

151
Predominant taxa have included two ‘moderately sensitive’ taxa [elmid beetles and stony-cased caddisfly (Pycnocentrodes)]; and five ‘tolerant’ taxa [oligochaete worms, snail (Potamopyrgus), net-building caddisfly (Hydropsyche-Aoteapsyche), and midges (Maoridiamesa and orthoclads)], but no ‘highly sensitive’ taxa. The spring 2015 community consisted of four characteristic taxa comprising one ‘moderately sensitive’ and three ‘tolerant’ taxa. The summer 2016 community also consisted of four characteristic taxa comprising one ‘moderately sensitive’ and three ‘tolerant’ taxa. Three of the five characteristic taxa were characteristic at both the spring and summer surveys (Table 75). The decrease in numerical abundance of the stony-cased caddisfly (Pycnocentrodes) was the main contributing factor in the reduction of SQMCIs score during summer by 0.8 units (Table 159 and Table 160). The two taxa recorded as very or extremely abundant during spring and/or summer have characterised this site’s communities on 80% to 83% of past survey occasions.
Predicted stream ‘health’ 3.2.16.6.3The Waingongoro River at the Ohawe Beach site is 66.6km downstream of the National Park boundary at an altitude of 5 m asl. Relationships for ringplain streams and rivers developed between MCI and site altitude and distance from the National Park boundary (Stark and Fowles, 2009), predict MCI values of 85 (altitude) and 85 (distance) for this site. The historical site median (91) is six units higher than both the predictive values. The spring 2015 (91 units) and summer 2016 (86 units) survey score were not significantly different to either predictive value (Stark, 1998). The median value for a ringplain river arising within the National Park at similar altitude (TRC, 2015c) was 90 units. The historical, spring and summer scores were all not significantly different to the TRC, 2015c value. The REC predicted MCI value (Leathwick, et al. 2009) was 95 units. The historical, spring and summer scores were also not significantly different to this value (Stark, 1998).
Temporal trends in 1995 to 2016 data 3.2.16.6.4A LOWESS trend plot with a moving average (tension 0.4) trendline was produced (Figure 103). A non-parametric statistical trend analysis of the MCI data using the Mann-Kendall test was then performed on 21 years of SEM results (1995-2016) from the site in the Waingongoro River at Ohawe Beach. The MCI has been chosen as the preferable indicator of ‘stream/river health’ for SEM trend reporting purposes.
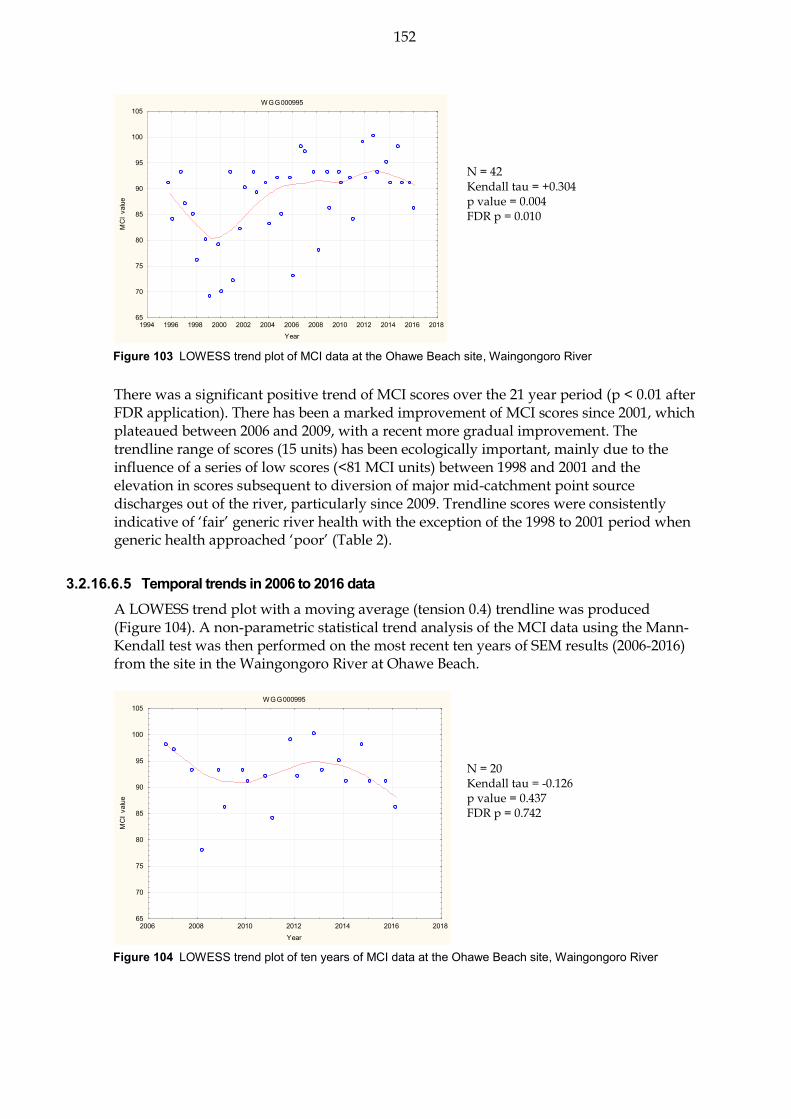
152
Figure 103 LOWESS trend plot of MCI data at the Ohawe Beach site, Waingongoro River
There was a significant positive trend of MCI scores over the 21 year period (p < 0.01 after FDR application). There has been a marked improvement of MCI scores since 2001, which plateaued between 2006 and 2009, with a recent more gradual improvement. The trendline range of scores (15 units) has been ecologically important, mainly due to the influence of a series of low scores (<81 MCI units) between 1998 and 2001 and the elevation in scores subsequent to diversion of major mid-catchment point source discharges out of the river, particularly since 2009. Trendline scores were consistently indicative of ‘fair’ generic river health with the exception of the 1998 to 2001 period when generic health approached ‘poor’ (Table 2).
Temporal trends in 2006 to 2016 data 3.2.16.6.5A LOWESS trend plot with a moving average (tension 0.4) trendline was produced (Figure 104). A non-parametric statistical trend analysis of the MCI data using the Mann-Kendall test was then performed on the most recent ten years of SEM results (2006-2016) from the site in the Waingongoro River at Ohawe Beach.
Figure 104 LOWESS trend plot of ten years of MCI data at the Ohawe Beach site, Waingongoro River
WGG000995
1994 1996 1998 2000 2002 2004 2006 2008 2010 2012 2014 2016 2018Year
65
70
75
80
85
90
95
100
105M
CI
valu
e
WGG000995
2006 2008 2010 2012 2014 2016 2018Year
65
70
75
80
85
90
95
100
105
MC
I va
lue
N = 42 Kendall tau = +0.304 p value = 0.004 FDR p = 0.010
N = 20 Kendall tau = -0.126 p value = 0.437 FDR p = 0.742

153
There was a non-significant negative trend of MCI scores over the ten year period which strongly contrasts with the significant, positive trend found in the full dataset. The large discrepancy was largely the result of the large increases in MCI scores in the full dataset from 1999 to 2004 creating the positive, significant result. Though the trendline indicated a negative trend as this was not significant no real trend can be inferred. The trendline was consistently indicative of ‘fair’ generic river health (Table 2).
Discussion 3.2.16.7Seasonal MCI values typically decreased between spring and summer at the four lowest sites by three, seven, 11 and five units in a downstream direction while the two upper sites had increases of 12 and one unit. The decreases were similar to historical seasonal median differences at three sites (1-2 units) where decreases occurred with one site having a score nine units greater than the historical seasonal mean (Table 68). Seasonal communities shared 23 of the 32 taxa (72%), found at the upper site near the National Park; 18 of the 30 taxa (60%) at the Opunake Road upper mid-reach site; 8 of 22 taxa (36%) at the Eltham Road mid-reach site; 15 of the 25 taxa (60%) at the Stuart Road mid-reach site; 10 of the 27 taxa (37%) at the SH45 lower reach site; and 7 of 23 taxa (30%) at the furthest downstream site (Ohawe Beach) in the lower reaches. Seasonal community compositions in the 2015-2016 period therefore tended to follow typical trends of generally greater dissimilarity with increasing distance downstream from the National Park apart from the Stuart Road site which had higher seasonal community similarity compared with the upstream Eltham Road site. Community composition varied markedly through the length of the river surveyed. A total of 41 taxa was recorded in spring of which only three taxa were present at all six sites. These included one ‘highly sensitive’ taxon, five ‘moderately sensitive’ taxa, and one ‘tolerant’ taxon with only the ‘highly sensitive’ mayfly (Deleatidium) abundant at all six sites. A slightly higher total of 46 taxa was found along the river’s length by the summer survey of which seven taxa were present at all six sites. These included two of the three widespread taxa found in the spring survey which were the ubiquitous mayfly Deleatidium and caddisfly Pycnocentrodes. Only one taxon was abundant at all six sites, the caddisfly Hydropsyche-Aoteapysche. Dissimilarities in spatial community structure along the length of the Waingongoro River were generally more pronounced in summer than in spring. The MCI scores fell in a downstream direction between the upper site and the furthest downstream lower reaches site by 41 units in spring and 58 units in summer, over a river distance of 65.9 km. These seasonal falls in MCI scores were typical of most past trends, when there have been an increased summers’ seasonal decline. Previously, a higher decrease in MCI score had been recorded between the Eltham Road and Stuart Road mid-reach sites over 6.6 km distance in spring and particularly in summer but more recent surveys have found smaller differences. This had been attributable to point source discharges of treated Eltham municipal wastes and treated industrial (meatworks) wastes within this reach but since the summer removal of the meatworks discharge and the complete diversion of the municipal wastes (post July 2010) the decline in MCI score had reduced. However, the current surveys show a significant decrease of 16 units in spring and 20 units in summer between the two sites, compared with historic differences of five and eight units respectively. This indicates that there was probably higher than usual nutrient inputs between the two sites despite a reduction in point source discharges.

154
Mangawhero Stream 3.2.17The results found by the 2015-2016 surveys are presented in Table 161 and Table 162, Appendix I for this small stream draining the Ngaere swamp, with a lower sub-catchment (Mangawharawhara Stream) rising on the ringplain but outside of the National Park.
Site upstream of the Eltham Municipal WWTP discharge (MWH000380) 3.2.17.1 Taxa richness and MCI 3.2.17.1.1
Forty surveys have been undertaken in this mid-reach site in the Mangawhero Stream within about 3 km of the Ngaere swamp between October 1995 and February 2015. These results are summarised in Table 76, together with the results from the current period, and illustrated in Figure 105.
Table 76 Results of previous surveys performed in Mangawhero Stream upstream of Eltham WWTP, together with spring 2015 and summer 2016 results
Site code
SEM data ( 1995 to Feb 2015) 2015-2016 surveys
No of surveys
Taxa numbers MCI values Dec 2015 Feb 2016
Range Median Range Median Taxa no MCI Taxa no MCI
MWH000380 40 10-24 15 58-85 75 15 83 18 72
Figure 105 Numbers of taxa and MCI values in the Mangawhero Stream upstream of Eltham WWTP
A moderately wide range of richnesses (10 to 24 taxa) has been found, with a median richness of 15 taxa (more representative of typical richnesses in small swamp drainage streams where a median richness of 18 taxa has been at similar altitudes (TRC, 2015c)). During the 2015-2016 period spring (15 taxa) and summer (18 taxa) richnesses were relatively similar to each other and within three taxa of the historical median. The habitat was predominantly comprised of a hard clay substrate with patchy filamentous algae substrate cover in spring but only slippery mats in summer. MCI values have had a moderate range (27 units) at this site. The median value (75 units) has been typical of similar non-ringplain sites elsewhere in the region. The spring 2015 (83 units) and summer 2016 (72 units) scores were not significantly different to the

155
historical median but the summer score was significantly lower than the spring score (by 11 units). These scores categorised this site as having ‘poor’ (spring) and ‘fair’ (summer) health generically (Table 2). The historical median score (75 units) placed this site in the ‘poor’ category for the generic method of assessment.
Community composition 3.2.17.1.2Characteristic macroinvertebrate taxa in the communities at this site prior to the 2015-2016 period are listed in Table 77.
Table 77 Characteristic taxa [abundant (A), very abundant (VA), extremely abundant (XA)] recorded in the Mangawhero Stream upstream of Eltham WWTP between 1995 and February 2015 [40 surveys], and by the spring 2015 and summer 2016 surveys
Taxa List MCI A VA XA Total %
Survey
Spring 2015
Summer 2016
NEMERTEA Nemertea 3 1 1 3
ANNELIDA (WORMS) Oligochaeta 1 19 5 2 26 65 A
Lumbricidae 5 1 1 3
MOLLUSCA Potamopyrgus 4 2 2 5 A A
CRUSTACEA Ostracoda 1 6 1 2 9 23 VA
Paracalliope 5 18 12 3 33 83 XA
EPHEMEROPTERA (MAYFLIES) Austroclima 7 18 15 2 35 88
TRICHOPTERA (CADDISFLIES) Hydropsyche (Aoteapsyche) 4 14 3 17 43
Hydrobiosis 5 6 6 15
Polyplectropus 6 1 1 3
Oxyethira 2 4 4 10
DIPTERA (TRUE FLIES) Aphrophila 5 14 5 19 48
Chironomus 1 1 1 2 5
Maoridiamesa 3 6 1 1 8 20
Orthocladiinae 2 26 6 5 37 93
Austrosimulium 3 14 3 1 18 45 VA
Prior to the current 2015-2016 period, 16 taxa had characterised the community at this site on occasions. These have comprised six ‘moderately sensitive’ and ten ‘tolerant’ taxa i.e. an absence of ‘highly sensitive’ taxa and a relatively high proportion of ‘tolerant’ taxa as would be expected in the drain-like reaches of a non-ringplain, swampy, seepage stream. Predominant taxa have included three ‘moderately sensitive’ taxa [amphipod (Paracalliope), mayfly (Austroclima), and cranefly (Aphrophila)], and two ‘tolerant’ taxa [oligochaete worms and orthoclad midges]. The spring 2015 community was characterised by two historically characteristic taxa both of which were ‘tolerant’ taxa. The summer 2016 community was characterised by four taxa consisting of one ‘moderately sensitive’ and three ‘tolerant’ taxa (Table 77). A very large increase in abundance for one ‘moderately sensitive’ taxon and lesser increases in abundance for two ‘tolerant’ taxa during summer resulted in a non-significant increase in SQMCIs scores (0.6 unit) between seasons (Table 161 and Table 162). The two taxa which were recorded as very abundant during spring and/or summer had characterised this site’s communities on 23% to 83% of past surveys.

156
N = 42 Kendall tau = +0.330 p value = 0.002 FDR p = 0.005
Predicted stream ‘health’ 3.2.17.1.3The Mangawhero Stream rises as seepage from the Ngaere swamp and is not a ringplain stream at the site upstream of the Eltham WWTP. This site is at an altitude of 200 m asl and toward its upper reaches. Relationships for ringplain streams developed between MCI and site altitude (Stark and Fowles, 2009) are therefore not applicable to this site. The median value for a stream arising in smaller lowland hill country (TRC, 2015c) was 79 units. The historical, spring and summer scores were all not significantly different to the TRC, 2015c value. The REC predicted MCI value (Leathwick, et al. 2009) was 92 units. The spring score was not significantly different to this value but the summer and historical medians were significantly lower by 20 and 17 units respectively (Stark, 1998).
Temporal trends in 1995 to 2016 data 3.2.17.1.4A LOWESS trend plot with a moving average (tension 0.4) trendline was produced (Figure 106). A non-parametric statistical trend analysis of the MCI data using the Mann-Kendall test was then performed on the 21 years of SEM results (1995-2016) from the site in the Mangawhero Stream upstream of the Eltham WWTP discharge. The MCI has been chosen as the preferable indicator of ‘stream/river health’ for SEM trend reporting purposes.
Figure 106 LOWESS trend plot of MCI data at site upstream of
the Eltham WWTP discharge, Mangawhero Stream
A positive non-significant temporal trend in MCI scores has been found over the 21 year monitoring period at this site with the early trend of slightly increasing scores having been followed by a plateauing of scores a few units above those recorded early in the programme, then another small increase and plateau in recent years. However, the narrow range of trendline scores (six units) has not been of ecological importance over the twenty-one year period. Trendline MCI scores consistently have been indicative of ‘poor’ generic stream health (Table 2) throughout the period.
Temporal trends in 2006 to 2016 data 3.2.17.1.5A LOWESS trend plot with a moving average (tension 0.4) trendline was produced (Figure 107). A non-parametric statistical trend analysis of the MCI data using the Mann-
MW H000380
1994 1996 1998 2000 2002 2004 2006 2008 2010 2012 2014 2016 2018Year
55
60
65
70
75
80
85
90
MC
I va
lue

157
N = 20 Kendall tau = +0.116 p value = 0.475 FDR p = 0.742
Kendall test was then performed on the ten most recent years of SEM results (2006-2016) from the site in the Mangawhero Stream upstream of the Eltham WWTP discharge.
Figure 107 LOWESS trend plot of ten years of MCI data at site
upstream of the Eltham WWTP discharge, Mangawhero Stream
A positive non-significant trend in MCI scores has been found over the ten year monitoring period at this site in contrast with the significant positive trend found in the full dataset. Very little change in the trendline has occurred in the most recent ten year period with only six MCI units variation in the trendline indicating that the significant improvement occurred mostly outside the ten year period. The trendline has been indicative of ‘poor’ generic stream health (Table 2) throughout the period.
Site downstream of the Mangawharawhara Stream confluence (MWH000490) 3.2.17.2 Taxa richness and MCI 3.2.17.2.1
Forty surveys have been undertaken at this lower mid-reach site in the Mangawhero Stream between October 1995 and February 2015. These results are summarised in Table 78, together with the results from the current period, and illustrated in Figure 108.
Table 78 Results of previous surveys performed in the Mangawhero Stream downstream of the Mangawharawhara Stream confluence, together with spring 2015 and summer 2016 results
MW H000380
2006 2008 2010 2012 2014 2016 2018Year
55
60
65
70
75
80
85
90
MC
I va
lue
Site code
SEM data ( 1995 to Feb 2015) 2015-2016 surveys
No of surveys
Taxa numbers MCI values Dec 2015 Feb 2016
Range Median Range Median Taxa no MCI Taxa no MCI
MWH000490 40 13-30 20 63-102 79 25 90 27 83

158
Figure 108 Numbers of taxa and MCI values in the Mangawhero Stream downstream of the
railbridge and Mangawharawhara Stream confluence
A relatively wide range of richnesses (13 to 30 taxa) has been found with a moderate median richness of 19 taxa (more representative of typical richnesses in the lower-mid reaches of streams and rivers). During the 2015-2016 period spring (25 taxa) and summer (27 taxa) richnesses were very similar and to each other and moderately higher than the historic median richness. MCI values have had a wide range (39 units) at this site, more typical of a site in the middle to lower reaches of ringplain streams. However, the median value (79 units) has been lower than typical of lower mid-reach sites elsewhere. The spring 2015 (90 units) and summer 2016 (83 units) scores were not significantly different to each but the spring score was significantly higher than the historic median by 11 units (Stark, 1998). These scores were coincident with the diversion of the major point source Eltham municipal wastewater discharge out of the Mangawhero Stream which was completed in June 2010. The MCI scores categorised the site as having ‘fair’ health generically (Table 2) in both spring and summer. The historical median score (79 units) placed this site in the ‘poor’ category for generic health. The historical median score continues to reflect both the more lowland, swampy, nature of the headwaters of the Mangawhero Stream, but more particularly, the impact of the Eltham municipal wastewater treatment system’s discharge on the water quality of the stream, prior to diversion in July, 2010. Of the 42 surveys to date at this river site, all MCI scores have been less than 104 units.

159
Community composition 3.2.17.2.2Characteristic macroinvertebrate taxa in the communities at this site prior to the 2015-2016 period are listed in Table 79.
Table 79 Characteristic taxa [abundant (A), very abundant (VA), extremely abundant (XA)] recorded in the Mangawhero Stream downstream of the Mangawharawhara Stream confluence, between 1995 and February 2015 [40 surveys], and by the spring 2015 and summer 2016 surveys
Taxa List MCI score
A VA XA Total %
Survey
Spring 2015
Summer 2016
NEMERTEA Nemertea 3 A
ANNELIDA (WORMS) Oligochaeta 1 13 13 14 40 100 A VA
MOLLUSCA Physa 3 1 1 2 5
Potamopyrgus 4 9 4 13 33 VA
CRUSTACEA Cladocera 5 2 1 3 8
Ostracoda 1 13 5 8 26 65
Paracalliope 5 8 9 18 35 88 VA
Paraleptamphopidae 5 2 2 5
Talitridae 5 1 1 2 5
EPHEMEROPTERA (MAYFLIES) Austroclima 7 3 3 8
Deleatidium 8 2 5 4 11 28 A
PLECOPTERA (STONEFLIES) Zelandobius 5 2 2 5
COLEOPTERA (BEETLES) Elmidae 6 5 3 1 9 23 A
MEGALOPTERA (DOBSONFLIES) Archichauliodes 7 1 1 3
TRICHOPTERA (CADDISFLIES) Hydropsyche (Aoteapsyche) 4 13 9 4 26 65 VA
Costachorema 7 1 1 3
Hydrobiosis 5 12 1 13 33 A
Oxyethira 2 5 4 9 23 A
Pycnocentria 7 2 2 5
Pycnocentrodes 5 5 1 2 8 20 A A
DIPTERA (TRUE FLIES) Aphrophila 5 6 2 8 20
Chironomus 1 2 2 5
Maoridiamesa 3 16 5 21 53
Orthocladiinae 2 15 14 8 37 93 A VA
Polypedilum 3 1 1 3
Tanypodinae 5 1 1 3
Tanytarsini 3 3 3 8 VA
Empididae 3 1 1 3 A
Muscidae 3 2 2 5
Austrosimulium 3 9 4 13 33
Prior to the current 2015-2016 period 29 taxa have characterised the community at this site. These have comprised one ‘highly sensitive’, fourteen ‘moderately sensitive’, and fourteen ‘tolerant’ taxa i.e. a higher proportion of ‘tolerant’ taxa than might be expected at this altitude (190 m asl) in the downstream reaches of a small stream with a ringplain component. Predominant taxa have included one ‘moderately sensitive’ taxon [amphipod (Paracalliope)] and five ‘tolerant’ taxa [oligochaete worms, ostracod seed shrimps, net-building caddisfly (Aoteapsyche), and midges (orthoclads and Maoridiamesa)]. The spring 2015 community comprised four characteristic taxa consisting of one ‘highly sensitive’, one ‘moderately sensitive’ and two ‘tolerant’ taxa. The summer 2016 community comprised 12 characteristic taxa consisting of four ‘moderately sensitive’ and eight ‘tolerant’ taxa community (Table 79). The presence of the ‘highly sensitive’ mayfly

160
N = 42 Kendall tau = +0.489 p value < 0.001 FDR p < 0.001
Deleatidium in spring and several characteristic ‘moderately sensitive’ taxa were further confirmation of improved water quality and habitat following Eltham WWTP wastewater diversion. Increases in the abundance of several ‘tolerant’ taxa in the summer caused a non-significant decrease of 0.8 units in the SQMCIs score (Table 161 and Table 162). All taxa recorded as very or extremely abundant during spring and/or summer had characterised this site’s communities on 65% to 100% of the past surveys.
Predicted stream ‘health’ 3.2.17.2.3The Mangawhero Stream site below the Mangawharawhara Stream confluence, at an altitude of 190 m asl, is in the lower reaches of a stream draining a catchment comprised of the Ngaere Swamp drainage system and a mid-reach ringplain sub-catchment with its headwaters outside the National Park and therefore predictive values developed for steams and rivers inside the National Park will not be used. The median value for a stream arising in smaller lowland hill country (TRC, 2015c) was 81 units. The historical, spring and summer scores were all not significantly different to the TRC, 2015c value. The REC predicted MCI value (Leathwick, et al. 2009) was 93 units. The spring and summer scores were not significantly different to this value but the historical median was significantly lower by 14 units (Stark, 1998).
Temporal trends in 1995 to 2016 data 3.2.17.2.4A LOWESS trend plot with a moving average (tension 0.4) trendline was produced (Figure 109). A non-parametric statistical trend analysis of the MCI data using the Mann-Kendall test was then performed on 21 years of SEM results (1995-2016) from the site in the Mangawhero Stream downstream of the Mangawharawhara Stream confluence. The MCI has been chosen as the preferable indicator of ‘stream/river health’ for SEM trend reporting purposes.
Figure 109 LOWESS trend plot of MCI data at the Mangawhero Stream site downstream
of the Mangawharawhara Stream confluence
A significant (p <0.01, after FDR) improvement in MCI scores has been illustrated at this more ringplain-like site in the lower reaches of the stream near its confluence with Waingongoro River. The wide range in trendline scores (17 units) has more recently become ecologically important over this 21 year period. Scores have plateaued for the last
MW H000490
1994 1996 1998 2000 2002 2004 2006 2008 2010 2012 2014 2016 2018Year
60
65
70
75
80
85
90
95
100
105
MC
I va
lue

161
N = 20 Kendall tau = +0.391 p value = 0.016 FDR p = 0.122
four years after a steady improvement between 1995 and 2006 prior to the more recent marked improvement due to improved scores since the diversion of the Eltham WWTP wastes discharge out of the stream in July 2010. The MCI scores generally have been indicative of ‘poor’ generic stream health (Table 2) with sporadic incursions into the ‘fair’ health category prior to 2010. The trendline scores remained in the ‘poor’ category through the period until 2010 and subsequently improved into the ‘fair’ category where they have since plateaued.
Temporal trends in 2006 to 2016 data 3.2.17.2.5A LOWESS trend plot with a moving average (tension 0.4) trendline was produced (Figure 110). A non-parametric statistical trend analysis of the MCI data using the Mann-Kendall test was then performed on the most recent ten years of SEM results (2006-2016) from the site in the Mangawhero Stream downstream of the Mangawharawhara Stream confluence.
Figure 110 LOWESS trend plot of ten years of MCI data at the Mangawhero Stream site downstream
of the Mangawharawhara Stream confluence
A positive non-significant increase in MCI scores has occurred at this site in contrast with the significant positive result found in the full dataset. The full dataset in this case was probably a better reflection of the real trend as the 2007 result for the ten year trend appears to have had an unduly large influence and there probably were improvements from until 2013. Furthermore, the result was significant before FDR analysis. The MCI scores generally have been indicative of ‘fair’ generic stream health (Table 2).
Discussion 3.2.17.3The MCI score at the upper reach (upstream of the Eltham WWTP) decreased by a larger than normal nine units between spring and summer compared with the historical median summer decrease of only two units (Appendix II). Another larger than normal decrease of seven units was found at the lower site (downstream of the Mangawharawhara Stream confluence) in the absence of the WWTP discharge which had significantly impacted on water quality at this site prior to mid 2010. This was larger in comparison with a seasonal three unit median summer historical decrease at this site (Appendix II). Seasonal communities at the upper reach site shared nine common taxa out of the 24 taxa (38%)
MW H000490
2006 2008 2010 2012 2014 2016 2018Year
60
65
70
75
80
85
90
95
100
105
MC
I va
lue

162
despite the relatively similar MCI scores compared with 19 shared common taxa of the 33 taxa (58%) at the lower site; a more typical seasonal change in community structure at the lower site. The two sites shared 14 common taxa of the 26 taxa (54%) in spring and 14 common taxa of 31 taxa (45%) in summer, indicative of the dissimilarity in spatial community structures in both spring and summer, as might be expected given the significantly different physical and physicochemical habitats at these two sites. MCI scores typically (for this stream) improved in a downstream direction by seven units in spring and nine units in summer, over a stream distance of 16.5 km between the upper and lower sites of this stream. This was principally as a result of the variability and improvement in physical habitat and physicochemical water quality conditions in a downstream direction between the two sites which have been enhanced in recent years by the diversion of the Eltham wastewater discharge out of the stream.
Huatoki Stream 3.2.18The results of spring and summer (2015-2016) surveys are summarised in Table 163 and Table 164, Appendix I.
Hadley Drive site (HTK000350) 3.2.18.1 Taxa richness and MCI 3.2.18.1.1
Thirty-eight surveys have been undertaken, between December 1996 and February 2015, at this lower mid-reach, unshaded site, draining open developed farmland, on the outskirts of New Plymouth city. These results are summarised in Table 80, together with the results from the current period, and illustrated in Figure 111.
Table 80 Results of previous surveys performed in the Huatoki Stream at Hadley Drive together with spring 2014 and summer 2015 results
Site code
SEM data ( 1996 to Feb 2015) 2015-2016 surveys
No of surveys
Taxa numbers MCI values Oct 2015 Mar 2016
Range Median Range Median Taxa no MCI Taxa no MCI
HTK000350 38 22-34 26 79-114 96 23 115 26 96
Figure 111 Numbers of taxa and MCI values in the Huatoki Stream at the end of Hadley Drive
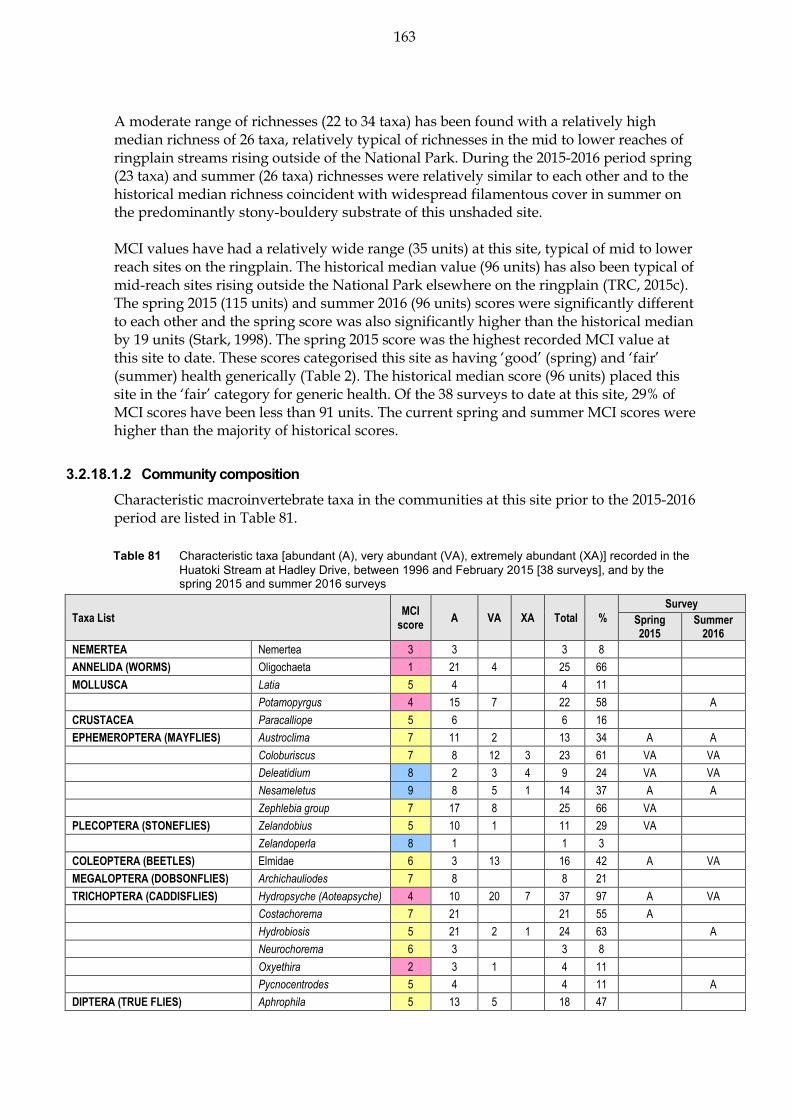
163
A moderate range of richnesses (22 to 34 taxa) has been found with a relatively high median richness of 26 taxa, relatively typical of richnesses in the mid to lower reaches of ringplain streams rising outside of the National Park. During the 2015-2016 period spring (23 taxa) and summer (26 taxa) richnesses were relatively similar to each other and to the historical median richness coincident with widespread filamentous cover in summer on the predominantly stony-bouldery substrate of this unshaded site. MCI values have had a relatively wide range (35 units) at this site, typical of mid to lower reach sites on the ringplain. The historical median value (96 units) has also been typical of mid-reach sites rising outside the National Park elsewhere on the ringplain (TRC, 2015c). The spring 2015 (115 units) and summer 2016 (96 units) scores were significantly different to each other and the spring score was also significantly higher than the historical median by 19 units (Stark, 1998). The spring 2015 score was the highest recorded MCI value at this site to date. These scores categorised this site as having ‘good’ (spring) and ‘fair’ (summer) health generically (Table 2). The historical median score (96 units) placed this site in the ‘fair’ category for generic health. Of the 38 surveys to date at this site, 29% of MCI scores have been less than 91 units. The current spring and summer MCI scores were higher than the majority of historical scores.
Community composition 3.2.18.1.2Characteristic macroinvertebrate taxa in the communities at this site prior to the 2015-2016 period are listed in Table 81.
Table 81 Characteristic taxa [abundant (A), very abundant (VA), extremely abundant (XA)] recorded in the Huatoki Stream at Hadley Drive, between 1996 and February 2015 [38 surveys], and by the spring 2015 and summer 2016 surveys
Taxa List MCI
score A VA XA Total %
Survey
Spring 2015
Summer 2016
NEMERTEA Nemertea 3 3 3 8
ANNELIDA (WORMS) Oligochaeta 1 21 4 25 66
MOLLUSCA Latia 5 4 4 11
Potamopyrgus 4 15 7 22 58 A
CRUSTACEA Paracalliope 5 6 6 16
EPHEMEROPTERA (MAYFLIES) Austroclima 7 11 2 13 34 A A
Coloburiscus 7 8 12 3 23 61 VA VA
Deleatidium 8 2 3 4 9 24 VA VA
Nesameletus 9 8 5 1 14 37 A A
Zephlebia group 7 17 8 25 66 VA
PLECOPTERA (STONEFLIES) Zelandobius 5 10 1 11 29 VA
Zelandoperla 8 1 1 3
COLEOPTERA (BEETLES) Elmidae 6 3 13 16 42 A VA
MEGALOPTERA (DOBSONFLIES) Archichauliodes 7 8 8 21
TRICHOPTERA (CADDISFLIES) Hydropsyche (Aoteapsyche) 4 10 20 7 37 97 A VA
Costachorema 7 21 21 55 A
Hydrobiosis 5 21 2 1 24 63 A
Neurochorema 6 3 3 8
Oxyethira 2 3 1 4 11
Pycnocentrodes 5 4 4 11 A
DIPTERA (TRUE FLIES) Aphrophila 5 13 5 18 47
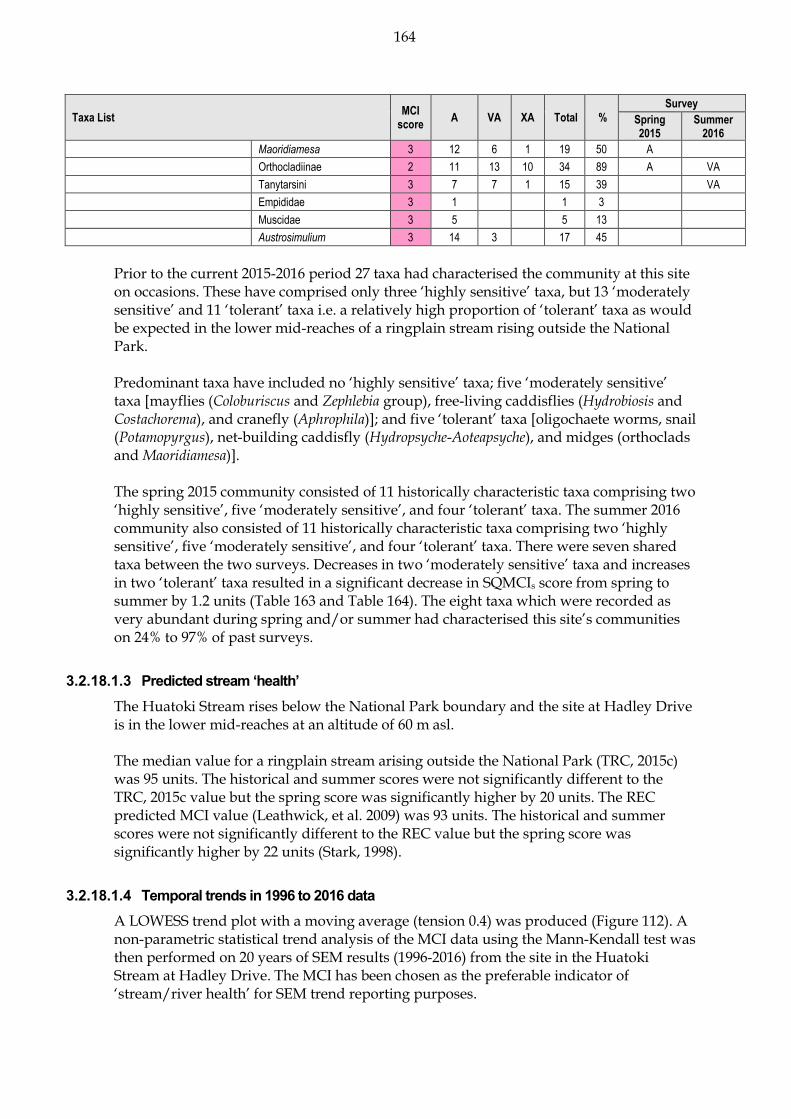
164
Taxa List MCI
score A VA XA Total %
Survey
Spring 2015
Summer 2016
Maoridiamesa 3 12 6 1 19 50 A
Orthocladiinae 2 11 13 10 34 89 A VA
Tanytarsini 3 7 7 1 15 39 VA
Empididae 3 1 1 3
Muscidae 3 5 5 13
Austrosimulium 3 14 3 17 45
Prior to the current 2015-2016 period 27 taxa had characterised the community at this site on occasions. These have comprised only three ‘highly sensitive’ taxa, but 13 ‘moderately sensitive’ and 11 ‘tolerant’ taxa i.e. a relatively high proportion of ‘tolerant’ taxa as would be expected in the lower mid-reaches of a ringplain stream rising outside the National Park. Predominant taxa have included no ‘highly sensitive’ taxa; five ‘moderately sensitive’ taxa [mayflies (Coloburiscus and Zephlebia group), free-living caddisflies (Hydrobiosis and Costachorema), and cranefly (Aphrophila)]; and five ‘tolerant’ taxa [oligochaete worms, snail (Potamopyrgus), net-building caddisfly (Hydropsyche-Aoteapsyche), and midges (orthoclads and Maoridiamesa)]. The spring 2015 community consisted of 11 historically characteristic taxa comprising two ‘highly sensitive’, five ‘moderately sensitive’, and four ‘tolerant’ taxa. The summer 2016 community also consisted of 11 historically characteristic taxa comprising two ‘highly sensitive’, five ‘moderately sensitive’, and four ‘tolerant’ taxa. There were seven shared taxa between the two surveys. Decreases in two ‘moderately sensitive’ taxa and increases in two ‘tolerant’ taxa resulted in a significant decrease in SQMCIs score from spring to summer by 1.2 units (Table 163 and Table 164). The eight taxa which were recorded as very abundant during spring and/or summer had characterised this site’s communities on 24% to 97% of past surveys.
Predicted stream ‘health’ 3.2.18.1.3The Huatoki Stream rises below the National Park boundary and the site at Hadley Drive is in the lower mid-reaches at an altitude of 60 m asl. The median value for a ringplain stream arising outside the National Park (TRC, 2015c) was 95 units. The historical and summer scores were not significantly different to the TRC, 2015c value but the spring score was significantly higher by 20 units. The REC predicted MCI value (Leathwick, et al. 2009) was 93 units. The historical and summer scores were not significantly different to the REC value but the spring score was significantly higher by 22 units (Stark, 1998).
Temporal trends in 1996 to 2016 data 3.2.18.1.4A LOWESS trend plot with a moving average (tension 0.4) was produced (Figure 112). A non-parametric statistical trend analysis of the MCI data using the Mann-Kendall test was then performed on 20 years of SEM results (1996-2016) from the site in the Huatoki Stream at Hadley Drive. The MCI has been chosen as the preferable indicator of ‘stream/river health’ for SEM trend reporting purposes.
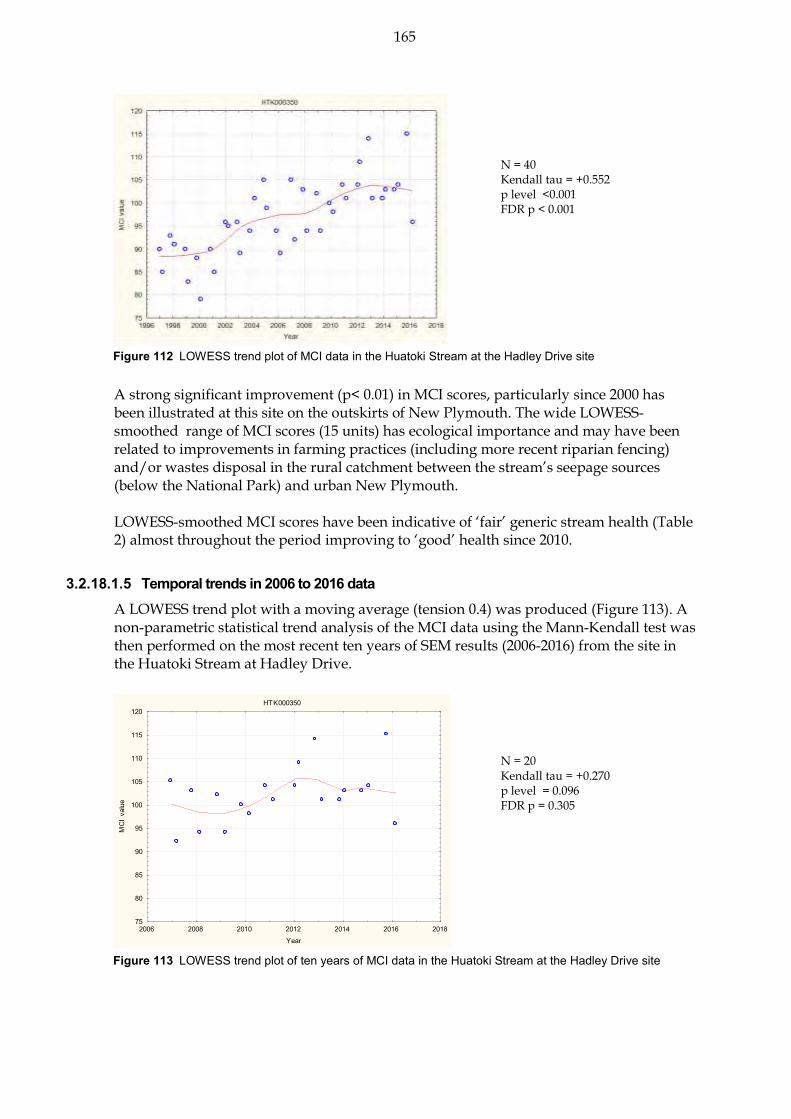
165
Figure 112 LOWESS trend plot of MCI data in the Huatoki Stream at the Hadley Drive site
A strong significant improvement (p< 0.01) in MCI scores, particularly since 2000 has been illustrated at this site on the outskirts of New Plymouth. The wide LOWESS-smoothed range of MCI scores (15 units) has ecological importance and may have been related to improvements in farming practices (including more recent riparian fencing) and/or wastes disposal in the rural catchment between the stream’s seepage sources (below the National Park) and urban New Plymouth. LOWESS-smoothed MCI scores have been indicative of ‘fair’ generic stream health (Table 2) almost throughout the period improving to ‘good’ health since 2010.
Temporal trends in 2006 to 2016 data 3.2.18.1.5A LOWESS trend plot with a moving average (tension 0.4) was produced (Figure 113). A non-parametric statistical trend analysis of the MCI data using the Mann-Kendall test was then performed on the most recent ten years of SEM results (2006-2016) from the site in the Huatoki Stream at Hadley Drive.
Figure 113 LOWESS trend plot of ten years of MCI data in the Huatoki Stream at the Hadley Drive site
HTK000350
2006 2008 2010 2012 2014 2016 2018Year
75
80
85
90
95
100
105
110
115
120
MC
I va
lue
N = 40 Kendall tau = +0.552 p level <0.001 FDR p < 0.001
N = 20 Kendall tau = +0.270 p level = 0.096 FDR p = 0.305

166
A minor positive non-significant result was found in contrast with the full dataset which had a significant positive result. Only minor variation in the trendline was evident for the ten year period suggesting little real change. The trendline was indicative of mostly ‘good’ generic stream health (Table 2).
Huatoki Domain site (HTK000425) 3.2.18.2 Taxa richness and MCI 3.2.18.2.1
Thirty-eight surveys have been undertaken at this lower middle reach site in the Huatoki Stream toward the downstream boundary of the Huatoki Domain between December 1996 and February 2015. These results are summarised in Table 82, together with the results from the current period, and illustrated in Figure 114.
Table 82 Results of previous surveys performed at Huatoki Stream in Huatoki Domain, together with spring 2015 and summer 2016 results
Site code
SEM data ( 1996 to Feb 2015) 2015-2016 surveys
No of surveys
Taxa numbers MCI values Oct 2015 Mar 2016
Range Median Range Median Taxa no MCI Taxa no MCI
HTK000425 38 17-32 26 91-115 104 25 106 22 105
Figure 114 Numbers of taxa and MCI values in the Huatoki Stream at the Huatoki Domain
A moderate range of richnesses (17 to 32 taxa) has been found, with a median richness of 26 taxa (more representative of typical richnesses for the lower reaches of ringplain streams rising outside the National Park boundary). During the 2015-2016 period spring (25 taxa) and summer (22 taxa) richnesses decreased very slightly in summer with seasonal richnesses one to four taxa below the historic median richness. MCI values have had a moderately wide range (24 units) at this site. The median value (104 units) has been higher than typical of lower reach sites elsewhere on the ringplain however. The spring 2015 (106 units) and summer 2016 (105 units) scores very similar to each other and to the historic median value.. These scores categorised this site as having ‘good’ (spring and summer) health generically (Table 2). The historical median score (104 units) placed this site in the ‘good’ category for generic health.
0
10
20
30
40
50
60
0
20
40
60
80
100
120
No. o
f tax
a
MCI
val
ue
SEM: Number of taxa and MCI values in the Huatoki Stream at Huatoki Domain entrance (HTK000425)
MCI value Median MCI to dateNo. of taxa Median no. of taxa to date
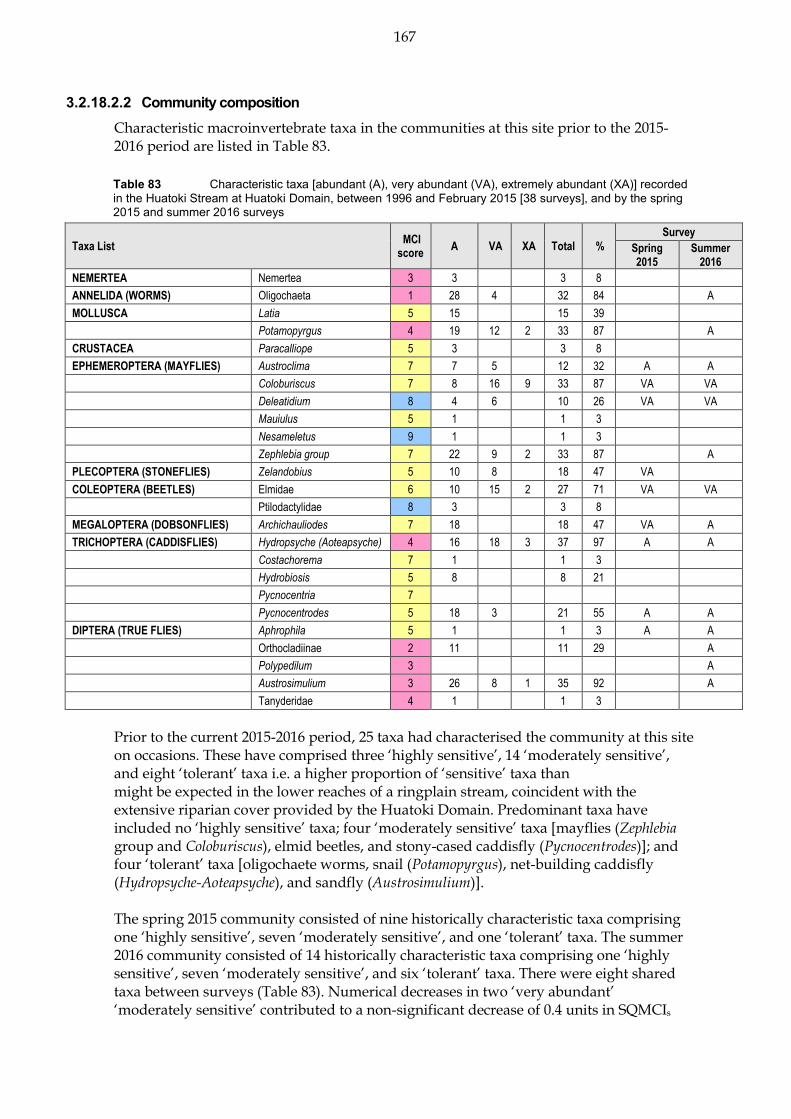
167
Community composition 3.2.18.2.2Characteristic macroinvertebrate taxa in the communities at this site prior to the 2015-2016 period are listed in Table 83.
Table 83 Characteristic taxa [abundant (A), very abundant (VA), extremely abundant (XA)] recorded in the Huatoki Stream at Huatoki Domain, between 1996 and February 2015 [38 surveys], and by the spring 2015 and summer 2016 surveys
Taxa List MCI score
A VA XA Total %
Survey
Spring 2015
Summer 2016
NEMERTEA Nemertea 3 3 3 8
ANNELIDA (WORMS) Oligochaeta 1 28 4 32 84 A
MOLLUSCA Latia 5 15 15 39
Potamopyrgus 4 19 12 2 33 87 A
CRUSTACEA Paracalliope 5 3 3 8
EPHEMEROPTERA (MAYFLIES) Austroclima 7 7 5 12 32 A A
Coloburiscus 7 8 16 9 33 87 VA VA
Deleatidium 8 4 6 10 26 VA VA
Mauiulus 5 1 1 3
Nesameletus 9 1 1 3
Zephlebia group 7 22 9 2 33 87 A
PLECOPTERA (STONEFLIES) Zelandobius 5 10 8 18 47 VA
COLEOPTERA (BEETLES) Elmidae 6 10 15 2 27 71 VA VA
Ptilodactylidae 8 3 3 8
MEGALOPTERA (DOBSONFLIES) Archichauliodes 7 18 18 47 VA A
TRICHOPTERA (CADDISFLIES) Hydropsyche (Aoteapsyche) 4 16 18 3 37 97 A A
Costachorema 7 1 1 3
Hydrobiosis 5 8 8 21
Pycnocentria 7
Pycnocentrodes 5 18 3 21 55 A A
DIPTERA (TRUE FLIES) Aphrophila 5 1 1 3 A A
Orthocladiinae 2 11 11 29 A
Polypedilum 3
A
Austrosimulium 3 26 8 1 35 92 A
Tanyderidae 4 1 1 3
Prior to the current 2015-2016 period, 25 taxa had characterised the community at this site on occasions. These have comprised three ‘highly sensitive’, 14 ‘moderately sensitive’, and eight ‘tolerant’ taxa i.e. a higher proportion of ‘sensitive’ taxa than might be expected in the lower reaches of a ringplain stream, coincident with the extensive riparian cover provided by the Huatoki Domain. Predominant taxa have included no ‘highly sensitive’ taxa; four ‘moderately sensitive’ taxa [mayflies (Zephlebia group and Coloburiscus), elmid beetles, and stony-cased caddisfly (Pycnocentrodes)]; and four ‘tolerant’ taxa [oligochaete worms, snail (Potamopyrgus), net-building caddisfly (Hydropsyche-Aoteapsyche), and sandfly (Austrosimulium)]. The spring 2015 community consisted of nine historically characteristic taxa comprising one ‘highly sensitive’, seven ‘moderately sensitive’, and one ‘tolerant’ taxa. The summer 2016 community consisted of 14 historically characteristic taxa comprising one ‘highly sensitive’, seven ‘moderately sensitive’, and six ‘tolerant’ taxa. There were eight shared taxa between surveys (Table 83). Numerical decreases in two ‘very abundant’ ‘moderately sensitive’ contributed to a non-significant decrease of 0.4 units in SQMCIs

168
score (Table 163 and Table 164). The four taxa which were recorded as very abundant during spring and/or summer had characterised this site’s communities on 26% to 87% of past surveys.
Predicted stream ‘health’ 3.2.18.2.3The Huatoki Stream rises below the National Park boundary and the site at Hadley Domain is in the lower mid-reaches at an altitude of 30 m asl. The median value for a ringplain stream arising outside the National Park (TRC, 2015c) was 102 units. The historical, spring and summer scores were not significantly different to the TRC, 2015c value. The REC predicted MCI value (Leathwick, et al. 2009) was 92 units. The historical, spring and summer scores were all significantly higher than the REC value by 12 to 14 units (Stark, 1998).
Temporal trends in 1996 to 2016 data 3.2.18.2.4A LOWESS trend plot with a moving average (tension 0.4) trendline was produced (Figure 115). A non-parametric statistical trend analysis of the MCI data using the Mann-Kendall test was then performed on 20 years of SEM results (1996-2016) from the site in the Huatoki Stream at Huatoki Domain. The MCI has been chosen as the preferable indicator of ‘stream/river health’ for SEM trend reporting purposes.
Figure 115 LOWESS trend plot of MCI data in the Huatoki
Stream for the Huatoki Domain site
A similar temporal trend of a marked improvement in MCI scores, but not as strong as that found at the upstream site (at Hadley Drive), was identified at this site in the Domain although scores peaked with small decreases after 2006 and 2012. The overall trend has been very significant after FDR application (p< 0.01) and the trendline range of scores (10 units) although only of marginal ecological importance. The trend has probably been related to the upstream catchment activities noted above (Section 3.2.18.1.4) as no nearby habitat changes have been recorded within the Domain. The trendline MCI scores which indicated ‘fair’ generic stream health (Table 2) much earlier in the monitoring period, improved to ‘good’ stream health where they have remained since 2002.
HTK000425
1996 1998 2000 2002 2004 2006 2008 2010 2012 2014 2016 2018Year
70
80
90
100
110
120
MC
I va
lue
N = 40 Kendall tau = +0.415 p level < 0.001 FDR p < 0.001

169
Temporal trends in 2006 to 2016 data 3.2.18.2.5A LOWESS trend plot with a moving average (tension 0.4) trendline was produced (Figure 115). A non-parametric statistical trend analysis of the MCI data using the Mann-Kendall test was then performed on the most recent ten years of SEM results (2006-2016) from the site in the Huatoki Stream at Huatoki Domain.
Figure 116 LOWESS trend plot of ten years of MCI data in the
Huatoki Stream for the Huatoki Domain site
A minor non-significant positive trend occurred over the ten year period in contrast with the significant positive trend of the full dataset. Though the trendline show some minor variation within the ten year period with a rise in MCI scores from 2009 to 2013 little overall change in the trendline occurred. The trendline was indicative of ‘good’ generic stream health (Table 2).
Site near coast (HTK000745) 3.2.18.3 Taxa richness and MCI 3.2.18.3.1
Thirty-eight surveys have been undertaken at this lower reach site in the Huatoki Stream between December 1996 and February 2015. These results are summarised in Table 84, together with the results from the current period, and illustrated in Figure 117.
Table 84 Results of previous surveys performed in Huatoki Stream at the site near the coast, together with spring 2015 and summer 2016 results
Site code
SEM data ( 1996 to Feb 2015) 2015-2016 surveys
No of surveys
Taxa numbers MCI values Oct 2015 Mar 2016
Range Median Range Median Taxa no MCI Taxa no MCI
HTK000745 38 14-27 22 69-101 86 26 86 18 82
HTK000425
2006 2008 2010 2012 2014 2016 2018Year
80
85
90
95
100
105
110
115
120
MC
I va
lue
N = 20 Kendall tau = +0.180 p level = 0.267 FDR = 0.593

170
Figure 117 Numbers of taxa and MCI values in the Huatoki Stream at
Molesworth Street (near coast)
A moderate range of richnesses (14 to 27 taxa) has been found, with a median richness of 22 taxa (more representative of typical richnesses in the lower reaches of ringplain streams rising outside the National Park boundary). During the 2015-2016 period spring (26 taxa) taxa richness was higher than the summer (18 taxa) richness by eight taxa but both surveys were only four taxa different from the historical median richness. MCI values have had a relatively wide range (32 units) at this site. However, the median value (86 units) has been typical of lower reach sites elsewhere on the ringplain. The spring 2015 (86 units) and summer 2016 (82 units) scores were not significantly (Stark, 1998) different from each other. The spring score was the same as the historical median whereas the summer score was only four units lower. These scores were coincidental with a reduction in the cobble component of the substrate in summer. They categorised this site as having ‘fair’ (spring and summer) health generically (Table 2). The historical median score (86 units) placed this site in the ‘fair’ category for generic health.
Community composition 3.2.18.3.2Characteristic macroinvertebrate taxa in the communities at this site prior to the 2015-2016 period are listed in Table 85.
0
10
20
30
40
50
60
0
20
40
60
80
100
120
No.
of t
axa
MC
I val
ue
SEM: Number of taxa and MCI values in the Huatoki Stream at Molesworth Street (HTK000745)
MCI value Median MCI to dateNo. of taxa Median no. of taxa to date

171
Table 85 Characteristic taxa [abundant (A), very abundant (VA), extremely abundant (XA)] recorded in the Huatoki Stream at the site near the coast, between 1996 and 2015 [38 surveys], and by the spring 2015 and summer 2016 surveys
Taxa List MCI
score A VA XA Total %
Survey
FWB15297 FWB16146
NEMERTEA Nemertea 3 1 1 3
ANNELIDA (WORMS) Oligochaeta 1 7 18 13 38 100 XA XA
MOLLUSCA Ferrissia 3 1 1 3
Latia 5 3 3 8
Potamopyrgus 4 4 11 23 38 100 A XA
Sphaeriidae 3 1 1 3
CRUSTACEA Ostracoda 1 1 1 3 A
Paratya 3 2 1 3 8
EPHEMEROPTERA (MAYFLIES) Coloburiscus 7 3 1 4 11
Zephlebia group 7 6 6 16
PLECOPTERA (STONEFLIES) Zelandobius 5 3 3 8 A
COLEOPTERA (BEETLES) Elmidae 6 7 10 5 22 58 VA A
TRICHOPTERA (CADDISFLIES) Hydropsyche (Aoteapsyche) 4 3 3 8
Oxyethira 2 1 1 3
Pycnocentrodes 5 6 4 10 26
Triplectides 5 2 2 5
DIPTERA (TRUE FLIES) Aphrophila 5 1 1 3
Orthocladiinae 2 11 3 14 37
Polypedilum 3 1 1 3
Empididae 3 2 2 5
Austrosimulium 3 1 1 3
Tanyderidae 4 5 5 13
Prior to the current 2015-2016 period, 22 taxa had characterised the community at this site on occasions. These have comprised no ‘highly sensitive’, eight ‘moderately sensitive’, and 14 ‘tolerant’ taxa i.e. a high proportion of ‘tolerant’ taxa as would be expected in the lower reaches of a ringplain stream. Predominant taxa have included only one ‘moderately sensitive’ taxon [elmid beetles] and two ‘tolerant’ taxa [oligochaete worms and snail (Potamopyrgus); both “tolerant” taxa on every occasion]. Four of the historically characteristic taxa were dominant in the spring 2015 community and comprised two ‘moderately sensitive’ and two ‘tolerant’ taxa. The summer 2016 community was characterised by only one ‘moderately sensitive’ taxon and three ‘tolerant’ taxa with the same three predominant taxa present in both spring and summer surveys. The loss of one ‘moderately sensitive’ taxon in conjunction with increases in the numerically dominance of one ‘tolerant’ taxon and the decrease in the numerical dominance of a ‘moderate’ most predominant taxa between seasons was reflected in the similar spring and summer SQMCIs scores which were only 0.5 units different (Table 163 and Table 164). The three taxa which were recorded as very or extremely abundant during spring and/or summer had characterised this site’s communities on 58% to 100% of past surveys.

172
Predicted stream ‘health’ 3.2.18.3.3The Huatoki Stream rises below the National Park boundary and the site near the coast is in the lower reaches at an altitude of 5 m asl. The median value for a ringplain stream arising outside the National Park (TRC, 2015c) was 84 units. The historical, spring and summer scores were not significantly different to the TRC, 2015c value. The REC predicted MCI value (Leathwick, et al. 2009) was 93 units. The historical and spring scores were not significantly different to the REC value but the summer score was significantly lower (Stark, 1998) by 11 units.
Temporal trends in 1996 to 2016 data 3.2.18.3.4A LOWESS trend plot with a moving average (tension 0.4) trendline was produced (Figure 118). A non-parametric statistical trend analysis of the MCI data using the Mann-Kendall test was then performed on 20 years of SEM results (1996-2016) from the site in the Huatoki Stream near the coast. The MCI has been chosen as the preferable indicator of ‘stream/river health’ for SEM trend reporting purposes.
Figure 118 LOWESS trend plot of MCI data for the site in the Huatoki Stream near the coast
A trend of steady improvement in smoothed MCI scores had occurred at this urbanised site until 2004 after which scores trended downward until plateauing more recently (with much more variability amongst individual scores) following the pulsed flows and subtle habitat changes caused by the beautification project which involved construction of a weir and a fishpass. Overall, there was a slight negative non-significant trend. The range of LOWESS-smoothed scores (11 units) has some ecological importance probably related in part to those activities noted for the two sites further upstream in the Huatoki catchment (see above) and the stream enhancement project specific to the reach immediately upstream of this site. Smoothed MCI scores indicative of ‘fair’ generic stream health (Table 2) have been recorded for all but the first years of the monitoring programme (Figure 118).
Temporal trends in 2006 to 2016 data 3.2.18.3.5A LOWESS trend plot with a moving average (tension 0.4) was produced (Figure 119). A non-parametric statistical trend analysis of the MCI data using the Mann-
N = 40 Kendall tau = -0.034 p level = 0.757 FDR p = 0.803

173
Kendall test was then performed on the most recent ten years of SEM results (2006-2016) from the site in the Huatoki Stream near the coast.
Figure 119 LOWESS trend plot of ten years of MCI data for the site in the Huatoki Stream near the
coast
No trend occurred over the ten year period. Though the trendline show some minor variation within the ten year period no positive or negative trend occurred indicating no change. The trendline was indicative of ‘fair’ generic stream health (Table 2).
Discussion 3.2.18.4Seasonal MCI values significantly decreased between spring and summer at only the upstream Hadley Drive site (by 19 units), whereas there were minimal, non-significant decreases at the coastal and Huatoki Domain sites. The upper site typically had the largest decrease from spring to summer of the three Huatoki sites sampled. Historically, there have been median summer MCI decreases of six units at the Hadley Drive site, three units at the Huatoki Domain site, and one unit change near the coast (Appendix II). Seasonal communities shared 16 of the 33 taxa (48%) found at the mid-reach Hadley Drive site, 19 of 28 taxa (68%) at Huatoki Domain, but only 12 of 32 taxa (38%) at the furthest downstream site in the lower reaches near the coast. This was indicative of the least dissimilarity in seasonal community composition at the more stable Huatoki Domain site and by far the greatest dissimilarity at the furthest downstream site. Community composition indicated some improvement at the Hadley Drive site where there was a significantly higher spring MCI score recorded compared with both the historic spring median and overall site median. Further downstream, near the mouth, urbanisation and habitat modification coincided with a significant variation in community composition. This site’s seasonal faunal communities were characterised by a decrease in taxa richness from spring to summer and the disappearance of both ‘highly sensitive’ spring taxa. Community composition varied markedly through the mid reach to lower reach length of the stream surveyed. A total of 38 taxa were recorded in spring, similar number to the previous spring survey (37 taxa). Of the 38 taxa, only 14 taxa (37%) were present at all three sites. These included two ‘highly sensitive’, six ‘moderately
HTK000745
2006 2008 2010 2012 2014 2016 2018Year
60
70
80
90
100
110
MC
I va
lue
N = 20 Kendall tau = 0.000 p level = 1.000 FDR p = 1.000

174
sensitive’, and six ‘tolerant’ taxa with only one ‘moderately sensitive’ taxon (elmid beetles) abundant at all three sites. A similar total of 37 taxa were found along the stream’s surveyed length by the summer survey when only nine taxa (24%) were present at all three sites. Seven of these taxa were the same as the widespread taxa in spring. One ‘moderately sensitive’ taxon [‘moderately sensitive’ elmid beetles] was abundant at all three sites in summer. Dissimilarities in spatial community structure along the surveyed length (mid to lower reaches) of the Huatoki Stream were more pronounced in summer as has often been found in the past. MCI score decreased (for ringplain streams) in a downstream direction by nine units in spring and atypically increased by nine units in summer between the open farmland site (Hadley Drive) and the Huatoki Domain site in comparison with increases recorded by most past surveys (e.g. historical median scores have increased by five units (spring) and eight units (summer) between these sites (Appendix II)). The downstream changes were the result of the upstream site deteriorating in condition over summer as filamentous algae went from being absent in spring to widespread in summer. The well shaded Huatoki Domain site was generally well buffered from seasonal impacts. MCI score fell by 20 units (spring) and by 23 units (summer) through the city between the Domain and the coast, despite a relatively short distance between the two sites. Both spring and summer decreases were above the normal decreases of 15 and 12 units between the two sites (Appendix II) coincident with some impacts of urbanisation on the stream’s macroinvertebrate fauna and poorer habitat quality at the coastal site.
Kaupokonui River 3.2.19Five sites located along the length of the Kaupokonui River were included in the SEM programme, commencing in the 1999-2000 year for the purpose of long term monitoring of the impacts of riparian vegetation planting initiatives throughout this catchment. Two sites, at Opunake Road (KPK000250) and near the coast (KPK000990), were established specifically for this purpose, while the remaining three sites were components of existing consent monitoring programmes. The results of the spring 2015 and summer 2016 surveys are presented in Table 165 and Table 166, Appendix I.
Opunake Road site (KPK000250) 3.2.19.1 Taxa richness and MCI 3.2.19.1.1
Thirty-three surveys have been undertaken in the Kaupokonui River at this upper mid-reach site at Opunake Road (draining relatively open farmland approximately 3.3 km downstream of the National Park) between March 1998 and February 2015. These results are summarised in Table 86, together with the results from the current period, and illustrated in Figure 120.
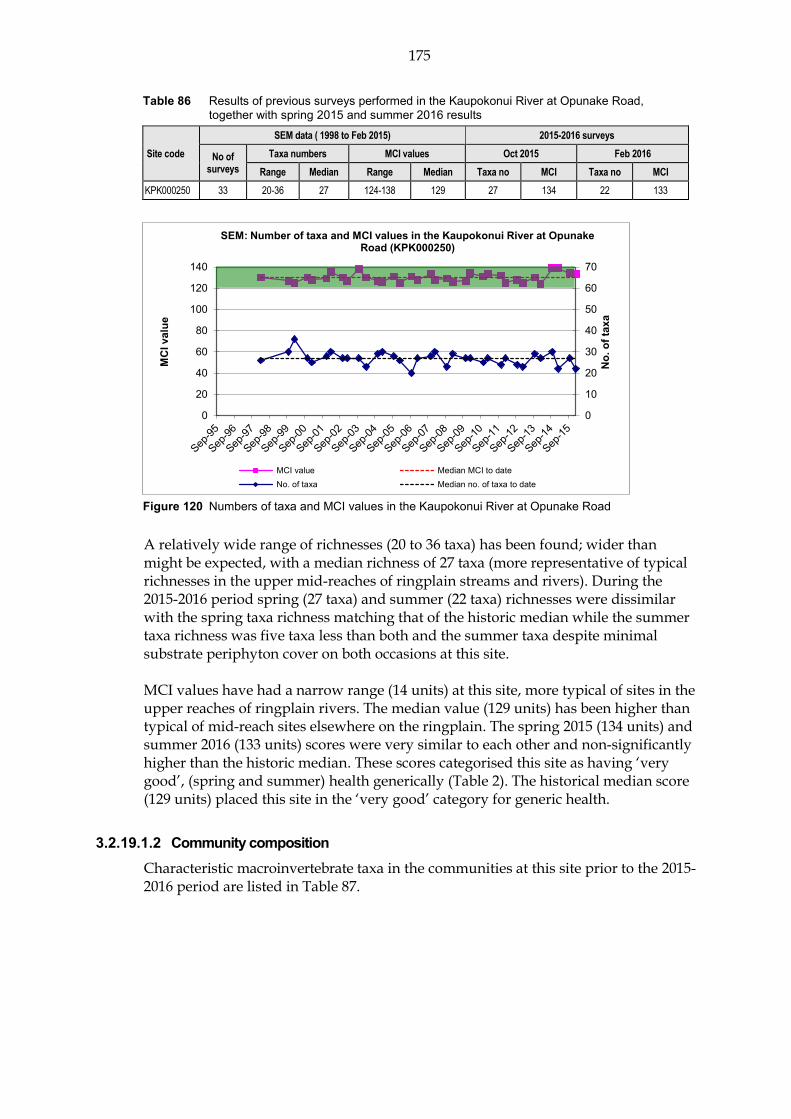
175
Table 86 Results of previous surveys performed in the Kaupokonui River at Opunake Road, together with spring 2015 and summer 2016 results
Site code
SEM data ( 1998 to Feb 2015) 2015-2016 surveys
No of surveys
Taxa numbers MCI values Oct 2015 Feb 2016
Range Median Range Median Taxa no MCI Taxa no MCI
KPK000250 33 20-36 27 124-138 129 27 134 22 133
Figure 120 Numbers of taxa and MCI values in the Kaupokonui River at Opunake Road
A relatively wide range of richnesses (20 to 36 taxa) has been found; wider than might be expected, with a median richness of 27 taxa (more representative of typical richnesses in the upper mid-reaches of ringplain streams and rivers). During the 2015-2016 period spring (27 taxa) and summer (22 taxa) richnesses were dissimilar with the spring taxa richness matching that of the historic median while the summer taxa richness was five taxa less than both and the summer taxa despite minimal substrate periphyton cover on both occasions at this site. MCI values have had a narrow range (14 units) at this site, more typical of sites in the upper reaches of ringplain rivers. The median value (129 units) has been higher than typical of mid-reach sites elsewhere on the ringplain. The spring 2015 (134 units) and summer 2016 (133 units) scores were very similar to each other and non-significantly higher than the historic median. These scores categorised this site as having ‘very good’, (spring and summer) health generically (Table 2). The historical median score (129 units) placed this site in the ‘very good’ category for generic health.
Community composition 3.2.19.1.2Characteristic macroinvertebrate taxa in the communities at this site prior to the 2015-2016 period are listed in Table 87.
0
10
20
30
40
50
60
70
0
20
40
60
80
100
120
140
No. o
f tax
a
MCI
val
ue
SEM: Number of taxa and MCI values in the Kaupokonui River at Opunake Road (KPK000250)
MCI value Median MCI to dateNo. of taxa Median no. of taxa to date

176
Table 87 Characteristic taxa [abundant (A), very abundant (VA), extremely abundant (XA)] recorded in the Kaupokonui River at Opunake Road between 1995 and February 2015 [33 surveys], and by the spring 2015 and summer 2016 surveys
Taxa List MCI score
A VA XA Total %
Survey
Spring 2015
Summer 2016
ANNELIDA (WORMS) Oligochaeta 1 2 2 6
EPHEMEROPTERA (MAYFLIES) Austroclima 7 3 3 9
Coloburiscus 7 12 13 6 31 94 VA VA
Deleatidium 8 1 11 21 33 100 VA VA
Nesameletus 9 10 5 15 45 A A
PLECOPTERA (STONEFLIES) Acroperla 5 1 1 3
Megaleptoperla 9 20 1 21 64
Zelandoperla 8 20 10 30 91 VA VA
COLEOPTERA (BEETLES) Elmidae 6 11 20 1 32 97 VA A
Hydraenidae 8 3 3 9
MEGALOPTERA (DOBSONFLIES) Archichauliodes 7 7 7 21
TRICHOPTERA (CADDISFLIES) Hydropsyche (Aoteapsyche) 4 15 12 27 82 A A
Costachorema 7 5 5 15
Hydrobiosis 5 3 1 4 12
Beraeoptera 8 11 11 2 24 73 VA A
Helicopsyche 10 3 1 4 12 A
Olinga 9 11 8 2 21 64 XA VA
Pycnocentrodes 5 8 4 12 36 A
DIPTERA (TRUE FLIES) Aphrophila 5 15 16 31 94 A A
Eriopterini 5 6 6 18
Maoridiamesa 3 6 1 7 21
Orthocladiinae 2 6 2 8 24
Prior to the current 2015-2016 period, 22 taxa had characterised the community at this site on occasions. These have comprised eight ‘highly sensitive’, ten ‘moderately sensitive’, and four ‘tolerant’ taxa i.e. a majority of ‘sensitive’ taxa as would be expected in the upper mid-reaches of a ringplain stream. Predominant taxa have included five ‘highly sensitive’ taxa [mayfly (Deleatidium, on every sampling occasion), stoneflies (Megaleptoperla and Zelandoperla), and cased caddisflies (Beraeoptera and Olinga)]; three ‘moderately sensitive’ taxa [mayfly (Coloburiscus), elmid beetles, and cranefly (Aphrophila)]; and one ‘tolerant’ taxon [net-building caddisfly (Hydropsyche-Aoteapsyche)]. The spring 2015 community consisted of ten historically characteristic taxa comprising six ‘highly sensitive’, three ‘moderately sensitive’ and one ‘tolerant’ taxa. The summer 2016 community consisted of ten historically characteristic taxa comprising five ‘highly sensitive’, four ‘moderately sensitive’ and one ‘tolerant’ taxa. There was a very high nine of the elven characteristic taxa shared between surveys indicating a very stable community composition.

177
The small change in community composition with some decreases in the numerical dominance of ‘highly sensitive’ taxa and increases in ‘moderately sensitive’ taxa resulted in a small, non-significant decreases in the summer SQMCIs value of 0.4 units (Table 165 and Table 166). All taxa recorded as very or extremely abundant during spring and/or summer had characterized this site’s communities on 64% to 100% of past surveys. The mayfly Deleatidium recorded as very or extremely abundant during spring and/or summer has characterised this site’s communities on every past survey occasion.
Predicted stream ‘health’ 3.2.19.1.3The Kaupokonui River site at Opunake Road is 3.3 km downstream of the National Park boundary at an altitude of 380 m asl. Relationships for ringplain streams developed between MCI and site altitude and distance from the National Park boundary (Stark and Fowles, 2009), predict MCI values of 123 (altitude) and 118 (distance) for this site. The historical site median (129) is six units higher than the altitude prediction and a significant (Stark, 1998) 11 units higher than the distance predictive value. The spring 2015 survey score (134 units) was a significant 11 to 16 units higher than these predictive values. The summer 2016 score (133 units) was not significantly different to the altitude score but was significantly higher than the distance value by 15 units. The median value for a ringplain stream arising outside the National Park (TRC, 2015c) was 129 units. The historical, spring and summer scores were not significantly different to the TRC, 2015c value. The REC predicted MCI value (Leathwick, et al. 2009) was 137 units. The historical, spring and summer scores were not significantly different to the REC value either (Stark, 1998).
Temporal trends in 1998 to 2016 data 3.2.19.1.4A LOWESS trend plot with a moving average (tension 0.4) was produced (Figure 121). A non-parametric statistical trend analysis of the MCI data using the Mann-Kendall test was then performed on 17 years of SEM results (1998-2016) from the site in the Kaupokonui River at Opunake Road. The MCI has been chosen as the preferable indicator of ‘stream/river health’ for SEM trend reporting purposes.
Figure 121 LOWESS trend plot of MCI data in the Kaupokonui River at the Opunake Road site
KPK000250
1996 1998 2000 2002 2004 2006 2008 2010 2012 2014 2016 2018Year
122
124
126
128
130
132
134
136
138
140
MC
I va
lue
N = 35 Kendall tau = +0.134 p level = 0.258 FDR p = 0.342
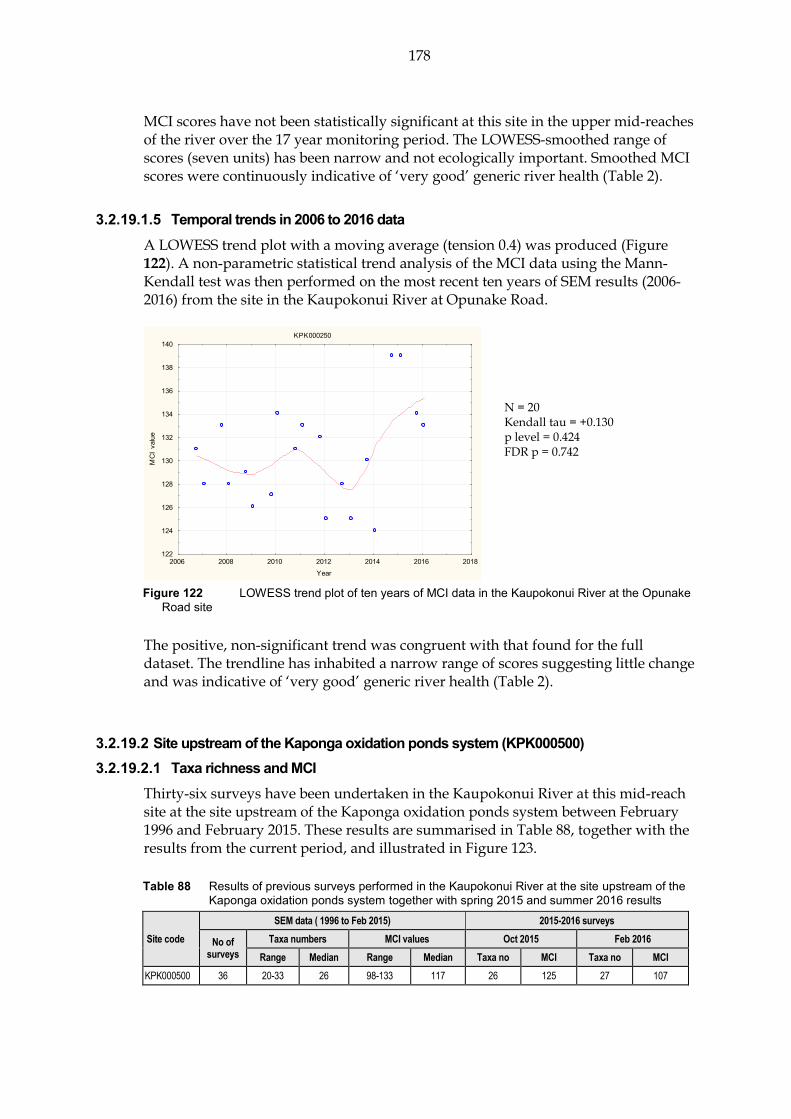
178
MCI scores have not been statistically significant at this site in the upper mid-reaches of the river over the 17 year monitoring period. The LOWESS-smoothed range of scores (seven units) has been narrow and not ecologically important. Smoothed MCI scores were continuously indicative of ‘very good’ generic river health (Table 2).
Temporal trends in 2006 to 2016 data 3.2.19.1.5A LOWESS trend plot with a moving average (tension 0.4) was produced (Figure
122). A non-parametric statistical trend analysis of the MCI data using the Mann-Kendall test was then performed on the most recent ten years of SEM results (2006-2016) from the site in the Kaupokonui River at Opunake Road.
Figure 122 LOWESS trend plot of ten years of MCI data in the Kaupokonui River at the Opunake
Road site
The positive, non-significant trend was congruent with that found for the full dataset. The trendline has inhabited a narrow range of scores suggesting little change and was indicative of ‘very good’ generic river health (Table 2).
Site upstream of the Kaponga oxidation ponds system (KPK000500) 3.2.19.2 Taxa richness and MCI 3.2.19.2.1
Thirty-six surveys have been undertaken in the Kaupokonui River at this mid-reach site at the site upstream of the Kaponga oxidation ponds system between February 1996 and February 2015. These results are summarised in Table 88, together with the results from the current period, and illustrated in Figure 123.
Table 88 Results of previous surveys performed in the Kaupokonui River at the site upstream of the Kaponga oxidation ponds system together with spring 2015 and summer 2016 results
Site code
SEM data ( 1996 to Feb 2015) 2015-2016 surveys
No of surveys
Taxa numbers MCI values Oct 2015 Feb 2016
Range Median Range Median Taxa no MCI Taxa no MCI
KPK000500 36 20-33 26 98-133 117 26 125 27 107
KPK000250
2006 2008 2010 2012 2014 2016 2018Year
122
124
126
128
130
132
134
136
138
140
MC
I va
lue
N = 20 Kendall tau = +0.130 p level = 0.424 FDR p = 0.742
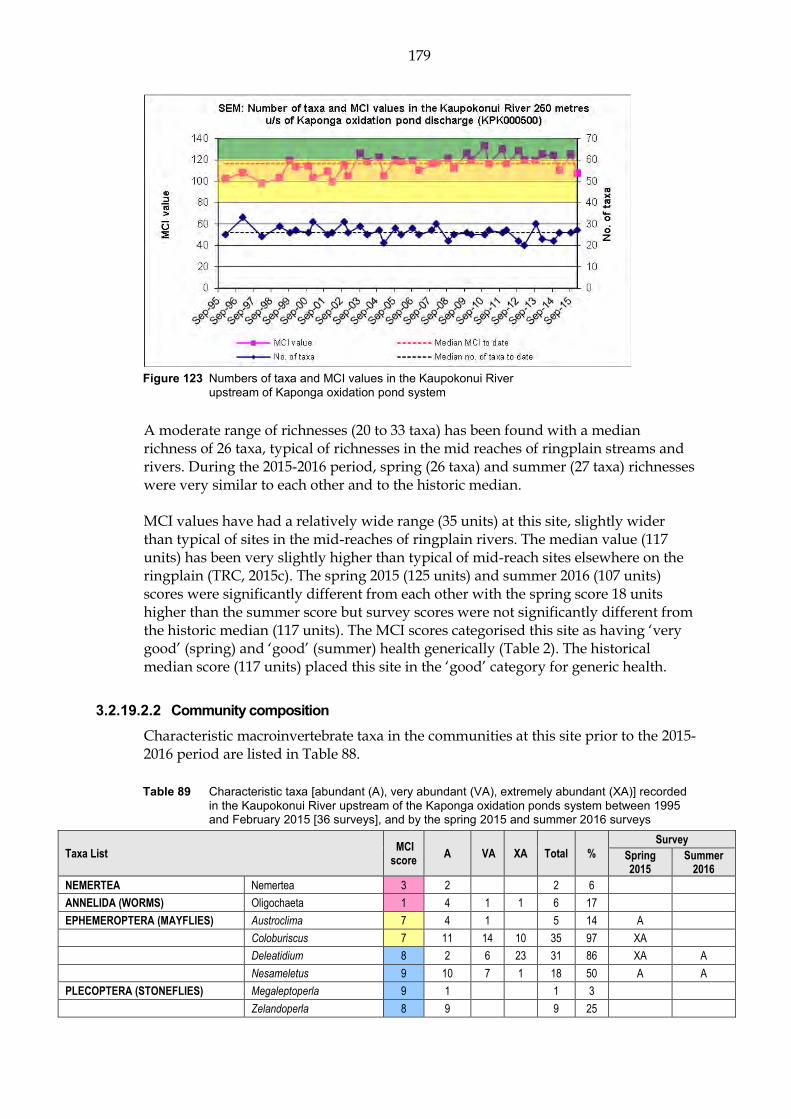
179
Figure 123 Numbers of taxa and MCI values in the Kaupokonui River
upstream of Kaponga oxidation pond system
A moderate range of richnesses (20 to 33 taxa) has been found with a median richness of 26 taxa, typical of richnesses in the mid reaches of ringplain streams and rivers. During the 2015-2016 period, spring (26 taxa) and summer (27 taxa) richnesses were very similar to each other and to the historic median. MCI values have had a relatively wide range (35 units) at this site, slightly wider than typical of sites in the mid-reaches of ringplain rivers. The median value (117 units) has been very slightly higher than typical of mid-reach sites elsewhere on the ringplain (TRC, 2015c). The spring 2015 (125 units) and summer 2016 (107 units) scores were significantly different from each other with the spring score 18 units higher than the summer score but survey scores were not significantly different from the historic median (117 units). The MCI scores categorised this site as having ‘very good’ (spring) and ‘good’ (summer) health generically (Table 2). The historical median score (117 units) placed this site in the ‘good’ category for generic health.
Community composition 3.2.19.2.2Characteristic macroinvertebrate taxa in the communities at this site prior to the 2015-2016 period are listed in Table 88.
Table 89 Characteristic taxa [abundant (A), very abundant (VA), extremely abundant (XA)] recorded
in the Kaupokonui River upstream of the Kaponga oxidation ponds system between 1995 and February 2015 [36 surveys], and by the spring 2015 and summer 2016 surveys
Taxa List MCI score
A VA XA Total %
Survey
Spring 2015
Summer 2016
NEMERTEA Nemertea 3 2 2 6
ANNELIDA (WORMS) Oligochaeta 1 4 1 1 6 17
EPHEMEROPTERA (MAYFLIES) Austroclima 7 4 1 5 14 A
Coloburiscus 7 11 14 10 35 97 XA
Deleatidium 8 2 6 23 31 86 XA A
Nesameletus 9 10 7 1 18 50 A A
PLECOPTERA (STONEFLIES) Megaleptoperla 9 1 1 3
Zelandoperla 8 9 9 25

180
Taxa List MCI score
A VA XA Total %
Survey
Spring 2015
Summer 2016
COLEOPTERA (BEETLES) Elmidae 6 16 16 1 33 92 A A
MEGALOPTERA (DOBSONFLIES) Archichauliodes 7 18 1 19 53 A
TRICHOPTERA (CADDISFLIES) Hydropsyche (Aoteapsyche) 4 15 13 4 32 89 VA A
Costachorema 7 18 1 19 53
Hydrobiosis 5 6 4 10 28 A
Beraeoptera 8 10 7 2 19 53 A
Olinga 9 5 5 14
Oxyethira 2 1 1 3
Pycnocentrodes 5 8 10 2 20 56 A A
DIPTERA (TRUE FLIES) Aphrophila 5 18 17 35 97 VA A
Eriopterini 5 5 5 14
Maoridiamesa 3 8 7 9 24 67 A VA
Orthocladiinae 2 12 8 3 23 64 VA
Tanytarsini 3 3 3 6 17
Empididae 3 1 1 3
Muscidae 3 4 4 11
Austrosimulium 3 1 1 3
Prior to the current 2015-2016 period, 25 taxa had characterised the community at this site on occasions. These have comprised six ‘highly sensitive’, nine ‘moderately sensitive’, and ten ‘tolerant’ taxa i.e. a majority of ‘sensitive’ taxa but a small downstream increase in ‘tolerant’ taxa compared with the Opunake Road site, as would be expected in the mid-reaches of a ringplain river. Predominant taxa have included three ‘highly sensitive’ taxa [mayflies (Deleatidium and Nesameletus) and flare-cased caddisfly (Beraeoptera)]; six ‘moderately sensitive’ taxa [mayfly (Coloburiscus), elmid beetles, dobsonfly (Archichauliodes), free-living caddisfly (Costachorema), stony-cased caddisfly (Pycnocentrodes), and cranefly (Aphrophila)]; and three ‘tolerant’ taxa [free-living caddisfly (Hydropsyche-Aoteapsyche) and midges (Maoridiamesa and orthoclads)]. The spring 2015 community consisted of 11 historically characteristic taxa comprising three ‘highly sensitive’, six ‘moderately sensitive’ and two ‘tolerant’ taxa. The summer 2016 community consisted of nine historically characteristic taxa comprising two ‘highly sensitive’, four ‘moderately sensitive’ and three ‘tolerant’ taxa. Seven of the 13 characteristic taxa were shared between surveys indicating a stable community composition (Table 89). Decreased numerical dominances in several ‘sensitive’ taxa and increased numerical dominances in several ‘tolerant’ taxa resulted in a significant decrease of 2.8 units in SQMCIs scores between spring and summer (Table 165 and Table 166). The eight taxa recorded as very or extremely abundant during spring and/or summer have characterised this site’s communities on 64% to 97% of past survey occasions.
Predicted stream ‘health’ 3.2.19.2.3The Kaupokonui River site upstream of the Kaponga oxidation pond system is 9.2 km downstream of the National Park boundary at an altitude of 260 m asl. Relationships for ringplain streams developed between MCI and site altitude and distance from the National Park boundary (Stark and Fowles, 2009), predict MCI values of 111 (altitude) and 107 (distance) for this site. The historical site median (117) is 6 units higher than the altitude prediction and ten units higher than the
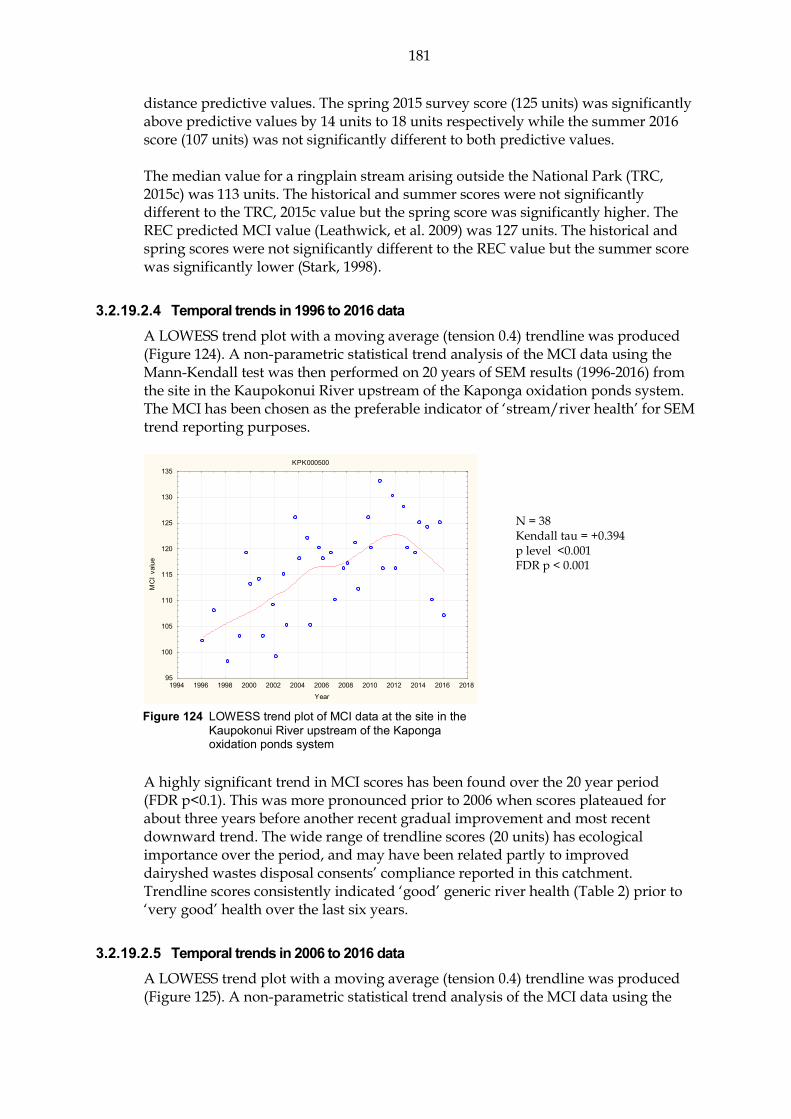
181
distance predictive values. The spring 2015 survey score (125 units) was significantly above predictive values by 14 units to 18 units respectively while the summer 2016 score (107 units) was not significantly different to both predictive values. The median value for a ringplain stream arising outside the National Park (TRC, 2015c) was 113 units. The historical and summer scores were not significantly different to the TRC, 2015c value but the spring score was significantly higher. The REC predicted MCI value (Leathwick, et al. 2009) was 127 units. The historical and spring scores were not significantly different to the REC value but the summer score was significantly lower (Stark, 1998).
Temporal trends in 1996 to 2016 data 3.2.19.2.4A LOWESS trend plot with a moving average (tension 0.4) trendline was produced (Figure 124). A non-parametric statistical trend analysis of the MCI data using the Mann-Kendall test was then performed on 20 years of SEM results (1996-2016) from the site in the Kaupokonui River upstream of the Kaponga oxidation ponds system. The MCI has been chosen as the preferable indicator of ‘stream/river health’ for SEM trend reporting purposes.
Figure 124 LOWESS trend plot of MCI data at the site in the
Kaupokonui River upstream of the Kaponga oxidation ponds system
A highly significant trend in MCI scores has been found over the 20 year period (FDR p<0.1). This was more pronounced prior to 2006 when scores plateaued for about three years before another recent gradual improvement and most recent downward trend. The wide range of trendline scores (20 units) has ecological importance over the period, and may have been related partly to improved dairyshed wastes disposal consents’ compliance reported in this catchment. Trendline scores consistently indicated ‘good’ generic river health (Table 2) prior to ‘very good’ health over the last six years.
Temporal trends in 2006 to 2016 data 3.2.19.2.5A LOWESS trend plot with a moving average (tension 0.4) trendline was produced (Figure 125). A non-parametric statistical trend analysis of the MCI data using the
KPK000500
1994 1996 1998 2000 2002 2004 2006 2008 2010 2012 2014 2016 2018Year
95
100
105
110
115
120
125
130
135
MC
I va
lue
N = 38 Kendall tau = +0.394 p level <0.001 FDR p < 0.001
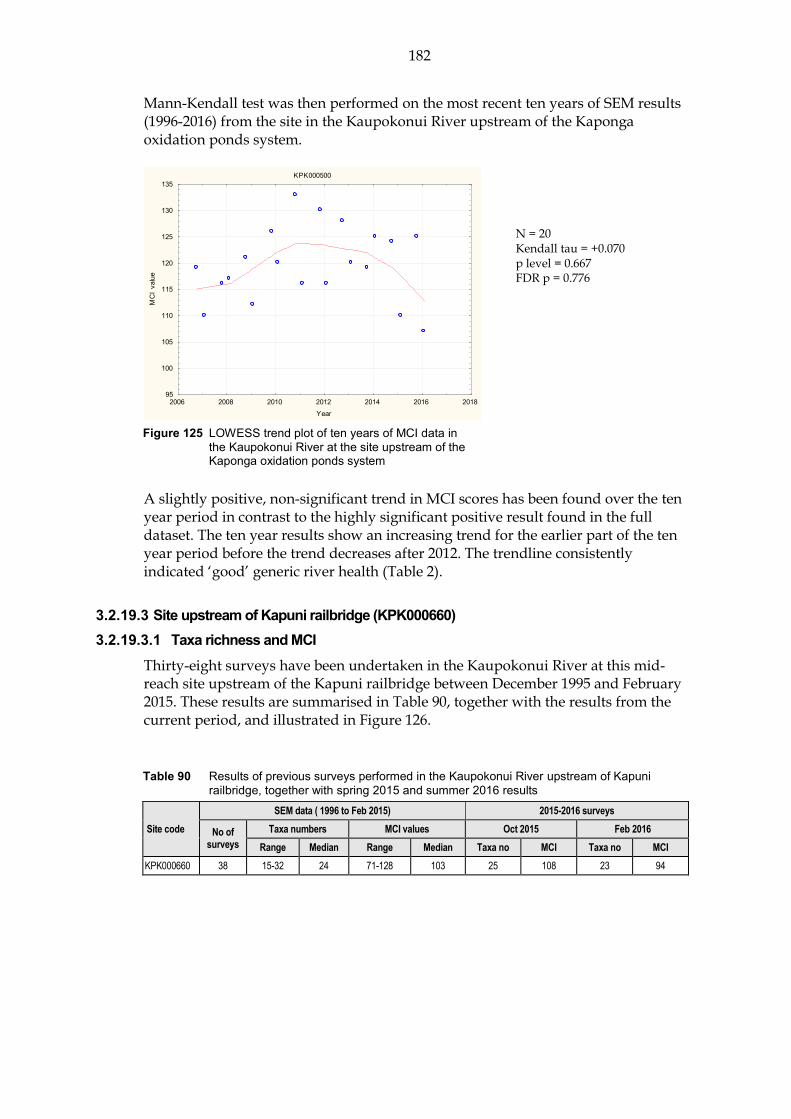
182
Mann-Kendall test was then performed on the most recent ten years of SEM results (1996-2016) from the site in the Kaupokonui River upstream of the Kaponga oxidation ponds system.
Figure 125 LOWESS trend plot of ten years of MCI data in
the Kaupokonui River at the site upstream of the Kaponga oxidation ponds system
A slightly positive, non-significant trend in MCI scores has been found over the ten year period in contrast to the highly significant positive result found in the full dataset. The ten year results show an increasing trend for the earlier part of the ten year period before the trend decreases after 2012. The trendline consistently indicated ‘good’ generic river health (Table 2).
Site upstream of Kapuni railbridge (KPK000660) 3.2.19.3 Taxa richness and MCI 3.2.19.3.1
Thirty-eight surveys have been undertaken in the Kaupokonui River at this mid-reach site upstream of the Kapuni railbridge between December 1995 and February 2015. These results are summarised in Table 90, together with the results from the current period, and illustrated in Figure 126.
Table 90 Results of previous surveys performed in the Kaupokonui River upstream of Kapuni railbridge, together with spring 2015 and summer 2016 results
Site code
SEM data ( 1996 to Feb 2015) 2015-2016 surveys
No of surveys
Taxa numbers MCI values Oct 2015 Feb 2016
Range Median Range Median Taxa no MCI Taxa no MCI
KPK000660 38 15-32 24 71-128 103 25 108 23 94
KPK000500
2006 2008 2010 2012 2014 2016 2018Year
95
100
105
110
115
120
125
130
135
MC
I va
lue
N = 20 Kendall tau = +0.070 p level = 0.667 FDR p = 0.776

183
Figure 126 Numbers of taxa and MCI values in the Kaupokonui River upstream of
Kapuni railbridge
A wide range of richnesses (15 to 32 taxa) has been found with a median richness of 24 taxa (more representative of typical richnesses in the mid reaches of ringplain streams and rivers). During the 2015-2016 period spring (25 taxa) and summer (23 taxa) richnesses were relatively similar and within one taxon of the historic median. MCI values have had a very wide range (57 units) at this site, much wider than typical of sites elsewhere in the mid reaches of ringplain rivers. However, the median value (103 units) has been relatively typical of mid reach sites elsewhere on the ringplain (TRC, 2015c). The spring 2015 (108 units) and summer 2016 (94 units) scores were significantly different from each other (14 units) but were not significantly different from the historic median. These scores categorised this site as having ‘good’ (spring) and ‘fair’ (summer) health generically (Table 2). The historical median score (103 units) placed this site in the ‘good’ category for generic health.
Community composition 3.2.19.3.2Characteristic macroinvertebrate taxa in the communities at this site prior to the 2015-2016 period are listed in Table 91.
Table 91 Characteristic taxa [abundant (A), very abundant (VA), extremely abundant (XA)] recorded in the Kaupokonui River upstream of Kapuni railbridge between 1995 and February 2015 [38 surveys], and by the spring 2015 and summer 2016 surveys
Taxa List MCI score
A VA XA Total %
Survey
Spring 2015
Summer 2016
NEMERTEA Nemertea 3 2 2 6
ANNELIDA (WORMS) Oligochaeta 1 9 6 15 43
MOLLUSCA Potamopyrgus 4 2 2 6 A
EPHEMEROPTERA (MAYFLIES) Austroclima 7 8 8 23 A
Coloburiscus 7 7 13 2 22 63 VA A
Deleatidium 8 2 7 17 26 74 XA VA
Nesameletus 9 5 5 14

184
Taxa List MCI score
A VA XA Total %
Survey
Spring 2015
Summer 2016
PLECOPTERA (STONEFLIES) Acroperla 5 3 3 9
Zelandoperla 8 1 1 3
COLEOPTERA (BEETLES) Elmidae 6 9 15 5 29 83 A A
MEGALOPTERA (DOBSONFLIES) Archichauliodes 7 15 15 43 A
TRICHOPTERA (CADDISFLIES) Hydropsyche (Aoteapsyche) 4 5 14 5 24 69 XA
Costachorema 7 11 11 31 A
Hydrobiosis 5 11 11 31 A
Beraeoptera 8 3 6 9 26 A
Oxyethira 2 7 7 20
Pycnocentrodes 5 8 7 1 16 46 VA
DIPTERA (TRUE FLIES) Aphrophila 5 19 5 24 69
Maoridiamesa 3 14 7 2 23 66 VA
Orthocladiinae 2 12 9 7 28 80 A A
Tanytarsini 3 1 1 3
Muscidae 3 2 2 6
Austrosimulium 3 5 5 14
Prior to the current 2015-2016 period, 30 taxa had characterised the community at this site on occasions. These have comprised five ‘highly sensitive’, eleven ‘moderately sensitive’, and fourteen ‘tolerant’ taxa i.e. a minority of ‘highly sensitive’ taxa and a higher proportion of ‘tolerant’ taxa as might be expected in the mid reaches of a ringplain river. Predominant taxa have included one ‘highly sensitive’ taxon [mayfly (Deleatidium)]; three ‘moderately sensitive’ taxa [mayfly (Coloburiscus), elmid beetles, and cranefly (Aphrophila)]; and three ‘tolerant’ taxa [net-building caddisfly (Hydropsyche-Aoteapsyche), and midges (Maoridiamesa and orthoclads)]. The spring 2015 community consisted of eight historically characteristic taxa comprising two ‘highly sensitive’, four ‘moderately sensitive’ and five ‘tolerant’ taxa. The summer 2016 community consisted of nine historically characteristic taxa comprising one ‘highly sensitive’, five ‘moderately sensitive’ and three ‘tolerant’ taxa. Four of the 13 characteristic taxa were shared between surveys (Table 91). The decreased numerical dominance of ‘sensitive’ taxa and increased dominance within ‘tolerant’ taxon in summer was reflected in the large significant decrease of 2.8 units in summer SQMCIs score (Table 165 and Table 166). The five taxa recorded as very or extremely abundant during spring and/or summer have characterised this site’s communities on 46% to 74% of past survey occasions.
Predicted stream ‘health’ 3.2.19.3.3The Kaupokonui River site upstream of the Kapuni railbridge is 15.5 km downstream of the National Park boundary at an altitude of 170 m asl. Relationships for ringplain streams developed between MCI and site altitude and distance from the National Park boundary (Stark and Fowles, 2009), predict MCI values of 102 (altitude) and 101 (distance) for this site. The historical site median (103) is one unit above the altitude prediction and two units above the distance predictive value. The spring 2015 survey score (108 units) was not significantly different to both predictive values while the summer 2016 score (80 units) was significantly lower than both values by 22 and 21 units respectively.
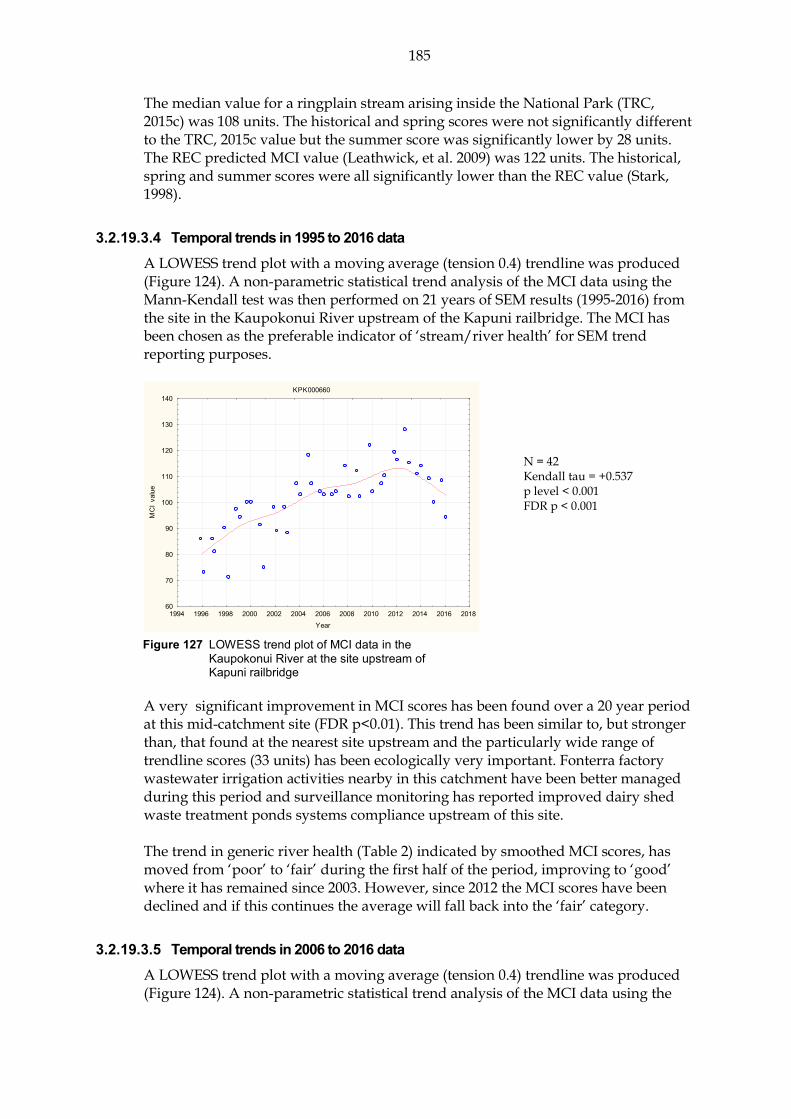
185
The median value for a ringplain stream arising inside the National Park (TRC, 2015c) was 108 units. The historical and spring scores were not significantly different to the TRC, 2015c value but the summer score was significantly lower by 28 units. The REC predicted MCI value (Leathwick, et al. 2009) was 122 units. The historical, spring and summer scores were all significantly lower than the REC value (Stark, 1998).
Temporal trends in 1995 to 2016 data 3.2.19.3.4A LOWESS trend plot with a moving average (tension 0.4) trendline was produced (Figure 124). A non-parametric statistical trend analysis of the MCI data using the Mann-Kendall test was then performed on 21 years of SEM results (1995-2016) from the site in the Kaupokonui River upstream of the Kapuni railbridge. The MCI has been chosen as the preferable indicator of ‘stream/river health’ for SEM trend reporting purposes.
Figure 127 LOWESS trend plot of MCI data in the
Kaupokonui River at the site upstream of Kapuni railbridge
A very significant improvement in MCI scores has been found over a 20 year period at this mid-catchment site (FDR p<0.01). This trend has been similar to, but stronger than, that found at the nearest site upstream and the particularly wide range of trendline scores (33 units) has been ecologically very important. Fonterra factory wastewater irrigation activities nearby in this catchment have been better managed during this period and surveillance monitoring has reported improved dairy shed waste treatment ponds systems compliance upstream of this site. The trend in generic river health (Table 2) indicated by smoothed MCI scores, has moved from ‘poor’ to ‘fair’ during the first half of the period, improving to ‘good’ where it has remained since 2003. However, since 2012 the MCI scores have been declined and if this continues the average will fall back into the ‘fair’ category.
Temporal trends in 2006 to 2016 data 3.2.19.3.5A LOWESS trend plot with a moving average (tension 0.4) trendline was produced (Figure 124). A non-parametric statistical trend analysis of the MCI data using the
KPK000660
1994 1996 1998 2000 2002 2004 2006 2008 2010 2012 2014 2016 2018Year
60
70
80
90
100
110
120
130
140
MC
I va
lue
N = 42 Kendall tau = +0.537 p level < 0.001 FDR p < 0.001

186
Mann-Kendall test was then performed on the ten most recent years of SEM results (2006-2016) from the site in the Kaupokonui River upstream of the Kapuni railbridge.
Figure 128 LOWESS trend plot of ten years of MCI data in
the Kaupokonui River at the site upstream of Kapuni railbridge
A slightly positive non-significant trend in MCI scores has been found over the ten year period in contrast to the highly significant positive result found in the full dataset. The ten year results show an increasing trend for the earlier part of the ten year period before the trend sharply decreases after 2013. The trendline consistently indicated ‘good’ generic river health (Table 2).
Upper Glenn Road site (KPK000880) 3.2.19.4 Taxa richness and MCI 3.2.19.4.1
Thirty-eight surveys have been undertaken in the Kaupokonui River at this lower reach site at Upper Glenn Road between 1995 and February 2015. These results are summarised in Table 92, together with the results from the current period, and illustrated in Figure 129.
Table 92 Results of previous surveys performed in the Kaupokonui River at Upper Glenn Road, together with spring 2015 and summer 2016 results
Site code
SEM data ( 1996 to Feb 2015) 2015-2016 surveys
No of surveys
Taxa numbers MCI values Oct 2015 Feb 2016
Range Median Range Median Taxa no MCI Taxa no MCI
KPK000880 40 14-31 19 66-110 91 20 99 20 84
KPK000660
2006 2008 2010 2012 2014 2016 2018Year
80
90
100
110
120
130
140
MC
I va
lue
N = 20 Kendall tau = +0.005 p level = 0.974 FDR p = 0.974

187
Figure 129 Numbers of taxa and MCI values in Kaupokonui River at Upper Glenn Road
A wide range of richnesses (14 to 31 taxa) has been found with a median richness of 19 taxa (typical of richnesses in the lower reaches of ringplain streams and rivers). During the 2015-2016 period spring (20 taxa) and summer (20 taxa) richnesses were the same and within one taxon of the median taxa number. MCI values have had a very wide range (44 units) at this site, more typical of sites in the lower reaches of ringplain streams and rivers. The median value (91 units) has been slightly lower than typical of scores at lower reach sites elsewhere on the ringplain (TRC, 2015c). The spring 2015 (99 units) and summer 2016 (84 units) scores were significantly different from each other and four units higher (spring) and seven units lower (summer) than the historical median score at this site coincident with patchy spring substrate periphyton cover and more widespread filamentous algae cover in summer. These scores categorised this site has having ‘fair’ health (spring and summer) generically (Table 2). The historical median score (91 units) placed this site in the ‘fair’ category for generic health.
Community composition 3.2.19.4.2Characteristic macroinvertebrate taxa in the communities at this site prior to the 2015-2016 period are listed in Table 93.
Table 93 Characteristic taxa [abundant (A), very abundant (VA), extremely abundant (XA)] recorded in the Kaupokonui River at Upper Glenn Road between 1995 and February 2015 [40 surveys], and by the spring 2015 and summer 2016 surveys
Taxa List MCI score
A VA XA Total %
Survey
Spring 2015
Summer 2016
PLATYHELMINTHES (FLATWORMS) Cura 3 1 1 3
NEMERTEA Nemertea 3 5 1 6 15
ANNELIDA (WORMS) Oligochaeta 1 19 10 5 34 85 A
MOLLUSCA Latia 5 1 1 3
Physa 3 2 2 5
Potamopyrgus 4 6 5 2 13 33 VA
CRUSTACEA Ostracoda 1 1 1 3
Paracalliope 5 1 1 3
188
Taxa List MCI score
A VA XA Total %
Survey
Spring 2015
Summer 2016
EPHEMEROPTERA (MAYFLIES) Austroclima 7 1 1 3
Coloburiscus 7 3 3 8
Deleatidium 8 7 7 7 21 53 VA A
Nesameletus 9 1 1 3
COLEOPTERA (BEETLES) Elmidae 6 8 16 4 28 70
MEGALOPTERA (DOBSONFLIES) Archichauliodes 7 4 1 5 13 A
TRICHOPTERA (CADDISFLIES) Hydropsyche (Aoteapsyche) 4 7 13 5 25 63
Costachorema 7 3 3 8
Hydrobiosis 5 19 4 23 58
Oxyethira 2 7 7 18
Pycnocentrodes 5 11 6 3 20 50 XA VA
DIPTERA (TRUE FLIES) Aphrophila 5 6 1 7 18
Chironomus 1 1 1 3
Maoridiamesa 3 12 9 3 24 60 A
Orthocladiinae 2 17 12 8 37 93 VA
Tanytarsini 3 6 6 15
Ephydridae 4 1 1 3
Muscidae 3 2 2 5 A
Austrosimulium 3 2 2 5
Prior to the current 2015-2016 period, 27 taxa had characterised the community at this site on occasions. These have comprised two ‘highly sensitive’, ten ‘moderately sensitive’, and fifteen ‘tolerant’ taxa i.e. a minority of ‘highly sensitive’ taxa and relatively high proportion of ‘tolerant’ taxa as would be expected in the lower reaches of a ringplain river. Predominant taxa have included one ‘highly sensitive’ taxon [mayfly (Deleatidium)]; two ‘moderately sensitive’ taxa [elmid beetles and caddisfly (Hydrobiosis)]; and four ‘tolerant’ taxa [oligochaete worms, net-building caddisfly (Hydropsyche-Aoteapsyche), and midges (Maoridiamesa and orthoclads)]. The spring 2015 community consisted of four historically characteristic taxa comprising one ‘highly sensitive’, one ‘moderately sensitive’ and two ‘tolerant’ taxa. The summer 2016 community consisted of six historically characteristic taxa comprising one ‘highly sensitive’, two ‘moderately sensitive’ and three ‘tolerant’ taxa. Two of the eight characteristic taxa were shared between surveys (Table 91). The proportional increase in summer dominance by a few of the ’tolerant’ taxa and decrease in abundance of the single ‘highly sensitive’ mayfly taxon in particular were reflected in the significant decrease of 1.1 units in seasonal SQMCIs scores (Table 165 and Table
166). The five taxa recorded as very abundant during spring and/or summer have characterised this site’s communities on 33% to 93% of past survey occasions.
Predicted stream ‘health’ 3.2.19.4.3The Kaupokonui River site at Upper Glenn Road is 25.7 km downstream of the National Park boundary at an altitude of 60 m asl. Relationships for ringplain streams developed between MCI and site altitude and distance from the National Park boundary (Stark and Fowles, 2009), predict MCI values of 91 (altitude) and 95 (distance) for this site. The historical site median (91) is equal with the altitude prediction and four units lower than the predictive distance value. The spring 2015 score (99 units) and the summer 2016 score (94 units) were similar to predictive values.

189
The median value for a ringplain stream arising inside the National Park (TRC, 2015c) was 98 units. The historical, spring and summer scores were not significantly different to the TRC, 2015c value. The REC predicted MCI value (Leathwick, et al. 2009) was 106 units. The historical and summer scores were significantly lower than the REC value but the spring score was not significantly different (Stark, 1998).
Temporal trends in 1995 to 2016 data 3.2.19.4.4A LOWESS trend plot with a moving average (tension 0.4) trendline was produced (Figure 130). A non-parametric statistical trend analysis of the MCI data using the Mann-Kendall test was then performed on 21 years of SEM results (1995-2016) from the site in the Kaupokonui River at Upper Glenn Road. The MCI has been chosen as the preferable indicator of ‘stream/river health’ for SEM trend reporting purposes.
Figure 130 LOWESS trend plot of MCI data in the Kaupokonui River at the Upper Glenn Road site
A significant improvement in MCI scores was found at this site (FDR p<0.05). There has mostly been an increasing trend up until 2012 with one small dip from 2005-2008. However, the trend has in the past four years declined quite sharply. The trendline range of MCI scores (15 units) has been ecologically important but nowhere near as wide as that upstream, also indicative of some decrease in effects in a downstream direction. The overall positive temporal trend was due to improved wastes management further upstream in the catchment but more particularly in relation to a reduction in heat input (via cooling water) to the river at the Fonterra, Kapuni factory. Smoothed MCI scores have consistently indicated ‘fair’ generic river health (Table 2) throughout the period, and more recently some individual scores indicated ‘good’ health although prior to 2003 individual scores varied between ‘fair’ and ‘poor’ health.
N = 42 Kendall tau = +0.245 p level = 0.022 FDR p = 0.039
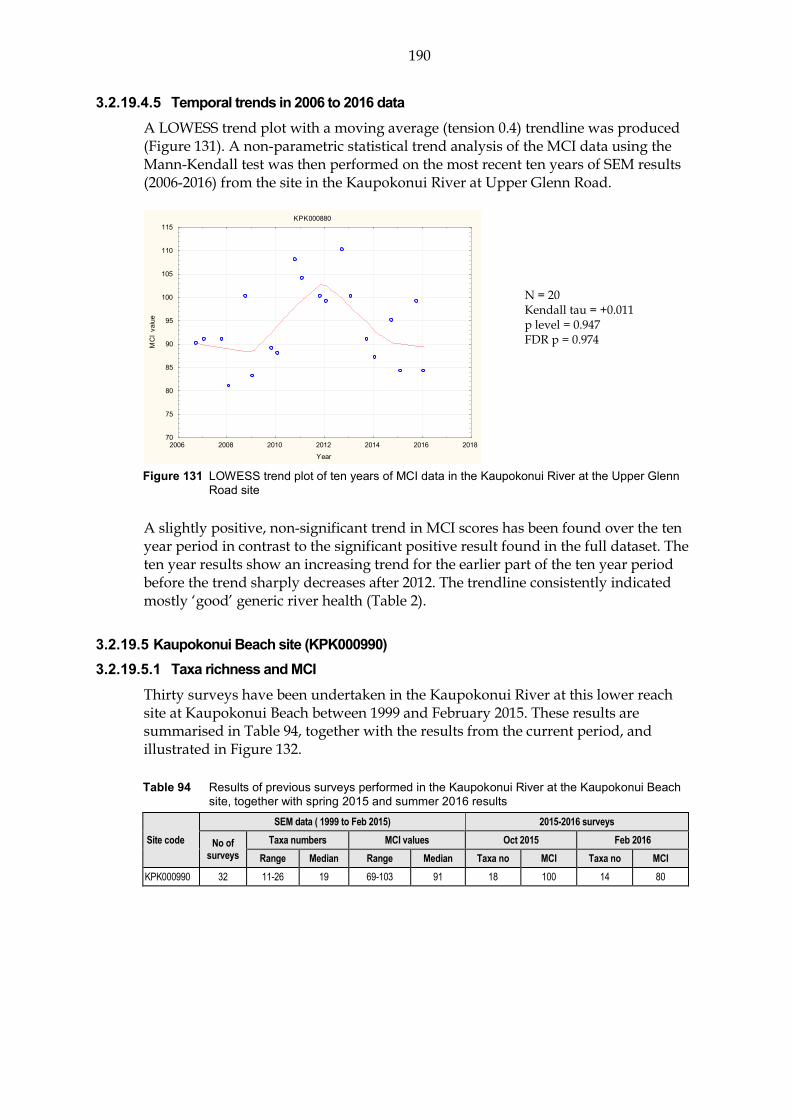
190
Temporal trends in 2006 to 2016 data 3.2.19.4.5A LOWESS trend plot with a moving average (tension 0.4) trendline was produced (Figure 131). A non-parametric statistical trend analysis of the MCI data using the Mann-Kendall test was then performed on the most recent ten years of SEM results (2006-2016) from the site in the Kaupokonui River at Upper Glenn Road.
Figure 131 LOWESS trend plot of ten years of MCI data in the Kaupokonui River at the Upper Glenn
Road site
A slightly positive, non-significant trend in MCI scores has been found over the ten year period in contrast to the significant positive result found in the full dataset. The ten year results show an increasing trend for the earlier part of the ten year period before the trend sharply decreases after 2012. The trendline consistently indicated mostly ‘good’ generic river health (Table 2).
Kaupokonui Beach site (KPK000990) 3.2.19.5 Taxa richness and MCI 3.2.19.5.1
Thirty surveys have been undertaken in the Kaupokonui River at this lower reach site at Kaupokonui Beach between 1999 and February 2015. These results are summarised in Table 94, together with the results from the current period, and illustrated in Figure 132.
Table 94 Results of previous surveys performed in the Kaupokonui River at the Kaupokonui Beach site, together with spring 2015 and summer 2016 results
Site code
SEM data ( 1999 to Feb 2015) 2015-2016 surveys
No of surveys
Taxa numbers MCI values Oct 2015 Feb 2016
Range Median Range Median Taxa no MCI Taxa no MCI
KPK000990 32 11-26 19 69-103 91 18 100 14 80
KPK000880
2006 2008 2010 2012 2014 2016 2018Year
70
75
80
85
90
95
100
105
110
115
MC
I va
lue
N = 20 Kendall tau = +0.011 p level = 0.947 FDR p = 0.974

191
Figure 132 Numbers of taxa and MCI values in the Kaupokonui River at the Kaupokonui Beach site
A wide range of richnesses (11 to 26 taxa) has been found, with a median richness of 19 taxa. During the 2015-2016 period spring (18 taxa) and summer (14 taxa) richnesses were four taxa apart and one to five taxa lower than the historical the median richness. MCI values have had a moderate range (34 units) at this site, typical of sites in the lower reaches of ringplain streams and rivers. The median value (91 units) has been typical of scores at lower reach sites elsewhere on the ringplain (TRC, 2015c). The spring 2015 (100 units) score was nine units higher than the median while the summer 2016 (80 units) score was a significant 20 units lower than the spring score and a significant 11 units below the historic median. However, such a large decrease from spring to summer was typical for the site where historic median differences were a significant 12 units apart (Appendix II). The MCI scores categorised this site as having ‘good’ (spring) and ‘fair’ (summer) health generically (Table 2). The historical median score (91 units) placed this site in the ‘fair’ category for generic health.
Community composition 3.2.19.5.2Characteristic macroinvertebrate taxa in the communities at this site prior to the 2015-2016 period are listed in Table 95.
Table 95 Characteristic taxa [abundant (A), very abundant (VA), extremely abundant (XA)] recorded in the Kaupokonui River at the Kaupokonui Beach site between 1999 and February 2015 [32 surveys], and by the spring 2015 and summer 2016 surveys
Taxa List MCI
score A VA XA Total %
Survey
Spring 2015
Summer 2016
NEMERTEA Nemertea 3 3 1 4 13
ANNELIDA (WORMS) Oligochaeta 1 10 10 10 30 94 A VA
MOLLUSCA Potamopyrgus 4 8 8 1 17 53 VA
EPHEMEROPTERA (MAYFLIES) Austroclima 7 2 2 6
Coloburiscus 7 1 1 3
Deleatidium 8 11 8 3 22 69 VA

192
Taxa List MCI
score A VA XA Total %
Survey
Spring 2015
Summer 2016
COLEOPTERA (BEETLES) Elmidae 6 6 12 18 56
TRICHOPTERA (CADDISFLIES) Hydropsyche (Aoteapsyche) 4 8 8 4 20 63 A
Costachorema 7 3 3 9
Hydrobiosis 5 19 19 59
Pycnocentrodes 5 9 7 5 21 66 XA
DIPTERA (TRUE FLIES) Aphrophila 5 2 2 6
Maoridiamesa 3 7 10 4 21 66 VA
Orthocladiinae 2 7 11 12 30 94 VA
Tanytarsini 3 10 10 31 A VA
Muscidae 3 1 1 3
Prior to the current 2015-2016 period, 16 taxa had characterised the community at this site on occasions. These have comprised one ‘highly sensitive’, seven ‘moderately sensitive’, and eight ‘tolerant’ taxa i.e. a very low proportion of ‘highly sensitive’ taxa and a higher proportion of ‘tolerant’ taxa as would be expected in the lower reaches of a ringplain river. Predominant taxa have included one ‘highly sensitive’ taxon [mayfly (Deleatidium)]; three ‘moderately sensitive’ taxa [elmid beetles, free-living caddisfly (Hydrobiosis), and stony-cased caddisfly (Pycnocentrodes)]; and five ‘tolerant’ taxa [oligochaete worms, snail (Potamopygus), net-building caddisfly (Hydropsyche-Aoteapsyche), and midges (Maoridiamesa and orthoclads)]. The spring 2015 community consisted of five historically characteristic taxa comprising one ‘highly sensitive’, one ‘moderately sensitive’ and three ‘tolerant’ taxa. The summer 2016 community consisted of five historically characteristic taxa comprising ‘tolerant’ taxa. Only two of the eight characteristic taxa were shared between surveys (Table 95). A significant decrease in numerical abundances in two ‘sensitive’ taxa and increases in several ‘tolerant’ taxa abundances were reflected in the large summer decrease of 2.3 units in SQMCIs score (Tables 162 and 163). The five taxa recorded as very or extremely abundant during spring and/or summer have characterised this site’s communities on 50% to 93% of past survey occasions.
Predicted stream ‘health’ 3.2.19.5.3The Kaupokonui River at the Kaupokonui Beach site is 31.1 km downstream of the National Park boundary at an altitude of 5 m asl. Relationships for ringplain streams and rivers developed between MCI and site altitude and distance from the National Park boundary (Stark and Fowles, 2009), predict MCI values of 85 (altitude) and 93 (distance) for this site. The historical site median (91) is six units higher than the altitude and two units below the distance predictive values. The spring 2015 survey score (100 units) was seven to a significant 15 units above the predictive values while the summer score (80 units) was five units lower than the predictive altitude value and a significant 13 units below the distance value. The median value for a ringplain stream arising inside the National Park (TRC, 2015c) was 90 units. The historical, spring and summer scores were not significantly different to the TRC, 2015c value. The REC predicted MCI value (Leathwick, et al. 2009) was 96 units. The historical, spring and summer scores were also not significantly different to the REC value (Stark, 1998).
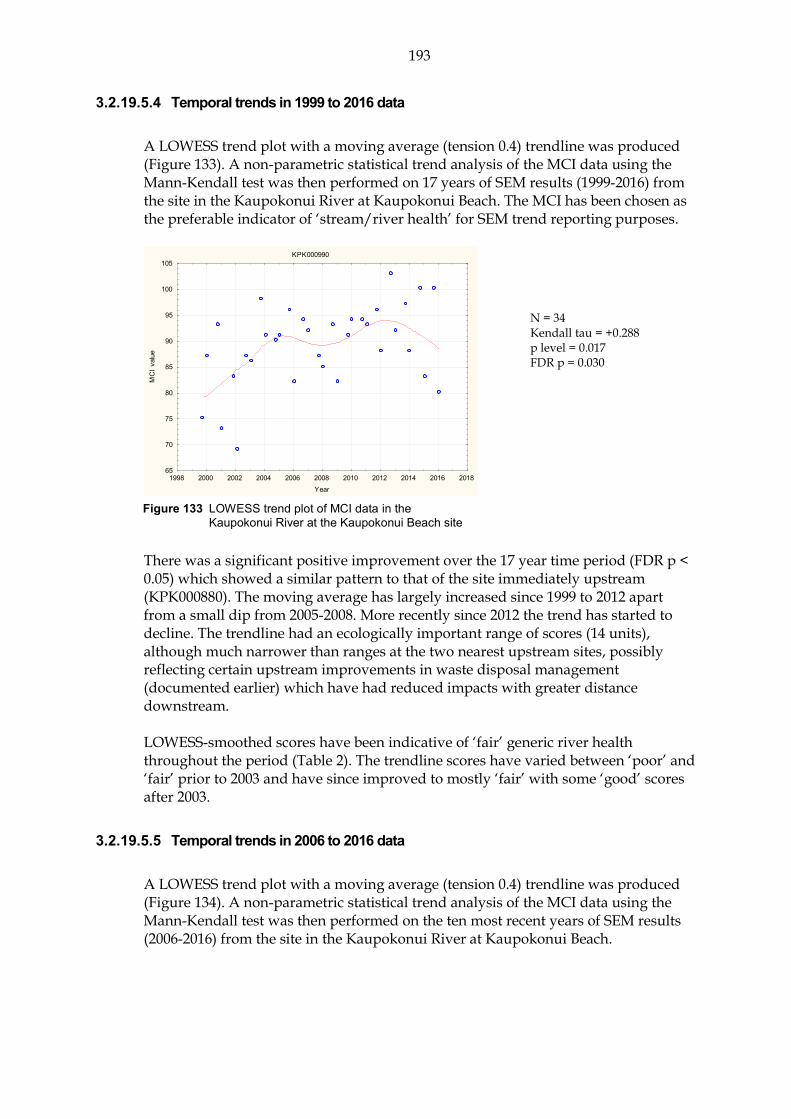
193
Temporal trends in 1999 to 2016 data 3.2.19.5.4 A LOWESS trend plot with a moving average (tension 0.4) trendline was produced (Figure 133). A non-parametric statistical trend analysis of the MCI data using the Mann-Kendall test was then performed on 17 years of SEM results (1999-2016) from the site in the Kaupokonui River at Kaupokonui Beach. The MCI has been chosen as the preferable indicator of ‘stream/river health’ for SEM trend reporting purposes.
Figure 133 LOWESS trend plot of MCI data in the
Kaupokonui River at the Kaupokonui Beach site
There was a significant positive improvement over the 17 year time period (FDR p < 0.05) which showed a similar pattern to that of the site immediately upstream (KPK000880). The moving average has largely increased since 1999 to 2012 apart from a small dip from 2005-2008. More recently since 2012 the trend has started to decline. The trendline had an ecologically important range of scores (14 units), although much narrower than ranges at the two nearest upstream sites, possibly reflecting certain upstream improvements in waste disposal management (documented earlier) which have had reduced impacts with greater distance downstream. LOWESS-smoothed scores have been indicative of ‘fair’ generic river health throughout the period (Table 2). The trendline scores have varied between ‘poor’ and ‘fair’ prior to 2003 and have since improved to mostly ‘fair’ with some ‘good’ scores after 2003.
Temporal trends in 2006 to 2016 data 3.2.19.5.5 A LOWESS trend plot with a moving average (tension 0.4) trendline was produced (Figure 134). A non-parametric statistical trend analysis of the MCI data using the Mann-Kendall test was then performed on the ten most recent years of SEM results (2006-2016) from the site in the Kaupokonui River at Kaupokonui Beach.
KPK000990
1998 2000 2002 2004 2006 2008 2010 2012 2014 2016 2018Year
65
70
75
80
85
90
95
100
105
MC
I va
lue
N = 34 Kendall tau = +0.288 p level = 0.017 FDR p = 0.030

194
Figure 134 LOWESS trend plot of MCI data in the
Kaupokonui River at the Kaupokonui Beach site
A slightly positive, non-significant trend in MCI scores has been found over the ten year period in contrast to the significant positive result found in the full dataset. The ten year results show an increasing trend for the earlier part of the ten year period before the trend decreases after 2013. The trendline consistently indicated mostly ‘fair’ generic river health (Table 2).
Discussion 3.2.19.6Seasonal MCI values typically decreased between spring and summer at all five sites; from the Opunake Rd site (by 1 unit), Kaponga site (by 18 units), Kapuni railbridge site (14 units), the Upper Glen Road site (15 units), to the Kaupokonui Beach site (20 units). These seasonal differences may be compared with historical seasonal median decreases of two, 10, four, five, and six units respectively (Appendix II). Seasonal communities shared 20 of 29 taxa (69%) at the Opunake Road upper mid-reach site, 18 of 35 taxa (51%) at the Kaponga mid-reach site, 17 of 31 taxa (55%) at the Kapuni Railbridge mid-reach site, 14 of 26 taxa (54%) at the Upper Glenn Road lower reach site, and 10 of 22 taxa (45%) at the furthest downstream site (Kaupokonui Beach) in the lower reaches. Seasonal community compositions have generally been more variable with increasing distance downstream from the National Park and this trend was generally apparent during the 2015-2016 monitoring period though seasonal differences in the four lower sites were noticeably more pronounced than that of the upper site. The MCI scores fell in a downstream direction between the upper site and the furthest downstream lower reaches site by 34 units in spring and 53 units in summer, over a river distance of 27.8 km. Community composition varied markedly through the length of the river surveyed. A total of 40 taxa was recorded in spring of which 11 taxa (28%) were present at all five sites. These included one ‘highly sensitive’, eight ‘moderately sensitive’, and two ‘tolerant’ taxa with only the ‘highly sensitive’ mayfly (Deleatidium), abundant at all five sites. A slightly lower number of taxa were found during the summer survey (39 taxa) of which there were seven shared taxa (18%). These were similar to the 11 widespread taxa in spring though notably the mayfly Deleatidium was entirely absent from the bottom site during summer but still abundant at the four upstream sites. No taxa were abundant at all five sites. These dissimilarities in spatial community
KPK000990
2006 2008 2010 2012 2014 2016 2018Year
70
75
80
85
90
95
100
105
MC
I va
lue
N = 20 Kendall tau = +0.102 p level = 0.523 FDR p = 0.742

195
structure along the length of the Kaupokonui River were more pronounced in summer than in spring. Time trend analysis showed the majority of sites had significant positive trends over the full dataset indicating that macroinvertebrate communities have been getting healthier over time. However, there were no significant trends over the most recent ten year periods with all sites except the most upstream site showing a decreasing trendline from 2012-2013 onwards indicating that improvements in macroinvertebrate communities have plateaued and suggesting that they actually may be getting worse.
Katikara Stream 3.2.20Two sites in the Katikara Stream, one located near the headwaters (just inside the National Park) and the other near the coast, were first included in the SEM programme in the 2000-2001 year, for the purpose of long term monitoring of the progressive impacts of riparian vegetation planting initiatives within this north-western Taranaki catchment. In the 2008-2009 period severe headwater erosion events impacted upon the macroinvertebrate communities of the upper reaches of this stream (TRC, 2009). The results found in the 2015-2016 surveys are presented in Table 167 and Table 168, Appendix I.
Carrington Road site (KTK000150) 3.2.20.1 Taxa richness and MCI 3.2.20.1.1
Thirty-two surveys have been undertaken at this upper reach site in the Katikara Stream inside the National park boundary at Carrington Road between September 1999 and February 2015. These results are summarised in Table 96, together with the results from the current period, and illustrated in Figure 135.
Table 96 Results of previous surveys performed in the Katikara Stream at Carrington Road, together with spring 2015 and summer 2016 results
Site code
SEM data ( 1995 to February 2015) 2015-2016 surveys
No of surveys
Taxa numbers MCI values Oct 2015 Mar 2016
Range Median Range Median Taxa no MCI Taxa no MCI
KTK000150 30 11-38 29 112-148 136 17 129 20 124

196
Figure 135 Numbers of taxa and MCI values in the Katikara Stream at Carrington Road
A very wide range of richnesses (11 to 38 taxa) has been found; wider than might be expected, due to the impacts of significant headwater erosion over the 2008-2009 period and subsequent recovery from these effects. The median richness of 29 taxa has been far more representative of typical richnesses in ringplain streams and rivers near the National Park boundary (TRC, 2015c), although median richness since the 2008-2009 erosion event has been 20 taxa (Figure 135). During the 2015-2016 period spring (17 taxa) and summer (20 taxa) richnesses were well below the long term median richness indicative of a continuing post-headwater erosion recovery phase and/or long term degradation of the physical habitat (Figure 135). MCI values at this site have had a wider range (36 units) than typical of a National Park boundary site, due in part to atypically lower values for a short period and on other isolated occasions since the 2008-2009 headwater erosion event. The median value (136 units) has been typical of upper reach sites (near or within the National Park) elsewhere on the ringplain (TRC, 2015c). The spring 2015 (129 units) score was not significantly different to the historical median (136 units). The summer score (124 units) was significantly lower than the historical median, coincident with higher levels of both algal mats and filamentous algae on the substrate. These scores categorised this site as having ‘very good’ (spring and summer) health generically (Table 2) although taxa numbers in general continued to be slightly lower than typical pre-erosion richnesses. The historical median score (136 units) placed this site in the ‘very good’ category for the generic health.
Community composition 3.2.20.1.2Characteristic macroinvertebrate taxa in the communities at this site prior to the 2015-2016 period are listed in Table 97.
0
10
20
30
40
50
60
70
80
0
20
40
60
80
100
120
140
160
No.
of t
axa
MC
I val
ue
SEM: Number of taxa and MCI values in the Katikara Stream at Carrington Road (KTK000150)
MCI value Median MCI to dateNo. of taxa Median no. of taxa to date
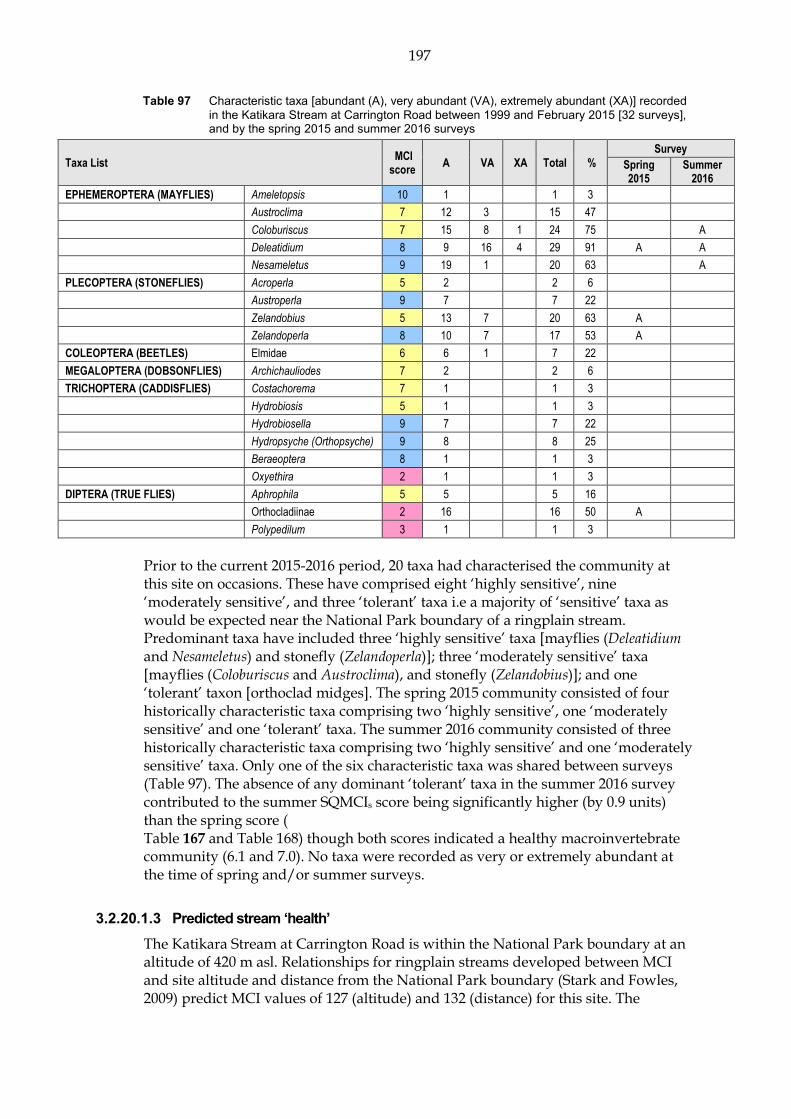
197
Table 97 Characteristic taxa [abundant (A), very abundant (VA), extremely abundant (XA)] recorded in the Katikara Stream at Carrington Road between 1999 and February 2015 [32 surveys], and by the spring 2015 and summer 2016 surveys
Taxa List MCI score
A VA XA Total %
Survey
Spring 2015
Summer 2016
EPHEMEROPTERA (MAYFLIES) Ameletopsis 10 1 1 3
Austroclima 7 12 3 15 47
Coloburiscus 7 15 8 1 24 75 A
Deleatidium 8 9 16 4 29 91 A A
Nesameletus 9 19 1 20 63 A
PLECOPTERA (STONEFLIES) Acroperla 5 2 2 6
Austroperla 9 7 7 22
Zelandobius 5 13 7 20 63 A
Zelandoperla 8 10 7 17 53 A
COLEOPTERA (BEETLES) Elmidae 6 6 1 7 22
MEGALOPTERA (DOBSONFLIES) Archichauliodes 7 2 2 6
TRICHOPTERA (CADDISFLIES) Costachorema 7 1 1 3
Hydrobiosis 5 1 1 3
Hydrobiosella 9 7 7 22
Hydropsyche (Orthopsyche) 9 8 8 25
Beraeoptera 8 1 1 3
Oxyethira 2 1 1 3
DIPTERA (TRUE FLIES) Aphrophila 5 5 5 16
Orthocladiinae 2 16 16 50 A
Polypedilum 3 1 1 3
Prior to the current 2015-2016 period, 20 taxa had characterised the community at this site on occasions. These have comprised eight ‘highly sensitive’, nine ‘moderately sensitive’, and three ‘tolerant’ taxa i.e a majority of ‘sensitive’ taxa as would be expected near the National Park boundary of a ringplain stream. Predominant taxa have included three ‘highly sensitive’ taxa [mayflies (Deleatidium and Nesameletus) and stonefly (Zelandoperla)]; three ‘moderately sensitive’ taxa [mayflies (Coloburiscus and Austroclima), and stonefly (Zelandobius)]; and one ‘tolerant’ taxon [orthoclad midges]. The spring 2015 community consisted of four historically characteristic taxa comprising two ‘highly sensitive’, one ‘moderately sensitive’ and one ‘tolerant’ taxa. The summer 2016 community consisted of three historically characteristic taxa comprising two ‘highly sensitive’ and one ‘moderately sensitive’ taxa. Only one of the six characteristic taxa was shared between surveys (Table 97). The absence of any dominant ‘tolerant’ taxa in the summer 2016 survey contributed to the summer SQMCIs score being significantly higher (by 0.9 units) than the spring score ( Table 167 and Table 168) though both scores indicated a healthy macroinvertebrate community (6.1 and 7.0). No taxa were recorded as very or extremely abundant at the time of spring and/or summer surveys.
Predicted stream ‘health’ 3.2.20.1.3The Katikara Stream at Carrington Road is within the National Park boundary at an altitude of 420 m asl. Relationships for ringplain streams developed between MCI and site altitude and distance from the National Park boundary (Stark and Fowles, 2009) predict MCI values of 127 (altitude) and 132 (distance) for this site. The
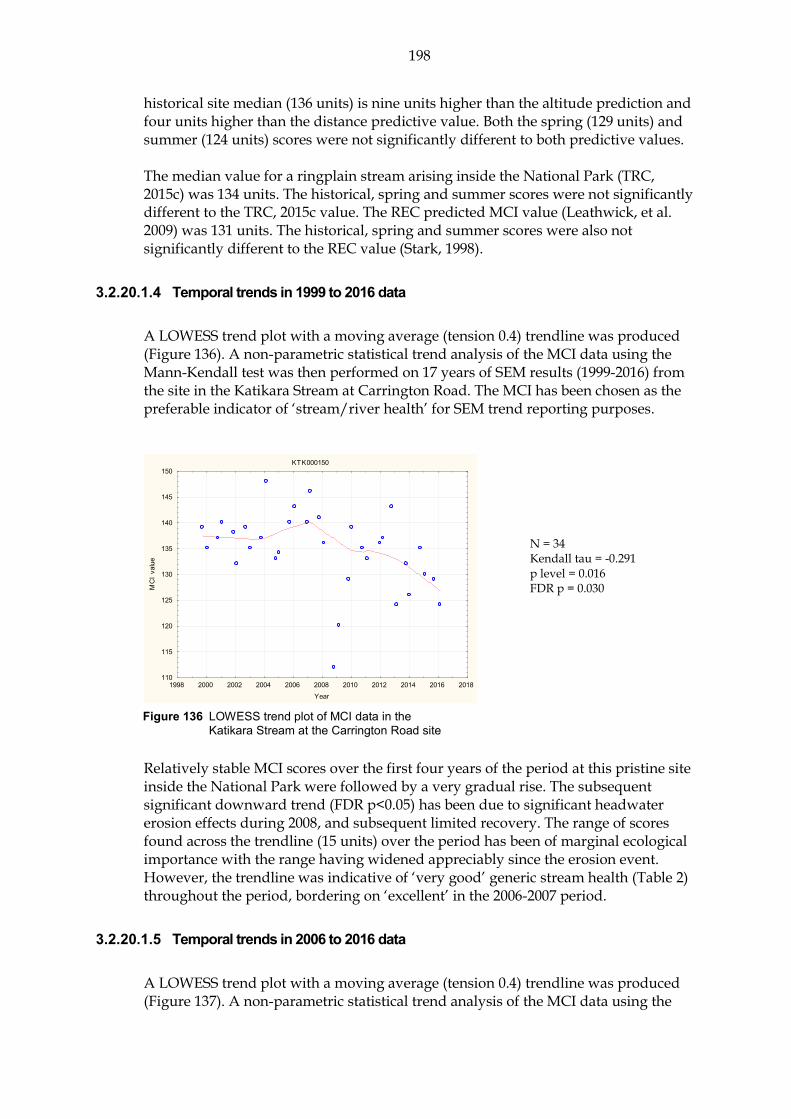
198
historical site median (136 units) is nine units higher than the altitude prediction and four units higher than the distance predictive value. Both the spring (129 units) and summer (124 units) scores were not significantly different to both predictive values. The median value for a ringplain stream arising inside the National Park (TRC, 2015c) was 134 units. The historical, spring and summer scores were not significantly different to the TRC, 2015c value. The REC predicted MCI value (Leathwick, et al. 2009) was 131 units. The historical, spring and summer scores were also not significantly different to the REC value (Stark, 1998).
Temporal trends in 1999 to 2016 data 3.2.20.1.4 A LOWESS trend plot with a moving average (tension 0.4) trendline was produced (Figure 136). A non-parametric statistical trend analysis of the MCI data using the Mann-Kendall test was then performed on 17 years of SEM results (1999-2016) from the site in the Katikara Stream at Carrington Road. The MCI has been chosen as the preferable indicator of ‘stream/river health’ for SEM trend reporting purposes.
Figure 136 LOWESS trend plot of MCI data in the
Katikara Stream at the Carrington Road site
Relatively stable MCI scores over the first four years of the period at this pristine site inside the National Park were followed by a very gradual rise. The subsequent significant downward trend (FDR p<0.05) has been due to significant headwater erosion effects during 2008, and subsequent limited recovery. The range of scores found across the trendline (15 units) over the period has been of marginal ecological importance with the range having widened appreciably since the erosion event. However, the trendline was indicative of ‘very good’ generic stream health (Table 2) throughout the period, bordering on ‘excellent’ in the 2006-2007 period.
Temporal trends in 2006 to 2016 data 3.2.20.1.5 A LOWESS trend plot with a moving average (tension 0.4) trendline was produced (Figure 137). A non-parametric statistical trend analysis of the MCI data using the
KTK000150
1998 2000 2002 2004 2006 2008 2010 2012 2014 2016 2018Year
110
115
120
125
130
135
140
145
150
MC
I va
lue
N = 34 Kendall tau = -0.291 p level = 0.016 FDR p = 0.030

199
Mann-Kendall test was then performed on the most recent ten years of SEM results (2006-2016) from the site in the Katikara Stream at Carrington Road.
Figure 137 LOWESS trend plot of ten years of MCI data
in the Katikara Stream at the Carrington Road site
A negative non-significant trend in MCI scores has been found over the ten year period in contrast to the significant negative result found in the full dataset. The ten year dataset trendline shows a sharp decline from 2006 to 2010 but then has little trend after that date which is slightly at odds with the full dataset as the significant negative decline found in the full dataset was fully encompassed in the ten year dataset. The trendline consistently indicated mostly ‘very good’ generic river health (Table 2).
Coastal site (KTK000248) 3.2.20.2 Taxa richness and MCI 3.2.20.2.1
Thirty surveys have been undertaken in the Katikara Stream at this lower reach site near the coast between October 2000 and February 2015. The exact position of the site has been shifted slightly upstream from the summer 2016 survey onwards to avoid being flooded when the stream outlet blocks during low summer flows. The results of the thirty surveys are summarised in Table 98, together with the results from the current period, and illustrated in Figure 138.
Table 98 Results of previous surveys performed in the Katikara Stream near the coast together with spring 2015 and summer 2016
Site code
SEM data ( 1995 to Feb 2015) 2015-2016 surveys
No of surveys
Taxa numbers MCI values Oct 2015 Mar 2016
Range Median Range Median Taxa no MCI Taxa no MCI
KTK000248 30 20-31 26 87-118 102 27 100 21 94
KTK000150
2006 2008 2010 2012 2014 2016 2018Year
110
115
120
125
130
135
140
145
150
MC
I va
lue
N = 20 Kendall tau = - 0.298 p level = 0.066 FDR p = 0.242
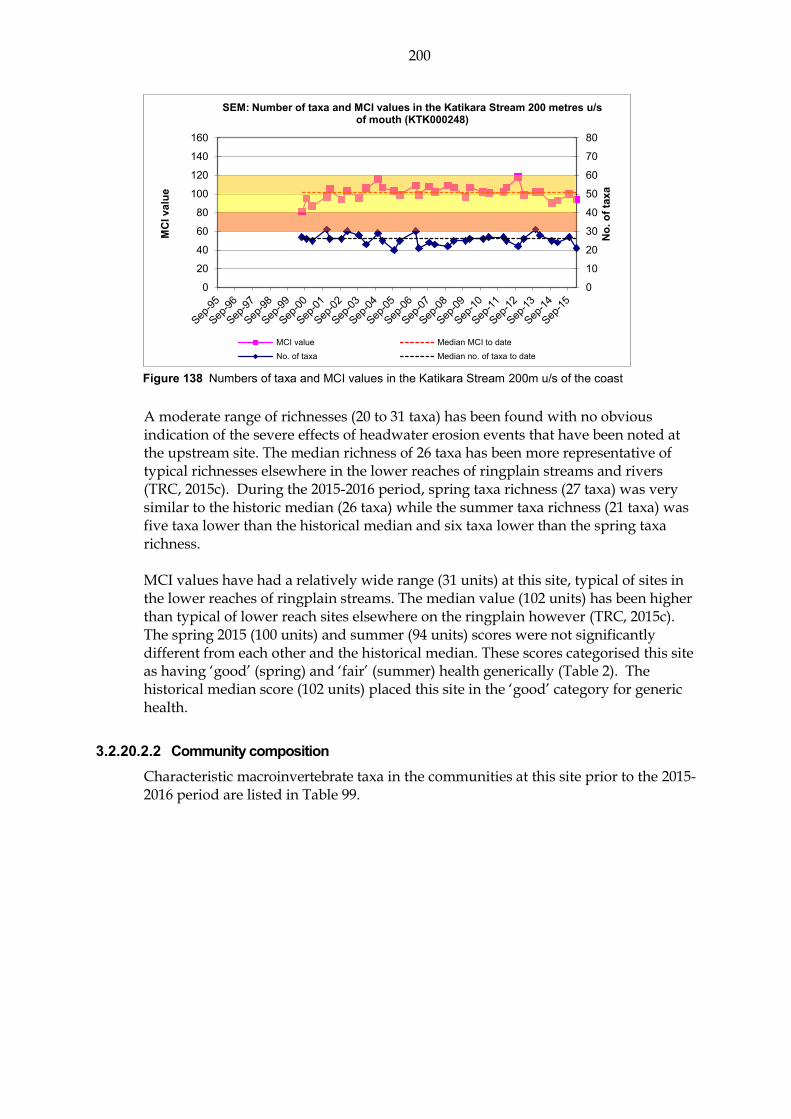
200
Figure 138 Numbers of taxa and MCI values in the Katikara Stream 200m u/s of the coast
A moderate range of richnesses (20 to 31 taxa) has been found with no obvious indication of the severe effects of headwater erosion events that have been noted at the upstream site. The median richness of 26 taxa has been more representative of typical richnesses elsewhere in the lower reaches of ringplain streams and rivers (TRC, 2015c). During the 2015-2016 period, spring taxa richness (27 taxa) was very similar to the historic median (26 taxa) while the summer taxa richness (21 taxa) was five taxa lower than the historical median and six taxa lower than the spring taxa richness. MCI values have had a relatively wide range (31 units) at this site, typical of sites in the lower reaches of ringplain streams. The median value (102 units) has been higher than typical of lower reach sites elsewhere on the ringplain however (TRC, 2015c). The spring 2015 (100 units) and summer (94 units) scores were not significantly different from each other and the historical median. These scores categorised this site as having ‘good’ (spring) and ‘fair’ (summer) health generically (Table 2). The historical median score (102 units) placed this site in the ‘good’ category for generic health.
Community composition 3.2.20.2.2Characteristic macroinvertebrate taxa in the communities at this site prior to the 2015-2016 period are listed in Table 99.
0
10
20
30
40
50
60
70
80
0
20
40
60
80
100
120
140
160
No.
of t
axa
MC
I val
ue
SEM: Number of taxa and MCI values in the Katikara Stream 200 metres u/s of mouth (KTK000248)
MCI value Median MCI to dateNo. of taxa Median no. of taxa to date

201
Table 99 Characteristic taxa [abundant (A), very abundant (VA), extremely abundant (XA)] recorded in the Katikara Stream near the mouth between October 2000 and February 2015 [30 surveys], and by the spring 2015 and summer 2016 surveys
Taxa List MCI
score A VA XA Total %
Survey
Spring 2015
Summer 2016
NEMERTEA Nemertea 3 4 4 13
ANNELIDA (WORMS) Oligochaeta 1 10 10 1 21 68 A VA
MOLLUSCA Latia 5 2 2 6
Potamopyrgus 4 6 9 12 27 87 A A
CRUSTACEA Paratya 3 2 2 6
EPHEMEROPTERA (MAYFLIES) Austroclima 7 15 2 17 55
Coloburiscus 7 9 4 13 42 A
Deleatidium 8 9 8 3 20 65 VA
Rallidens 9 1 1 3
PLECOPTERA (STONEFLIES) Zelandobius 5 2 2 6 A
Zelandoperla 8 1 1 3
COLEOPTERA (BEETLES) Elmidae 6 6 14 7 27 87 A
Ptilodactylidae 8 1 1 2 6
MEGALOPTERA (DOBSONFLIES) Archichauliodes 7 17 1 18 58
TRICHOPTERA (CADDISFLIES) Hydropsyche (Aoteapsyche) 4 6 15 7 28 90 A VA
Costachorema 7 7 7 23
Hydrobiosis 5 20 1 21 68
Pycnocentrodes 5 7 10 9 26 84 A
DIPTERA (TRUE FLIES) Aphrophila 5 17 3 20 65 A VA
Maoridiamesa 3 7 3 10 32 VA
Orthocladiinae 2 13 10 1 24 77 A A
Tanytarsini 3 4 4 13 A
Austrosimulium 3 9 1 10 32
Prior to the current 2015-2016 period, 23 taxa had characterised the community at this site on occasions. These have comprised four ‘highly sensitive’, ten ‘moderately sensitive’, and nine ‘tolerant’ taxa i.e. a minority of ‘highly sensitive’ taxa and an increased proportion of ‘tolerant’ taxa as would be expected in the lower reaches of a ringplain stream. Predominant taxa have included one ‘highly sensitive’ taxon [mayfly (Deleatidium)]; six ‘moderately sensitive’ taxa [mayfly (Austroclima), elmid beetles, dobsonfly (Archichauliodes), free-living caddisfly (Hydrobiosis), stony-cased caddisfly (Pycnocentrodes), and cranefly (Aphrophila)]; and four ‘tolerant’ taxa [oligochaete worms, snail (Potamopyrgus), net-building caddisfly (Hydropsyche-Aoteapsyche), and orthoclad midges]. The spring 2015 community consisted of ten historically characteristic taxa comprising one ‘highly sensitive’, four ‘moderately sensitive’ and five ‘tolerant’ taxa. The summer 2016 community consisted of seven historically characteristic taxa comprising two ‘moderately sensitive’ and five ‘tolerant’ taxa. Five of the 12 characteristic taxa were shared between surveys (Table
99). The numerical reduction of the only spring ‘highly sensitive’ characteristic taxon (mayfly Deleatidium) in the summer 2016 survey contributed to the summer SQMCIs score being significantly lower (by 1.2 units) than the spring score ( Table 167 and Table 168). All taxa recorded as very or extremely abundant during spring and/or summer had characterised this site’s communities on 32% to 90% of past survey occasions.
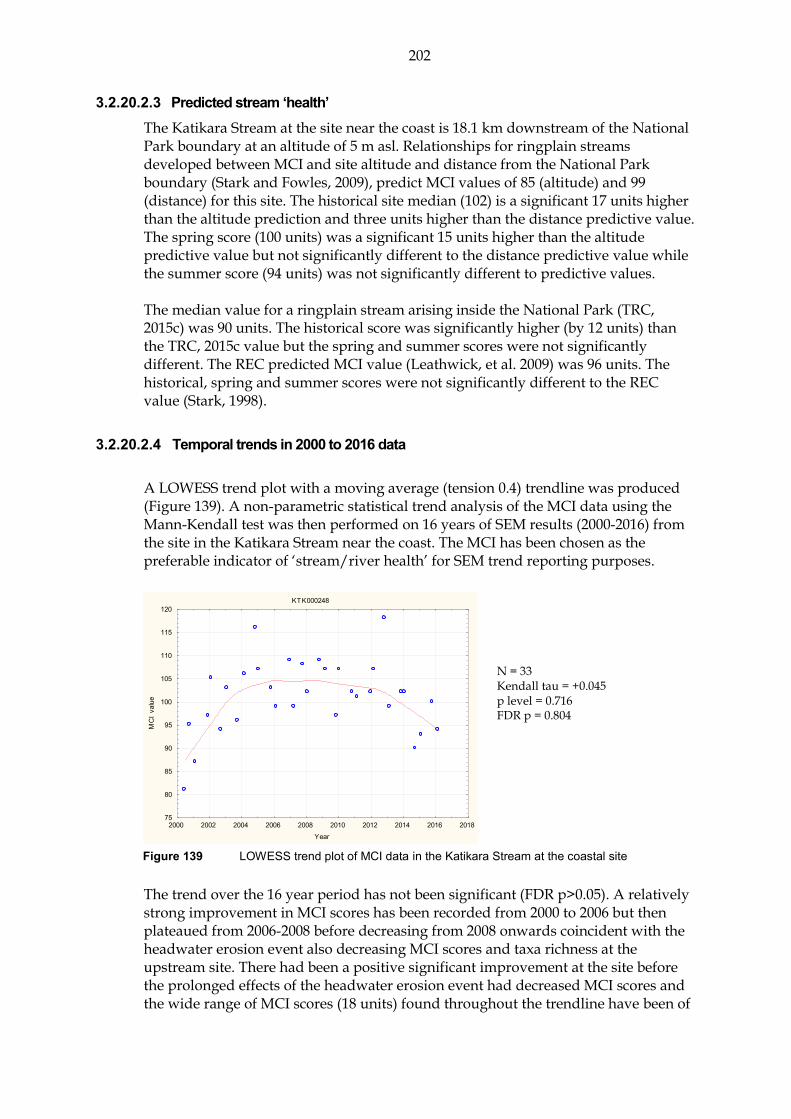
202
Predicted stream ‘health’ 3.2.20.2.3The Katikara Stream at the site near the coast is 18.1 km downstream of the National Park boundary at an altitude of 5 m asl. Relationships for ringplain streams developed between MCI and site altitude and distance from the National Park boundary (Stark and Fowles, 2009), predict MCI values of 85 (altitude) and 99 (distance) for this site. The historical site median (102) is a significant 17 units higher than the altitude prediction and three units higher than the distance predictive value. The spring score (100 units) was a significant 15 units higher than the altitude predictive value but not significantly different to the distance predictive value while the summer score (94 units) was not significantly different to predictive values. The median value for a ringplain stream arising inside the National Park (TRC, 2015c) was 90 units. The historical score was significantly higher (by 12 units) than the TRC, 2015c value but the spring and summer scores were not significantly different. The REC predicted MCI value (Leathwick, et al. 2009) was 96 units. The historical, spring and summer scores were not significantly different to the REC value (Stark, 1998).
Temporal trends in 2000 to 2016 data 3.2.20.2.4 A LOWESS trend plot with a moving average (tension 0.4) trendline was produced (Figure 139). A non-parametric statistical trend analysis of the MCI data using the Mann-Kendall test was then performed on 16 years of SEM results (2000-2016) from the site in the Katikara Stream near the coast. The MCI has been chosen as the preferable indicator of ‘stream/river health’ for SEM trend reporting purposes.
Figure 139 LOWESS trend plot of MCI data in the Katikara Stream at the coastal site
The trend over the 16 year period has not been significant (FDR p>0.05). A relatively strong improvement in MCI scores has been recorded from 2000 to 2006 but then plateaued from 2006-2008 before decreasing from 2008 onwards coincident with the headwater erosion event also decreasing MCI scores and taxa richness at the upstream site. There had been a positive significant improvement at the site before the prolonged effects of the headwater erosion event had decreased MCI scores and the wide range of MCI scores (18 units) found throughout the trendline have been of
KTK000248
2000 2002 2004 2006 2008 2010 2012 2014 2016 2018Year
75
80
85
90
95
100
105
110
115
120
MC
I va
lue
N = 33 Kendall tau = +0.045 p level = 0.716 FDR p = 0.804

203
ecological importance coincidentally with retirement and riparian planting of the margins of the lower reaches of this stream. The trendline range of scores indicative of ‘fair’ generic stream health (Table 2) have improved to ‘good’ health after 2003 where they remained until a return to ‘fair’ health most recently.
Temporal trends in 2006 to 2016 data 3.2.20.2.5
A LOWESS trend plot with a moving average (tension 0.4) trendline was produced (Figure 140). A non-parametric statistical trend analysis of the MCI data using the Mann-Kendall test was then performed on the ten most recent years of SEM results (2006-2016) from the site in the Katikara Stream near the coast.
Figure 140 LOWESS trend plot of ten years of MCI data in the Katikara Stream at the coastal site
A negative non-significant trend in MCI scores after FDR adjustment has been found over the ten year period in contrast with the positive, but non-significant trend found with the full dataset. The ten year dataset trendline shows a gradual decline throughout the dataset with the trend significant before FDR adjustment whereas the full dataset showed a large improvement before the erosion event negatively affected the macroinvertebrate community. The trendline went from indicating ‘very good’ health to ‘good’ health from 2014 onwards (Table 2).
Discussion 3.2.20.3Seasonal MCI values decreased at both sites between spring and summer by a non-significant amount (five and six units respectively). Seasonal median scores (Appendix II) have remained very similar at the National Park site (within two units) and identical at the coastal site. Seasonal communities at the upper site shared ten of the 27 total taxa (37%) compared with 17 of 31 taxa (55%) at the lower site near the coast; an atypically less pronounced seasonal change in community composition at the downstream site as compared with the upstream site. The two sites shared 11 of the 33 taxa (33%) in total found in spring and only six of 34 taxa (18%) in summer, indicative of substantial change in spatial community structures between spring and summer though this was not coincident with recorded periphyton substrate at the lower site which had the same general levels of periphyton recorded for both surveys.
KTK000248
2006 2008 2010 2012 2014 2016 2018Year
85
90
95
100
105
110
115
120
MC
I va
lue
N = 20 Kendall tau = -0.389 p level = 0.016 FDR p = 0.122

204
MCI scores fell in a downstream direction in spring (by 29 units) and by a very similar amount in summer (by 30 units) over a stream distance of 18.1 km downstream from the National Park boundary which was typical for Taranaki ringplain streams. Recent declines in MCI scores at both sites was due to a natural headwater erosion event in 2008 inside the National Park boundary and both sites still appear to be recovering from the natural event.
Kapoaiaia Stream 3.2.21Three established sites in the Kapoaiaia Stream, located at Wiremu Road (in open farmland nearly 6 km below the National Park boundary), Wataroa Road bridge (nearly 8 km further downstream), and about 0.8 km from the coast (in open farmland about 8 km further downstream, i.e. 25 km below the National Park boundary), were included in the SEM programme commencing in the 2000-2001 year. This stream was selected for the purpose of monitoring a western Taranaki ringplain catchment with minimal existing riparian vegetation cover. Biological sampling had been undertaken previously in this catchment as a component of the Taranaki ringplain survey (TCC, 1984) and on various occasions in relation to the Pungarehu Dairy Factory (closed since 1995). The results of the spring 2015 and summer 2016 surveys are presented in Table 169 and Table 170, Appendix I.
Wiremu Road site (KPA000250) 3.2.21.1 Taxa richness and MCI 3.2.21.1.1
Thirty-two surveys have been undertaken in the Kapoaiaia Stream between March 1998 and February 2015 at this open, upper mid-reach site in farmland, 5.7 km downstream of the National Park. These results are summarised in Table 100 together with the results from the current period, and illustrated in Figure 141.
Table 100 Results of previous surveys performed in the Kapoaiaia Stream at Wiremu Road together with the spring 2015 and summer 2016 results
Site code
SEM data ( 1995 to Feb 2015) 2015-2016 surveys
No of surveys
Taxa numbers MCI values Oct 2015 Mar 2016
Range Median Range Median Taxa no MCI Taxa no MCI
KPA000250 32 19-31 25 83-130 113 24 121 24 131

205
Figure 141 Numbers of taxa MCI values in the Kapoaiaia Stream at Wiremu Road
A moderate range of richnesses (19 to 31 taxa) has been found with a median richness of 25 taxa (more typical of richnesses in the mid-reaches of ringplain streams and rivers). During the 2015-2016 period, spring (24 taxa) and summer (24 taxa) richnesses were the same and within one taxon of this median richness. MCI values have had a wide range (47 units) at this site, wider than typical of a site in the upper mid-reaches of a ringplain stream although this site is in a reach of very open farmland, nearly 6km downstream from the National Park boundary. The spring 2015 (121 units) score was a non-significant eight units higher than the historic median but the summer 2016 (131 units) score was a significant 18 units higher (Stark, 1998) than the historical median and the highest recorded MCI score at the site to date. These scores categorised this site as having ‘very good’ generic health (Table 2) in both spring and summer. The historical median score (113 units) placed this site in the ‘good’ generic health.
Community composition 3.2.21.1.2Characteristic macroinvertebrate taxa in the communities at this site prior to the 2015-2016 period are listed in Table 101.
Table 101 Characteristic taxa [abundant (A), very abundant (VA), extremely abundant (XA)] recorded in the Kapoaiaia Stream at Wiremu Road between 1995 and February 2015 [32 surveys], and by the spring 2015 and summer 2016 surveys
Taxa List MCI score
A VA XA Total
%
Survey
Spring 2015
Summer 2016
ANNELIDA (WORMS) Oligochaeta 1 5 3 4 12 38
MOLLUSCA Potamopyrgus 4 3 3 9
CRUSTACEA Paracalliope 5 1 1 3
EPHEMEROPTERA (MAYFLIES) Austroclima 7 6 1 7 22
Coloburiscus 7 6 15 1 22 69 VA A
Deleatidium 8 4 6 14 24 75 XA XA
Nesameletus 9 8 3 11 34 A
PLECOPTERA (STONEFLIES) Acroperla 5 5 1 6 19
Zelandoperla 8 9 3 12 38 VA

206
Taxa List MCI score
A VA XA Total
%
Survey
Spring 2015
Summer 2016
COLEOPTERA (BEETLES) Elmidae 6 15 12 3 30 94 A
Hydraenidae 8 1 1 3
MEGALOPTERA (DOBSONFLIES) Archichauliodes 7 6 6 19
TRICHOPTERA (CADDISFLIES) Hydropsyche (Aoteapsyche) 4 15 6 5 26 81 A
Costachorema 7 16 1 17 53
Hydrobiosis 5 9 1 10 31
Beraeoptera 8 1 3 3 7 22 A
Helicopsyche 10 2 2 6
Olinga 9 1 1 3
Oxyethira 2 4 4 13
Pycnocentrodes 5 4 3 2 9 28 A A
DIPTERA (TRUE FLIES) Aphrophila 5 20 3 23 72
Eriopterini 5 1 1 3
Maoridiamesa 3 9 7 6 22 69
Orthocladiinae 2 9 8 7 24 75 A
Tanytarsini 3 2 2 6
Muscidae 3 3 3 9
Austrosimulium 3 4 1 5 16
Prior to the current 2015-2016 period, a high number of taxa (25) had characterised the community at this site on occasions. These have comprised five ‘highly sensitive’, eleven ‘moderately sensitive’, and nine ‘tolerant’ taxa i.e. a predominance of ‘sensitive’ taxa as would be expected in the upper mid-reaches of a ringplain stream but also a relatively higher number of ‘tolerant’ taxa for a site within 6km of the National Park boundary. Predominant taxa have included one ‘highly sensitive’ taxon [mayfly (Deleatidium)]; four ‘moderately sensitive’ taxa [mayfly (Coloburiscus), elmid beetles, free-living caddisfly (Costachorema), and cranefly (Aphrophila)]; and three ‘tolerant’ taxa [net-building caddisfly (Hydropsyche-Aoteapsyche) and midges (orthoclads and Maoridiamesa)]. The spring 2015 community consisted of five historically characteristic taxa comprising three ‘highly sensitive’ and two ‘moderately sensitive’ taxa. The summer 2016 community consisted of seven historically characteristic taxa comprising two ‘highly sensitive’, three ‘moderately sensitive’ and two ‘tolerant’ taxa. Three of the nine characteristic taxa were shared between surveys (Table 101). Despite the differences between the seasonally most dominant taxa compositions there was minimal change in SQMCIs scores (0.3 unit) between spring and summer (Table 169 and Table 170). Taxa recorded as very or extremely abundant during spring and/or summer had characterised this site’s communities on 38% to 75% of the past surveys.
Predicted stream ‘health’ 3.2.21.1.3The Kapoaiaia Stream site at Wiremu Road is 5.7 km downstream of the National Park boundary at an altitude of 240 m asl. Relationships for ringplain streams developed between MCI and site altitude and distance from the National Park boundary (Stark and Fowles, 2009), predict MCI values of 109 (altitude) and 112 (distance) for this site. The historical site median (113 units) is four units above the altitude prediction and one unit higher than the distance predictive values. The spring 2015 survey score (121 units) was significantly (Stark, 1998) higher (by 12 units) than the altitude value but not significantly different to the distance value. The
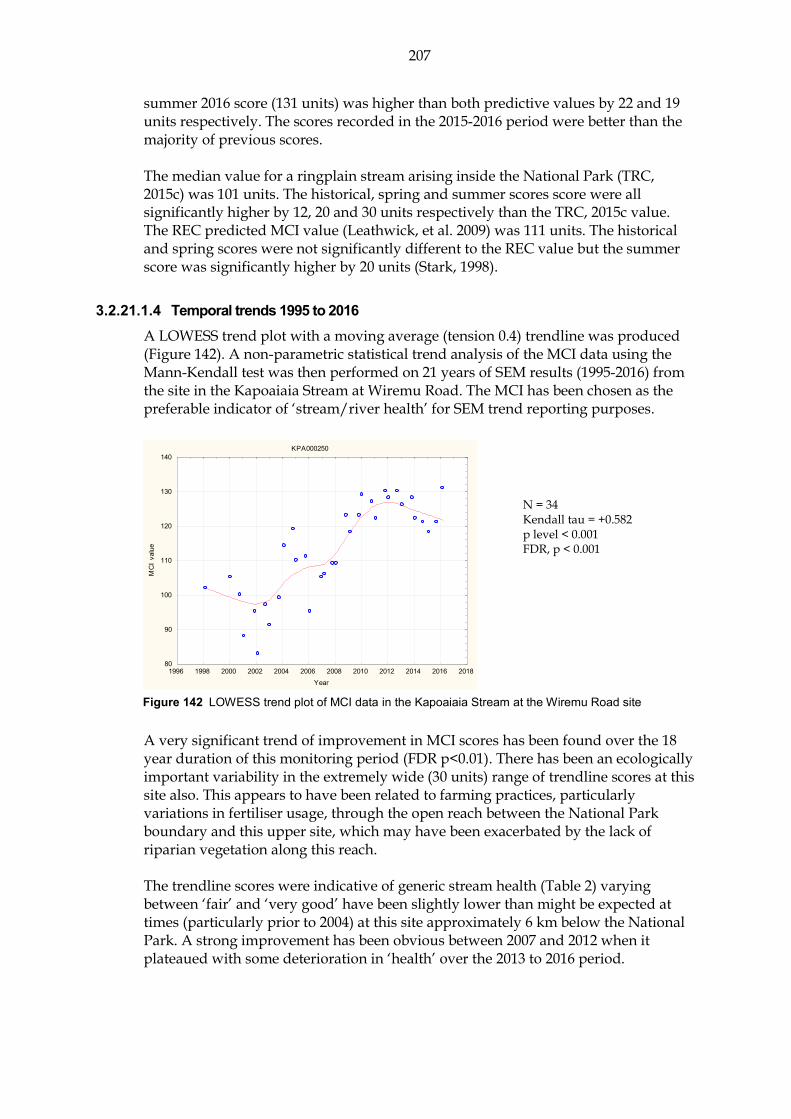
207
summer 2016 score (131 units) was higher than both predictive values by 22 and 19 units respectively. The scores recorded in the 2015-2016 period were better than the majority of previous scores. The median value for a ringplain stream arising inside the National Park (TRC, 2015c) was 101 units. The historical, spring and summer scores score were all significantly higher by 12, 20 and 30 units respectively than the TRC, 2015c value. The REC predicted MCI value (Leathwick, et al. 2009) was 111 units. The historical and spring scores were not significantly different to the REC value but the summer score was significantly higher by 20 units (Stark, 1998).
Temporal trends 1995 to 2016 3.2.21.1.4A LOWESS trend plot with a moving average (tension 0.4) trendline was produced (Figure 142). A non-parametric statistical trend analysis of the MCI data using the Mann-Kendall test was then performed on 21 years of SEM results (1995-2016) from the site in the Kapoaiaia Stream at Wiremu Road. The MCI has been chosen as the preferable indicator of ‘stream/river health’ for SEM trend reporting purposes.
Figure 142 LOWESS trend plot of MCI data in the Kapoaiaia Stream at the Wiremu Road site
A very significant trend of improvement in MCI scores has been found over the 18 year duration of this monitoring period (FDR p<0.01). There has been an ecologically important variability in the extremely wide (30 units) range of trendline scores at this site also. This appears to have been related to farming practices, particularly variations in fertiliser usage, through the open reach between the National Park boundary and this upper site, which may have been exacerbated by the lack of riparian vegetation along this reach. The trendline scores were indicative of generic stream health (Table 2) varying between ‘fair’ and ‘very good’ have been slightly lower than might be expected at times (particularly prior to 2004) at this site approximately 6 km below the National Park. A strong improvement has been obvious between 2007 and 2012 when it plateaued with some deterioration in ‘health’ over the 2013 to 2016 period.
KPA000250
1996 1998 2000 2002 2004 2006 2008 2010 2012 2014 2016 2018Year
80
90
100
110
120
130
140
MC
I va
lue
N = 34 Kendall tau = +0.582 p level < 0.001 FDR, p < 0.001

208
Temporal trends 2006 to 2016 3.2.21.1.5A LOWESS trend plot with a moving average (tension 0.4) trendline was produced (Figure 143). A non-parametric statistical trend analysis of the MCI data using the Mann-Kendall test was then performed on the ten most recent years of SEM results (2006-2016) from the site in the Kapoaiaia Stream at Wiremu Road.
Figure 143 LOWESS trend plot of ten years of MCI data in the Kapoaiaia Stream at the Wiremu Road
site
A positive significant trend in MCI scores has been found over the ten year period congruent with the results from the full dataset indicating a relatively recent improvement in the macroinvertebrate community at this site. The trendline was indicative of ‘very good’ health (Table 2).
Wataroa Road site (KPA000700) 3.2.21.2 Taxa richness and MCI 3.2.21.2.1
Thirty surveys have been undertaken in the Kapoaiaia Stream at this mid-reach site at Wataroa Road between December 1996 and February 2015. These results are summarised in Table 102, together with the results from the current period, and illustrated in Figure 144.
Table 102 Results of previous surveys performed in the Kapoaiaia Stream at Wataroa Road, together with spring 2015 and summer 2016 results
Site code
SEM data ( 1995 to Feb 2015) 2015-2016 surveys
No of surveys
Taxa numbers MCI values Oct 2015 Mar 2016
Range Median Range Median Taxa no MCI Taxa no MCI
KPA000700 30 12-30 21 78-118 95 21 114 27 109
KPA000250
2006 2008 2010 2012 2014 2016 2018Year
90
100
110
120
130
140
MC
I va
lue
N = 20 Kendall tau = +0.349 p level = 0.032 FDR, p = 0.032

209
Figure 144 Numbers of taxa and MCI values in the Kapoaiaia Stream at Wataroa Road
A wide range of richnesses (12 to 30 taxa) has been found, with a median richness of 21 taxa, relatively typical of richnesses in the mid-reaches of ringplain streams and rivers. During the 2015-2016 period, spring (21 taxa) and summer (27 taxa) richnesses were six taxa apart with a typical increase in taxa number from spring to summer though summer taxa richness was still slightly higher than normal at the site coincident with more widespread substrate periphyton mats cover. MCI values have had a relatively wide range (40 units) at this site, more so than typical of many sites in the mid-reaches of ringplain rivers. The historical median value (95 units) is lower than values typical of mid-reach sites elsewhere on the ringplain (TRC, 2015c). The spring 2015 (114 units) and summer 2016 (109 units) scores were not significantly different from each other and both scores were significantly higher than the historical median score by 19 and 14 units respectively. These scores categorised this site as having ‘good’ (spring and summer) health generically (Table 2). The historical median score (95 units) placed this site in the ‘fair’ category for generic health.
Community composition 3.2.21.2.2Characteristic macroinvertebrate taxa in the communities at this site prior to the 2015-2016 period are listed in
Table 103.
Table 103 Characteristic taxa [abundant (A), very abundant (VA), extremely abundant (XA)]
recorded in the Kapoaiaia Stream at Wataroa Road between 1995 and February 2015 [32 surveys], and by the spring 2015 and summer 2016 surveys
Taxa List MCI
score A VA XA Total %
Survey
Spring 2015
Summer 2016
PLATYHELMINTHES (FLATWORMS) Cura 3 1 1 3
NEMATODA Nematoda 3 1 1 3
ANNELIDA (WORMS) Oligochaeta 1 7 7 4 18 56
Lumbricidae 5 1 1 3
MOLLUSCA Potamopyrgus 4 4 3 7 22
EPHEMEROPTERA (MAYFLIES) Austroclima 7 3 3 9
Coloburiscus 7 2 4 6 19 A A
0
10
20
30
40
50
60
0
20
40
60
80
100
120
No.
of t
axa
MC
I val
ue
SEM: Number of taxa and MCI values in the Kapoaiaia Stream at Wataroa Road bridge (KPA000700)
MCI values Median MCI value to dateNo of taxa Median no of taxa to date

210
Taxa List MCI
score A VA XA Total %
Survey
Spring 2015
Summer 2016
Deleatidium 8 7 4 6 17 53 VA VA
Nesameletus 9 1 1 3
PLECOPTERA (STONEFLIES) Acroperla 5 3 3 9 A
Zelandobius 5 1 1 3
COLEOPTERA (BEETLES) Elmidae 6 10 14 4 28 88 A
MEGALOPTERA (DOBSONFLIES) Archichauliodes 7 12 12 38
TRICHOPTERA (CADDISFLIES) Hydropsyche (Aoteapsyche) 4 9 12 2 23 72 A
Costachorema 7 14 2 16 50
Hydrobiosis 5 15 4 19 59
Oxyethira 2 2 2 6
Pycnocentrodes 5 9 2 11 34 A
DIPTERA (TRUE FLIES) Aphrophila 5 15 2 17 53 A
Maoridiamesa 3 9 12 1 22 69 A
Orthocladiinae 2 8 15 5 28 88 A VA
Tanytarsini 3 3 3 6 19 A
Empididae 3 4 1 5 16
Muscidae 3 4 4 13
Austrosimulium 3 10 1 11 34
Prior to the current 2015-2016 period, 24 taxa had characterised the community at this site on occasions. These have comprised two ‘highly sensitive’, ten ‘moderately sensitive’, and twelve ‘tolerant’ taxa i.e. a minority of ‘highly sensitive’ taxa and a downstream increase in the number of ‘tolerant’ taxa to a higher proportion than might be expected in the mid reaches of a ringplain stream. Predominant taxa have included one ‘highly sensitive’ taxon [mayfly (Deleatidium)]; four ‘moderately sensitive’ taxa [elmid beetles, free-living caddisflies (Costachorema and Hydrobiosis), and cranefly (Aphrophila)]; and four ‘tolerant’ taxa [oligochaete worms, net-building caddisfly (Hydropsyche-Aoteapsyche), and midges (Maoridiamesa and orthoclads)]. The spring 2015 community consisted of five historically characteristic taxa comprising one ‘highly sensitive’, two ‘moderately sensitive’ and two ‘tolerant’ taxa. The summer 2016 community consisted of eight historically characteristic taxa comprising one ‘highly sensitive’, four ‘moderately sensitive’ and three ‘tolerant’ taxa. Three of the ten characteristic taxa were shared between surveys ( Table 103). Due to the differences between the seasonally most dominant taxa compositions, particularly orthoclad midges, there was a significant decrease in SQMCIs scores (1.3 unit) between spring and summer (Table 169 and Table 170). The two characteristic taxa found as very abundant by the seasonal surveys have characterised this site’s communities on 53% to 88% of past survey occasions.
Predicted stream ‘health’ 3.2.21.2.3The Kapoaiaia Stream site at Wataroa Road, is 13.5 km downstream of the National Park boundary at an altitude of 140 m asl. Relationships for ringplain streams developed between MCI and site altitude and distance from the National Park boundary (Stark and Fowles, 2009), predict MCI values of 99 (altitude) and 103 (distance) for this site. The historical site median (95) is four units lower than the altitude prediction and eight units lower than the distance predictive value. The spring 2015 survey score (114 units) was four units lower than the predictive altitude

211
value and eight units lower than the predictive distance value while the summer, 2015 score (109 units) was significantly (Stark, 1998) lower than both predictive values by 14 to 18 units. Of the 32 surveys to date at this site, 75% of MCI scores have been less than 99 units while only 13% have been greater than 103 units, confirmation of the much poorer than predicted historical biological ‘health’ at this site. The median value for a ringplain stream arising inside the National Park (TRC, 2015c) was 101 units. The historical, spring and summer scores score were all significantly higher by 12, 20 and 30 units respectively than the TRC, 2015c value. The REC predicted MCI value (Leathwick, et al. 2009) was 111 units. The historical and spring scores were not significantly different to the REC value but the summer score was significantly higher by 20 units (Stark, 1998).
Temporal trends in 1995 to 2016 3.2.21.2.4A LOWESS trend plot with a moving average (tension 0.4) trendline was produced (Figure 145). A non-parametric statistical trend analysis of the MCI data using the Mann-Kendall test was then performed on 21 years of SEM results (1995-2016) from the site in the Kapoaiaia Stream at Wataroa Road. The MCI has been chosen as the preferable indicator of ‘stream/river health’ for SEM trend reporting purposes.
Figure 145 LOWESS trend plot of MCI data in the Kapoaiaia Stream at the Wataroa Road site
There was a significant positive trend over the 21 year period (FDR p<0.01). Although the initial six years of the monitoring programme indicated a significant temporal improvement in MCI scores, these tended to decline between 2004 and 2007. Further more recent improvement has resulted in a positive trend. The range of trendline scores (30 units) have been ecologically important although it has been influenced by an initial very low score. From 2000 to date this range (12 units) has been of ecological importance. This trend of improvement had been influenced probably by the same drivers of the marked improvement at the Wiremu Road site upstream. MCI scores across the trendline have consistently indicated ‘fair’ generic stream health (Table 2) at this mid-catchment site, improving to ‘good’ from 2012 onwards.
KPA000700
1996 1998 2000 2002 2004 2006 2008 2010 2012 2014 2016 2018Year
75
80
85
90
95
100
105
110
115
120
MC
I va
lue
N = 34 Kendall tau = +0.480 p level < 0.001 FDR p = 0.001

212
Temporal trends in 2006 to 2016 3.2.21.2.5A LOWESS trend plot with a moving average (tension 0.4) trendline was produced (Figure 146). A non-parametric statistical trend analysis of the MCI data using the Mann-Kendall test was then performed on the ten most recent years of SEM results (2006-2016) from the site in the Kapoaiaia Stream at Wataroa Road.
Figure 146 LOWESS trend plot of ten years of MCI data in the Kapoaiaia Stream at the Wataroa Road site
A positive non-significant trend in MCI scores after FDR adjustment has been found over the ten year period in contrast with the high significant positive results found in the full dataset. However, the ten year dataset trend was significant before FDR adjustment and shows a marked increased from 2006 to 2010 and 2014 to 2016 over a large MCI score range. The trendline was indicative of ‘fair’ to ‘good’ health (Table
2).
Upstream of coast site (KPA000950) 3.2.21.3 Taxa richness and MCI 3.2.21.3.1
Thirty surveys have been undertaken at this lower reach site near the coast in the Kapoaiaia Stream between December 1996 and February 2015. These results are summarised in Table 104, together with the results from the current period, and illustrated in Figure 145.
Table 104 Results of previous surveys performed in the Kapoaiaia Stream at the site upstream of the coast together with spring 2015 and summer 2016 results
Site code
SEM data ( 1995 to Feb 2015) 2015-2016 surveys
No of surveys
Taxa numbers MCI values Oct 2015 Mar 2016
Range Median Range Median Taxa no MCI Taxa no MCI
KPA000950 32 15-24 19 76-101 86 17 91 17 87
KPA000700
2006 2008 2010 2012 2014 2016 2018Year
75
80
85
90
95
100
105
110
115
120
MC
I va
lue
N = 20 Kendall tau = +0.370 p level = 0.022 FDR p = 0.143

213
Figure 147 Numbers of taxa and MCI values in the Kapoaiaia Stream at the Cape Egmont
(upstream of coast) site
A moderate range of richnesses (15 to 24 taxa) has been found with a median richness of 19 taxa relatively typical of richnesses in the lower reaches of ringplain streams and rivers. During the 2015-2016 period, spring (17 taxa) and summer (17 taxa) richnesses were the same despite significantly more periphyton present during the summer survey. Both surveys were only two taxa lower than the historic median. MCI scores have had a moderate range (25 units) at this site, slightly narrower than typical of sites in the lower reaches of ringplain streams. However, the median value (86 units) has been relatively typical of lower reach sites elsewhere on the ringplain (TRC, 2015c). The spring 2015 (92 units) score was six units above the historical median for this site but only three taxa above the spring historic median (89 taxa). The summer 2016 (87 units) score was only one unit above the historic median but six taxa above the historic summer median (81 units). The MCI scores categorised this site as having ‘fair’ (spring and summer) health generically (Table 2). The historical median score (86 units) placed this site in the ‘fair’ category for generic health.
Community composition 3.2.21.3.2Characteristic macroinvertebrate taxa in the communities at this site prior to the 2015-2016 period are listed in Table 105.
Table 105 Characteristic taxa [abundant (A), very abundant (VA), extremely abundant (XA)] recorded in the Kapoaiaia Stream at the site upstream of the coast between 1995 and February 2015 [32 surveys], and by the spring 2015 and summer 2016 surveys
Taxa List MCI A VA XA Total %
Survey
Spring 2015
Summer 2016
PLATYHELMINTHES (FLATWORMS) Cura 3 1 1 3
NEMERTEA Nemertea 3 1 1 3
ANNELIDA (WORMS) Oligochaeta 1 11 7 11 29 91 A
Lumbricidae 5 1 1 3
MOLLUSCA Potamopyrgus 4 12 11 1 24 75
EPHEMEROPTERA (MAYFLIES) Austroclima 7 2 2 6

214
Taxa List MCI A VA XA Total %
Survey
Spring 2015
Summer 2016
Deleatidium 8 3 1 4 13 A
COLEOPTERA (BEETLES) Elmidae 6 4 14 18 56 A
MEGALOPTERA (DOBSONFLIES) Archichauliodes 7 3 3 9
TRICHOPTERA (CADDISFLIES) Hydropsyche (Aoteapsyche) 4 9 14 4 27 84 A
Costachorema 7 2 2 6
Hydrobiosis 5 19 3 22 69
Oxyethira 2 5 5 16
Pycnocentrodes 5 6 11 1 18 56 A
DIPTERA (TRUE FLIES) Aphrophila 5 8 1 9 28 A
Chironomus 1 1 1 3
Maoridiamesa 3 5 11 3 19 59 VA
Orthocladiinae 2 8 14 9 31 97 A A
Tanytarsini 3 7 7 22 A
Empididae 3 1 1 3
Muscidae 3 4 4 13
Austrosimulium 3 5 2 7 22
Prior to the current 2015-2016 period 22 taxa have characterised the community at this site on occasions. These have comprised one ‘highly sensitive’, eight ‘moderately sensitive’, and thirteen ‘tolerant’ taxa i.e. a high proportion of ‘tolerant’ taxa as might be expected in the lower reaches of a ringplain stream. Predominant taxa have included no ‘highly sensitive’ taxa; three ‘moderately sensitive’ taxa [elmid beetles, free-living caddisfly (Hydrobiosis), and stony-cased caddisfly (Pycnocentrodes)]; and five ‘tolerant’ taxa [oligochaete worms, snail (Potamopyrgus), net-building caddisfly (Hydropsyche-Aoteapsyche), and midges (orthoclads and Maoridiamesa)]. The spring 2015 community consisted of four historically characteristic taxa comprising one ‘highly sensitive’, one ‘moderately sensitive’ and two ‘tolerant’ taxa. The summer 2016 community consisted of six historically characteristic taxa comprising one two ‘moderately sensitive’ and four ‘tolerant’ taxa. Only one taxon of the nine characteristic taxa was shared between surveys (Table 105). Despite the differences between the seasonally most dominant taxa compositions there was minimal change in SQMCIs scores (0.3 unit) between spring and summer (Table 169 and Table 170). The only taxon recorded as very/extremely abundant during spring and/or summer had characterised this site’s communities on 59% of past survey occasions.
Predicted stream ‘health’ 3.2.21.3.3The Kapoaiaia Stream site near the coast is 25.2 km downstream of the National Park boundary at an altitude of 20 m asl. Relationships for ringplain streams developed between MCI and site altitude and distance from the National Park boundary (Stark and Fowles, 2009), predict MCI values of 86 (altitude) and 96 (distance) for this site. The historical site median (86 units) is equivalent with the altitude prediction but 10 units lower than the distance predictive value. The spring 2015 survey (92 units) and summer 2016 (87 units) scores were not significantly different to both predictive values (Stark, 1998). The median value for a ringplain stream arising inside the National Park (TRC, 2015c) at similar altitude was 102 units. The historical and summer scores were significantly lower by 16 and 15 units respectively while the spring score was not

215
significantly different. The REC predicted MCI value (Leathwick, et al. 2009) was 105 units. The historical and summer scores were significantly lower by 19 and 18 units respectively while the spring score was not significantly different (Stark, 1998).
Temporal trends in 1996 to 2016 3.2.21.3.4A LOWESS trend plot with a moving average (tension 0.4) was produced (Figure 148). A non-parametric statistical trend analysis of the MCI data using the Mann-Kendall test was then performed on 20 years of SEM results (1996-2016) from the site in the Kapoaiaia Stream at near the coast. The MCI has been chosen as the preferable indicator of ‘stream/river health’ for SEM trend reporting purposes.
Figure 148 LOWESS trend plot of MCI data at the site
upstream of the coast
No statistically significant trend has been found for the overall monitoring period despite a steady improvement in MCI scores over the initial seven year period followed by a smaller increase between 2008 and 2012 (FDR p>0.05). There has been a similar, although more pronounced, trend at the mid-catchment site at Wataroa Road. However, there has been an ecologically important range (of 13 units) across the trendline, influenced by the low initial score, but not as wide as the range at the nearest upstream site. Subsequent to the December 1996 survey, no usage of the Pungarehu Dairy Factory (between the two sites) has occurred and since 2000 there has been a narrower, ecologically insignificant, range of MCI scores (eight units). In more recent years, there has been an increase in water abstraction in the lower reaches for irrigation purposes. The trendline range of MCI scores have consistently been indicative of ‘fair’ generic stream health (Table 2) although individual scores have occasionally indicated ‘poor’ health, invariably under summer (warmer and lower) flow conditions.
Temporal trends in 2006 to 2016 3.2.21.3.5A LOWESS trend plot with a moving average (tension 0.4) was produced (Figure 149). A non-parametric statistical trend analysis of the MCI data using the Mann-Kendall test was then performed on the most recent ten years of SEM results (2006-2016) from the site in the Kapoaiaia Stream at near the coast.
KPA000950
1996 1998 2000 2002 2004 2006 2008 2010 2012 2014 2016 2018Year
74
76
78
80
82
84
86
88
90
92
94
96
98
100
102
104
MC
I va
lue
N = 34 Kendall tau = +0.214 p level = 0.076 FDR p = 0.125
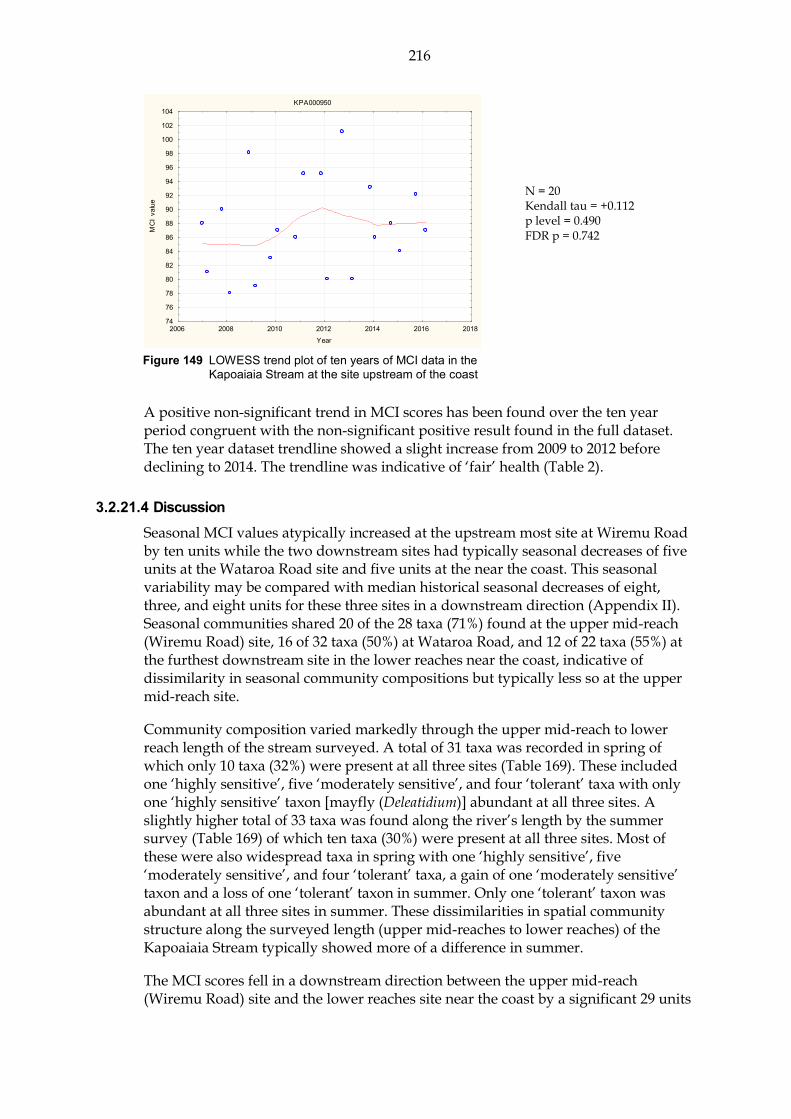
216
Figure 149 LOWESS trend plot of ten years of MCI data in the
Kapoaiaia Stream at the site upstream of the coast
A positive non-significant trend in MCI scores has been found over the ten year period congruent with the non-significant positive result found in the full dataset. The ten year dataset trendline showed a slight increase from 2009 to 2012 before declining to 2014. The trendline was indicative of ‘fair’ health (Table 2).
Discussion 3.2.21.4Seasonal MCI values atypically increased at the upstream most site at Wiremu Road by ten units while the two downstream sites had typically seasonal decreases of five units at the Wataroa Road site and five units at the near the coast. This seasonal variability may be compared with median historical seasonal decreases of eight, three, and eight units for these three sites in a downstream direction (Appendix II). Seasonal communities shared 20 of the 28 taxa (71%) found at the upper mid-reach (Wiremu Road) site, 16 of 32 taxa (50%) at Wataroa Road, and 12 of 22 taxa (55%) at the furthest downstream site in the lower reaches near the coast, indicative of dissimilarity in seasonal community compositions but typically less so at the upper mid-reach site.
Community composition varied markedly through the upper mid-reach to lower reach length of the stream surveyed. A total of 31 taxa was recorded in spring of which only 10 taxa (32%) were present at all three sites (Table 169). These included one ‘highly sensitive’, five ‘moderately sensitive’, and four ‘tolerant’ taxa with only one ‘highly sensitive’ taxon [mayfly (Deleatidium)] abundant at all three sites. A slightly higher total of 33 taxa was found along the river’s length by the summer survey (Table 169) of which ten taxa (30%) were present at all three sites. Most of these were also widespread taxa in spring with one ‘highly sensitive’, five ‘moderately sensitive’, and four ‘tolerant’ taxa, a gain of one ‘moderately sensitive’ taxon and a loss of one ‘tolerant’ taxon in summer. Only one ‘tolerant’ taxon was abundant at all three sites in summer. These dissimilarities in spatial community structure along the surveyed length (upper mid-reaches to lower reaches) of the Kapoaiaia Stream typically showed more of a difference in summer.
The MCI scores fell in a downstream direction between the upper mid-reach (Wiremu Road) site and the lower reaches site near the coast by a significant 29 units
KPA000950
2006 2008 2010 2012 2014 2016 2018Year
74
76
78
80
82
84
86
88
90
92
94
96
98
100
102
104
MC
I va
lue
N = 20 Kendall tau = +0.112 p level = 0.490 FDR p = 0.742

217
in spring and to a larger extent in summer by 44 units, over a river distance of 19.5 km. This contrasts with the historic median differences between the upper and lower sites where there was a decrease of 31 units in both spring and summer, with decreases of eight units from spring to summer at both the upper and lower sites. Therefore, a significantly larger decrease in MCI score occurred during the summer survey than was typical for the stream but this was due to the record high MCI score at the upper site rather than due to higher levels of degradation along the stream length.
Kurapete Stream 3.2.22Two sites in this small ringplain seepage-sourced stream, one located immediately upstream of the Inglewood Wastewater Treatment (WWTP) and the other nearly six km downstream, were included in the SEM programme for the purposes of long term monitoring of the impacts of the removal of the treated wastewater discharge from the stream and also, riparian vegetation planting initiatives in the catchment.
The results of the spring and summer 2015-2016 surveys are presented in Table 171 and Table 172, Appendix 1.
Site upstream of Inglewood WWTP (KRP000300) 3.2.22.1 Taxa richness and MCI 3.2.22.1.1
Forty-one surveys have been undertaken, between 1995 and February 2015, at this mid-reach, shaded site, draining developed farmland, downstream of Inglewood, but immediately upstream of the WWTP. These results are summarised in Table 106, together with the results from the current period, and illustrated in Figure 150.
Table 106 Results of previous surveys performed in the Kurapete Stream upstream of Inglewood WWTP, together with spring 2015 and summer 2016 results
Site code
SEM data ( 1995 to Feb 2015) 2015-2016 surveys
No of surveys
Taxa numbers MCI values Oct 2015 Mar 2016
Range Median Range Median Taxa no MCI Taxa no MCI
KRP000300 41 13-32 22 80-104 94 27 104 22 106
Figure 150 Numbers of taxa and MCI values in the Kurapete Stream upstream of the
Inglewood WWTP

218
A relatively wide range of richnesses (13 to 32 taxa) has been found with a moderate median richness of 22 taxa, relatively typical of richnesses in the mid reaches of ringplain streams rising outside the National Park boundary. During the 2015-2016 period spring (27 taxa) richness was five taxa higher than the summer (22 taxa) and historical median richness coincident with patchy (spring) and thin (summer) periphyton layers on the predominantly cobble/boulder substrate of this shaded site. MCI values have had a moderate range (23 units) at this site, typical of mid-reach sites in seepage streams on the ringplain. The spring 2015 (104 units) score was very similar to the summer 2016 (106 units) score and 10 units higher than the historical median and the highest equal MCI score recorded at the time. The summer score was a significant 12 units higher than the historic median and the highest recorded MCI score at the site to date. The scores categorised this ringplain seepage stream site as having ‘good’ (spring and summer) health generically (Table 2). The historical median score (94 units) placed this site in the ‘fair’ category for generic health.
Community composition 3.2.22.1.2Characteristic macroinvertebrate taxa in the communities at this site prior to the 2015-2016 period are listed in Table 107.
Table 107 Characteristic taxa (abundant, very abundant, extremely abundant) recorded in the Kurapete Stream upstream of Inglewood WWTP, between 1996 and February 2015 [41 surveys], and by the spring 2015 and summer 2016 surveys
Taxa List MCI
score A VA XA Total %
Survey
Spring 2015
Summer 2016
PLATYHELMINTHES (FLATWORMS) Cura 3 1 1 2
NEMERTEA Nemertea 3 1 1 2
ANNELIDA (WORMS) Oligochaeta 1 25 7 32 74 VA A
MOLLUSCA Potamopyrgus 4 17 10 2 29 67 A A
CRUSTACEA Paraleptamphopidae 5 5 5 12
EPHEMEROPTERA (MAYFLIES) Austroclima 7 7 6 13 30 A VA
Coloburiscus 7 1 1 2 A VA
Deleatidium 8 2 2 4 9 A
Zephlebia group 7 5 10 5 20 47 VA VA
PLECOPTERA (STONEFLIES) Acroperla 5 2 2 5
COLEOPTERA (BEETLES) Elmidae 6 11 13 24 56 A VA
MEGALOPTERA (DOBSONFLIES) Archichauliodes 7 15 15 35 A A
TRICHOPTERA (CADDISFLIES) Hydropsyche (Aoteapsyche) 4 26 3 29 67 A
Hydrobiosis 5 3 3 7
Oxyethira 2 2 2 5
Pycnocentria 7
DIPTERA (TRUE FLIES) Aphrophila 5 20 4 24 56
Maoridiamesa 3 3 3 7
Orthocladiinae 2 18 8 26 60 VA
Polypedilum 3 1 1 2
Tanypodinae 5 1 1 2
Austrosimulium 3 16 8 3 27 63

219
Prior to the current 2015-2016 period 18 taxa had characterised the community at this site on occasions. These have comprised only one ‘highly sensitive’, nine ‘moderately sensitive’, and eight ‘tolerant’ taxa i.e. a relatively even balance between ‘sensitive’ and ‘tolerant’ taxa as might be expected in the mid-reaches of a ringplain stream rising outside the National Park. Predominant taxa have included two ‘moderately sensitive’ taxa [elmid beetles and cranefly (Aphrophila)] and five ‘tolerant’ taxa [oligochaete worms, snail (Potamopyrgus), net-building caddisfly (Hydropsyche-Aoteapsyche), orthoclad midges, and sandfly (Austrosimulium)]. The spring 2015 community consisted of nine historically characteristic taxa comprising one ‘highly sensitive’, five ‘moderately sensitive’ and three ‘tolerant’ taxa. The summer 2016 community consisted of eight historically characteristic taxa comprising five ‘moderately sensitive’ and three ‘tolerant’ taxa. Seven of the ten characteristic taxa were shared between surveys (Table 107). Despite the similarity between the seasonally most dominant taxa compositions there was a significant decrease in SQMCIs scores (2.0 units) between spring and summer (Table 171 and Table 172) largely due to a significant decrease in ‘highly sensitive’ mayflies. All taxa which were recorded as very abundant during spring and/or summer had characterised this site’s communities on 49% to 79% of past survey occasions.
Predicted stream ‘health’ 3.2.22.1.3The Kurapete Stream rises below the National Park boundary and the site upstream of the Inglewood WWTP is in the mid-reaches at an altitude of 180 m asl. The median value for a ringplain stream arising outside the National Park (TRC, 2015c) at similar altitude was 89 units. The spring and summer scores were significantly higher by 15 and 17 units respectively while the historical median was not significantly different. The REC predicted MCI value (Leathwick, et al. 2009) was 92 units. The spring and summer scores were significantly higher by 12 and 14 units respectively while the historical median was not significantly different (Stark, 1998).
Temporal trends in 1995 to 2016 data 3.2.22.1.4A LOWESS trend plot with a moving average (tension 0.4) trendline was produced (Figure 151). A non-parametric statistical trend analysis of the MCI data using the Mann-Kendall test was then performed on 21 years of SEM results (1995-2016) from the site in the Kurapete Stream upstream of the Inglewood WWTP. The MCI has been chosen as the preferable indicator of ‘stream/river health’ for SEM trend reporting purposes.
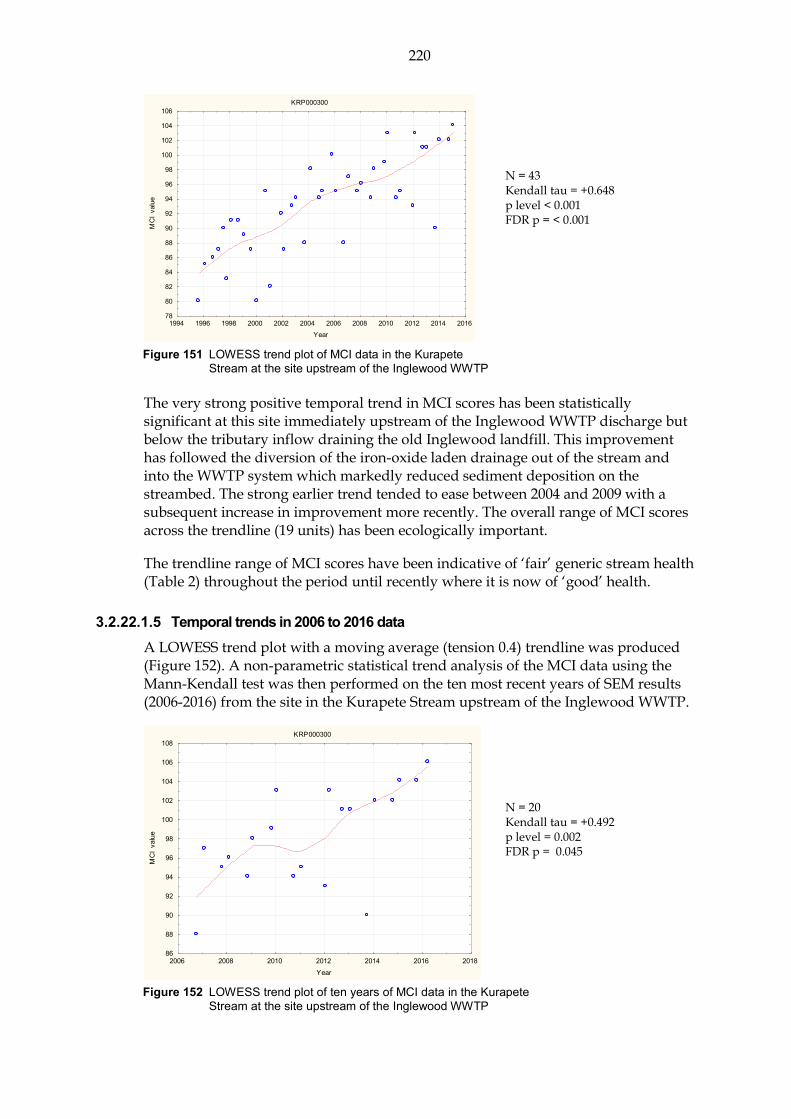
220
N = 43 Kendall tau = +0.648 p level < 0.001 FDR p = < 0.001
N = 20 Kendall tau = +0.492 p level = 0.002 FDR p = 0.045
Figure 151 LOWESS trend plot of MCI data in the Kurapete
Stream at the site upstream of the Inglewood WWTP
The very strong positive temporal trend in MCI scores has been statistically significant at this site immediately upstream of the Inglewood WWTP discharge but below the tributary inflow draining the old Inglewood landfill. This improvement has followed the diversion of the iron-oxide laden drainage out of the stream and into the WWTP system which markedly reduced sediment deposition on the streambed. The strong earlier trend tended to ease between 2004 and 2009 with a subsequent increase in improvement more recently. The overall range of MCI scores across the trendline (19 units) has been ecologically important.
The trendline range of MCI scores have been indicative of ‘fair’ generic stream health (Table 2) throughout the period until recently where it is now of ‘good’ health.
Temporal trends in 2006 to 2016 data 3.2.22.1.5A LOWESS trend plot with a moving average (tension 0.4) trendline was produced (Figure 152). A non-parametric statistical trend analysis of the MCI data using the Mann-Kendall test was then performed on the ten most recent years of SEM results (2006-2016) from the site in the Kurapete Stream upstream of the Inglewood WWTP.
Figure 152 LOWESS trend plot of ten years of MCI data in the Kurapete
Stream at the site upstream of the Inglewood WWTP
KRP000300
1994 1996 1998 2000 2002 2004 2006 2008 2010 2012 2014 2016Year
78
80
82
84
86
88
90
92
94
96
98
100
102
104
106
MC
I va
lue
KRP000300
2006 2008 2010 2012 2014 2016 2018Year
86
88
90
92
94
96
98
100
102
104
106
108
MC
I va
lue

221
A positive significant trend in MCI scores has been found over the ten year period congruent with the positive significant result found in the full dataset. The ten year dataset trendline showed a large increase throughout the ten year period. The trendline was indicative of ‘fair’ health (Table 2) becoming ‘good’ health from 2013 onwards.
Site approximately 6km downstream of the Inglewood WWTP outfall (KRP000660) 3.2.22.2 Taxa richness and MCI 3.2.22.2.1
Forty-one surveys have been undertaken at this lower reach site in the Kurapete Stream 6 km downstream of the Inglewood WWTP outfall (KRP000660) between 1995 and February 2015. These results are summarised in Table 108, together with the results from the current period, and illustrated in Figure 153.
Table 108 Results of previous surveys performed in the Kurapete Stream at the site 6km downstream of the Inglewood WWTP outfall together with spring 2015 and summer 2016 results
Site code
SEM data (1996 to February 2015) 2015-2016 surveys
No of surveys
Taxa numbers MCI values Oct 2015 Mar 2016
Range Median Range Median Taxa no MCI Taxa no MCI
KRP000660 41 14-30 25 70-112 93 25 105 25 99
Figure 153 Numbers of taxa and MCI values in the Kurapete Stream, 6 km downstream
of the Inglewood WWTP outfall
A moderate range of richnesses (14 to 30 taxa) has been found, with a median richness of 25 taxa (slightly higher than typical of richnesses for the lower mid-reaches of ringplain streams rising outside the National Park boundary. During the 2015-2016 period spring (25 taxa) and summer (25 taxa) richnesses were exactly the same as each other and to that of the historic median (25 taxa). MCI values have had a wide range (42 units) at this site. The median value (93 units) has been typical of lower mid-reach sites in similar seepage-fed streams elsewhere on the ringplain (TRC, 2015c). The spring 2015 (105 units) and summer 2016 (99 units) scores were not significantly different to each other and the summer score was not significantly different to the historic median but the spring score was significantly

222
higher (Stark, 1998) than the historic median by 12 units. These scores categorised this site as having ‘good’ (spring) and ‘fair’ (summer) health generically (Table 2). . The historical median score (93 units) placed this site in the ‘fair’ category for generic health.
Community composition 3.2.22.2.2Characteristic macroinvertebrate taxa in the communities at this site prior to the 2015-2016 period are listed in Table 109.
Table 109 Characteristic taxa (abundant, very abundant, extremely abundant) recorded in the Kurapete Stream at the site 6 km downstream of Inglewood WWTP outfall, between 1996 and February 2015 [41 surveys], and by the spring 2015 and summer 2016 surveys
Taxa List MCI
score A VA XA Total %
Survey
Spring 2015
Summer 2016
PLATYHELMINTHES (FLATWORMS) Cura 3 1 1 2
NEMERTEA Nemertea 3 3 3 7
NEMATODA Nematoda 3 1 1 2
ANNELIDA (WORMS) Oligochaeta 1 19 13 3 35 83 VA VA
MOLLUSCA Potamopyrgus 4 13 9 2 24 57 A A
CRUSTACEA Ostracoda 1 1 1 2
EPHEMEROPTERA (MAYFLIES) Austroclima 7 7 2 9 21 A A
Coloburiscus 7 6 4 10 24 A A
Deleatidium 8 3 6 9 21 VA
Zephlebia group 7 6 5 11 26 A
PLECOPTERA (STONEFLIES) Zelandobius 5 7 2 9 21 A
COLEOPTERA (BEETLES) Elmidae 6 16 10 26 62 VA A
MEGALOPTERA (DOBSONFLIES) Archichauliodes 7 17 17 40 A A
TRICHOPTERA (CADDISFLIES) Hydropsyche (Aoteapsyche) 4 8 18 1 27 64 VA
Costachorema 7 2 2 5
Hydrobiosis 5 18 1 19 45
Oxyethira 2 9 5 14 33
Pycnocentria 7 A
Pycnocentrodes 5 5 4 9 21 A
DIPTERA (TRUE FLIES) Aphrophila 5 22 8 30 71
Maoridiamesa 3 10 1 11 26 A
Orthocladiinae 2 26 12 3 41 98 XA A
Tanytarsini 3 4 4 10
Empididae 3 3 3 7
Muscidae 3 4 4 10
Austrosimulium 3 17 1 1 19 45
Prior to the current 2015-2016 period, 25 taxa had characterised the community at this site on occasions. These have comprised one ‘highly sensitive’, ten ‘moderately sensitive’, and fourteen ‘tolerant’ taxa i.e. a higher proportion of ‘tolerant’ taxa, which is typical of the lower mid-reaches of a ringplain stream. Predominant taxa have included two ‘moderately sensitive’ taxa [elmid beetles and cranefly (Aphrophila)] and four ‘tolerant’ taxa [oligochaete worms, snail (Potamopyrgus), net-building caddisfly (Hydropsyche-Aoteapsyche), and orthoclad midges]. The spring 2015 community consisted of 11 historically characteristic taxa comprising one ‘highly sensitive’, six ‘moderately sensitive’ and four ‘tolerant’ taxa. The summer 2016

223
community consisted of ten historically characteristic taxa comprising six ‘moderately sensitive’ and four ‘tolerant’ taxa. Seven of the 13 characteristic taxa were shared between surveys (Table 109). Due to the similarity between the seasonally most dominant taxa compositions there was no significant difference in SQMCIs scores (0.4 units) between spring and summer (Table 171 and Table 172). The five taxa which were recorded as very or extremely abundant in spring and/or summer had characterised this site’s communities on 21% to 98% of past surveys.
Predicted stream ‘health’ 3.2.22.2.3The Kurapete Stream rises below the National Park boundary and the site 6 km downstream of the Inglewood WWTP outfall is in the lower mid-reaches at an altitude of 120 m asl. The median value for a ringplain stream arising outside the National Park (TRC, 2015c) at similar altitude was 102 units. The spring, summer scores and historical medians were significantly not significantly different to this value. The REC predicted MCI value (Leathwick, et al. 2009) was again 102 units and therefore the spring, summer scores and historical medians were also not significantly different (Stark, 1998).
Temporal trends in 1995 to 2016 data 3.2.22.2.4A LOWESS trend plot with a moving average (tension 0.4) trendline was produced (Figure 154). A non-parametric statistical trend analysis of the MCI data using the Mann-Kendall test was then performed on 21 years of SEM results (1995-2016) from the site in the Kurapete Stream at the site six km downstream of the Inglewood WWTP outfall. The MCI has been chosen as the preferable indicator of ‘stream/river health’ for SEM trend reporting purposes.
Figure 154 LOWESS trend plot of MCI data in the Kurapete
Stream for the site 6 km downstream of the Inglewood WWTP outfall
There has been a highly significant positive trend of MCI score improvement (FDR p<0.01). There was a noticeably increase in the steepness of the trend after 2000 (following diversion of all Inglewood WWTP wastes out of the stream (to the New
KRP000660
1994 1996 1998 2000 2002 2004 2006 2008 2010 2012 2014 2016 2018Year
65
70
75
80
85
90
95
100
105
110
115
MC
I va
lue
N = 43 Kendall tau = +0.456 p level <0.001 FDR p < 0.001

224
Plymouth WWTP) which was emphasised by an ecologically important increase in average score of 17 units over a five year period. Subsequently, a decreasing trend in scores has been followed by a steady recovery since 2007 coincident with relatively few consented municipal wastes short-duration discharge overflows to the stream during recent years. Overall, the trendline scores indicated improving stream health from ‘poor’ through ‘fair’ to ‘good’ in 2015 (Table 2) indicative of the positive effects of diversion of the Inglewood WWTP discharge out of the stream.
Temporal trends in 2006 to 2016 data 3.2.22.2.5A LOWESS trend plot with a moving average (tension 0.4) trendline was produced (Figure 155). A non-parametric statistical trend analysis of the MCI data using the Mann-Kendall test was then performed on the ten most recent years of SEM results (2006-2016) from the site in the Kurapete Stream at the site six km downstream of the Inglewood WWTP outfall.
Figure 155 LOWESS trend plot of ten years of MCI data in the
Kurapete Stream for the site 6 km downstream of the Inglewood WWTP outfall
KRP000660
2006 2008 2010 2012 2014 2016 2018Year
70
75
80
85
90
95
100
105
110
115
MC
I va
lue
N = 20 Kendall tau = +0.488 p level = 0.003 FDR p = 0.045

225
A positive significant trend in MCI scores has been found over the ten year period congruent with the positive significant result found in the full dataset. The ten year dataset trendline showed a consistent increase throughout the ten year period. The trendline was indicative of ‘fair’ health (Table 2) becoming ‘good’ health from 2015 onwards.
Discussion 3.2.22.3Seasonal MCI values increased by a non-significant two units between spring and summer at the site upstream of the Inglewood WWTP outfall and decreased at the site 6 km downstream by a non-significant six units. These seasonal differences may be compared with historical seasonal medians (Appendix II) which indicate a summer increase of one unit at the upstream site and a summer decrease of five units at the lower site indicating that seasonal MCI score changes were very similar to historical changes. Seasonal communities shared 17 of the 32 taxa (53%) found at the mid-reach site and a similar 18 of the 32 taxa (56%) found at the downstream lower mid-reach site indicative of marked seasonal community dissimilarities.
Community composition varied markedly through the mid-reach to lower mid-reach length of the stream surveyed. A total of 33 taxa were recorded in spring of which 18 taxa (55%) were present at both sites. These included one ‘highly sensitive’, eleven ‘moderately sensitive’, and six ‘tolerant’ taxa. A total of 31 taxa were found along the stream’s surveyed length by the summer survey of which 16 taxa (52%) were present at both sites. They were relatively similar to the widespread taxa in spring one ‘highly sensitive’, eleven ‘moderately sensitive’, and five ‘tolerant’ taxa. Seven taxa were abundant at both sites in summer; five ‘moderately sensitive’ and two ‘tolerant’ taxa. Dissimilarities in spatial community structure along the surveyed length of the Kurapete Stream were atypical of most seasonal structures to date which have shown greater summer dissimilarity.
The spring increase in MCI score by one unit and the summer decrease by six units was typical of minimal downstream deterioration recorded by most surveys since 2000 along this stream reach. The minimal summer decline in MCI score was significantly smaller than typical deteriorations through the mid reaches of Taranaki ringplain rivers and streams sourced outside of the National Park (TRC, 2015c).
Waiokura Stream 3.2.23Two sites in this small, intensively dairy-farmed, ringplain seepage-sourced stream, were included in the SEM programme in recognition of a long-term collaborative study of the effects of best-practice dairy-farming initiatives being evaluated in five dairying catchments throughout the country (Wilcock et al, 2009). Fonterra, Kapuni lactose factory also irrigates wastewater to land in the mid reaches of this catchment. One site is located upstream of the irrigation area (in mid-catchment) and the other site approximately ten km further downstream toward the lower reaches of the stream. Some consent monitoring data have been collected from the upper site since 2003 whereas the downstream site was established for biological temporal trend purposes in the 2008-2009 period to provide an additional monitoring component of the collaborative study.

226
The results of spring and summer (2015-2016) surveys are summarised in Table 173 and Table 174, Appendix I.
Skeet Road site (WKR000500) 3.2.23.1 Taxa richness and MCI 3.2.23.1.1
Twenty-one surveys have been undertaken, between 2003 and February 2015, at this mid-reach, partially shaded site in the Waiokura Stream, draining open developed farmland upstream of the Fonterra, Kapuni wastewater irrigation area. These results are summarised in Table 110, together with the results from the current period, and illustrated in Figure 156.
Table 110 Results of previous surveys performed in the Waiokura Stream at Skeet Road, together with spring 2015 and summer 2016 results
Site code
SEM data (2003 to Feb 2015) 2015-2016 surveys
No of surveys
Taxa numbers MCI values Oct 2015 Feb 2016
Range Median Range Median Taxa no MCI Taxa no MCI
WKR000500 21 18-29 23 88-114 99 28 108 29 99
Figure 156 Numbers of taxa and MCI values in the Waiokura Stream at Skeet Road
A relatively narrow range of richnesses (18 to 29 taxa) has been found to date with a median richness of 23 taxa more typical of richnesses in the mid reaches of ringplain streams rising outside the National park boundary. During the 2015-2016 period spring (28 taxa) and summer (29 taxa) richnesses were higher than this median richness and were close or equal to the maximum previously recorded taxa richness for this site, coincident with minimal periphyton on the predominantly gravel-cobble substrate of this site in spring and in summer despite following relatively lengthy flow recession periods on both occasions, particularly in summer. MCI values have had a moderate range (26 units) at this site, more typical of mid reach sites on the ringplain, although the monitoring period has been relatively short to date. The historical median value (99 units) has been typical of mid-reach sites in streams rising outside the National Park elsewhere on the ringplain (TRC, 2015c). The spring 2015 (108 units) and summer 2016 (99 units) scores were nine units above and equal to the historical median respectively. The scores categorised this site as
0
10
20
30
40
50
60
70
0
20
40
60
80
100
120
140
No. o
f tax
a
MCI
val
ue
SEM: Number of taxa and MCI values in the Waiokura Stream at Skeet Rd (WKR000500)
MCI score Median MCI to dateTaxa No Median no of taxa to date
227
having ‘good’ (spring) and ‘fair’ (summer) health generically (Table 2). The historical median score (99 units) placed this site in the ‘fair’ category for generic health.
Community composition 3.2.23.1.2Characteristic macroinvertebrate taxa in the communities at this site prior to the 2015-2016 period are listed in Table 111.
Table 111 Characteristic taxa [abundant (A), very abundant (VA), extremely abundant (XA)] recorded in the Waiokura Stream at Skeet Road, between 2003 and February 2015 [21 surveys], and by the spring 2015 and summer 2016 surveys
Taxa List MCI
score A VA XA Total %
Survey
Spring 2015
Summer 2016
NEMERTEA Nemertea 3 1 1 5
ANNELIDA (WORMS) Oligochaeta 1 8 2 10 48
MOLLUSCA Potamopyrgus 4 6 1 7 33
CRUSTACEA Paracalliope 5 1 1 5
Paraleptamphopidae 5 1 1 5 A
EPHEMEROPTERA (MAYFLIES) Austroclima 7 2 13 6 21 100 VA XA
Coloburiscus 7 7 7 33 VA
Deleatidium 8 7 4 1 12 57
Zephlebia group 7 5 4 9 43 A VA
PLECOPTERA (STONEFLIES) Zelandobius 5 3 3 14
COLEOPTERA (BEETLES) Elmidae 6 1 11 9 21 100 A A
MEGALOPTERA (DOBSONFLIES) Archichauliodes 7 13 13 62 A A
TRICHOPTERA (CADDISFLIES) Hydropsyche (Aoteapsyche) 4 3 12 6 21 100 A VA
Costachorema 7 1 1 5
Hydrobiosis 5 3 1 4 19
Confluens 5 1 1 5
Helicopsyche 10 0 A
Pycnocentria 7 0 A
Pycnocentrodes 5 7 2 9 43
DIPTERA (TRUE FLIES) Aphrophila 5 1 1 5
Maoridiamesa 3 1 2 3 14
Orthocladiinae 2 3 4 7 33
Tanytarsini 3 1 1 5
Austrosimulium 3 1 1 2 10 A
Prior to the current 2015-2016 period 22 taxa had characterised the community at this site on occasions. These have comprised only one ‘highly sensitive’, 13 ‘moderately sensitive’ and eight ‘tolerant’ taxa i.e. a moderately high proportion (64%) of ‘sensitive’ taxa as would be expected in the mid-reaches of a ringplain stream rising outside the National Park. Predominant taxa have included one ‘highly sensitive’ taxon [mayfly (Deleatidium)]; three ‘moderately sensitive’ taxa [mayfly (Austroclima), elmid beetles, and dobsonfly (Archichauliodes)]; and one ‘tolerant’ taxa [net-building caddisfly (Hydropsyche-Aoteapsyche)]. Two of the ‘moderately sensitive’ and one of the ‘tolerant’ taxa have been dominant on all survey occasions (Table 111).

228
Six of the historically characteristic taxa were dominant in the spring, 2015 community comprising four of the predominant taxa (above) together with two other ‘moderately sensitive’ taxa and two other ‘tolerant’ taxa. An additional two taxa characterised the community on this occasion, the ‘highly sensitive’ caddisfly (Helicopsyche) and the moderately sensitive caddisfly (Pycnocentria). The summer, 2016 community was characterised by one fewer taxon; five of the taxa dominant in spring, with one additional ‘tolerant’ taxon and one additional ‘moderately sensitive’ taxon. However, few changes in overall abundances within both ‘sensitive’ and ‘tolerant ‘dominant taxa resulted in a minimal change in the seasonal SQMCIs scores of 0.3 unit (Table 173 and Table 174). The four taxa which were recorded as very/extremely abundant during spring and/or summer had characterised this site’s communities on 33% to 100% of past survey occasions (Table 111).
Predicted stream ‘health’ 3.2.23.1.3The Waiokura Stream rises below the National Park boundary and the site at Skeet Road is in the mid-reaches at an altitude of 150 m asl. The REC predicted MCI value (Leathwick, et al. 2009) was 97 units. The spring score was a significant 11 units higher, while the summer score and historical median were an insignificant two units higher (Stark, 1998).
Temporal trends in 2002 to 2016 data 3.2.23.1.4A LOWESS trend plot with a moving average (tension 0.4) trendline was produced (Figure 157). A non-parametric statistical trend analysis of the MCI data using the Mann-Kendall test was then performed on 15 years of SEM results (2002-2016) from the site in the Waiokura Stream at the site on Skeet Road. The MCI has been chosen as the preferable indicator of ‘stream/river health’ for SEM trend reporting purposes.
Figure 157 LOWESS trend plot of MCI data in the Waiokura Stream at the Skeet Road site
Since 2009 there has been relatively strong temporal improvement in MCI scores at this site, with a minor decrease since 2014. The trendline range of MCI scores (12 units) has bordered on ecological importance and increases in scores may have been related to improvements in farming practices and/or wastes disposal in the rural catchment between the stream’s seepage sources (below the National Park) and mid
N = 23 Kendall tau = +0.542 p level <0.001 FDR p < 0.001
229
reaches at Skeet Road, although the shorter duration and less frequent initial monitoring must be noted. Trendline MCI scores have been indicative of ‘fair’ generic stream health (Table 2) for the first seven years of the period improving to the ‘good’ health category over the most recent six years.
Temporal trends in 2006 to 2016 data 3.2.23.1.5A LOWESS trend plot with a moving average (tension 0.4) trendline was produced (Figure 158). A non-parametric statistical trend analysis of the MCI data using the Mann-Kendall test was not performed on the most recent ten years of SEM results (2006-2016) from the site in the Waiokura Stream at the site on Skeet Road as there were fewer than 20 surveys conducted during the ten year period.
Figure 158 LOWESS trend plot of MCI data in the Waiokura Stream at the Skeet Road site
The trendline showed was mostly positive during the ten year period congruent with the full dataset.
Manaia golf course site (WKR000700) 3.2.23.2 Taxa richness and MCI 3.2.23.2.1
Sixteen surveys have been undertaken at this more recently established lower reach site in the Waiokura Stream at Manaia between 2007 and February 2015. These results are summarised in Table 112 together with the results from the current period, and illustrated in Figure 159.
Table 112 Results of previous surveys performed at Waiokura Stream at Manaia golf course, together with spring 2015 and summer 2016 results
Site code
SEM data (2007 to Feb 2015) 2015-2016 surveys
No of surveys
Taxa numbers MCI values Oct 2015 Feb 2016
Range Median Range Median Taxa no MCI Taxa no MCI
WKR000700 16 16-27 23 92-109 99 23 97 20 95
WKR000500
2006 2008 2010 2012 2014 2016 2018Year
85
90
95
100
105
110
115
120
MC
I va
lue
N = 19

230
Figure 159 Numbers of taxa and MCI values in the Waiokura Stream at Manaia Golf course
A moderate range of richnesses (16 to 27 taxa) has been found, with a median richness of 23 taxa (more representative of typical richnesses for the lower reaches of ringplain streams rising outside the National Park boundary). During the 2015-2016 period spring (23 taxa) and summer (20 taxa) richnesses were relatively similar but up to three taxa fewer than this median richness. MCI values have had a narrow range (17 units) at this site partly due to the short duration of the monitoring period to date. The median value (99 units) has been slightly higher than typical of similar lower reach sites elsewhere on the ringplain (TRC, 2015a). The spring, 2015 (97 units) and summer, 2016 (95 units) scores were atypically similar with spring and summer scores respectively two and four units below the historical median score. These scores categorised this site as having ‘fair’ (spring and summer) health generically (Table 2). The historical median score (99 units) placed this site in the ‘fair’ category for generic health.
Community composition 3.2.23.2.2Characteristic macroinvertebrate taxa in the communities at this site for the relatively short monitoring period prior to the 2015-2016 surveys are listed in Table 113.
Table 113 Characteristic taxa [abundant (A), very abundant (VA), extremely abundant (XA)] recorded in the Waiokura Stream at the Manaia golf course, between 2007 and February 2015 [16 surveys], and by the spring 2015 and summer 2016 surveys
Taxa List MCI
score A VA XA Total %
Survey
Spring 2015
Summer 2016
NEMATODA Nematoda 3 1 1 6
ANNELIDA (WORMS) Oligochaeta 1 10 2 12 75 A A
MOLLUSCA Potamopyrgus 4 5 1 6 38
CRUSTACEA Paracalliope 5 1 1 6
EPHEMEROPTERA (MAYFLIES) Austroclima 7 1 12 3 16 100 VA VA
Coloburiscus 7 5 6 11 69
Deleatidium 8 1 1 6 A
Zephlebia group 7 5 9 2 16 100 VA VA
PLECOPTERA (STONEFLIES) Zelandobius 5 2 2 13 A
COLEOPTERA (BEETLES) Elmidae 6 2 12 2 16 100 VA A
0
10
20
30
40
50
60
70
0
20
40
60
80
100
120
140
No.
of t
axa
MCI
val
ue
SEM: Number of taxa and MCI values in the Waiokura Stream at Manaia Golf Course (WKR000700)
MCI value Median MCI to dateTaxa No Median no. of taxa to date

231
Taxa List MCI
score A VA XA Total %
Survey
Spring 2015
Summer 2016
MEGALOPTERA (DOBSONFLIES) Archichauliodes 7 13 13 81 A A
TRICHOPTERA (CADDISFLIES) Hydropsyche (Aoteapsyche) 4 3 8 2 13 81 A A
Hydrobiosis 5 1 1 6
Pycnocentria 7 1 1 6
Pycnocentrodes 5 2 1 3 19 A
Prior to the current 2015-2016 period, 15 taxa had characterised the community at this site on occasions. These have comprised one ‘highly sensitive’, ten ‘moderately sensitive’, and four ‘tolerant’ taxa i.e. a higher proportion of ‘sensitive’ taxa than might be expected in the lower reaches of a ringplain stream, but coincident with the riparian cover provided within the Manaia golf course reach. Predominant taxa have included five ‘moderately sensitive’ taxa [mayflies (Austroclima, Zephlebia group, and Coloburiscus), elmid beetles and dobsonfly (Archichauliodes)] and two ‘tolerant’ taxa [oligochaete worms and net-building caddisfly (Hydropsyche-Aoteapsyche)]. Eight of these historically characteristic taxa were dominant in the spring, 2015 community comprising six of the predominant taxa (above). The summer, 2016 community was characterised by six of the taxa dominant in spring, plus one additional ‘highly sensitive’ taxon (Table 113). Increased summer abundances of this ‘highly sensitive’ taxon in particular resulted in a small increase of 0.2 unit in seasonal SQMCIs scores which were relatively high (6.0 to 6.2 units) for the lower reaches of a ringplain seepage stream (TRC, 2015c) (Table 173 and Table 174). The three taxa which were recorded as very abundant during spring and/or summer had characterised this site’s communities on 100% of past surveys.
Predicted stream ‘health’ 3.2.23.2.3The Waiokura Stream rises below the National Park boundary and the site at the Manaia golf course is in the lower reaches at an altitude of 70 m asl. The median MCI score for a ringplain stream arising outside the National Park at similar altitude was 98 units (TRC, 2015c). The spring and summer scores were an insignificant one and three units lower respectively. The historical median for this site is an insignificant one unit higher than this median. The REC predicted MCI value for this site (Leathwick, et al. 2009) was 95 units. The spring and summer scores were an insignificant two units higher and equal to this value respectively. The historical median for this site is an insignificant four units higher than this predicted value.
Temporal trends in 2007 to 2016 data 3.2.23.2.4A LOWESS trend plot with a moving average (tension 0.4) trendline was produced (Figure 160). A non-parametric statistical trend analysis of the MCI data using the Mann-Kendall test was not performed on the most recent ten years of SEM results (2006-2016) from the site in the Waiokura Stream at Manaia golf course as there were fewer than ten years of data.

232
Figure 160 LOWESS trend plot of MCI data in the Waiokura Stream for the Manaia golf course
A similar temporal trend of improvement in MCI scores since 2009 to that found at the upstream site (at Skeet Road) was identified at this site at the Manaia golf course (although more stable since 2010) but the short duration of the data record must be noted at this stage. The relatively narrow LOWESS-smoothed range of scores (six units) has no ecological importance to date. The smoothed MCI scores which indicated ‘fair’ generic stream health (Table 1) for two years of the monitoring period, improved to ‘good’ stream health for about three years before returning to ‘fair’ stream health most recently.
Discussion 3.2.23.3Seasonal MCI values decreased (by nine units) at the mid-reach site and decreased (by two units) between spring and summer at the site in the lower reaches. These seasonal differences may be compared with the historical median seasonal summer decrease of four units at the Skeet Road site and no change between seasons at the Manaia Golf Course site (Appendix II). Seasonal communities shared only 58% (21 of the 36 taxa) found at the mid-reach site and 59% (16 of 27 taxa) at the downstream site in the lower reaches at Manaia. This does not indicate greater similarity in seasonal community composition in a downstream direction at the site within the riparian covered reaches, as has typically been the case in this stream. MCI score decreased by eleven units in spring and decreased by two units in summer in a downstream direction over the 9.7 km reach, between the more open farmland mid-reach site (Skeet Road) and the lower reach Manaia golf course site, despite some improvement in habitat provided by patches of riparian vegetation cover through the golf course. Community composition varied through the mid reach to lower reach length of the stream surveyed. A total of 32 taxa were recorded in spring of which only 19 taxa (59%) were present at both sites. These included no ‘highly sensitive’, 14 ‘moderately sensitive’, and five ‘tolerant’ taxa with only four ‘moderately sensitive’ and one ‘tolerant’ taxa abundant at both sites. The same total (32 taxa) was found along the stream’s surveyed length by the summer survey of which 17 taxa (53%) were present at both sites. They were generally similar to the widespread taxa in spring with the inclusion of one ‘highly sensitive’ taxon, a decrease in the number of ‘moderately sensitive’ taxa and a small increase in the number of ‘tolerant’ taxa. The same taxa
WKR000700
2007 2008 2009 2010 2011 2012 2013 2014 2015 2016Year
90
92
94
96
98
100
102
104
106
108
110
MC
I va
lue
233
were abundant at both sites in summer as in spring. Dissimilarities in spatial community structure along the surveyed length (mid to lower reaches) of the Waiokura Stream were typically slightly less pronounced in spring than in summer.
Tangahoe River 3.2.24Three sites in this eastern hill country river were included in the SEM programme in 2007 for the purpose of monitoring long-term land use changes (afforestation) particularly in the upper-mid catchment. The Fonterra, Hawera dairy factory abstracts water from the river in the lower catchment for processing purposes. Two of the three sites are in the upper to mid, shallow gradient, reaches of the river (the upstream site within 4 km of the headwaters) with the third site in the lower reaches, some 4 km from the coast. The results of the 2015–2016 spring and summer surveys are presented in Table 175 and Table 176, Appendix I.
Upper Tangahoe Valley Road site (TNH000090) 3.2.24.1 Taxa richness and MCI 3.2.24.1.1
Fourteen surveys have been undertaken at this upper reach site in the Tangahoe River between December 2007 and February 2015. These results are summarised in Table 114, together with the results from the current period, and illustrated in Figure
161.
Table 114 Results of previous surveys performed in the Tangahoe River at upper Tangahoe Valley Road, together with spring 2015 and summer 2016 results
Site code
SEM data (2007 to Feb 2015) 2015-2016 surveys
No of surveys
Taxa numbers MCI values Oct 2015 Mar 2016
Range Median Range Median Taxa no MCI Taxa no MCI
TNH000090 16 17-31 24 90-107 98 14 104 22 104
Figure 161 Numbers of taxa and MCI values in the Tangahoe River at Upper Tangahoe
Valley Road
A relatively wide range of richnesses (17 to 31 taxa) has been found with a moderate median richness of 24 taxa (lower than richnesses which might be anticipated toward the upper reaches of hill country rivers) but higher than the median richness (20 taxa)
234
for sites at this relatively low altitude (85 m asl) (TRC, 2015c). During the 2015-2016 period, spring (14 taxa) taxa richness was significantly lower than the historic median and the lowest recorded taxa richness at the site to date by three taxa. Summer (22 taxa) richness was only two taxa less than the median richness of 24 taxa. MCI values have had a relatively narrow range (17 units) at this site, typical of scores at sites toward the upper reaches of streams and rivers. However, the median value (98 units) has been more typical of mid reach sites elsewhere and five units above the median score recorded by 59 previous surveys at ‘control’ sites located at similar altitudes (to the upper Tangahoe Valley Road site) in hill country rivers and streams (TRC, 2015c). The spring 2015 (104 units) and summer 2016 (104 units) scores were six units higher than the historical median score. These scores categorised this site as having ‘good’ health (spring and summer) generically (Table 2). The historical median score (98 units) placed this site in the ‘fair’ category for the generic method of assessment.
Community composition 3.2.24.1.2Characteristic macroinvertebrate taxa in the communities at this site prior to the 2015-2016 period are listed in Table 115.
Table 115 Characteristic taxa (abundant, very abundant, extremely abundant) recorded in the Tangahoe River at upper Tangahoe Valley Road between 2007 and February 2015 [16 surveys], and by the spring 2015 and summer 2016 surveys
Taxa List MCI score
A VA XA Total %
Survey
Spring 2015
Summer 2016
ANNELIDA (WORMS) Oligochaeta 1 8 8 50
MOLLUSCA Potamopyrgus 4 2 6 6 14 88 VA
EPHEMEROPTERA (MAYFLIES) Austroclima 7 11 5 16 100 A
Deleatidium 8 2 5 7 14 88 A A
Zephlebia group 7 5 3 8 50 A
PLECOPTERA (STONEFLIES) Megaleptoperla 9 3 3 19
COLEOPTERA (BEETLES) Elmidae 6 6 8 1 15 94 VA
MEGALOPTERA (DOBSONFLIES) Archichauliodes 7 3 3 19
TRICHOPTERA (CADDISFLIES) Hydropsyche (Aoteapsyche) 4 3 3 19
Hydrobiosis 5 3 3 19
DIPTERA (TRUE FLIES) Orthocladiinae 2 3 3 19
Austrosimulium 3 7 4 1 12 75 A
Prior to the current 2015-2016 period, 12 taxa have characterised the community at this site on occasions. These have comprised two ‘highly sensitive’, five ‘moderately sensitive’, and five ‘tolerant’ taxa i.e. a higher proportion of ‘tolerant’ taxa than would be expected toward the upper reaches of hill-country river, reflecting the relatively flat gradient of this river to this site. Predominant taxa have included one ‘highly sensitive’ taxon (mayfly (Deleatidium)); two ‘moderately sensitive’ taxa [mayfly (Austroclima) and elmid beetles]; and three ‘tolerant’ taxa [snail (Potamopyrgus), oligochaete worms, and sandfly (Austrosimulium)]. The spring 2015 community consisted of only one historically characteristic taxon, the ‘highly sensitive’ mayfly Deleatidium, which was also present in the summer 2016 survey. The summer 2016 community consisted of six historically characteristic taxa comprising one ‘highly sensitive’, three ‘moderately sensitive’ and two ‘tolerant’ taxa

235
(Table 115). The significant seasonal differences in characteristic taxa which saw a numerical increase in characteristic ‘moderately sensitive’ and ‘tolerant’ taxa resulted in a significant decrease in SQMCIs score between spring and summer surveys by 1.4 units (Table 175 and Table 176). The two taxa recorded as very abundant during spring and/or summer had characterised this site’s communities on 88% to 94% of past survey occasions.
Predicted stream ‘health’ 3.2.24.1.3The Tangahoe River site at upper Tangahoe Valley Road, at an altitude of 85 m asl, is toward the upper reaches of this low gradient river draining an eastern hill country catchment. The relationship for ringplain streams and river developed between MCI and altitude (Stark and Fowles, 2009) is therefore not appropriate for this river. The median value for an Eastern hill country streams (TRC, 2015c) at a similar altitude was 93 units. The spring and summer scores were significantly higher than this value and the historic median was not significantly different. The REC predicted MCI value (Leathwick, et al. 2009) was 110 units and therefore the spring and summer scores were not significantly different but the historical medians were significantly lower (Stark, 1998).
Temporal trends in 2007 to 2016 data 3.2.24.1.4A LOWESS trend plot with a moving average (tension 0.4) was produced (Figure
162). A non-parametric statistical trend analysis of the MCI data using the Mann-Kendall test was not performed on the SEM results (2007-2016) from the site in the Tangahoe River at upper Tangahoe Valley Road due to the relatively short duration of the data record (i.e. less than ten years).
Figure 162 LOWESS trend plot of MCI data in the
Tangahoe River for the upper Tangahoe Valley site
Some temporal trend of improvement in MCI scores may be interpreted for this hill country catchment site toward the upper reaches, but its significance cannot be fully evaluated due to the relatively short monitoring period to date. The range of smoothed MCI scores (eight units) has limited ecological importance to date but cannot be fully assessed until the monitoring period is of sufficient duration.

236
Smoothed MCI scores indicated ‘fair’ health from 2007-2013 before improving to ‘good’ health (Table 2) for the last nine years (Figure 161).
Tangahoe Valley Road bridge site (TNH000200) 3.2.24.2 Taxa richness and MCI 3.2.24.2.1
Fourteen surveys have been undertaken at this mid reach site in the Tangahoe River between December 2007 and February 2015. These results are summarised in Table
116, together with the results from the current period, and illustrated in Figure 163.
Table 116 Results of previous surveys performed in the Tangahoe River at Tangahoe Valley Road bridge, together with spring 2015 and summer 2016 results
Site code
SEM data (2007 to Feb 2015) 2015-2016 surveys
No of surveys
Taxa numbers MCI values Oct 2015 Mar 2016
Range Median Range Median Taxa no MCI Taxa no MCI
TNH000200 16 20-33 25 92-108 104 25 98 24 94
Figure 163 Numbers of taxa and MCI values in the Tangahoe River at Tangahoe Valley Road bridge
A moderate range of richnesses (20 to 33 taxa) has been found with a relatively good median richness of 25 taxa (typical of richnesses in the mid-reaches of hill country rivers). During the 2015-2016 period, spring richness (25 taxa) was equivalent with the median, while summer richness (24 taxa) was only one taxon below the spring score and the historic median. MCI values have had a moderate range (16 units) at this site, typical of a site in the mid-reaches of hill country streams and rivers. The median value (104 units) has also been typical of mid-reach sites elsewhere and two units above the median score recorded by 26 previous surveys at ‘control’ sites located at similar altitudes in eastern hill country rivers and streams (TRC, 2015c). The spring 2015 (98 units) and summer 2016 (94 units) scores were not significantly different from each other or to the historic median (104 units). These scores categorised this site as having ‘fair’ health generically (Table 2). The historical median score (104 units) placed this site in the ‘good’ category for the generic assessment of health.

237
Community composition 3.2.24.2.2Characteristic macroinvertebrate taxa in the communities at this site prior to the 2015-2016 period are listed in Table 117. Table 117 Characteristic taxa (abundant, very abundant, extremely abundant) recorded in the
Tangahoe River at Tangahoe Valley Road bridge between 2007 and February 2015 [16 surveys], and by the spring 2015 and summer 2016 surveys
Taxa List MCI score
A VA XA Total %
Survey
Spring 2015
Summer 2016
ANNELIDA (WORMS) Oligochaeta 1 1 1 2 13 A
MOLLUSCA Potamopyrgus 4 6 3 9 56 XA
EPHEMEROPTERA (MAYFLIES) Austroclima 7 4 11 1 16 100 A
Coloburiscus 7 5 1 6 38
Deleatidium 8 4 10 14 88 VA
Rallidens 9 1 1 6
Zephlebia group 7 7 3 10 63 A
PLECOPTERA (STONEFLIES) Acroperla 5 3 3 19
Zelandobius 5 6 1 7 44
COLEOPTERA (BEETLES) Elmidae 6 4 11 1 16 100 VA A
MEGALOPTERA (DOBSONFLIES) Archichauliodes 7 4 4 25
TRICHOPTERA (CADDISFLIES) Hydropsyche (Aoteapsyche) 4 6 6 1 13 81 A
Hydrobiosis 5 6 6 38
Oxyethira 2 1 1 2 13
Pycnocentrodes 5 1 1 6
DIPTERA (TRUE FLIES) Aphrophila 5 7 2 9 56
Orthocladiinae 2 8 1 9 56
Tanytarsini 3 4 2 6 38 A
Austrosimulium 3 4 1 5 31
Prior to the current 2015-2016 period, 19 taxa have characterised the community at this site on occasions. These have comprised two ‘highly sensitive’, ten ‘moderately sensitive’, and seven ‘tolerant’ taxa i.e. a relatively high proportion of ‘sensitive’ taxa as would be expected in the mid-reaches of a hill-country river. Predominant taxa have included one ‘highly sensitive’ taxon [mayfly (Deleatidium)]; four ‘moderately sensitive’ taxa [mayflies (Austroclima and Zephlebia group), elmid beetles, and cranefly (Aphrophila)]; and three ‘tolerant’ taxa [snail (Potamopyrgus), net-building caddisfly (Hydropsyche-Aoteapsyche), and orthoclad midges]. The spring 2015 community consisted of two historically characteristic taxa comprising one ‘highly sensitive’ taxon and one ‘moderately sensitive’ taxon. The summer 2016 community consisted of seven historically characteristic taxa comprising three ‘moderately sensitive’ and four ‘tolerant’ taxa (Table 117). An increase in summer numerical abundances within ‘tolerant’ taxa and decreased abundance within the one ‘highly sensitive’ taxon and one ‘moderately sensitive’ taxon principally were responsible for the decrease of 2.2 units in seasonal SQMCIs scores (Tables 172 and 173). The four taxa recorded as very abundant during spring and/or summer had characterised this site’s communities on 56% to 100% of the past survey occasions.
Predicted stream ‘health’ 3.2.24.2.3The Tangahoe River site at Tangahoe Valley Road bridge, at an altitude of 65 m asl, is in the mid reaches of a river draining a hill country catchment. A relationship for

238
ringplain streams and river developed between MCI and altitude (Stark and Fowles, 2009) is therefore not appropriate for this river. The median value for an Eastern hill country streams (TRC, 2015c) at a similar altitude was 93 units. The spring and summer scores were significantly higher than this value and the historic median was not significantly different. The REC predicted MCI value (Leathwick, et al. 2009) was 110 units and therefore the spring and summer scores were not significantly different but the historical medians were significantly lower (Stark, 1998).
Temporal trends in 2007 to 2015 data 3.2.24.2.4A LOWESS trend plot with a moving average (tension 0.4) was produced (Figure
163). A non-parametric statistical trend analysis of the MCI data using the Mann-Kendall test was not performed on the SEM results (2007-2016) from the site in the Tangahoe River at the Tangahoe Valley Road bridge site due to the relatively short duration of the data record (i.e. less than ten years).
Figure 164 LOWESS trend plot of MCI data in the
Tangahoe River for the Tangahoe Valley Road bridge site
There was an overall decrease in MCI scores for this mid river reach, hill country catchment site but no statistical significance can be assessed due to the relatively short monitoring period to date. The range of smoothed MCI scores (seven units) over the period has limited ecological importance, but cannot be fully assessed until the monitoring period is of sufficient duration. Smoothed MCI scores have indicated ‘good’ generic river health for the majority of the period with the last survey results causing the trend line to decline to ‘fair’ health (Table 2).
Site downstream of railbridge (TNH000515) 3.2.24.3 Taxa richness and MCI 3.2.24.3.1
Seventeen surveys have been undertaken at this lower reach site in the Tangahoe River between August 1997 and February 2015 with fourteen of these surveys since 2007. These results are summarised in Table 118, together with the results from the current period, and illustrated in Figure 165.
TNH000200
2007 2008 2009 2010 2011 2012 2013 2014 2015 2016 2017Year
85
90
95
100
105
110
115
MC
I va
lue

239
Table 118 Results of previous surveys performed in the Tangahoe River d/s of railbridge, together with spring 2015 and summer 2016 results
Site code
SEM data ( 1997 to Feb 2015) 2015-2016 surveys
No of surveys
Taxa numbers MCI values Oct 2015 Mar 2016
Range Median Range Median Taxa no MCI Taxa no MCI
TNH000515 15 13-26 19 84-104 95 14 94 20 78
Figure 165 Numbers of taxa and MCI values in the Tangahoe River downstream of the railbridge
A moderate range of richnesses (13 to 26 taxa) has been found with a slightly higher than typical median richness of 20 taxa for a site in the lower reaches of a hill country river (TRC, 2015c) During the 2015-2016 period, spring (14 taxa) taxa richness was lower than the summer (20 taxa) richness and the median richness coincident with very swift, high flows in spring. MCI values also have had a moderate range (20 units) at this site, narrower than typical of sites in the lower reaches of hill country streams and rivers. The median value (95 units) has been typical of lower reach sites elsewhere in the region but a significant 17 units higher than the median score (78 units) recorded by 230 previous surveys at ‘control’ sites located at similar altitudes (to this site) in hill country rivers and streams (TRC, 2015c). The spring 2015 (94 units) score was significantly higher than the summer 2016 (78 units) score and very similar to the historical median. The summer 2016 score was the lowest MCI score ever recorded at the site to date and six units below the previous lowest recorded MCI score which was coincident with earthworks immediately upstream of the site at the Fonterra surface water intake that were likely to have increased sediment loads within the river. These scores categorised this site as having ‘fair’ health (spring) and ‘poor’ health (summer) generically (Table 2). The historical median score (95 units) placed this site in the ’fair’ category for the generic method of assessment.
Community composition 3.2.24.3.2Characteristic macroinvertebrate taxa in the communities at this site prior to the 2015-2016 period are listed in Table 119.

240
Table 119 Characteristic taxa (abundant, very abundant, extremely abundant) recorded in the Tangahoe River d/s of the railbridge between 1995 and February 2015 [17 surveys], and by the spring 2015 and summer 2016 surveys
Taxa List MCI A VA XA Total
%
Survey
Spring 2015
Summer 2016
NEMERTEA Nemertea 3 1 1 6
ANNELIDA (WORMS) Oligochaeta 1 11 2 1 14 82
MOLLUSCA Latia 5 3 3 18
Potamopyrgus 4 5 3 1 9 53 VA
CRUSTACEA Paracalliope 5 1 1 6
EPHEMEROPTERA (MAYFLIES) Austroclima 7 3 3 18
Deleatidium 8 3 3 18
Zephlebia group 7 1 1 6
PLECOPTERA (STONEFLIES) Zelandobius 5 1 1 6
COLEOPTERA (BEETLES) Elmidae 6 5 8 3 16 94 A VA
TRICHOPTERA (CADDISFLIES) Hydropsyche (Aoteapsyche) 4 4 5 7 16 94 XA
Hydrobiosis 5 1 1 6
Pycnocentrodes 5 3 3 2 8 47 A
DIPTERA (TRUE FLIES) Aphrophila 5 6 6 35
Maoridiamesa 3 4 1 5 29
Orthocladiinae 2 6 6 2 14 82 A
Polypedilum 3 2 2 12
Tanytarsini 3 1 1 6 A
Austrosimulium 3 2 1 3 18
Prior to the current 2015-2016 period, a moderate number of taxa (19) have characterised the community at this site on occasions due in part to the short duration of monitoring at this site. These have comprised one ‘highly sensitive’, nine ‘moderately sensitive’, and nine ‘tolerant’ taxa i.e. a relatively high proportion of ‘tolerant’ taxa as would be expected in the lower reaches of a hill-country river. Predominant taxa have included one ‘moderately sensitive’ taxon [elmid beetles] and four ‘tolerant’ taxa [oligochaete worms, snail (Potamopyrgus), net-building caddisfly (Hydropsyche-Aoteapsyche), and orthoclad midges]. The spring 2015 community consisted of only one historically characteristic, ‘moderately sensitive’ taxon. The summer 2016 community consisted of six historically characteristic taxa comprising two ‘moderately sensitive’ and four ‘tolerant’ taxa. Only elmid beetles were dominant in both surveys (Table 119). Increased abundances within four ‘tolerant’ taxa resulted in a significant decrease of 1.0 unit in the summer SQMCIs score. The three taxa recorded as very or extremely abundant during spring and/or summer had characterised this site’s communities on 53% to 94% of the past surveys.
Predicted stream ‘health’ 3.2.24.3.3The Tangahoe River site downstream of the railbridge, at an altitude of 15 m asl, is in the lower reaches of a river draining a hill country catchment. The relationship for ringplain streams and river developed between MCI and altitude (Stark and Fowles, 2009) is therefore not appropriate for this river. The median value for an Eastern hill country streams (TRC, 2015c) at a similar altitude was 78 units. The spring and summer scores were significantly higher than this value and the historic median was not significantly different. The REC predicted MCI value (Leathwick, et al. 2009) was 95 units and therefore the spring and summer

241
scores were not significantly different but the historical medians were significantly lower (Stark, 1998).
Temporal trends in 2007 to 2016 data 3.2.24.3.4A LOWESS trend plot with a moving average (tension 0.4) was produced (Figure 166). A non-parametric statistical trend analysis of the MCI data using the Mann-Kendall test was not performed on the SEM results (2007-2016) from the site in the Tangahoe River downstream of the railbridge due to the relatively short duration of the data record (i.e. less than ten years).
Figure 166 LOWESS trend plot of MCI data for the Tangahoe River
site downstream of the railbridge
No apparent improvement in MCI scores has occurred for this lower river reach, hill country catchment site, largely due to the single, exceptional low MCI value recorded for the summer 2016 survey. The range of smoothed MCI scores (10 units) has bordered on ecologically important but this importance cannot be properly assessed until the monitoring period is of sufficient duration and frequency for valid interpretation. Smoothed MCI scores have indicated ‘fair’ generic river health (Table 2) over the period to date (Figure 166).
Discussion 3.2.24.4Seasonal MCI values showed no changed between spring and at the site toward the upper reaches (Upper Tangahoe Valley Road) where historical median seasonal values (Appendix II) have shown a summer increase of five units. At the Tangahoe Valley Road Bridge site there was a summer decrease of four units where no difference between historic seasonal medians has been found. At the railbridge site there was a large, significant decrease of 16 units in the lower reaches which was larger than the typical summer decrease in MCI score of nine units (Appendix II). Seasonal communities shared only eight of the 28 taxa (29%) found at the upper reach (Upper Tangahoe Valley Road) site, 18 of 31 taxa (58%) at the Tangahoe Valley Road Bridge site, and eight of 25 taxa (32%) at the furthest downstream site in the lower reaches (railbridge), indicative of high seasonal dissimilarity in seasonal community composition at the upper and lower sites.
TNH000515
1996 1998 2000 2002 2004 2006 2008 2010 2012 2014 2016 2018Year
76
78
80
82
84
86
88
90
92
94
96
98
100
102
104
106
MC
I va
lue

242
Community composition varied markedly through the upper reach to lower reach length of the river surveyed. A total of 30 taxa was recorded in spring of which only nine taxa (30%) were present at all three sites (Table 175) compared with the higher total of 39 taxa was found along the river’s length by the summer survey (Table 176) but of which only a very low four taxa (10%) were present at all three sites. These dissimilarities in spatial community structure along the surveyed length (upper reaches to lower reaches) of the Tangahoe River were far more pronounced in summer than in spring. - Using the long-term median SEM MCI scores for each site (Appendix II), there is normally no decrease, but rather an improvement in MCI scores between the upper reach (Upper Tangahoe Valley Road) and the mid-reach (Tangahoe Valley Road bridge) sites by six units. The decline between the mid-reach site and lower reach (railbridge) site has been nine units. The spring MCI scores typically showed a decrease of six units in a downstream direction over the 8.9 km reach between the upper and mid sites and total decrease of ten units between the upper and lower sites over a distance of 30.2 km (and decrease in elevation of 70 m). Summer MCI scores decreased overall between the upper and lower reach sites by a significant 26 units which was coincident with earthworks immediately upstream of the bottom site.
Whenuakura River 3.2.25One site in this river was included in the SEM programme in 2015 for the purpose of monitoring an additional site in the eastern hill country. The site is located in the lower reaches of the river at an altitude of approximately 20 m some ten km from the coast. The results of the 2015–2016 spring and summer surveys are presented in Table 177 and Table 178, Appendix I.
Whenuakura River at Nicholson Road site (WNR000450) 3.2.25.1 Taxa richness and MCI 3.2.25.1.1
This is the first two surveys undertaken at this lower reach site in the Whenuakura River. These results from the current period are presented in Table 120, and illustrated in Figure 167.
Table 120 Results of previous surveys performed in the Whenuakura River at Nicholson Road, together with spring 2015 and summer 2016 results
Site code
2015-2016 surveys
Oct 2015 Mar 2016
Taxa no MCI Taxa no MCI
WNR000450 17 89 18 81

243
Figure 167 Numbers of taxa and MCI values in the Tangahoe River at Upper Tangahoe
Valley Road
During the 2015-2016 period, spring (17 taxa) taxa richness was very similar to the summer (18 taxa) richness suggesting little seasonal variation at this site. MCI values have had a narrow range (eight units) at this site which was expected given only two surveys have been completed at the site. The median value (85 units) was slightly higher than was typical (78 units) of mid reach sites elsewhere as recorded by 230 previous surveys at ‘control’ sites located at similar altitudes in hill country rivers and streams (TRC, 2015c). The spring 2015 (89 units) and summer 2016 (81 units) scores were not significantly different from each other and categorised this site as having ‘fair’ health (spring and summer) generically (Table 2).
Community composition 3.2.25.1.2Characteristic macroinvertebrate taxa in the communities at this site prior to the 2015-2016 period are listed in Table 121.
Table 121 Characteristic taxa [abundant (A), very abundant (VA), extremely abundant (XA)] recorded in the Whenuakura River at Nicholson Road for the spring 2015 and summer 2016 surveys
Taxa List MCI
score A VA XA Total %
Survey
Spring 2015
Summer 2016
ANNELIDA (WORMS) Oligochaeta 1 1 1 50 A
MOLLUSCA Potamopyrgus 4 1 1 50 VA
CRUSTACEA Paracalliope 5 1 1 50 VA
EPHEMEROPTERA (MAYFLIES) Deleatidium 8 1 1 50 A
PLECOPTERA (STONEFLIES) Acroperla 5 1 1 50 A
COLEOPTERA (BEETLES) Elmidae 6 1 1 50 VA
TRICHOPTERA (CADDISFLIES) Hydropsyche (Aoteapsyche) 4 1 1 50 A
DIPTERA (TRUE FLIES) Orthocladiinae 2 1 1 50 VA
Tanytarsini 3 1 1 2 100 A VA
The spring 2015 community consisted of four characteristic taxa comprising one ‘highly sensitive’, one ‘moderately sensitive’ and two ‘tolerant’ taxa. The summer 2016 community consisted of six historically characteristic taxa comprising two ‘moderately sensitive’ and four ‘tolerant’ taxa. Only one characteristic taxon, the ‘tolerant’ midge Tanytarsini, was present during both surveys (Table 121). The significant seasonal differences in characteristic taxa which saw a numerical increase
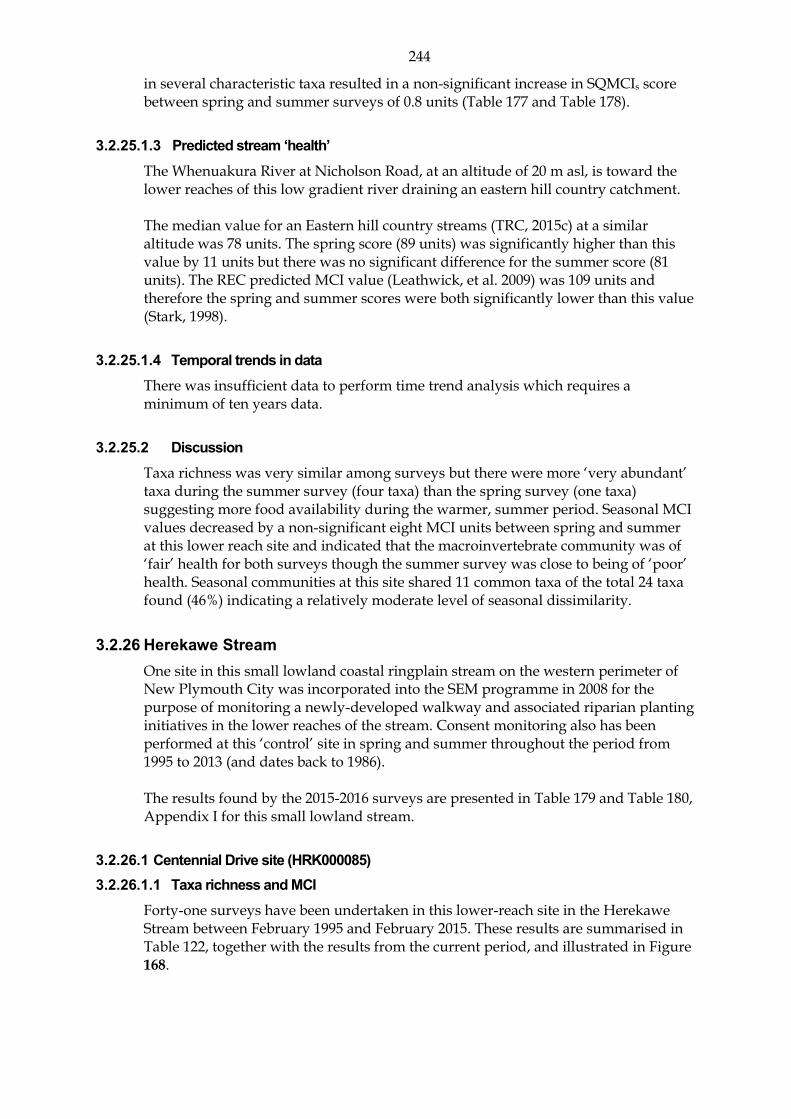
244
in several characteristic taxa resulted in a non-significant increase in SQMCIs score between spring and summer surveys of 0.8 units (Table 177 and Table 178).
Predicted stream ‘health’ 3.2.25.1.3The Whenuakura River at Nicholson Road, at an altitude of 20 m asl, is toward the lower reaches of this low gradient river draining an eastern hill country catchment. The median value for an Eastern hill country streams (TRC, 2015c) at a similar altitude was 78 units. The spring score (89 units) was significantly higher than this value by 11 units but there was no significant difference for the summer score (81 units). The REC predicted MCI value (Leathwick, et al. 2009) was 109 units and therefore the spring and summer scores were both significantly lower than this value (Stark, 1998).
Temporal trends in data 3.2.25.1.4There was insufficient data to perform time trend analysis which requires a minimum of ten years data.
Discussion 3.2.25.2Taxa richness was very similar among surveys but there were more ‘very abundant’ taxa during the summer survey (four taxa) than the spring survey (one taxa) suggesting more food availability during the warmer, summer period. Seasonal MCI values decreased by a non-significant eight MCI units between spring and summer at this lower reach site and indicated that the macroinvertebrate community was of ‘fair’ health for both surveys though the summer survey was close to being of ‘poor’ health. Seasonal communities at this site shared 11 common taxa of the total 24 taxa found (46%) indicating a relatively moderate level of seasonal dissimilarity.
Herekawe Stream 3.2.26One site in this small lowland coastal ringplain stream on the western perimeter of New Plymouth City was incorporated into the SEM programme in 2008 for the purpose of monitoring a newly-developed walkway and associated riparian planting initiatives in the lower reaches of the stream. Consent monitoring also has been performed at this ‘control’ site in spring and summer throughout the period from 1995 to 2013 (and dates back to 1986). The results found by the 2015-2016 surveys are presented in Table 179 and Table 180, Appendix I for this small lowland stream.
Centennial Drive site (HRK000085) 3.2.26.1 Taxa richness and MCI 3.2.26.1.1
Forty-one surveys have been undertaken in this lower-reach site in the Herekawe Stream between February 1995 and February 2015. These results are summarised in Table 122, together with the results from the current period, and illustrated in Figure 168.

245
Table 122 Results of previous surveys performed in Herekawe Stream at Centennial Drive, together with spring 2015 and summer 2016 results
Site code
SEM data ( 1998 to Feb 2015) 2015-2016 surveys
No of surveys
Taxa numbers MCI values Oct 2015 Mar 2016
Range Median Range Median Taxa no MCI Taxa no MCI
HRK000085 41 13-23 18 68-99 89 23 100 14 81
Figure 168 Numbers of taxa and MCI values in the Herekawe Stream upstream of
Centennial Drive
A moderate range of richnesses (13 to 23 taxa) had been found, with a median richness of 18 taxa (more representative of typical richnesses in small lowland coastal streams where a median richness of 17 taxa has been recorded from previous surveys of ‘control’ sites at similar altitudes (TRC, 2015c). During the 2015-2016 period, spring (23 taxa) and summer (14 taxa) richnesses were dissimilar and from five taxa higher and four taxa lower than the median richness for the site. MCI values have had a relatively wide range (31 units) at this site. The median value (89 units) is above scores typical of lower reach sites elsewhere in small lowland coastal streams. The spring 2015 (100 units) score was significantly higher (Stark, 1998) than the summer 2016 (81 units) score and the historical median. These scores categorised this site as having ‘good’ (spring) and ‘fair’ (summer) health generically (Table 2). The spring score was significantly higher and the summer score was insignificantly higher than the median MCI score (79 units) recorded by previous surveys of ‘control’ sites below 25 m asl in small, coastal, lowland streams in Taranaki (TRC, 2015c). The historical median score (89 units) placed this site in the ‘fair’ category for the generic method of assessment and was ten units higher than the median score recorded at similar sites elsewhere in small lowland coastal streams.
Community composition 3.2.26.1.2Characteristic macroinvertebrate taxa in the communities at this site prior to the 2015-2016 period are listed in Table 123.

246
Table 123 Characteristic taxa [abundant (A), very abundant (VA), extremely abundant (XA)] recorded in the Herekawe Stream at Centennial Drive between 1998 and February 2015 [41 surveys], and by the spring 2015 and summer 2016 surveys
Taxa List MCI
score A VA XA Total %
Survey
Spring 2015
Summer 2016
ANNELIDA (WORMS) Oligochaeta 1 23 4 2 29 71 A
MOLLUSCA Potamopyrgus 4 9 15 17 41 100 VA VA
CRUSTACEA Ostracoda 1 2 2 5
Paracalliope 5 18 9 8 35 85 A
EPHEMEROPTERA (MAYFLIES) Austroclima 7 2 2 5 A
Coloburiscus 7 5 5 12
PLECOPTERA (STONEFLIES) Acroperla 5 1 1 2
Megaleptoperla 9 1 1 2
COLEOPTERA (BEETLES) Elmidae 6 1 1 2
TRICHOPTERA (CADDISFLIES) Oxyethira 2 8 2 10 24 A
Triplectides 5 12 1 13 32
DIPTERA (TRUE FLIES) Aphrophila 5 2 2 5
Orthocladiinae 2 16 7 23 56 A
Austrosimulium 3 12 1 1 14 34
Prior to the current 2015-2016 period, 14 taxa had characterised the community at this site on occasions. These have comprised one ‘highly sensitive taxon, seven ‘moderately sensitive’ and six ‘tolerant’ taxa i.e. a relatively high proportion of ‘tolerant’ taxa as would be expected in the lower reaches of a small, lowland coastal stream. Predominant taxa have included only the one ‘moderately sensitive’ taxon [amphipod (Paracalliope)] and three ‘tolerant’ taxa [oligochaete worms, snail (Potamopyrgus), and orthoclad midges]. The spring 2015 community was characterised by only three taxa, one ‘moderately sensitive’ taxon and two ‘tolerant’ taxa. The summer 2016 community was characterised by four taxa, one ‘moderately sensitive’ taxon and three ‘tolerant’ taxa. This increase in tolerant taxa resulted in a decrease of 0.7 unit in SQMCIs score between the spring and summer surveys. Only one ‘tolerant’ taxon was recorded in both the spring and summer surveys. This same taxon was the only taxon to be recorded as very or extremely abundant during the spring and/or summer and had characterised the community on 100% of past surveys.
Predicted stream ‘health’ 3.2.26.1.3The Herekawe Stream rises as seepage near the coast on the ringplain and the site at Centennial Drive, Omata is in the lower reaches near the mouth at an altitude of 5 m asl. The median MCI score for a lowland coastal stream at similar altitude was 79 units (TRC, 2015c). The spring and summer scores were a significant 21 units and an insignificant two units higher than this median respectively. The historical median MCI was an insignificant 10 units higher than this median. The REC predicted MCI value (Leathwick, et al. 2009) was 89 units. The spring score was a significant 11 units higher, while the summer score and historical median were an insignificant eight units lower (Stark, 1998). This predictive value is equal to the historical median MCI score for this site.
247
N = 42 Kendall tau = +0.293 p level = 0.006 FDR p = 0.003
Temporal trends in 1995 to 2016 data 3.2.26.1.4A LOWESS trend plot with a moving average (tension 0.4) trendline was produced (Figure 169). A non-parametric statistical trend analysis of the MCI data using the Mann-Kendall test was not performed on 21 years of SEM results (1995-2016) from Herekawe Stream at Centennial Drive. The MCI has been chosen as the preferable indicator of ‘stream/river health’ for SEM trend reporting purposes.
Figure 169 LOWESS trend plot of MCI data in the
Herekawe Stream at the Centennial Drive site
The positive trend in MCI scores was significant (FDR p < 0.01) at this site in the lower reaches of the stream immediately downstream of the more recently constructed walkway. Trends have varied at this site over the 21 year period with a general trend of improvement since 2000 and particularly after 2008, with more recent stability, but with some wide variations in individual MCI scores. The trendline variation (12 units) suggested some ecologically important changes have occurred over the monitoring period. The trendline was indicative of ‘fair’ stream health until 2010, since when the trendline has indicated ‘good’ stream health.
Temporal trends in 2006 to 2016 data 3.2.26.1.5A LOWESS trend plot with a moving average (tension 0.4) trendline was produced (Figure 170). A non-parametric statistical trend analysis of the MCI data using the Mann-Kendall test was performed on the ten most recent years of SEM results (2006-2016) from Herekawe Stream at Centennial Drive.
HRK000085
1994 1996 1998 2000 2002 2004 2006 2008 2010 2012 2014 2016 2018Year
65
70
75
80
85
90
95
100
105
MC
I va
lue

248
N = 20 Kendall tau = +0.282 p level = 0.082 FDR p = 0.277
Figure 170 LOWESS trend plot of ten years of MCI data
in the Herekawe Stream at the Centennial Drive site
A positive non-significant trend in MCI scores has been found over the ten year period in contrast with the highly significant positive result found in the full dataset. The ten year dataset trend shows a small decrease followed by a slight increase from 2009 to 2012 but overall the trendline change was negligible. The trendline was indicative of ‘fair’ health (Table 2).
Discussion 3.2.26.2Seasonal MCI values atypically decreased between spring and summer at this lower reach site which may be compared with the identical median seasonal spring and summer values for the twenty year period (Appendix II). The percentage composition of ‘tolerant’ taxa typically increased (by 11%) in the summer community although periphyton substrate cover was similar. In contrast, the composition of available substrate changed significantly under lower flow, with much less cobble available for macroinvertebrate colonisation in the summer survey. However, seasonal communities at this site shared 14 common taxa (42% of the 26 taxa found at this site in 2015-2016), a relatively low percentage of common taxa.
HRK000085
2006 2008 2010 2012 2014 2016 2018Year
65
70
75
80
85
90
95
100
105
MC
I val
ue

249
General discussion and conclusions 4.The detection of trends in the biological data requires a data set of suitable period and collected using rigid, acceptable protocols, to be statistically valid e.g. a minimum of ten years of spring and summer surveys. With 21 years of data available for most sites, temporal trend analyses have been updated further within this report. For the first time, there has also been analysis presented of the results from the most recent 10 year period for each site where available. This represents a compromise between degree of certainty in any apparent trends, and an indication of current over historical directions of travel. Other comments in relation to the data collected in the period 1995 to 2016, are presented briefly below. These data are summarised in Appendix II and illustrated in Figures 121 to 127.
Macroinvertebrate fauna communities 4.1In general terms, data have indicated that the macroinvertebrate communities at sites in upper reaches of catchments have been comprised of a greater proportion of taxa that are ‘sensitive’ to the effects of organic pollution than proportions which comprised the sites’ communities in the mid and lower reaches of catchments. These changes in community composition have resulted from the effects of organic enrichment, higher temperatures, increased algal growth (a partial consequence of the former), lower in-stream velocities, and finer substrate (sedimentation), coincident with poorer physicochemical water quality in the lower reaches of streams and rivers. Taxa richnesses ( number of different taxa) at most sites in these streams and rivers more often showed higher richnesses in the upper reaches of catchments (with the exception of those affected by preceding headwater erosion events) but more seasonal variability in richnesses further downstream. Seasonal richnesses often have tended to be higher in summer than in spring, particularly at lower reach sites. Over the 21 year period, sites in the middle and the lower reaches of streams and rivers generally have had lower summer MCI scores than spring MCI scores as evidenced by overall decreases in median scores by four units, whereas median seasonal scores at upper reach sites have differed by only one unit on average. This difference has been coincident with summer warmer water temperatures and increased periphyton substrate cover, resulting in the loss of certain ‘sensitive’ taxa and/or increases in lower scoring ‘tolerant’ taxa combined with lifecycle patterns. Additionally, some taxa will also be present in spring as large nymphs but will not be recorded in summer samples as they will be at an egg or first instar (usually impossible to ID to genus) stage. Furthermore, the results from the 2015-2016 period have shown that:
- at all sites, spring MCI scores (median 104 units) were higher (by eight units) than summer scores (median 96 units)
- a t-test of spring and summer MCI scores (excluding the two new 2015-2016 sites) showed that there was no significant seasonal variation (N=57, t-value = 1.80, p = 0.40)
- at upper reach sites there was an increase in average MCI score of 3.5 units in summer which was not statistically significant ((N=7, t-value = -0.60, p = 0.61)
- at mid reach sites, a decrease in average MCI score of six units in summer was not significant ((N=23, t-value = 1.67, p = 0.57)

250
- at lower reach sites, a similar decrease in average MCI scores of eight units in summer was not significant ((N=24, t-value = 2.77, p = 0.07)
- at all sites (excluding the two new 2015-2016 sites), the spring 2015 average MCI score was five units higher than long term (21 year) average of spring median scores, but this difference was not significant ((N=57, t-value = -1.88, p = 0.72)
- at all sites (excluding the two new 2015-2016 sites), the summer 2016 average MCI score was the same as the long term (21 year) average of summer median scores, but this difference was not significant ((N=57, t-value = 0.01, p = 0.63)
There was a substantial 11 new maximum MCI site scores (by 1-5 units) recorded during the 2015-2016 period not counting the two new sites, as opposed to only three new maxima detected in the preceding 2014-2015 period. One decrease in historical minimum MCI site score (by 6 units) was recorded during the 2015-2016 period, the same as that recorded for the 2014-2015 period.
Spring surveys 4.1.1 Historical SEM 4.1.1.1Fifty-two of the 57 sites’ faunal communities’ spring 2015 MCI scores were either similar to (within five units), or better than, historical SEM medians for those sites with historical medians (Figure 171). Significantly higher scores were found at a small proportion (six) of mainly mid-reach sites, coincident with some of these sites having reduced periphyton cover in comparison with many past survey occasions. Two significantly lower scores were found at lower reach sites at the time of these spring surveys.

251
Figure 171 Spring 2015 MCI scores in relation to SEM historical median values
252
In summary, 86% of sites showed no significant detectable differences (Stark, 1998) between spring, 2015 MCI scores and historical median scores, while 10% of sites had significantly higher and 3% of sites had significantly lower spring 2015 MCI scores.
Predictive TRC ringplain altitude/distance models 4.1.1.2Predictive scores have been developed for ringplain sites with their sources inside the National Park in relation to altitude and distance from the National Park (Stark and Fowles, 2009). Spring scores have been assessed against predicted scores for altitude in Figure 172 and against predicted scores for distance in Figure 173.
Altitude 4.1.1.2.1Few (five) sites had spring MCI scores more than five units below predicted values (Figure 172), none of which was significantly lower than predicted. Six sites had spring scores very similar to (within 5 units) predicted scores while the remaining 27 sites’ scores were more than five MCI units above predicted scores. Of the latter, 17 sites had significantly higher MCI scores, a relatively typical proportion (45% of sites) found to date. In summary, 55% of sites showed no significant detectable difference (Stark, 1998) between spring 2015 scores and predicted altitude scores, while 45% of sites had significantly higher spring 2015 MCI scores.

253
Figure 172 Spring 2015 MCI scores in relation to predicted altitude scores
254
Distance from National Park 4.1.1.2.2Three sites had spring MCI scores more than five units below predicted values (Figure 173) with two of these sites significantly lower than predicted. These sites were in the Waimoku Stream at the coast (due to the very short distance between the source and the coast) and Waiwhakaiho River also at the coast. Sixteen sites had spring scores within five MCI units of predicted scores while 19 sites’ scores were more than five units higher than predicted, 13 of which were significantly higher (>10 units) than predicted.
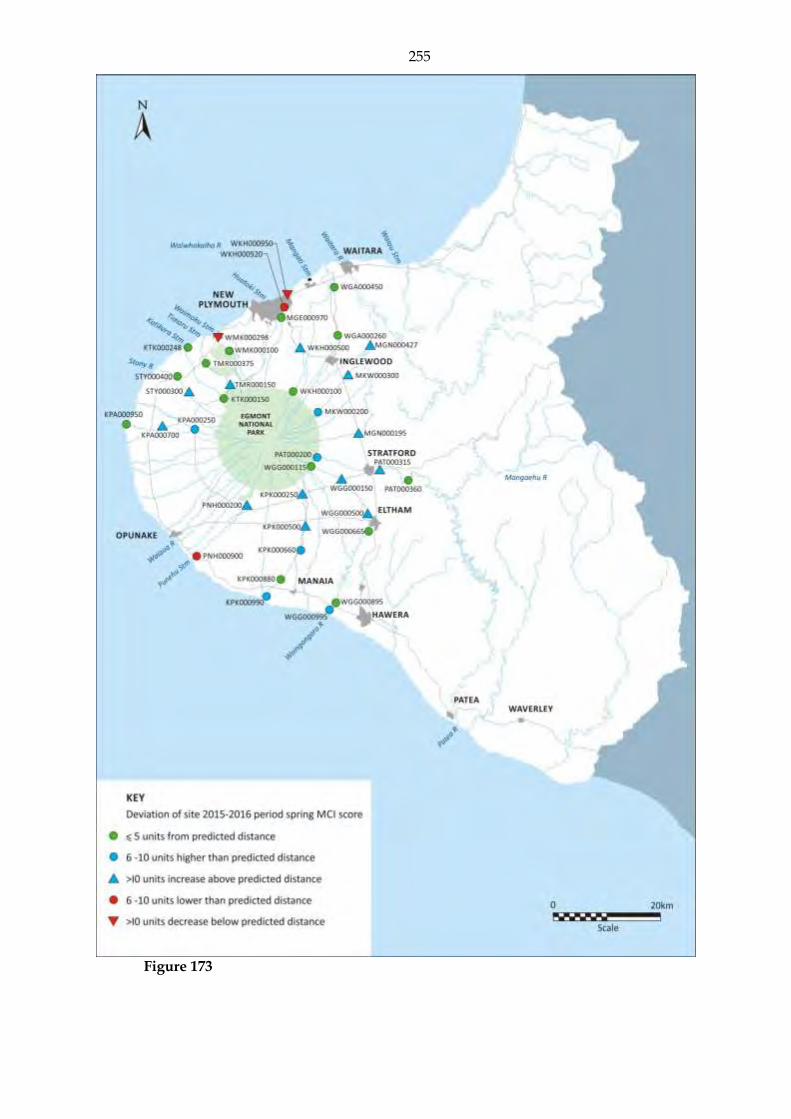
255
Figure 173

256
Figure 173 Spring 2015 MCI scores in relation to predicted downstream distance scores

257
In summary, 61% of sites showed no significant detectable difference (Stark, 1998) between spring 2015 scores and predicted distance (from the National Park) scores, while 34% of sites had significantly higher spring 2015 MCI scores and 5% of sites (two sites) had a significantly lower spring 2015 score.
Spring MCI scores in relation to the REC predictive score 4.1.1.2.3Leathwick (2009, pers comm.) has developed predictive scores based upon the River Environmental Classification (REC) system for New Zealand rivers and streams (Snelder et al, 2004). REC classifies and maps river and stream environments in a spatial framework for management purposes. It provides a context for inventories of river/stream resources and a spatial framework for effects assessment, policy development, developing monitoring programmes, and interpretations of state of the environment reporting. Spring MCI scores have been compared with the REC predictions for all 59 sites. REC predictions are calculated by averaging current MCI scores for a particular REC segment type as well as taking into account other additional environmental and physically factors (see Leathwick, 1998). Nineteen sites had spring MCI scores more than five units below predicted values (Figure ) with seven of these sites significantly lower than predicted. Twenty-three sites had spring scores within five MCI units of predicted scores while 17 sites’ scores were more than five units higher than predicted, four of which were significantly higher (> 10 units) than predicted.

258
Figure 174 Spring 2015 MCI scores in relation to REC predictive values

259
In summary, 80% of sites showed no significant detectable difference (Stark, 1998) between spring 2015 scores and predicted REC scores, while 8% of sites (four sites) had significantly higher spring 2015 MCI scores and 12% of sites (seven sites) had a significantly lower spring 2015 score.
Summer surveys 4.1.2 Historical SEM 4.1.2.1A majority (47 of 59 sites) of sites’ faunal communities’ MCI scores were similar to (within 10 units) historical SEM site median scores (Figure 175). Significantly higher scores were found at six sites, while only three sites showed significantly lower MCI scores dueing summer.

260
Figure 174 Summer 2016 MCI scores in relation to SEM historical median values
261
Significantly higher scores were found in the mid reaches of the Kapoaiaia (two sites), Timaru, Kurapete and Mangati Streams and the lower reaches of the Waiwhakaiho River coincident with improving water quality at the majority of those sites. The three significantly lower scores were found in the upper reaches of the Katikara Stream, mid reaches of the Kaupokonui River and lower reaches of the Tangahoe River. In summary, 85% of sites showed no significant detectable differences (Stark, 1998) between summer 2016 MCI scores and historical median scores, while 10% of sites had significantly higher summer 2016 scores and 5% of sites had significantly lower summer 2016 scores. The same number of sites (six sites) had significantly higher MCI scores (than historical medians) in spring and summer. In summer, 5% of sites (three sites) were six or more MCI units lower than historical medians compared to 3% (two sites) in spring. In summer 24% of sites’ scores were greater than five MCI units higher than historical medians compared to 39% of sites in spring, a relatively typical historical seasonal trend which should even out over time as median spring scores increase over time.
Predictive TRC ringplain altitude/distance models 4.1.2.2Summer scores for each ringplain site have been assessed against predicted scores (Stark and Fowles, 2009) for altitude (Error! Reference source not found. 176) and for distance from the National Park boundary for those ringplain sites with sources inside the inside the National Park (Figure 177)

262
Altitude 4.1.2.2.1
Figure 17576 Summer 2016 MCI scores in relation to predicted altitude scores

263
Three sites had summer MCI scores more than 5 units below predicted values, one of which (Waingongoro River below the Mangawhero Stream confluence) is downstream of the more recently diverted Eltham municipal wastewater point source discharge. This site and sites in the middle reaches of the Patea River below the WWTP discharge and Kaupokonui River below the WWTP discharge were the only sites significantly below predictive values. Twenty-six sites had scores very similar to (within 5 units) predicted scores (Figure 176), while sixteen sites’ scores were more than 5 MCI units above predicted scores for sites at equivalent altitudes. Nine sites had significantly higher MCI scores and these were situated in the upper reaches of the Waimoku and Timaru Streams; mid reaches of the Kaupokonui and Stony Rivers, and Waimoku, Maketawa and Timaru Streams and, in the lower reaches of the Waiwhakaiho and Stony Rivers. In summary, 68% of sites showed no significant detectable difference (Stark, 1998) between summer 2016 scores and predicted altitude scores, while 15% of sites had significantly higher summer MCI scores and 8% of sites had significantly lower summer MCI scores. A typically higher proportion of sites significantly exceeded the predictive scores in spring (34% more) compared to those in summer while there was a higher proportion of summer sites that were significantly lower than predictive scores in summer (8%) compared with spring sites (5%).
Distance from National Park 4.1.2.2.2Six sites (three more than in spring) had summer MCI score more than 5 units below predicted values (Figure 177) with three of these sites’ scores (in the mid reaches of the Kaupokonui River and in the lower reaches of the Punehu and Waimoku Streams) significantly lower than predicted. Seventeen sites had summer scores within 5 units of predicted scores, while 15 sites’ scores (four fewer sites than in spring) were more than 5 units higher than predicted. There were eight sites with summer scores significantly higher than predicted, five sites fewer than in spring. These sites were situated in the upper reaches of the Waingongoro and Patea Rivers and Timaru Stream; mid reaches of the Manganui and Waingongoro Rivers (two sites), and Kapoaiaia and Kaupokonui Streams. In summary, 71% of sites showed no significant detectable difference (Stark, 1998) between summer 2016 MCI scores and predicted distance (from National Park) scores, while 21% of sites had significantly higher summer scores and 8% of sites had significantly lower summer scores. A much higher proportion of sites’ scores significantly exceeded predictive spring scores (34%) than summer scores (21%) while a greater proportion of sites’ scores were significantly worse in summer (8%) than spring (5%)

264
Figure 176

265
Figure 17677 Summer 2016 MCI scores in relation to predicted downstream distance scores

266
Summer MCI scores in relation to REC predictive scores 4.1.2.2.3 Summer MCI scores have been compared with the REC predictions for all 59 sites. REC predictions are calculated by averaging current MCI scores for a particular REC segment type as well as taking into account other additional environmental and physically factors (see Leathwick, 1998). Twenty-eight sites had summer MCI scores more than five units below predicted values (Figure 178) with 17 of these sites significantly lower than predicted. Twenty-six sites had spring scores within five MCI units of predicted scores while four sites’ scores were more than five units higher than predicted, all of which were significantly higher (> 10 units) than predicted. Therefore, summer scores were far more likely to be significantly lower (29%) rather than significantly higher (7%) than predicted scores.
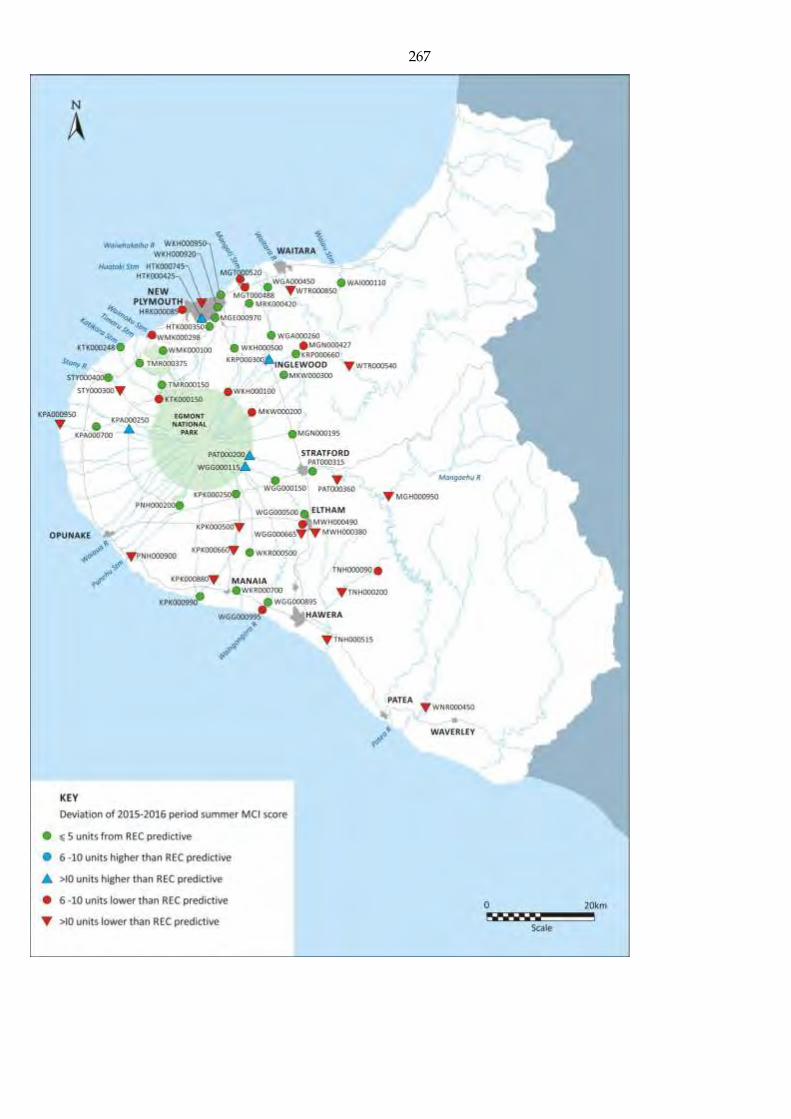
267

268
Figure 177
Figure 17778 Summer 2016 MCI scores in relation to REC predictive values
269
Comments The general seasonal trend in MCI scores is summarised in Table 124 which provides the percentages of sites’ scores in relation to predicted scores.
Table 124 Percentages of spring and summer MCI scores for ringplain sites with sources arising in the National Park in relation to Stark and Fowles (2009) predicted (altitude and distance from National Park) scores and REC scores (Lethwick, 1998)
Season Spring 2015 Summer 2016
Prediction > 10 units lower ± 10 units > 10 units higher > 10 units lower ± 10 units > 10 units higher
Altitude Distance
REC
0 5 12
55 58 80
45 34 8
8 8 29
68 71 63
24 21 7
In general, MCI scores were more likely to be significantly higher than predictive altitude and distance scores than significantly lower than predictive altitude and distance scores suggesting sites are improving since the altitude and distance predictive equations were created using data from 1981-2006. REC predictive scores showed the opposite trend with more sites being significantly lower than significantly higher than predictive scores though the majority were not significantly different (Stark, 1998) to predictive scores. There was noticeable seasonal variation with spring scores generally better than summer scores for all three indices.
General comments 4.1.2.2.4Sites in the lower reaches of shorter ringplain streams (e.g. Punehu, Kapoaiaia and, in particular the Waimoku Stream), have had historical median MCI scores showing the greatest disparity between actual and the predicted scores for altitude and distance from the National Park that are anticipated from such models (see Appendix II). These sites had wider ranges between the predicted altitude score and the predicted distance score (e.g. 31 units for the Waimoku Stream at Lucy’s Gully and at the coast, 12 units for the Punehu Stream at SH45, and 10 units for the Kapoaiaia Stream at Cape Egmont). Care needs to be used when comparing actual scores with predictive score as there is likely to be discrepancies as predictive values are not likely to be perfect and give only a general indication of what a site’s MCI score is likely to be. Consideration must therefore be given to selection of the most appropriate predictive score which should be applied to a site in each case, assessed against length of catchment and site location, as the models developed by Stark and Fowles, 2009 utilised the historical (1981 to 2006) macroinvertebrate ‘control’ sites database for the entire ringplain. The REC predictive scores which were calculated using a nationally dataset showed more deviation from actual scores, particularly when compared with summer scores. The MCI scores from the 21year duration (1995-2016) of the SEM programme to date have been summarised in Appendix II and the median scores for all sites used to assess any deviations from those scores predicted by each of the three variables where relationships have been established (i.e. ringplain altitude and distance from the National Park, and REC [national]). Those sites’ median MCI scores which deviated significantly (> 10 MCI units) from predicted scores are summarised in Table 125 and listed individually in Appendix II.
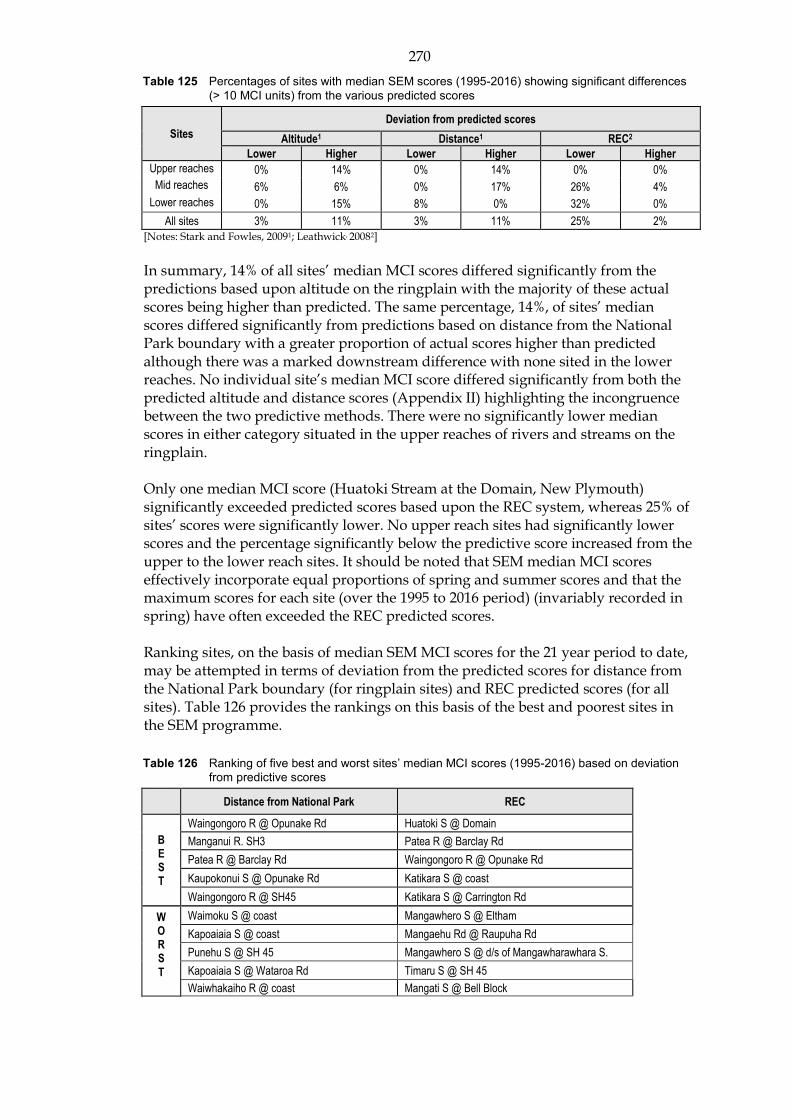
270
Table 125 Percentages of sites with median SEM scores (1995-2016) showing significant differences (> 10 MCI units) from the various predicted scores
Sites
Deviation from predicted scores
Altitude1 Distance1 REC2
Lower Higher Lower Higher Lower Higher
Upper reaches 0% 14% 0% 14% 0% 0%
Mid reaches 6% 6% 0% 17% 26% 4%
Lower reaches 0% 15% 8% 0% 32% 0%
All sites 3% 11% 3% 11% 25% 2%
[Notes: Stark and Fowles, 20091; Leathwick, 20082]
In summary, 14% of all sites’ median MCI scores differed significantly from the predictions based upon altitude on the ringplain with the majority of these actual scores being higher than predicted. The same percentage, 14%, of sites’ median scores differed significantly from predictions based on distance from the National Park boundary with a greater proportion of actual scores higher than predicted although there was a marked downstream difference with none sited in the lower reaches. No individual site’s median MCI score differed significantly from both the predicted altitude and distance scores (Appendix II) highlighting the incongruence between the two predictive methods. There were no significantly lower median scores in either category situated in the upper reaches of rivers and streams on the ringplain. Only one median MCI score (Huatoki Stream at the Domain, New Plymouth) significantly exceeded predicted scores based upon the REC system, whereas 25% of sites’ scores were significantly lower. No upper reach sites had significantly lower scores and the percentage significantly below the predictive score increased from the upper to the lower reach sites. It should be noted that SEM median MCI scores effectively incorporate equal proportions of spring and summer scores and that the maximum scores for each site (over the 1995 to 2016 period) (invariably recorded in spring) have often exceeded the REC predicted scores. Ranking sites, on the basis of median SEM MCI scores for the 21 year period to date, may be attempted in terms of deviation from the predicted scores for distance from the National Park boundary (for ringplain sites) and REC predicted scores (for all sites). Table 126 provides the rankings on this basis of the best and poorest sites in the SEM programme.
Table 126 Ranking of five best and worst sites’ median MCI scores (1995-2016) based on deviation from predictive scores
Distance from National Park REC
B E S T
Waingongoro R @ Opunake Rd Huatoki S @ Domain
Manganui R. SH3 Patea R @ Barclay Rd
Patea R @ Barclay Rd Waingongoro R @ Opunake Rd
Kaupokonui S @ Opunake Rd Katikara S @ coast
Waingongoro R @ SH45 Katikara S @ Carrington Rd
W O R S T
Waimoku S @ coast Mangawhero S @ Eltham
Kapoaiaia S @ coast Mangaehu Rd @ Raupuha Rd
Punehu S @ SH 45 Mangawhero S @ d/s of Mangawharawhara S.
Kapoaiaia S @ Wataroa Rd Timaru S @ SH 45
Waiwhakaiho R @ coast Mangati S @ Bell Block

271
The majority of the best ranked sites were located higher up the catchment. However, the Waingongoro River at SH45 was located in the lower reach close to the coast. The site had good riparian vegetation and swift flow which probably contributed to its better than predicted score. The Huatoki Stream in the Domain at New Plymouth has extensive riparian cover provided by the Domain constituting of intact native bush, but is excluded from the distance ranking as this stream is sourced outside of the National Park. The majority of the poorest ranked streams were located in the lower reaches of catchments with the Kapoaiaia Stream (with very limited riparian cover) notable for its poor ranking at two sites. The Mangaehu River and the two small, non-ringplain sourced streams (Mangati and Mangawhero), which used to receive significant point source discharges rank poorly in terms of the REC predictions. (Note: these streams and river sites were excluded from the distance predictive rankings as these catchments are located well away from the National Park).
Stream ‘health’ categorisation 4.1.3A gradation of biological water quality conditions based upon ranges of MCI scores has been used to determine the ‘health’ generically (Table 2) of each site by utilising the median score from the 21 year period (1995-2016). These assessments are summarised in Appendix II and illustrated in Table 180. The ‘health’ of streams in relation to the location of sites (upper, middle and lower reaches) in catchments is summarised in Table 127.

272
Figure 17879 Generic biological ‘health’ (based on median MCI) and trends in biological quality
for SEM sites, 1995 to 2016

273
Table 127 Stream ‘health’ site assessments according to catchment reach (in terms of median MCI score)
‘Health’ grading Reaches
Upper Middle Lower
Excellent Very good
0 7
0 4
0 0
Good 1 11 3 Fair 0 11 18 Poor 0 2 2
Very poor 0 0 0
Median ranges* (MCI units)
100-138 (38)
75-129 (54)
65-108 (43)
Typically generic ‘health’ (in terms of median MCI scores) decreases in a downstream direction from ‘very good’ in the upper reaches of catchments, through predominantly ‘good-fair’ in the middle reaches, to mainly ‘fair’ in the lower reaches toward the coast (Figure 178). Each site’s ‘health’ may vary between seasons, but seldom by no more than one category (grading) either side of this median grading in response to preceding stream flow and associated habitat (physical and physicochemical water quality) conditions. In this regard generally there has been a similar level of seasonal variability in scores between middle and lower catchment sites (on average both decrease by four MCI units from spring to summer). Upper catchment sites showed far less variability with on average only a one MCI unit decrease from spring to summer. However, there were also far less upper reach sites surveyed compared with middle or lower reach sites which limits the usefulness of direct comparisons examining total variability.
Comments 4.1.4The decreasing gradient of stream ‘health’, from ‘very good’ in the upper reaches of ringplain streams to ‘fair’ in the lower reaches, is indicative of a downstream change in macroinvertebrate communities towards those that are comprised of taxa more ‘tolerant’ of organic enrichment and/or physical habitat deterioration in the lower reaches. These communities have become well adapted to the cumulative impacts of upstream point source discharges and non-point source diffuse run-off and are particularly resistant to further impacts (other than toxic discharges). Therefore, in most lower reach communities significant improvement of water quality and habitat would have to occur before changes would be statistical and ecological significant. Thus, while maintenance of (‘fair’) stream ‘health’ occurs in the lower reaches of ringplain catchments (as these communities are very ‘tolerant’ of cumulative organic impacts), temporal trends of improvement in stream ‘health’ are unlikely to be statistically significant until appropriate management initiatives are substantially progressed on a catchment wide basis. Enhancement of stream health, particularly at these sites in the lower reaches of ringplain streams, is unlikely to be significant and/or important until marked improvements in habitat and water quality occur. These may be implemented for instance by way of a combination of riparian fencing/planting initiatives and re-direction of dairy pond treatment system discharges from direct disposal into surface waters to irrigation to land.

274
Macroinvertebrate fauna MCI trends 4.2Temporal trends measured over the monitoring period between 1995 and 2016 (Table 128, Figure 178, and Appendix II) indicated that 30 sites had significantly improving MCI scores (FDR p<5%) with 16 of those sites having highly significantly MCI scores (FDR p<1%) during the period. Only one site had a significantly deteriorating score. Six sites could not be trended due to the shorter duration of monitoring at these sites.
Table 128 Summary of Mann-Kendall test results for MCI scores trended over time (1995-2016) for 53 Taranaki streams/rivers (p with FDR applied) (significant p<0.05 and p<0.01)
Site code Site code N FDR p level +/- (ve) Significance Ecological importance
(Trendline MCI range)
STY000300 43 0.139 -ve Not significant 15
STY000400 43 0.992 -ve Not significant 16
TMR000150 40 0.383 +ve Not significant 9
TMR000375 40 <0.001 +ve Highly significant 18
MRK000420 40 <0.001 +ve Highly significant 16
WGA000260 41 0.049 +ve Significant 9
WGA000450 40 <0.001 +ve Highly significant 18
WKH000100 26 0.549 +ve Not significant 5
WKH000500 40 0.002 +ve Highly significant 14
WKH000920 41 0.697 +ve Not significant 11
WKH000950 39 0.640 +ve Not significant 12
MGE000970 26 0.202 -ve Not significant 11
MGN000195 42 0.581 -ve Not significant 9
MGN000427 40 0.287 +ve Not significant 7
MKW000200 31 0.728 -ve Not significant 12
MKW000300 30 0.004 +ve Highly significant 17
WTR000540 - - - - -
WTR000850 40 0.002 +ve Highly significant 18
MGT000488 41 0.383 +ve Not significant 9
MGT000520 41 <0.001 +ve Highly significant 24
WMK000100 32 0.932 +ve Not significant 4
WMK000298 32 0.004 +ve Highly significant 13
WAI000110 33 0.003 +ve Highly significant 11
PNH000200 40 0.004 +ve Highly significant 15
PNH000900 40 <0.001 +ve Highly significant 20
PAT000200 40 0.581 +ve Not significant 5
PAT000315 40 0.181 +ve Not significant 6
PAT000360 40 0.340 +ve Not significant 3
MGH000950 40 <0.001 +ve Highly significant 19
WGG000115 41 0.179 +ve Not significant 8
WGG000150 41 0.932 +ve Not significant 6
WGG000500 44 <0.001 +ve Highly significant 11
WGG000665 40 0.010 +ve Significant 12
WGG000895 41 0.304 +ve Not significant 5
WGG000995 40 0.010 +ve Significant 15
MWH000380 40 0.005 +ve Highly significant 6
MWH000490 40 <0.001 +ve Highly significant 17
HTK000350 38 <0.001 +ve Highly significant 15
HTK000425 38 <0.001 +ve Highly significant 10
HTK000745 38 0.802 -ve Not significant 11
KPK000250 33 0.342 +ve Not significant 7
KPK000500 36 0.002 +ve Highly significant 20
KPK000660 40 <0.001 +ve Highly significant 33
KPK000880 40 0.039 +ve Significant 15
KPK000990 22 0.030 +ve Significant 14
KTK000150 32 0.030 -ve Significant 15
KTK000248 31 0.803 +ve Not significant 18
KPA000250 32 <0.001 +ve Highly significant 30
KPA000700 32 <0.001 +ve Highly significant 30
KPA000950 32 0.125 +ve Not significant 13
KRP000300 41 <0.001 +ve Highly significant 19
KRP000660 41 <0.001 +ve Highly significant 17
WKR000500 23 <0.001 +ve Highly significant 12
WKR000700 - - - - 6
TNH000090 - - - - 8
TNH000200 - - - - 7
TNH000515 - - - - 10
WNR000450 - - - - -
HRK000085 40 0.013 +ve Significant 12
[Not significant = not statistically significant (ie p0.05), Significant = significant after FDR applied (at p < 0.05), Highly significant = significant after FDR applied (at p < 0.01); -ve = negative trend, +ve = positive trend]

275
Each of these site’s trends is discussed more fully in the site section of the report. In general, all but one of the sites that had a significant trend exhibited a broad range of MCI scores across the moving average trendline over the 21 year SEM monitoring period which suggested trends which were ecologically significant. Those sites with the strongest positive improvement over the 21 year monitoring period, coupled with a large increase in MCI scores have been:
Kaupokonui Stream upstream of Fonterra, Kapuni factory
Mangaehu River at Raupuha Road
Punehu Stream at SH45
Kapoaiaia Stream at Wiremu Road
Mangawhero Stream upstream of Waingongoro River confluence
Kaupokonui Stream upstream of Kaponga WWTP
Kapoaiaia Stream at Wataroa Road
Mangati Stream at Bell Block
Timaru Stream at SH45
Huatoki Stream at Hadley Drive
Waiongana Stream at SH3
Mangaoraka Stream at Corbett Road
Kurapete Stream upstream of Inglewood WWTP
Waiwhakaiho River at SH 3
Waingongoro River at Stuart Road
Waingongoro River at SH45 Note that although three Waingongoro River sites [at Eltham (upstream of the two former major point source discharges) and downstream at Stuart Road and at Ohawe Beach] have shown highly significant positive trends (p<0.01), the sites downstream of these former point source discharges have shown the slightly greater ecological improvement.

276
Summary 5.The 2015-2016 period was the 21st year of the macroinvertebrate state of the environment monitoring (SEM) programme. Sampling was conducted between October to December 2015 for spring samples and February to March 2016 for summer samples. This report describes the macroinvertebrate communities at 59 sites established through the Taranaki region (TRC, 1995b). These include the additional riparian monitoring sites in the Katikara and Kapoaiaia Streams and the sites in the Maketawa Stream and Waiwhakaiho catchment with the two sites monitored for consent purposes in the Kurapete Stream also included. Sites in the Waiokura Stream and Tangahoe River were also added to the programme in the 2007-2008 period and a site in the lower Herekawe Stream in 2008-2009 (although this site has a lengthy historical consent monitoring record spanning the 1995 to 2008 period). In addition two new eastern hill country sites were added for this monitoring period in the middle reaches of the Waitara River and lower reaches of the Whenuakura River. Results are discussed in terms of macroinvertebrate community composition, richness and MCI scores, which are compared with prior SEM data, and stream ‘health’ is assessed using generic and predictive methodologies. Downstream spatial trends are also identified where possible, and results are discussed in relation to the historical Taranaki streams and river database (TRC 2006c and TRC 2015c) where applicable and also in relation to more recently established relationships between site altitude and distance from the National Park (Stark and Fowles, 2009) and the REC system (J Leathwick, pers comm.). Discussion of temporal trends over the 21 years of data collection is also provided for each site and causal assessments have been made where trends have been shown to be statistically significant and particularly where ecological importance has been high. Enhancement of stream ‘health’, particularly in the lower reaches of ringplain catchments (currently mainly in ‘fair’ condition), may not be expected to be significant and/or important until upstream initiatives (such as diversion to land irrigation of dairy shed wastes and riparian planting/fencing) are substantially implemented throughout catchments.
277
Recommendations from the 2014-2015 report 6.In the 2014-2015 report, it was recommended:- 1. THAT the freshwater biological macroinvertebrate fauna component of the SEM
programme be maintained in the 2015-2016 monitoring year by means of the same programme to that undertaken in 2014-2015 and expanded to include two additional sites (one in each of the lower reaches of the Waitara and Whenuakura Catchments) representative of large hill-country catchments;
2. THAT temporal trending of the macroinvertebrate faunal data continues to be
updated on an annual basis. These recommendations have been implemented in the 2015-2016 year under review and per this report.
Recommendations for 2016-2017 7.It is recommended for 2016-2017:-
1. THAT the freshwater biological macroinvertebrate fauna component of the SEM programme be maintained in the 2016-2017 monitoring year by means of the same programme to that undertaken in 2015-2016;
2. THAT temporal trending of the macroinvertebrate faunal data continues to be
updated on an annual basis.

278
Acknowledgements 8.The Job Manager for the programme was Darin Sutherland (Scientific Officer) who was the main author of this Annual Report. Statistical analyses were provided by Fiza Hafiz (Scientific Officer) with all field sample collection performed by Darin Sutherland and Bart Jansma (Scientific Officer). Macroinvertebrate sample processing was undertaken by Biosortid Ltd. (under contract to the Taranaki Regional Council) with quality control undertaken by Katie Blakemore. The report was checked for formatting by Haidie Burchell-Burger (Administration Officer) and some figures were produced with assistance from Chris Lambert (GIS Officer) and Kathryn Mischefski (Graphics Officer).

279
References 9.Biggs, BJF, 2000: New Zealand Periphyton Guideline: Detecting, Monitoring and
Managing Enrichment of Streams. Prepared for Ministry for the Environment. NIWA, Christchurch, New Zealand. 122 pp.
Biggs, BJF and Kilroy C, 2000: Stream Periphyton Monitoring Manual. Published for
Ministry for the Environment. NIWA, Christchurch, New Zealand. 228 pp. Collier, KJ; Winterbourn, MJ, 2000 (eds.): New Zealand stream invertebrates: ecology
and implications for management. NZ Limnological Society, Christchurch. 415pp.
Death, RG, 2000: Invertebrate-substratum relationships. In: Collier, KJ; Winterbourn,
MJ eds. New Zealand stream invertebrates: ecology and implications for management. New Zealand Limnological Society, Christchurch. Pp 157-178.
Fowles, CR, 2014: Baseline biomonitoring of lower reach sites in three intensive
dairying southwestern ring plain catchments (Heimama, Hiniwera, and Mangatawa Streams), surveyed January 2014. TRC Internal Report CF598.
Leathwick, J, Julian, K, and Smith, B. 2009: Predicted national-scale distributions of
freshwater macroinvertebrates in all New Zealand’s rivers and streams. NIWA Client Report HAM2009-042. 69pp.
Ryan, PA, 1991: Environmental effects of sediment on New Zealand streams, a review.
NZ Journal of Marine and Freshwater Research, Vol 25, 207-221. Snelder, T, Biggs, B, Weatherhead, M, 224: New Zealand River Environment
Classification User Guide. MfE publication. 145p. Stark, JD, 1985: A macroinvertebrate community index of water quality for stony
streams. Water and Soil Miscellaneous Publication No. 87. Stark, JD, 1998: SQMCI: a biotic index for freshwater macroinvertebrate coded
abundance data. New Zealand Journal of Marine and Freshwater Research 32(1): 55-66.
Stark, JD, 1999: An evaluation of Taranaki Regional Council’s SQMCI biomonitoring
index. Cawthron Report No. 472. 32pp. Stark, JD, 2003: The water quality and biological condition of the Maketawa catchment.
Cawthron Report No 742. 70pp. Stark, JD 2000; Boothroyd, IKG, 2000: Use of invertebrates in monitoring. In Collier KJ;
Winterbourn, MJ eds. New Zealand Stream Invertebrates: ecology and implications for management. NZ Limnological Society, Chch. Pp 344-373.
Stark, JD; Boothroyd, IKG; Harding, JS; Maxted JR; Scarsbrook, MR, 2001: Protocols for
sampling macroinvertebrates in wadeable streams. New Zealand
280
Macroinvertebrate Working Group Report No 1. Prepared for Ministry for the Environment. Sustainable Management Fund Project No 5103 57p.
Stark, JD and Fowles, CR, 2006: An approach to the evaluation of temporal trends in
Taranaki state of the environment macroinvertebrate data. Cawthron Institute Report No 1135. 88p.
Stark, JD and Fowles, CR, 2009: Relationships between MCI, site altitude, and distance
from source for Taranaki ring plain streams. Stark Environmental Report No 2009-01 47p.
Stark, JD and Fowles, CR, 2015: A re-appraisal of MCI tolerance values for
macroinvertebrates in Taranaki ringplain streams, Stark Environmental Report No 2015-03 38p.
Stark, JD and Maxted, JR, 2007: A user guide for the MCI. Cawthron Report No 1166. 56p. TCC, 1984. Freshwater biology. Taranaki ring plain water resources survey. Taranaki
Catchment Commission Report. 196p. TRC, 1994: Regional Policy Statement for Taranaki. Taranaki Regional Council. TRC, 1995a: Freshwater macroinvertebrate community data: a review of the results of
biomonitoring surveys undertaken between 1980 and 1995. TRC internal report. TRC, 1995b: Regional Monitoring Strategy for Taranaki Part II: Proposed State of the
Environment Monitoring Programme. TRC internal report. TRC, 1996a: State of the environment regional water quality monitoring network for
Taranaki. Biological sampling techniques for freshwater rivers and streams. TRC internal report.
TRC, 1996b: A brief statistical summary of Taranaki freshwater macroinvertebrate
surveys for the period January 1980 to July 1996. TRC internal report. TRC, 1996c: State of the Environment - Taranaki Region 1996. Taranaki Regional
Council. TRC, 1997a: State of the Environment Procedures Document. TRC internal report. TRC, 1997b: State of the Environment regional water quality monitoring network for
Taranaki. Biological sampling techniques for freshwater rivers and streams. TRC internal report.
TRC, 1997c: Annual SEM Report 1995-96 Fresh water biological monitoring
programme. Technical report 97-96. TRC, 1998: Freshwater biological monitoring programme. Annual SEM Report 1996-97.
Technical Report 97-100.

281
TRC, 1999: Freshwater biological monitoring programme. Annual SEM Report 1997-98. Technical Report 99-06.
TRC, 2000: Fresh water biological monitoring programme Annual SEM Report 1998-99.
Technical Report 99-90. TRC, 2001: Fresh water biological monitoring programme Annual SEM Report 1999-
2000, Technical Report 2000-40. TRC, 2002a: Fresh water biological monitoring programme Annual SEM Report 2000-
2001, Technical Report 2001-87. TRC, 2002b: Fresh water biological monitoring programme Annual SEM Report 2001-
2002, Technical Report 2002-46. TRC, 2003a: Taranaki – Our Place, Our Future, Report on the state of the environment
of the Taranaki region – 2003. TRC, 206pp. TRC, 2003b: Fresh water biological monitoring programme Annual SEM Report 2002-
2003, Technical Report 2003-18. TRC, 2004a: Fresh water biological monitoring programme Annual SEM Report 2003-
2004, Technical Report 2004-23. TRC, 2005: Fresh water biological monitoring programme Annual SEM Report 2004-
2005, Technical Report 2005-72. TRC, 2006a: Fresh water macroinvertebrate fauna biological monitoring programme
Annual SEM Report 2005-2006, Technical Report 2006-94. TRC, 2006b: An interpretation of the reasons for statistically significant temporal
trends in macroinvertebrate (MCI) SEM data in the Taranaki region 1995-2005. TRC Internal Report.
TRC, 2006c: A review of macroinvertebrate monitoring data for large hill country
catchments in the Taranaki region. TRC Internal Report. TRC, 2007a: Fresh water macroinvertebrate fauna biological monitoring programme
Annual SEM Report 2006-2007, Technical Report 2007-22. TRC, 2007b: Taranaki Regional Council freshwater biology methods manual Version 3.
TRC Internal Report. TRC, 2008: Fresh water macroinvertebrate fauna biological monitoring programme
Annual SEM Report 2007-2008, Technical Report 2008-75. TRC, 2009a: Fresh water macroinvertebrate fauna biological monitoring programme
Annual SEM Report: 2008–2009, Technical Report 2009-14. TRC, 2009b: Taranaki-Where We Stand. State of the environment report. TRC, 282 p.

282
TRC, 2010: Fresh water macroinvertebrate fauna biological monitoring programme Annual SEM Report: 2009–2010, Technical Report 2010-16.
TRC, 2011a: Fresh water macroinvertebrate fauna biological monitoring programme
Annual SEM Report: 2010–2011, Technical Report 2011-38. TRC, 2011b: Freshwater physicochemical programme. State of the Environment
Monitoring Annual Report 2010-2011. Technical Report 2011-47. TRC, 2012a: Fresh water macroinvertebrate fauna biological monitoring programme
Annual SEM Report: 2011–2012, Technical Report 2012-18. TRC, 2012b: Freshwater physicochemical programme. State of the Environment
Monitoring Annual Report 2011-2012. Technical Report 2012-27. TRC, 2013a: Fresh water macroinvertebrate fauna biological monitoring programme
Annual SEM Report: 2012–2013, Technical Report 2013-48. TRC, 2013b: Freshwater physicochemical programme. State of the Environment
Monitoring Annual Report 2012-2013. Technical Report 2013-49. TRC, 2014a: Freshwater physicochemical programme. State of the Environment
Monitoring Annual Report 2013-2014. Technical Report 2014-23. TRC, 2014b: Fresh water macroinvertebrate fauna biological monitoring programme
Annual SEM Report: 2013–2014, Technical Report 2014-28. TRC, 2015a: Fresh water macroinvertebrate fauna biological monitoring programme
Annual SEM Report: 2014–2015, Technical Report 2015-66. TRC, 2015b: Taranaki - as one. State of the environment report 2015 TRC, 267p. TRC, 2015c: Some statistics from the Taranaki Regional Council database (FWB) of
freshwater macroinvertebrate surveys performed during the period from January 1980 to 30 September 2015 (SEM reference report). TRC Technical Report 2014-105.
Wilcock RJ, Betteridge K, Shearman D, Fowles CR, Scarsbrook MR, Thorrold BS and
Costall D, 2009 : Riparian protection and on-farm best management practices for restoration of a lowland stream in an intensive dairy farming catchment: a case study. NZJ of Marine and Freshwater Research 43: 803-818.


Appendix I
Macroinvertebrate faunal 2015-2016 tables


Table 129 Macroinvertebrate fauna of the Stony River: spring SEM survey sampled on 8 December 2015
Taxa list Site Code MCI
score STY000300 STY000400
Sample Number FWB15359 FWB15360
EPHEMEROPTERA (MAYFLIES) Deleatidium 8 VA VA
PLECOPTERA (STONEFLIES) Megaleptoperla 9 R -
Zelandobius 5 - R
Zelandoperla 8 R R
COLEOPTERA (BEETLES) Elmidae 6 C C
TRICHOPTERA (CADDISFLIES) Costachorema 7 R R
Hydrobiosis 5 C C
Pycnocentrodes 5 - R
DIPTERA (TRUE FLIES) Eriopterini 5 C R
Orthocladiinae 2 R R
ACARINA (MITES) Acarina 5 - R
No of taxa 8 10
MCI 125 112
SQMCIs 7.6 7.6
EPT (taxa) 5 6
%EPT (taxa) 63 60
'Tolerant' taxa 'Moderately sensitive' taxa 'Highly sensitive' taxa
R = Rare C = Common A = Abundant VA = Very Abundant XA = Extremely Abundant

Table 130 Macroinvertebrate fauna of the Stony River: summer SEM survey sampled on 1 February 2016
Taxa list Site Code MCI
score
STY000300 STY000400
Sample Number FWB16012 FWB16013
ANNELIDA (WORMS) Oligochaeta 1 R -
EPHEMEROPTERA (MAYFLIES) Deleatidium 8 VA VA
PLECOPTERA (STONEFLIES) Zelandoperla 8 C R
COLEOPTERA (BEETLES) Elmidae 6 R R
TRICHOPTERA (CADDISFLIES) Hydropsyche (Aoteapsyche) 4 - R
Costachorema 7 C C
Hydrobiosis 5 - C
DIPTERA (TRUE FLIES) Eriopterini 5 R R
Hexatomini 5 R -
Orthocladiinae 2 C C
No of taxa 8 8
MCI 105 113
SQMCIs 7.6 7.5
EPT (taxa) 3 5
%EPT (taxa) 38 63
'Tolerant' taxa 'Moderately sensitive' taxa 'Highly sensitive' taxa
R = Rare C = Common A = Abundant VA = Very Abundant XA = Extremely Abundant

Table 131 Macroinvertebrate fauna of the Timaru Stream: spring SEM survey sampled on 8 December 2015
Taxa list Site Code MCI
score TMR000150 TMR000375
Sample Number FWB15361 FWB15362
NEMATODA Nematoda 3 - R
MOLLUSCA Potamopyrgus 4 - A
EPHEMEROPTERA (MAYFLIES) Acanthophlebia 9 R -
Ameletopsis 10 C -
Austroclima 7 - A
Coloburiscus 7 A A
Deleatidium 8 XA A
Neozephlebia 7 R -
Nesameletus 9 A C
Rallidens 9 - C
Zephlebia group 7 - R
PLECOPTERA (STONEFLIES) Austroperla 9 C R
Megaleptoperla 9 C -
Stenoperla 10 C -
Zelandobius 5 VA C
Zelandoperla 8 VA C
COLEOPTERA (BEETLES) Elmidae 6 A VA
Hydraenidae 8 - C
MEGALOPTERA (DOBSONFLIES) Archichauliodes 7 C A
TRICHOPTERA (CADDISFLIES) Hydropsyche (Aoteapsyche) 4 - VA
Costachorema 7 C A
Hydrobiosis 5 R A
Hydrobiosella 9 C -
Neurochorema 6 - C
Hydropsyche (Orthopsyche) 9 R -
Beraeoptera 8 - R
Confluens 5 - R
Helicopsyche 10 A -
Olinga 9 C R
Oxyethira 2 - R
Pycnocentria 7 - R
Pycnocentrodes 5 - A
Zelolessica 7 R -
DIPTERA (TRUE FLIES) Aphrophila 5 A A
Eriopterini 5 R R
Maoridiamesa 3 - A
Orthocladiinae 2 R C
Polypedilum 3 R R
Tanytarsini 3 - A
Empididae 3 - R
Austrosimulium 3 - A
No of taxa 24 32
MCI 146 114
SQMCIs 7.6 5.3
EPT (taxa) 18 18
%EPT (taxa) 75 56
'Tolerant' taxa 'Moderately sensitive' taxa 'Highly sensitive' taxa
R = Rare C = Common A = Abundant VA = Very Abundant XA = Extremely Abundant

Table 132 Macroinvertebrate fauna of the Timaru Stream: summer SEM survey sampled on
1 February 2016
Taxa list Site Code MCI
score TMR000150 TMR000375
Sample Number FWB16014 FWB16015
NEMATODA Nematoda 3 - R
ANNELIDA (WORMS) Oligochaeta 1 - R
MOLLUSCA Potamopyrgus 4 - A
EPHEMEROPTERA (MAYFLIES) Acanthophlebia 9 R -
Ameletopsis 10 A -
Austroclima 7 R A
Coloburiscus 7 A C
Deleatidium 8 XA R
Ichthybotus 8 - R
Nesameletus 9 A -
Rallidens 9 - C
Zephlebia group 7 R -
PLECOPTERA (STONEFLIES) Austroperla 9 C -
Megaleptoperla 9 R -
Stenoperla 10 C -
Taraperla 10 R -
Zelandobius 5 C -
Zelandoperla 8 A R
COLEOPTERA (BEETLES) Elmidae 6 C A
Hydraenidae 8 R -
MEGALOPTERA (DOBSONFLIES) Archichauliodes 7 C A
TRICHOPTERA (CADDISFLIES) Hydropsyche (Aoteapsyche) 4 - A
Costachorema 7 C -
Hydrobiosis 5 C C
Hydrobiosella 9 R -
Neurochorema 6 - A
Hydropsyche (Orthopsyche) 9 C -
Plectrocnemia 8 R -
Psilochorema 6 R -
Beraeoptera 8 C R
Helicopsyche 10 R -
Olinga 9 C R
Oxyethira 2 - C
Pycnocentrodes 5 - VA
DIPTERA (TRUE FLIES) Aphrophila 5 C A
Eriopterini 5 R R
Hexatomini 5 R -
Maoridiamesa 3 R C
Orthocladiinae 2 A C
Polypedilum 3 R -
Tanytarsini 3 - A
Empididae 3 - R
Austrosimulium 3 - C
ACARINA (MITES) Acarina 5 - R
No of taxa 31 26
MCI 144 105
SQMCIs 7.8 5.1
EPT (taxa) 22 12
%EPT (taxa) 71 46
'Tolerant' taxa 'Moderately sensitive' taxa 'Highly sensitive' taxa
R = Rare C = Common A = Abundant VA = Very Abundant XA = Extremely Abundant

Table 133 Macroinvertebrate fauna of the Mangaoraka Stream: spring SEM survey sampled on
15 October 2015
Taxa list Site Code MCI
score MRK000420
Sample Number FWB15299
ANNELIDA (WORMS) Oligochaeta 1 A
MOLLUSCA Potamopyrgus 4 A
EPHEMEROPTERA (MAYFLIES) Austroclima 7 A
Coloburiscus 7 R
Deleatidium 8 A
Zephlebia group 7 C
PLECOPTERA (STONEFLIES) Acroperla 5 R
Zelandobius 5 VA
COLEOPTERA (BEETLES) Elmidae 6 A
MEGALOPTERA (DOBSONFLIES) Archichauliodes 7 C
TRICHOPTERA (CADDISFLIES) Hydropsyche (Aoteapsyche) 4 C
Costachorema 7 C
Hydrobiosis 5 A
Neurochorema 6 R
Pycnocentria 7 C
Pycnocentrodes 5 R
DIPTERA (TRUE FLIES) Aphrophila 5 C
Maoridiamesa 3 A
Orthocladiinae 2 A
Polypedilum 3 R
Tanytarsini 3 R
Empididae 3 R
Ephydridae 4 R
Austrosimulium 3 C
ACARINA (MITES) Acarina 5 R
No of taxa 25
MCI 98
SQMCIs 4.8
EPT (taxa) 12
%EPT (taxa) 48
'Tolerant' taxa 'Moderately sensitive' taxa 'Highly sensitive' taxa
R = Rare C = Common A = Abundant VA = Very Abundant XA = Extremely Abundant
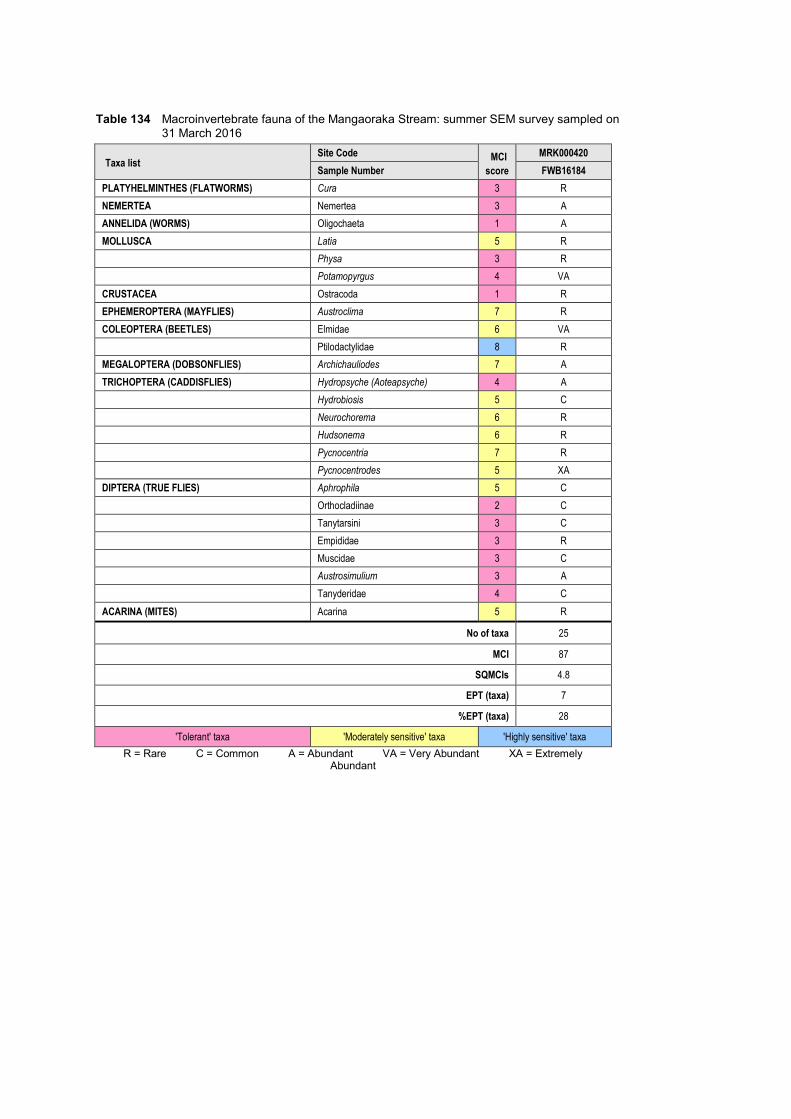
Table 134 Macroinvertebrate fauna of the Mangaoraka Stream: summer SEM survey sampled on
31 March 2016
Taxa list Site Code MCI
score MRK000420
Sample Number FWB16184
PLATYHELMINTHES (FLATWORMS) Cura 3 R
NEMERTEA Nemertea 3 A
ANNELIDA (WORMS) Oligochaeta 1 A
MOLLUSCA Latia 5 R
Physa 3 R
Potamopyrgus 4 VA
CRUSTACEA Ostracoda 1 R
EPHEMEROPTERA (MAYFLIES) Austroclima 7 R
COLEOPTERA (BEETLES) Elmidae 6 VA
Ptilodactylidae 8 R
MEGALOPTERA (DOBSONFLIES) Archichauliodes 7 A
TRICHOPTERA (CADDISFLIES) Hydropsyche (Aoteapsyche) 4 A
Hydrobiosis 5 C
Neurochorema 6 R
Hudsonema 6 R
Pycnocentria 7 R
Pycnocentrodes 5 XA
DIPTERA (TRUE FLIES) Aphrophila 5 C
Orthocladiinae 2 C
Tanytarsini 3 C
Empididae 3 R
Muscidae 3 C
Austrosimulium 3 A
Tanyderidae 4 C
ACARINA (MITES) Acarina 5 R
No of taxa 25
MCI 87
SQMCIs 4.8
EPT (taxa) 7
%EPT (taxa) 28
'Tolerant' taxa 'Moderately sensitive' taxa 'Highly sensitive' taxa
R = Rare C = Common A = Abundant VA = Very Abundant XA = Extremely Abundant
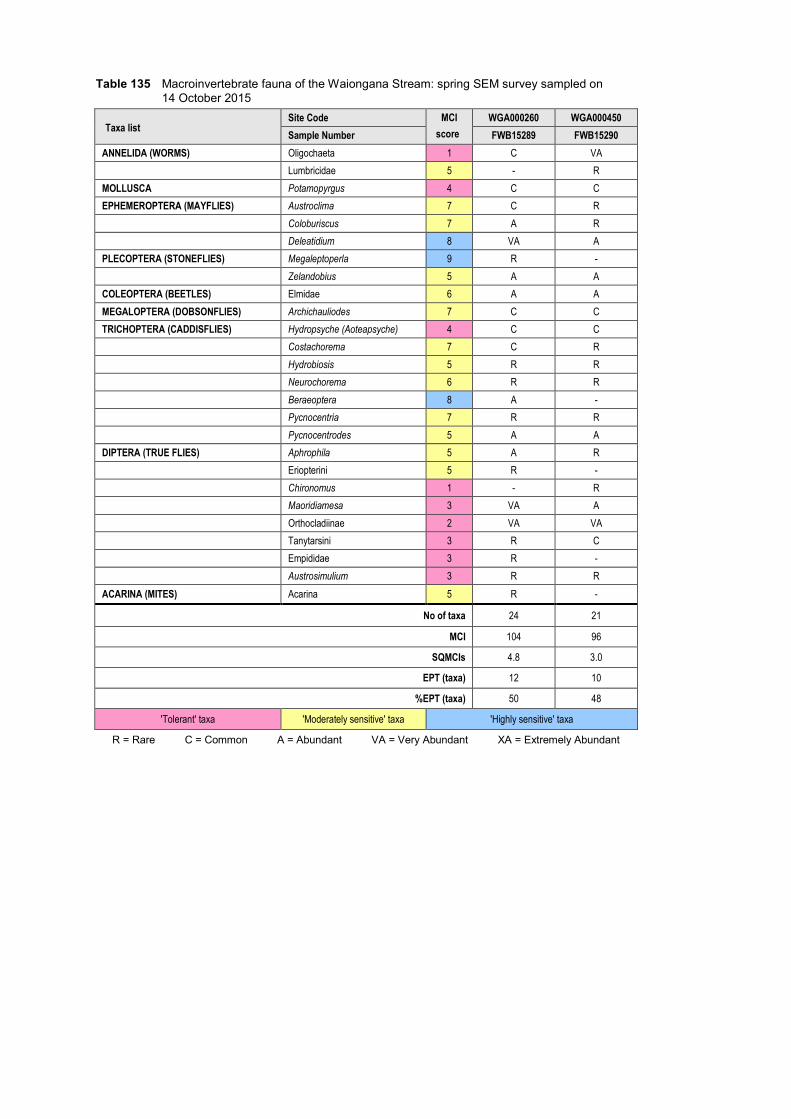
Table 135 Macroinvertebrate fauna of the Waiongana Stream: spring SEM survey sampled on 14 October 2015
Taxa list Site Code MCI
score WGA000260 WGA000450
Sample Number FWB15289 FWB15290
ANNELIDA (WORMS) Oligochaeta 1 C VA
Lumbricidae 5 - R
MOLLUSCA Potamopyrgus 4 C C
EPHEMEROPTERA (MAYFLIES) Austroclima 7 C R
Coloburiscus 7 A R
Deleatidium 8 VA A
PLECOPTERA (STONEFLIES) Megaleptoperla 9 R -
Zelandobius 5 A A
COLEOPTERA (BEETLES) Elmidae 6 A A
MEGALOPTERA (DOBSONFLIES) Archichauliodes 7 C C
TRICHOPTERA (CADDISFLIES) Hydropsyche (Aoteapsyche) 4 C C
Costachorema 7 C R
Hydrobiosis 5 R R
Neurochorema 6 R R
Beraeoptera 8 A -
Pycnocentria 7 R R
Pycnocentrodes 5 A A
DIPTERA (TRUE FLIES) Aphrophila 5 A R
Eriopterini 5 R -
Chironomus 1 - R
Maoridiamesa 3 VA A
Orthocladiinae 2 VA VA
Tanytarsini 3 R C
Empididae 3 R -
Austrosimulium 3 R R
ACARINA (MITES) Acarina 5 R -
No of taxa 24 21
MCI 104 96
SQMCIs 4.8 3.0
EPT (taxa) 12 10
%EPT (taxa) 50 48
'Tolerant' taxa 'Moderately sensitive' taxa 'Highly sensitive' taxa
R = Rare C = Common A = Abundant VA = Very Abundant XA = Extremely Abundant

Table 136 Macroinvertebrate fauna of the Waiongana Stream: summer SEM survey sampled on 15 February 2016
Taxa list Site Code MCI
score WGA000260 WGA000450
Sample Number FWB16074 FWB16075
ANNELIDA (WORMS) Oligochaeta 1 - VA
Lumbricidae 5 - R
MOLLUSCA Latia 5 - R
Potamopyrgus 4 A VA
CRUSTACEA Paracalliope 5 - R
EPHEMEROPTERA (MAYFLIES) Austroclima 7 - C
Deleatidium 8 - C
COLEOPTERA (BEETLES) Elmidae 6 A VA
MEGALOPTERA (DOBSONFLIES) Archichauliodes 7 C A
TRICHOPTERA (CADDISFLIES) Hydropsyche (Aoteapsyche) 4 - XA
Hydrobiosis 5 - A
Neurochorema 6 - A
Beraeoptera 8 R -
Confluens 5 R -
Oxyethira 2 R C
Pycnocentria 7 - R
Pycnocentrodes 5 C VA
DIPTERA (TRUE FLIES) Aphrophila 5 - A
Orthocladiinae 2 - A
Tanytarsini 3 - VA
Empididae 3 C R
Muscidae 3 R A
Austrosimulium 3 - R
Tanyderidae 4 - R
No of taxa 9 22
MCI 96 91
SQMCIs 5.0 4.0
EPT (taxa) 3 7
%EPT (taxa) 33 32
'Tolerant' taxa 'Moderately sensitive' taxa 'Highly sensitive' taxa
R = Rare C = Common A = Abundant VA = Very Abundant XA = Extremely Abundant
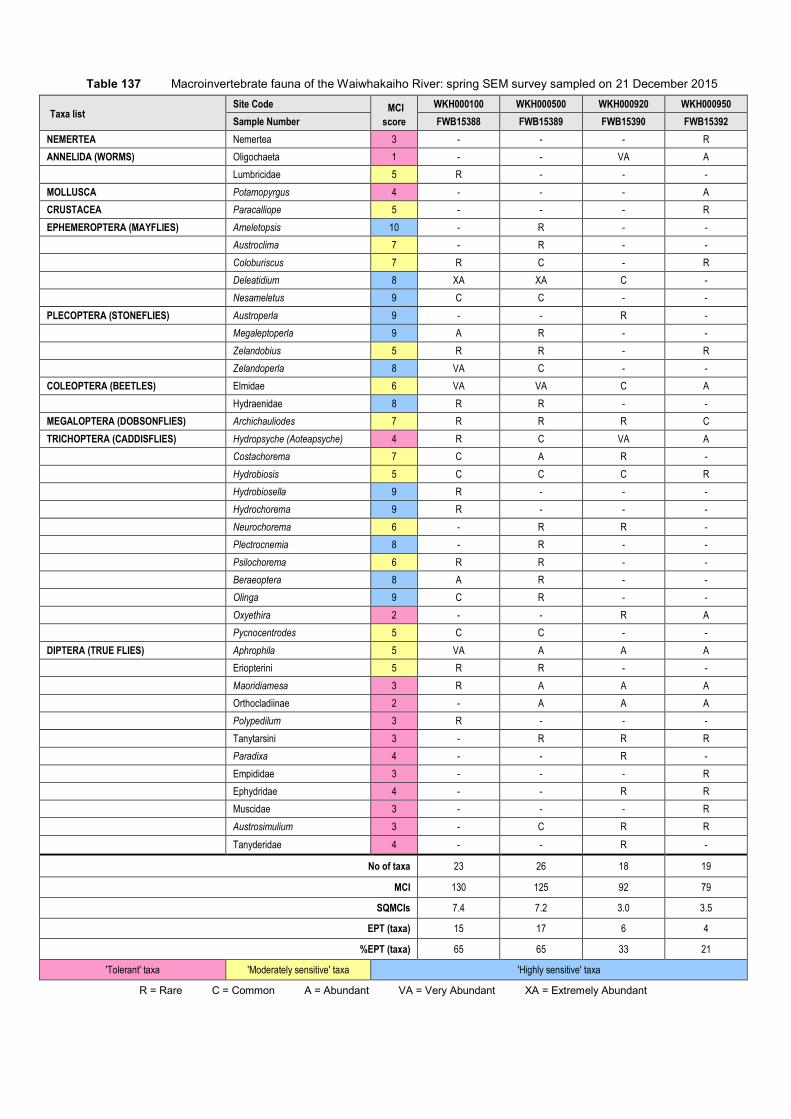
Table 137 Macroinvertebrate fauna of the Waiwhakaiho River: spring SEM survey sampled on 21 December 2015
Taxa list Site Code MCI
score WKH000100 WKH000500 WKH000920 WKH000950
Sample Number FWB15388 FWB15389 FWB15390 FWB15392
NEMERTEA Nemertea 3 - - - R
ANNELIDA (WORMS) Oligochaeta 1 - - VA A
Lumbricidae 5 R - - -
MOLLUSCA Potamopyrgus 4 - - - A
CRUSTACEA Paracalliope 5 - - - R
EPHEMEROPTERA (MAYFLIES) Ameletopsis 10 - R - -
Austroclima 7 - R - -
Coloburiscus 7 R C - R
Deleatidium 8 XA XA C -
Nesameletus 9 C C - -
PLECOPTERA (STONEFLIES) Austroperla 9 - - R -
Megaleptoperla 9 A R - -
Zelandobius 5 R R - R
Zelandoperla 8 VA C - -
COLEOPTERA (BEETLES) Elmidae 6 VA VA C A
Hydraenidae 8 R R - -
MEGALOPTERA (DOBSONFLIES) Archichauliodes 7 R R R C
TRICHOPTERA (CADDISFLIES) Hydropsyche (Aoteapsyche) 4 R C VA A
Costachorema 7 C A R -
Hydrobiosis 5 C C C R
Hydrobiosella 9 R - - -
Hydrochorema 9 R - - -
Neurochorema 6 - R R -
Plectrocnemia 8 - R - -
Psilochorema 6 R R - -
Beraeoptera 8 A R - -
Olinga 9 C R - -
Oxyethira 2 - - R A
Pycnocentrodes 5 C C - -
DIPTERA (TRUE FLIES) Aphrophila 5 VA A A A
Eriopterini 5 R R - -
Maoridiamesa 3 R A A A
Orthocladiinae 2 - A A A
Polypedilum 3 R - - -
Tanytarsini 3 - R R R
Paradixa 4 - - R -
Empididae 3 - - - R
Ephydridae 4 - - R R
Muscidae 3 - - - R
Austrosimulium 3 - C R R
Tanyderidae 4 - - R -
No of taxa 23 26 18 19
MCI 130 125 92 79
SQMCIs 7.4 7.2 3.0 3.5
EPT (taxa) 15 17 6 4
%EPT (taxa) 65 65 33 21
'Tolerant' taxa 'Moderately sensitive' taxa 'Highly sensitive' taxa
R = Rare C = Common A = Abundant VA = Very Abundant XA = Extremely Abundant

Table 138 Macroinvertebrate fauna of the Waiwhakaiho River: summer SEM survey sampled 16 March 2016
Taxa list Site Code MCI
score WKH000100 WKH000500 WKH000920 WKH000950
Sample Number FWB16165 FWB16166 FWB16167 FWB16169
NEMERTEA Nemertea 3 - - R R
NEMATODA Nematoda 3 R R - -
ANNELIDA (WORMS) Oligochaeta 1 - - VA C
MOLLUSCA Potamopyrgus 4 - - R C
CRUSTACEA Paracalliope 5 - - R -
EPHEMEROPTERA (MAYFLIES) Austroclima 7 - R - -
Coloburiscus 7 - C C -
Deleatidium 8 VA VA A R
Nesameletus 9 R R - -
Zephlebia group 7 - - - R
PLECOPTERA (STONEFLIES) Megaleptoperla 9 R R - R
Stenoperla 10 R - - -
Zelandoperla 8 A C - -
HEMIPTERA (BUGS) Saldula 5 - - R -
COLEOPTERA (BEETLES) Elmidae 6 A C C C
Hydraenidae 8 - R R R
Staphylinidae 5 - - R -
MEGALOPTERA (DOBSONFLIES) Archichauliodes 7 R C C R
TRICHOPTERA (CADDISFLIES) Hydropsyche (Aoteapsyche) 4 R A A A
Costachorema 7 - R - -
Hydrobiosis 5 - R - R
Psilochorema 6 R - - -
Olinga 9 R R - R
Oxyethira 2 - VA A C
Pycnocentrodes 5 - - - R
DIPTERA (TRUE FLIES) Aphrophila 5 R A R C
Eriopterini 5 R - - -
Maoridiamesa 3 - A - -
Orthocladiinae 2 - VA C A
Polypedilum 3 R - - -
Tanypodinae 5 - - R -
Tanytarsini 3 - A - C
Empididae 3 - R - -
Ephydridae 4 - C R -
Muscidae 3 - C - R
Austrosimulium 3 - - R R
No of taxa 14 22 18 19
MCI 131 111 93 99
SQMCIs 7.6 4.1 2.8 3.6
EPT (taxa) 8 10 3 7
%EPT (taxa) 57 45 17 37
'Tolerant' taxa 'Moderately sensitive' taxa 'Highly sensitive' taxa
R = Rare C = Common A = Abundant VA = Very Abundant XA = Extremely Abundant

Table 139 Macroinvertebrate fauna of the Mangorei Stream: spring SEM survey sampled on 21 December 2015
Taxa list Site Code MCI
score MGE000970
Sample Number FWB15387
ANNELIDA (WORMS) Oligochaeta 1 C
MOLLUSCA Potamopyrgus 4 C
EPHEMEROPTERA (MAYFLIES) Austroclima 7 R
Coloburiscus 7 A
Deleatidium 8 C
Nesameletus 9 R
Rallidens 9 R
Zephlebia group 7 A
PLECOPTERA (STONEFLIES) Zelandobius 5 C
Zelandoperla 8 R
COLEOPTERA (BEETLES) Elmidae 6 A
Hydraenidae 8 R
MEGALOPTERA (DOBSONFLIES) Archichauliodes 7 C
TRICHOPTERA (CADDISFLIES) Hydropsyche (Aoteapsyche) 4 A
Costachorema 7 C
Hydrobiosis 5 C
Neurochorema 6 R
Oxyethira 2 A
DIPTERA (TRUE FLIES) Aphrophila 5 A
Maoridiamesa 3 C
Orthocladiinae 2 C
Tanytarsini 3 A
Empididae 3 R
Austrosimulium 3 VA
Tanyderidae 4 R
No of taxa 25
MCI 106
SQMCIs 4.2
EPT (taxa) 12
%EPT (taxa) 48
'Tolerant' taxa 'Moderately sensitive' taxa 'Highly sensitive' taxa
R = Rare C = Common A = Abundant VA = Very Abundant XA = Extremely Abundant

Table 140 Macroinvertebrate fauna of the Mangorei Stream: summer SEM survey sampled on 16 March 2016
Taxa list Site Code MCI
score MGE000970
Sample Number FWB16164
NEMERTEA Nemertea 3 C
ANNELIDA (WORMS) Oligochaeta 1 A
MOLLUSCA Latia 5 R
Potamopyrgus 4 C
EPHEMEROPTERA (MAYFLIES) Austroclima 7 A
Coloburiscus 7 C
Deleatidium 8 A
COLEOPTERA (BEETLES) Elmidae 6 A
Hydraenidae 8 C
MEGALOPTERA (DOBSONFLIES) Archichauliodes 7 A
TRICHOPTERA (CADDISFLIES) Hydropsyche (Aoteapsyche) 4 VA
Costachorema 7 R
Hydrobiosis 5 C
Neurochorema 6 C
Beraeoptera 8 R
Confluens 5 R
Oxyethira 2 A
Pycnocentrodes 5 R
DIPTERA (TRUE FLIES) Aphrophila 5 R
Orthocladiinae 2 A
Tanytarsini 3 A
Empididae 3 C
Muscidae 3 C
Austrosimulium 3 A
No of taxa 24
MCI 98
SQMCIs 4.3
EPT (taxa) 10
%EPT (taxa) 42
'Tolerant' taxa 'Moderately sensitive' taxa 'Highly sensitive' taxa
R = Rare C = Common A = Abundant VA = Very Abundant XA = Extremely Abundant

Table 141 Macroinvertebrate fauna of the Manganui River: spring SEM survey sampled on 14 October 2015
Taxa list Site Code MCI
score MGN000195 MGN000195
Sample Number FWB15285 FWB16078
EPHEMEROPTERA (MAYFLIES) Austroclima 7 R C
Coloburiscus 7 A A
Deleatidium 8 XA VA
Nesameletus 9 A A
PLECOPTERA (STONEFLIES) Acroperla 5 A R
Austroperla 9 R -
Megaleptoperla 9 C R
Zelandoperla 8 VA A
COLEOPTERA (BEETLES) Elmidae 6 A VA
Hydraenidae 8 R R
MEGALOPTERA (DOBSONFLIES) Archichauliodes 7 R C
TRICHOPTERA (CADDISFLIES) Hydropsyche (Aoteapsyche) 4 C A
Hydrobiosis 5 - C
Plectrocnemia 8 - R
Psilochorema 6 R R
Beraeoptera 8 A A
Confluens 5 R R
Olinga 9 R A
Pycnocentrodes 5 C A
DIPTERA (TRUE FLIES) Aphrophila 5 A A
Eriopterini 5 C R
Maoridiamesa 3 R -
Orthocladiinae 2 - R
Polypedilum 3 - R
Muscidae 3 - R
Austrosimulium 3 - R
No of taxa 20 24
MCI 133 121
SQMCIs 7.7 6.9
EPT (taxa) 14 15
%EPT (taxa) 70 63
'Tolerant' taxa 'Moderately sensitive' taxa 'Highly sensitive' taxa
R = Rare C = Common A = Abundant VA = Very Abundant XA = Extremely Abundant

Table 142 Macroinvertebrate fauna of the Manganui River: summer SEM survey sampled on 16 February 2016
Taxa list Site Code MCI
score MGN000427 MGN000427
Sample Number FWB15286 FWB16079
ANNELIDA (WORMS) Oligochaeta 1 A A
Lumbricidae 5 R -
MOLLUSCA Potamopyrgus 4 - R
EPHEMEROPTERA (MAYFLIES) Austroclima 7 R C
Coloburiscus 7 A R
Deleatidium 8 XA A
Nesameletus 9 R R
PLECOPTERA (STONEFLIES) Acroperla 5 R -
Zelandobius 5 C -
Zelandoperla 8 R -
COLEOPTERA (BEETLES) Elmidae 6 A VA
MEGALOPTERA (DOBSONFLIES) Archichauliodes 7 C C
TRICHOPTERA (CADDISFLIES) Hydropsyche (Aoteapsyche) 4 R VA
Costachorema 7 C C
Hydrobiosis 5 R A
Neurochorema 6 - C
Plectrocnemia 8 R -
Beraeoptera 8 C -
Confluens 5 - R
Oxyethira 2 - C
Pycnocentrodes 5 C R
DIPTERA (TRUE FLIES) Aphrophila 5 C A
Eriopterini 5 R -
Maoridiamesa 3 A R
Orthocladiinae 2 A VA
Tanytarsini 3 C VA
Empididae 3 C R
Muscidae 3 - C
Austrosimulium 3 - R
No of taxa 23 22
MCI 110 95
SQMCIs 7.2 4.0
EPT (taxa) 13 10
%EPT (taxa) 57 45
'Tolerant' taxa 'Moderately sensitive' taxa 'Highly sensitive' taxa
R = Rare C = Common A = Abundant VA = Very Abundant XA = Extremely Abundant

Table 143 Macroinvertebrate fauna of the Maketawa Stream: SEM spring survey sampled on 14 October 2015
Taxa list Site Code MCI
score MKW000200 MKW000300
Sample Number FWB15287 FWB15288
EPHEMEROPTERA (MAYFLIES) Austroclima 7 - R
Coloburiscus 7 C XA
Deleatidium 8 XA XA
Nesameletus 9 A C
PLECOPTERA (STONEFLIES) Acroperla 5 C R
Austroperla 9 R -
Megaleptoperla 9 C R
Stenoperla 10 R -
Zelandobius 5 C R
Zelandoperla 8 C C
COLEOPTERA (BEETLES) Elmidae 6 VA C
Hydraenidae 8 R -
MEGALOPTERA (DOBSONFLIES) Archichauliodes 7 R C
TRICHOPTERA (CADDISFLIES) Hydropsyche (Aoteapsyche) 4 R C
Costachorema 7 R C
Hydrobiosis 5 C -
Hydrochorema 9 R -
Neurochorema 6 R -
Plectrocnemia 8 R -
Psilochorema 6 R -
Beraeoptera 8 VA A
Helicopsyche 10 A -
Olinga 9 C -
Pycnocentria 7 - R
Pycnocentrodes 5 C C
DIPTERA (TRUE FLIES) Aphrophila 5 VA A
Eriopterini 5 C R
Hexatomini 5 - R
Maoridiamesa 3 VA A
Orthocladiinae 2 C A
Polypedilum 3 R -
Tanytarsini 3 - R
Austrosimulium 3 R -
No of taxa 29 21
MCI 130 119
SQMCIs 6.9 7.2
EPT (taxa) 20 13
%EPT (taxa) 69 62
'Tolerant' taxa 'Moderately sensitive' taxa 'Highly sensitive' taxa
R = Rare C = Common A = Abundant VA = Very Abundant XA = Extremely Abundant

Table 144 Macroinvertebrate fauna of the Maketawa Stream: summer SEM survey sampled on 16 February 2016
Taxa list Site Code MCI
score MKW000200 MKW000300
Sample Number FWB16080 FWB16081
ANNELIDA (WORMS) Oligochaeta 1 R -
EPHEMEROPTERA (MAYFLIES) Austroclima 7 - R
Coloburiscus 7 R A
Deleatidium 8 XA VA
Nesameletus 9 VA -
Zephlebia group 7 - R
PLECOPTERA (STONEFLIES) Austroperla 9 R -
Megaleptoperla 9 A R
Zelandoperla 8 A R
COLEOPTERA (BEETLES) Elmidae 6 VA A
Hydraenidae 8 C -
MEGALOPTERA (DOBSONFLIES) Archichauliodes 7 R C
TRICHOPTERA (CADDISFLIES) Hydropsyche (Aoteapsyche) 4 C VA
Costachorema 7 R A
Hydrobiosis 5 R C
Neurochorema 6 - C
Psilochorema 6 C -
Beraeoptera 8 C -
Olinga 9 C R
Pycnocentrodes 5 - R
DIPTERA (TRUE FLIES) Aphrophila 5 A VA
Eriopterini 5 R -
Maoridiamesa 3 R A
Orthocladiinae 2 R VA
Polypedilum 3 R R
Tanypodinae 5 - R
Tanytarsini 3 - C
Muscidae 3 R R
Austrosimulium 3 - C
No of taxa 22 22
MCI 120 111
SQMCIs 7.7 4.9
EPT (taxa) 12 12
%EPT (taxa) 55 55
'Tolerant' taxa 'Moderately sensitive' taxa 'Highly sensitive' taxa
R = Rare C = Common A = Abundant VA = Very Abundant XA = Extremely Abundant

Table 145 Macroinvertebrate fauna of the Waitara River: spring SEM survey sampled on 15 October 2015
Taxa list Site Code MCI
score WTR000540 WTR000850
Sample Number FWB15302 FWB15303
NEMATODA Nematoda 3 R -
ANNELIDA (WORMS) Oligochaeta 1 A C
Branchiura 1 C -
Lumbricidae 5 C R
MOLLUSCA Latia 5 R -
Potamopyrgus 4 R R
CRUSTACEA Paratya 3 - R
EPHEMEROPTERA (MAYFLIES) Austroclima 7 R R
Coloburiscus 7 R C
Deleatidium 8 XA VA
Zephlebia group 7 C R
PLECOPTERA (STONEFLIES) Acroperla 5 A C
Zelandobius 5 C C
Zelandoperla 8 R -
COLEOPTERA (BEETLES) Elmidae 6 A C
MEGALOPTERA (DOBSONFLIES) Archichauliodes 7 R R
TRICHOPTERA (CADDISFLIES) Hydropsyche (Aoteapsyche) 4 R C
Costachorema 7 R R
Hydrobiosis 5 C R
Neurochorema 6 C R
Beraeoptera 8 - R
Confluens 5 - R
Oxyethira 2 - R
Pycnocentria 7 R R
Pycnocentrodes 5 C R
DIPTERA (TRUE FLIES) Aphrophila 5 A C
Maoridiamesa 3 R R
Orthocladiinae 2 A A
Tanytarsini 3 C -
Empididae 3 - R
Austrosimulium 3 R R
No of taxa 26 26
MCI 99 100
SQMCIs 7.1 6.3
EPT (taxa) 13 14
%EPT (taxa) 50 54
'Tolerant' taxa 'Moderately sensitive' taxa 'Highly sensitive' taxa
R = Rare C = Common A = Abundant VA = Very Abundant XA = Extremely Abundant

Table 146 Macroinvertebrate fauna of the Waitara River: summer SEM survey sampled on 15 February 2016
Taxa list Site Code MCI
score WTR000540 WTR000850
Sample Number FWB16076 FWB16077
ANNELIDA (WORMS) Oligochaeta 1 - C
Lumbricidae 5 - R
MOLLUSCA Latia 5 R -
Potamopyrgus 4 A A
EPHEMEROPTERA (MAYFLIES) Austroclima 7 A -
Coloburiscus 7 C R
Deleatidium 8 R -
Mauiulus 5 C -
Zephlebia group 7 C R
COLEOPTERA (BEETLES) Elmidae 6 A R
MEGALOPTERA (DOBSONFLIES) Archichauliodes 7 C -
TRICHOPTERA (CADDISFLIES) Hydropsyche (Aoteapsyche) 4 VA A
Hydrobiosis 5 C R
Neurochorema 6 C -
Hudsonema 6 R -
Oxyethira 2 C A
Pycnocentria 7 R -
Pycnocentrodes 5 A R
DIPTERA (TRUE FLIES) Aphrophila 5 VA C
Eriopterini 5 C -
Orthocladiinae 2 R A
Polypedilum 3 C -
Tanypodinae 5 C -
Tanytarsini 3 A C
Empididae 3 C -
Muscidae 3 - R
Austrosimulium 3 R -
Tabanidae 3 R -
Tanyderidae 4 R -
ACARINA (MITES) Acarina 5 - R
No of taxa 26 15
MCI 98 85
SQMCIs 4.7 3.2
EPT (taxa) 11 5
%EPT (taxa) 42 33
'Tolerant' taxa 'Moderately sensitive' taxa 'Highly sensitive' taxa
R = Rare C = Common A = Abundant VA = Very Abundant XA = Extremely Abundant

Table 147 Macroinvertebrate fauna of the Mangati Stream: spring SEM survey sampled on 19 November 2015
Taxa list Site Code MCI
score MGT000488 MGT000520
Sample Number FWB15348 FWB15354
PLATYHELMINTHES (FLATWORMS) Cura 3 - R
NEMERTEA Nemertea 3 - C
NEMATODA Nematoda 3 - R
ANNELIDA (WORMS) Oligochaeta 1 A VA
Lumbricidae 5 - R
MOLLUSCA Potamopyrgus 4 C XA
Sphaeriidae 3 R -
CRUSTACEA Cladocera 5 - A
Ostracoda 1 R R
Isopoda 5 R -
Paracalliope 5 VA C
EPHEMEROPTERA (MAYFLIES) Austroclima 7 A R
Zephlebia group 7 R -
TRICHOPTERA (CADDISFLIES) Hydrobiosis 5 C C
Psilochorema 6 R R
Oxyethira 2 R C
Triplectides 5 - R
DIPTERA (TRUE FLIES) Aphrophila 5 - R
Zelandotipula 6 R -
Orthocladiinae 2 A A
Polypedilum 3 C C
Empididae 3 - C
Austrosimulium 3 C A
Tanyderidae 4 - R
ACARINA (MITES) Acarina 5 R R
No of taxa 16 21
MCI 81 76
SQMCIs 4.3 3.5
EPT (taxa) 4 4
%EPT (taxa) 25 19
'Tolerant' taxa 'Moderately sensitive' taxa 'Highly sensitive' taxa
R = Rare C = Common A = Abundant VA = Very Abundant XA = Extremely Abundant

Table 148 Macroinvertebrate fauna of the Mangati Stream: summer SEM survey sampled on 10 February 2016
Taxa list Site Code MCI
score MGT000488 MGT000520
Sample Number FWB16052 FWB16058
COELENTERATA Coelenterata 3 C -
NEMERTEA Nemertea 3 R -
ANNELIDA (WORMS) Oligochaeta 1 A XA
MOLLUSCA Physa 3 C -
Potamopyrgus 4 A XA
Sphaeriidae 3 R -
CRUSTACEA Ostracoda 1 A R
Isopoda 5 R -
Paracalliope 5 XA -
Talitridae 5 - R
EPHEMEROPTERA (MAYFLIES) Zephlebia group 7 R -
COLEOPTERA (BEETLES) Staphylinidae 5 - R
MEGALOPTERA (DOBSONFLIES) Archichauliodes 7 - R
TRICHOPTERA (CADDISFLIES) Oxyethira 2 - R
Triplectides 5 - A
DIPTERA (TRUE FLIES) Aphrophila 5 - R
Limonia 6 - C
Orthocladiinae 2 - R
Dolichopodidae 3 R -
Austrosimulium 3 - R
Tanyderidae 4 - R
ACARINA (MITES) Acarina 5 A R
No of taxa 12 14
MCI 72 79
SQMCIs 4.7 2.6
EPT (taxa) 1 1
%EPT (taxa) 8 7
'Tolerant' taxa 'Moderately sensitive' taxa 'Highly sensitive' taxa
R = Rare C = Common A = Abundant VA = Very Abundant XA = Extremely Abundant
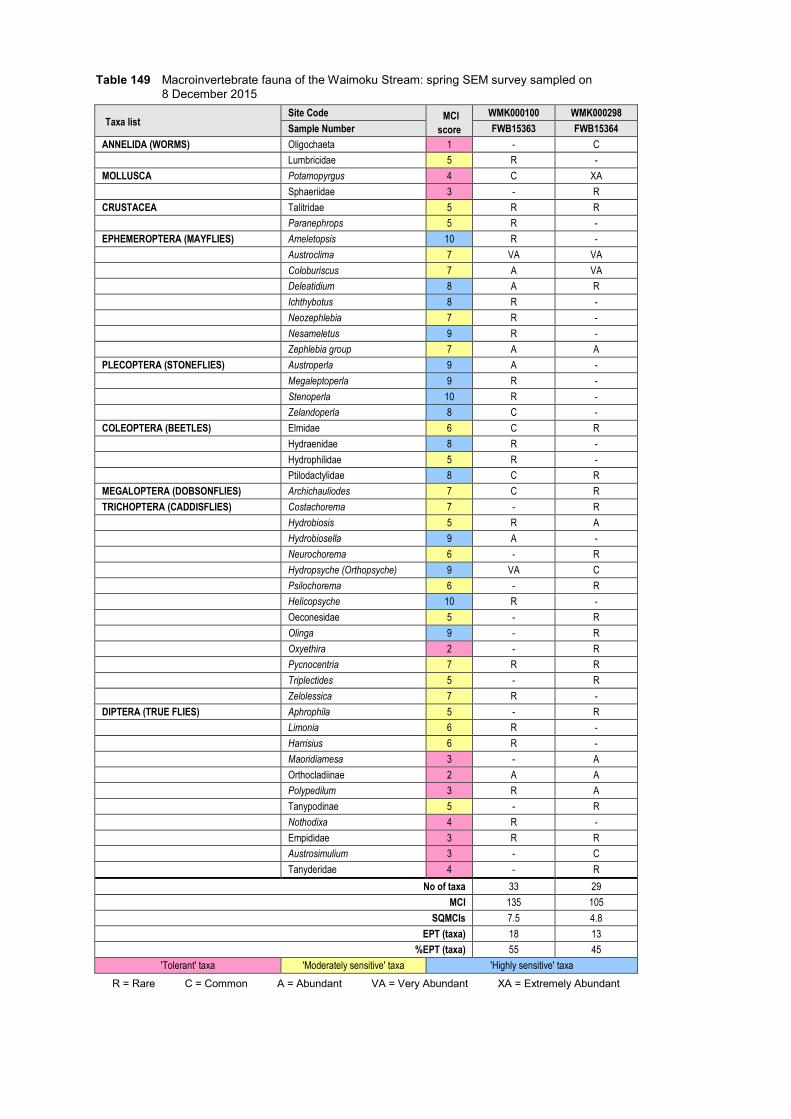
Table 149 Macroinvertebrate fauna of the Waimoku Stream: spring SEM survey sampled on 8 December 2015
Taxa list Site Code MCI
score WMK000100 WMK000298
Sample Number FWB15363 FWB15364
ANNELIDA (WORMS) Oligochaeta 1 - C
Lumbricidae 5 R -
MOLLUSCA Potamopyrgus 4 C XA
Sphaeriidae 3 - R
CRUSTACEA Talitridae 5 R R
Paranephrops 5 R -
EPHEMEROPTERA (MAYFLIES) Ameletopsis 10 R -
Austroclima 7 VA VA
Coloburiscus 7 A VA
Deleatidium 8 A R
Ichthybotus 8 R -
Neozephlebia 7 R -
Nesameletus 9 R -
Zephlebia group 7 A A
PLECOPTERA (STONEFLIES) Austroperla 9 A -
Megaleptoperla 9 R -
Stenoperla 10 R -
Zelandoperla 8 C -
COLEOPTERA (BEETLES) Elmidae 6 C R
Hydraenidae 8 R -
Hydrophilidae 5 R -
Ptilodactylidae 8 C R
MEGALOPTERA (DOBSONFLIES) Archichauliodes 7 C R
TRICHOPTERA (CADDISFLIES) Costachorema 7 - R
Hydrobiosis 5 R A
Hydrobiosella 9 A -
Neurochorema 6 - R
Hydropsyche (Orthopsyche) 9 VA C
Psilochorema 6 - R
Helicopsyche 10 R -
Oeconesidae 5 - R
Olinga 9 - R
Oxyethira 2 - R
Pycnocentria 7 R R
Triplectides 5 - R
Zelolessica 7 R -
DIPTERA (TRUE FLIES) Aphrophila 5 - R
Limonia 6 R -
Harrisius 6 R -
Maoridiamesa 3 - A
Orthocladiinae 2 A A
Polypedilum 3 R A
Tanypodinae 5 - R
Nothodixa 4 R -
Empididae 3 R R
Austrosimulium 3 - C
Tanyderidae 4 - R
No of taxa 33 29
MCI 135 105
SQMCIs 7.5 4.8
EPT (taxa) 18 13
%EPT (taxa) 55 45
'Tolerant' taxa 'Moderately sensitive' taxa 'Highly sensitive' taxa
R = Rare C = Common A = Abundant VA = Very Abundant XA = Extremely Abundant
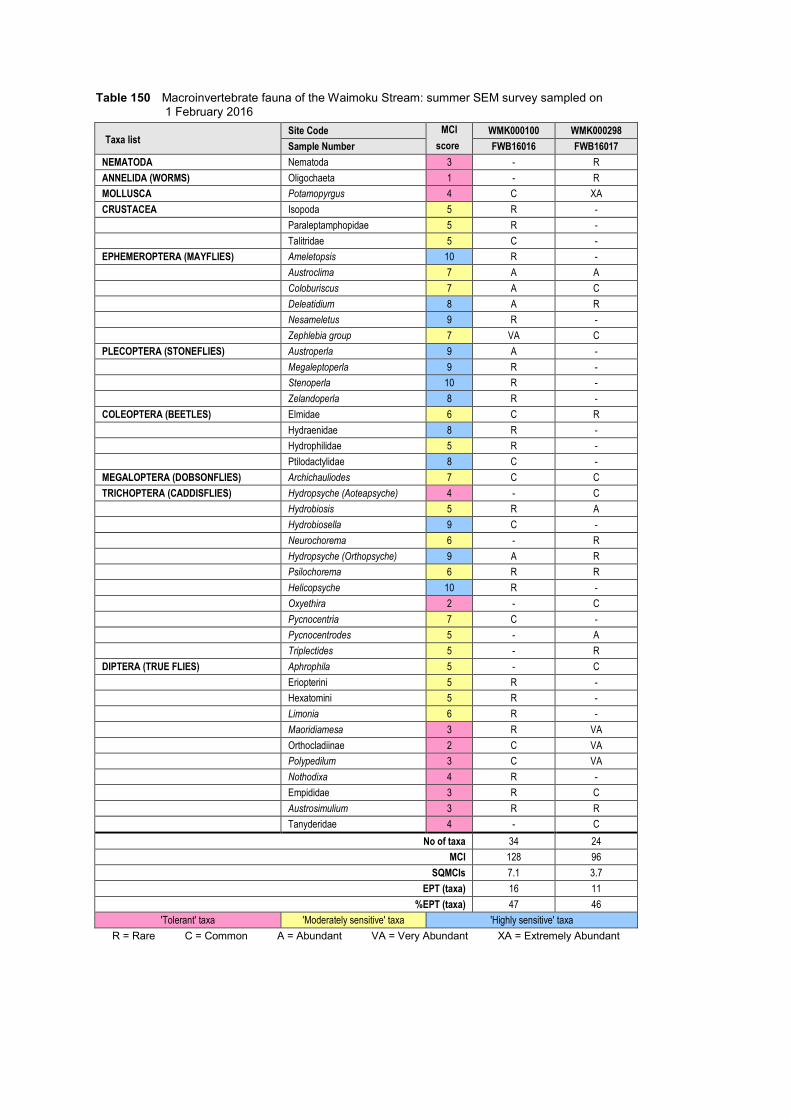
Table 150 Macroinvertebrate fauna of the Waimoku Stream: summer SEM survey sampled on
1 February 2016
Taxa list Site Code MCI
score WMK000100 WMK000298
Sample Number FWB16016 FWB16017
NEMATODA Nematoda 3 - R
ANNELIDA (WORMS) Oligochaeta 1 - R
MOLLUSCA Potamopyrgus 4 C XA
CRUSTACEA Isopoda 5 R -
Paraleptamphopidae 5 R -
Talitridae 5 C -
EPHEMEROPTERA (MAYFLIES) Ameletopsis 10 R -
Austroclima 7 A A
Coloburiscus 7 A C
Deleatidium 8 A R
Nesameletus 9 R -
Zephlebia group 7 VA C
PLECOPTERA (STONEFLIES) Austroperla 9 A -
Megaleptoperla 9 R -
Stenoperla 10 R -
Zelandoperla 8 R -
COLEOPTERA (BEETLES) Elmidae 6 C R
Hydraenidae 8 R -
Hydrophilidae 5 R -
Ptilodactylidae 8 C -
MEGALOPTERA (DOBSONFLIES) Archichauliodes 7 C C
TRICHOPTERA (CADDISFLIES) Hydropsyche (Aoteapsyche) 4 - C
Hydrobiosis 5 R A
Hydrobiosella 9 C -
Neurochorema 6 - R
Hydropsyche (Orthopsyche) 9 A R
Psilochorema 6 R R
Helicopsyche 10 R -
Oxyethira 2 - C
Pycnocentria 7 C -
Pycnocentrodes 5 - A
Triplectides 5 - R
DIPTERA (TRUE FLIES) Aphrophila 5 - C
Eriopterini 5 R -
Hexatomini 5 R -
Limonia 6 R -
Maoridiamesa 3 R VA
Orthocladiinae 2 C VA
Polypedilum 3 C VA
Nothodixa 4 R -
Empididae 3 R C
Austrosimulium 3 R R
Tanyderidae 4 - C
No of taxa 34 24
MCI 128 96
SQMCIs 7.1 3.7
EPT (taxa) 16 11
%EPT (taxa) 47 46
'Tolerant' taxa 'Moderately sensitive' taxa 'Highly sensitive' taxa
R = Rare C = Common A = Abundant VA = Very Abundant XA = Extremely Abundant

Table 151 Macroinvertebrate fauna of the Waiau Stream: spring SEM survey sampled on 15 October 2015
Taxa list Site Code MCI
score WAI000110
Sample Number FWB15298
ANNELIDA (WORMS) Oligochaeta 1 A
MOLLUSCA Potamopyrgus 4 A
CRUSTACEA Paracalliope 5 C
EPHEMEROPTERA (MAYFLIES) Austroclima 7 VA
Coloburiscus 7 C
Zephlebia group 7 C
PLECOPTERA (STONEFLIES) Zelandobius 5 A
COLEOPTERA (BEETLES) Elmidae 6 VA
MEGALOPTERA (DOBSONFLIES) Archichauliodes 7 C
TRICHOPTERA (CADDISFLIES) Hydropsyche (Aoteapsyche) 4 A
Hydrobiosis 5 A
Psilochorema 6 R
Pycnocentria 7 A
Pycnocentrodes 5 VA
DIPTERA (TRUE FLIES) Aphrophila 5 C
Orthocladiinae 2 A
Austrosimulium 3 C
No of taxa 17
MCI 101
SQMCIs 5.4
EPT (taxa) 9
%EPT (taxa) 53
'Tolerant' taxa 'Moderately sensitive' taxa 'Highly sensitive' taxa
R = Rare C = Common A = Abundant VA = Very Abundant XA = Extremely Abundant

Table 152 Macroinvertebrate fauna of the Waiau Stream: summer SEM survey sampled on 31 March 2016
Taxa list Site Code MCI
score WAI000110
Sample Number FWB16183
PLATYHELMINTHES (FLATWORMS) Cura 3 C
NEMERTEA Nemertea 3 C
ANNELIDA (WORMS) Oligochaeta 1 A
MOLLUSCA Latia 5 A
Lymnaeidae 3 R
Potamopyrgus 4 XA
CRUSTACEA Ostracoda 1 C
Paracalliope 5 R
EPHEMEROPTERA (MAYFLIES) Austroclima 7 A
Coloburiscus 7 R
Zephlebia group 7 R
COLEOPTERA (BEETLES) Elmidae 6 VA
MEGALOPTERA (DOBSONFLIES) Archichauliodes 7 A
TRICHOPTERA (CADDISFLIES) Hydropsyche (Aoteapsyche) 4 VA
Hydrobiosis 5 C
Neurochorema 6 R
Hudsonema 6 R
Oxyethira 2 A
Pycnocentria 7 VA
Pycnocentrodes 5 VA
DIPTERA (TRUE FLIES) Aphrophila 5 A
Orthocladiinae 2 A
Tanytarsini 3 R
Ephydridae 4 C
Muscidae 3 R
Austrosimulium 3 R
ACARINA (MITES) Acarina 5 R
No of taxa 27
MCI 88
SQMCIs 4.6
EPT (taxa) 9
%EPT (taxa) 33
'Tolerant' taxa 'Moderately sensitive' taxa 'Highly sensitive' taxa
R = Rare C = Common A = Abundant VA = Very Abundant XA = Extremely Abundant

Table 153 Macroinvertebrate fauna of the Punehu Stream: spring SEM survey sampled on 12 October 2015
Taxa list Site Code MCI
score PNH000200 PNH000900
Sample Number FWB15258 FWB15259
ANNELIDA (WORMS) Oligochaeta 1 R C
MOLLUSCA Potamopyrgus 4 - C
EPHEMEROPTERA (MAYFLIES) Austroclima 7 R R
Coloburiscus 7 A VA
Deleatidium 8 XA XA
Nesameletus 9 VA R
PLECOPTERA (STONEFLIES) Acroperla 5 C C
Austroperla 9 R -
Megaleptoperla 9 A -
Stenoperla 10 R -
Zelandobius 5 R C
Zelandoperla 8 A -
COLEOPTERA (BEETLES) Elmidae 6 A R
Hydraenidae 8 C -
MEGALOPTERA (DOBSONFLIES) Archichauliodes 7 C C
TRICHOPTERA (CADDISFLIES) Hydropsyche (Aoteapsyche) 4 C C
Costachorema 7 C R
Hydrobiosis 5 R R
Psilochorema 6 R -
Beraeoptera 8 A C
Confluens 5 R -
Helicopsyche 10 C -
Olinga 9 R R
Pycnocentrodes 5 VA VA
DIPTERA (TRUE FLIES) Aphrophila 5 R R
Eriopterini 5 R -
Chironomus 1 - R
Maoridiamesa 3 R C
Orthocladiinae 2 C A
Polypedilum 3 R R
Tanypodinae 5 R -
Tanytarsini 3 - C
ACARINA (MITES) Acarina 5 R -
No of taxa 30 22
MCI 124 104
SQMCIs 7.6 7.1
EPT (taxa) 19 12
%EPT (taxa) 63 55
'Tolerant' taxa 'Moderately sensitive' taxa 'Highly sensitive' taxa
R = Rare C = Common A = Abundant VA = Very Abundant XA = Extremely Abundant

Table 154 Macroinvertebrate fauna of the Punehu Stream: summer SEM survey sampled on 10 March 2016
Taxa list Site Code MCI
score PNH000200 PNH000900
Sample Number FWB16154 FWB16155
ANNELIDA (WORMS) Oligochaeta 1 - A
MOLLUSCA Potamopyrgus 4 - VA
EPHEMEROPTERA (MAYFLIES) Austroclima 7 C R
Coloburiscus 7 A R
Deleatidium 8 VA C
Nesameletus 9 VA -
PLECOPTERA (STONEFLIES) Austroperla 9 R -
Megaleptoperla 9 C -
Stenoperla 10 R -
Zelandoperla 8 A -
COLEOPTERA (BEETLES) Elmidae 6 A R
Hydraenidae 8 R -
MEGALOPTERA (DOBSONFLIES) Archichauliodes 7 R C
TRICHOPTERA (CADDISFLIES) Hydropsyche (Aoteapsyche) 4 A A
Costachorema 7 C -
Hydrobiosis 5 C C
Neurochorema 6 R -
Plectrocnemia 8 R -
Psilochorema 6 R -
Beraeoptera 8 VA -
Helicopsyche 10 R -
Olinga 9 C -
Oxyethira 2 - C
Pycnocentria 7 R -
Pycnocentrodes 5 C A
DIPTERA (TRUE FLIES) Aphrophila 5 C A
Eriopterini 5 R -
Maoridiamesa 3 A -
Orthocladiinae 2 C A
Polypedilum 3 R A
Tanytarsini 3 R A
Empididae 3 - R
Muscidae 3 - R
Austrosimulium 3 - A
Tabanidae 3 R -
No of taxa 29 18
MCI 129 87
SQMCIs 7.5 3.7
EPT (taxa) 19 6
%EPT (taxa) 66 33
'Tolerant' taxa 'Moderately sensitive' taxa 'Highly sensitive' taxa
R = Rare C = Common A = Abundant VA = Very Abundant XA = Extremely Abundant

Table 155 Macroinvertebrate fauna of the Patea River: spring SEM survey sampled on 12 October 2015
Taxa list Site Code MCI
score PAT000200 PAT000315 PAT000360
Sample Number FWB15267 FWB15268 FWB15271
ANNELIDA (WORMS) Oligochaeta 1 R C R
MOLLUSCA Potamopyrgus 4 - - C
EPHEMEROPTERA (MAYFLIES) Austroclima 7 C A C
Coloburiscus 7 A VA A
Deleatidium 8 VA VA VA
Nesameletus 9 R C -
Zephlebia group 7 R - -
PLECOPTERA (STONEFLIES) Acroperla 5 C A -
Austroperla 9 C - -
Megaleptoperla 9 C - -
Stenoperla 10 C - -
Zelandobius 5 A C R
Zelandoperla 8 A R -
COLEOPTERA (BEETLES) Elmidae 6 C C C
Hydraenidae 8 C R -
MEGALOPTERA (DOBSONFLIES) Archichauliodes 7 R C C
TRICHOPTERA (CADDISFLIES) Hydropsyche (Aoteapsyche) 4 - A A
Costachorema 7 - R C
Hydrobiosis 5 R - C
Hydrobiosella 9 R - -
Neurochorema 6 - - R
Hydropsyche (Orthopsyche) 9 C - -
Psilochorema 6 R - -
Beraeoptera 8 A A R
Confluens 5 R A C
Helicopsyche 10 A - -
Olinga 9 C R -
Pycnocentria 7 R - -
Pycnocentrodes 5 R A A
DIPTERA (TRUE FLIES) Aphrophila 5 C VA VA
Maoridiamesa 3 - C VA
Orthocladiinae 2 C A A
Polypedilum 3 R - -
Tanytarsini 3 - C C
Empididae 3 - R R
Austrosimulium 3 - - R
No of taxa 28 22 21
MCI 135 114 99
SQMCIs 7.6 6.1 5.2
EPT (taxa) 21 13 11
%EPT (taxa) 75 59 52
'Tolerant' taxa 'Moderately sensitive' taxa 'Highly sensitive' taxa
R = Rare C = Common A = Abundant VA = Very Abundant XA = Extremely Abundant

Table 156 Macroinvertebrate fauna of the Patea River: summer SEM survey sampled on 29 February 2016
Taxa list Site Code MCI
score PAT000200 PAT000315 PAT000360
Sample Number FWB16099 FWB16100 FWB16106
NEMERTEA Nemertea 3 - - R
ANNELIDA (WORMS) Oligochaeta 1 - R A
MOLLUSCA Potamopyrgus 4 - - C
EPHEMEROPTERA (MAYFLIES) Ameletopsis 10 R - -
Austroclima 7 C R R
Coloburiscus 7 VA VA R
Deleatidium 8 VA VA VA
Nesameletus 9 C C -
PLECOPTERA (STONEFLIES) Austroperla 9 C - -
Megaleptoperla 9 C - -
Stenoperla 10 R - -
Taraperla 10 C - -
Zelandobius 5 R - -
Zelandoperla 8 C R -
COLEOPTERA (BEETLES) Elmidae 6 A A A
Hydraenidae 8 A A R
Hydrophilidae 5 R - -
MEGALOPTERA (DOBSONFLIES) Archichauliodes 7 C C C
TRICHOPTERA (CADDISFLIES) Hydropsyche (Aoteapsyche) 4 - VA VA
Costachorema 7 R R R
Hydrobiosis 5 - R C
Neurochorema 6 - R -
Hydropsyche (Orthopsyche) 9 A - -
Psilochorema 6 R - -
Beraeoptera 8 C R -
Confluens 5 R R -
Helicopsyche 10 C - -
Olinga 9 C - -
Pycnocentria 7 R - -
Pycnocentrodes 5 - C C
Zelolessica 7 C - -
DIPTERA (TRUE FLIES) Aphrophila 5 C A C
Hexatomini 5 R - -
Maoridiamesa 3 - R C
Orthocladiinae 2 R R VA
Polypedilum 3 R - R
Tanypodinae 5 - - R
Tanytarsini 3 - - A
Empididae 3 R - -
Austrosimulium 3 - R C
Stratiomyidae 5 - R -
No of taxa 29 21 20
MCI 141 113 96
SQMCIs 7.6 6.3 4.5
EPT (taxa) 20 12 7
%EPT (taxa) 69 57 35
'Tolerant' taxa 'Moderately sensitive' taxa 'Highly sensitive' taxa
R = Rare C = Common A = Abundant VA = Very Abundant XA = Extremely Abundant

Table 157 Macroinvertebrate fauna of the Mangaehu River: spring SEM survey sampled on 12 October 2015
Taxa list Site Code MCI
score MGH000950
Sample Number FWB15274
ANNELIDA (WORMS) Oligochaeta 1 R
MOLLUSCA Potamopyrgus 4 R
EPHEMEROPTERA (MAYFLIES) Austroclima 7 A
Coloburiscus 7 R
Deleatidium 8 C
Zephlebia group 7 C
PLECOPTERA (STONEFLIES) Acroperla 5 A
Zelandobius 5 C
COLEOPTERA (BEETLES) Elmidae 6 R
MEGALOPTERA (DOBSONFLIES) Archichauliodes 7 C
TRICHOPTERA (CADDISFLIES) Hydropsyche (Aoteapsyche) 4 R
Costachorema 7 R
Hydrobiosis 5 C
Pycnocentria 7 C
Pycnocentrodes 5 R
DIPTERA (TRUE FLIES) Aphrophila 5 R
Maoridiamesa 3 C
Orthocladiinae 2 C
Tanytarsini 3 R
Austrosimulium 3 R
No of taxa 20
MCI 101
SQMCIs 5.6
EPT (taxa) 11
%EPT (taxa) 55
'Tolerant' taxa 'Moderately sensitive' taxa 'Highly sensitive' taxa
R = Rare C = Common A = Abundant VA = Very Abundant XA = Extremely Abundant

Table 158 Macroinvertebrate fauna of the Mangaehu River: summer SEM survey sampled on 10 February 2015
Taxa list Site Code MCI
score MGH000950
Sample Number FWB16095
NEMERTEA Nemertea 3 R
ANNELIDA (WORMS) Oligochaeta 1 C
MOLLUSCA Potamopyrgus 4 A
EPHEMEROPTERA (MAYFLIES) Austroclima 7 R
Coloburiscus 7 C
Deleatidium 8 C
Zephlebia group 7 A
COLEOPTERA (BEETLES) Elmidae 6 R
MEGALOPTERA (DOBSONFLIES) Archichauliodes 7 C
TRICHOPTERA (CADDISFLIES) Hydropsyche (Aoteapsyche) 4 VA
Hydrobiosis 5 R
Neurochorema 6 R
Oxyethira 2 R
Pycnocentria 7 R
Pycnocentrodes 5 A
DIPTERA (TRUE FLIES) Aphrophila 5 VA
Orthocladiinae 2 A
Polypedilum 3 R
Tanytarsini 3 A
Empididae 3 C
Muscidae 3 R
Austrosimulium 3 R
ACARINA (MITES) Acarina 5 R
No of taxa 23
MCI 92
SQMCIs 4.5
EPT (taxa) 9
%EPT (taxa) 39
'Tolerant' taxa 'Moderately sensitive' taxa 'Highly sensitive' taxa
R = Rare C = Common A = Abundant VA = Very Abundant XA = Extremely Abundant

Table 159 Macroinvertebrate fauna of the Waingongoro River: spring SEM survey sampled on 7 October 2015
Taxa list Site Code MCI
score WGG000115 WGG000150 WGG000500 WGG000665 WGG000895 WGG000995
Sample Number FWB15245 FWB15246 FWB15247 FWB15250 FWB15251 FWB15252
NEMATODA Nematoda 3 - - - R - -
ANNELIDA (WORMS) Oligochaeta 1 - - R R C A
MOLLUSCA Potamopyrgus 4 - - R - R VA
CRUSTACEA Paracalliope 5 - - - R - C
Paratya 3 - - - - - R
EPHEMEROPTERA (MAYFLIES) Austroclima 7 C C - - - -
Coloburiscus 7 VA VA A R - -
Deleatidium 8 VA VA VA VA A C
Nesameletus 9 C A - - - -
PLECOPTERA (STONEFLIES) Acroperla 5 C C - - - -
Austroperla 9 C R - - - -
Megaleptoperla 9 C - - - - -
Stenoperla 10 R - - - - -
Zelandobius 5 C R A C C C
Zelandoperla 8 A A R - - -
COLEOPTERA (BEETLES) Elmidae 6 A A A - R R
Hydraenidae 8 A C - - - -
MEGALOPTERA (DOBSONFLIES) Archichauliodes 7 R C C C - R
TRICHOPTERA (CADDISFLIES) Hydropsyche (Aoteapsyche)
4 C C C R R -
Costachorema 7 R - R R - -
Hydrobiosis 5 - R - R R R
Hydrobiosella 9 R - - - - -
Neurochorema 6 - - R - - -
Hydropsyche (Orthopsyche) 9 R - - - - -
Beraeoptera 8 VA VA R R - -
Confluens 5 C R - - - -
Helicopsyche 10 C C - - - -
Hudsonema 6 - - - - - R
Olinga 9 A C - - - -
Pycnocentria 7 - - - R - R
Pycnocentrodes 5 R A A A VA XA
Zelolessica 7 R - - - - -
DIPTERA (TRUE FLIES) Aphrophila 5 A A - R R R
Eriopterini 5 R R R - - -
Maoridiamesa 3 C - - R C C
Orthocladiinae 2 R R - A A A
Polypedilum 3 R R - - R -
Tanytarsini 3 - - - R - C
Empididae 3 R R R C - -
Ephydridae 4 - - - - - R
Austrosimulium 3 - - - R R R
No of taxa 29 23 15 19 13 18
MCI 132 124 112 96 83 91
SQMCIs 7.4 7.3 6.9 6.4 4.8 4.6
EPT (taxa) 20 15 9 9 5 6
%EPT (taxa) 69 65 60 47 38 33
'Tolerant' taxa 'Moderately sensitive' taxa 'Highly sensitive' taxa
R = Rare C = Common A = Abundant VA = Very Abundant XA = Extremely Abundant

Table 160 Macroinvertebrate fauna of the Waingongoro River: summer SEM survey sampled on 1 March 2016
Taxa list Site Code MCI
score WGG000115 WGG000150 WGG000500 WGG000665 WGG000895 WGG000995
Sample Number FWB16112 FWB16113 FWB16114 FWB16119 FWB16120 FWB16121
PLATYHELMINTHES (FLATWORMS) Cura 3 - - - - R -
NEMERTEA Nemertea 3 - - - - R -
ANNELIDA (WORMS) Oligochaeta 1 - - - R A C
Lumbricidae 5 - R - - R -
MOLLUSCA Latia 5 - - - - R R
Potamopyrgus 4 - R R C XA A
CRUSTACEA Ostracoda 1 - - - - R -
Paracalliope 5 - - - R R R
EPHEMEROPTERA (MAYFLIES) Ameletopsis 10 C - - - - -
Austroclima 7 C A R R R R
Coloburiscus 7 VA VA A R R -
Deleatidium 8 XA VA XA VA C R
Nesameletus 9 A C - - - -
Zephlebia group 7 - R - - R -
PLECOPTERA (STONEFLIES) Austroperla 9 C C - - - -
Megaleptoperla 9 A R - - - -
Stenoperla 10 C - - - - -
Taraperla 10 R - - - - -
Zelandobius 5 R - - - - -
Zelandoperla 8 XA A - - - -
COLEOPTERA (BEETLES) Elmidae 6 A A A R C C
Hydraenidae 8 A R C - - -
MEGALOPTERA (DOBSONFLIES) Archichauliodes 7 C C C C C -
TRICHOPTERA (CADDISFLIES) Hydropsyche (Aoteapsyche)
4 A A VA VA VA A
Costachorema 7 R - - - - -
Hydrobiosis 5 R R A C C R
Neurochorema 6 - - - - R -
Hydropsyche (Orthopsyche)
9 C - - - - -
Beraeoptera 8 A A R - - -
Confluens 5 R R - - - -
Helicopsyche 10 C - - - - -
Hudsonema 6 - - - - R -
Olinga 9 A C - - - -
Oxyethira 2 - - - R - R
Pycnocentria 7 - R - R C -
Pycnocentrodes 5 R R R R VA A
DIPTERA (TRUE FLIES) Aphrophila 5 A A C R - -
Eriopterini 5 R - - - - -
Harrisius 6 - R - - - -
Maoridiamesa 3 - - - C - -
Orthocladiinae 2 R R C A R A
Polypedilum 3 - C - C A R
Tanytarsini 3 - - R C C C
Empididae 3 - - - R - -
Muscidae 3 - - - R - -
Austrosimulium 3 - R R R A -
No of taxa 26 25 15 21 24 14
MCI 144 125 109 89 94 86
SQMCIs 7.8 7.0 7.1 5.4 4.1 3.8
EPT (taxa) 20 15 7 7 10 5
%EPT (taxa) 77 60 47 33 42 36
'Tolerant' taxa 'Moderately sensitive' taxa 'Highly sensitive' taxa
R = Rare C = Common A = Abundant VA = Very Abundant XA = Extremely Abundant

Table 161 Macroinvertebrate fauna of the Mangawhero Stream: spring SEM survey sampled on 7 October 2015
Taxa list Site Code MCI
score MWH000380 MWH000490
Sample Number FWB15253 FWB15254
NEMERTEA Nemertea 3 R R
NEMATODA Nematoda 3 - R
ANNELIDA (WORMS) Oligochaeta 1 A A
MOLLUSCA Potamopyrgus 4 A C
CRUSTACEA Paracalliope 5 C C
Paraleptamphopidae 5 R -
EPHEMEROPTERA (MAYFLIES) Austroclima 7 C R
Deleatidium 8 - A
Zephlebia group 7 - R
PLECOPTERA (STONEFLIES) Zelandobius 5 R C
COLEOPTERA (BEETLES) Elmidae 6 - C
MEGALOPTERA (DOBSONFLIES) Archichauliodes 7 - R
TRICHOPTERA (CADDISFLIES) Hydropsyche (Aoteapsyche) 4 - C
Costachorema 7 - R
Hydrobiosis 5 C C
Oxyethira 2 R R
Pycnocentria 7 R C
Pycnocentrodes 5 - A
Triplectides 5 R R
DIPTERA (TRUE FLIES) Aphrophila 5 C C
Maoridiamesa 3 - C
Orthocladiinae 2 C A
Polypedilum 3 R C
Tanytarsini 3 - C
Empididae 3 - C
Austrosimulium 3 R C
No of taxa 15 25
MCI 83 90
SQMCIs 3.5 4.2
EPT (taxa) 5 10
%EPT (taxa) 33 40
'Tolerant' taxa 'Moderately sensitive' taxa 'Highly sensitive' taxa
R = Rare C = Common A = Abundant VA = Very Abundant XA = Extremely Abundant

Table 162 Macroinvertebrate fauna of the Mangawhero Stream: summer SEM survey sampled on 1 March 2016
Taxa list Site Code MCI
score MWH000380 MWH000490
Sample Number FWB16122 FWB16123
NEMERTEA Nemertea 3 C A
ANNELIDA (WORMS) Oligochaeta 1 C VA
MOLLUSCA Ferrissia 3 - R
Potamopyrgus 4 A VA
CRUSTACEA Ostracoda 1 VA R
Paracalliope 5 XA VA
Talitridae 5 - C
Paranephrops 5 R R
EPHEMEROPTERA (MAYFLIES) Deleatidium 8 R C
HEMIPTERA (BUGS) Microvelia 3 R -
COLEOPTERA (BEETLES) Elmidae 6 - A
MEGALOPTERA (DOBSONFLIES) Archichauliodes 7 - C
TRICHOPTERA (CADDISFLIES) Hydropsyche (Aoteapsyche) 4 R VA
Hydrobiosis 5 - A
Neurochorema 6 - R
Polyplectropus 6 R -
Oxyethira 2 R A
Pycnocentria 7 - C
Pycnocentrodes 5 - A
Triplectides 5 R -
DIPTERA (TRUE FLIES) Aphrophila 5 - R
Limonia 6 - R
Corynoneura 3 R -
Maoridiamesa 3 - R
Orthocladiinae 2 C VA
Polypedilum 3 R C
Tanytarsini 3 R VA
Empididae 3 - A
Ephydridae 4 R C
Muscidae 3 - C
Austrosimulium 3 VA C
No of taxa 18 27
MCI 72 83
SQMCIs 4.1 3.4
EPT (taxa) 4 6
%EPT (taxa) 22 22
'Tolerant' taxa 'Moderately sensitive' taxa 'Highly sensitive' taxa
R = Rare C = Common A = Abundant VA = Very Abundant XA = Extremely Abundant

Table 163 Macroinvertebrate fauna of the Huatoki Stream: spring SEM survey sampled on 15 October 2015
Taxa list Site Code MCI
score HTK000350 HTK000425 HTK000745
Sample Number FWB15295 FWB15296 FWB15297
PLATYHELMINTHES (FLATWORMS) Cura 3 - - R
NEMATODA Nematoda 3 - - R
ANNELIDA (WORMS) Oligochaeta 1 C C XA
MOLLUSCA Ferrissia 3 - - R
Physa 3 - - R
Potamopyrgus 4 C C A
CRUSTACEA Ostracoda 1 - - R
EPHEMEROPTERA (MAYFLIES) Austroclima 7 A A -
Coloburiscus 7 VA VA R
Deleatidium 8 VA VA R
Nesameletus 9 A R -
Zephlebia group 7 VA C C
PLECOPTERA (STONEFLIES) Acroperla 5 - R -
Austroperla 9 R - -
Zelandobius 5 VA VA A
Zelandoperla 8 C - -
COLEOPTERA (BEETLES) Elmidae 6 A VA VA
Ptilodactylidae 8 R C R
MEGALOPTERA (DOBSONFLIES) Archichauliodes 7 C VA R
TRICHOPTERA (CADDISFLIES) Hydropsyche (Aoteapsyche) 4 A A R
Costachorema 7 A C -
Hydrobiosis 5 R C -
Hydrobiosella 9 R - -
Neurochorema 6 - R -
Confluens 5 - R -
Pycnocentria 7 - A R
Pycnocentrodes 5 C A C
Triplectides 5 - - C
DIPTERA (TRUE FLIES) Aphrophila 5 C R R
Eriopterini 5 - - R
Chironomus 1 - - R
Maoridiamesa 3 A R -
Orthocladiinae 2 A C R
Polypedilum 3 C R C
Psychodidae 1 - - R
Austrosimulium 3 C C R
Tanyderidae 4 - R -
ACARINA (MITES) Acarina 5 - - R
No of taxa 23 25 26
MCI 115 106 86
SQMCIs 6.3 6.3 2.1
EPT (taxa) 13 14 8
%EPT (taxa) 57 56 31
'Tolerant' taxa 'Moderately sensitive' taxa 'Highly sensitive' taxa
R = Rare C = Common A = Abundant VA = Very Abundant XA = Extremely Abundant

Table 164 Macroinvertebrate fauna of the Huatoki Stream: summer SEM survey sampled on 8 March 2016
Taxa list Site Code MCI
score HTK000350 HTK000425 HTK000745
Sample Number FWB16144 FWB16145 FWB16146
NEMERTEA Nemertea 3 - - C
ANNELIDA (WORMS) Oligochaeta 1 C A XA
Branchiura 1 R - -
Lumbricidae 5 - - R
MOLLUSCA Latia 5 C C R
Potamopyrgus 4 A A XA
Sphaeriidae 3 - - R
CRUSTACEA Ostracoda 1 - - A
EPHEMEROPTERA (MAYFLIES) Austroclima 7 A A -
Coloburiscus 7 VA VA R
Deleatidium 8 VA VA -
Nesameletus 9 A C -
Zephlebia group 7 C A C
COLEOPTERA (BEETLES) Elmidae 6 VA VA A
Ptilodactylidae 8 C R -
MEGALOPTERA (DOBSONFLIES) Archichauliodes 7 C A -
TRICHOPTERA (CADDISFLIES) Hydropsyche (Aoteapsyche) 4 VA A -
Hydrobiosis 5 A C -
Neurochorema 6 R - -
Confluens 5 R - -
Oxyethira 2 C - -
Pycnocentria 7 - A -
Pycnocentrodes 5 A A -
Triplectides 5 - C C
DIPTERA (TRUE FLIES) Aphrophila 5 R R -
Eriopterini 5 - - R
Chironomus 1 - - R
Harrisius 6 - - R
Orthocladiinae 2 VA A R
Polypedilum 3 - A -
Tanypodinae 5 - - R
Tanytarsini 3 VA C -
Empididae 3 R - -
Muscidae 3 C - -
Austrosimulium 3 C A R
Tanyderidae 4 R R -
ACARINA (MITES) Acarina 5 R - R
No of taxa 26 22 18
MCI 96 105 82
SQMCIs 5.1 5.9 2.6
EPT (taxa) 10 10 3
%EPT (taxa) 38 45 17
'Tolerant' taxa 'Moderately sensitive' taxa 'Highly sensitive' taxa
R = Rare C = Common A = Abundant VA = Very Abundant XA = Extremely Abundant
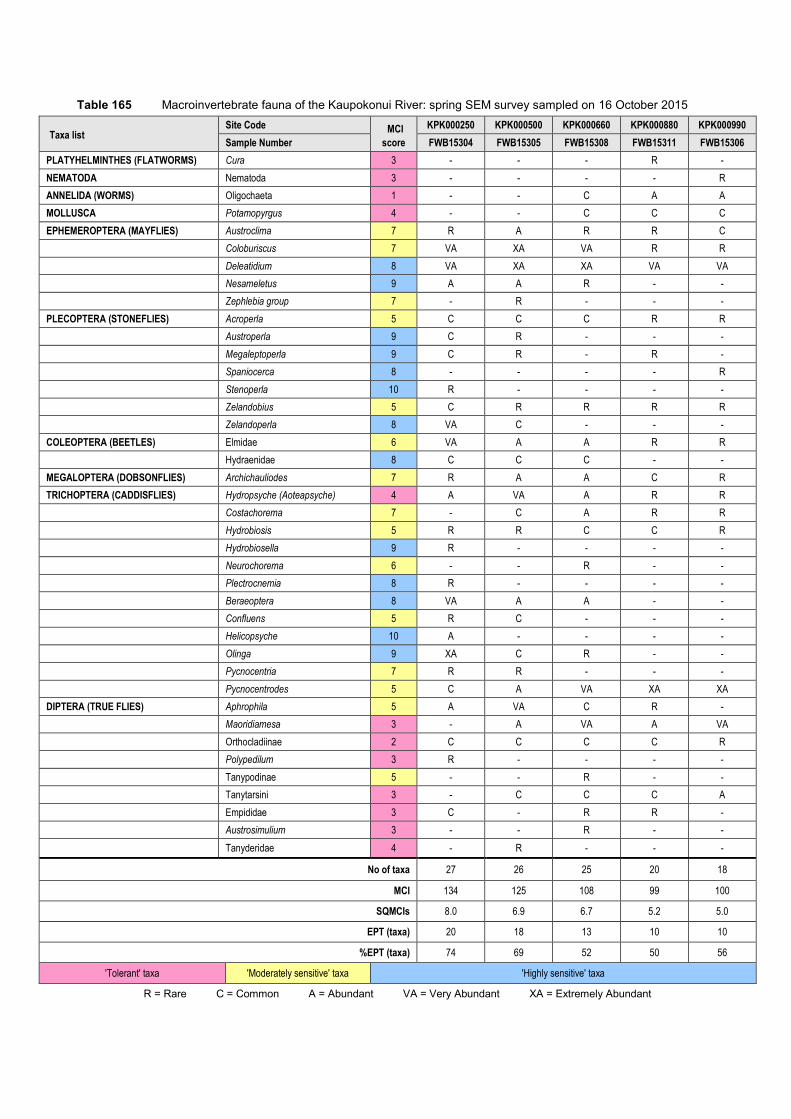
Table 165 Macroinvertebrate fauna of the Kaupokonui River: spring SEM survey sampled on 16 October 2015
Taxa list Site Code MCI
score KPK000250 KPK000500 KPK000660 KPK000880 KPK000990
Sample Number FWB15304 FWB15305 FWB15308 FWB15311 FWB15306
PLATYHELMINTHES (FLATWORMS) Cura 3 - - - R -
NEMATODA Nematoda 3 - - - - R
ANNELIDA (WORMS) Oligochaeta 1 - - C A A
MOLLUSCA Potamopyrgus 4 - - C C C
EPHEMEROPTERA (MAYFLIES) Austroclima 7 R A R R C
Coloburiscus 7 VA XA VA R R
Deleatidium 8 VA XA XA VA VA
Nesameletus 9 A A R - -
Zephlebia group 7 - R - - -
PLECOPTERA (STONEFLIES) Acroperla 5 C C C R R
Austroperla 9 C R - - -
Megaleptoperla 9 C R - R -
Spaniocerca 8 - - - - R
Stenoperla 10 R - - - -
Zelandobius 5 C R R R R
Zelandoperla 8 VA C - - -
COLEOPTERA (BEETLES) Elmidae 6 VA A A R R
Hydraenidae 8 C C C - -
MEGALOPTERA (DOBSONFLIES) Archichauliodes 7 R A A C R
TRICHOPTERA (CADDISFLIES) Hydropsyche (Aoteapsyche) 4 A VA A R R
Costachorema 7 - C A R R
Hydrobiosis 5 R R C C R
Hydrobiosella 9 R - - - -
Neurochorema 6 - - R - -
Plectrocnemia 8 R - - - -
Beraeoptera 8 VA A A - -
Confluens 5 R C - - -
Helicopsyche 10 A - - - -
Olinga 9 XA C R - -
Pycnocentria 7 R R - - -
Pycnocentrodes 5 C A VA XA XA
DIPTERA (TRUE FLIES) Aphrophila 5 A VA C R -
Maoridiamesa 3 - A VA A VA
Orthocladiinae 2 C C C C R
Polypedilum 3 R - - - -
Tanypodinae 5 - - R - -
Tanytarsini 3 - C C C A
Empididae 3 C - R R -
Austrosimulium 3 - - R - -
Tanyderidae 4 - R - - -
No of taxa 27 26 25 20 18
MCI 134 125 108 99 100
SQMCIs 8.0 6.9 6.7 5.2 5.0
EPT (taxa) 20 18 13 10 10
%EPT (taxa) 74 69 52 50 56
'Tolerant' taxa 'Moderately sensitive' taxa 'Highly sensitive' taxa
R = Rare C = Common A = Abundant VA = Very Abundant XA = Extremely Abundant

Table 166 Macroinvertebrate fauna of the Kaupokonui Stream: summer SEM survey sampled on 19 February 2015
Taxa list Site Code MCI
score KPK000250 KPK000500 KPK000660 KPK000880 KPK000990
Sample Number FWB16039 FWB16040 FWB16045 FWB16048 FWB16043
PLATYHELMINTHES (FLATWORMS) Cura 3 - R R - -
NEMERTEA Nemertea 3 - - C R -
ANNELIDA (WORMS) Oligochaeta 1 - C A C VA
MOLLUSCA Potamopyrgus 4 R C VA VA VA
CRUSTACEA Ostracoda 1 - - - R -
Paratya 3 - - - - C
EPHEMEROPTERA (MAYFLIES) Austroclima 7 C C C C C
Coloburiscus 7 VA C A R -
Deleatidium 8 VA A A A -
Nesameletus 9 A A - - -
PLECOPTERA (STONEFLIES) Austroperla 9 C - - - -
Megaleptoperla 9 C R - - -
Stenoperla 10 C - - - -
Zelandoperla 8 VA R - - -
HEMIPTERA (BUGS) Saldula 5 - R - R -
COLEOPTERA (BEETLES) Elmidae 6 A A A C R
Hydraenidae 8 C R R - -
MEGALOPTERA (DOBSONFLIES) Archichauliodes 7 C C A A R
TRICHOPTERA (CADDISFLIES) Hydropsyche (Aoteapsyche) 4 A A VA R A
Costachorema 7 - R - - -
Hydrobiosis 5 C A C C C
Neurochorema 6 - C - - -
Beraeoptera 8 A C - - -
Helicopsyche 10 C - - - -
Hudsonema 6 - - R - -
Olinga 9 VA - R - -
Oxyethira 2 - R A C C
Pycnocentrodes 5 A A C VA C
DIPTERA (TRUE FLIES) Aphrophila 5 A A A C -
Maoridiamesa 3 R VA - - -
Orthocladiinae 2 R VA VA VA VA
Polypedilum 3 R - - - -
Tanypodinae 5 - R - - -
Tanytarsini 3 - C A C VA
Empididae 3 - - C R -
Ephydridae 4 - R - - R
Muscidae 3 - R R A C
Austrosimulium 3 - - R R -
Tanyderidae 4 - - R - -
No of taxa 22 27 23 20 14 14
MCI 133 107 94 84 80 80
SQMCIs 7.6 4.1 3.9 4.1 2.7 2.7
EPT (taxa) 14 12 8 6 4 4
%EPT (taxa) 64 44 35 30 29 29
'Tolerant' taxa 'Moderately sensitive' taxa 'Highly sensitive' taxa
R = Rare C = Common A = Abundant VA = Very Abundant XA = Extremely Abundant

Table 167 Macroinvertebrate fauna of the Katikara Stream: spring SEM survey sampled on 12 October 2015
Taxa list Site Code MCI
score KTK000150 KTK000248
Sample Number FWB15263 FWB15264
NEMERTEA Nemertea 3 - R
ANNELIDA (WORMS) Oligochaeta 1 - A
MOLLUSCA Latia 5 - R
Potamopyrgus 4 - A
Sphaeriidae 3 - R
EPHEMEROPTERA (MAYFLIES) Austroclima 7 - R
Coloburiscus 7 R A
Deleatidium 8 A VA
Nesameletus 9 C -
PLECOPTERA (STONEFLIES) Acroperla 5 C R
Austroperla 9 C -
Stenoperla 10 R -
Zelandobius 5 A A
Zelandoperla 8 A R
COLEOPTERA (BEETLES) Elmidae 6 - C
Ptilodactylidae 8 - R
Scirtidae 8 R -
Staphylinidae 5 - R
MEGALOPTERA (DOBSONFLIES) Archichauliodes 7 R C
TRICHOPTERA (CADDISFLIES) Hydropsyche (Aoteapsyche) 4 - A
Costachorema 7 R C
Hydrobiosis 5 - C
Hydrobiosella 9 R -
Beraeoptera 8 - R
Pycnocentrodes 5 - A
DIPTERA (TRUE FLIES) Aphrophila 5 R A
Maoridiamesa 3 R VA
Orthocladiinae 2 A A
Polypedilum 3 R C
Tanypodinae 5 - R
Empididae 3 - R
Austrosimulium 3 - C
ACARINA (MITES) Acarina 5 R -
No of taxa 17 27
MCI 129 100
SQMCIs 6.1 4.9
EPT (taxa) 10 11
%EPT (taxa) 59 41
'Tolerant' taxa 'Moderately sensitive' taxa 'Highly sensitive' taxa
R = Rare C = Common A = Abundant VA = Very Abundant XA = Extremely Abundant
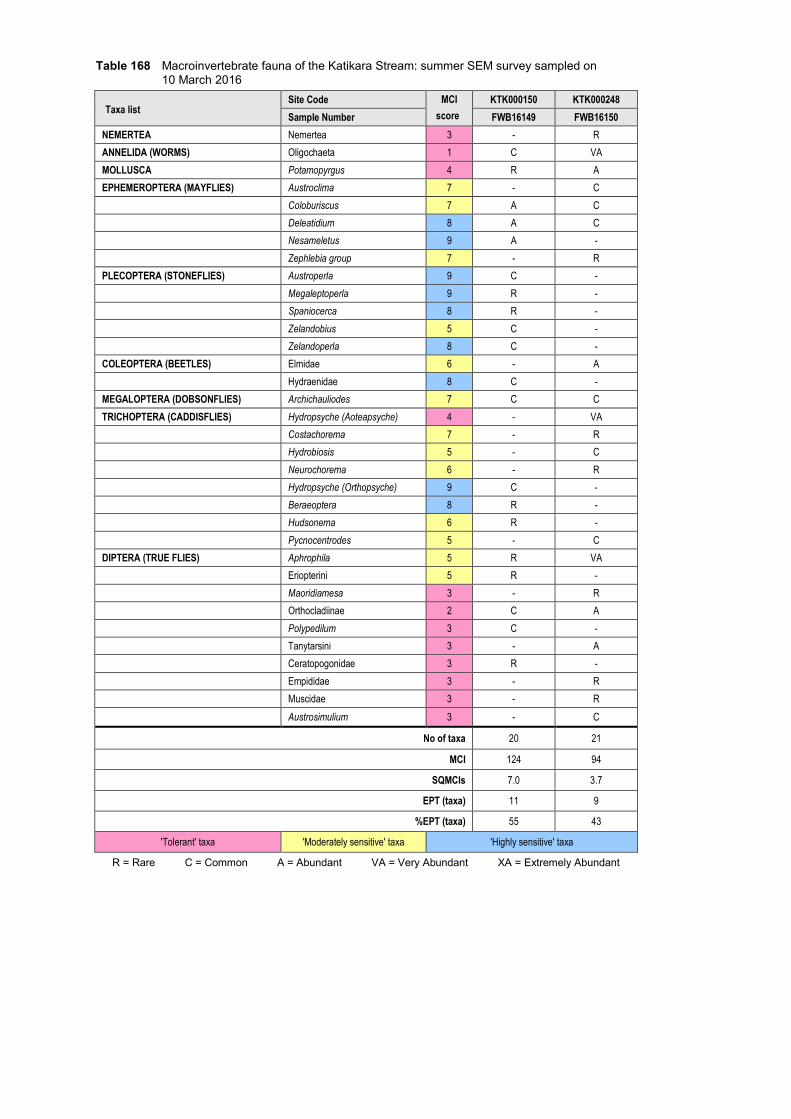
Table 168 Macroinvertebrate fauna of the Katikara Stream: summer SEM survey sampled on 10 March 2016
Taxa list Site Code MCI
score KTK000150 KTK000248
Sample Number FWB16149 FWB16150
NEMERTEA Nemertea 3 - R
ANNELIDA (WORMS) Oligochaeta 1 C VA
MOLLUSCA Potamopyrgus 4 R A
EPHEMEROPTERA (MAYFLIES) Austroclima 7 - C
Coloburiscus 7 A C
Deleatidium 8 A C
Nesameletus 9 A -
Zephlebia group 7 - R
PLECOPTERA (STONEFLIES) Austroperla 9 C -
Megaleptoperla 9 R -
Spaniocerca 8 R -
Zelandobius 5 C -
Zelandoperla 8 C -
COLEOPTERA (BEETLES) Elmidae 6 - A
Hydraenidae 8 C -
MEGALOPTERA (DOBSONFLIES) Archichauliodes 7 C C
TRICHOPTERA (CADDISFLIES) Hydropsyche (Aoteapsyche) 4 - VA
Costachorema 7 - R
Hydrobiosis 5 - C
Neurochorema 6 - R
Hydropsyche (Orthopsyche) 9 C -
Beraeoptera 8 R -
Hudsonema 6 R -
Pycnocentrodes 5 - C
DIPTERA (TRUE FLIES) Aphrophila 5 R VA
Eriopterini 5 R -
Maoridiamesa 3 - R
Orthocladiinae 2 C A
Polypedilum 3 C -
Tanytarsini 3 - A
Ceratopogonidae 3 R -
Empididae 3 - R
Muscidae 3 - R
Austrosimulium 3 - C
No of taxa 20 21
MCI 124 94
SQMCIs 7.0 3.7
EPT (taxa) 11 9
%EPT (taxa) 55 43
'Tolerant' taxa 'Moderately sensitive' taxa 'Highly sensitive' taxa
R = Rare C = Common A = Abundant VA = Very Abundant XA = Extremely Abundant

Table 169 Macroinvertebrate fauna of the Kapoaiaia Stream: spring SEM survey sampled on 12 October 2015
Taxa list Site Code MCI
score KPA000250 KPA000700 KPA000950
Sample Number FWB15260 FWB15261 FWB15262
NEMATODA Nematoda 3 - - R
ANNELIDA (WORMS) Oligochaeta 1 - - R
MOLLUSCA Potamopyrgus 4 - C C
EPHEMEROPTERA (MAYFLIES) Austroclima 7 R - R
Coloburiscus 7 VA A R
Deleatidium 8 XA VA A
Nesameletus 9 C R -
Zephlebia group 7 R - -
PLECOPTERA (STONEFLIES) Acroperla 5 C A -
Austroperla 9 R - -
Megaleptoperla 9 R R -
Zelandobius 5 R R C
Zelandoperla 8 VA R -
COLEOPTERA (BEETLES) Elmidae 6 C C R
Hydraenidae 8 R R -
MEGALOPTERA (DOBSONFLIES) Archichauliodes 7 - C C
TRICHOPTERA (CADDISFLIES) Hydropsyche (Aoteapsyche) 4 R C C
Costachorema 7 C C -
Hydrobiosis 5 R - C
Beraeoptera 8 A - -
Olinga 9 C - -
Pycnocentria 7 - R -
Pycnocentrodes 5 A R A
DIPTERA (TRUE FLIES) Aphrophila 5 C C C
Eriopterini 5 - R -
Maoridiamesa 3 R A VA
Orthocladiinae 2 R A A
Tanytarsini 3 - R -
Empididae 3 R R R
Austrosimulium 3 R - R
Tabanidae 3 R - -
No of taxa 24 21 17
MCI 121 114 92
SQMCIs 7.7 6.2 4.0
EPT (taxa) 16 11 7
%EPT (taxa) 67 52 41
'Tolerant' taxa 'Moderately sensitive' taxa 'Highly sensitive' taxa
R = Rare C = Common A = Abundant VA = Very Abundant XA = Extremely Abundant

Table 170 Macroinvertebrate fauna of the Kapoaiaia Stream: summer SEM survey sampled on 10 March 2016
Taxa list Site Code MCI
score KPA000250 KPA000700 KPA000950
Sample Number FWB16151 FWB16152 FWB16153
NEMATODA Nematoda 3 - R -
ANNELIDA (WORMS) Oligochaeta 1 - C A
Lumbricidae 5 - - R
MOLLUSCA Potamopyrgus 4 - C C
EPHEMEROPTERA (MAYFLIES) Austroclima 7 C C C
Coloburiscus 7 A A -
Deleatidium 8 XA VA C
Nesameletus 9 A R -
Zephlebia group 7 R R -
PLECOPTERA (STONEFLIES) Austroperla 9 R - -
Megaleptoperla 9 R - -
Zelandoperla 8 C R -
COLEOPTERA (BEETLES) Elmidae 6 A A A
Hydraenidae 8 R R -
MEGALOPTERA (DOBSONFLIES) Archichauliodes 7 C C C
TRICHOPTERA (CADDISFLIES) Hydropsyche (Aoteapsyche) 4 A A A
Costachorema 7 R R -
Hydrobiosis 5 C C C
Plectrocnemia 8 R - -
Beraeoptera 8 C R -
Helicopsyche 10 R R -
Olinga 9 C R -
Oxyethira 2 - C R
Pycnocentrodes 5 A A R
DIPTERA (TRUE FLIES) Aphrophila 5 C A A
Maoridiamesa 3 C C -
Orthocladiinae 2 A VA A
Polypedilum 3 R - -
Tanytarsini 3 - A A
Empididae 3 - C -
Ephydridae 4 - - C
Muscidae 3 - C C
Austrosimulium 3 R C R
No of taxa 24 27 17
MCI 131 109 87
SQMCIs 7.4 4.9 3.9
EPT (taxa) 16 13 5
%EPT (taxa) 67 48 29
'Tolerant' taxa 'Moderately sensitive' taxa 'Highly sensitive' taxa
R = Rare C = Common A = Abundant VA = Very Abundant XA = Extremely Abundant

Table 171 Macroinvertebrate fauna of the Kurapete Stream: spring SEM survey sampled on 15 October 2015
Taxa list Site Code MCI
score KRP000300 KRP000660
Sample Number FWB15300 FWB15301
NEMERTEA Nemertea 3 R -
NEMATODA Nematoda 3 R R
ANNELIDA (WORMS) Oligochaeta 1 VA VA
Lumbricidae 5 R -
MOLLUSCA Potamopyrgus 4 A A
EPHEMEROPTERA (MAYFLIES) Austroclima 7 A A
Coloburiscus 7 A A
Deleatidium 8 A VA
Zephlebia group 7 VA A
PLECOPTERA (STONEFLIES) Acroperla 5 R R
Spaniocerca 8 - R
Zelandobius 5 R A
COLEOPTERA (BEETLES) Elmidae 6 A VA
Ptilodactylidae 8 R -
MEGALOPTERA (DOBSONFLIES) Archichauliodes 7 A A
TRICHOPTERA (CADDISFLIES) Hydropsyche (Aoteapsyche) 4 C C
Costachorema 7 R R
Hydrobiosis 5 C C
Hydrobiosella 9 - R
Neurochorema 6 - R
Hydropsyche (Orthopsyche) 9 R -
Psilochorema 6 R -
Pycnocentria 7 R R
Pycnocentrodes 5 - C
DIPTERA (TRUE FLIES) Aphrophila 5 C C
Eriopterini 5 C -
Maoridiamesa 3 R A
Orthocladiinae 2 VA XA
Polypedilum 3 R -
Tanypodinae 5 R -
Empididae 3 - R
Austrosimulium 3 C C
Tanyderidae 4 - R
No of taxa 27 25
MCI 104 105
SQMCIs 4.3 3.6
EPT (taxa) 12 14
%EPT (taxa) 44 56
'Tolerant' taxa 'Moderately sensitive' taxa 'Highly sensitive' taxa
R = Rare C = Common A = Abundant VA = Very Abundant XA = Extremely Abundant

Table 172 Macroinvertebrate fauna of the Kurapete Stream: summer SEM survey sampled on 31 March 2016
Taxa list Site Code MCI
score KRP000300 KRP000660
Sample Number FWB16185 FWB16186
NEMERTEA Nemertea 3 - C
ANNELIDA (WORMS) Oligochaeta 1 A VA
Lumbricidae 5 R -
MOLLUSCA Potamopyrgus 4 A A
CRUSTACEA Isopoda 5 R -
EPHEMEROPTERA (MAYFLIES) Austroclima 7 VA A
Coloburiscus 7 VA A
Deleatidium 8 - R
Zephlebia group 7 VA C
COLEOPTERA (BEETLES) Elmidae 6 VA A
Ptilodactylidae 8 R R
MEGALOPTERA (DOBSONFLIES) Archichauliodes 7 A A
TRICHOPTERA (CADDISFLIES) Hydropsyche (Aoteapsyche) 4 A VA
Costachorema 7 - R
Hydrobiosis 5 R C
Neurochorema 6 R C
Hydropsyche (Orthopsyche) 9 R -
Beraeoptera 8 - R
Oxyethira 2 - R
Pycnocentria 7 A A
Pycnocentrodes 5 - A
Triplectides 5 R -
DIPTERA (TRUE FLIES) Aphrophila 5 R C
Eriopterini 5 R -
Limonia 6 C -
Orthocladiinae 2 R A
Polypedilum 3 - R
Tanytarsini 3 - R
Empididae 3 R R
Muscidae 3 - R
Austrosimulium 3 C C
No of taxa 22 25
MCI 106 99
SQMCIs 6.3 4.0
EPT (taxa) 9 11
%EPT (taxa) 41 44
'Tolerant' taxa 'Moderately sensitive' taxa 'Highly sensitive' taxa
R = Rare C = Common A = Abundant VA = Very Abundant XA = Extremely Abundant
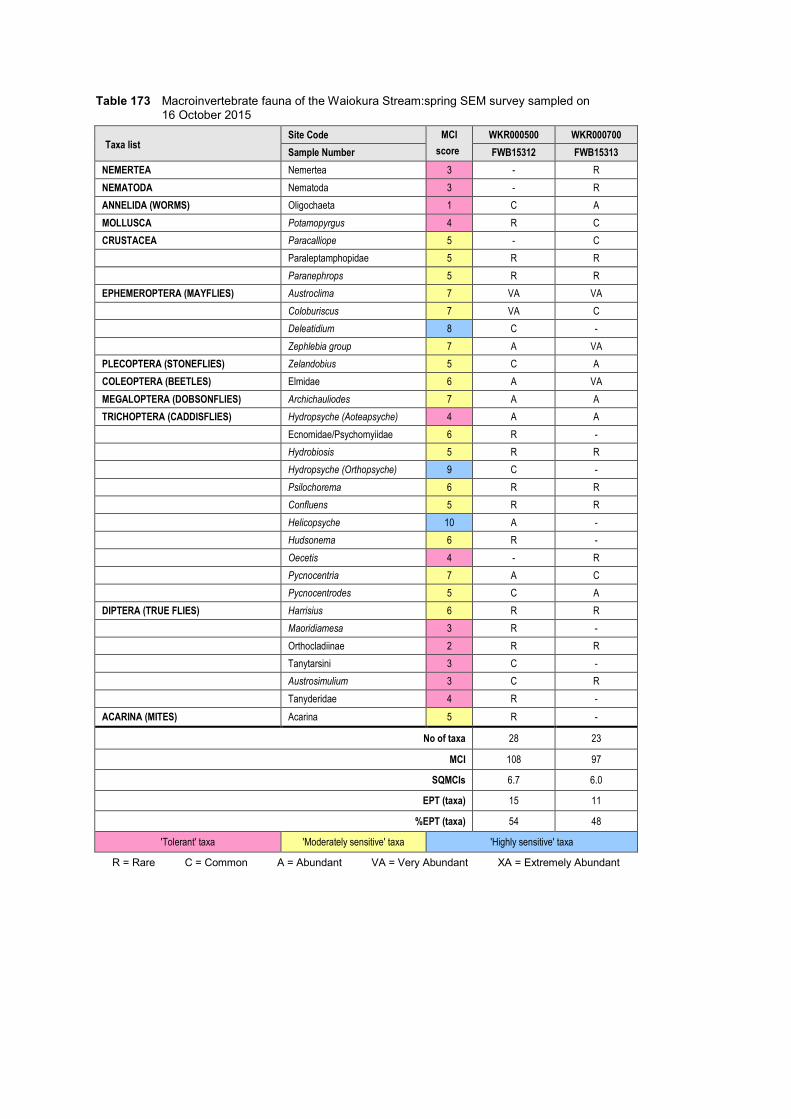
Table 173 Macroinvertebrate fauna of the Waiokura Stream:spring SEM survey sampled on 16 October 2015
Taxa list Site Code MCI
score WKR000500 WKR000700
Sample Number FWB15312 FWB15313
NEMERTEA Nemertea 3 - R
NEMATODA Nematoda 3 - R
ANNELIDA (WORMS) Oligochaeta 1 C A
MOLLUSCA Potamopyrgus 4 R C
CRUSTACEA Paracalliope 5 - C
Paraleptamphopidae 5 R R
Paranephrops 5 R R
EPHEMEROPTERA (MAYFLIES) Austroclima 7 VA VA
Coloburiscus 7 VA C
Deleatidium 8 C -
Zephlebia group 7 A VA
PLECOPTERA (STONEFLIES) Zelandobius 5 C A
COLEOPTERA (BEETLES) Elmidae 6 A VA
MEGALOPTERA (DOBSONFLIES) Archichauliodes 7 A A
TRICHOPTERA (CADDISFLIES) Hydropsyche (Aoteapsyche) 4 A A
Ecnomidae/Psychomyiidae 6 R -
Hydrobiosis 5 R R
Hydropsyche (Orthopsyche) 9 C -
Psilochorema 6 R R
Confluens 5 R R
Helicopsyche 10 A -
Hudsonema 6 R -
Oecetis 4 - R
Pycnocentria 7 A C
Pycnocentrodes 5 C A
DIPTERA (TRUE FLIES) Harrisius 6 R R
Maoridiamesa 3 R -
Orthocladiinae 2 R R
Tanytarsini 3 C -
Austrosimulium 3 C R
Tanyderidae 4 R -
ACARINA (MITES) Acarina 5 R -
No of taxa 28 23
MCI 108 97
SQMCIs 6.7 6.0
EPT (taxa) 15 11
%EPT (taxa) 54 48
'Tolerant' taxa 'Moderately sensitive' taxa 'Highly sensitive' taxa
R = Rare C = Common A = Abundant VA = Very Abundant XA = Extremely Abundant

Table 174 Macroinvertebrate fauna of the Waiokura Stream: summer SEM survey sampled on 9 February 2016
Taxa list Site Code MCI
score WKR000500 WKR000700
Sample Number FWB16049 FWB16051
NEMERTEA Nemertea 3 - C
NEMATODA Nematoda 3 R R
ANNELIDA (WORMS) Oligochaeta 1 R A
MOLLUSCA Ferrissia 3 - R
Potamopyrgus 4 C C
CRUSTACEA Ostracoda 1 R -
Paracalliope 5 R R
Paraleptamphopidae 5 A R
Paranephrops 5 R -
EPHEMEROPTERA (MAYFLIES) Austroclima 7 XA VA
Coloburiscus 7 C C
Deleatidium 8 R A
Zephlebia group 7 VA VA
PLECOPTERA (STONEFLIES) Zelandobius 5 R -
COLEOPTERA (BEETLES) Elmidae 6 A A
MEGALOPTERA (DOBSONFLIES) Archichauliodes 7 A A
TRICHOPTERA (CADDISFLIES) Hydropsyche (Aoteapsyche) 4 VA A
Hydrobiosis 5 C R
Hydropsyche (Orthopsyche) 9 R -
Psilochorema 6 R R
Oecetis 4 - R
Oxyethira 2 R -
Pycnocentria 7 C -
Triplectides 5 R -
DIPTERA (TRUE FLIES) Aphrophila 5 R -
Eriopterini 5 R -
Harrisius 6 R -
Polypedilum 3 C C
Tanytarsini 3 R -
Austrosimulium 3 A C
Tanyderidae 4 R R
ACARINA (MITES) Acarina 5 R -
No of taxa 29 20
MCI 99 95
SQMCIs 6.4 6.2
EPT (taxa) 11 8
%EPT (taxa) 38 40
'Tolerant' taxa 'Moderately sensitive' taxa 'Highly sensitive' taxa
R = Rare C = Common A = Abundant VA = Very Abundant XA = Extremely Abundant

Table 175 Macroinvertebrate fauna of the Tangahoe River: spring SEM survey sampled on 14 October 2015
Taxa list Site Code MCI
score TNH000090 TNH000200 TNH000515
Sample Number FWB15291 FWB15292 FWB15293
ANNELIDA (WORMS) Oligochaeta 1 R R R
Lumbricidae 5 R R -
MOLLUSCA Potamopyrgus 4 R C C
EPHEMEROPTERA (MAYFLIES) Austroclima 7 C C R
Coloburiscus 7 - C R
Deleatidium 8 A VA C
Mauiulus 5 - R -
Oniscigaster 10 R - -
Zephlebia group 7 C R -
PLECOPTERA (STONEFLIES) Acroperla 5 R C R
Zelandobius 5 R C R
COLEOPTERA (BEETLES) Elmidae 6 C VA A
Hydrophilidae 5 - C -
MEGALOPTERA (DOBSONFLIES) Archichauliodes 7 - - R
TRICHOPTERA (CADDISFLIES) Hydropsyche (Aoteapsyche) 4 - R -
Costachorema 7 - R -
Hydropsyche (Orthopsyche) 9 - R -
Psilochorema 6 - R -
Oecetis 4 - R -
Oxyethira 2 - C -
Pycnocentrodes 5 - C -
DIPTERA (TRUE FLIES) Aphrophila 5 - C R
Eriopterini 5 R - -
Orthocladiinae 2 R C C
Polypedilum 3 - R R
Tanytarsini 3 - - R
Empididae 3 - R -
Austrosimulium 3 R R R
Tanyderidae 4 - R -
ACARINA (MITES) Acarina 5 R - -
No of taxa 14 25 14
MCI 104 98 94
SQMCIs 6.8 6.4 5.2
EPT (taxa) 6 13 5
%EPT (taxa) 43 52 36
'Tolerant' taxa 'Moderately sensitive' taxa 'Highly sensitive' taxa
R = Rare C = Common A = Abundant VA = Very Abundant XA = Extremely Abundant

Table 176 Macroinvertebrate fauna of the Tangahoe River: summer SEM survey sampled on 15 March 2016
Taxa list Site Code MCI
score TNH000090 TNH000200 TNH000515
Sample Number FWB16157 FWB16158 FWB16159
NEMERTEA Nemertea 3 R - R
NEMATODA Nematoda 3 - - R
ANNELIDA (WORMS) Oligochaeta 1 R A C
MOLLUSCA Potamopyrgus 4 VA XA VA
CRUSTACEA Ostracoda 1 R - R
Paracalliope 5 - - C
Paratya 3 - - R
EPHEMEROPTERA (MAYFLIES) Austroclima 7 A A -
Coloburiscus 7 - C R
Deleatidium 8 A R -
Neozephlebia 7 R - -
Zephlebia group 7 A A R
PLECOPTERA (STONEFLIES) Acroperla 5 - C -
Megaleptoperla 9 C - -
COLEOPTERA (BEETLES) Elmidae 6 VA A VA
Ptilodactylidae 8 R - -
MEGALOPTERA (DOBSONFLIES) Archichauliodes 7 R C C
TRICHOPTERA (CADDISFLIES) Hydropsyche (Aoteapsyche) 4 - A XA
Costachorema 7 R R -
Hydrobiosis 5 - C R
Psilochorema 6 R - -
Oxyethira 2 - C R
Paroxyethira 2 - - R
Pycnocentrodes 5 - R A
Triplectides 5 R R -
DIPTERA (TRUE FLIES) Aphrophila 5 - C C
Eriopterini 5 R - -
Hexatomini 5 R - -
Limonia 6 R - -
Harrisius 6 - R -
Orthocladiinae 2 - R A
Polypedilum 3 - C C
Tanytarsini 3 - A A
Paradixa 4 R - -
Empididae 3 - R -
Ephydridae 4 - R -
Psychodidae 1 R - -
Austrosimulium 3 A C -
Tanyderidae 4 R R -
No of taxa 22 24 20
MCI 104 94 78
SQMCIs 5.4 4.2 4.2
EPT (taxa) 8 10 5
%EPT (taxa) 36 42 25
'Tolerant' taxa 'Moderately sensitive' taxa 'Highly sensitive' taxa
R = Rare C = Common A = Abundant VA = Very Abundant XA = Extremely Abundant

Table 177 Macroinvertebrate fauna of the Whenuakura River: spring SEM survey sampled on 14 October 2015
Taxa list Site Code MCI
score WNR000450
Sample Number FWB15294
ANNELIDA (WORMS) Oligochaeta 1 C
Lumbricidae 5 R
MOLLUSCA Potamopyrgus 4 C
CRUSTACEA Paracalliope 5 R
Paratya 3 R
EPHEMEROPTERA (MAYFLIES) Austroclima 7 R
Deleatidium 8 A
Zephlebia group 7 C
PLECOPTERA (STONEFLIES) Acroperla 5 A
Zelandobius 5 C
COLEOPTERA (BEETLES) Elmidae 6 C
TRICHOPTERA (CADDISFLIES) Oxyethira 2 R
DIPTERA (TRUE FLIES) Eriopterini 5 R
Orthocladiinae 2 VA
Tanypodinae 5 R
Tanytarsini 3 A
Austrosimulium 3 R
No of taxa 17
MCI 89
SQMCIs 3.5
EPT (taxa) 5
%EPT (taxa) 29
'Tolerant' taxa 'Moderately sensitive' taxa 'Highly sensitive' taxa
R = Rare C = Common A = Abundant VA = Very Abundant XA = Extremely Abundant

Table 178 Macroinvertebrate fauna of the Whenuakura River: summer SEM survey sampled on 15 March 2016
Taxa list Site Code MCI
score WNR000450
Sample Number FWB16156
ANNELIDA (WORMS) Oligochaeta 1 A
Lumbricidae 5 R
MOLLUSCA Potamopyrgus 4 VA
CRUSTACEA Paracalliope 5 VA
Paratya 3 C
EPHEMEROPTERA (MAYFLIES) Austroclima 7 C
COLEOPTERA (BEETLES) Elmidae 6 VA
Hydrophilidae 5 C
TRICHOPTERA (CADDISFLIES) Hydropsyche (Aoteapsyche) 4 A
Hydrobiosis 5 R
Oecetis 4 R
Oxyethira 2 R
Paroxyethira 2 R
Triplectides 5 R
DIPTERA (TRUE FLIES) Aphrophila 5 R
Eriopterini 5 R
Orthocladiinae 2 R
Tanytarsini 3 VA
No of taxa 18
MCI 81
SQMCIs 4.3
EPT (taxa) 5
%EPT (taxa) 28
'Tolerant' taxa 'Moderately sensitive' taxa 'Highly sensitive' taxa
R = Rare C = Common A = Abundant VA = Very Abundant XA = Extremely Abundant

Table 179 Macroinvertebrate fauna of the Herekawe Stream: spring SEM survey sampled 12 October 2015
Taxa list Site Code MCI
score HRK000085
Sample Number FWB15265
ANNELIDA (WORMS) Oligochaeta 1 C
MOLLUSCA Potamopyrgus 4 VA
CRUSTACEA Paracalliope 5 C
Paratya 3 R
EPHEMEROPTERA (MAYFLIES) Austroclima 7 A
Coloburiscus 7 C
Deleatidium 8 R
Zephlebia group 7 R
PLECOPTERA (STONEFLIES) Acroperla 5 R
COLEOPTERA (BEETLES) Elmidae 6 R
Ptilodactylidae 8 R
TRICHOPTERA (CADDISFLIES) Hydropsyche (Aoteapsyche) 4 R
Hydrobiosis 5 R
Hydropsyche (Orthopsyche) 9 R
Oxyethira 2 R
Pycnocentria 7 R
Pycnocentrodes 5 R
DIPTERA (TRUE FLIES) Aphrophila 5 C
Eriopterini 5 R
Orthocladiinae 2 A
Polypedilum 3 C
Austrosimulium 3 C
Tanyderidae 4 R
No of taxa 23
MCI 100
SQMCIs 4.2
EPT (taxa) 10
%EPT (taxa) 43
'Tolerant' taxa 'Moderately sensitive' taxa 'Highly sensitive' taxa
R = Rare C = Common A = Abundant VA = Very Abundant XA = Extremely Abundant

Table 180 Macroinvertebrate fauna of the Herekawe Stream: summer SEM survey sampled on 8 March 2016
Taxa list Site Code MCI
score HRK000085
Sample Number FWB16147
ANNELIDA (WORMS) Oligochaeta 1 A
MOLLUSCA Potamopyrgus 4 VA
CRUSTACEA Paracalliope 5 A
Paranephrops 5 R
EPHEMEROPTERA (MAYFLIES) Coloburiscus 7 R
COLEOPTERA (BEETLES) Elmidae 6 R
TRICHOPTERA (CADDISFLIES) Hydrobiosis 5 R
Oxyethira 2 A
Triplectides 5 R
DIPTERA (TRUE FLIES) Aphrophila 5 C
Orthocladiinae 2 C
Tanytarsini 3 R
Austrosimulium 3 C
Tanyderidae 4 R
No of taxa 14
MCI 81
SQMCIs 3.5
EPT (taxa) 3
%EPT (taxa) 21
'Tolerant' taxa 'Moderately sensitive' taxa 'Highly sensitive' taxa
R = Rare C = Common A = Abundant VA = Very Abundant XA = Extremely Abundant
Appendix II
Summary of SEM sites’ information, 2015-2016 and historical MCI scores, predicted scores
and 1995-2016 trends


Summary of MCI scores at all SEM sites: significance in relation to various predictive methodologies (Stark and Fowles, 2009; Leathwick, 2008), and trends over the SEM period 1995 to 2016
Site code River Environment
Classification (REC) Altitude (masl)
Distance from National Park
(km)
MCI Values Trends (1995-2016)
Ecological importance SEM 1995 to 2016 Predicted
Spring 2015
Summer 2016
1995-2016
Median stream 'health'
category Altitude1 Distance1
Median of similar
streams REC2 P value FDR p value + / - BPJ
Range Medians
Spring Summer Overall Generic3
STY000300 CX/H/VA/S/MO/MG 160 7.3 125 112 64-160 112 113 113 Good 101[+] 109[0] 108[0] 128[-] 0.087 0.139 -ve -
STY000400 CX/H/VA/S/MO/MG 70 12.5 105 113 0-160 107 109 108 Good 92[+] 103[0] 98[0] 115[0] 0.992 0.992 -ve -
TMR000150 CX/H/VA/IF/LO/HG 420 0 146^ 144 119-146 136 138 138 Very good 127[0] 132[0] 134[0] 141[0] 0.297 0.383 +ve -
TMR000375 CX/L/VA/P/MO/MG 100 10.9 105 114 89-120 106 102 102 Good 95[0] 105[0] 102[0] 117[-] <0.001 <0.001 +ve Yes
MRK000420 WW/L/VA/P/MO/LG 60 N/A 98 87 75-105 92 89 90 Fair N/A N/A 79[+] 92[0] <0.001 <0.001 +ve Yes
WGA000260 CX/L/VA/P/MO/LG 140 16.1 104 96 82-112 99 96 96 Fair 99[0] 100[0] 102[0] 99[0] 0.029 0.049 +ve No
WGA000450 WW/L/VA/P/MO/LG 20 31.2 96 91 72-102 93 87 90 Fair 86[0] 93[0] 90[0] 88[0] <0.001 <0.001 +ve Yes
WKH000100 CX/H/VA/IF/LO/HG 460 0 130 131 115-147 131 126 130 Very good 131[0] 132[0] 134[0] 137[0] 0.445 0.549 +ve -
WKH000500 CX/H/VA/P/MO/MG 175 10.6 125^ 111 87-125 112 108 111 Good 102[0] 105[0] 108[0] 115[0] <0.001 0.002 +ve Yes
WKH000920 CX/H/VA/P/HO/LG 20 26.6 92 93 71-110 99 91 94 Fair 86[0] 95[0] 90[0] 97[0] 0.618 0.697 +ve -
WKH000950 CX/H/VA/P/HO/LG 2 28.4 79 99 70-111 92 83 88 Fair 85[0] 94[0] 90[0] 97[0] 0.556 0.640 +ve -
MGE000970 CX/L/VA/P/MO/LG 90 15.6 106 98 86-113 102 99 102 Good 94[0] 101(0) 102[0] 101[0] 0.137 0.202 -ve -
MGN000195 CX/H/VA/P/MO/LG 330 8.7 133 121 113-143 130 123 126 Very good 118[0] 107[+] 119[0] 124[0] 0.482 0.581 -ve -
MGN000427 CX/L/VA/P/HO/MG 140 37.9 110 95 77-115 102 96 98 Fair 99[0] 91[0] 102[0] 103[0] 0.200 0.287 +ve -
MKW000200 CX/H/VA/IF/MO/MG 380 2.3 130 120 100-141 131 123 128 Very good 123[0] 121[0] 129[0] 130[0] 0.659 0.728 -ve -
MKW000300 CX/H/VA/P/MO/LG 150 15.5 119^ 111 90-119 109 104 107 Good 100[0] 101[0] 102[0] 111[0] 0.001 0.004 +ve Yes
WTR000540 WX/L/SS/P/HO/LG 100 N/A 99^ 98 98-99 99 98 99 Fair N/A N/A 93[0] 110[-] N/T N/T -ve N/T
WTR000850 WX/L/SS/P/HO/LG 15 N/A 100 85 64-107 91 81 86 Fair N/A N/A 78[0] 98[-] 0.012 0.0024 +ve Yes
MGT000488 WN/L/VA/P/LO/LG 30 N/A 81 72 56-91 78 79 78 Poor N/A N/A 68[0] 80[0] 0.304 0.383 +ve -
MGT000520 WW/L/VA/U/LO/LG 20 N/A 76 79^ 44-79 65 67 65 Poor N/A N/A 79[-] 88[-] <0.001 <0.001 +ve Yes
WMK000100 WW/L/VA/P/LO/HG 160 0 135 128 121-141 132 130 131 Very good 101[+] 132[0] 108[-] 128[0] 0.915 0.932 +ve -
WMK000298 WW/L/VA/P/MO/MG 1 4.0 105^ 96 75-105 94 88 91 Fair 85[0] 116[-] 90[0] 103[-] 0.002 0.004 +ve Yes
WAI000110 WW/L/VA/P/MO/LG 50 N/A 101^ 88 80-101 92 88 90 Fair N/A N/A 79[+] 91[0] 0.001 0.003 +ve Yes
PNH000200 CX/H/YA/IF/MO/MG 270 4.4 127 120 104-137 128 120 123 Very good 112[0] 115[0] 113[0] 121[0] 0.002 0.004 +ve Yes
PNH000900 CW/L/VA/P/MO/LG 20 20.9 92 85 70-114 92 84 89 Fair 86[0] 98[0] 90[0] 100[-] <0.001 <0.001 +ve Yes
PAT000200 CX/H/VA/IF/MO/MG 500 1.9 135 141 127-145 138 137 138 Very good 135[0] 125[+] 134[0] 129[0] 0.493 0.581 +ve -
PAT000315 CX/H/VA/P/MO/LG 300 124 114 113 99-130 115 108 111 Good 115[0] 103[0] 119[0] 112[0] 0.120 0.181 +ve -
PAT000360 CW/L/VA/P/HO/LG 240 19.2 99 96 86-105 99 96 98 Fair 109[-] 99[0] 101[0] 109[-] 0.250 0.340 +ve -
MGH000950 CW/L/SS/P/HO/LG 120 N/A 101 92 77-104 94 91 92 Fair N/A N/A 93[0] 117[-] <0.001 <0.001 +ve Yes
WGG000115 CX/H/VA/IF/LO/MG 540 0.7 132 144^ 122-144 132 134 132 Very good 140[0] 132[0] 134[0] 131[0] 0.115 0.179 +ve -
WGG000150 CX/H/VA/P/LO/MG 380 7.2 124 125 119-139 132 126 129 Very good 123[0] 110[+] 129[0] 124[0] 0.915 0.932 +ve -
WGG000500 CW/L/VA/P/MO/LG 200 23.0 112 109 91-124 103 101 102 Good 105[0] 97[0] 101[0] 110[0] <0.001 <0.001 +ve Yes
WGG000665 CW/L/VA/P/HO/MG 180 29.6 96 89 77-111 98 93 95 Fair 103[0] 94[0] 108[-] 102[0] 0.005 0.010 +ve No
WGG000895 CW/L/VA/P/HO/LG 40 63.0 83 94 73-106 96 94 95 Fair 89[0] 85[0] 93[0] 92[0] 0.218 0.304 +ve -
WGG000995 CW/L/VA/P/HO/MG 5 66.6 91 86 69-100 93 86 91 Fair 85[0] 85[0] 90[0] 95[0] 0.005 0.010 +ve No
MWH000380 WW/L/M/P/MO/LG 200 N/A 83 72 58-85 76 74 75 Poor N/A N/A 79[0] 92[-] 0.002 0.005 +ve No
MWH000490 CN/L/VA/P/MO/LG 190 N/A 90 83 63-102 81 78 79 Poor N/A N/A 81[0] 93[-] <0.001 <0.001 +ve Yes
HTK000350 WX/L/VA/P/MO/LG 60 N/A 115^ 96 79-115 100 94 96 Fair N/A N/A 95[0] 95[0] <0.001 <0.001 +ve Yes
HTK000425 WW/L/VA/P/MO/LG 30 N/A 106 105 91-115 105 102 104 Good N/A N/A 102[0] 92[+] <0.0001 <0.001 +ve No
HTK000745 WW/L/VA/U/MO/MG 5 N/A 86 82 62-101 85 86 86 Fair N/A N/A 84[0] 93[0] 0.757 0.802 -ve -
KPK000250 CX/H/VA/IF/MO/MG 380 3.3 134 133 124-138 130 128 129 Very good 123[0] 118[+] 129[0] 137[0] 0.258 0.342 +ve -
KPK000500 CX/H/VA/P/MO/MG 260 9.2 125 107 98-133 121 111 117 Good 111[0] 107[0] 113[0] 127[0] <0.001 0.002 +ve Yes
KPK000660 CX/H/VA/P/MO/LG 170 15.5 108 80 71-128 107 102 103 Good 102[0] 101[0] 108[0] 122[-] <0.001 <0.001 +ve Yes
KPK000880 CW/H/VA/P/MO/LG 60 25.7 99 94 66-110 93 87 91 Fair 91[0] 95[0] 98[0] 106[-] 0.022 0.039 +ve Yes
KPK000990 CW/L/VA/P/HO/LG 5 31.1 100 84 69-103 94 87 91 Fair 85[0] 93[0] 90[0] 96[0] 0.017 0.030 +ve Yes
KTK000150 CW/L/VA/P/HO/LG 420 0 129 124 112-148 137 135 136 Very good 127[0] 132[0] 134[0] 131[0] 0.016 0.030 -ve Yes
KTK000248 WX/L/VA/P/MO/LG 5 18.1 100 94 87-118 102 102 102 Good 85[+] 99[0] 90[-] 96[0] 0.716 0.803 +ve -
KPA000250 CX/H/VA/P/MO/MG 240 5.7 121 131^ 83-131 120 112 116 Good 109[0] 112[0] 101[-] 111[0] <0.001 <0.001 +ve Yes
KPA000700 CX/H/VA/P/MO/MG 140 13.5 114 109 78-118 96 93 95 Fair 99[0] 103[0] 102[0] 105[0] <0.001 <0.001 +ve Yes
KPA000950 CX/L/VA/P/MO/LG 20 25.2 92 87 76-101 89 81 86 Fair 86[0] 96[0] 90[0] 99[-] 0.076 0.125 +ve -
KRP000300 WX/L/VA/P/LO/LG 180 N/A 104 106^ 80-106 94 95 94 Fair N/A N/A 89[0] 92[0] <0.001 <0.001 +ve Yes
KRP000660 WW/L/VA/P/LO/LG 120 N/A 105 99 70-112 96 91 93 Fair N/A N/A 102[0] 102[0] <0.001 <0.001 +ve Yes
WKR000500 WW/L/VA/P/MO/LG 150 N/A 108 99 88-114 102 98 99 Fair N/A N/A 102[0] 97[0] <0.001 <0.001 +ve Yes
WKR000700 WW/L/VA/P/MO/LG 70 N/A 97 95 92-109 99 99 99 Fair N/A N/A 98[0] 95[0] N/T N/T +ve N/T
TNH000090 WW/L/SS/P/MO/LG 85 N/A 104 104 90-107 96 101 100 Good N/A N/A 93[0] 110[-] N/T N/T +ve N/T
TNH000200 WW/L/SS/P/HO/LG 65 N/A 98 94 92-108 104 104 103 Good N/A N/A 102[0] 108[0] N/T N/T -ve N/T
TNH000515 WW/L/SS/P/HO/LG 15 N/A 94 78* 84-104 88 96 94 Fair N/A N/A 78[+] 95[0] N/T N/T +ve N/T
WNR000450 WW/L/SS/P/HO/LG 20 N/A 89^ 81 81-89 89 81 85 Fair N/A N/A 78[0] 109[-] N/T N/T -ve N/T
HRK000085 WW/L/VA/U/MO/MG 5 N/A 100^ 81 68-100 89 88 89 Fair N/A N/A 79[0] 89[0] 0.006 0.013 +ve Yes
Notes: ( ) = affected by headwater erosion events; [+/-] = median score ecologically significant deviation from predicted scores; Trend significant/not significant at p<0.05; N/A = non-ringplain source inside NP sites; N/As = soft-bedded sites;^ = highest recorded MCI score for that site; * = lowest recorded MCI score for that site, 1 = Stark and Fowles, 2009’ 2 = Leathwick, 2009; 3 =TRC generic health categories (Table 2); N/T = not trended (insufficient data at present).