wavewatch iii validation - national oceanic and ...polar.ncep.noaa.gov/waves/workshop/pdfs/ · grid...
TRANSCRIPT

Version 1.1, Jan 2010 WW Workshop 1.3 1/31
WAVEWATCH III® validationPresent and future
Arun ChawlaSAIC @ Marine Modeling and Analysis BranchNOAA / NWS / NCEP / EMC
Version 1.1, Jan 2010 WW Workshop 1.3 2/31
History of WAVEWATCH III® Validation Studies
WAVEWATCH III has gone through multiple validation studies since its development (mid 1990s). Some of the notable ones are mentioned here
Tolman, H. L., 1998b: Validation of a new global wave forecast system at NCEP. In: Ocean Wave Measurements and Analysis, B.L. Edge and J.M. Helmsley, Eds., ASCE, 777786 Tolman, H. L., 2002e: Testing of WAVEWATCH III version 2.22 in NCEP's NWW3 ocean wave model suite. NOAA / NWS / NCEP / OMB Technical Note Nr. 214, 99 pp. Tolman, H. L., 2002b: Validation of WAVEWATCH III version 1.15 for a global domain. NOAA / NWS / NCEP / OMB Technical Note Nr. 213, 33 pp.
More validation plots for WAVEWATCH III v 2.22 can be found at
http://polar.ncep.noaa.gov/waves/validation.html Here we shall concentrate on validation studies for the
multigrid version of WAVEWATCH III (v 3.14)
Version 1.1, Jan 2010 WW Workshop 1.3 3/31
MODEL – DATA comparisons
Modeling System8 grid global system using the twoway coupled multigrid WAVEWATCH IIITM modelModel forced with GFS winds and sea ice derived from daily passive microwave analysis
AnalysisAnalysis includes regular forecasts (4 cycles a data) and a 5 year hindcast (20052009)Collocated model – altimeter comparisons with Jason1 satellite dataComparison of bulk spectral parameters with a global network of buoysSpectral analysis (at select buoy locations) with IMEDS (Interactive Model Evaluation and Diagnostics System)

Version 1.1, Jan 2010 WW Workshop 1.3 4/31
MODEL GRIDS
Grid resolution in minutes
Version 1.1, Jan 2010 WW Workshop 1.3 5/31
Error Metrics
( )100
1
1
0
2
×−−
=∑
∑H
N
bHHNSI
om
( )∑ −= om HHN
b1
( )∑ −= 21om HH
NRMS
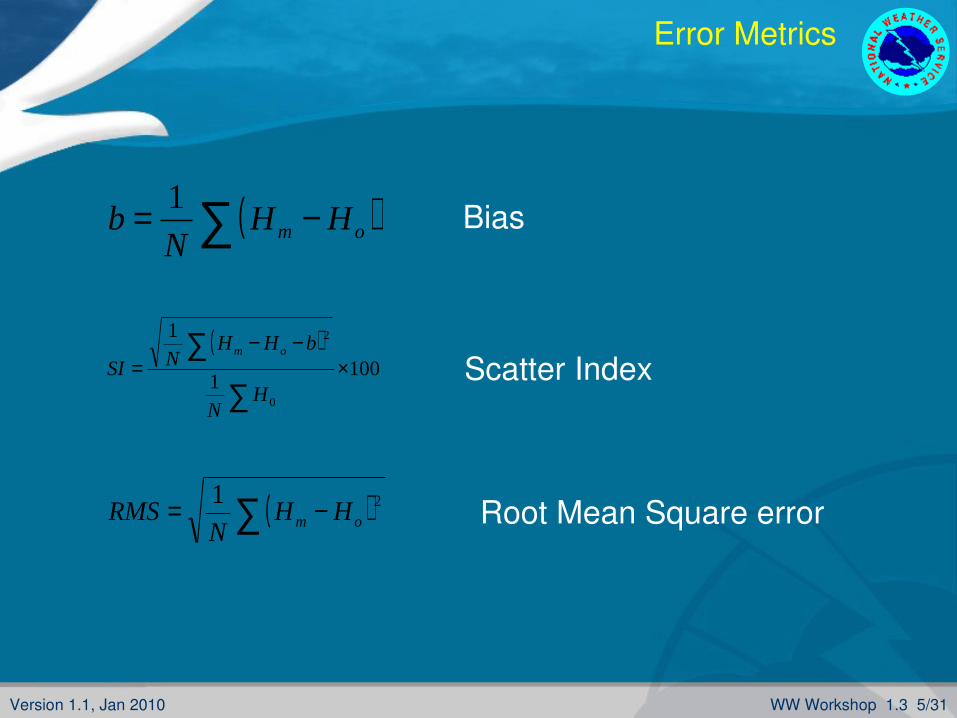
Bias
Scatter Index
Root Mean Square error
Version 1.1, Jan 2010 WW Workshop 1.3 6/31
Using Altimeter data for validation
Advantages Altimeters measure the significant wave height from back scatter observationsAltimeter measurements are valuable because altimeter tracks traverse the complete ocean domainSatellite tracks are fast enough to provide a spatial map of observations
DisadvantagesIt is not a direct measurement of the wave heights and requires calibrationAltimeters can only provide estimates of the overall significant wave heightTracks do not repeat for several daysSignal can be noisy
Version 1.1, Jan 2010 WW Workshop 1.3 7/31
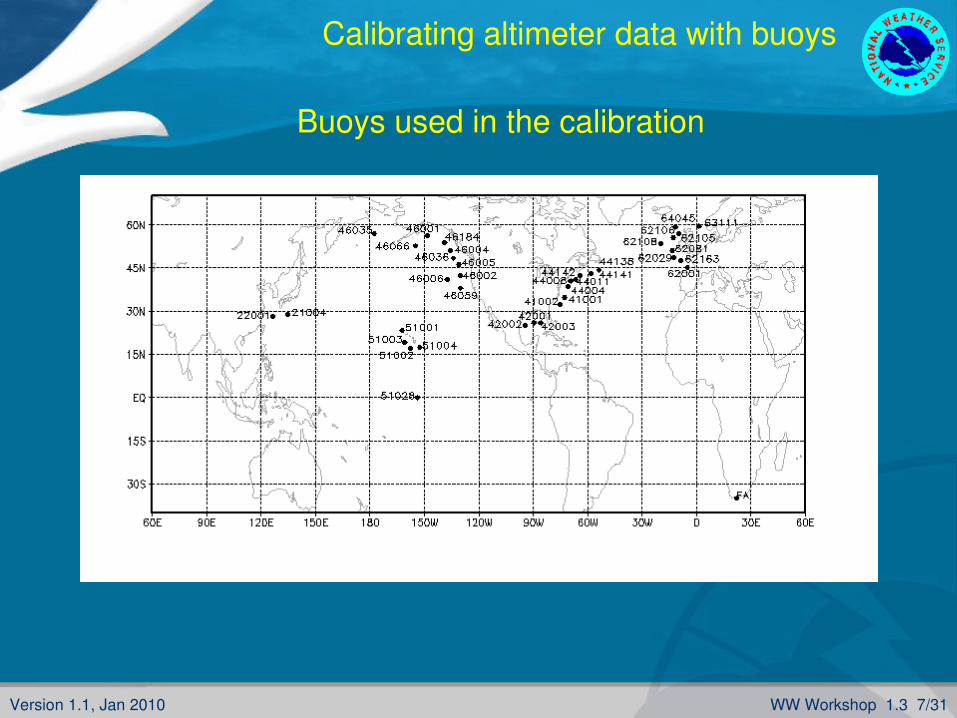
Calibrating altimeter data with buoys
Buoys used in the calibration
Version 1.1, Jan 2010 WW Workshop 1.3 8/31
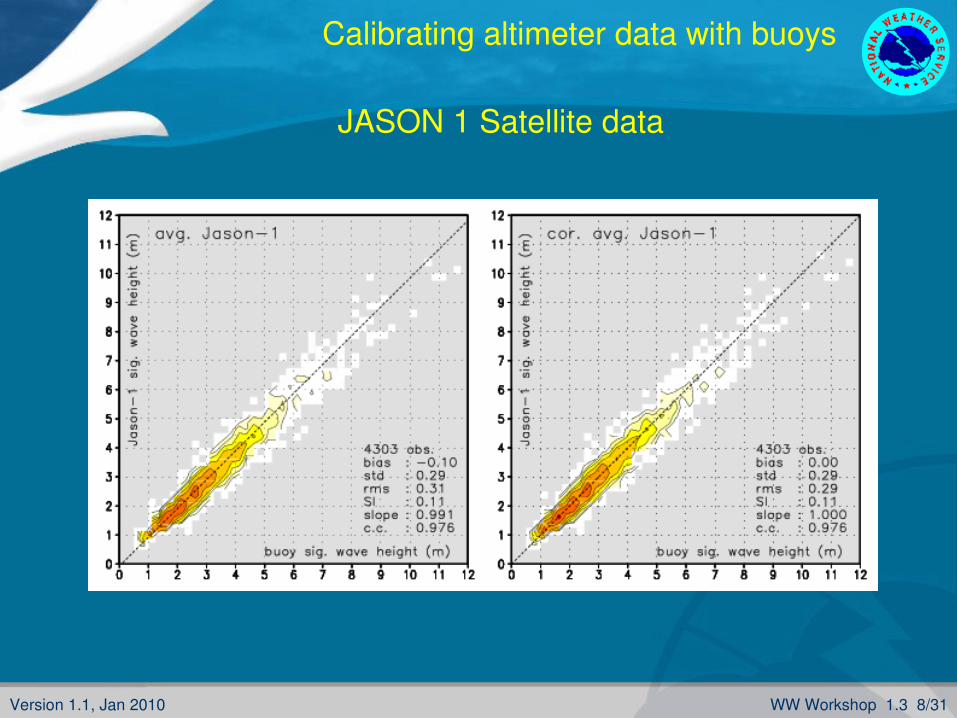
Calibrating altimeter data with buoys
JASON 1 Satellite data
Version 1.1, Jan 2010 WW Workshop 1.3 9/31
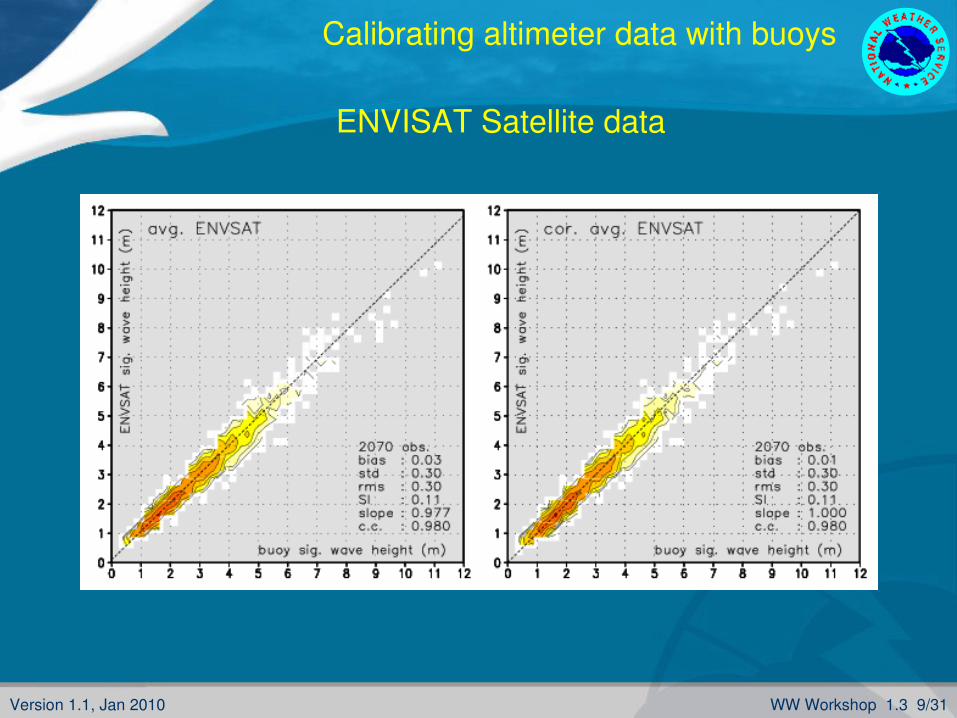
Calibrating altimeter data with buoys
ENVISAT Satellite data
Version 1.1, Jan 2010 WW Workshop 1.3 10/31
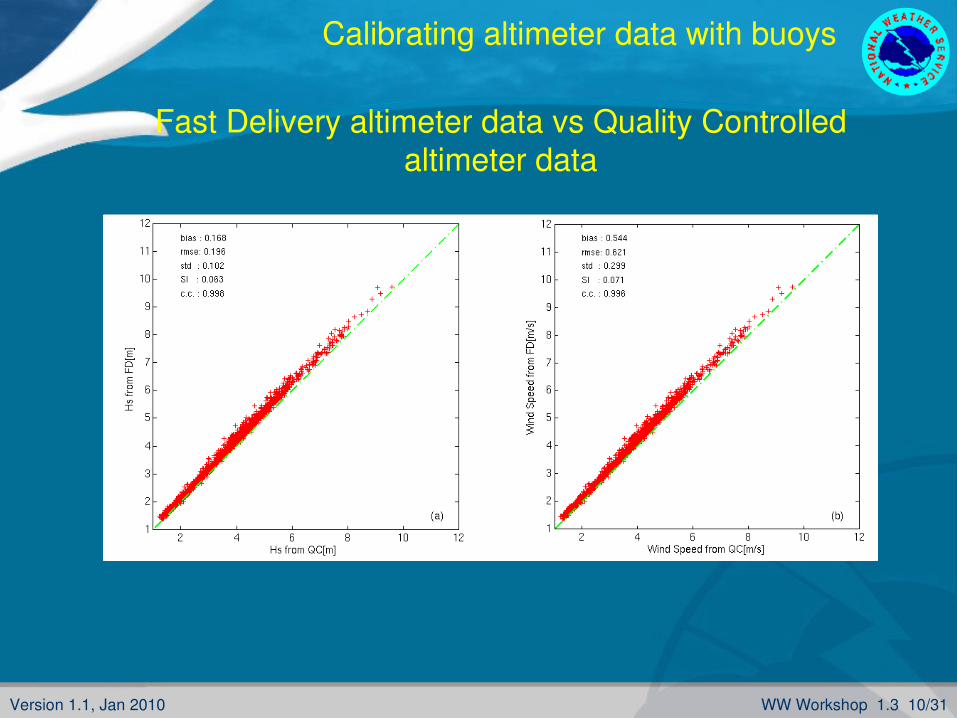
Calibrating altimeter data with buoys
Fast Delivery altimeter data vs Quality Controlled altimeter data
Version 1.1, Jan 2010 WW Workshop 1.3 11/31
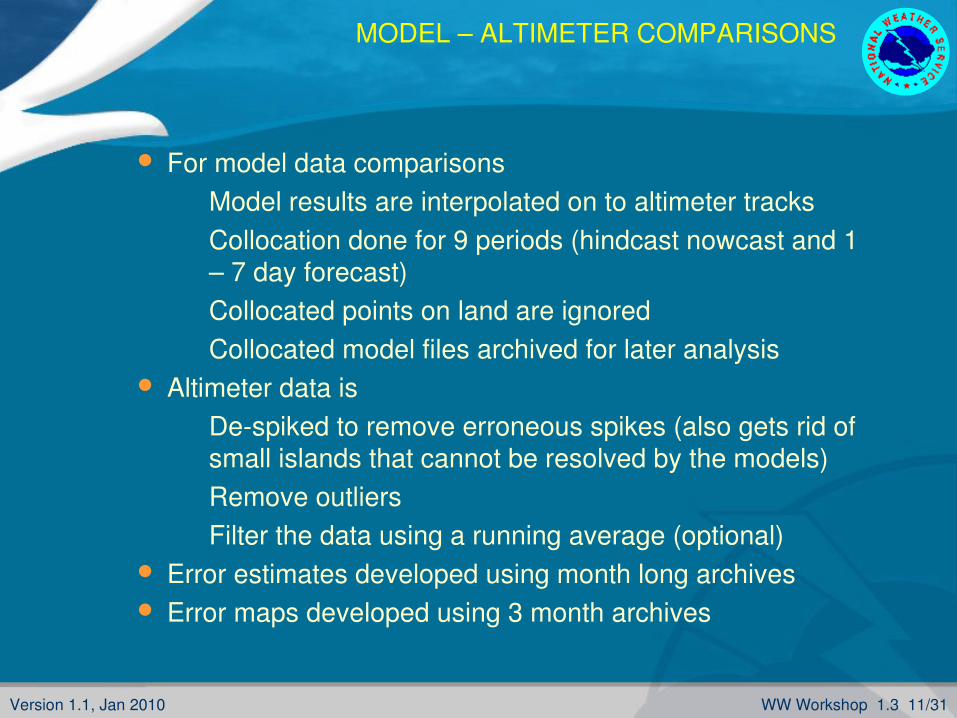
MODEL – ALTIMETER COMPARISONS
For model data comparisonsModel results are interpolated on to altimeter tracksCollocation done for 9 periods (hindcast nowcast and 1 – 7 day forecast)Collocated points on land are ignoredCollocated model files archived for later analysis
Altimeter data isDespiked to remove erroneous spikes (also gets rid of small islands that cannot be resolved by the models)Remove outliersFilter the data using a running average (optional)
Error estimates developed using month long archives Error maps developed using 3 month archives
Version 1.1, Jan 2010 WW Workshop 1.3 12/31
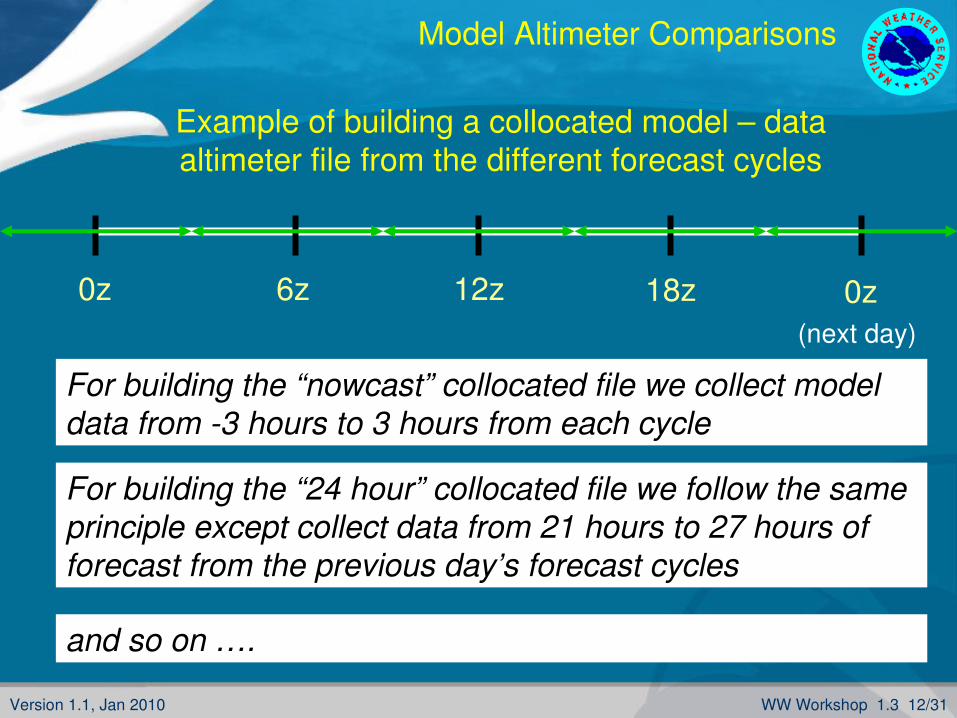
Model Altimeter Comparisons
Example of building a collocated model – data altimeter file from the different forecast cycles
0z 6z 12z 18z 0z(next day)
For building the “nowcast” collocated file we collect model data from 3 hours to 3 hours from each cycle
For building the “24 hour” collocated file we follow the same principle except collect data from 21 hours to 27 hours of forecast from the previous day’s forecast cycles
and so on ….
Version 1.1, Jan 2010 WW Workshop 1.3 13/31
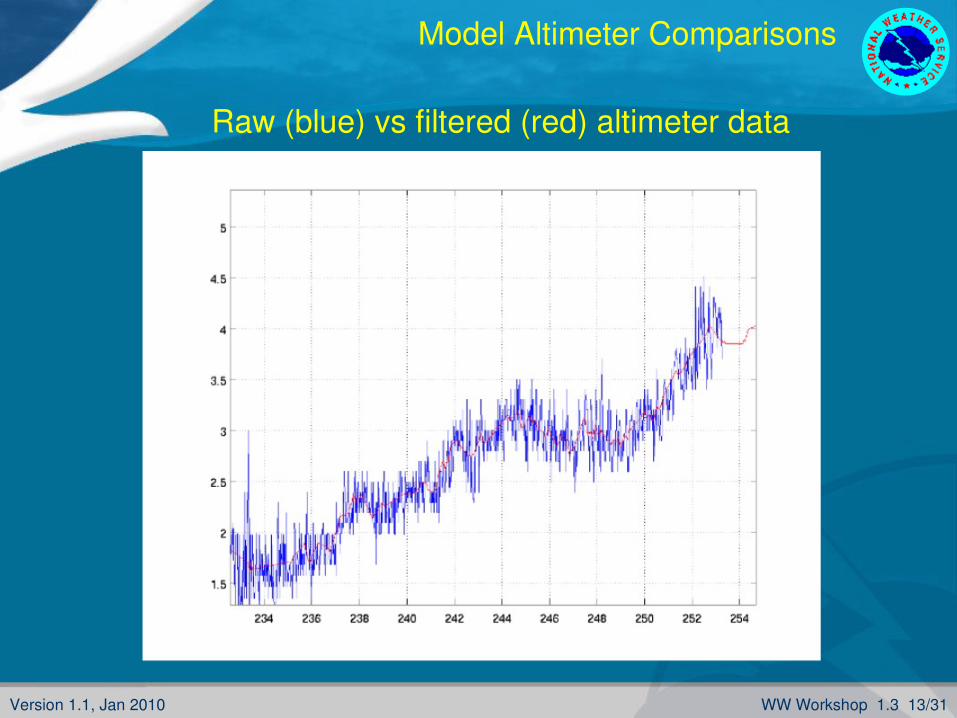
Model Altimeter Comparisons
Raw (blue) vs filtered (red) altimeter data
Version 1.1, Jan 2010 WW Workshop 1.3 14/31
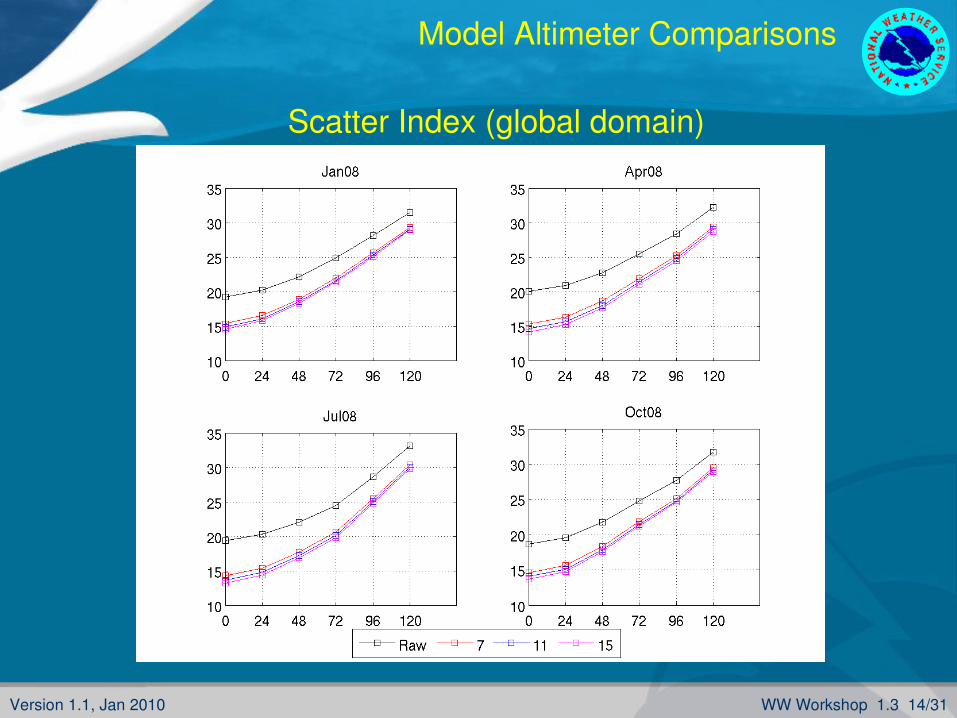
Model Altimeter Comparisons
Scatter Index (global domain)
Version 1.1, Jan 2010 WW Workshop 1.3 15/31
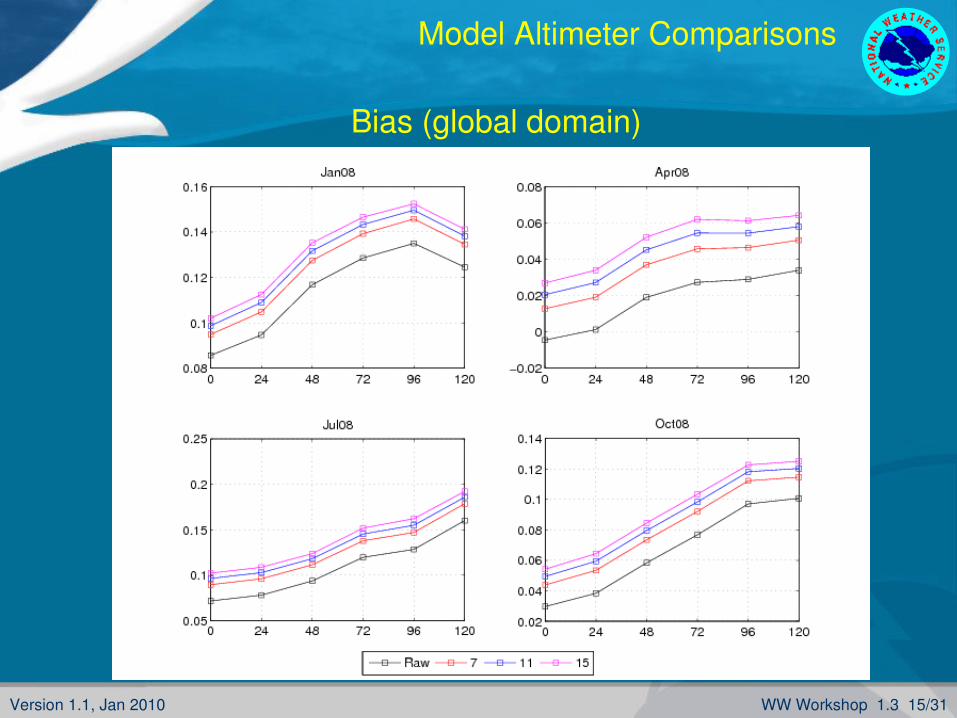
Model Altimeter Comparisons
Bias (global domain)
Version 1.1, Jan 2010 WW Workshop 1.3 16/31
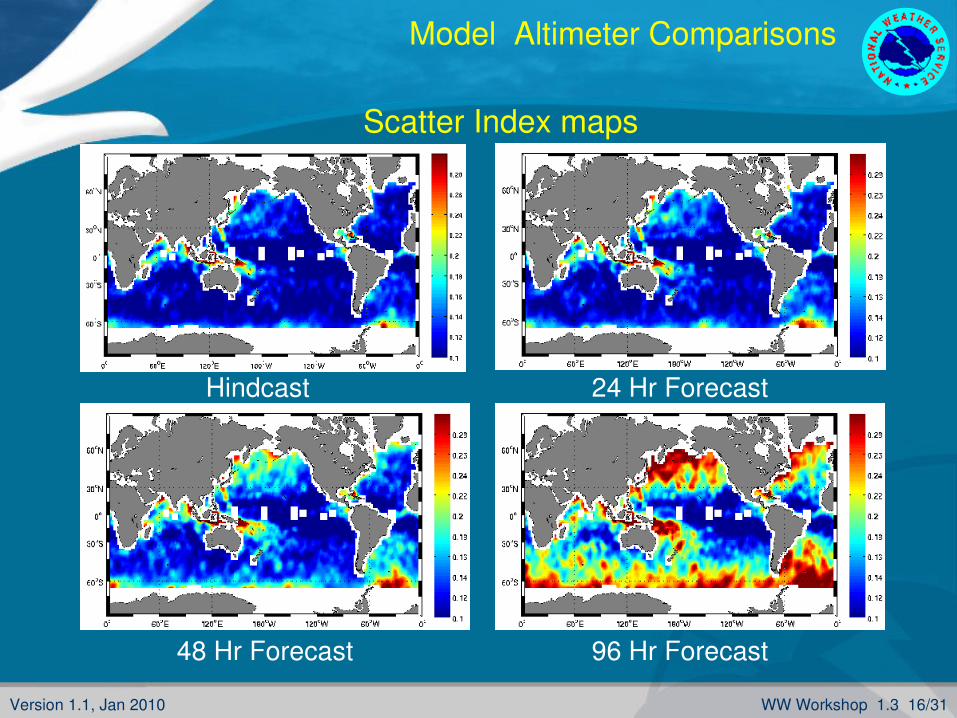
Model Altimeter Comparisons
Scatter Index maps
Hindcast 24 Hr Forecast
48 Hr Forecast 96 Hr Forecast
Version 1.1, Jan 2010 WW Workshop 1.3 17/31
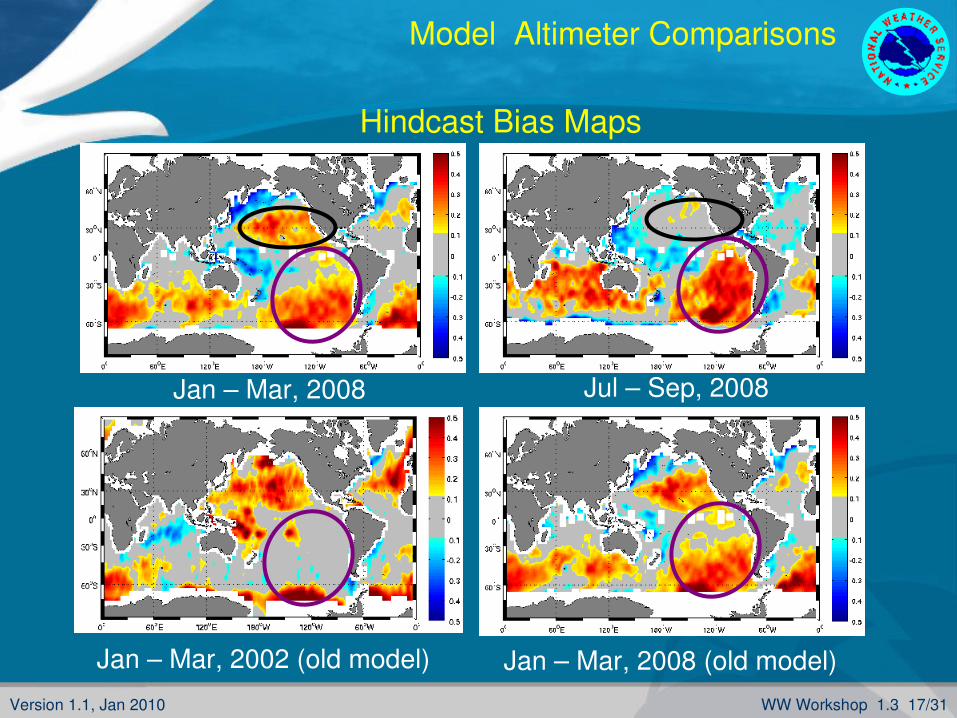
Model Altimeter Comparisons
Hindcast Bias Maps
Jan – Mar, 2008 Jul – Sep, 2008
Jan – Mar, 2008 (old model)Jan – Mar, 2002 (old model)
Version 1.1, Jan 2010 WW Workshop 1.3 18/31
BUOY COMPARISONS
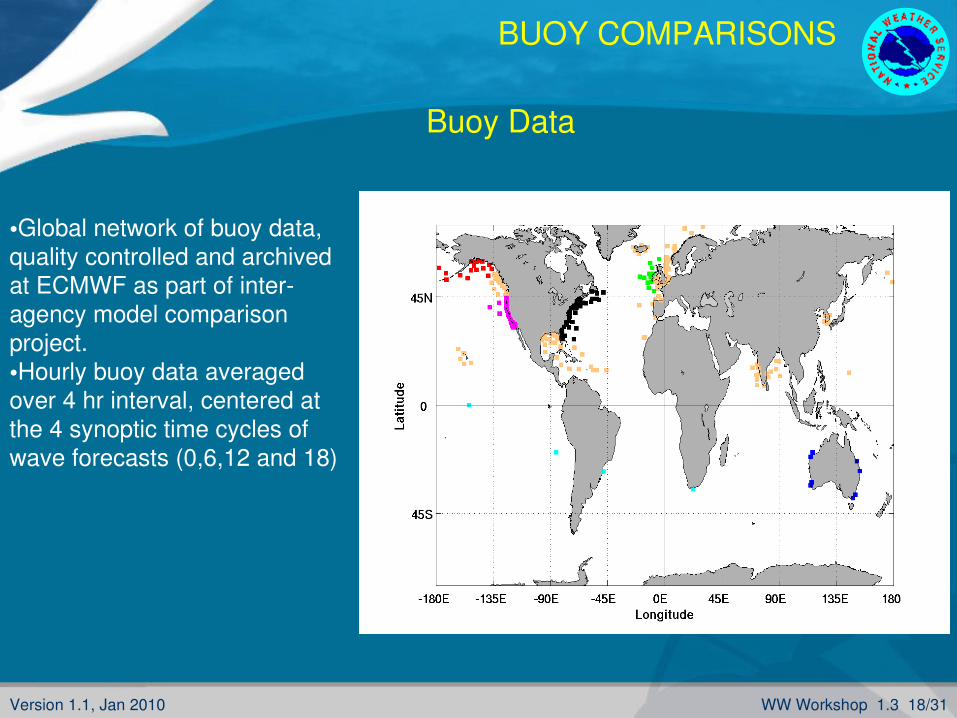
Buoy Data
•Global network of buoy data, quality controlled and archived at ECMWF as part of interagency model comparison project.•Hourly buoy data averaged over 4 hr interval, centered at the 4 synoptic time cycles of wave forecasts (0,6,12 and 18)
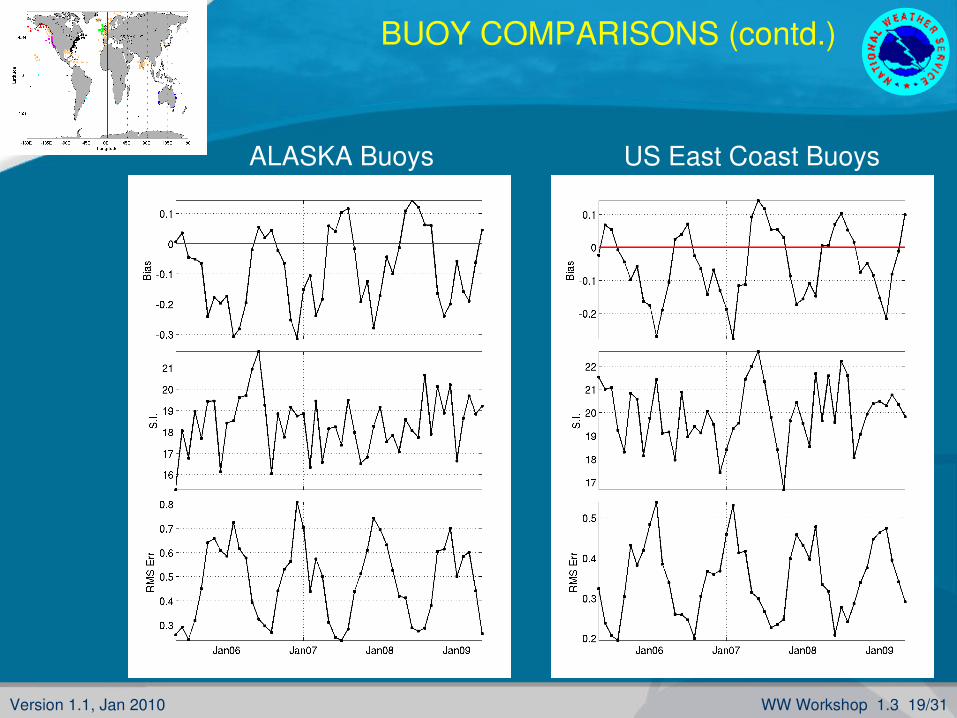
Version 1.1, Jan 2010 WW Workshop 1.3 19/31
ALASKA Buoys US East Coast Buoys
BUOY COMPARISONS (contd.)
Version 1.1, Jan 2010 WW Workshop 1.3 20/31
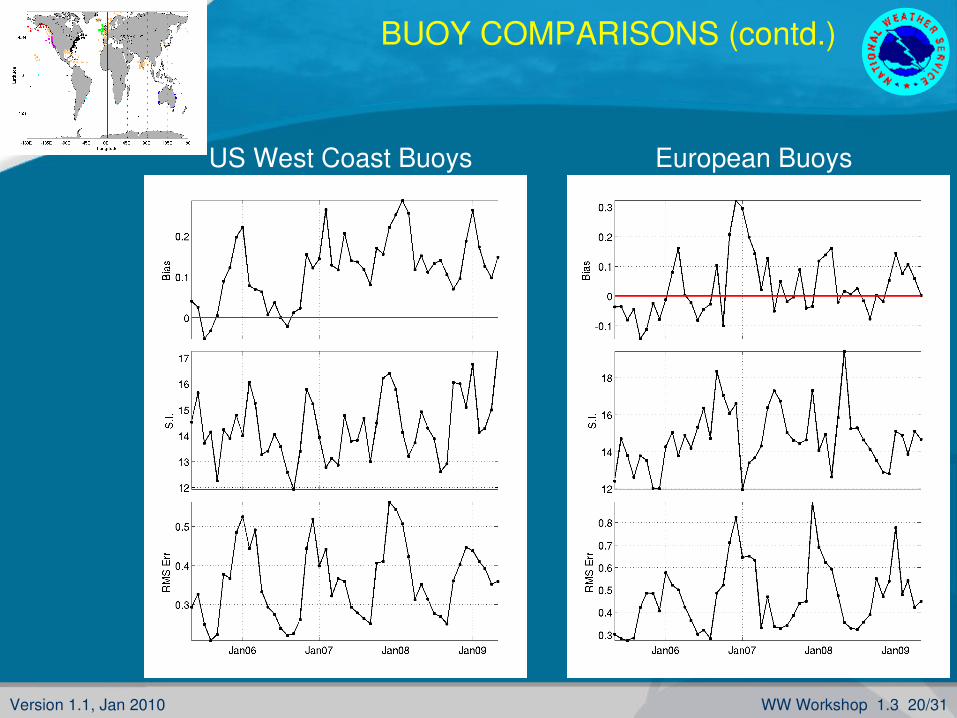
US West Coast Buoys European Buoys
BUOY COMPARISONS (contd.)
Version 1.1, Jan 2010 WW Workshop 1.3 21/31
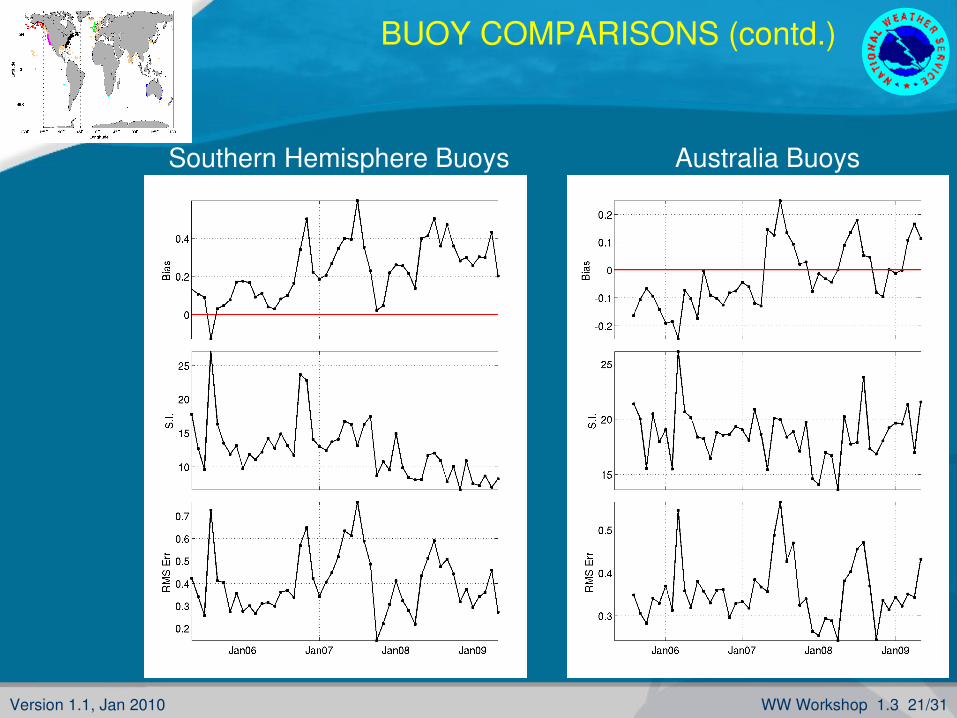
Australia Buoys
BUOY COMPARISONS (contd.)
Southern Hemisphere Buoys
Version 1.1, Jan 2010 WW Workshop 1.3 22/31
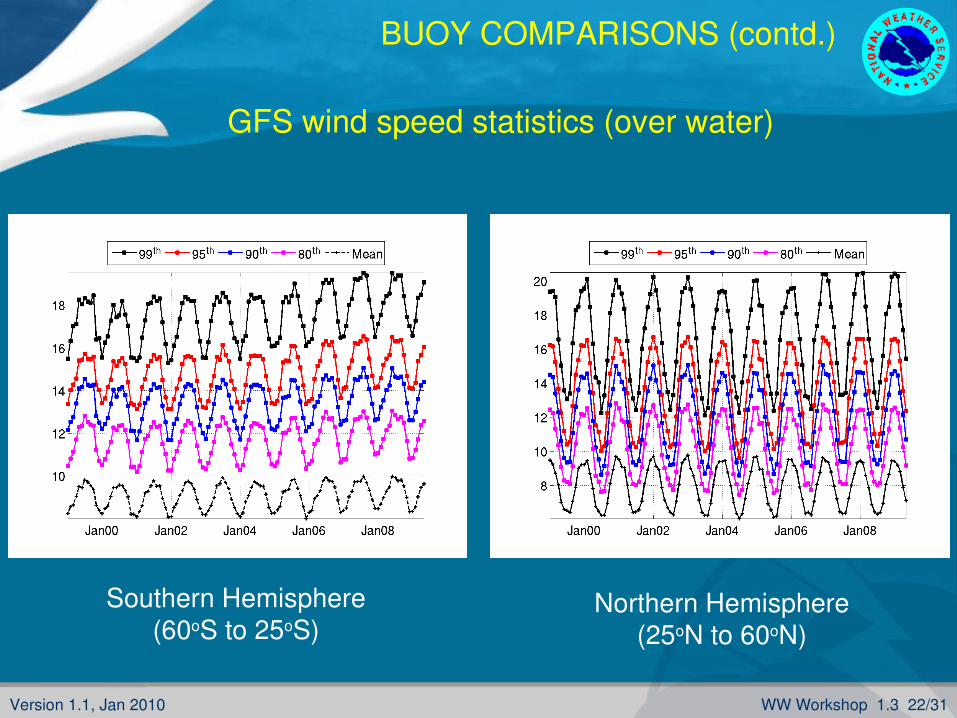
BUOY COMPARISONS (contd.)
GFS wind speed statistics (over water)
Southern Hemisphere(60oS to 25oS)
Northern Hemisphere(25oN to 60oN)
Version 1.1, Jan 2010 WW Workshop 1.3 23/31
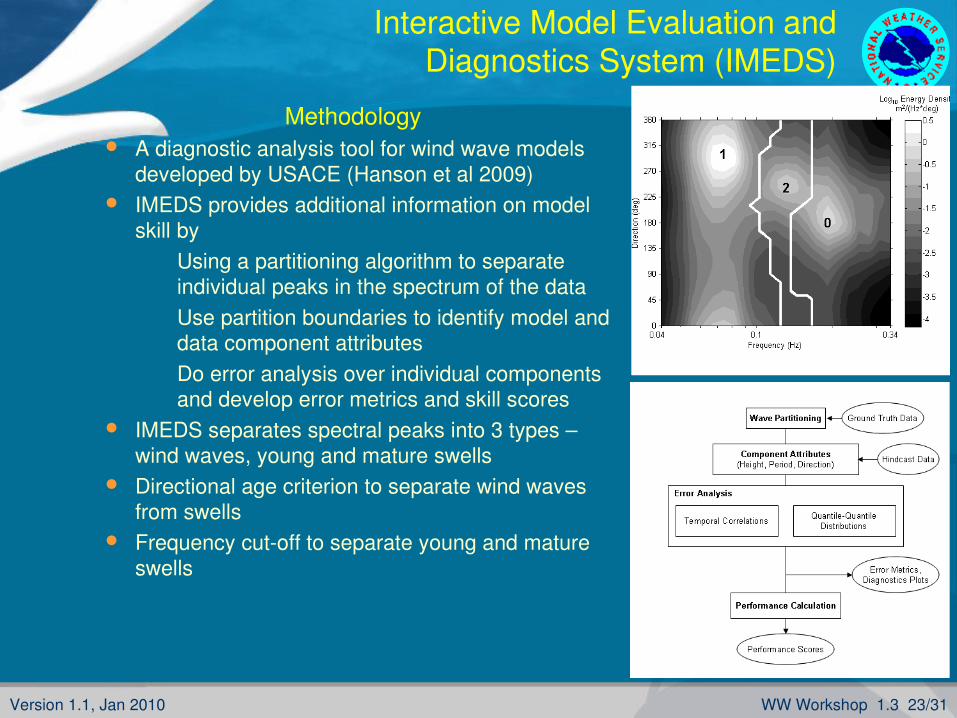
Interactive Model Evaluation and Diagnostics System (IMEDS)
Methodology A diagnostic analysis tool for wind wave models
developed by USACE (Hanson et al 2009) IMEDS provides additional information on model
skill byUsing a partitioning algorithm to separate individual peaks in the spectrum of the dataUse partition boundaries to identify model and data component attributesDo error analysis over individual components and develop error metrics and skill scores
IMEDS separates spectral peaks into 3 types – wind waves, young and mature swells
Directional age criterion to separate wind waves from swells
Frequency cutoff to separate young and mature swells

Version 1.1, Jan 2010 WW Workshop 1.3 24/31
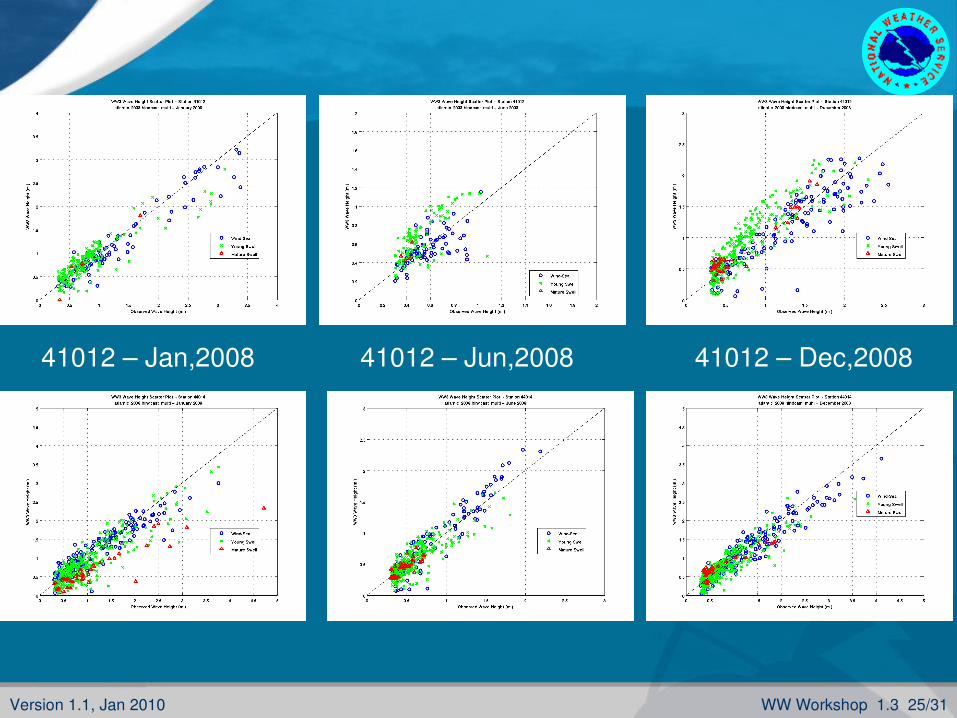
IMEDS (contd.)
Atlantic buoys
Version 1.1, Jan 2010 WW Workshop 1.3 25/31
41012 – Jan,2008 41012 – Jun,2008 41012 – Dec,2008
Version 1.1, Jan 2010 WW Workshop 1.3 26/31
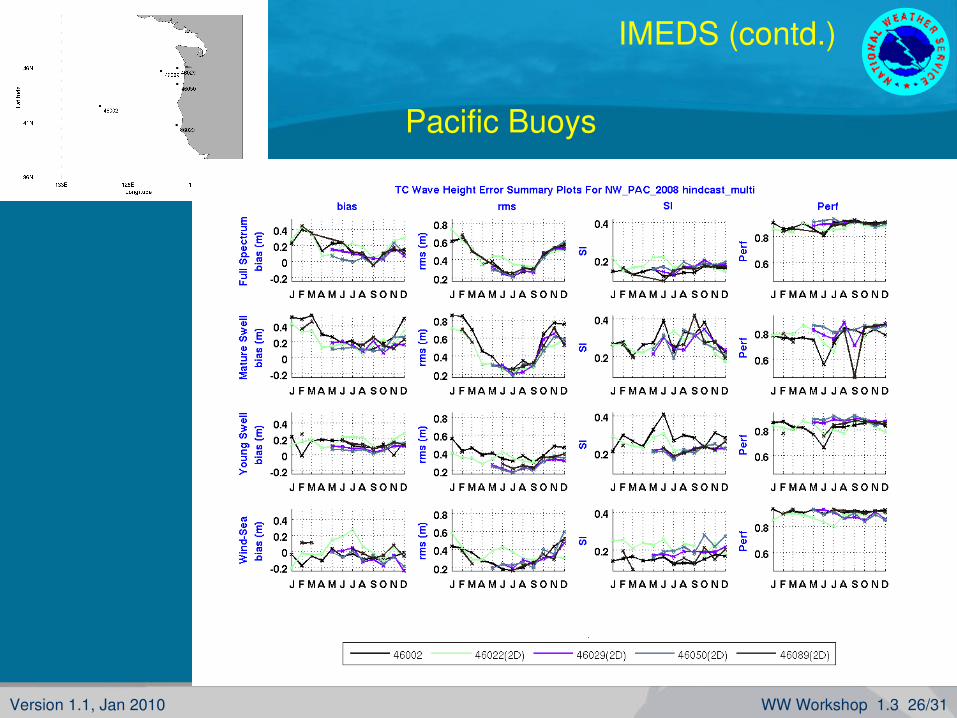
IMEDS (contd.)
Pacific Buoys

Version 1.1, Jan 2010 WW Workshop 1.3 27/31
46002 – Jan,2008 46002 – Jun,2008 46002 – Dec,2008
46022 – Jan,2008 46022 – Jun,2008 46022 – Dec,2008
Version 1.1, Jan 2010 WW Workshop 1.3 28/31
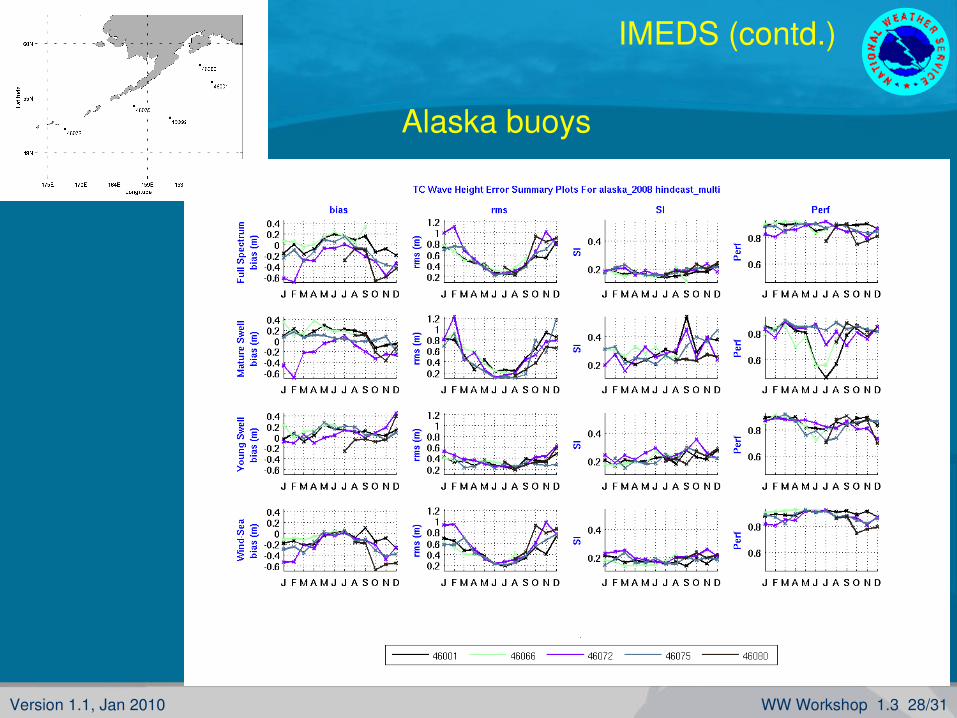
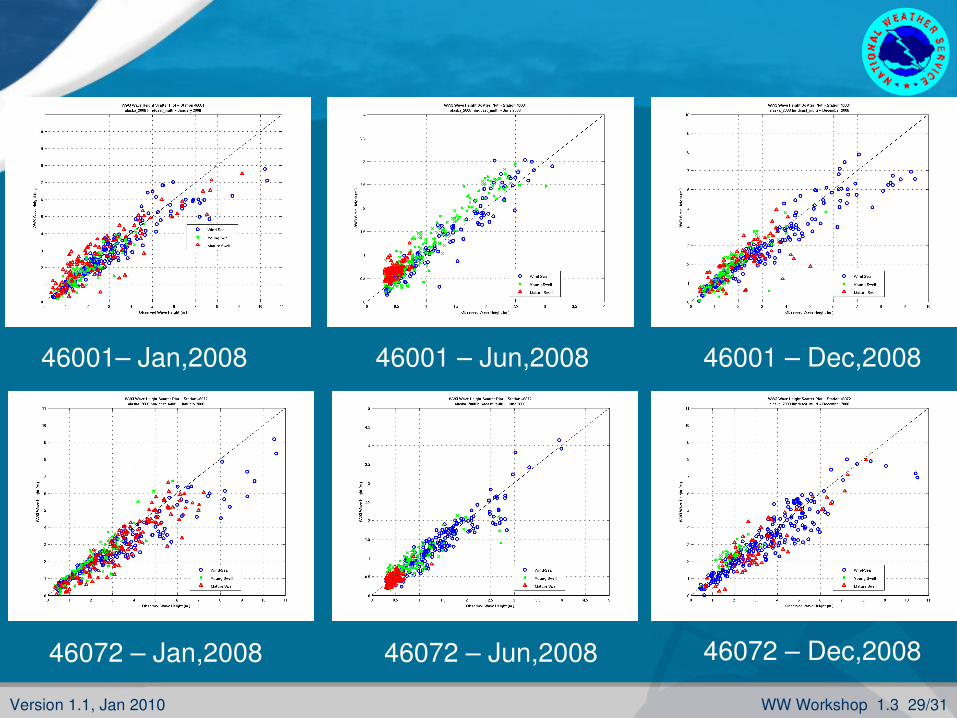
IMEDS (contd.)
Alaska buoys
Version 1.1, Jan 2010 WW Workshop 1.3 29/31
46001– Jan,2008 46001 – Jun,2008 46001 – Dec,2008
46072 – Jan,2008 46072 – Jun,2008 46072 – Dec,2008
Version 1.1, Jan 2010 WW Workshop 1.3 30/31
CONCLUSIONS
A small but persistent positive bias (wave heights) in the Southern Hemisphere.
Development of bias coincides with the GFS winds becoming more energetic in this region
Seasonal bias patterns in the Northern HemispherePositive biases in the swell dominated eastern parts of the basinNegative biases in the wind wave dominated western parts of the basin
Bias patterns show room for improvement in the physics packages in WAVEWATCH III
A new NOPP initiative currently underway to improve wave physics

Version 1.1, Jan 2010 WW Workshop 1.3 31/31
The End
End of lecture 3.1