weal th - nabilinvest.com.np newsletter... · issue management |underwriting ... depository for...
TRANSCRIPT
The detailed information about upcoming AGMs is enclosed in Annexure.
W e a l th
NEPSE UPDATE
Market UPDATE
Bullion Desk UPDATE
Upcoming AGMs
Our Services: Issue Management |Underwriting |Registrar to Share/Depository Participant| Portfolio Management| Corporate Advisory | Fund Manager and
Depository for Nabil Mutual Fund
Monthly Newsletter from Nabil Investment Banking Ltd. (Nabil Invest) Vol.6. Issue 08, Magh, 2074
INDICATORS Magh 18,
074 Mangsir End, 074
Increase/ Decrease
(%)
NEPSE 1,411.52 1,520.00 (7.14) SENSITIVE 298.12 320.65 (7.03) BANKING 1,227.08 1,295.78 (5.30) DEV. BANKS 1,584.08 1,748.23 (9.39) FINANCE COs 716.31 760.40 (5.80) INSURANCE COs 7,227.54 7,894.84 (8.45) HYDROPOWER 1,832.27 2,056.83 (10.92) HOTELS 2,136.24 2,146.25 (0.47) MANU. & PRO. 2,483.73 2,523.01 (1.56) MICRO-FINANCE 1,698.54 1,845.48 (7.96) OTHERS 765.83 920.91 (15.18) TRADING 215.62 205.24 5.06 TOTAL SHARES TRADED (‘000) 33,0160.00 21,459.56 53.85
NEPSE Index witnessed a major decline of 108.48 points or 7.14% from Mangsir End till 18th Magh, 2074 to end at 1,411.52 points. Sensitive Index which measures the performance of class ‘A’ stocks also decreased by 7.03% in comparison to Mangsir End, 2074 and closed at 298.12 points. Among the ten sectoral indexes, all sector except Trading Index ended in the negative side. The market volume has increased by a massive 53.85% at the end of the review period. A downward trend has been observed during the review period mainly due to the constant credit crunch faced by the BFIs, tax obligation, share supply pressure and delay in formation of national assembly. The stock market did experience short term improvement from Poush 17th and reached at 1,456.07 on Poush 25th. The main reasons for this are agreement of the BFIs to stop the unhealthy competition by raising the interest rate along with NRB injecting money in the market to address the liquidity crisis in the BFIs. However, due to the persisting problems faced by the BFIs, increasing share supply pressure and the dwindling EPS of BFIs in the second quarter of the fiscal year, the market is still in the downward trend at the end of the review period.
• VAT collection row in share transaction surface again TSO seem set to lock horns again as the TSO has…….Read More
• NRB to tell BFIs to stick to published rates
At a time when banks are facing challenges rel……....Read More
• CDSC set to apply C-ASBA system
CDSC has finalized all the preparatory works……..….Read More
Hallmark Gold NRs. 56,600/10 Gms.
Worked Gold NRs. 56,300/10 Gms.
Silver NRs. 735/10 Gms.
As of 08/02/2018
Quote of the Month “Win, loss whatever emerges in the short-term, place and manage your next trades untouched, unattached... always keeping your eyes on the long-term picture.”
– Yvan Byeajee, The essence of trading psychology in one skill
Nabil Invest UPDATE • Nabil Invest as Issue Manager had concluded the
issue of local IPO shares of Panchakanya Mai Hydropower Co. Ltd.
• Nabil Invest as Issue Manager had successfully concluded the allotment of IPO of Radhi Bidhut Company.
• Nabil Invest as Issue Manager had successfully concluded the issue of 'NIC Asia Debenture 2081/82’.
• Nabil Invest as Issue Manager had successfully concluded the allotment of auctioned promoter shares of Bank of Kathmandu Limited.
Trend Analysis
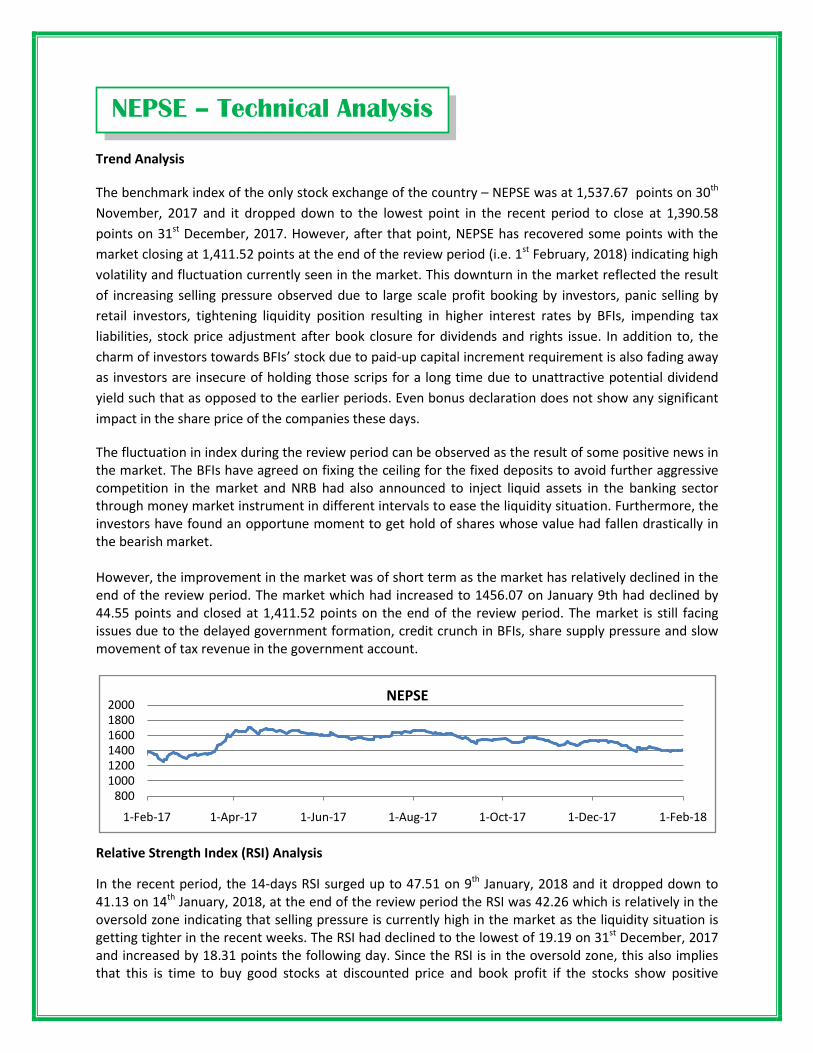
The benchmark index of the only stock exchange of the country – NEPSE was at 1,537.67 points on 30th November, 2017 and it dropped down to the lowest point in the recent period to close at 1,390.58 points on 31st December, 2017. However, after that point, NEPSE has recovered some points with the market closing at 1,411.52 points at the end of the review period (i.e. 1st February, 2018) indicating high volatility and fluctuation currently seen in the market. This downturn in the market reflected the result of increasing selling pressure observed due to large scale profit booking by investors, panic selling by retail investors, tightening liquidity position resulting in higher interest rates by BFIs, impending tax liabilities, stock price adjustment after book closure for dividends and rights issue. In addition to, the charm of investors towards BFIs’ stock due to paid-up capital increment requirement is also fading away as investors are insecure of holding those scrips for a long time due to unattractive potential dividend yield such that as opposed to the earlier periods. Even bonus declaration does not show any significant impact in the share price of the companies these days.
The fluctuation in index during the review period can be observed as the result of some positive news in the market. The BFIs have agreed on fixing the ceiling for the fixed deposits to avoid further aggressive competition in the market and NRB had also announced to inject liquid assets in the banking sector through money market instrument in different intervals to ease the liquidity situation. Furthermore, the investors have found an opportune moment to get hold of shares whose value had fallen drastically in the bearish market. However, the improvement in the market was of short term as the market has relatively declined in the end of the review period. The market which had increased to 1456.07 on January 9th had declined by 44.55 points and closed at 1,411.52 points on the end of the review period. The market is still facing issues due to the delayed government formation, credit crunch in BFIs, share supply pressure and slow movement of tax revenue in the government account.
Relative Strength Index (RSI) Analysis
In the recent period, the 14-days RSI surged up to 47.51 on 9th January, 2018 and it dropped down to 41.13 on 14th January, 2018, at the end of the review period the RSI was 42.26 which is relatively in the oversold zone indicating that selling pressure is currently high in the market as the liquidity situation is getting tighter in the recent weeks. The RSI had declined to the lowest of 19.19 on 31st December, 2017 and increased by 18.31 points the following day. Since the RSI is in the oversold zone, this also implies that this is time to buy good stocks at discounted price and book profit if the stocks show positive
800100012001400160018002000
1-Feb-17 1-Apr-17 1-Jun-17 1-Aug-17 1-Oct-17 1-Dec-17 1-Feb-18
NEPSE
NEPSE – Technical Analysis
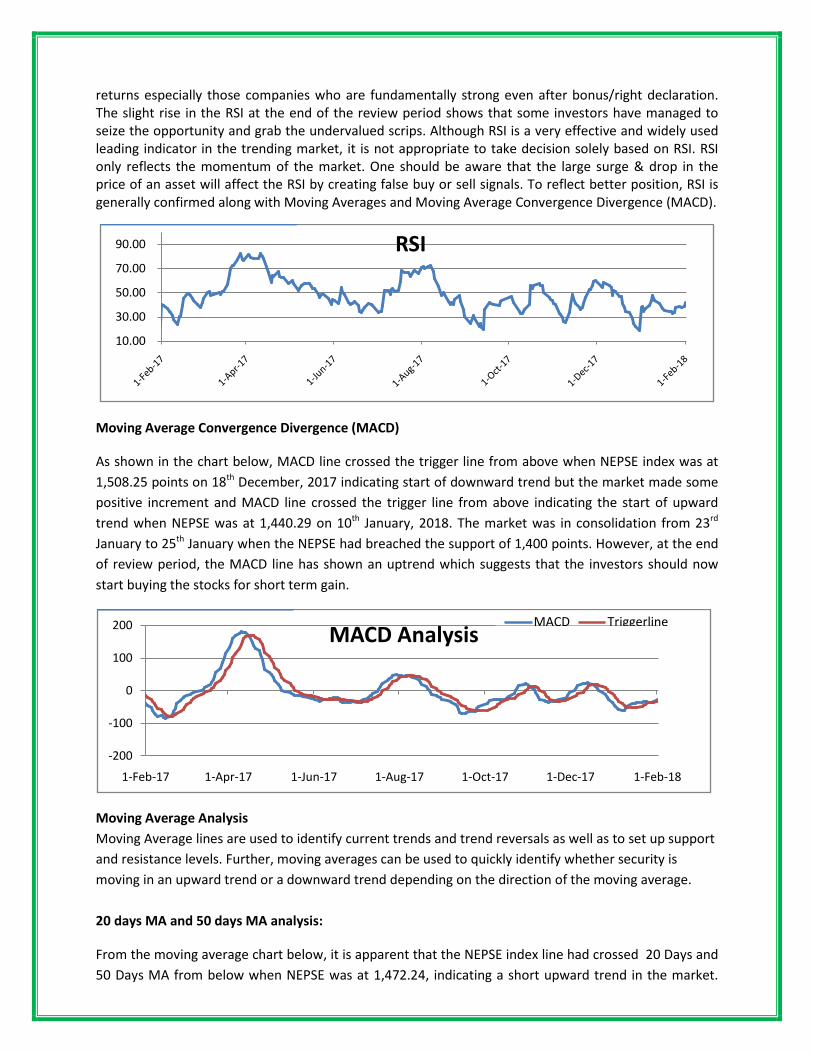
returns especially those companies who are fundamentally strong even after bonus/right declaration. The slight rise in the RSI at the end of the review period shows that some investors have managed to seize the opportunity and grab the undervalued scrips. Although RSI is a very effective and widely used leading indicator in the trending market, it is not appropriate to take decision solely based on RSI. RSI only reflects the momentum of the market. One should be aware that the large surge & drop in the price of an asset will affect the RSI by creating false buy or sell signals. To reflect better position, RSI is generally confirmed along with Moving Averages and Moving Average Convergence Divergence (MACD).
Moving Average Convergence Divergence (MACD)
As shown in the chart below, MACD line crossed the trigger line from above when NEPSE index was at 1,508.25 points on 18th December, 2017 indicating start of downward trend but the market made some positive increment and MACD line crossed the trigger line from above indicating the start of upward trend when NEPSE was at 1,440.29 on 10th January, 2018. The market was in consolidation from 23rd January to 25th January when the NEPSE had breached the support of 1,400 points. However, at the end of review period, the MACD line has shown an uptrend which suggests that the investors should now start buying the stocks for short term gain.
Moving Average Analysis Moving Average lines are used to identify current trends and trend reversals as well as to set up support and resistance levels. Further, moving averages can be used to quickly identify whether security is moving in an upward trend or a downward trend depending on the direction of the moving average. 20 days MA and 50 days MA analysis:
From the moving average chart below, it is apparent that the NEPSE index line had crossed 20 Days and 50 Days MA from below when NEPSE was at 1,472.24, indicating a short upward trend in the market.
10.00
30.00
50.00
70.00
90.00 RSI
-200
-100
0
100
200
1-Feb-17 1-Apr-17 1-Jun-17 1-Aug-17 1-Oct-17 1-Dec-17 1-Feb-18
MACD AnalysisMACD Triggerline
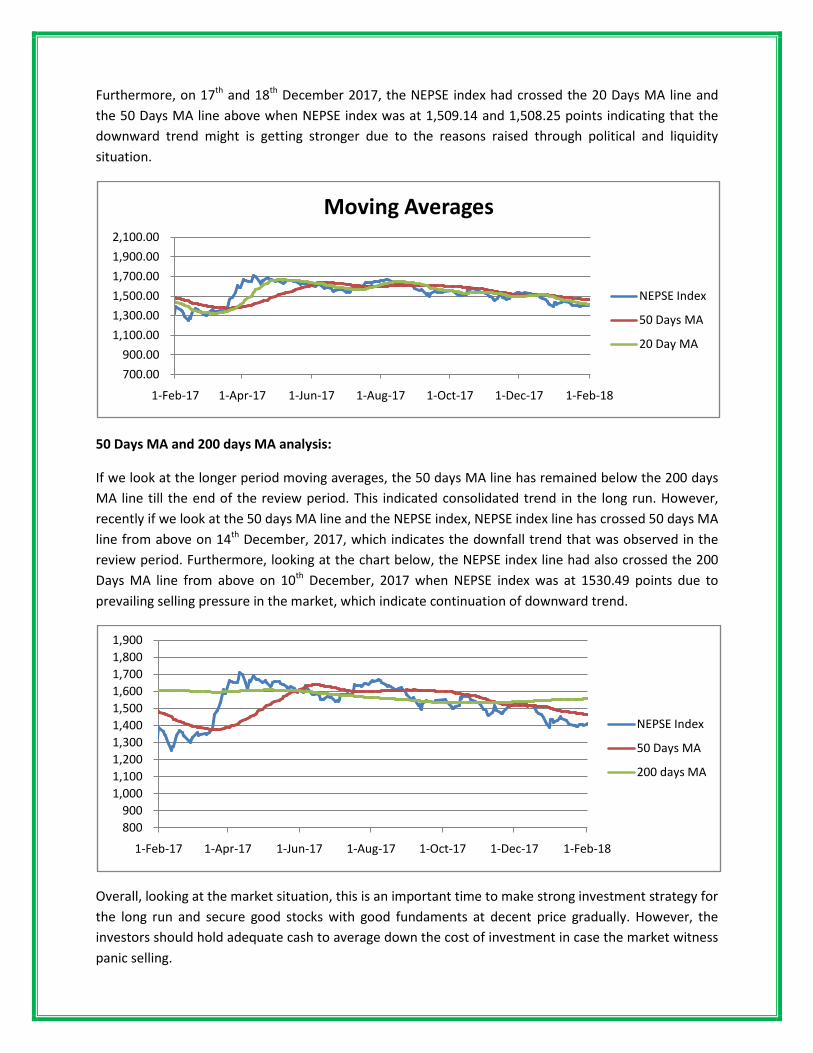
Furthermore, on 17th and 18th December 2017, the NEPSE index had crossed the 20 Days MA line and the 50 Days MA line above when NEPSE index was at 1,509.14 and 1,508.25 points indicating that the downward trend might is getting stronger due to the reasons raised through political and liquidity situation.
50 Days MA and 200 days MA analysis:
If we look at the longer period moving averages, the 50 days MA line has remained below the 200 days MA line till the end of the review period. This indicated consolidated trend in the long run. However, recently if we look at the 50 days MA line and the NEPSE index, NEPSE index line has crossed 50 days MA line from above on 14th December, 2017, which indicates the downfall trend that was observed in the review period. Furthermore, looking at the chart below, the NEPSE index line had also crossed the 200 Days MA line from above on 10th December, 2017 when NEPSE index was at 1530.49 points due to prevailing selling pressure in the market, which indicate continuation of downward trend.
Overall, looking at the market situation, this is an important time to make strong investment strategy for the long run and secure good stocks with good fundaments at decent price gradually. However, the investors should hold adequate cash to average down the cost of investment in case the market witness panic selling.
700.00 900.00
1,100.00 1,300.00 1,500.00 1,700.00 1,900.00 2,100.00
1-Feb-17 1-Apr-17 1-Jun-17 1-Aug-17 1-Oct-17 1-Dec-17 1-Feb-18
Moving Averages
NEPSE Index
50 Days MA
20 Day MA
800 900
1,000 1,100 1,200 1,300 1,400 1,500 1,600 1,700 1,800 1,900
1-Feb-17 1-Apr-17 1-Jun-17 1-Aug-17 1-Oct-17 1-Dec-17 1-Feb-18
NEPSE Index
50 Days MA
200 days MA
Stock Analysis – First Microfinance Development Bank
2018
Presence of GBBL in Nepal
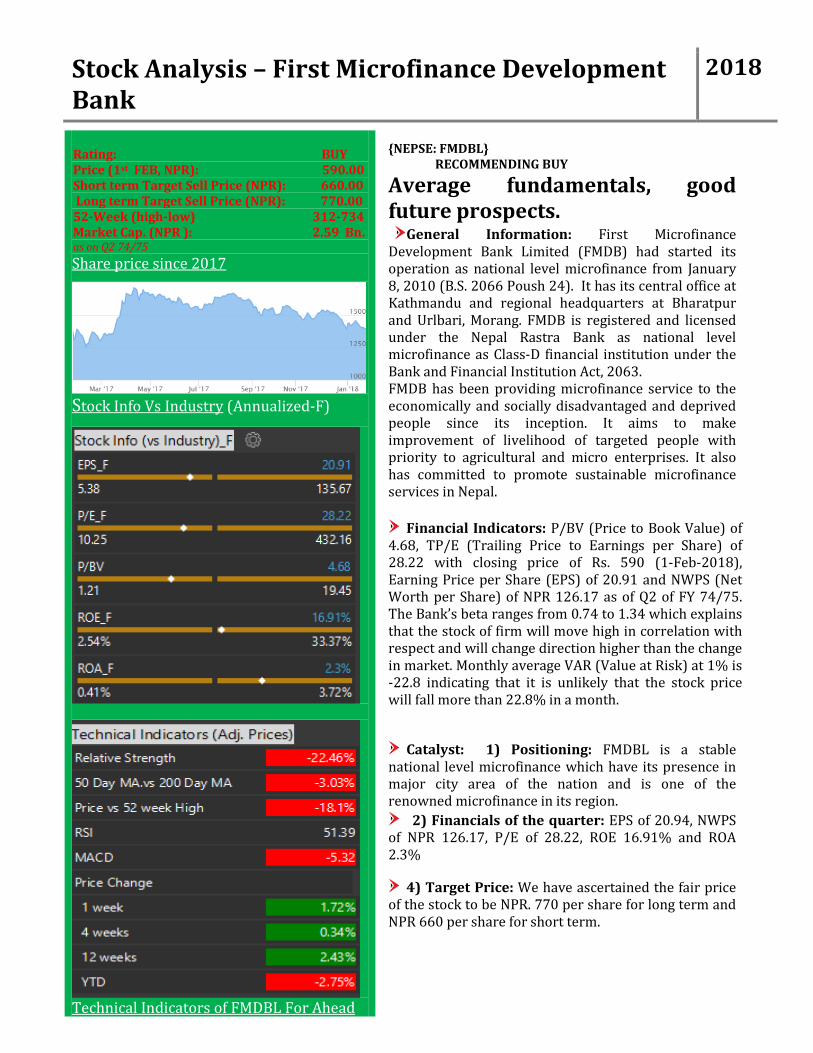
{NEPSE: FMDBL} RECOMMENDING BUY
Average fundamentals, good future prospects.
General Information: First Microfinance Development Bank Limited (FMDB) had started its operation as national level microfinance from January 8, 2010 (B.S. 2066 Poush 24). It has its central office at Kathmandu and regional headquarters at Bharatpur and Urlbari, Morang. FMDB is registered and licensed under the Nepal Rastra Bank as national level microfinance as Class-D financial institution under the Bank and Financial Institution Act, 2063. FMDB has been providing microfinance service to the economically and socially disadvantaged and deprived people since its inception. It aims to make improvement of livelihood of targeted people with priority to agricultural and micro enterprises. It also has committed to promote sustainable microfinance services in Nepal.
Financial Indicators: P/BV (Price to Book Value) of 4.68, TP/E (Trailing Price to Earnings per Share) of 28.22 with closing price of Rs. 590 (1-Feb-2018), Earning Price per Share (EPS) of 20.91 and NWPS (Net Worth per Share) of NPR 126.17 as of Q2 of FY 74/75. The Bank’s beta ranges from 0.74 to 1.34 which explains that the stock of firm will move high in correlation with respect and will change direction higher than the change in market. Monthly average VAR (Value at Risk) at 1% is -22.8 indicating that it is unlikely that the stock price will fall more than 22.8% in a month.
Catalyst: 1) Positioning: FMDBL is a stable national level microfinance which have its presence in major city area of the nation and is one of the renowned microfinance in its region.
2) Financials of the quarter: EPS of 20.94, NWPS of NPR 126.17, P/E of 28.22, ROE 16.91% and ROA 2.3%
4) Target Price: We have ascertained the fair price of the stock to be NPR. 770 per share for long term and NPR 660 per share for short term.
Rating: BUY Price (1st FEB, NPR): 590.00 Short term Target Sell Price (NPR): 660.00 Long term Target Sell Price (NPR): 770.00 52-Week (high-low) 312-734 Market Cap. (NPR ): 2.59 Bn. as on Q2 74/75 Share price since 2017
Stock Info Vs Industry (Annualized-F)
Technical Indicators of FMDBL For Ahead
Stock Analysis – First Microfinance Development Bank
2018
Financials & Non-Financial Highlights
Figure 2 – FMDBL key indicators – Quarter to Quarter comparison
Particulars As at Poush End,FY 2072/73
As at Poush End, FY 2073/74
As at Poush End, FY 2074/75
EPS (in NPR) 20.41 25.48 20.94 Closing Market Price (in NPR) 686 883 840 P/E Ratio 33.61 34.65 28.22 NWPS (in NPR) 120.58 128.7 126.17 Net Profit ( NPR) 23,475,000.00 33,699,000.00 47,698,000.00 Net Profit Growth (%) 56.08% 43.55% 41.54% Paid Up Capital (NPR) 230,000,000.00 264,500,000.00 456,263,000.00 Reserve & Surplus (NPR) 47,343,000.00 75,913,000.00 119,385,000.00 Loans and Advance (NPR) 2,308,300,000.00 3,241,246,000.00 3,715,098,000.00
Summary: Based on the table presented above, we can see that the FMDBL demonstrated average financial performance in Q2 FY 2074/75. Looking at the major financial indicators, FMDBL has shown average level of growth on its profit in current FY Q2 compared to previous FY Q2 as we can observe a decrease in net profit growth rate by around 2% in this Q2 compared to previous FY Q2. FMDBL has increased the paid capital by distributing 15% stock dividend. FMDBL’s EPS has been in between NPR 20-26 for the last three years. At the end of Q2 FY 2074/75, the EPS stands at NPR 20.91 and NWPS have slightly decreased from NPR 128.7 at Q2 FY 2073/74 to NPR 126.17 at the end of Q2 FY 2074/75.
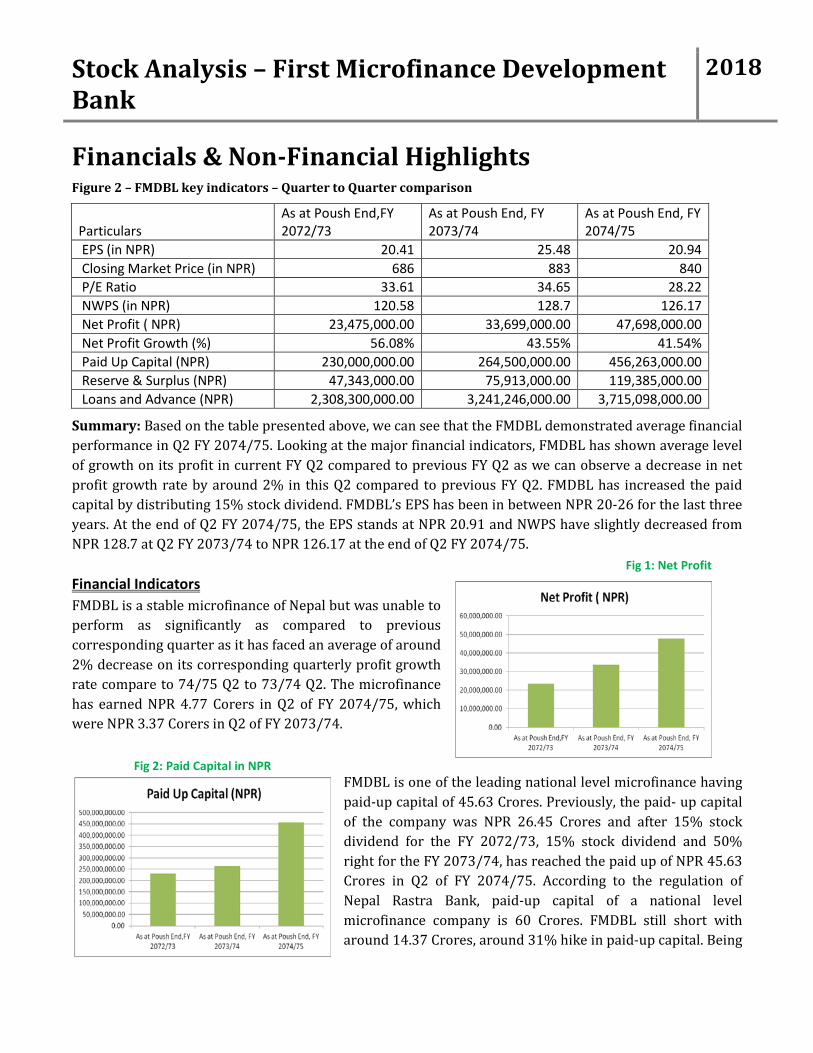
Financial Indicators FMDBL is a stable microfinance of Nepal but was unable to perform as significantly as compared to previous corresponding quarter as it has faced an average of around 2% decrease on its corresponding quarterly profit growth rate compare to 74/75 Q2 to 73/74 Q2. The microfinance has earned NPR 4.77 Corers in Q2 of FY 2074/75, which were NPR 3.37 Corers in Q2 of FY 2073/74.
FMDBL is one of the leading national level microfinance having paid-up capital of 45.63 Crores. Previously, the paid- up capital of the company was NPR 26.45 Crores and after 15% stock dividend for the FY 2072/73, 15% stock dividend and 50% right for the FY 2073/74, has reached the paid up of NPR 45.63 Crores in Q2 of FY 2074/75. According to the regulation of Nepal Rastra Bank, paid-up capital of a national level microfinance company is 60 Crores. FMDBL still short with around 14.37 Crores, around 31% hike in paid-up capital. Being
Fig 2: Paid Capital in NPR
Fig 1: Net Profit
Stock Analysis – First Microfinance Development Bank
2018
a stable company having decent dividend history and strong fundamentals the company is likely issue a decent
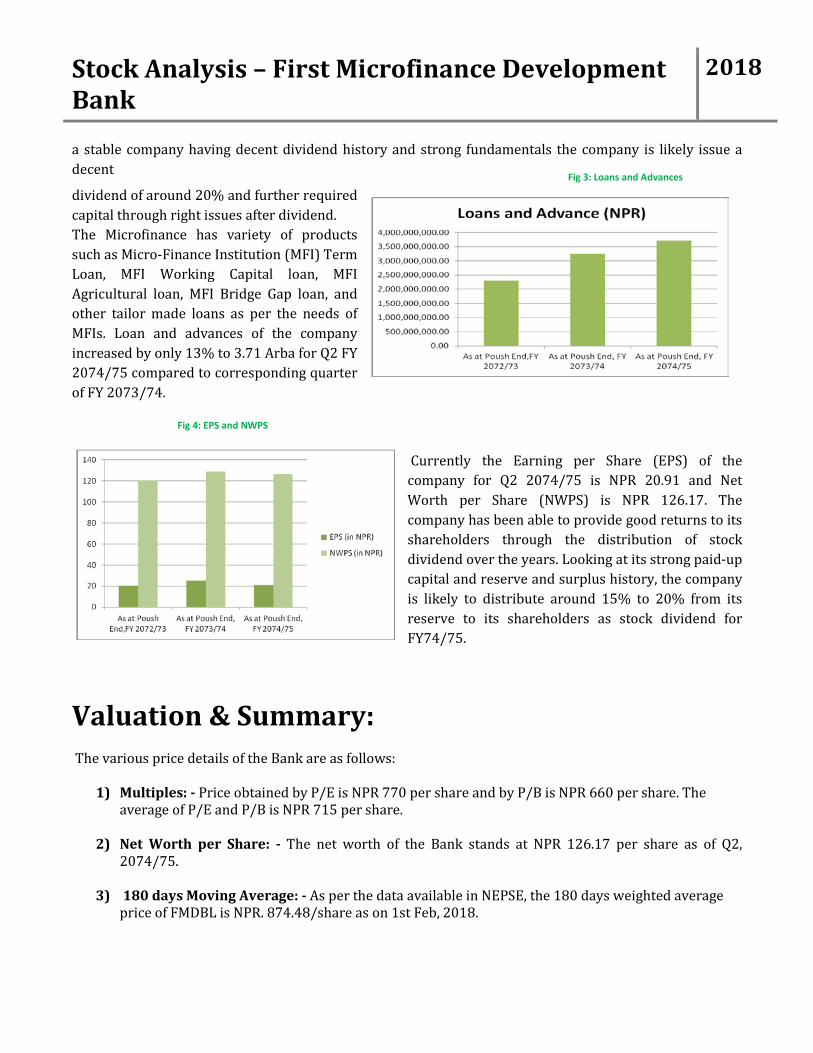
dividend of around 20% and further required capital through right issues after dividend. The Microfinance has variety of products such as Micro-Finance Institution (MFI) Term Loan, MFI Working Capital loan, MFI Agricultural loan, MFI Bridge Gap loan, and other tailor made loans as per the needs of MFIs. Loan and advances of the company increased by only 13% to 3.71 Arba for Q2 FY 2074/75 compared to corresponding quarter of FY 2073/74.
Currently the Earning per Share (EPS) of the company for Q2 2074/75 is NPR 20.91 and Net Worth per Share (NWPS) is NPR 126.17. The company has been able to provide good returns to its shareholders through the distribution of stock dividend over the years. Looking at its strong paid-up capital and reserve and surplus history, the company is likely to distribute around 15% to 20% from its reserve to its shareholders as stock dividend for FY74/75.
Valuation & Summary:
The various price details of the Bank are as follows:
1) Multiples: - Price obtained by P/E is NPR 770 per share and by P/B is NPR 660 per share. The average of P/E and P/B is NPR 715 per share.
2) Net Worth per Share: - The net worth of the Bank stands at NPR 126.17 per share as of Q2, 2074/75.
3) 180 days Moving Average: - As per the data available in NEPSE, the 180 days weighted average
price of FMDBL is NPR. 874.48/share as on 1st Feb, 2018.
Fig 4: EPS and NWPS
Fig 3: Loans and Advances
Stock Analysis – First Microfinance Development Bank
2018
In relation to price multiple, the microfinance has positioned itself in the first quartile for EPS and ROE also P/BV lies in first quartile. These parameters indicate that the Microfinance is performing sideways to the industry average but trading lower than industry adjusted price. After averaging the various methods of valuation on an equal weighted approach, the valuation of share comes to NPR 625.01 per share. However, the recent 50% right share issue has caused major dilution. And we had adjusted the price valuation accordingly. We further discount the price by 10% which provides the fair price of NPR of 562 after the dividend and right adjustment. Based on market trends, stocks are trading at a higher price than the said value. However, observing the current downtrend of the market, we recommend buying the stock in the near future below the said price in near future and take the accumulate approach for the Microfinance since the fundamentals are in a good position.
All material included in this document is based on data / information gathered from various sources and is based on certain assumptions of Nabil Invest. Therefore, this study should not be solely relied upon for making any decision, investment or otherwise. The prospective user of this study is encouraged to carry out his / her own due diligence and gather any information he / she considers necessary for making an informed decision.
The content of this study does not bind Nabil Investment Banking Ltd. in any legal or other form.
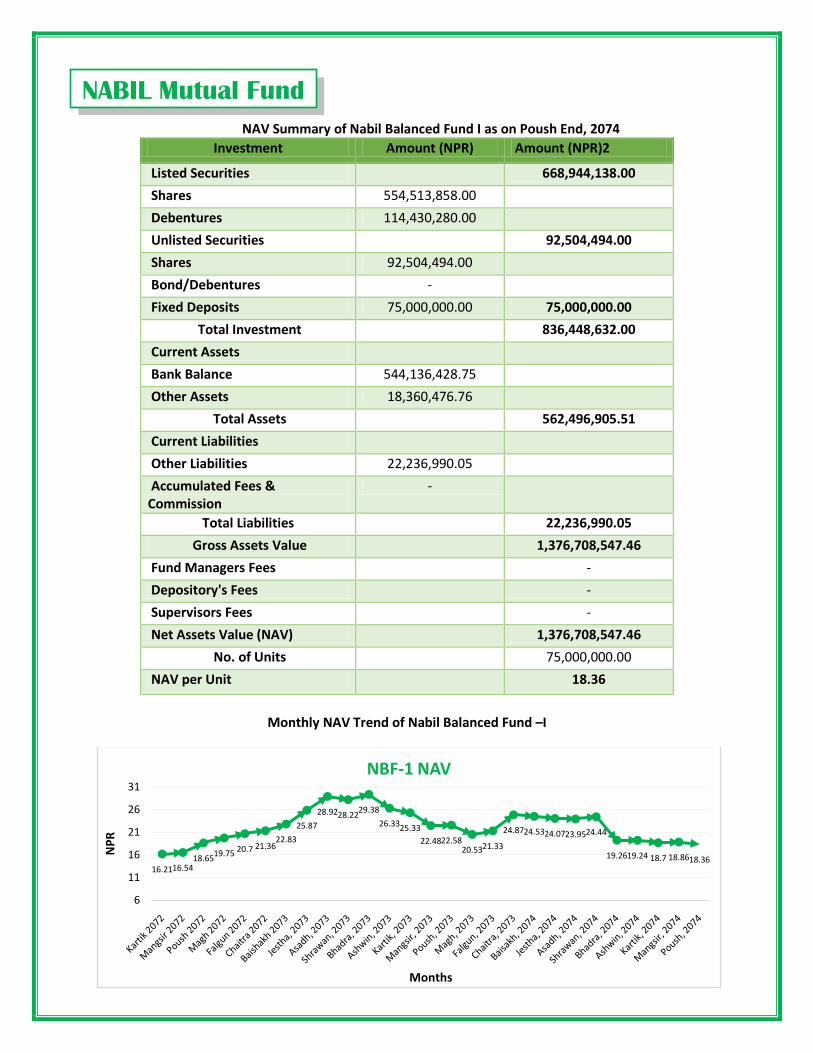
NAV Summary of Nabil Balanced Fund I as on Poush End, 2074 Investment Amount (NPR) Amount (NPR)2
Listed Securities 668,944,138.00 Shares 554,513,858.00 Debentures 114,430,280.00 Unlisted Securities 92,504,494.00 Shares 92,504,494.00 Bond/Debentures - Fixed Deposits 75,000,000.00 75,000,000.00
Total Investment 836,448,632.00 Current Assets Bank Balance 544,136,428.75 Other Assets 18,360,476.76
Total Assets 562,496,905.51 Current Liabilities Other Liabilities 22,236,990.05 Accumulated Fees & Commission
-
Total Liabilities 22,236,990.05 Gross Assets Value 1,376,708,547.46
Fund Managers Fees - Depository's Fees - Supervisors Fees - Net Assets Value (NAV) 1,376,708,547.46
No. of Units 75,000,000.00 NAV per Unit 18.36
Monthly NAV Trend of Nabil Balanced Fund –I
16.2116.5418.6519.75 20.7 21.36
22.8325.87
28.9228.2229.3826.3325.33
22.4822.5820.5321.33
24.8724.5324.0723.9524.44
19.2619.24 18.7 18.8618.36
6
11
16
21
26
31
NPR
Months
NBF-1 NAV
NABIL Mutual Fund
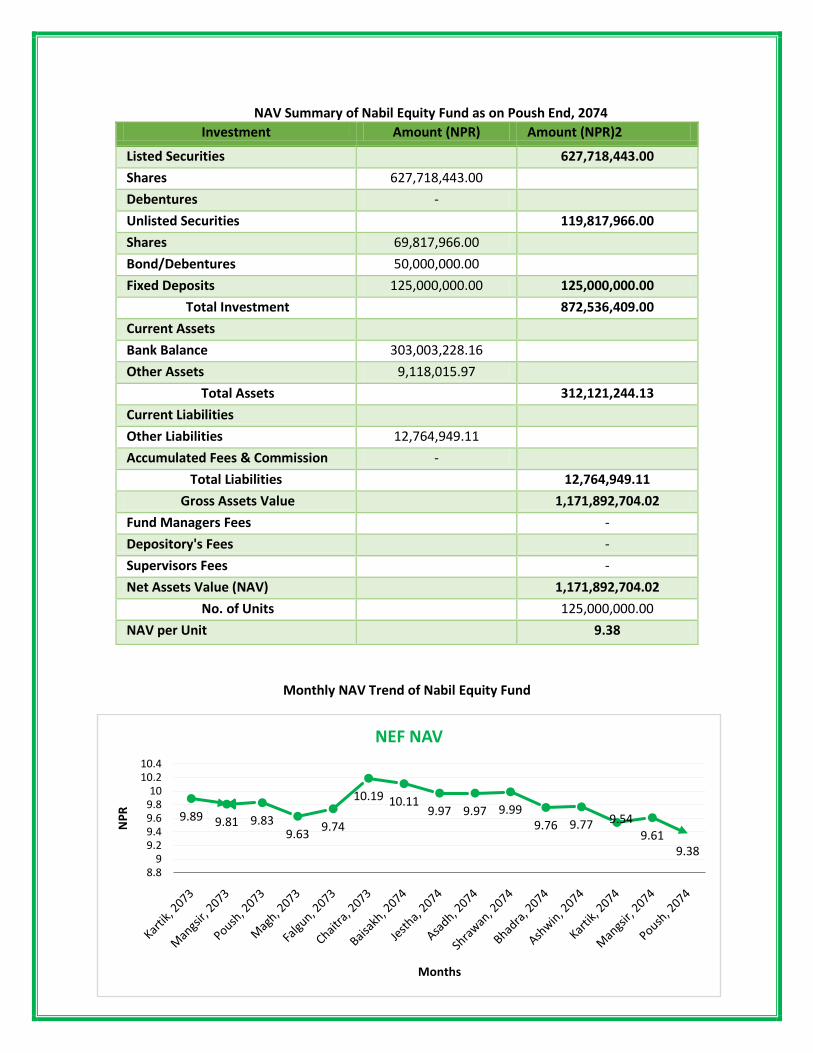
NAV Summary of Nabil Equity Fund as on Poush End, 2074
Investment Amount (NPR) Amount (NPR)2
Listed Securities 627,718,443.00 Shares 627,718,443.00 Debentures - Unlisted Securities 119,817,966.00 Shares 69,817,966.00 Bond/Debentures 50,000,000.00 Fixed Deposits 125,000,000.00 125,000,000.00
Total Investment 872,536,409.00 Current Assets Bank Balance 303,003,228.16 Other Assets 9,118,015.97
Total Assets 312,121,244.13 Current Liabilities Other Liabilities 12,764,949.11 Accumulated Fees & Commission -
Total Liabilities 12,764,949.11 Gross Assets Value 1,171,892,704.02
Fund Managers Fees - Depository's Fees - Supervisors Fees - Net Assets Value (NAV) 1,171,892,704.02
No. of Units 125,000,000.00 NAV per Unit 9.38
Monthly NAV Trend of Nabil Equity Fund
9.89 9.81 9.839.63 9.74
10.19 10.119.97 9.97 9.99
9.76 9.77 9.549.61
9.388.8
99.29.49.69.810
10.210.4
NPR
Months
NEF NAV
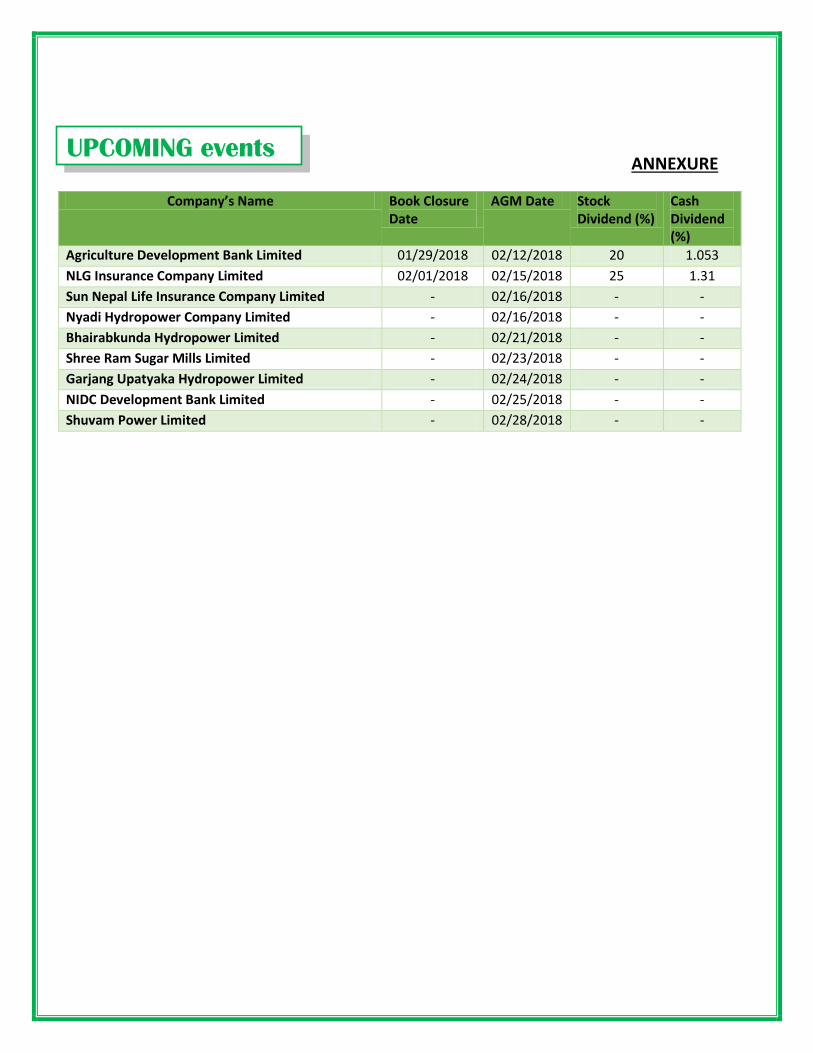
ANNEXURE
Company’s Name Book Closure Date
AGM Date Stock Dividend (%)
Cash Dividend (%)
Agriculture Development Bank Limited 01/29/2018 02/12/2018 20 1.053 NLG Insurance Company Limited 02/01/2018 02/15/2018 25 1.31 Sun Nepal Life Insurance Company Limited - 02/16/2018 - - Nyadi Hydropower Company Limited - 02/16/2018 - - Bhairabkunda Hydropower Limited - 02/21/2018 - - Shree Ram Sugar Mills Limited - 02/23/2018 - - Garjang Upatyaka Hydropower Limited - 02/24/2018 - - NIDC Development Bank Limited - 02/25/2018 - - Shuvam Power Limited - 02/28/2018 - -
UPCOMING events

Nabil Investment Banking Ltd., 3rd Floor, Central Plaza, Narayanchaur, Naxal, Kathmandu
Phone: 01-4411604, 4411733 | Fax: 01-4410554 | [email protected] |http://www.nabilinvest.com.np/ | www.facebook.com/NabilInvest

Disclaimer and important information: This document has been prepared by Nabil Investment Banking Ltd. (Nabil Invest) for information and illustration purpose only. The information provided in this document is subject to change. While this information has been obtained from sources believed to be reliable, Nabil Invest is not liable for erroneous information obtained from the sources. Nabil Invest, its directors and employees are not liable/responsible for any direct, indirect or consequential loss arising from use of this document or its contents. Past performance is no indication of future results. Nabil Invest is regulated by Securities Board of Nepal. This document may not be reproduced, distributed or published by any person for any purpose without Nabil Invests’ prior written consent.
Nabil Investment Banking Ltd., 3rd Floor, Central Plaza, Narayanchaur, Naxal, Kathmandu Phone: 01-4411604, 4411733 | Fax: 01-4410554 | [email protected] |http://www.nabilinvest.com.np/ |
www.facebook.com/NabilInvest