ryan nabil final draft 2
TRANSCRIPT

Ryan Nabil
“What are the Characteristics and Determinants of U.S. and Chinese Foreign Direct
Investment in Africa?”
May 9, 2015
Nabil 1
1. Introduction
If a company wants to serve a foreign market, it essentially has three options: it can
produce goods domestically and export them to the foreign market, produce goods in the
foreign market using a foreign firm, or produce in the foreign market by buying majority
shares of a local company. This last option is called Foreign Direct Investment (FDI). FDI is
defined formally as “cross-border investment by a resident entity in one economy with the
objective of obtaining a lasting interest in an enterprise resident in another economy” (OECD
Library, 2012). FDI occurs when a company purchases 10 or more percent of the outstanding
shares of an enterprise, allowing the company to have the controlling share of the entity.1 For
instance, if an American entity buy stocks of an African enterprise, the American company
will have the controlling share of the company and can introduce new techniques of
production and management in the company.
There are two main types of FDI: horizontal FDI and vertical FDI. Horizontal FDI
occurs when firms replicate identical production techniques in multiple countries. For
instance, when Pepsi Cola establishes a production facility in Lagos, Nigeria to produce
beverages, it employs the same production technique as it uses in its headquarters in New
York. Pepsi Cola’s investment to acquire a firm in Nigeria to serve domestic customers there
is an example of horizontal FDI. On the other hand, vertical FDI occurs when firms locate
different stages of operation in different countries. For instance, in the production process of
MacBook laptops, Apple produces the processors in California, but assembles them in China
because of lower labour cost in China. Apple’s investment to purchase an assembly factory in
China is an example of vertical FDI. Both horizontal and vertical FDI bring host countries a
number of benefits, including higher capital stock and output, increased employment, tax
1 However, if a company purchases less than 10 percent of outstanding shares, it does not have the controlling
share of the entity. This investment is referred to as Foreign Portfolio Investment (FPI).

Nabil 2
revenues, and exports. Lastly, as Apple and other foreign companies train their local
employees, they improve the host country’s human capital stock. As these employees leave
the multinational companies and join local companies, they bring their improved managerial
and technical skills to the local companies. Thus, FDI can have significant spill over effects
in the local economy.
Because of increase in capital stock and human capital, FDI is important to Africa’s
development, but as a continent, it receives only a minority of the world’s FDI flows: for
instance, in 2000-2005, it received only 2.2 percent of the global FDI flows (UNCTAD,
FDI/TNC Database). Some economists think that in order for Africa to grow at the same rate
as Southeast Asia did in the 1980s, Africa needs more FDI and the increase in physical and
human capital training that accompanies it (UNCTAD). Apart from the European Union, the
United States and China are the two main development partners of Africa.2 In this paper, I
will compare American and Chinese FDI patterns in Africa. I will also investigate their
determinants. This investigation is important because if American and Chinese FDI in Africa
are functions of certain policies such as lower tax rates or stronger protection of intellectual
property rights, then African governments can attract more FDI by changing those policy
variables.
This brings me to the second part of my motivation for this paper: the popular media
has been sceptical of the Chinese involvement in Africa. For instance, with the increase in
Chinese FDI, particularly in the natural resources sector, Chinese involvement in Africa has
been called “neo-colonialist,” and “neo-imperialist” (Okeowo, 2013). It has been suggested
that the Chinese investors are interested in Africa to exploit their natural resources and are
2 The other main development partner of Africa is the European Union. Since the EU consists of 27 states, it
would be more difficult to generalise about the European FDI determinants in Africa (for instance, France and
the UK have different colonial legacies and are more interested in certain countries than others). On the other
hands, southern and Eastern European countries might also have their own FDI objectives. Therefore, I find
China and US to be a more interesting comparison.

Nabil 3
more likely than other investors to support states with poor human rights records. As a part of
my investigation, I will also explore if Chinese investors are more likely than American
investors to invest in countries that have high concentrations of natural resources.
2. Historical Overview
2.1 The United States in Africa
The United States has been involved significantly with Africa since the early modern
times. Unlike that of China, the U.S. involvement in Africa has been intertwined with its
history of slavery. The United States Africa Command provides a useful summary of
historical U.S. exchanges with Africa in “Fact Sheet: U.S.-Africa Relations Chronology”: in
1619, the first group of African slaves arrived in Florida in what was then the English Colony
of Jamestown, Virginia (the United States Africa Command, 2008).3 In 1777 Morocco
became the first country in the world to recognise the United States as a nation following its
War of Independence with Britain. Between 1798 and 1808, the United States imported
approximately 200,000 African slaves, which was the highest number of slave imports to the
United States in its history. In 1808 the Congress outlawed slavery, but it did not come to
effect until 1820, when the Congress equated slave trade with piracy and makes its imports
punishable by death. In 1822 the United States establishes the first African-American
settlements, which leads to the creation of Liberia.
In the next few decades, when European nations began exploring and colonising
Africa, the United States assumed a reluctant role. For instance, when German Chancellor
Otto Von Bismarck hosts the 1884-85 Berlin Conference, which marked the beginning of the
European colonisation of Africa, the United States sent a representative, but did not act as a
major player in the talks. In fact, over the years, the United States remained anti-imperialist:
3 The exact country of origin of these slaves are unknown.

Nabil 4
during the 1899-1902 Boer War, the American popular support sways in favour of the Boers
as the “anti-imperialist yeomen fighters” (the U.S. Africa Command, 2008). During and after
the Second World War, the United States became involved in emancipating several African
countries. In the 1942 Operation Torch, American and British troops drove the Axis forces
out of Africa by defeating them in Vichy French-Morocco, Algeria, and Tunisia.
Furthermore, during the 1956 Suez Canal, the United States and USSR pressured Israel,
Britain, and France into leaving Egypt, which bolstered the United States’ image as an anti-
imperial force in Africa.
However, American publicity in Africa suffered during the Cold War era, as
American interests at times did not align with those of Soviet-backed African leaders. For
instance, in 1961, the Kennedy Administration backed Belgium and the presence of Belgian
peacekeeping forces in Congo, which was deemed as the better alternative to pro-Soviet
Congo. Furthermore, American complicity and suspicions of its involvement in the death of
Patrice Lumumba, pro-Soviet Congolese independence leader and the first democratically
elected Congolese Prime Minister, deteriorated African perceptions of the United States.
Furthermore, fear of Soviet-led government in Angola led the United States to support the
minority National Liberal Front of Angola (NLF), which lengthened its civil war between
NLF and pro-Soviet groups. Such proxy-wars bolstered the idea that the United States was
interested in Africa to maintain its hegemony against the Soviet Union.
2.1 China in Africa
While China has not been as involved in African politics like the United States,
Chinese involvement in Africa is not a modern phenomenon; in fact, it dates back to the
Ming Dynasty, when the Chinese imperial sailor Zheng He made four trips to the coast of
Africa between 1405 and 1433 (Wade, 2004). However, in the next few centuries following
Nabil 5
Zheng He’s explorations, China would pursue protectionist and inward-looking foreign
policy. Modern-day exchanges between Africa and China dates back to the 1950s, when
China looked towards Africa to counterbalance the Soviet hegemony after its relationship
with the Soviet Union deteriorated (Ayodele and Sotola, 2014). In fact, African countries
provided important support to China in the United Nations, especially as China dealt with its
disputes over Taiwan. During the next two decades, China provided foreign aid to thirty
African countries. However, during the 1980s, as China focused on inward economic
development, its relationship with Africa suffered. The 1990s saw the Chinese re-emergence
in the continent, with increased focus not just on direct foreign aid, but also on investment,
technology transfer, development assistance, and trade.
Since its re-emergence in Africa in the 1990s, China has become an important
economic partner for Africa: between 2000 and 2012, trade between China and Africa
increased from $9 billion to $166 billion, making China the largest trading partner of Africa
(U.N. Comtrade, 2014). In the same time period, Chinese FDI to Africa increased from $200
million to $2.9 billion (UNCTAD, 2013). While U.S. FDI to Africa is still slightly greater
than Chinese FDI to Africa, China is now the largest developing country trading partner of
Africa, making Chinese involvement in Africa an interesting counterpart to American
involvement in the region.4 Furthermore, China, unlike the United States, improved its
poverty rate from 84 percent in 1981 to 15.9 percent in 2005, which makes the Chinese
model of development relatable to many Africans (Zheng, 2010: 273).
4 See Chart 1a and 1b at the end of the paper for distribution of American, European and Chinese FDI in Africa.

Nabil 6
3. Theory
3.1 Investment Theory
In the history of FDI literature, there have been two major theories: capital or
investment theory, and OLI theory. Until the 1950s, investment theory was the main theory in
understanding FDI patterns. Investment theory predicted that capital should flow to countries
with lower capital stock and higher returns. This theory was bolstered by empirical evidence
on American investment in Europe, which was the major source of FDI in the world at that
time. During the 1950s, American investment in Europe indeed earned higher returns than
American investment at home (Mundell, 1957). However, in the 1960s and 1970s, when
returns to American investment in Europe became lower, investment theory did not fully
explain why capital did not flow as much to African countries, which had much lower capital
stock and higher returns than European countries. After investment theory came OLI theory,
which is the framework I use for the majority of my paper.
3.2 OLI Framework
Among the different theories put forward by economists regarding FDI, the “eclectic
approach” or the “OLI” framework is helpful in understanding why multinational
corporations (MNCs) invest in certain countries. OLI stands for ownership, location, and
internalisation advantages. “World Economy FDI: the OLI Framework” provides a useful
summary of these advantages (Neary, 2015). Ownerships advantages refer to the specific
capabilities of a firm for which it wishes to enter a foreign market. Ownerships advantages
include factors such as large amounts of asset, patent, technology, and production techniques.
Such advantages often make a multinational company more competitive than domestic firms.
For instance, local entrepreneurs in Kenya might not possess the technology or infrastructure

Nabil 7
to extract oil. However, British Petroleum has the technological expertise and equipment with
which to extract oil. Consequently, when British Petroleum operates in Kenya, it is able to
compete there because of its superior assets and technical knowhow, that is, because of its
ownership advantage.
Locational advantages, on the other hand, explain factors about a particular country
for which firms wants to invest there. Such advantages can include factors such as the size of
the economy (as measured by real GDP) or population, which make the host country
attractive to investors. For instance, Coca Cola is more likely to invest in Nigeria, Egypt, and
South Africa, the three largest economies in Africa, rather than Somalia, Gambia, and
Comoros, the three smallest ones, since the larger economies have more purchasing power
than the smaller ones.
Lastly, internalisation advantages explain why a firm finds it more advantageous to
produce goods itself, rather than letting a domestic firm license its technology and produce on
its behalf. Licensing makes it difficult for a firm to keep its technology secret, and makes it
more likely that other firms will steal its technology. Consequently, if a firm wants to protect
its technology against risk of imitation and other opportunistic behaviour, it may decide not
to issue a license. For instance, if Apple issues a license to a local firm, in the absence of
strong property rights, the local firm may steal Apple’s technology. Therefore, Apple has an
incentive to run its own firm to protect its technology against imitation. Internalisation
advantage refers to the benefit that Apple gets when it runs its own firm rather than licensing
its technology.
4. Literature Review on Determinants of Foreign Direct Investment
There has been little empirical research comparing U.S. and Chinese FDI in Africa,
but there has been a number of empirical studies concerning the global determinants of FDI.

Nabil 8
Previous research found GDP per capita, GDP, and market size to be the most important
determinants of FDI flow (Kravis and Lipsey (1982), Wheeler and Mody (1992), and
Billington (1993)). This is not surprising since GDP and market size are reflective of a
country’s locational advantages, while lower GDP per capita often signals lower wages and
attracts vertical FDI (see empirical strategy for further discussion on how these variables
relate to the OLI framework). Furthermore, in their research about FDI, James P. Walsh and
Jiangan Yu find openness, average inflation, and GDP per capita to be key determinants
(Walsh and Yu, 2010). The other important determinants of FDI include trade openness, host
country tax rate, and human capital. I include all of these variables in my regression.
Whilst there has not been as much research regarding the determinants of U.S. or
Chinese FDI in Africa, there has been a substantial body of research regarding the
determinants of U.S. FDI in Europe. Previous studies by Lunn (1980) and Culem (1988)
found market size and growth to be important determinants of U.S. FDI in the European
Union area; however, to what extent these determinants are true of U.S. FDI in Africa
remains unclear. I include GDP growth rate in my regression to investigate if GDP growth
rate is an important indicator of U.S. FDI in Africa as well as Europe.
5. Data Analysis
Before discussing empirical strategy, I would like to discuss the general trends in my
dataset. The data on FDI flows between 2006 and 2012 is available from the United Nations
Conference on Trade and Development (UNCTAD). There are several countries for which
FDI data are not reported for the years 2006 and 2007. In order to maximise the number of
countries in my sample, I take the average FDI flows between the years 2008 and 2012

Nabil 9
The dataset contains 31 of the 53 countries of the African continent (see footnote for
the 31 countries).5 It contains all the major economies of Africa, including South Africa,
Egypt, Mauritius, and Angola. The countries in the dataset are geographically diverse: for
instance, while South Africa is at the southernmost point of Africa, Morocco and Algeria are
in North Africa, and Mauritius is in the Indian Ocean about 1,200 miles off the southeast
coast of Africa. However, this dataset does not include a few small islands such as Cape
Verde, Reunion (France) and Saint Helena, Ascension and Tristan da Cunha (UK). It also
does not contain certain war-torn countries such as Sierra Leone, newly independent nations
such as South Sudan, or disputed territories such as the Western Sahara. Nonetheless, since
most of these nations receive little to no FDI, their omission from the dataset is not likely to
significantly impact my results.
5.1 Recipients of FDI
The average U.S. FDI flow to 31 countries in the sample was $176.71 million,
whereas the average Chinese flow was $78.81 million. In absolute terms, the highest five and
lowest three recipients of U.S. and Chinese FDI flows are as follows:
Country US FDI Flow (2008-
2012) ($million)
Country Chinese FDI Flow
(2008-2012)
($million)
Egypt 1655.00
South Africa 886.31
Nigeria 1251.20
Nigeria 209.96
Mauritius 755.80
Congo, Dem. 181.34
Angola 688.40 Sudan 112.93
South Africa 643.40 Algeria 163.45
Eq Guinea -143.40 Eritrea 1.54
Tunisia -144.00 Tunisia 0.36
5 Algeria, Angola, Botswana, Cameroon, Congo, the Democratic Republic of Congo, Cote d’Ivoire, Egypt,
Equatorial Guinea, Eritrea, Gabon, Ghana, Kenya, Liberia, Madagascar, Malawi, Mali, Mauritania, Mauriitus,
Morocco, Mozambique, Niger, Nigeria, Rwanda, Senegal, Seychelles, South Africa, Sudan, Tunisia, Uganda,
and the United Republic of Tanzania.

Nabil 10
Gabon -154.50 Cote d’Ivoire -1.21
Here are two charts showing U.S. and Chinese FDI flows to Africa, followed by a map of
Africa by FDI recipients:
0.00
200.00
400.00
600.00
800.00
1000.00
Sou
th A
fric
aC
on
go,…
Alg
eria
Mau
riti
us
Egyp
tK
enya
Un
ited
Re
p. o
f…C
on
goB
ots
wan
aG
abo
nSe
ych
elle
sM
auri
tan
iaU
gan
da
Cam
ero
on
Mal
awi
Tun
isia
Ch
ines
e FD
I Flo
w (
in M
illio
ns
of
USD
)
Countries
Chinese FDI Flow (2008-2012) by Destination
-500.00
0.00
500.00
1000.00
1500.00
2000.00
Egyp
t
Mau
riti
us
Sou
th A
fric
a
Gh
ana
Mo
rocc
o
Bo
tsw
ana
Mo
zam
biq
ue
Sud
an
Mau
rita
nia
Nig
er
Erit
rea
Sen
ega
l
Cam
ero
on
Co
ngo
Equ
ato
rial
…
Gab
on
US
FDI F
low
(in
Mill
ion
s o
f U
SD)
Countries
U.S. FDI Flow (2008-2012) by Destination
Recipients of U.S. and
Chinese FDI in Africa
(Brookings, 2012)

Nabil 11
We see a few key trends here: several countries, such as South Africa, Egypt, Nigeria,
and Mauritius monopolise FDI flows into Africa. These four countries account for 78% and
52% of 2008-2012 U.S. and Chinese FDI flows to Africa. Apart from the Democratic
Republic of Congo, there is a strong overlap between the major recipient of U.S. and Chinese
FDI: South Africa, Nigeria, and Mauritius are in the top 5 recipients for both countries. The
large discrepancy between U.S. and Chinese FDI in the Democratic Republic of Congo is due
to the 2008 $9 billion deal between China and Congo, of which $6 billion is to be invested in
infrastructure and $2 billion in mining operations (The China Monitor, 2008).
Secondly, apart from South Africa, which is the largest recipient of Chinese FDI to
Africa, Chinese FDI flows are more evenly distributed, with the lowest FDI recipient being
Gabon, with a net FDI inflow of -1.21 million. This means that between 2008 and 2012,
Chinese investors pulled out $1.21 million out of Gabon. However, while the U.S. has, on
average, higher FDI flow into Africa, they are highly concentrated in Egypt, Mauritius, South
Africa, and Ghana. Furthermore, the U.S. investors have been pulling out substantial sums of
money from Gabon, Tunisia, and Equatorial Guinea. Between 2008 and 2012, it pulled out an
average of $154.50 million dollar out of Gabon. In fact, the magnitudes of U.S. FDI flows
tend to be higher in both extremes: U.S. FDI flow (to Egypt) is 86% higher than the highest
Chinese FDI flow (to South Africa). At the same time, the U.S. also pulled out money from
risky countries faster than China did. For instance, consider Tunisia, a country that was 2nd
lowest FDI recipient for both countries. While Chinese investors invested added a meagre
$360,000 per year in the period 2008-2012, the US investors pulled out an average of $144
million per year on average during the same time period.
The main reason why both the United States and Chinese investors decreased their
investment in Tunisia is due to the political transition following the Arab Revolution, as
investors became wary of the transitioning political system and the new business policies (the

Nabil 12
Dubai National, 2012). However, it seems that U.S. investors are more sensitive to political
volatility than Chinese investors. In addition to the above example of American investment
fleeing Tunisia, consider the cases of Congo, Gabon, and Equatorial Guinea, three countries
that have been strife with political violence over the last few years.6 American investment
decreased in Cote d’Ivoire by $56.40 million per year between 2008 and 2012, whereas
Chinese investment in Cote d’Ivoire decreased only by $1.2 million per year during the same
time period. Similarly, in Congo, 2008-2012 Chinese FDI flow averaged $35 million, while
U.S. FDI flow averaged $29 million (UNCTAD data).
5.2 Sectors of FDI
Both the U.S. and China invest heavily in Egypt, Mauritius, South Africa, and Ghana:
apart from Mauritius, the other three are large economies with have copious amounts of
natural resources. 7 Natural resource share of GDP for these three countries average 26%,
which is higher than the African average of 21% (UNCTAD). However, to what extent are
the U.S. and China engaged in different industries? While the UNCTAD dataset which I use
does not report sectoral composition of U.S. and Chinese investments, the Brookings
Institution used the Chinese White Paper on Economic Cooperation (2013) and a 2012 CRS
paper “U.S. Trade and Investment Relations with sub-Saharan Africa and the African Growth
and Opportunity Act” to analyse the composition of U.S. and Chinese FDI stocks and here is
a summary of their findings: 8
6 For instance, Congo saw two civil wars in the last ten years, the latter of which ended in 2011. 7 Mauritius is the top recipient of both American and Chinese FDI flows, but this largely reflects the pro-trade
policies of the Mauritian government, in addition to the bilingual work force and political stability, which
encourages foreign investment (the IMF, 2002). Furthermore, Mauritius is used as a conduit to invest into India
because of their Double Taxation Avoidance Argument (DTAA): last year for instance, Mauritius was the
highest source of FDI to India, accounting for 25 percent of India’s total FDI flows in 2012 (the Economic
Times, 2014). 8 No such data on FDI flow is available.

Nabil 13
Sector Percentage of U.S.
FDI Stock
Percentage of
Chinese FDI Stock
Mining and Extractive Industries 58.0% 30.6%
Financial Services 12.0% 19.5%
Construction 0% 16.4%
Manufacturing 5.0% 15.3%
Technological Services and Geological
Prospecting
25.8% 18.2%
Total 100.0% 100.0%
This data provides no evidence to suggest that China invests more in mining and
extractive industries than the United States; in fact, it seems to be the other way around, with
Chinese FDI stock in mining being 30.6% of its total investment as opposed to 58.0% for
U.S. FDI stock. Another sector which stands out is the construction industry, where the
Chinese invest 16.4%, but the Americans do not invest at all. China’s involvement in African
construction breeds the perception that China is a development partner in Africa and an
alternative to institutions such as the International Monetary Fund and the World Bank
(Zheng, 2010: 271). In fact, building infrastructure is an important part of Chinese
involvement with Africa: in 2006, there were 800 Chinese construction companies operating
in Africa (He, 2006).
Furthermore, differences in U.S. and Chinese investment in Africa are indicative of
their relative OLI advantages. The 27.4 percentage point difference between the U.S. and
Chinese investment in mining and extractive industries and the 7.6 percentage point
difference in technological services and geological prospecting reflects the ownership
advantage that the American companies might possess. For instance, American companies
might have better machinery, technical knowledge, and asset than their Chinese counterparts,
which is why they are overrepresented in for mining and extractive industries.
Financial services reflect both ownership and locational advantages: for instances,
accounting and auditing services require strong financial knowledge, which indicate the
Nabil 14
financial firms’ ownership advantages. On the other hand, financial firms are also more likely
to start businesses in countries with stronger locational advantages such as South Africa and
Egypt, which are two of the largest economies in Africa. Lastly, Chinese investment is
slightly higher than American investment in manufacturing, which is suggestive of vertical
FDI in those countries, as countries with lower wages will have comparative advantage in
labour-intensive manufacturing industries. Chinese investment in manufacturing also reflects
the increasing cost pressure in the Chinese textile and electronics industries, particularly in
the coastal industrial zones. In fact, this increase in cost is in fact leading many Chinese
companies to shift manufacturing jobs to countries with countries with lower labour cost,
such as Vietnam, Mexico, and South Africa (Goodman, 2015).
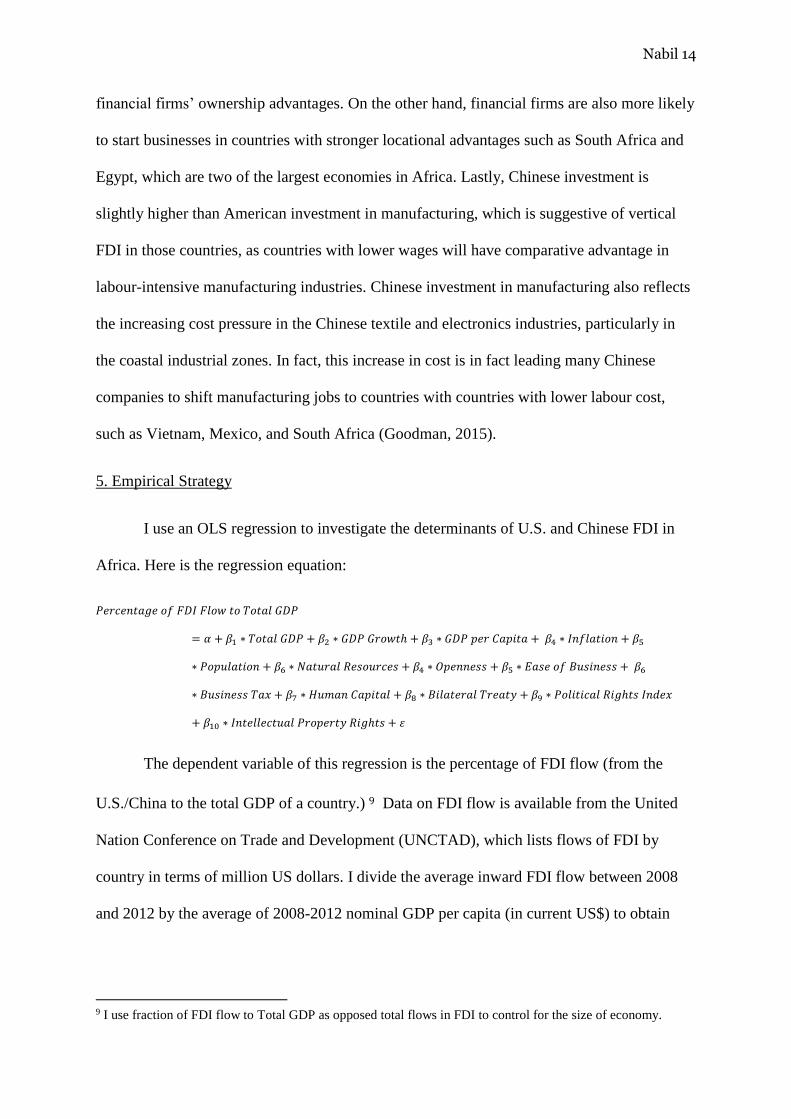
5. Empirical Strategy
I use an OLS regression to investigate the determinants of U.S. and Chinese FDI in
Africa. Here is the regression equation:
𝑃𝑒𝑟𝑐𝑒𝑛𝑡𝑎𝑔𝑒 𝑜𝑓 𝐹𝐷𝐼 𝐹𝑙𝑜𝑤 𝑡𝑜 𝑇𝑜𝑡𝑎𝑙 𝐺𝐷𝑃
= 𝛼 + 𝛽1 ∗ 𝑇𝑜𝑡𝑎𝑙 𝐺𝐷𝑃 + 𝛽2 ∗ 𝐺𝐷𝑃 𝐺𝑟𝑜𝑤𝑡ℎ + 𝛽3 ∗ 𝐺𝐷𝑃 𝑝𝑒𝑟 𝐶𝑎𝑝𝑖𝑡𝑎 + 𝛽4 ∗ 𝐼𝑛𝑓𝑙𝑎𝑡𝑖𝑜𝑛 + 𝛽5
∗ 𝑃𝑜𝑝𝑢𝑙𝑎𝑡𝑖𝑜𝑛 + 𝛽6 ∗ 𝑁𝑎𝑡𝑢𝑟𝑎𝑙 𝑅𝑒𝑠𝑜𝑢𝑟𝑐𝑒𝑠 + 𝛽4 ∗ 𝑂𝑝𝑒𝑛𝑛𝑒𝑠𝑠 + 𝛽5 ∗ 𝐸𝑎𝑠𝑒 𝑜𝑓 𝐵𝑢𝑠𝑖𝑛𝑒𝑠𝑠 + 𝛽6
∗ 𝐵𝑢𝑠𝑖𝑛𝑒𝑠𝑠 𝑇𝑎𝑥 + 𝛽7 ∗ 𝐻𝑢𝑚𝑎𝑛 𝐶𝑎𝑝𝑖𝑡𝑎𝑙 + 𝛽8 ∗ 𝐵𝑖𝑙𝑎𝑡𝑒𝑟𝑎𝑙 𝑇𝑟𝑒𝑎𝑡𝑦 + 𝛽9 ∗ 𝑃𝑜𝑙𝑖𝑡𝑖𝑐𝑎𝑙 𝑅𝑖𝑔ℎ𝑡𝑠 𝐼𝑛𝑑𝑒𝑥
+ 𝛽10 ∗ 𝐼𝑛𝑡𝑒𝑙𝑙𝑒𝑐𝑡𝑢𝑎𝑙 𝑃𝑟𝑜𝑝𝑒𝑟𝑡𝑦 𝑅𝑖𝑔ℎ𝑡𝑠 + 𝜀
The dependent variable of this regression is the percentage of FDI flow (from the
U.S./China to the total GDP of a country.) 9 Data on FDI flow is available from the United
Nation Conference on Trade and Development (UNCTAD), which lists flows of FDI by
country in terms of million US dollars. I divide the average inward FDI flow between 2008
and 2012 by the average of 2008-2012 nominal GDP per capita (in current US$) to obtain
9 I use fraction of FDI flow to Total GDP as opposed total flows in FDI to control for the size of economy.

Nabil 15
this variable (see Appendix A for a summary of variables). I do this to control for the size of
the country, as measured by its GDP. (See Appendix A: Data and Sources.)
The mean percentage of U.S. FDI flow to GDP is 0.30%, with a standard deviation of
1/76%, whereas those values are 0.25% and 0.27% respectively for Chinese FDI flow to
GDP. The mean percentage of U.S. FDI flow to GDP to African countries is higher than that
for Chinese FDI, which is consistent with the findings from the previous section. The
countries with the highest percentage of U.S. FDI to GDP are Mauritius, Liberia, and Egypt,
while those with the highest percentage of Chinese FDI to GDP are Seychelles, Mauritius,
and Liberia. Chinese FDI flow accounted for only 1.1% of the GDP of Seychelles, whereas
American FDI flow represented 6.6% of Mauritius’ GDP.
Both OLI framework and investment theory inform my choice of variables in the
regression. For instance, total GDP and market size, as measured by the total population of a
country, reflect the locational advantages that a firm can obtain by serving the market in the
host country. Therefore, if coefficients 𝛽1 and 𝛽5 are positive for a host country, it will
indicate the country’s locational advantages.
On the other hand, the share of natural resources of rent in GDP is likely to be
associated with ownership advantages. For instance, if a country is well endowed with natural
resources, it will attract investment from global mining and extraction firms, whose physical,
technological, and managerial skill reflect strong ownership advantages. In that case, I expect
𝛽6 to be positive. Share of natural resources is also likely to attract more vertical or resource
seeking FDI, who will want to exploit the natural resources of the country.
The coefficient on GDP per capita 𝛽3 is trickier to interpret as it can reflect either the
advantages of vertical relative to horizontal FDI or locational advantages. For instance, if 𝛽3
is negative, it may mean that a higher FDI flow to GDP percentage is associated with

Nabil 16
countries with lower GDP per capita and consequently lower wages. A negative 𝛽3 therefore
suggests that a country is more likely to attract vertical FDI, which seeks to exploit cheap
labour. On the other hand, if 𝛽3 is positive, higher FDI flow to GDP percentage is likely to
be associated with higher GDP per capita, suggesting that the higher income of countries
attract horizontal FDI. Since horizontal FDI seeks to replicate the same model of production
technique abroad, locational advantages such as higher GDP per capita are likely to induce
more horizontal FDI. Furthermore, 𝛽3 might also reflect support investment theory: if
investment theory is correct, 𝛽3 is likely to be negative, since more FDI should flow to
countries with higher returns, which according to the neoclassical theory, are the countries
with lower capital stock and lower GDP per capita.
In order to investigate the effect of internalisation advantage on FDI, I include an
intellectual property rights variable. The World Intellectual Property Forum publishes yearly
data on the total number of trademarks filed according to the country of origin. I divide the
weighted 2011/2012 average by 2011-2012 population (in millions) average to construct the
number of trademarks filed by country of origin per million people, which I use as a proxy
for intellectual property rights.10 If firms have strong internalisation advantage and want to
protect their technology, they are more likely to invest in countries with stronger intellectual
property rights. If that is the case, then the coefficient on IPR should be positive, as countries
with stronger property rights will have higher FDI flow to GDP percentages.
I also include inflation, growth rate, trade openness, and tax rates in my regression
since previous research found them to be important determinants of FDI. I use secondary
school enrolment rate as proxy for human capital and the number of days required to start a
10 The other variable that the World Intellectual Property Forum publishes is the World Intellectual Property
Index, which assigns scores almost exclusively to the developed countries: it assigned an index to only six
African countries.

Nabil 17
new business as proxy for ease of doing business. Lastly, several countries in the UNCTAD
sample have bilateral trade treaties with the United States and China, I create bilateral treaty
dummies for U.S. and Chinese FDI flows.11
Variable
No. of
Observati
on
Mean Standard
Deviation
Minimum Maximu
m
Unit
Percentage of Chinese
FDI/ GDP
31 .25 .27 -0.04 1.11 Percentage
Percentage of US
FDI/GDP
31 .30 1.76 -3.67 6.61 Percentage
Real GDP 31 127.72 222.61 1.82 804.26 Billion USD,
PPP (current
international
USD)
Real GDP Growth 31 4.50 2.40 -0.74 10.92 Percentage
Inflation 31 7.89 4.50 1.58 19.66 Percentage
Population 31 26.00 31.41 0.088 159.86 Current
Share of National
Resources in GDP
31 21.64 19.93 24.50 72.89 Percentage
Share of Exports and
Imports in GDP
31 38.05 21.88 4.80 92.80 Percentage
Days Required to Open a
New Business
31 24.52 26.33 5 135 Days
Secondary School
Enrolment Rate
31 58.13 27.16 16 100 Percentage
Business Tax Rate 31 43.37 12.55 24.5 72.8 Percentage
China Treaty Dummy 31 0.29 0.46 0 1 Number
US Treaty Dummy 31 0.13 0.34 0 1 Number
Political Rights Index 31 3.89 1.74 0.75 6.25 Number
Number of Trademark
Application
Filed/Million People
26 2823.31 6985.575 1 29661 Number/Million
11 China has enforced bilateral treaties (BIT) with 7 countries in our sample: Algeria, Ethiopia, Madagascar,
Mali, Mauritius, Morocco, and Zambia. In the dummy variable that I create, I assign a value of one if a country
has bilateral treaty in force.
The United States also has BITs with five countries in our sample: Rwanda, the Democratic Republic of Congo,
Equatorial Guinea, South Africa, and Zambia. I expect bilateral treaties to be positively correlated with FDI
flows into the country
Summary Statistics
Nabil 18
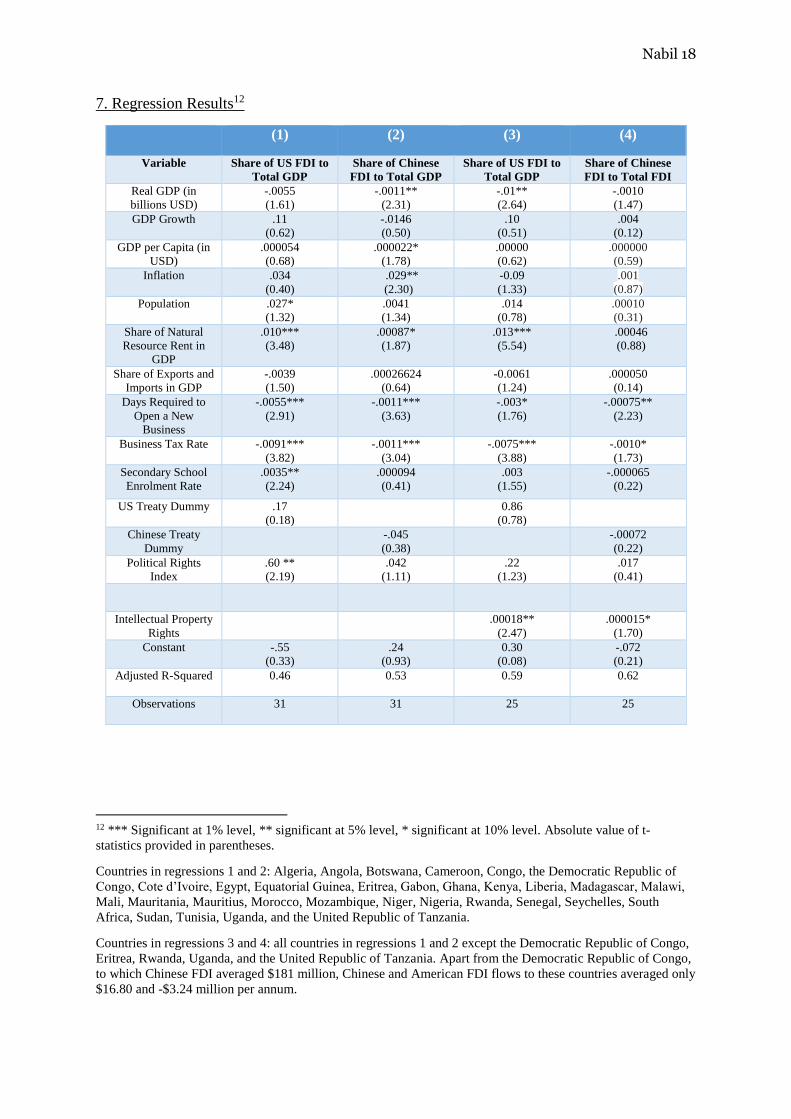
7. Regression Results12
12 *** Significant at 1% level, ** significant at 5% level, * significant at 10% level. Absolute value of t-
statistics provided in parentheses.
Countries in regressions 1 and 2: Algeria, Angola, Botswana, Cameroon, Congo, the Democratic Republic of
Congo, Cote d’Ivoire, Egypt, Equatorial Guinea, Eritrea, Gabon, Ghana, Kenya, Liberia, Madagascar, Malawi,
Mali, Mauritania, Mauritius, Morocco, Mozambique, Niger, Nigeria, Rwanda, Senegal, Seychelles, South
Africa, Sudan, Tunisia, Uganda, and the United Republic of Tanzania.
Countries in regressions 3 and 4: all countries in regressions 1 and 2 except the Democratic Republic of Congo,
Eritrea, Rwanda, Uganda, and the United Republic of Tanzania. Apart from the Democratic Republic of Congo,
to which Chinese FDI averaged $181 million, Chinese and American FDI flows to these countries averaged only
$16.80 and -$3.24 million per annum.
(1) (2) (3) (4)
Variable Share of US FDI to
Total GDP
Share of Chinese
FDI to Total GDP
Share of US FDI to
Total GDP
Share of Chinese
FDI to Total FDI
Real GDP (in
billions USD)
-.0055
(1.61)
-.0011**
(2.31)
-.01**
(2.64)
-.0010
(1.47)
GDP Growth .11
(0.62)
-.0146
(0.50)
.10
(0.51)
.004
(0.12)
GDP per Capita (in
USD)
.000054
(0.68)
.000022*
(1.78)
.00000
(0.62)
.000000
(0.59)
Inflation .034
(0.40)
.029**
(2.30)
-0.09
(1.33)
.001
(0.87)
Population .027*
(1.32)
.0041
(1.34)
.014
(0.78)
.00010
(0.31)
Share of Natural
Resource Rent in
GDP
.010***
(3.48)
.00087*
(1.87)
.013***
(5.54)
.00046
(0.88)
Share of Exports and
Imports in GDP
-.0039
(1.50)
.00026624
(0.64)
-0.0061
(1.24)
.000050
(0.14)
Days Required to
Open a New
Business
-.0055***
(2.91)
-.0011***
(3.63)
-.003*
(1.76)
-.00075**
(2.23)
Business Tax Rate -.0091***
(3.82)
-.0011***
(3.04)
-.0075***
(3.88)
-.0010*
(1.73)
Secondary School
Enrolment Rate
.0035**
(2.24)
.000094
(0.41)
.003
(1.55)
-.000065
(0.22)
US Treaty Dummy .17
(0.18)
0.86
(0.78)
Chinese Treaty
Dummy
-.045
(0.38)
-.00072
(0.22)
Political Rights
Index
.60 **
(2.19)
.042
(1.11)
.22
(1.23)
.017
(0.41)
Intellectual Property
Rights
.00018**
(2.47)
.000015*
(1.70)
Constant -.55
(0.33)
.24
(0.93)
0.30
(0.08)
-.072
(0.21)
Adjusted R-Squared 0.46 0.53 0.59 0.62
Observations 31 31 25 25

Nabil 19
Regressions (1) and (2), included in columns (1) and (2), do not control for
intellectual property rights (IPR), but regressions (3) and (4) do. As seen in column (1),
population, share of natural resource rent, days required to open a new business, tax rate,
secondary school enrolment rate, and political rights index are statistically significant
variables for U.S. investments. On the other hand, real GDP, GDP per capita, inflation, share
of natural resources, days required to open a new business, and tax rates are statistically
significant variables for Chinese FDI.
After controlling for IPR in regressions (3) and (4), real GDP, share of natural
resource rent in GDP, days required to open a new business, tax rate, secondary school
enrolment, and IPR are statistically significant variables for U.S FDI. On the other hand, days
required to open a new business, tax rate, and IPR are statistically significant variables for
Chinese FDI. However, that the magnitude of all of the statistically significant coefficients
are higher for American investment than for Chinese investment, suggesting that American
investment is more sensitive to these variables than Chinese investment.
It is interesting to note that, after controlling for IPR, the share of natural resources is
statistically significant for U.S. FDI, but not for Chinese FDI. This is consistent with the
observation in section 5 that the U.S. invests roughly 60% of its FDI stocks in mining and
extractive services, compared to only 30% by China. This overrepresentation of U.S. FDI in
mining and extractive industries suggest the superior ownership advantages of U.S.
companies, as ownership advantages are important in an capital-intensive field such as
mining and extractive industries. If a country’s natural resource as a share of its GDP
increases by 5 percentage points, this is on average associated with an increase in U.S. FDI
flow by 0.065 percentage points, which represents a 21.7 percent increase in the U.S. FDI
flow/GDP ratio.

Nabil 20
The number of days required to open a business and business tax rates are statistically
significant for both U.S. and Chinese investment; however, the magnitude of these
coefficients are higher for U.S. investment than for its Chinese counterpart, suggesting that
U.S. FDI flow is much more sensitive than Chinese FDI flow. For instance, a 10 percentage
point decrease in business tax rate is on average associated with an increase of U.S FDI flow
by 0.075 percentage points, which represents a 25% increase in U.S. FDI flow/GDP ratio.
However, a corresponding decrease in tax rate is associated with an increase in Chinese FDI
flow by only 0.01 percentage points and an increase in Chinese FDI flow/GDP share by only
4 percent.
Similarly, if the number of business days required to open a business is reduced by a
month, this is on average associated with an increase in U.S. FDI flow by 0.09 percentage
point, which translates into a 30 percent increase in U.S. FDI flow/GDP ratio for that country.
However, this reduction in number of days required to open a business is associated with an
increase in Chinese FDI flow by 0.02 percentage points, which is roughly a 10 percent
increase in Chinese FDI flow/GDP ratio for that country. This suggests that Chinese investors
are significantly less sensitive to changes in ease of doing business than American investors.
To a certain extent, this difference in sensitivity to changes in ease of doing business and tax
rates reflects the underlying differences in American and Chinese FDI decision making. For
instance, whereas American FDI decisions are largely made by privately held multinational
corporations, more than half of Chinese FDI in Africa are controlled by state-owned
enterprises (SOEs) (the Business Insider, 2012). FDI by these SOEs are often a part of
broader governmental policies, which are motivated by a mixture of commercial incentives
and political incentives such as acquiring strategic assets or establishing diplomatic ties. Thus
FDI conducted by Chinese state-owned enterprises are more likely to be less sensitive to

Nabil 21
fluctuations in tax rate and ease of doing business than enterprises with purely commercial
objectives.
Furthermore, IPR is statistically significant for both U.S. and Chinese FDI flows,
suggesting that internalisation advantage is key in considering FDI decisions. However, U.S.
FDI has higher correlation with IPR than Chinese FDI: if trademarks registered per a million
people increases by 500, this is associated with an increase in American FDI flow to GDP
ratio to that country by about 60%, but with an increase Chinese FDI flow to GDP ratio by a
meagre 5%. This should not be surprising, given that U.S. investors tend to have stronger
ownership advantages than Chinese investors, and tend to invest more in technology-heavy
sectors such as geological prospecting, mining and extractive industries, where internalisation
advantages are much more important than in industries such as construction.
Lastly, after controlling for IPR, the size of the economy is strongly inversely
correlated with U.S. FDI/GDP ratio, whereas the correlation is weaker and statistically
insignificant for Chinese FDI/GDP ratio. Real GDP is a strong indicator of locational
advantage of a country. Locational advantages are particularly important to horizontal or
market-seeking firms, which wish to earn profit by serving a local market. It seems that U.S.
FDI in Africa is not driven primarily by locational advantages. Consequently, U.S. FDI tends
to go towards mining and extractive industries, which are industries associated with vertical
FDI more so than horizontal FDI.
8. Limitation
One of the main issues with OLS regression is reverse causality, to which the
regression used in this paper is no exception. For instance, reverse causality is likely to be a
significant problem for the IPR variable. On one hand, countries with strong intellectual
property rights are likely to attract more foreign direct investment; however, on the other

Nabil 22
hand, countries with more foreign direct investment are also more likely to develop stronger
intellectual property rights as a result of the presence of multinational companies and their
internalisation practices. Because of reverse causality, the regression in this paper implies
correlation but not causation.
9. Conclusion
To summarize, it seems that both American and Chinese FDI tend to go towards
countries such as South Africa, Egypt, and Algeria, which are large African economics rich
in natural resources. However, while the U.S. and China both invest heavily in mining and
extractive industries, Chinese investment in Africa is significantly more diversified than its
American counterpart. Indeed, American investment in Africa is associated with higher
percentage of natural resource revenue as a part of total output, indicating the ownership
advantages of American companies. There is therefore little evidence to suggest that China’s
FDI in Africa is dominated by natural resources and ownership advantages; in fact, it is U.S.
investment in Africa that is more strongly associated with the presence of natural resources
and ownership advantages.
Secondly, there are some major differences between the American and Chinese
investment in Africa: American investment hardly goes towards the construction sector,
whereas construction is an important part of China’s involvement in Africa. Chinese
investment is also much less sensitive to variables such as ease of doing business and tax
rates, and internalisation advantages. This diminished sensitivity of Chinese investment, to a
certain extent, is reflective of the mixture of commercial and political incentives of the
Chinese state-owned enterprises.
Given that U.S. investment is more likely to go towards natural resources and mining,
and Chinese investment towards construction and mining, it seems that U.S. and Chinese
Nabil 23
investment are not necessarily in direct competition with one another. The U.S. firms tend to
have stronger ownership and internalisation advantages, and consequently they invest more in
capital-intensive industries such as mining. On the other hand, Chinese firms are more
interested in investing in Africa’s infrastructure and outsourcing China’s labour-intensive
technological and textile manufacturing to lower cost countries such as South Africa.
Because of these factors, the roles that the United States and China play in Africa are
different, and, in some ways, complementary.

Nabil 24
Chart 1: Share of African FDI by Country of Origin (Brookings Institution, 2013).
Chart 1a: Share of FDI stocks
in Africa by country of origin
Chart 1b: Share of FDI flows
in Africa by country of origin

Nabil 25
Appendix A: Data and Sources
Variable Description Source
Fraction of
FDI to GDP
Constructed for country i during year t by dividing the average
2008-2012 FDI inflows (in current US$) by average 2008-2012
nominal GDP (in current US$).
UNCTAD
(2008-2012)
and World
Bank (2008-
2012)
Real GDP Average GDP, PPP (real US$, PPP) between 2008 and 2012 World Bank
Development
Indicator
(2008-2012)
Real GDP
Growth
Annual percentage growth rate of GDP at market prices based
on constant local currency. I use the 2008-2012 average.
World Bank
Development
Indicators
(2008-2012)
Real GDP per
Capita
Average GDP, PPP (real US$, PPP) between 2008 and 2012 World Bank
Development
Indicators
(2008-2012)
Inflation Average of CPI inflation between 2008 and 2012. Inflation is
measured by the Consumer Price Index (CPI), which reflects the
annual percentage change in the average basket of goods and
services that may be fixed or changed at specific intervals, such
as years.
World Bank
Development
Indicators
(2008-2012)
Total
Population
The World Bank uses the de facto definition of citizenship,
which is “the total count of all residents regardless of legal
status or citizenship, except for refugees not permanently settled
in the country of asylum, who are considered part of the
population of the country of their origin.” Total populations are
midyear estimates. Constructed using the average of 2008-2012
populations.
World Bank
Development
Indicators
(2008-2012
Share of
National
Resources in
GDP
Total natural resource rent are the sum of oil rents, natural gas
rents, coal (hard and soft) rents mineral rents, and forest rents
(World Bank, 2011a) . Constructed using the average of 2008-
2012 shares.
World Bank
Development
Indicators
(2008-2012)
Share of
Exports and
Imports in
GDP
Constructed by the World Bank using the World Bank and
OECD national accounts data. I use the 2008-2012 average.
World Bank
Development
Indicators
(2008-2012)
Days
Required to
Open a New
Business
The number of calendar days needed to complete the procedure
to legally operate a business. If a procedure can be speeded up at
an additional cost, the fastest procedure, independent of cost has
been taken (World Bank, 2011b). Once again, I use 2010 data
(since number of days required to open a business tend to stay
the same over the years).
World Bank
Development
Indicators
(2010)
Business Tax
Rate
Business Tax Rate is the percentage of commercial profits that is
paid in taxes. Taxes withheld, for instance personal income tax,
value added tax, or sales taxes are excluded. I use the 2010 data
since tax rates tend to stay constant over time.
World Bank
Development
Indicators
(2010)

Nabil 26
Secondary
School
Enrolment
Rate
Total enrolment in secondary education, expressed as a
percentage of the population of the official secondary age. It can
exceed 100% percent because of early/later school entrance and
grade repetition. I use the 2010 data since this rate does not vary
significantly in our data range.
World Bank
Development
Indicators
(2010)
Chinese
Treaty
Dummy
Dummy variable, where countries are assigned a score of 1 if it
has a bilateral investment treaty (BIT) in force with China. If a
country has a BIT that has been signed, but is not in force, it
receives 0. Similarly, if a country does not have BIT signed with
China, it also gets 0.
African
Growth and
Opportunity
Act Data
Centre (2015)
American
Treaty
Dummy
Dummy variable, where countries are assigned a score of 1 if it
has a bilateral investment treaty (BIT) in force with the United
States. If a country has a BIT that has been signed, but is not in
force, it receives 0. Similarly, if a country does not have BIT
signed with United States, it also gets 0.
Office of the
United States
Trade
Representative
(2015).
Political
Rights Index
CIRI Human Rights Data publishes Physical Integrity Index,
where a country receives a score 0 for terrible human rights
records and 8 for stellar human rights record. This index takes
extrajudicial killings, disappearances, assassinations, freedom of
speech, and freedom of movement into account. Since 2012 data
is not available, I use the 2008-2011 average.
CIRI Human
Rights Index
(2011)
Intellectual
Property
Rights (IPR)
Variable
The World Intellectual Property Indicators list the total number
of trademark applications filed by country of origin. I divide the
2011-12 weighted average share of trademark applications by
the 2011-12 average population to construct the IPR variable.
The World
Intellectual
Property
Indicators
(2012)

Nabil 27
Reference
African Growth and Opportunity Data Center. “Country Trade Profiles.” Accessed online at:
http://agoa.info/profiles.html.
Aykut, Dick. Ratha, Dilip. “South-South FDI Flows: How Big Are They?” United Nations
Conference on Trade and Development (UNCTAD). Transnational Corporations, vol. 13, no.
1. April 2003.
Ayodele, Thompson; Sotola, Olusegun. “China in Africa: an Evaluation of Chinese Involvement in
Africa.” Institute for Public Policy Analysis Working Paper Series. 2014.
Beseda, Hany. Wang, Yang. Whalley, John. “China’s Growing Economic Activity in Africa.”
National Bureau of Economic Research. Working Paper 14024.
Billington, N. “The Location of Foreign Direct Investment: An Empirical Analysis”, Applied
Economics 31. 1999. pp. 65-76.
Blonginen, Bruce A. “Determinants of Foreign Direct Investment.” National Bureau of Economic
Research. Working Paper 16704.
Borenzstein, E. Gregorio, J. De. Lee, J-W. “How Does Foreign Direct Investment Affect Economic
Growth?” Journal of International Economics, vol. 45. 1998. pp. 115-135.
Brooks, D.H.; Hasan, R.; Lee, J.-W.; Son, H.H.; Zhuang, J. “Closing Development Gaps: Challenges
and Policy Options.” ADB Economics Working Paper Series 209. Manila: Asian
Development Bank. 2010.
The Brookings Institution. “The US-Africa Leaders’ Summit: A Focus on Foreign Direct
Investment.” 11 July 2013. Accessed online at: http://www.brookings.edu/blogs/africa-in-
focus/posts/2014/07/11-foreign-direct-investment-us-africa-leaders-summit.
The Business Insider. “Here’s What’s Driving China’s Investments in Africa.” June 27, 2012.
Central Intelligence Agency (CIA). Population Database. Accessed Online.
The China Monitor. “China and the Democratic Republic of Congo: Partners in Development?”
Centre for Chinese Studies. 2008.
Kravis, I, B; Lipsey, R. E. Location of overseas production and production for exports by US
multinational firms, Journal of International Economics, vol. 12. 1982. pp. 201-223.
Cingranelli, David L; David L. Richards; Clay, Chad. “The CIRI Human Rights Dataset.” 2014.
Available online at: www.humanrightsdata.com
Culem, C. “Direct Investment among Industrialized Countries.” European Economic Review, vol. 32.
1988. pp. 885-904.
Dunning, J. H. “Trade, Location of Economic Activity and the MNE: a Search for an Eclectic
Approach.” In B. Ohlin, P. O. Hesselborn, and P. M. Wijkman. “The International Allocation
of Economic Activity.” London: MacMillan. 1977.
Dunning, J. H. “Towards an Eclecting Theory of International Production: Some Empirical Tests.”
Journal of International Business Studies, vol. 11, issue 1. 1980. pp. 9-31.
Dunning, J. H. The Eclectic Theory of International Production: A case study of the international
Hotel Industry. Managerial and Decision Economics. 1981.
Dunning, J. H. “Multinational Enterprises and the Global Economy.” Wokingham, UK and Reading,
Massachusetts: Addison Wesley. 1993.

Nabil 28
Dunning, J. H. “The Eclectic Paradigm as an Envelope for Economic and Business Theories of MNE
Activity.” International Business Review, vol. 9. 2000. pp. 163-190.
The Economist. The Chinese in Africa: Trying to Pull Together. April 11, 2011. Accessed online at:
http://www.economist.com/node/18586448.
The Economist. Africa Rising: a Hopeful Continent. March 2, 2013. Accessed online at:
http://www.economist.com/news/special-report/21572377-african-lives-have-already-greatly-
improved-over-past-decade-says-oliver-august.
The Economic Times. “Foreign Direct Investment from Mauritius to India Drying Up.” April 13,
2014.
Hymer, Stephen. “The International Operations of National Firms: a Study of Direct Foreign
Investment.” The MIT Press. 1958.
Kravis, I.B. and R.E. Lipsey. “The Location of Overseas Production and Production for Export by
U.S. Multinational Firms.” Journal of International Economics, vol. 12. 1982. pp. 201-223.
Llaudes, Ricardo. Salman, Ferhan. Chivakul, Mali. “The Impact of Great Recession on Emerging
Markets.” IMF Working Paper WP/10/237. October 2010.
Mundell, R. A. “International Trade and Factor Mobility.” American Economic Review, vol. 47.
1957.
Neary, Peter. “World Economy FDI: the OLI Framework.” The University of Oxford and CEPR.
Accessed online at http://users.ox.ac.uk/~econ0211/papers/pdf/fdiprinceton.pdf. Date
accessed: May 8, 2015.
Lunn, J. “Determinants of US Direct Investment in the EEC.” European Economic Review, vol. 13.
pp. 93-101. 1980.
Shatz, H. and A.J. Venables. “The Geography of International Investment”, World Bank Policy
Research Working Paper No. 2338. 2000.
Markusen, J. R. “Multinationals, Multi-Plant Economies, and the Gains from Trade”, Journal of
International Economics, vol. 16 (3-4). 1984. pp. 205-226.
OECD Factbook 2013: Economic, Environmental, and Social Statistics. “Foreign Direct Investment.”
Accessed online at: http://www.oecd-ilibrary.org/sites/factbook-2013-
en/04/02/01/index.html?itemId=/content/chapter/factbook-2013-34-en.
Office of the United States Trade Representative: Executive Office of the President. “Africa.”
Accessed online at: https://ustr.gov/countries-regions/africa.
Okeowo, Alexis. “China in Africa: the New Imperialists?” The New Yorker. June 12, 2013.
Renard, Mary-Francoise. China’s Trade and FDI in Africa. African Development Bank Group
Working Paper.
Wacker, Konstantin. “On the Measurement of Foreign Direct Investment and its Relationship to
Multinational Corporations.” Working Paper Series 1614. European Central Bank. November
2013.
Wade, Geoff. “The Zheng-He Voyages: A Reassessment.” Asia Research Institute, Working Paper
No. 31. National University of Singapore. October 2004.
Walsh, James P. Yu, Jiangan. “Determinants of Foreign Direct Investment: a Sectoral and
Institutional Approach.” IMF Working Paper WP/10/187. July 2010. Accessed online at:
https://www.imf.org/external/pubs/ft/wp/2010/wp10187.pdf.

Nabil 29
Wheeler, D. Mody, A. International investment location decisions: The case of U.S. firms, Journal of
International Economics, vol. 33. 1992. pp. 57-76.
The World Bank. “Development Indicators.” Accessed online at:
http://data.worldbank.org/indicator/SE.SEC.ENRR/countries
The World Intellectual Property Indicators. “Data on Trademarks.” 2012. Available online at:
http://www.wipo.int/edocs/pubdocs/en/intproperty/941/wipo_pub_941_2012.pdf.
The World Trade Organization. India-Africa: South-South. Trade and Investment for Development.
2013.
The United Nations Committee on Trade and Development (UNCTAD). India and China Foreign
Direct Investment Database (2014). Accessed online at:
http://unctad.org/Sections/dite_fdistat/docs/webdiaeia2014d3_CHN.pdf
The United Nations Committee on Trade and Development (UNCTAD) International Trade Statistics
Database (2014). Accessed online at: http://comtrade.un.org/pb/
The United States Africa Command. “Fact Sheet: U.S.-Africa Relations Chronology.” September 26,
2008. Accessed online at:
http://www.africom.mil/newsroom/article/6108/factsheetusafricarelationschronology
Zheng, Liang. “Neo-colonialism, Ideology or Just Business: China’s Perception of Africa” Global
Media and Communication, Vol.6: 3. 2010. pp. 271.