web-based performance benchmarking data collection and
TRANSCRIPT

Web-based Performance Benchmarking Data Collection and Preliminary Analysis
for Drinking Water and Wastewater Utility
Ankur Rathor
Thesis submitted to the faculty of the Virginia Polytechnic Institute and State University
in partial fulfillment of the requirements for the degree of
Master of Science
In
Civil Engineering
Sunil K. Sinha
Marc E. Edwards
Konstantinos P. Triantis
16 November 2012
Blacksburg, VA
Keywords: asset management, database benchmarking, performance evaluation, utility
management, performance indicators.
© Copyright 2012

Web-based Performance Benchmarking Data Collection and Preliminary Analysis
for Drinking Water and Wastewater Utility
Ankur Rathor
ABSTRACT
High-quality drinking water and wastewater systems are essential to public health,
business, and quality of life in the United States. Even though the current performance of
these systems is moderate, the concern is about the future performance. Planning can be
done for improvement once the current performance of utilities is evaluated, and areas
with a scope of improvement are identified. Benchmarking and performance evaluation
are key components in the process of continuous improvement for utility’s performance.
Benchmarking helps utilities make policies and programmatic decisions that reduce
operational expenses and increase productivity by understanding areas of
underperformance, understanding customer needs, developing future plans, and setting
goals. This study establishes a strong case for implementing benchmarking
methodologies among utilities to evaluate and improve performance.
There are many initiatives on performance benchmarking of utilities but a few of them
focuses on one or few area of performance. There are a few initiatives which use
subjective indicators. Additionally, consultants visit the utilities for performance
evaluation. This research focuses on creating a web-based benchmarking platform for
performance evaluation using holistic and quantitative indicators. Practical and robust
methodologies are used and the research presents the current performance comparisons
among utilities for areas that impact overall utility’s performance. Web based
benchmarking consists of two major parts – data collection and result visualization. A
major contribution from this study is the creation of an online performance benchmarking
database. With time more data will be collected which will provide utilities an access to a
better database for performance evaluation. The future work in this research will be
analyzing the data and results for each participant for each set of indicators, and finding
possible reasons for underperformance, followed by suggesting solutions for
improvement using the best practices.

iii
DEDICATION
This thesis is dedicated to my parents, Naresh Rathor and Kalpana Rathor for their
support and encouragement throughout my life.

iv
ACKNOWLEDGEMENTS
The development of WATERiD (WATER Infrastructure Database) is funded by the
Water Environment Research Foundation (WERF) under the contract INFR9SG09 and
INFR10SG09 through the U.S. Environmental Protection Agency’s Aging Water
Infrastructure Research Program, and stems from EPA’s Sustainable Water Infrastructure
Initiative. The authors would like to thank the National Science Foundation (NSF) for
the partial funding under the grant NSF-CMMI-0801018. We would also like to thank the
support of the Sustainable Water Infrastructure Management (SWIM) Center of
Excellence in the Institute of Critical Technology and Applied Science (ICTAS) at
Virginia Tech. Our special thanks to the representatives of various Drinking Water and
Wastewater Utilities, WATERiD Database User Group (DUG), US EPA Innovative
Infrastructure Review Committee (IIRC), and WERF Project Sub-Committee (PSC) for a
very thorough review that provided valuable feedback and comments related to
WATERiD project.

v
TABLE OF CONTENTS
Abstract .......................................................................................................................ii
Dedication ................................................................................................................. iii
Acknowledgements .................................................................................................... iv
Table of contents ......................................................................................................... v
List of figures ...........................................................................................................viii
List of tables ............................................................................................................. xiv
List of abbreviations .................................................................................................. xv
CHAPTER 1. Introduction ........................................................................................ 1
1.1 Goals and objectives .......................................................................................... 1
1.2 What is benchmarking? ..................................................................................... 2
1.3 Why benchmark? .............................................................................................. 2
1.4 Benefits of benchmarking .................................................................................. 3
1.5 Limitations of benchmarking ............................................................................. 3
1.6 Process and methodologies for benchmarking ................................................... 4
1.6.1 One to One Benchmarking ......................................................................... 4
1.6.2 Review Benchmarking ............................................................................... 4
1.6.3 Database Benchmarking for overall performance indicators ....................... 4
1.6.4 Customer Survey Benchmarking ................................................................ 5
1.6.5 Excellence Model ....................................................................................... 5
CHAPTER 2. Literature Review ................................................................................ 6
2.1 Literature reviewed – journal and conference papers ......................................... 7
2.1.1 Use of performance benchmarking in drinking water industry .................... 8
2.1.2 Use of performance benchmarking in wastewater industry ......................... 9

vi
2.1.3 Use of performance benchmarking in other industries ................................ 9
2.2 Literature reviewed - reports.............................................................................. 9
2.3 Literature reviewed - books ............................................................................. 10
2.4 Current performance benchmarking practices in drinking water and wastewater
industry ..................................................................................................................... 11
2.5 Conclusion ...................................................................................................... 13
CHAPTER 3. Performance Benchmarking Methodology......................................... 14
3.1 Methodology ................................................................................................... 14
3.2 Indicators ........................................................................................................ 15
3.3 Geographical distribution of participating utilities ........................................... 17
CHAPTER 4. Performance Benchmarking Results, Analysis and Limitations –
Drinking Water Utilities ................................................................................................ 19
4.1 Water resource utilization ................................................................................ 19
4.2 Employee information ..................................................................................... 21
4.3 Physical assets ................................................................................................. 26
4.4 Service quality ................................................................................................ 29
4.5 Operational performance ................................................................................. 36
4.6 Customer enquiries .......................................................................................... 44
4.7 Financial performance ..................................................................................... 47
CHAPTER 5. Performance Benchmarking Results, Analysis and Limitations –
Wastewater Utilities ...................................................................................................... 56
5.1 Wastewater and biosolids ................................................................................ 56
5.2 Employee information ..................................................................................... 59
5.3 Treatment process ........................................................................................... 65
5.4 Treatment performance ................................................................................... 66
5.5 Operational performance ................................................................................. 76
vii
5.6 Customer enquiries .......................................................................................... 80
5.7 Financial performance ..................................................................................... 83
CHAPTER 6. Web-based Performance Benchmarking for Drinking Water and
Wastewater 90
6.1 Web interface .................................................................................................. 91
6.2 Datasheets ....................................................................................................... 91
6.3 Links to resources ........................................................................................... 92
6.3.1 Synthesis Reports ..................................................................................... 92
6.3.2 Participating Utility Information............................................................... 92
6.3.3 Other benchmarking initiatives ................................................................. 92
CHAPTER 7. Summary........................................................................................... 93
7.1 Conclusion ...................................................................................................... 93
7.2 Recommendations and future work ................................................................. 93
References ..................................................................................................................... 95
Appendix A: Data Mining Sheet – General Information of Utilities ............................... 98
Appendix B: Data Mining Sheet – Drinking Water ........................................................ 99
Appendix C: Data Mining Sheet – Wastewater ............................................................ 112

viii
LIST OF FIGURES
Figure 1. Basic steps for performance benchmarking ....................................................... 4
Figure 2. Source of information ....................................................................................... 7
Figure 3. Performance indicators categories for benchmarking ...................................... 16
Figure 4. Inefficiency of use of water resource .............................................................. 20
Figure 5. Reused or recycled supplied water .................................................................. 20
Figure 6. Water resource availability ............................................................................. 21
Figure 7. Employee per 1000 connections ..................................................................... 24
Figure 8. Employee per mgal of water produced per day ............................................... 24
Figure 9. Higher management employee ........................................................................ 24
Figure 10. Human resource employee ............................................................................ 24
Figure 11. Financial and commercial employee ............................................................. 25
Figure 12. Customer service employee .......................................................................... 25
Figure 13. Planning, design and construction employee ................................................. 25
Figure 14. Operations and maintenance employee ......................................................... 25
Figure 15. Water quality monitoring employee .............................................................. 25
Figure 16. Personnel training ......................................................................................... 25
Figure 17. Working accidents - % of employees injured in last 1 year ........................... 26
Figure 18. Absences due to accidents ............................................................................ 26
Figure 19. Treatment plant utilization ............................................................................ 28
Figure 20. Water produced vs. treated water storage capacity ........................................ 28
Figure 21. Total main length .......................................................................................... 28
Figure 22. Transmission main length ............................................................................. 28
Figure 23. Distribution main length ............................................................................... 29
Figure 24. Valve density ................................................................................................ 29
Figure 25. Hydrant density ............................................................................................ 29
Figure 26. Meter density ................................................................................................ 29
Figure 27. Population coverage ..................................................................................... 34
Figure 28. Main breaks .................................................................................................. 34
Figure 29. % connections with interruptions of less than 4 hours in last 1 year .............. 34
Figure 30. % connections with interruptions between 4-12 hours in last 1 year .............. 34
ix
Figure 31. % connections with interruptions of greater than 12 hours in last 1 year........ 34
Figure 32. Total number of connections experiencing disruption in last 1 year .............. 34
Figure 33. Total % of tests compliant with standard for treated water ............................ 35
Figure 34. Total % of required tests done ...................................................................... 35
Figure 35. Total % of aesthetic tests compliant with standard for treated water .............. 35
Figure 36. Total % of required aesthetic tests done ........................................................ 35
Figure 37. Total % of microbiological tests compliant with standard for treated water ... 35
Figure 38. Total % of required microbiological tests done ............................................. 35
Figure 39. Total % of physical-chemical tests compliant with standard for treated water36
Figure 40. Total % of required physical-chemical tests done.......................................... 36
Figure 41. Total % of radioactive tests compliant with standard for treated water .......... 36
Figure 42. Total % of required radioactive tests done .................................................... 36
Figure 43. Pump inspection ........................................................................................... 41
Figure 44. Storage tank cleaning - number ..................................................................... 41
Figure 45. Storage tank cleaning - volume ..................................................................... 41
Figure 46. Main inspection ............................................................................................ 41
Figure 47. Valve inspection ........................................................................................... 42
Figure 48. Hydrant inspection........................................................................................ 42
Figure 49. Leakage control ............................................................................................ 42
Figure 50. Transmission main replaced / rehabilitated - in last 1 year ............................ 42
Figure 51. Distribution main replaced / rehabilitated - in last 1 year............................... 42
Figure 52. Valves replacement - in last 1 year................................................................ 42
Figure 53. Service connection rehabilitation - in last 1 year ........................................... 43
Figure 54. Pump refurbishment - in last 1 year .............................................................. 43
Figure 55. Pump replacement - in last 1 year ................................................................. 43
Figure 56. Annual water loss per connection ................................................................. 43
Figure 57. % water loss ................................................................................................. 43
Figure 58. Working operational meters .......................................................................... 43
Figure 59. Unmetered water - volume which is charged but not metered ....................... 44
Figure 60. Service enquiries per 100 connection ............................................................ 46
Figure 61. Pressure related reports ................................................................................. 46

x
Figure 62. Water quality - odor related reports............................................................... 46
Figure 63. Interruption related reports ........................................................................... 46
Figure 64. Continuity related reports ............................................................................. 46
Figure 65. Water quality - taste related reports............................................................... 46
Figure 66. Revenue per Mgal treated water produced - in last 1 year ............................. 52
Figure 67. Sales revenue in last 1 year ........................................................................... 52
Figure 68. Other revenue in last 1 year .......................................................................... 52
Figure 69. Total cost per Mgal treated water produced - in last 1 year............................ 52
Figure 70. Capital cost per Mgal treated water produced - in last 1 year......................... 52
Figure 71. Operating cost per Mgal treated water produced - in last 1 year .................... 52
Figure 72. % of transmission, storage and distribution cost - in last 1 year ..................... 53
Figure 73. % of water treatment and water testing cost - in last 1 year ........................... 53
Figure 74. % of energy / electricity used cost - in last 1 year ......................................... 53
Figure 75. % of meter management and connection related cost - in last 1 year ............. 53
Figure 76. Any other operational cost - in last 1 year ..................................................... 53
Figure 77. Total investment per Mgal of water produced - in last 1 year ....................... 53
Figure 78. % on new assets - in last 1 year ..................................................................... 54
Figure 79. % on replacement and renovation - in last 1 year .......................................... 54
Figure 80. Average water charges from direct consumption ........................................... 54
Figure 81. Water rate which utility charges the consumer .............................................. 54
Figure 82. Total cost coverage ....................................................................................... 54
Figure 83. Operational cost coverage ............................................................................. 54
Figure 84. Current ratio (liquidity measure) ................................................................... 55
Figure 85. Asset turnover ratio ...................................................................................... 55
Figure 86. Water loss cost - non revenue water cost ....................................................... 55
Figure 87. Earnings per million gallons of treated water produced ................................. 55
Figure 88. Compliance with discharge consents - last 1 year ......................................... 58
Figure 89. Reuse............................................................................................................ 58
Figure 90. Biosolids production ..................................................................................... 58
Figure 91. Biosolids use ................................................................................................ 58
Figure 92. Biosolids disposal ......................................................................................... 59
xi
Figure 93. Employee per 1000 population equivalent served ......................................... 62
Figure 94. Employee per million gallons of wastewater treated daily ............................. 62
Figure 95. Higher management employees .................................................................... 63
Figure 96. Human resources employees ......................................................................... 63
Figure 97. Financial and commercial employees ............................................................ 63
Figure 98. Customer service employees ......................................................................... 63
Figure 99. Planning, designing and construction employees .......................................... 63
Figure 100. Operations and maintenance employees ...................................................... 63
Figure 101. Wastewater quality monitoring employees (lab personnel) .......................... 64
Figure 102. Personnel training ....................................................................................... 64
Figure 103. Working accidents - % of employees injured in last 1 year.......................... 64
Figure 104. Absences due to accidents........................................................................... 64
Figure 105. Vaccination ................................................................................................ 64
Figure 106. Treatment plant utilization - primary treatment ........................................... 66
Figure 107. Treatment plant utilization - secondary treatment ........................................ 66
Figure 108. Treatment plant utilization - tertiary treatment ............................................ 66
Figure 109. Energy consumption ................................................................................... 66
Figure 110. Population coverage ................................................................................... 71
Figure 111. Total treatment level ................................................................................... 71
Figure 112. Primary treatment level ............................................................................... 72
Figure 113. Secondary treatment level .......................................................................... 72
Figure 114. Tertiary treatment level ............................................................................... 72
Figure 115. Total tests - total % of tests compliant with permit conditions ..................... 72
Figure 116. Total tests - total % of required test done .................................................... 72
Figure 117. BOD tests - total % of tests compliant with permit conditions ..................... 73
Figure 118. BOD tests - total % of required test done .................................................... 73
Figure 119. COD tests - total % of tests compliant with permit conditions ..................... 73
Figure 120. COD tests - total % of required test done .................................................... 73
Figure 121. TSS tests - total % of tests compliant with permit conditions ...................... 73
Figure 122. TSS tests - total % of required test done ...................................................... 73
Figure 123. Phosphorus tests - total % of tests compliant with permit conditions ........... 74

xii
Figure 124. Phosphorus tests - total % of required test done .......................................... 74
Figure 125. Fecal E.coli tests - total % of tests compliant with permit conditions........... 74
Figure 126. Fecal E.coli tests - total % of required test done .......................................... 74
Figure 127. Nitrogen tests - total % of tests compliant with permit conditions ............... 74
Figure 128. Nitrogen tests - total % of required test done ............................................... 74
Figure 129. Other tests - total % of tests compliant with permit conditions .................... 75
Figure 130. Other tests - total % of required test done ................................................... 75
Figure 131. Biosolids tests - total % of tests compliant with permit conditions .............. 75
Figure 132. Biosolids tests - total % of required test done .............................................. 75
Figure 133. Industrial discharge tests - total % of tests compliant with permit conditions
...................................................................................................................................... 75
Figure 134. Industrial discharge tests - total % of required test done .............................. 75
Figure 135. Sewer inspection ......................................................................................... 79
Figure 136. Sewer cleaning ........................................................................................... 79
Figure 137. Manhole chamber inspection ...................................................................... 79
Figure 138. Pump inspection ......................................................................................... 79
Figure 139. System flow meters .................................................................................... 79
Figure 140. Wastewater quality monitoring instrument .................................................. 79
Figure 141. Sewer replaced/rehabilitated - in last 1 year ................................................ 80
Figure 142. Manhole chamber replaced/rehabilitated - in last 1 year .............................. 80
Figure 143. Manhole covers replaced - in last 1 year ..................................................... 80
Figure 144. Sewer blockage - in last 1 year .................................................................... 80
Figure 145. Sewer breaks - in last 1 year ....................................................................... 80
Figure 146. Total service enquiries per 1000 population equivalent served .................... 82
Figure 147. Reports related to odor ................................................................................ 82
Figure 148. Reports related to flooding .......................................................................... 82
Figure 149. Reports related to rodent ............................................................................. 82
Figure 150. Reports related to pollution ......................................................................... 82
Figure 151. Reports related to Blockage ........................................................................ 82
Figure 152. Revenue per population equivalent (PE) served - in last 1 year ................... 86
Figure 153. Service revenue in last 1 year ...................................................................... 86

xiii
Figure 154. Other revenue in last 1 year ........................................................................ 87
Figure 155. Total cost per population equivalent (PE) served - in last 1 year ................. 87
Figure 156. Capital cost per PE served - in last 1 year ................................................... 87
Figure 157. Operating cost per PE served - in last 1 year ............................................... 87
Figure 158. % of sewer system cost - in last 1 year ........................................................ 87
Figure 159. % of treatment cost - in last 1 year .............................................................. 87
Figure 160. % of energy / electricity used cost - in last 1 year ....................................... 88
Figure 161. % of testing related cost - in last 1 year ....................................................... 88
Figure 162. Any other operational cost - in last 1 year ................................................... 88
Figure 163. Total expenses - in last 1 year ..................................................................... 88
Figure 164. % on new assets - in last 1 year ................................................................... 88
Figure. 165 % on replacement and renovation - in last 1 year ........................................ 88
Figure 166. Sewer collection rate which utility charges the consumer ............................ 89
Figure 167. Total cost coverage ..................................................................................... 89
Figure 168. Operational cost coverage ........................................................................... 89
Figure 169. Liquidity ratio ............................................................................................. 89
Figure 170. Asset turnover ratio .................................................................................... 89
Figure 171. Earnings per million gallons of wastewater treated ..................................... 89
Figure 172. WATERiD categories ................................................................................. 90
Figure 173. Sample indicator for data collection ............................................................ 92
xiv
LIST OF TABLES
Table 1. ASCE grades for drinking water and wastewater assets in the U.S. .................... 1
Table 2. Details of documents reviewed .......................................................................... 6
Table 3. Journal and conference papers reviewed ............................................................ 7
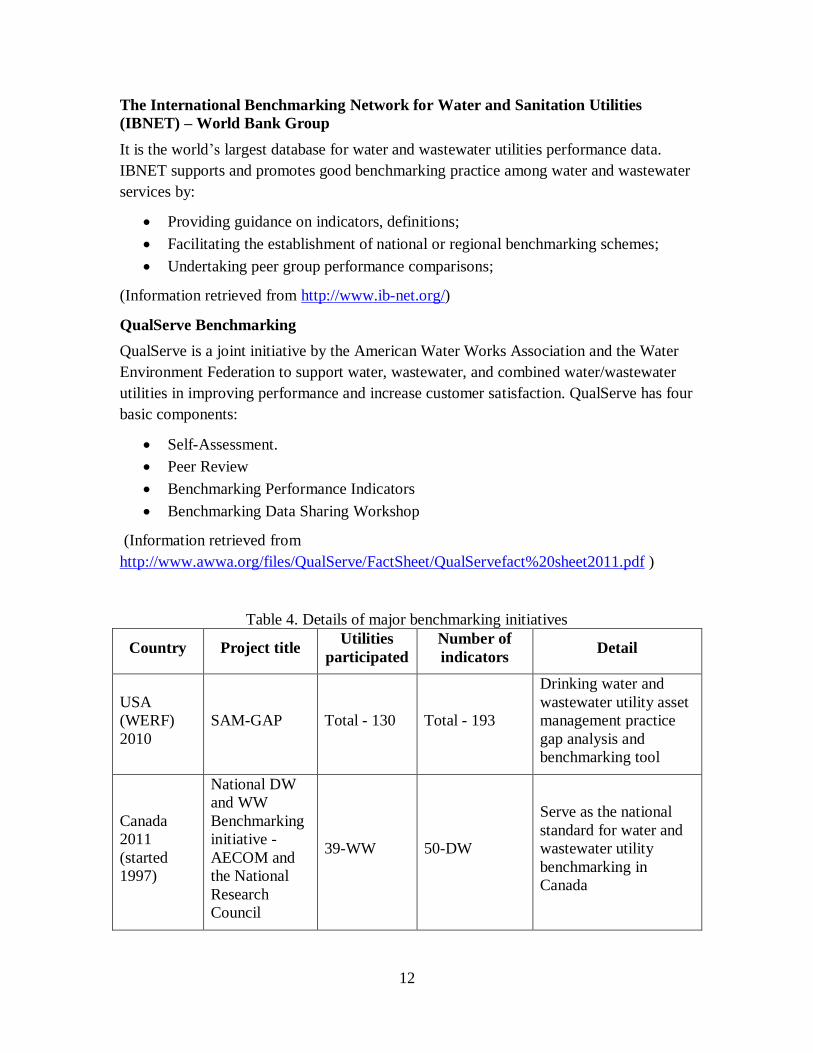
Table 4. Details of major benchmarking initiatives ........................................................ 12
Table 5. Number of indicators for different category used for drinking water utility data
collection and benchmarking ......................................................................................... 16
Table 6. Number of indicators for different category used for wastewater utility data
collection and benchmarking ......................................................................................... 16
Table 7. Description of EPA defined regions ................................................................. 18
Table 8. List of participating drinking water and wastewater utilities by EPA regions.... 18
Table 9. List of indicators, definition and results for water resource utilization .............. 20
Table 10. List of indicators, definition and results for employee information ................. 22
Table 11. List of indicators, definition and results for physical assets ............................ 27
Table 12. List of indicators, definition and results for service quality ............................. 30
Table 13. List of indicators, definition and results for operational performance ............. 38
Table 14. List of indicators, definition and results for customer enquiries ...................... 45
Table 15. List of indicators, definition and results for financial performance ................. 48
Table 16. List of indicators, definition and results for wastewater and Biosolids ............ 57
Table 17. List of indicators, definition and results for employee information ................. 60
Table 18. List of indicators, definition and results for treatment process ........................ 65
Table 19. List of indicators, definition and results for treatment performance ................ 67
Table 20. List of indicators, definition and results for operational performance ............. 77
Table 21. List of indicators, definition and results for customer enquiries ...................... 81
Table 22. List of indicators, definition and results for financial performance ................. 84

xv
LIST OF ABBREVIATIONS
ASCE American Society of Civil Engineers
AWWA American Water Works Association
AwwaRF American Water Works Association Research Foundation
BM&M Benchmarking and Metrics
BOD Biochemical oxygen demand
CII Construction Industry Institute
DEA Data Envelopment Analysis
DUG Database User Group
DW Drinking Water
EBC European Benchmarking Co-operation
EPA Environmental Protection Agency
IBNET International Benchmarking Network for Water and Sanitation
Utilities
ICTAS Institute of Critical Technology and Applied Science
IIRC Innovative Infrastructure Review Committee
IWA International Water Association
NSF National Science Foundation
NWI National Water Initiative
PE Population equivalent

xvi
PILOT Payment in lieu of taxes
PIs Performance indicators
PSC Project Sub-Committee
SAMGAP Strategic asset management gap analysis tool
SW Storm Water
SWIM Sustainable Water Infrastructure Management
U.K. United Kingdom
U.S. United States
WATERiD Water Infrastructure Database
WERF Water Environment Research Foundation
WW Wastewater

1
CHAPTER 1. INTRODUCTION
Asset management is a set of strategies for sustaining public infrastructure. An asset is a
component of a facility with an independent physical and functional identity. The
existing drinking water and wastewater assets in the U.S. have deteriorated to a poor state
because of deferred maintenance and rehabilitation, driven primarily by financial
considerations (Cagle, 2003). Further, the ASCE (American Society of Civil Engineers)
grades (Table 1) reinforce the fact that these assets need improvement.
Table 1. ASCE grades for drinking water and wastewater assets in the U.S.
Year Drinking Water
Infrastructure Trend
Wastewater
Infrastructure Trend
1988 B- C
1998 D ↓ D+ ↓
2001 D ↔ D ↓
2005 D- ↓ D- ↓
2009 D- ↔ D- ↔
Much of our drinking water infrastructure, more than one million mile of pipes beneath
our streets, is approaching the age at which it needs to be replaced. Restoring these water
systems as they reach the end of their useful lives, and expanding them to serve a
growing population will cost at least $1 trillion over the next 25 years (AWWA, 2012).
Regarding wastewater assets, the physical condition of many of the nation's 16,000
wastewater treatment systems is poor, due to a lack of investment in plants, equipment,
and other capital improvements. In 2008, the U.S. Environmental Protection Agency
(EPA) reported that the total investment needs of America's publicly owned treatment
works as of January 1, 2004, were $202.5 billion.
Evaluation and improvement in the condition of these assets can be done using
performance benchmarking. It provides regulators and utility managers with a way to
make performance comparisons over time, across water utilities, and across countries
(Berg, 2007). Benchmarking is important for documenting past performance, establishing
baselines for gauging improvements, and making comparisons across service providers
(Berg, 2007). Along with providing the comparison to understand past and current
performance levels, a benchmarking exercise also provides identification of opportunities
for improvement.
1.1 GOALS AND OBJECTIVES
The goals of this research are to evaluate the performance of utilities using benchmarking
and use the results to improve the management of the utility. The objectives to achieve
these goals are:
Identify a comprehensive set of indicators for performance benchmarking

2
Evaluate utility performance using quantitative indicators
Implement robust methodology for data collection and analysis
Develop a web-interface for continuous data collection and results visualization
Create a database to compare past and current performance
1.2 WHAT IS BENCHMARKING?
Benchmarking involves identifying the best practices in a particular discipline, activity or
process, and then being able to apply that experience and knowledge in a meaningful
context to improving your own operations. Camp (1995) considered benchmarking as
finding and implementing best practices that lead to superior performances of an
organization. Barber (2004) defined benchmarking as a process of investigation and
learning from the best in a class to get useful information for improving and changing an
organization. Watson (1993) stated that benchmarking is a systematic and continuous
measurement process to continuously measure and compare an organization’s business
process against its competitors and similar leading entities across the world, to gain
information which will help the organization to take action to improve its performance.
The basic steps to successful benchmarking are:
Know your operations — identify and document your business system and
respective core business processes
Know industry leaders and/or competitors
Learn from best practices and incorporate these into your operations in a relevant
way
Continue to improve over time to gain superiority.
Benchmarking is a systematic measurement of organizational performance over time and
against other equivalent organizations or industry norms. Benchmarking comes in two
types:
Output: The measuring stick is what the organization delivers – amount of water or
wastewater treated per year, etc. It often is efficiency oriented, measuring the cost per
unit of output.
Best Practice: An ongoing systematic process to search for and introduce international
best practice into an organization, in such a way that all parts of the organization
understand and achieve their full potential. The search may be for products, services,
business practices and processes of competitors or those organizations recognized as
leaders, in the industry or in the specific processes chosen.
1.3 WHY BENCHMARK?
Benchmarking is essential to understand the areas that contribute to a good overall
performance of a utility. It helps a utility to identify areas of strengths and weaknesses.
Along with providing the comparison to understand past and current performance levels,

3
a benchmarking exercise also provides identification of opportunities for improvement. It
also provides the value in terms of both cost and service to be gained from the
improvement, identification of any factors that could delay potential improvement
opportunities, prioritization of improvement opportunities, and realistic timelines and
costs involved in achieving any potential improvement.
1.4 BENEFITS OF BENCHMARKING
Benchmarking is a fundamental requirement of good management and can help managers
and regulators to identify historical trends, determine today’s baseline performance, and
quantify relative performance across utilities (Berg, 2007).The major benefits of
benchmarking are listed below:
1. Reduces the operational cost
2. Increases the productivity by identifying areas for improvement
3. Helps to understand customer needs
4. Develops a future plan and sets goals
5. Allows employees to visualize the improvement which can be a strong motivator
for change
6. Creates a sense of urgency for improvement
1.5 LIMITATIONS OF BENCHMARKING
Benchmarking certainly has its virtues. Benchmarking is not informative when it is used
to compare fundamentally different processes. The major limitations of benchmarking are
listed below:
1. Benchmarking is time consuming and expensive.
2. Participation in a benchmarking study may require additional staff for the utilities.
3. Benchmarking is important but should ideally be done on a continuous basis to
keep track of change in performance.
4. Utilities should be comparable in size, model, culture, and strategy.
5. Benchmarking reveals the standards attained by competitors but does not consider
the circumstances under which the competitors attained such standards.
6. Benchmarking may lead to complacency and arrogance. Utilities may tend to
relax after excelling beyond competitors' standards, which may lead to
complacency and overconfidence.
7. Many organizations make the mistake of undertaking benchmarking as a stand-
alone activity. Benchmarking is only a means to an end, and it is worthless if not
accompanied by a plan to change.
8. Lack of cooperation by the utility personnel may occur due to the confidentiality
of data.
9. Reliability of data may be an issue while performing benchmarking.

4
1.6 PROCESS AND METHODOLOGIES FOR BENCHMARKING
The process of performance benchmarking is cyclic and continuous. The benchmarking
process is divided into seven basic steps as described in Figure 1.
Figure 1. Basic steps for performance benchmarking
It is unlikely for two different industries to use the same methodology to benchmark
performance, and there is no single right methodology. Therefore, methodology should
be tailored expressly for drinking water and wastewater utilities. There are many
methodologies defined by researchers for drinking water and wastewater industry, and a
short description follows.
1.6.1 One to One Benchmarking
This is the most basic type of benchmarking in which one utility learns from other utility
by visiting them. This helps a utility to learn how other utilities function. Normally for
this type of benchmarking, the utility chooses to visit one of the best performing utilities.
1.6.2 Review Benchmarking
This type of benchmarking is performed with the help of experts and consultants. The
experts visit each utility to review the performance. In this type of benchmarking experts
identify areas of improvement and suggest solutions for improvement.
1.6.3 Database Benchmarking for overall performance indicators
This type of benchmarking uses an existing database with a number of specific core
indices, such as volume of water treated, length of main, number of tests for treated
water, population served, number of customer enquiries, financial performance and many
more. The already defined specific core indices are used to collect the data from the
utilities and values are compared with the existing database. This also helps to grow the
existing database.
Target future
performance Adjust goal
Determine gap
Varify data, analysis
and generate
results
Define data source and
data collection
Define indicators
Select subject and
defining content

5
1.6.4 Customer Survey Benchmarking
This type of benchmarking focuses on the customer satisfaction on service quality which
is important in evaluating utility performance. The trends over time also help to evaluate
the variation of customer satisfaction level.
1.6.5 Excellence Model
The excellence model is a set metrics designed to capture all key aspects of a successful
utility. This requires development of an optimized model based on creating an idealized
benchmark specific to each utility incorporating all the factors which affect the overall
performance (Berg, 2007). As with any methodology, this approach also has its
limitations and the models can be very complicated.

6
CHAPTER 2. LITERATURE REVIEW
Literature on drinking water, wastewater and other industries was reviewed related to the
benchmarking process, methodology and indicators. A web search was done, which
provided publicly available articles and major reports, such as those published by the
EPA. In addition to a web search, database search engines available through the Virginia
Tech library were used to access literature. The most prevalently used database search
engines were the Science Direct and Compendex. The source of information is
summarized in the Figure 2 and Table 2. The information was gathered from the
following sources:
1. Major global reports on benchmarking of drinking water, wastewater and other
industries.
2. Journal and conference papers on performance benchmarking process,
methodologies and indicators.
3. Books on methodologies, indicators and practice for drinking water and
wastewater performance benchmarking.
4. Information gathered from drinking water and wastewater utilities on their
benchmarking practices using data mining sheets and interviews.
Table 2. Details of documents reviewed
Sr. No Source Number of documents reviewed
1 Major Reports 13
2 Journal and Conference Papers 66
3 Books 6
4 Benchmarking data sheets from utilities 19

7
Figure 2. Source of information
2.1 LITERATURE REVIEWED – JOURNAL AND CONFERENCE PAPERS
Papers related to benchmarking process, methodology, and indicators used in drinking
water, wastewater, and other industries were reviewed. The number and type of papers
reviewed is summarized in Table 3.
Table 3. Journal and conference papers reviewed
Industry type
Number of
papers
reviewed
Industry type Number of
papers
reviewed
General benchmarking 21 Automotive 1
Drinking water industry 13 Flood model 1
Wastewater industry 8 Pipeline 1
Construction 6 Project management 1
Data Envelopment Analysis 5 Railways 1
Airport 3 Telecom 1
Energy 3 Transportation 1
Total papers reviewed - 66

8
2.1.1 Use of performance benchmarking in drinking water industry
Benchmarking is important for documenting past performance, establishing baselines for
gauging productivity improvements and making comparisons across service providers
(Berg et al, 2007). One example of using benchmarking is in the study on “Methods and
trends of performance benchmarking in UK utility regulation” (Dassler et al, 2006) which
establishes a case that the regulations are subject to available information and lack of
information may lead to inefficient allocation. One widely accepted solution is
benchmarking (also called ‘yardstick competition’), which is suggested in the article “A
theory of yardstick competition” (Shleifer, 1985). This study considers Shleifer’s
approach and compares the approach with the actual use in United Kingdom regulatory
bodies in telecommunications, water and energy. Another regional benchmarking
initiative is discussed in the article “Benchmarking Central American water utilities”
(Corton et al, 2009) which provides a comprehensive efficiency analysis of water utilities
in six countries in Central America. Similarly, another regional study on benchmarking
has been discussed in the paper “The long-term reform of the water and wastewater
industry: The case of Melbourne in Australia” (Abbott et al., 2011). This study analyzes
the economic performance of the Melbourne water and wastewater industry from the
early 1970s.
The literature shows vast differences in the performance between leading companies and
average companies in performing particular activities. By benchmarking leading
companies, many firms have experienced significant success in upgrading their
organizational capabilities (Barber, 2004). Performance benchmarking helps to pinpoint
the specific areas which can be improved.
Performance benchmarking can be used to solve various internal and external issues
related to the utilities. For example, conflicts in the design and implementation of policies
such as cognitive conflicts, interest conflicts, values conflicts, and authority conflicts can
be resolved using benchmarking water utility performance (Berg, 2006). Benchmarking
can promote conflict resolution between groups by allowing participants to focus on
performance and can help bridge the gap between technical researchers and those
practitioners currently conducting studies for government agencies and water utilities
(Berg, 2007). Another area of performance which can be improved using benchmarking
is quality of service. The article on “service quality and prospects for benchmarking”
(Chen, 2005) summarizes that service quality is a very important factor of the water and
sewerage industry. The author, using data from the Peruvian water sector (1996-2001),
examines how the introduction of quality indicators affects performance comparisons
across utilities. Another area which can benefit using benchmarking is utility rate
regulations. The paper on “Statistical benchmarking in utility regulation: Role, standards
and methods” (Lowry, 2009) states that statistical benchmarking is widely used these
days in utility rate regulations.

9
2.1.2 Use of performance benchmarking in wastewater industry
Wastewater industry uses benchmarking for performance evaluation in a similar way as
drinking water industry. For example, in the study on “Benchmarking procedure for full-
scale activated sludge plants” (Abusam et al., 2004) a benchmarking methodology was
proposed which was intended to evaluate performance of wastewater treatment plant.
This paper proposes a data-based approach which can be used to benchmark a full-scale
sludge plant for nitrogen and carbon removal.
One of the most efficient methodologies is the DEA approach. In the article on “Energy
efficiency in Spanish wastewater treatment plants: A non-radial DEA approach,” Sancho
et al. (2011) used a non-radial Data Envelopment Analysis (DEA) methodology for the
calculation of energy efficiency indices for a wastewater treatment plants (WWTPs)
located in Spain. This study shows that reducing the carbon footprint of wastewater
treatment plants is very important both for economic and environmental reasons. The
DEA approach was also used by Sancho & Garrido (2009) to analyze the efficiency of
wastewater treatment plants as a basic requisite to increase the potential of the water
reuse. To achieve this, empirical research was carried out for 338 plants in Valencia
region in Spain. It was verified that the large plants run more efficiently than smaller
plants.
2.1.3 Use of performance benchmarking in other industries
The review shows that benchmarking is popular and effective in performance evaluation
not only in drinking water and wastewater industry but also in other industries.
Benchmarking use is prominent in industries like - airports, construction, energy, railway,
Telecom, Transportation, automotive, pipeline and others. These industries are using
various methodologies and processes of benchmarking. For example, the construction
industry is using web-based system for data collection, performance and practice use
reporting, and industry analysis (Lee et al., 2005). In the case of airport industry, it was
observed that many airports are engaged in Best Practice Benchmarking (46 percent), but
it also indicated that many were not (54 percent), and these airports seem to have
developed other ways of satisfying their performance management requirements (Francis
et al., 2002). Further, the study on development of benchmarking tools for monitoring
progress towards sustainable transportation in New Zealand presents the development of
a national benchmarking process for their transport sector. The project and its outcomes
are considered to be of benefit to road land transport authorities across the world who
wishes to develop a benchmark process of their own (Henning et al., 2011).
2.2 LITERATURE REVIEWED - REPORTS
This section provides a list of reports on performance benchmarking of drinking water
utilities, wastewater utilities and other industries.

10
Benchmarking reports - Drinking water and wastewater industry:
1. Assessing utility practices with the strategic asset management gap analysis tool
(SAMGAP), 2010, (WERF)
2. National Performance Framework: Urban performance reporting indicators and
definitions handbook, Australian Government, 2011, National Water Initiative (NWI)
3. Benchmarking Performance Indicators for Water and Wastewater Utilities: 2006
Annual Survey Data and Analysis Report, Qualserve (AWWA)
4. Canadian National Water & Wastewater Benchmarking Initiative, 2011, (AECOM)
5. City of Palo Alto, City Council Staff Report, 2011
6. Effective Utility Management, A Primer for Water and Wastewater Utilities, 2008,
(EPA)
7. Energy Index development for Benchmarking Water and Wastewater utilities, 2007,
By Steven W Carlson and Adam Walburger (AwwaRF)
8. GHD's Approach to Driving Asset Management Improvement Programs using Total
Enterprise Asset Management Quality Framework, Tool - GAP-EX1, 2007, Australia,
(GHD)
9. Key Performance Indicators and Benchmarking for Water Utilities in MENA, Arab
Region, 2010, (InWEnt)
10. TILDE (Tool for Integrated Leakage Detection) Project, 2005, By Frøydis Sjøvold,
SINTEF; Peter Mobbs, WRc; SGI, (European Commission)
11. Water and Wastewater Benchmark, Learning from International Best Practices, 2010,
(European Benchmarking Co-operation)
Benchmarking reports - other industries:
1. Benchmarking and Metrices Implementation Toolkit, Pocket Guide CII
2. Transportation Performance Index - summary report, 2010, by U.S. Chamber of
Commerce’s Let’s Rebuild America initiative (LRA)
2.3 LITERATURE REVIEWED - BOOKS
Books on performance indicators, process of benchmarking and benchmarking
methodologies were reviewed. The books by IWA (International Water Association) on
performance indicators were used to define the indicators. The books on methodologies
were used for the analysis of the collected data from utilities across United States. List of
reviewed books is summarized below:
1. Performance Benchmarking for Water Utilities, 1996, By Bill Kingdom (AWWA)
2. Performance indicators for wastewater services, 2003, By Rafaela Matos, A. Cardoso,
P. Duarte, R. Ashley, A. Molinari (IWA)
3. Performance indicators for water supply services, 2006, By Helena Alegre (IWA)
4. The Benchmarking Book: A How-to-Guide to Best Practice for Managers and
Practitioners, 2009, by Tim Stapenhurst
5. Wastewater Treatment Plant Design, 2003, by P. Aarne Vesilind (IWA)

11
6. Water Utility Benchmarking: Measurement, Methodologies, and Performance
Incentives, 2010, By Sanford Berg (IWA)
2.4 CURRENT PERFORMANCE BENCHMARKING PRACTICES IN DRINKING
WATER AND WASTEWATER INDUSTRY
There are many initiatives in different countries in drinking water and wastewater utility
performance benchmarking. Major initiatives are summarized in Table 4. The summary
of major benchmarking initiatives is described below:
SAM GAP – Developed by Water Environment Research Foundation (WERF)
The Strategic Asset Management (SAM) gap analysis tool, developed by WERF is a tool
for measuring the confidence level embedded in an organization's current asset
management procedures and decision-making environment. SAM GAP is an online self-
assessment process that allows an organization to compare their performance against data
from over 170 asset management practitioners. It has a detailed and comprehensive
questionnaire with 166 questions. The utility’s information are compared to appropriate
practices for similar industry organizations and reported graphically, accompanied by a
detailed list of suggested areas for improvement. The customized report generated by
SAM GAP benchmarks the utility’s practices against its peers, and against the best run
organizations in the world. Because it can be run at any time, the tool helps the utility
measure improvement in their asset management processes.
(Information retrieved from http://simple.werf.org/UploadFiles/SAM2C06)
National Water and Wastewater Benchmarking Initiative, Canada - AECOM
This project was developed due to the need of Canadian municipal water and wastewater
utilities to evaluate utility performance. It is a high level metric benchmarking process
and has developed into a network and information base for Canada's municipal utilities.
The Benchmarking Initiative was started in 1997 as a pilot project that included 4
participating cities and team members from AECOM and the National Research Council.
It has now grown to serve as the standard for utility benchmarking in Canada.
(Information retrieved from http://www.nationalbenchmarking.ca/)
EBC: European Benchmarking Co-operation
The European Benchmarking Co-operation (EBC) is a benchmarking initiative for water
and wastewater services. Its focus is to help utilities in improving performance. The
International Water Association briefly defines benchmarking as: “a tool for performance
improvement through systematic search and adaptation of leading practices”.
Benchmarking focuses at continuously improving performance, hence benchmarking is a
cyclical process.
(Information retrieved from http://www.waterbenchmark.org/)
12
The International Benchmarking Network for Water and Sanitation Utilities
(IBNET) – World Bank Group
It is the world’s largest database for water and wastewater utilities performance data.
IBNET supports and promotes good benchmarking practice among water and wastewater
services by:
Providing guidance on indicators, definitions;
Facilitating the establishment of national or regional benchmarking schemes;
Undertaking peer group performance comparisons;
(Information retrieved from http://www.ib-net.org/)
QualServe Benchmarking
QualServe is a joint initiative by the American Water Works Association and the Water
Environment Federation to support water, wastewater, and combined water/wastewater
utilities in improving performance and increase customer satisfaction. QualServe has four
basic components:
Self-Assessment.
Peer Review
Benchmarking Performance Indicators
Benchmarking Data Sharing Workshop
(Information retrieved from
http://www.awwa.org/files/QualServe/FactSheet/QualServefact%20sheet2011.pdf )
Table 4. Details of major benchmarking initiatives
Country Project title Utilities
participated
Number of
indicators Detail
USA
(WERF)
2010
SAM-GAP Total - 130 Total - 193
Drinking water and
wastewater utility asset
management practice
gap analysis and
benchmarking tool
Canada
2011
(started
1997)
National DW
and WW
Benchmarking
initiative -
AECOM and
the National
Research
Council
39-WW 50-DW
Serve as the national
standard for water and
wastewater utility
benchmarking in
Canada

13
Europe
2010
European
Benchmarking
Co-operation
Total-41 154-DW
A tool for performance
improvement through
systematic search and
adaptation of leading
practices
128-WW
34-DW 50-WW
16-SW 15-SW
IBNET –
DFID (UK)
and The
world bank
The
International
Benchmarking
Network for
Water and
Sanitation
utilities
2000 from
85 countries
(overall)
Total-150
Objective is to support
access to comparative
information that will
help to promote best
practice among water
supply and sanitation
providers worldwide
USA and
Canada -
AWWA
and WEF
(2010)
QualServe
Benchmarking 52 Total - 34
Assessment of
Leadership and
Organizational
Development, Business
Operations, Customer
Relations, Water
Operations, and
Wastewater Operations
In Table 4, DW is drinking water, WW is wastewater, and SW is storm water
2.5 CONCLUSION
A major conclusion is that, benchmarking is important for documenting past
performance, establishing baselines for gauging productivity improvements, and making
comparisons across service providers (Berg et al, 2007). It was observed that very few
web-based benchmarking exists. Most of the benchmarking initiatives require consultants
to visit the utility, which can be eliminated by using a web-based benchmarking platform.
Along with this, web-based benchmarking will provide a platform not only for data
gathering but will also provide a platform for results display. A few benchmarking
initiatives are subjective and the subjectivity can be removed by quantifying the
performance indicators. Many benchmarking initiatives in the drinking water and
wastewater industry are not holistic and have a limited scope. A holistic evaluation of
overall performance can be done using a comprehensive set of indicators which cover all
the areas of utility performance.

14
CHAPTER 3. PERFORMANCE BENCHMARKING METHODOLOGY
3.1 METHODOLOGY
Database benchmarking methodology is adopted to create a web-based benchmarking
platform. This benchmarking platform can be used by the utilities for performance
evaluation and benchmarking. The benchmarking platform was developed using the
available literature and suggestions from the utility personnel. The validation and review
of the adopted methodology is especially important, as the products of the research are
intended for use as a source of guidance for performance evaluation of utilities. Two
review committees, one each for drinking water and wastewater were assembled to
review the methodology, indicators and analysis results. These committees consist of
three utility personnel and two consultants. The adopted methodology was reviewed by
utility personnel and consultants followed by modification with a focus to capture the
overall performance.
Database benchmarking methodology involves identifying and using indicators which
can be used for benchmarking. The next step was to collect data for indicators and to
develop a database for various core indicators which can be used to evaluate the overall
performance. The collected data was used to compare performance of each indicator, for
participating utilities. The utilities can make comparisons for each indicator with other
utilities to observe the difference in performance using the web-interface. Once the areas
of underperformance are identified, utilities can identify the reasons for
underperformance and make future strategies to improve the performance. The first set of
data was collected from 10 drinking water and 9 wastewater utilities using data-mining
sheets. The newly developed web-based benchmarking platform is a part of WATERiD
project. WATERiD is a knowledge database and contains information on both drinking
water and wastewater infrastructure. Information about utility performance
benchmarking, pipeline condition assessment, pipeline renewal engineering, subsurface
utility engineering information for locating pipelines, management practices, models and
tools, costs, and product qualification are parts of the project.
The web-interface on WATERiD serves a dual purpose:
Data collection
Utilities can access the benchmarking page to download the data mining sheet,
and send the data mining sheets with data for the indicators to the benchmarking
team at Virginia Tech. The collected data is saved at a secured location on the
website, which is accessible only to respective utility personnel and the
benchmarking team at Virginia Tech. The data provided by utilities is analyzed
and results are generated.

15
Visualization of results
Once the data is analyzed, it is converted into useful information and utilities can
access their results on website for each performance indicators. This web interface
gives the user a flexible way of visualizing the results.
3.2 INDICATORS
The indicators used for this study were defined using the literature sources, and were
modified using the suggestions from utility personnel. Performance indicators have a
clear definition and are achievable, auditable, universal, simple, and quantifiable. A list
of 150 indicators was created for drinking water and 140 indicators for wastewater. Based
on the suggestions and comments from the utility personnel 89 indicators were selected
for drinking water and 89 indicators were selected for wastewater. These indicators cover
the major areas which impact the overall utility’s performance. Indicators were further
divided in seven categories.
The book on Performance indicators for water supply services (Alegre, 2000) has a
detailed list of indicators and definitions for performance evaluation of drinking water
utilities. The categories for drinking water are:
1. Water resource utilization
2. Employee information
3. Physical assets
4. Service quality
5. Operational performance
6. Customer enquiries
7. Financial performance
The book on “Performance Indicators for Wastewater Services” (Matos et al. 2003)
provides a detailed list of indicators and definitions for the performance evaluation of
wastewater utilities. The categories for wastewater are:
1. Wastewater and Biosolids
2. Employee information
3. Treatment process
4. Treatment performance
5. Operational performance
6. Customer enquiries
7. Financial Performance
The indicators have been divided into essential and preferable indicators as illustrated in
Figure 3. Essential indicators are used for basic level benchmarking and preferable
indicators, used with essential indicators for advanced level benchmarking. The number
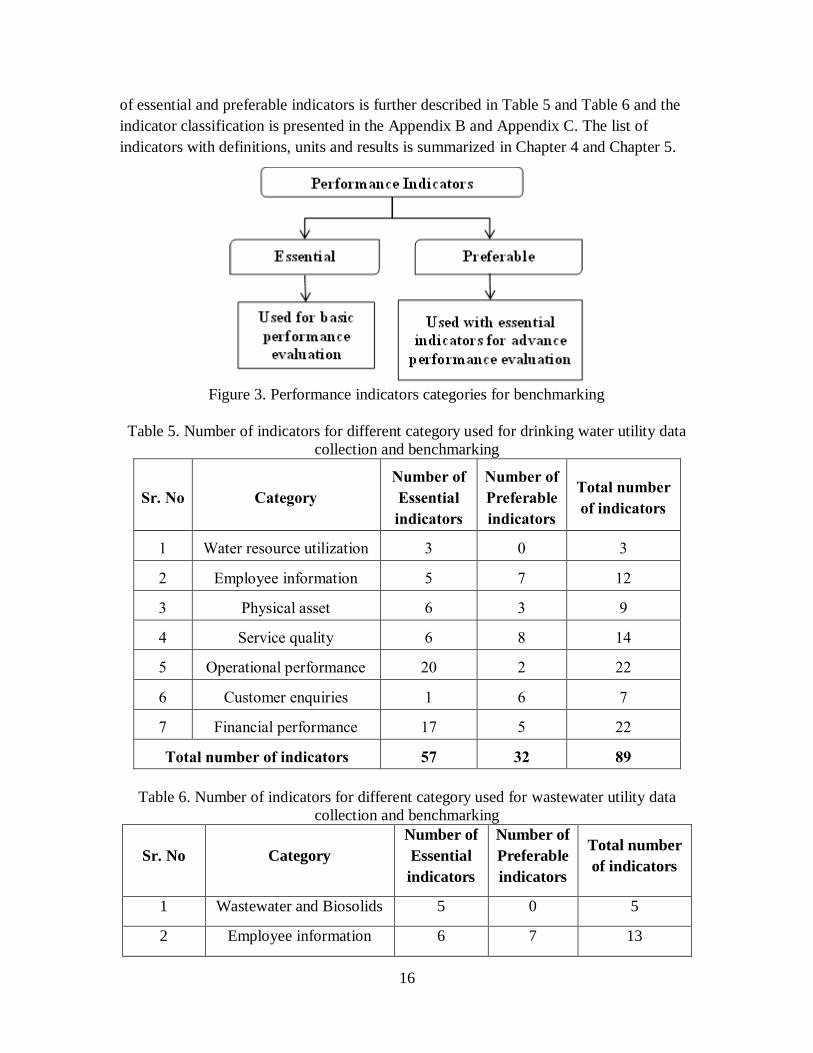
16
of essential and preferable indicators is further described in Table 5 and Table 6 and the
indicator classification is presented in the Appendix B and Appendix C. The list of
indicators with definitions, units and results is summarized in Chapter 4 and Chapter 5.
Figure 3. Performance indicators categories for benchmarking
Table 5. Number of indicators for different category used for drinking water utility data
collection and benchmarking
Sr. No Category
Number of
Essential
indicators
Number of
Preferable
indicators
Total number
of indicators
1 Water resource utilization 3 0 3
2 Employee information 5 7 12
3 Physical asset 6 3 9
4 Service quality 6 8 14
5 Operational performance 20 2 22
6 Customer enquiries 1 6 7
7 Financial performance 17 5 22
Total number of indicators 57 32 89
Table 6. Number of indicators for different category used for wastewater utility data
collection and benchmarking
Sr. No Category
Number of
Essential
indicators
Number of
Preferable
indicators
Total number
of indicators
1 Wastewater and Biosolids 5 0 5
2 Employee information 6 7 13
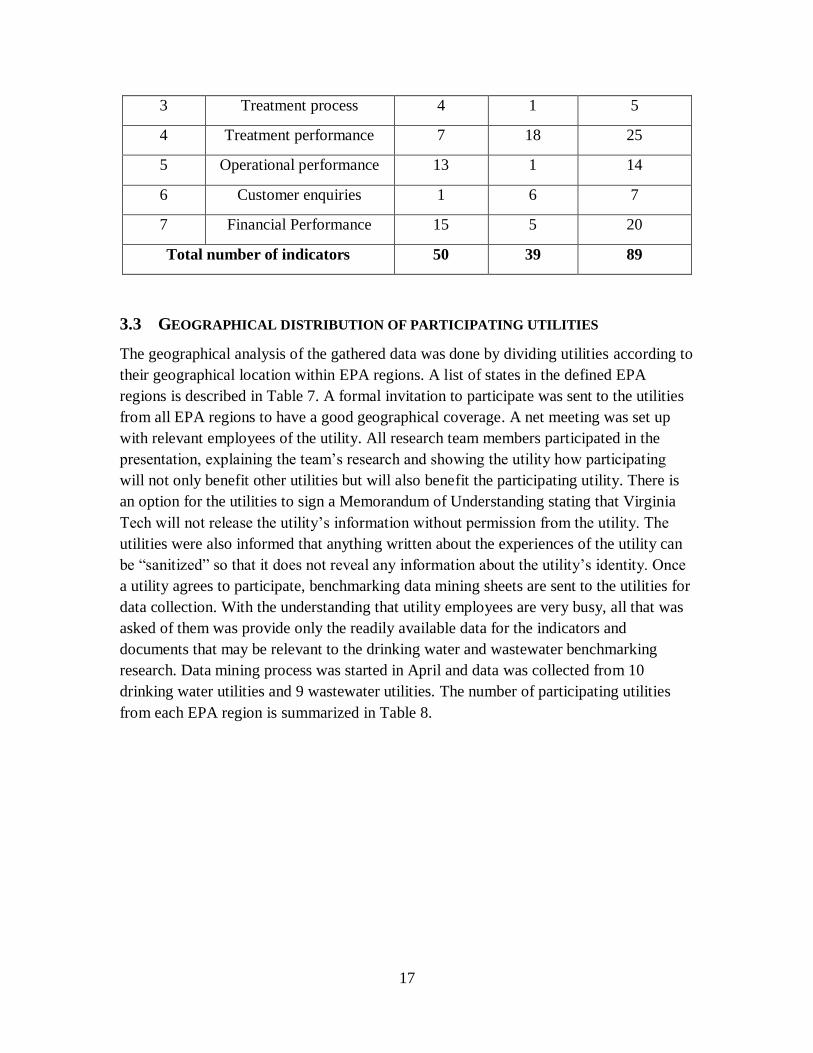
17
3 Treatment process 4 1 5
4 Treatment performance 7 18 25
5 Operational performance 13 1 14
6 Customer enquiries 1 6 7
7 Financial Performance 15 5 20
Total number of indicators 50 39 89
3.3 GEOGRAPHICAL DISTRIBUTION OF PARTICIPATING UTILITIES
The geographical analysis of the gathered data was done by dividing utilities according to
their geographical location within EPA regions. A list of states in the defined EPA
regions is described in Table 7. A formal invitation to participate was sent to the utilities
from all EPA regions to have a good geographical coverage. A net meeting was set up
with relevant employees of the utility. All research team members participated in the
presentation, explaining the team’s research and showing the utility how participating
will not only benefit other utilities but will also benefit the participating utility. There is
an option for the utilities to sign a Memorandum of Understanding stating that Virginia
Tech will not release the utility’s information without permission from the utility. The
utilities were also informed that anything written about the experiences of the utility can
be “sanitized” so that it does not reveal any information about the utility’s identity. Once
a utility agrees to participate, benchmarking data mining sheets are sent to the utilities for
data collection. With the understanding that utility employees are very busy, all that was
asked of them was provide only the readily available data for the indicators and
documents that may be relevant to the drinking water and wastewater benchmarking
research. Data mining process was started in April and data was collected from 10
drinking water utilities and 9 wastewater utilities. The number of participating utilities
from each EPA region is summarized in Table 8.

18
Table 7. Description of EPA defined regions
Geographical
Region Name Region Description
EPA Region 1 Connecticut, Maine, Massachusetts, New Hampshire, Rhode Island,
and Vermont.
EPA Region 2 New Jersey, New York, Puerto Rico and the U.S. Virgin Islands.
EPA Region 3 Delaware, Maryland, Pennsylvania, Virginia, West Virginia, and the
District of Columbia.
EPA Region 4 Alabama, Florida, Georgia, Kentucky, Mississippi, North
Carolina, South Carolina, and Tennessee.
EPA Region 5 Illinois, Indiana, Michigan, Minnesota, Ohio, and Wisconsin.
EPA Region 6 Arkansas, Louisiana, New Mexico, Oklahoma, and Texas.
EPA Region 7 Iowa, Kansas, Missouri, and Nebraska.
EPA Region 8 Colorado, Montana, North Dakota, South Dakota, Utah, and Wyoming.
EPA Region 9 Arizona, California, Hawaii, Nevada, and the territories of Guam and
American Samoa.
EPA Region 10 Alaska, Idaho, Oregon, and Washington.
Table 8. List of participating drinking water and wastewater utilities by EPA regions
EPA Region Drinking Water Wastewater
EPA Region 3 5 4
EPA Region 4 2 3
EPA Region 6 1 1
EPA Region 9 - 1
EPA Region 10 2 -
Total 10 9

19
CHAPTER 4. PERFORMANCE BENCHMARKING RESULTS, ANALYSIS
AND LIMITATIONS – DRINKING WATER UTILITIES
Data was gathered from 10 drinking water utilities. A total of 89 indicators were used for
data collection and for analysis of overall performance. The collected data for this study
is from 2011-2012. A committee was formed consisting of experts from the drinking
water industry to review the results; from the feedback the analysis results were finalized.
For this study the utility specific results were shared only with the respective utilities.
The results for seven key performance areas are summarized graphically. The results are
also available on the WATERiD website and continuous data collection will be
performed using the web-based benchmarking platform. This will enable the database to
grow and will result in a better database for future benchmarking. Further, each graph has
the maximum, minimum, average and median value for the indicator and the definition is
described below:
Maximum (Max) value: maximum of all the values collected from utilities for the
indicator.
Minimum (Min) value: minimum of all the values collected from utilities for the
indicator.
Average value: average of all the values collected from utilities for the indicator.
Median value: median of all the values collected from utilities for the indicator.
4.1 WATER RESOURCE UTILIZATION
Results and analysis:
The type and characteristics of the water resources vary greatly from case to case, both in
terms of quantity and quality. The indicators related to water resource utilization are
limited to aspects like how efficiently the resources are being used.
The result for each indicator is summarized in Table 9. It was found that some utilities
have a significant percentage of water loss (non-revenue water) and is calculated as the
percentage of treated water which is lost due to leakage and overflow as shown in Figure
4. Most of the utilities do not reuse or recycle the supplied water and the results are
summarized in Figure 5. Reuse or recycling of water can help in conserving the natural
resources of water, if done properly. Water reuse makes more sense in drier parts of the
United States. It was found that in some areas like Florida all wastewater is called
recycled water, which is pumped into groundwater aquifers to be used in the future.
Availability of raw water resources varies for different utilities and depends on the
geographical location of the utility and the results are summarized in Figure 6.

20
Limitations:
1. Some utilities are located at regions where extracting raw water does not require
any permit and extraction is dependent on the capacity of intake structures.
2. Some utilities are located at critical locations where they have a limitation on
extraction of water.
3. It should be noted that there is a cost associated with reusing water and in water
rich environments; the economic justification may not exist in such cases.
Table 9. List of indicators, definition and results for water resource utilization
Indicator Definition Unit Max Min Average Median
Inefficiency of
use of water
resource
Total Water lost due to
leakage and overflow / Total
treated water produced x 100
% 27.30 7.54 15.21 12.67
Reused or
recycled
supplied water
volume of water reused or
recycled / total volume of
water entering the utility for
treatment x 100
% 6.11 0.00 1.22 0.00
Water
resources
availability
total volume of water
entering the utility for
treatment / Total volume of
water available as per
withdrawal permit from
lakes, river and other sources
x 100
% 51 10 34 43
Figure 4. Inefficiency of use of water
resource
Figure 5. Reused or recycled supplied water
27.30
7.54
15.21 12.67
0
10
20
30
Max Min Average Median
%
Inefficiency of use of water resource
6.11
0.00 1.22
0.00 0
2
4
6
8
Max Min Average Median
%
Reused or recycled supplied water

21
Figure 6. Water resource availability
4.2 EMPLOYEE INFORMATION
Results and analysis:
Employee related indicators offer insight into how the participating utilities have staffed
their utility – both in leadership and operations staff; how they’re structured in terms of
the types of employees; how they invest in their employees (e.g. training); and, how they
maintain a safe working environment. Lin (2005), Berg and Lin (2007), Alsharif et al.
(2008), Lonborg (2005), Mugisha (2007), Lambert et al. (1993), Aida et al. (1998), and
Tupper and Resende (2004) are among researchers who have considered number of
employees (or labor or staff) as one of the inputs in their studies.
The result for each indicator is summarized in Table 10. The number of employees per
1000 connections and per million gallons of water produced per day is summarized in
Figure 7 and Figure 8. Percentage of employees in higher management (Figure 9), human
resources (Figure 10), financial and commercial (Figure 11), customer service (Figure
12), planning, design and construction (Figure 13) and water quality monitoring (Figure
15) were found lower as compared to percentage of employees in operations and
management (Figure 14) in all the utilities. This is because the main work in the utility
involves operations and management of water treatment. It was also found that most of
the utilities invest significant time and resources on personnel training as shown in Figure
16; most of this training is related to safety. The percentage of employees injured in
working accidents in the last one year is summarized in Figure 17. The percentage of
employees injured in the last one year is high for a few utilities. For such utilities the first
step is to determine the reasons for poor safety, and the next step is to implement better
health and safety programs. The rate of absences due to accidents show that the time lost
due to accidents is on a lower side for all the utilities as summarized in Figure 18.
51
10
34 43
0
10
20
30
40
50
60
Max Min Average Median%
Water resources availability

22
Limitations:
1. The number of employees per 1000 connections and per million gallons of water
produced per day depends on the size, location and number of connections served
by the utility
2. The number of employees in functions like human resources and finance vary
significantly between municipalities and drinking water authorities. In a
municipality, many of these functions are provided in the general fund; the utility
then pays a PILOT (payment in lieu of taxes) and/or makes a transfer of funds to
the general fund for indirect costs. In an authority they usually have those
positions on staff.
Table 10. List of indicators, definition and results for employee information
Indicator Definition Unit Max Min Average Median
Total employee
Employee per
1000 connection
total no. of employees /
number of connections x
1000
number /
1000 4.50 1.15 2.50 2.37
Employee per
million gallons
of water
produced per day
total no. of employees /
Million gallons of water
produced daily
number /
Mgal 7.80 2.57 4.95 4.46
Employee as per
function
Higher
management
employees
Number of full time
equivalent employees
dedicated to directors,
central administration,
strategic planning,
marketing and
communications, legal
affairs, environmental
management, business
development / total number
of employee x 100
% 16.73 1.53 7.09 5.04
Human resources
employees
Number of full time
employees dedicated to
personnel administration,
% 2.53 0.83 1.73 1.79
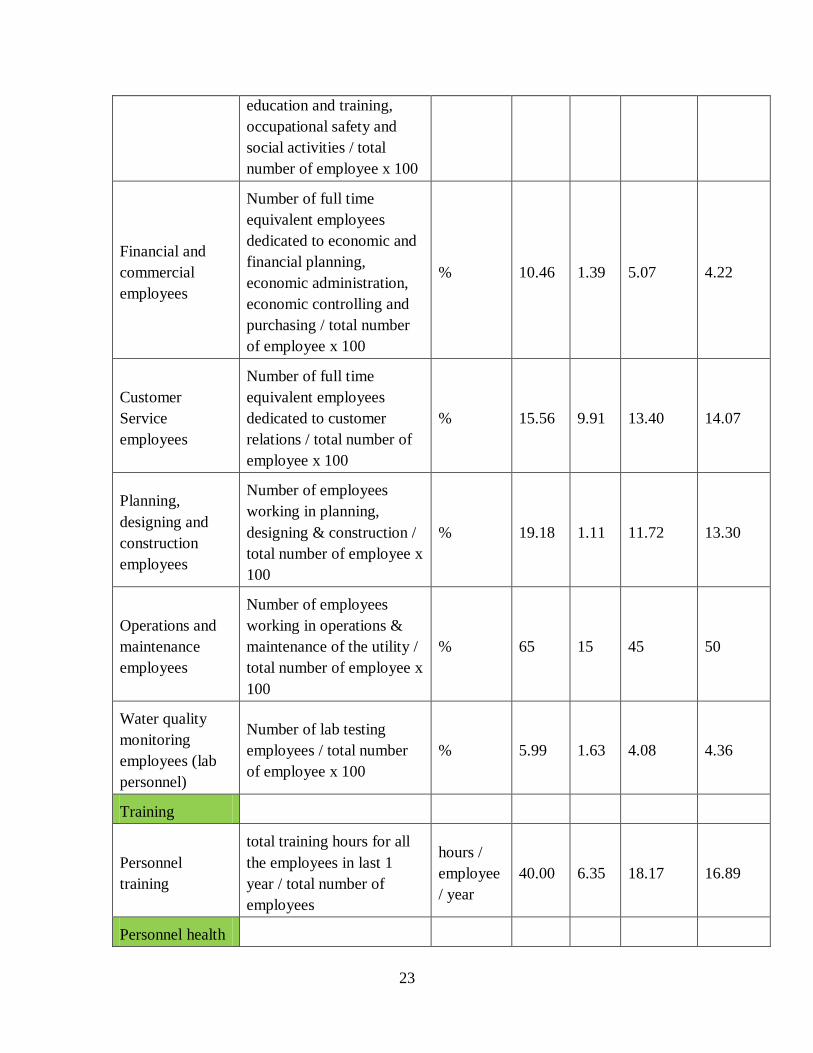
23
education and training,
occupational safety and
social activities / total
number of employee x 100
Financial and
commercial
employees
Number of full time
equivalent employees
dedicated to economic and
financial planning,
economic administration,
economic controlling and
purchasing / total number
of employee x 100
% 10.46 1.39 5.07 4.22
Customer
Service
employees
Number of full time
equivalent employees
dedicated to customer
relations / total number of
employee x 100
% 15.56 9.91 13.40 14.07
Planning,
designing and
construction
employees
Number of employees
working in planning,
designing & construction /
total number of employee x
100
% 19.18 1.11 11.72 13.30
Operations and
maintenance
employees
Number of employees
working in operations &
maintenance of the utility /
total number of employee x
100
% 65 15 45 50
Water quality
monitoring
employees (lab
personnel)
Number of lab testing
employees / total number
of employee x 100
% 5.99 1.63 4.08 4.36
Training
Personnel
training
total training hours for all
the employees in last 1
year / total number of
employees
hours /
employee
/ year
40.00 6.35 18.17 16.89
Personnel health

24
and safety
working
accidents - % of
employees
injured in last 1
year
number of employees
injured on the job in the
last 1 year / total number of
employees x 100
% 9.72 2.30 6.10 6.22
Absences due to
accidents
sum of all the absences due
to all the employees due to
reasons related to accident
in last 1 year / total number
of employees
number /
employee
/ year
0.46 0.00 0.25 0.27
Figure 7. Employee per 1000 connections
Figure 8. Employee per mgal of water
produced per day
Figure 9. Higher management employee
Figure 10. Human resource employee
4.50
1.15
2.50 2.37
0
1
2
3
4
5
Max Min Average Median
nu
mb
er /
100
0 co
nn
ecti
on
Employee per 1000 connection
7.80
2.57
4.95 4.46
0
2
4
6
8
10
Max Min Average Median
nu
mb
er/M
gal
Employee per million gallon of water produced per day
16.73
1.53
7.09 5.04
0
5
10
15
20
Max Min Average Median
%
Higher management employee
2.53
0.83
1.73 1.79
0
1
1
2
2
3
3
Max Min Average Median
%
Human resources employee
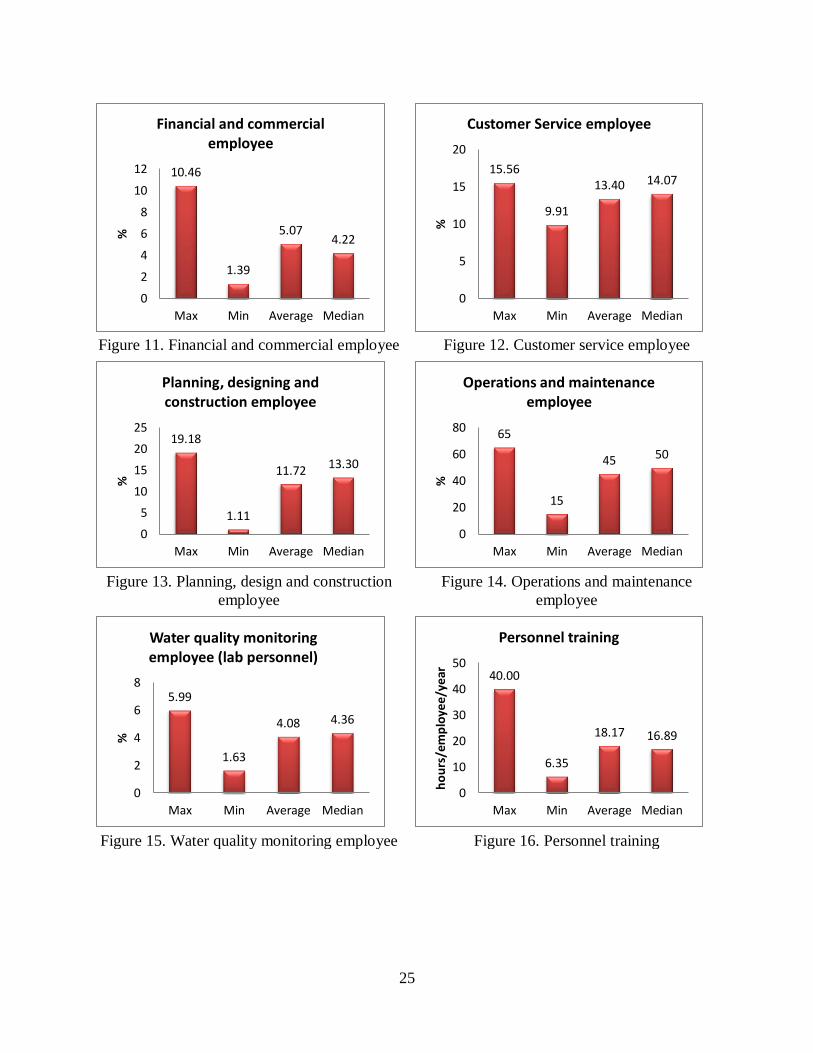
25
Figure 11. Financial and commercial employee
Figure 12. Customer service employee
Figure 13. Planning, design and construction
employee
Figure 14. Operations and maintenance
employee
Figure 15. Water quality monitoring employee
Figure 16. Personnel training
10.46
1.39
5.07 4.22
0
2
4
6
8
10
12
Max Min Average Median
%
Financial and commercial employee
15.56
9.91
13.40 14.07
0
5
10
15
20
Max Min Average Median
%
Customer Service employee
19.18
1.11
11.72 13.30
0
5
10
15
20
25
Max Min Average Median
%
Planning, designing and construction employee
65
15
45 50
0
20
40
60
80
Max Min Average Median
%
Operations and maintenance employee
5.99
1.63
4.08 4.36
0
2
4
6
8
Max Min Average Median
%
Water quality monitoring employee (lab personnel)
40.00
6.35
18.17 16.89
0
10
20
30
40
50
Max Min Average Median
ho
urs
/em
plo
yee/
year
Personnel training
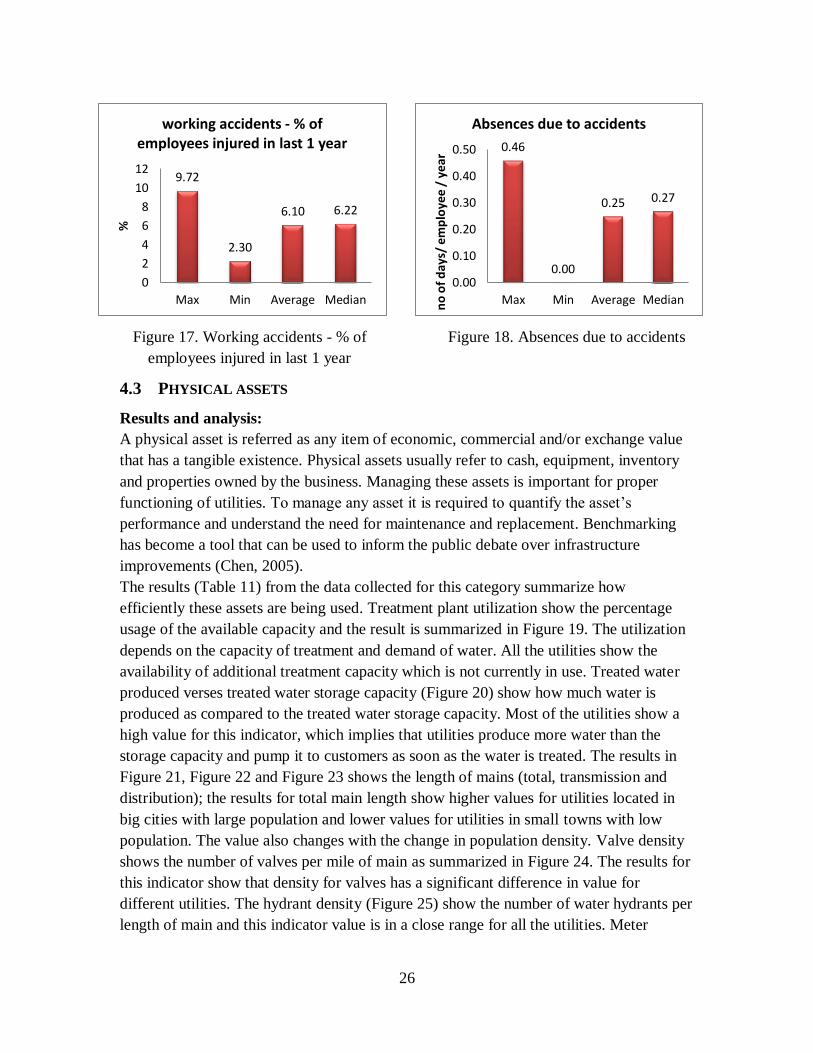
26
4.3 PHYSICAL ASSETS
Results and analysis:
A physical asset is referred as any item of economic, commercial and/or exchange value
that has a tangible existence. Physical assets usually refer to cash, equipment, inventory
and properties owned by the business. Managing these assets is important for proper
functioning of utilities. To manage any asset it is required to quantify the asset’s
performance and understand the need for maintenance and replacement. Benchmarking
has become a tool that can be used to inform the public debate over infrastructure
improvements (Chen, 2005).
The results (Table 11) from the data collected for this category summarize how
efficiently these assets are being used. Treatment plant utilization show the percentage
usage of the available capacity and the result is summarized in Figure 19. The utilization
depends on the capacity of treatment and demand of water. All the utilities show the
availability of additional treatment capacity which is not currently in use. Treated water
produced verses treated water storage capacity (Figure 20) show how much water is
produced as compared to the treated water storage capacity. Most of the utilities show a
high value for this indicator, which implies that utilities produce more water than the
storage capacity and pump it to customers as soon as the water is treated. The results in
Figure 21, Figure 22 and Figure 23 shows the length of mains (total, transmission and
distribution); the results for total main length show higher values for utilities located in
big cities with large population and lower values for utilities in small towns with low
population. The value also changes with the change in population density. Valve density
shows the number of valves per mile of main as summarized in Figure 24. The results for
this indicator show that density for valves has a significant difference in value for
different utilities. The hydrant density (Figure 25) show the number of water hydrants per
length of main and this indicator value is in a close range for all the utilities. Meter
Figure 17. Working accidents - % of
employees injured in last 1 year
Figure 18. Absences due to accidents
9.72
2.30
6.10 6.22
0
2
4
6
8
10
12
Max Min Average Median
%
working accidents - % of employees injured in last 1 year 0.46
0.00
0.25 0.27
0.00
0.10
0.20
0.30
0.40
0.50
Max Min Average Medianno
of
day
s/ e
mp
loye
e /
year
Absences due to accidents

27
density show the percentage of customer with meters, and the results show a value close
to 100% for all the utilities as summarized in Figure 26.
The indicators for daily used capacity of raw water storage reservoir, pumping capacity
utilization, electrical energy consumption per population served, and electrical energy
consumption per million gal of water treated have not been included because there was
insufficient data for making conclusions.
Limitations:
1. The indicator for main length, valve density and hydrant density depends on the
total area in which the utility provides service and on population density. Higher
number for these indicators does not mean a better performance.
Table 11. List of indicators, definition and results for physical assets
Indicator Definition Unit Max Min Average Median
Treatment plant
utilization
Average Volume
of water treated
daily / Maximum
daily water
treatment capacity
x 100
% 77 32 52 50
Water produced
vs. Treated water
storage capacity
Average Volume
of water treated
daily / capacity of
treated water
storage reservoir x
100
% 389 26 195 156
Total Main
length miles 5166 460 2953 3124
Transmission
main miles 333 20 163 154
Distribution main
miles 3933 360 2547 2948
Valve density
total no of
isolating valves /
total miles of
distribution main
length
number /
mile 26.78 0.21 14.88 12.48
Hydrant density
total no of
hydrants / total
miles of
number /
mile 7.66 5.16 6.19 6.12

28
distribution main
length
Meters
total number of
meters / total
number of
connections x 100
% 101 93 99 100
Figure 19. Treatment plant utilization
Figure 20. Water produced vs. treated
water storage capacity
Figure 21. Total main length
Figure 22. Transmission main length
77
32
52 50
0
20
40
60
80
100
Max Min Average Median
%
Treatement plant utilization
389
26
195 156
0
100
200
300
400
500
Max Min Average Median
%
Water produced vs Treated water storage capacity
5166
460
2953 3124
0
1000
2000
3000
4000
5000
6000
Max Min Average Median
mile
s
Total Main length 333
20
163 154
0
50
100
150
200
250
300
350
Max Min Average Median
mile
s
Transmission main

29
4.4 SERVICE QUALITY
Results and analysis:
Quality of service is a vital ingredient in a utility’s ability to maintain profitability and
continued success. Service quality is a very important aspect of the water industry (Chen,
2005).
All the results are summarized in Table 12. Population coverage show the percentage of
population served in the service area and for most of the utilities this number is high as
summarized in Figure 27. Main breaks show the number of main breaks in every 100
miles of mains last year and it shows how the mains have been maintained in the past. It
was found that a few utilities have a higher number for this indicator (29 main breaks per
100 miles in the last one year) as summarized in Figure 28. The utilities with higher
values for this indicator should focus on maintaining, repairing and replacing mains. This
will ensure smooth functioning of operations and will help to provide a high quality
service. Water interruptions are a critical part of service, and higher number of
interruption causes dissatisfaction to the customers. Percentage connections with
Figure 23. Distribution main length
Figure 24. Valve density
Figure 25. Hydrant density
Figure 26. Meter density
3933
360
2547 2948
0
1000
2000
3000
4000
5000
Max Min Average Median
mile
s
Distribution main
26.78
0.21
14.88 12.48
0
5
10
15
20
25
30
Max Min Average Median
nu
mb
er
/ m
iles
Valve density
7.66
5.16 6.19 6.12
0
2
4
6
8
10
Max Min Average Median
nu
mb
er /
mile
s
Hydrant density
101
93
99 100
88
90
92
94
96
98
100
102
Max Min Average Median
%
Meters

30
interruption in service show that most of the connections that experienced interruption
were for a time less than 4 hours as summarized in Figure 29, Figure 30, Figure 31 and
Figure 32. This shows that most of the utilities solved the water interruption on a priority
basis. Quality of supplied water is also important and critical in evaluation of the quality
of service. Many tests have been defined in the standards which are required to be
performed before supplying the treated water. The indicators related to tests are divided
in two categories. First is the percentage of tests compliant with the standards for treated
water for each type of tests and second is the total percentage of required number of tests
performed. Result for total percentage of tests compliant with the standard is summarized
in Figure 33 and total percentage of required tests done is summarized in Figure 34.
Percentage of aesthetic tests compliant with the standard is summarized in Figure 35 and
percentage of required aesthetic tests done is summarized in Figure 36. Percentage of
microbiological tests compliant with the standard is summarized in Figure 37 and total
percentage of required microbiological tests performed is summarized in Figure 38.
Percentage of physical-chemical tests compliant with the standard is summarized in
Figure 39 and the percentage of required number of physical-chemical tests done is
summarized in Figure 40. Percentage of radioactive tests compliant with the standard is
summarized in Figure 41 and the percentage of required number of radioactive tests done
is summarized in Figure 42. It is found that almost all utilities perform more than the
minimum number of required tests and all the utilities showed almost 100% compliance
with permit conditions for the tests.
Limitations:
1. Many utilities that have higher population coverage may not have effective
competition in a given area, and there may be no market incentive to cut costs.
Hence the utility with higher population coverage does not necessarily mean a
good performance.
2. Number of main breaks per 100 miles depends on the age, quality and current
condition of the pipes. These factors should be considered while making future
plans for main rehabilitation, repair or replacement.
3. There are few testes like radioactive tests which are approved for reduced
monitoring - once every 9 years. These practices should be taken into account
while evaluating the performance related to tests.
Table 12. List of indicators, definition and results for service quality
Indicator Definition Unit Max Min Average Median
Population
coverage
Total Population
served / Total
population of the
service area x 100
% 100 25 75 90
Water supply
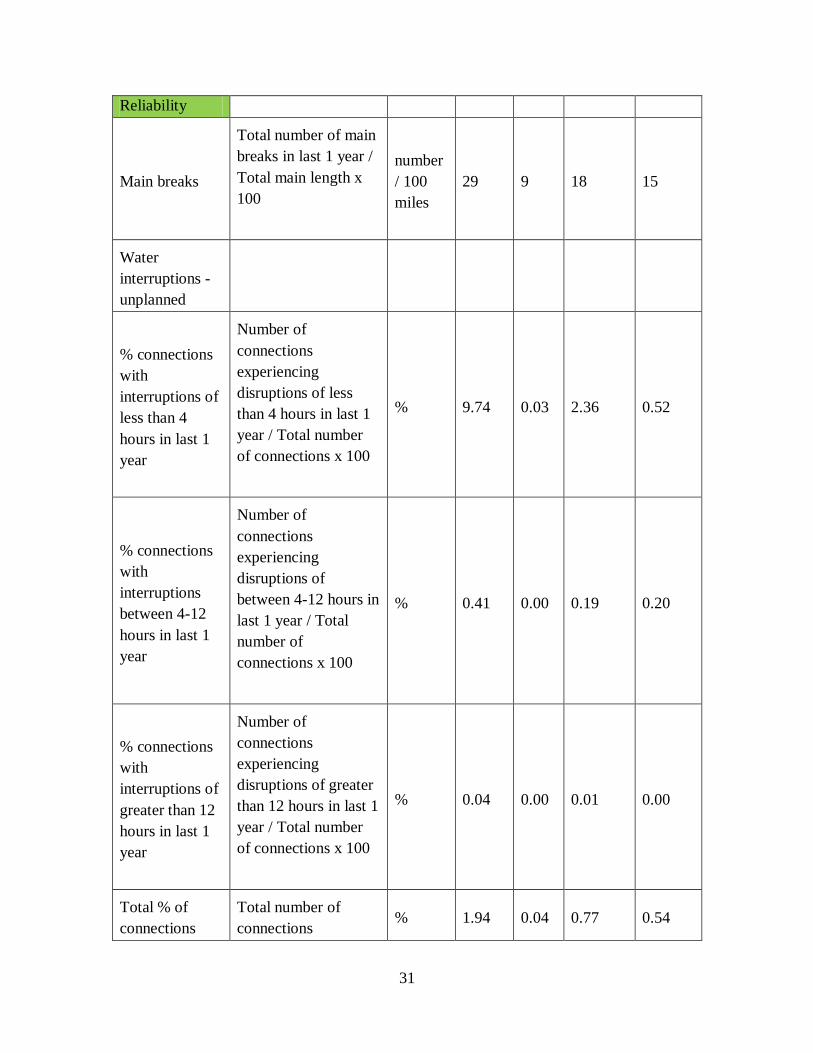
31
Reliability
Main breaks
Total number of main
breaks in last 1 year /
Total main length x
100
number
/ 100
miles
29 9 18 15
Water
interruptions -
unplanned
% connections
with
interruptions of
less than 4
hours in last 1
year
Number of
connections
experiencing
disruptions of less
than 4 hours in last 1
year / Total number
of connections x 100
% 9.74 0.03 2.36 0.52
% connections
with
interruptions
between 4-12
hours in last 1
year
Number of
connections
experiencing
disruptions of
between 4-12 hours in
last 1 year / Total
number of
connections x 100
% 0.41 0.00 0.19 0.20
% connections
with
interruptions of
greater than 12
hours in last 1
year
Number of
connections
experiencing
disruptions of greater
than 12 hours in last 1
year / Total number
of connections x 100
% 0.04 0.00 0.01 0.00
Total % of
connections
Total number of
connections % 1.94 0.04 0.77 0.54

32
experiencing
disruption in
last 1 year
experiencing
disruption in last 1
year / Total number
of connections x 100
Quality of
Supplied water
Total % of tests
compliant with
permit
conditions for
treated water
total no. of tests
complying with
permit conditions /
total no. of tests done
x 100
% 100.00 99.90 99.98 100.00
Total % of
required tests
done
total no. of tests done
/ total no. of water
quality tests required
by standards x 100
% 483 100 167 100
Total % of
Aesthetic tests
compliant with
permit
conditions for
treated water
total no. of Aesthetic
tests complying with
permit conditions /
total no. of Aesthetic
tests done x 100
% 100.00 99.65 99.91 100.00
Total % of
required
Aesthetic tests
done
total no. of Aesthetic
tests done / total no.
of Aesthetic tests
required by standards
x 100
% 1608 100 603 100
Total % of
Microbiological
tests compliant
with permit
conditions for
treated water
total no. of
Microbiological tests
complying with
permit conditions /
total no. of
Microbiological tests
done x 100
% 100.00 99.96 99.99 100.00
Total % of
required
Microbiological
tests done
total no. of
Microbiological tests
done / total no. of
Microbiological tests
% 229 100 134 103

33
required by standards
x 100
Total % of
Physical-
chemical tests
compliant with
permit
conditions for
treated water
total no. of Physical-
chemical tests
complying with
permit conditions /
total no. of Physical-
chemical tests done x
100
% 100.00 99.91 99.98 100.00
Total % of
required
Physical-
chemical tests
done
total no. of Physical-
chemical tests done /
total no. of Physical-
chemical tests
required by standards
x 100
% 1083 100 346 100
Total % of
Radioactive
tests compliant
with permit
conditions for
treated water
total no. of
Radioactive tests
complying with
permit conditions /
total no. of
Radioactive tests
done x 100
% 100 100 100 100
Total % of
required
Radioactive
tests done
total no. of
Radioactive tests
done / total no. of
Radioactive tests
required by standards
x 100
% 100 100 100 100

34
Figure 27. Population coverage
Figure 28. Main breaks
Figure 29. % connections with interruptions
of less than 4 hours in last 1 year
Figure 30. % connections with interruptions
between 4-12 hours in last 1 year
Figure 31. % connections with interruptions
of greater than 12 hours in last 1 year
Figure 32. Total number of connections
experiencing disruption in last 1 year
100
25
75 90
0
20
40
60
80
100
120
Max Min Average Median
%
Population coverage
29
9
18 15
0
10
20
30
40
Max Min Average Median
nu
mb
er
pe
r 10
0 m
iles
Main breaks
9.74
0.03
2.36
0.52
0
2
4
6
8
10
12
Max Min Average Median
%
% connections with interruptions of less than 4 hours in last 1 year
0.41
0.00
0.19 0.20
0.00
0.10
0.20
0.30
0.40
0.50
Max Min Average Median
%
% connections with interruptions between 4-12 hours in last 1 year
0.04
0.00 0.01
0.00 0.00
0.02
0.04
0.06
Max Min Average Median
%
% connections with interruptions of greater than 12 hours in last 1
year
1.94
0.04
0.77 0.54
0
1
1
2
2
3
Max Min Average Median
%
Total number of connections experiencing disruption in last 1
year

35
Figure 33. Total % of tests compliant with
standard for treated water
Figure 34. Total % of required tests done
Figure 35. Total % of aesthetic tests
compliant with standard for treated water
Figure 36. Total % of required aesthetic tests
done
Figure 37. Total % of microbiological tests
compliant with standard for treated water
Figure 38. Total % of required microbiological
tests done
100.00
99.90
99.98 100.00
99.85
99.90
99.95
100.00
100.05
Max Min Average Median
%
Total % of tests compliant with permit conditions for treated
water 483
100 167
100
0
100
200
300
400
500
600
Max Min Average Median
%
Total % of required test done
100.00
99.65
99.91 100.00
99.40
99.60
99.80
100.00
100.20
Max Min Average Median
%
Total % of Aesthetic tests compliant with permit conditions
for treated water 1608
100
603
100
0
500
1000
1500
2000
Max Min Average Median
%
Total % of required Aesthetic test done
100.00
99.96 99.99 100.00
99.90
99.95
100.00
100.05
Max Min Average Median
%
Total % of Microbiological tests compliant with permit conditions
for treated water 229
100 134
103
0
100
200
300
Max Min Average Median
%
Total % of required Microbiological test done

36
4.5 OPERATIONAL PERFORMANCE
Results and analysis:
Those responsible for utility operations can only manage what they measure, so having
information on productivity trends and relative performance enables utility managers to
direct attention to shortfalls (Berg et al, 2007). The indicators for operational
performance evaluate efficient use of resources, reliability, inspection of current assets,
rehabilitation of existing assets, and losses due to low operational performance.
Inefficient or ineffective operations also lead to higher costs.
All the results are summarized in Table 13. Pump inspection shows the percentage of
existing pumps inspected as shown in Figure 43. It was found that a few utilities
inspected all their pumps, while some utilities did not inspect any pumps in the last one
year. Storage tank cleaning shows the percentage of tanks cleaned in the last one year and
the results are summarized in Figure 44 and Figure 45. This indicator shows a lower
number and most of the utilities do not clean all their storage tanks every year. Main
Figure 39. Total % of physical-chemical tests
compliant with standard for treated water
Figure 40. Total % of required physical-
chemical tests done
Figure 41. Total % of radioactive tests
compliant with standard for treated water
Figure 42. Total % of required radioactive tests
done
100.00
99.91
99.98 100.00
99.85
99.90
99.95
100.00
100.05
Max Min Average Median
%
Total % of Physical-chemical tests compliant with permit conditions
for treated water 1083
100
346
100
0
200
400
600
800
1000
1200
Max Min Average Median
%
Total % of required Physical-chemical test done
100 100 100 100
0
20
40
60
80
100
120
Max Min Average Median
%
Total % of Radioactive tests compliant with permit conditions
for treated water 100 100 100 100
0
20
40
60
80
100
120
Max Min Average Median
%
Total % of required Radioactive test done
37
inspection (Figure 46) shows the percentage length of main inspected and the values
show that none of the participating utilities focuses on inspecting the mains, as the value
for this indicator is close to zero for all the utilities. Results for valve inspection show
that most of the utilities do not inspect the valves on a regular basis and change the valves
whenever a problem occurs as summarized in Figure 47. Hydrant inspection shows the
percentage inspected and the results for this indicator show that a few utilities inspect all
the hydrants every year while others do not inspect the hydrants, rather replace the
hydrants when they stop working as summarized in Figure 48.
Indicators for rehabilitation like leakage control shows the number of main breaks
detected and repaired per 100 miles of main. Many utilities showed the value of this
indicator in the range of 20 breaks in 100 miles and the utilities with higher values should
focus on maintenance and rehabilitation of mains as summarized in Figure 49.
Transmission main and distribution main replaced and rehabilitated shows the percentage
of mains replaced and rehabilitated in the last one year. Transmission mains show a
higher value than distribution mains and as summarized in Figure 50 and Figure 51.
Valve replacements, service connection rehabilitation, pump refurbishment, and pump
replacement show the summary of percentage of respective assets as summarized in
Figure 52, Figure 53, Figure 54 and Figure 55.
Water loss includes water lost through leaks, breaks, backwash, flushing, under--
registering meters, etc. Water loss per connection (Figure 56) and percentage of water
lost which was treated in last one year shows values in the range of 7.5 to 27 percent as
summarized in Figure 57. Water loss is a concern for every utility because loss of treated
water is a loss in terms of both money and resources. Non-revenue water can sometimes
be attributable to a poor meter replacement program, because a meter tends to under-
register as it ages. Operational meters indicator shows the percentage of meters which are
working and all the utilities shows a number close to 100 percent for this indicator as
summarized in Figure 58. Unmetered water shows the percentage of water which is not
metered and utilities show an average value around 10 percent for this indicator as
summarized in Figure 59.
The indicators for system flow meter calibration, meter replacement rate, pressure meter
calibration, water level meter calibration, online water quality monitoring equipment
calibration are discarded because there was insufficient data to make conclusions.
One interesting fact about many waterlines around the country was found from the
information gathered. The waterlines installed in 1900-1910 have a reliable service life of
100 to 110 years while those installed in 1930-1950 have a reliable service life of about
75 years. This is due to the better materials used during early nineteenth century. Along
with this, during the 1950s a lot of galvanized lines were installed. As a result, all of the
assets installed between 1900 and 1950 are reaching the end of their reliable service life
at about the same time.
Limitations:
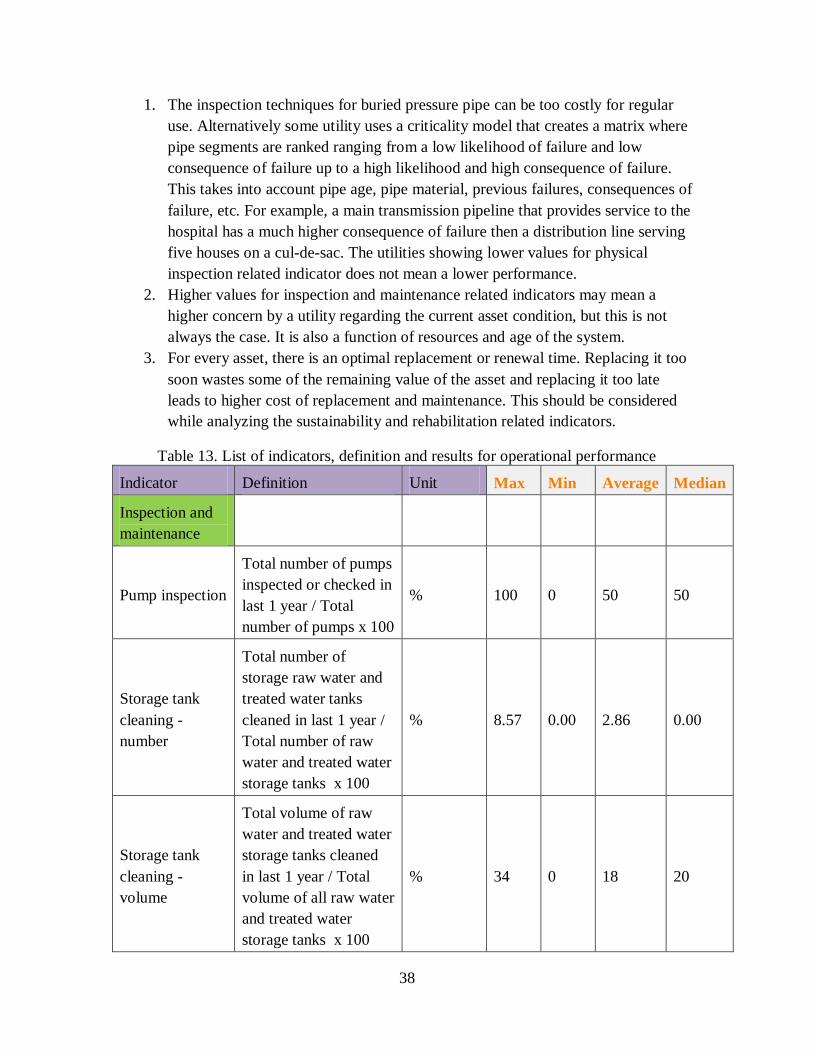
38
1. The inspection techniques for buried pressure pipe can be too costly for regular
use. Alternatively some utility uses a criticality model that creates a matrix where
pipe segments are ranked ranging from a low likelihood of failure and low
consequence of failure up to a high likelihood and high consequence of failure.
This takes into account pipe age, pipe material, previous failures, consequences of
failure, etc. For example, a main transmission pipeline that provides service to the
hospital has a much higher consequence of failure then a distribution line serving
five houses on a cul-de-sac. The utilities showing lower values for physical
inspection related indicator does not mean a lower performance.
2. Higher values for inspection and maintenance related indicators may mean a
higher concern by a utility regarding the current asset condition, but this is not
always the case. It is also a function of resources and age of the system.
3. For every asset, there is an optimal replacement or renewal time. Replacing it too
soon wastes some of the remaining value of the asset and replacing it too late
leads to higher cost of replacement and maintenance. This should be considered
while analyzing the sustainability and rehabilitation related indicators.
Table 13. List of indicators, definition and results for operational performance
Indicator Definition Unit Max Min Average Median
Inspection and
maintenance
Pump inspection
Total number of pumps
inspected or checked in
last 1 year / Total
number of pumps x 100
% 100 0 50 50
Storage tank
cleaning -
number
Total number of
storage raw water and
treated water tanks
cleaned in last 1 year /
Total number of raw
water and treated water
storage tanks x 100
% 8.57 0.00 2.86 0.00
Storage tank
cleaning -
volume
Total volume of raw
water and treated water
storage tanks cleaned
in last 1 year / Total
volume of all raw water
and treated water
storage tanks x 100
% 34 0 18 20

39
Main inspection
Total length of
transmission and
distribution main pipes
inspected - physical
inspection for proper
working condition,
internal inspection by
video, flow
measurements to
calculate head loss etc.
/ Total length of mains
x 100
% 0.29 0.00 0.10 0.01
Valve
Inspection
Number of valves
inspected - checked to
insure it is operational /
Total number of valves
x 100
% 14 4 9 9
Hydrant
inspection
Number of hydrants
inspected - checked to
insure it is operational /
Total number of
hydrants x 100
% 100 7 59 65
Sustainability/
rehabilitation
Leakage control
number of leaks or
main breaks detected
and repaired - in last 1
year / total length of
main x 100
number /
100 miles 31 9 21 20
Transmission
Main replaced /
rehabilitated - in
last 1 year
length of transmission
mains replaced or
rehabilitated- in last 1
year (miles) / Total
length of transmission
mains (miles) x 100
% 16.52 0.00 5.84 1.00
Distribution
Main replaced /
length of distribution
mains replaced or % 1.00 0.02 0.37 0.10
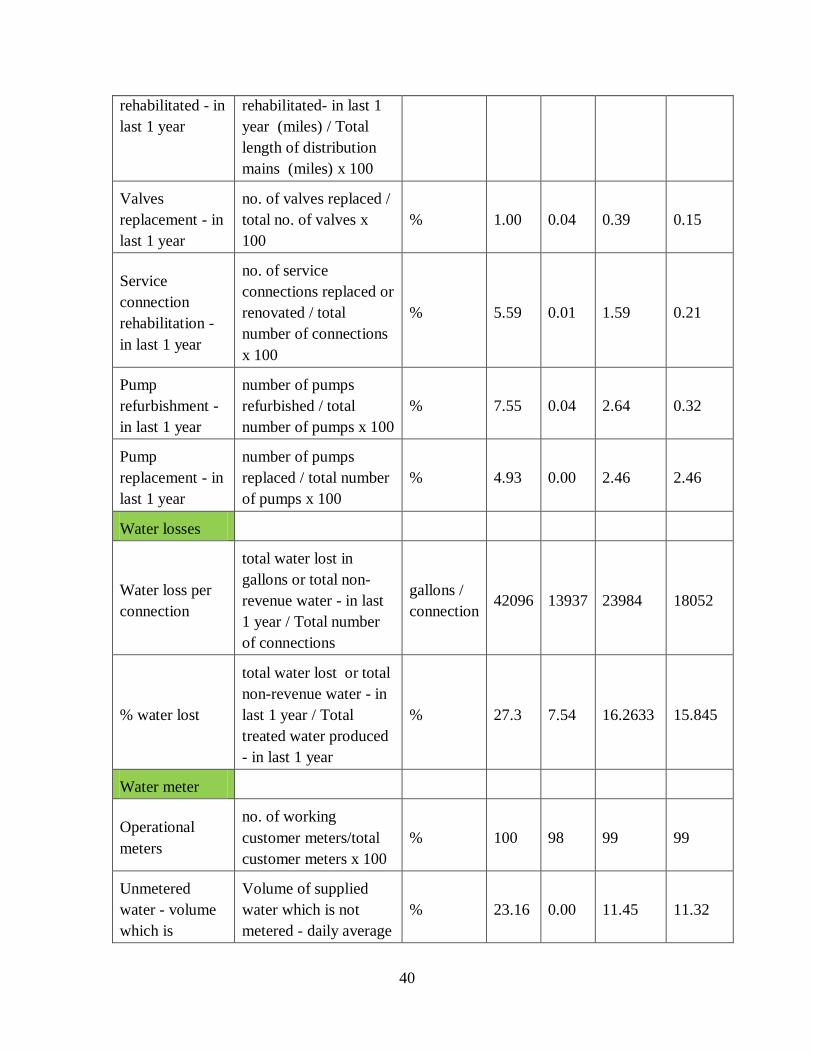
40
rehabilitated - in
last 1 year
rehabilitated- in last 1
year (miles) / Total
length of distribution
mains (miles) x 100
Valves
replacement - in
last 1 year
no. of valves replaced /
total no. of valves x
100
% 1.00 0.04 0.39 0.15
Service
connection
rehabilitation -
in last 1 year
no. of service
connections replaced or
renovated / total
number of connections
x 100
% 5.59 0.01 1.59 0.21
Pump
refurbishment -
in last 1 year
number of pumps
refurbished / total
number of pumps x 100
% 7.55 0.04 2.64 0.32
Pump
replacement - in
last 1 year
number of pumps
replaced / total number
of pumps x 100
% 4.93 0.00 2.46 2.46
Water losses
Water loss per
connection
total water lost in
gallons or total non-
revenue water - in last
1 year / Total number
of connections
gallons /
connection 42096 13937 23984 18052
% water lost
total water lost or total
non-revenue water - in
last 1 year / Total
treated water produced
- in last 1 year
% 27.3 7.54 16.2633 15.845
Water meter
Operational
meters
no. of working
customer meters/total
customer meters x 100
% 100 98 99 99
Unmetered
water - volume
which is
Volume of supplied
water which is not
metered - daily average
% 23.16 0.00 11.45 11.32

41
charged but not
metered
/ Total volume of
treated water supplied -
daily average x 100
Figure 43. Pump inspection
Figure 44. Storage tank cleaning -
number
Figure 45. Storage tank cleaning - volume
Figure 46. Main inspection
100
0
50 50
0
20
40
60
80
100
120
Max Min Average Median
%
Pump inspection
8.57
0.00
2.86
0.00 0
2
4
6
8
10
Max Min Average Median
%
Storage tank cleaning - number
34
0
18 20
0
10
20
30
40
Max Min Average Median
%
Storage tank cleaning - volume
0.29
0.00
0.10
0.01 0.00
0.10
0.20
0.30
0.40
Max Min Average Median
%
Main inspection

42
Figure 47. Valve inspection
Figure 48. Hydrant inspection
Figure 49. Leakage control
Figure 50. Transmission main replaced /
rehabilitated - in last 1 year
Figure 51. Distribution main replaced /
rehabilitated - in last 1 year
Figure 52. Valves replacement - in last 1
year
14
4
9 9
0
5
10
15
Max Min Average Median
%
Valve Inspection
100
7
59 65
0
20
40
60
80
100
120
Max Min Average Median
%
Hydrant inspection
31
9
21 20
0
5
10
15
20
25
30
35
Max Min Average Median
nu
mb
er /
100
mile
s
Leakage control
16.52
0.00
5.84
1.00
0
5
10
15
20
Max Min Average Median
%
Transmission Main replaced / rehabilitated - in last 1 year
1.00
0.02
0.37
0.10
0.00
0.50
1.00
1.50
Max Min Average Median
%
Distribution Main replaced / rehabilitated - in last 1 year
1.00
0.04
0.39
0.15
0.00
0.20
0.40
0.60
0.80
1.00
1.20
Max Min Average Median
%
Valves replacement - in last 1 year

43
Figure 53. Service connection
rehabilitation - in last 1 year
Figure 54. Pump refurbishment - in last 1
year
Figure 55. Pump replacement - in last 1
year
Figure 56. Annual water loss per
connection
Figure 57. % water loss
Figure 58. Working operational meters
5.59
0.01
1.59
0.21
0
1
2
3
4
5
6
Max Min Average Median
%
Service connection rehabilitation - in last 1 year
7.55
0.04
2.64
0.32
0
2
4
6
8
Max Min Average Median
%
Pump refurbishment - in last 1 year
4.93
0.00
2.46 2.46
0
1
2
3
4
5
6
Max Min Average Median
%
Pump replacement - in last 1 year
42096
13937 23984
18052
0
20000
40000
60000
Max Min Average MedianGal
lon
/ c
pm
mec
tio
n /
ye
ar
Annual Water loss per connection
27.3
7.54
16.26 15.84
05
1015202530
Max Min Average Median
%
% water lost
100
98
99 99
97
98
98
99
99
100
100
101
Max Min Average Median
%
Working Operational meters
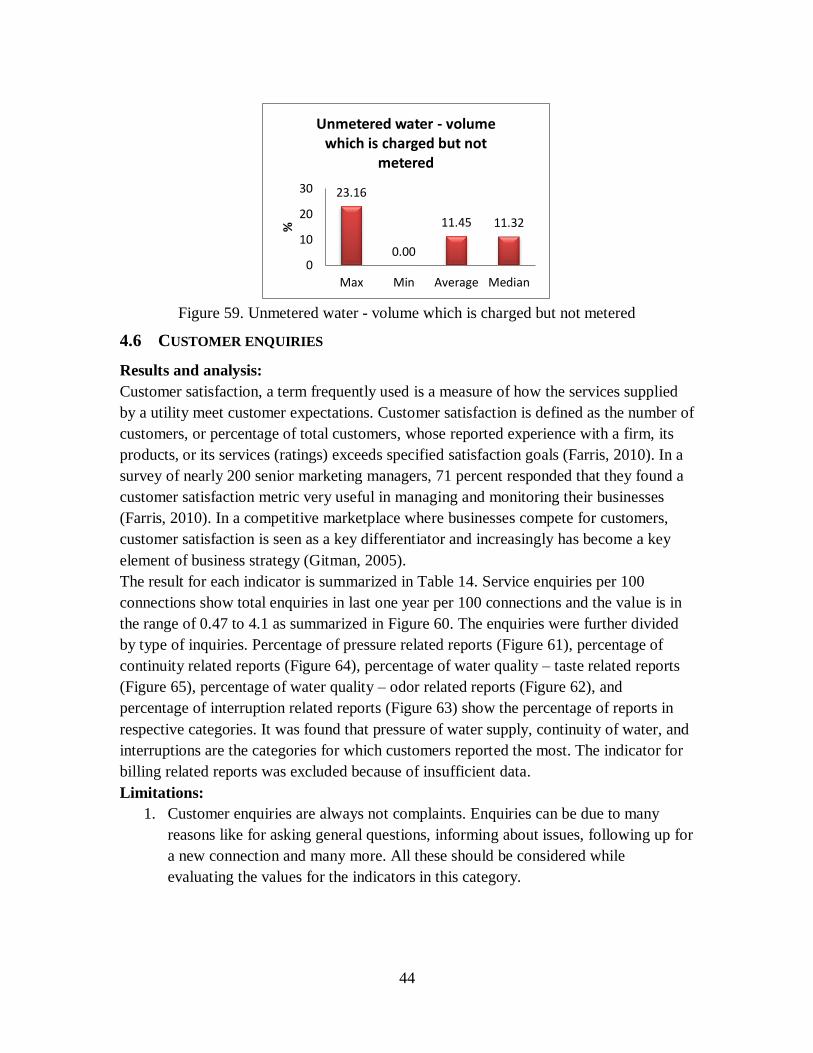
44
Figure 59. Unmetered water - volume which is charged but not metered
4.6 CUSTOMER ENQUIRIES
Results and analysis:
Customer satisfaction, a term frequently used is a measure of how the services supplied
by a utility meet customer expectations. Customer satisfaction is defined as the number of
customers, or percentage of total customers, whose reported experience with a firm, its
products, or its services (ratings) exceeds specified satisfaction goals (Farris, 2010). In a
survey of nearly 200 senior marketing managers, 71 percent responded that they found a
customer satisfaction metric very useful in managing and monitoring their businesses
(Farris, 2010). In a competitive marketplace where businesses compete for customers,
customer satisfaction is seen as a key differentiator and increasingly has become a key
element of business strategy (Gitman, 2005).
The result for each indicator is summarized in Table 14. Service enquiries per 100
connections show total enquiries in last one year per 100 connections and the value is in
the range of 0.47 to 4.1 as summarized in Figure 60. The enquiries were further divided
by type of inquiries. Percentage of pressure related reports (Figure 61), percentage of
continuity related reports (Figure 64), percentage of water quality – taste related reports
(Figure 65), percentage of water quality – odor related reports (Figure 62), and
percentage of interruption related reports (Figure 63) show the percentage of reports in
respective categories. It was found that pressure of water supply, continuity of water, and
interruptions are the categories for which customers reported the most. The indicator for
billing related reports was excluded because of insufficient data.
Limitations:
1. Customer enquiries are always not complaints. Enquiries can be due to many
reasons like for asking general questions, informing about issues, following up for
a new connection and many more. All these should be considered while
evaluating the values for the indicators in this category.
23.16
0.00
11.45 11.32
0
10
20
30
Max Min Average Median%
Unmetered water - volume which is charged but not
metered

45
Table 14. List of indicators, definition and results for customer enquiries
Indicator Definition Unit Max Min Average Median
Service
enquiries per
100
connection
total number of
enquiries - in last 1
year / total number of
connections
number /
100
connection
4.10 0.47 1.93 1.68
Pressure
related
reports
no. of pressure related
reports - in last 1 year
/ total no. of reports x
100
% 42.26 0.23 12.47 4.00
Continuity
related
reports
no. of Continuity
related reports - in last
1 year / total no. of
reports x 100
% 57.58 0.57 19.62 0.70
Water quality
- taste related
reports
no. of taste related
reports - in last 1 year
/ total no. of reports x
100
% 3.23 0.03 1.16 1.01
Water quality
- odor related
reports
no. of odor related
reports - in last 1 year
/ total no. of reports x
100
% 1.77 0.30 1.27 1.74
Interruption
related
reports
no. of Interruption
related reports - in last
1 year / total no. of
reports x 100
% 57.58 1.20 17.50 5.61

46
Figure 60. Service enquiries per 100
connection
Figure 61. Pressure related reports
Figure 64. Continuity related reports
Figure 65. Water quality - taste related
reports
4.10
0.47
1.93 1.68
0
1
2
3
4
5
Max Min Average Mediannu
mb
er
/ 10
0 co
nn
ect
ion
s
Service enquiries per 100 connection
42.26
0.23
12.47
4.00
0
10
20
30
40
50
Max Min Average Median
%
Pressure related reports
57.58
0.57
19.62
0.70 0
10
20
30
40
50
60
70
Max Min Average Median
%
Continuity related reports
3.23
0.03
1.16 1.01
0
1
2
3
4
Max Min Average Median
%
Water quality - taste related reports
Figure 62. Water quality - odor related
reports
Figure 63. Interruption related reports
1.77
0.30
1.27
1.74
0.00
0.50
1.00
1.50
2.00
Max Min Average Median
%
Water quality - odor related reports
57.58
1.20
17.50
5.61
0
20
40
60
80
Max Min Average Median
%
Interruption related reports

47
4.7 FINANCIAL PERFORMANCE
Results and analysis:
Measuring the results of a utility's policies and operations in monetary terms is a
definition of financial performance. Financial results are reflected in the utility's return on
investment, return on assets, value added, total cost, revenue generated, cost coverage,
profit, etc. Financial performance is a measure of how well a utility can use assets from
its primary mode of business and generate revenues. This term is also used as a general
measure of a utility's overall financial health over a given period of time. Consideration
of financial sustainability includes examining the role of revenues, and expenses affect
overall performance. Key financial ratios serve as indicators of long term performance, as
revenues can be used to facilitate future capacity investments for both network expansion
and external funding can be contingent on current cash flows more than covering
operating expenses (Berg et al, 2007).
The result for each indicator is summarized in Table 15. The indicators for the revenue
section summarize revenue per million gallons of treated water produced as shown in
Figure 66. Revenue is further divided into percentage of sales revenue (Figure 67) and
percentage of other revenue (Figure 68) which includes earnings from supply of raw
water and others. It was observed that major percent of revenue is collected from sales for
all the utilities. The indicators for the cost summarizes total cost per million gallons
treated water produced (Figure 69), capital cost per million gallons of water produced
(Figure 70), and operating cost per million gallons of water produced (Figure 71). The
summary of percentage of operation cost is summarized by the type operation and is
summarized in Figure 72 for transmission, storage and distribution, Figure 73 for
treatment and testing, Figure 74 for energy cost, Figure 75 meter management and
connection cost and Figure 76 for any other operational cost. It was observed that the
percentage of operational cost for transmission, storage, distribution and water treatment
and testing shows higher values as expected because these are the main functions of
utilities.
Expenses related indicators summarize total expenses per million gallons of water
produced as summarized in Figure 77, percentage of expenses on new assets is
summarized in Figure 78 and percentage of total expenses on replacement and renovation
is summarized in Figure 79. For all the utilities it was observed that majority of expenses
was for new assets. Average water charge from direct consumption is summarized in
Figure 80. Rate which utility charges the consumer (Figure 81) was collected from
utilities and the values change depending on the cost of treatment and operation. Total
cost coverage (Figure 82), operational cost coverage (Figure 83), current ratio (Figure
84), asset turnover ratio (Figure 85), and water loss cost - non revenue water cost (Figure
86) are indicators for the efficiency. Earnings per million gallons of treated water
produced shows the earnings of utility per million gallons of water produced and the

48
results are summarized in Figure 87. It was observed that a few utilities have a zero value
for the indicator related to earnings; this is because these utilities are publically owned
and cannot make net income.
It was observed that some utilities are experiencing a trend in reduction of demand and
this is expected to continue in the forecast, while population is expected to increase.
Various factors contributing to the reduction in demand included conservation programs,
water and sewer rates, and improved system operations. One utility reported that in the
last five years the average household consumption decrease from 6.53 hcf (4880 gallons)
per month to 5.62 hcf (4200 gallons) per month. While from a conservation standpoint
this is perceived as a good thing, but it is creating significant challenges to the utilities.
For the utility, revenues in both water and sewer fund went down by approximately $1
million since last year and the city council was reluctant to raise water and sewer rates.
But in this economic climate, any increases they approve can only cover rising
operational costs. As a result, the utility had to significantly cut back the capital
improvement programs (CIP). For example in the sewer fund the utility reduced the
annual CIP from $20-$25 million down to $2 - $3 million at a time where infrastructure
investment is critical for long term sustainability.
Limitations:
1. A higher value of revenue related indicators does not mean better financial
performance because these values change with the cost involved. It is also
dependent on the size and location of the utilities. Although, higher revenues are
preferred but does not tell the entire story.
2. A lower value of cost related indicators does not necessarily mean better financial
performance because cost is dependent on many factors like total population
served, size of utility, location of utility and others. Cost is also dependent on
revenue generated, so variation of cost should be considered with the variation of
revenue.
Table 15. List of indicators, definition and results for financial performance
Indicator Definition Unit Max Min Average Median
Revenue
Revenue per Mgal
treated water
produced - in last 1
year
Total revenue in last
1 year / Total treated
water produced in
last 1 year
$ /
Mgal 6083 1045 3109 3189
Sales revenue in
last 1 year
revenue generated
by sales / Total
revenue x 100
% 98.46 76.00 89.93 94.08

49
Other revenue in
last 1 year
revenue generated
which are not from
sales / Total revenue
x 100
% 67.67 1.54 17.27 10.12
Cost
Total cost per
Mgal treated water
produced - in last 1
year
Capital cost plus
Operating cost - in
last 1 year / Total
treated water
produced in last 1
year
$ /
Mgal 3638 975 2473 2394
Capital cost per
Mgal treated water
produced - in last 1
year
Total Capital cost in
last 1 year / Total
treated water
produced in last 1
year
$ /
Mgal 1847 126 995 1065
Operating cost per
Mgal treated water
produced - in last 1
year
Total Operating cost
in last 1 year / Total
treated water
produced in last 1
year
$ /
Mgal 5113 688 1930 1581
% Operational
Cost by type
% of
Transmission,
storage and
distribution cost -
in last 1 year
total cost related to
Transmission,
storage and
distribution process
/ Total Operational
cost
% 30 18 24 23
% of Water
Treatment and
water testing cost -
in last 1 year
total cost related to
Water Treatment
and water testing /
Total Operational
cost
% 37 31 35 37
% of Energy / total cost related to % 14 9 11 11

50
Electricity used
cost - in last 1 year
Energy / Electricity
used / Total
Operational cost
% of Meter
management and
connection related
cost - in last 1 year
total cost related to
Meter management
and connection
related / Total
Operational cost
% 10 1.16 7 10
Any other
operational cost -
in last 1 year
any other cost /
Total Operational
cost
% 32 10 23 26
Expenses on assets
Total expenses -
in last 1 year
Total expenses on
plant and equipment
– new / replacement
/ renovation - In the
last 1 year / Total
treated water
produced in last 1
year
$ /
Mgal 1847 591 1203 1242
% on New assets -
in last 1 year
Expenses on new
assets / Total
expenses x 100
% 100 29 72 86
% on Replacement
and renovation - in
last 1 year
Expenses on
replacement and
renovation of
existing assets /
Total expenses x100
% 35 14 25 25
Water rate
(calculated using
sales revenue and
water produced)
Average Water
charges from direct
consumption
Total Sales revenue
- in last 1 year /
Total treated water
produced in last 1
year
$ /
Mgal 3929 1966 2724 2519
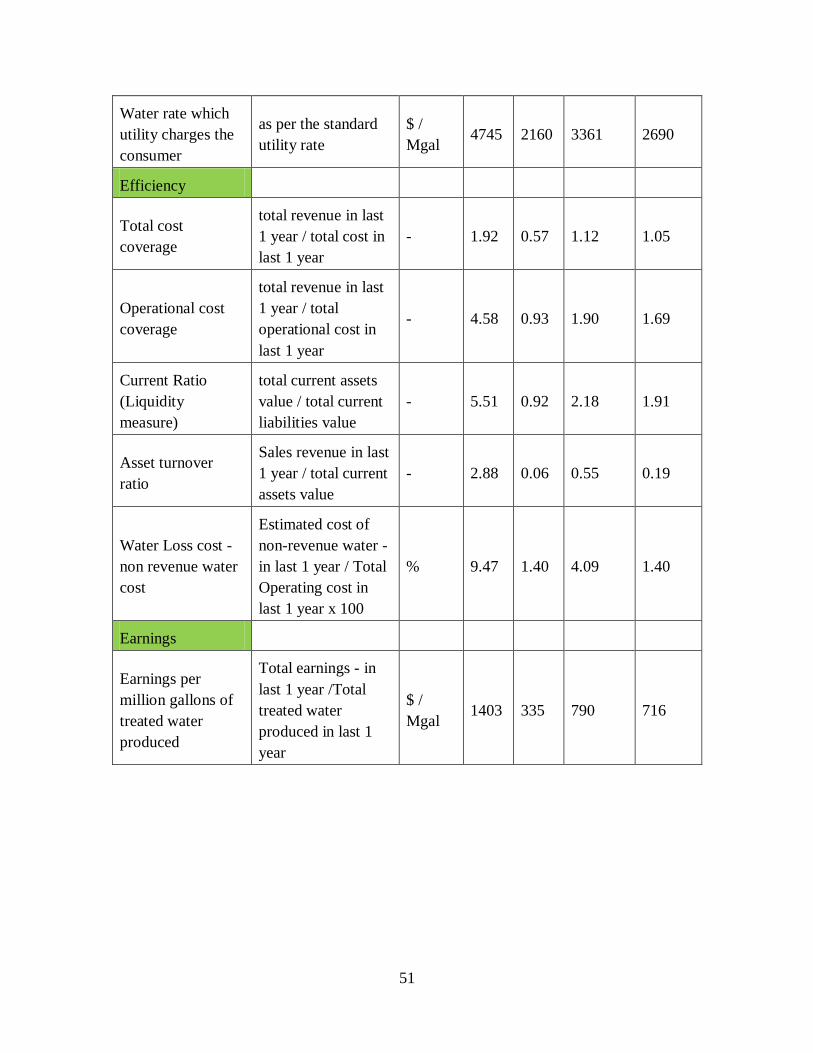
51
Water rate which
utility charges the
consumer
as per the standard
utility rate
$ /
Mgal 4745 2160 3361 2690
Efficiency
Total cost
coverage
total revenue in last
1 year / total cost in
last 1 year
- 1.92 0.57 1.12 1.05
Operational cost
coverage
total revenue in last
1 year / total
operational cost in
last 1 year
- 4.58 0.93 1.90 1.69
Current Ratio
(Liquidity
measure)
total current assets
value / total current
liabilities value
- 5.51 0.92 2.18 1.91
Asset turnover
ratio
Sales revenue in last
1 year / total current
assets value
- 2.88 0.06 0.55 0.19
Water Loss cost -
non revenue water
cost
Estimated cost of
non-revenue water -
in last 1 year / Total
Operating cost in
last 1 year x 100
% 9.47 1.40 4.09 1.40
Earnings
Earnings per
million gallons of
treated water
produced
Total earnings - in
last 1 year /Total
treated water
produced in last 1
year
$ /
Mgal 1403 335 790 716

52
Figure 66. Revenue per Mgal treated water
produced - in last 1 year
Figure 67. Sales revenue in last 1 year
Figure 68. Other revenue in last 1 year
Figure 69. Total cost per Mgal treated
water produced - in last 1 year
Figure 70. Capital cost per Mgal treated
water produced - in last 1 year
Figure 71. Operating cost per Mgal treated
water produced - in last 1 year
6083
1045
3109 3189
0
2000
4000
6000
8000
Max Min Average Median
$ /
Mga
l Revenue per Mgal treated water
produced - in last 1 year 98.46
76.00 89.93 94.08
0
20
40
60
80
100
120
Max Min Average Median
%
% of Sales revenue in last 1 year
67.67
1.54
17.27 10.12
0
20
40
60
80
Max Min Average Median
%
% of Other revenue in last 1 year
3638
975
2473 2394
0
1000
2000
3000
4000
Max Min Average Median
$ /
Mga
l
Total cost per Mgal treated water produced - in last 1 year
1847
126
995 1065
0
500
1000
1500
2000
Max Min Average Median
$ /
Mga
l
Capital cost per Mgal treated water produced - in last 1 year
5113
688
1930 1581
0
2000
4000
6000
Max Min Average Median
$ /
Mga
l
Operating cost per Mgal treated water produced - in last 1 year

53
Figure 72. % of transmission, storage and
distribution cost - in last 1 year
Figure 73. % of water treatment and water
testing cost - in last 1 year
Figure 74. % of energy / electricity used
cost - in last 1 year
Figure 75. % of meter management and
connection related cost - in last 1 year
Figure 76. Any other operational cost - in
last 1 year
Figure 77. Total investment per Mgal of
water produced - in last 1 year
30
18 24 23
0
10
20
30
40
Max Min Average Median
%
% of Transmission, storage and distribution cost - in last 1 year
37
31
35
37
28
30
32
34
36
38
Max Min Average Median
%
% of Water Treatment and water testing cost - in last 1 year
14
9 11 11
0
5
10
15
Max Min Average Median
%
% of Energy / Electricity used cost - in last 1 year
10
1.16
7 10
0
5
10
15
Max Min Average Median
%
% of Meter management and connection related cost - in last 1
year
32
10
23 26
0
10
20
30
40
Max Min Average Median
%
Any other operational cost - in last 1 year
1847
591
1203 1242
0
500
1000
1500
2000
Max Min Average Median
$ /
Mga
l
Total expenses per Mgal of water produced - in last 1 year

54
Figure 78. % on new assets - in last 1 year
Figure 79. % on replacement and
renovation - in last 1 year
Figure 80. Average water charges from
direct consumption
Figure 81. Water rate which utility charges
the consumer
Figure 82. Total cost coverage
Figure 83. Operational cost coverage
100
29
72 86
0
20
40
60
80
100
120
Max Min Average Median
%
% on New assets - in last 1 year
35
14
25 25
0
10
20
30
40
Max Min Average Median
%
% on Replacement and renovation - in last 1 year
3929
1966
2724 2519
0
1000
2000
3000
4000
5000
Max Min Average Median
$ /
Mga
l
Average Water charges from direct consumption
4745
2160
3361 2690
0
1000
2000
3000
4000
5000
Max Min Average Median
$ /
Mga
l
Water rate which utility charges the consumer
1.92
0.57
1.12 1.05
0.00
0.50
1.00
1.50
2.00
2.50
Max Min Average Median
-
Total cost coverage
4.58
0.93
1.90 1.69
0
1
2
3
4
5
Max Min Average Median
-
Operational cost coverage

55
Figure 84. Current ratio (liquidity measure)
Figure 85. Asset turnover ratio
Figure 86. Water loss cost - non revenue
water cost
Figure 87. Earnings per million gallons of
treated water produced
5.51
0.92
2.18 1.91
0
1
2
3
4
5
6
Max Min Average Median
-
Current Ratio
2.88
0.06
0.55 0.19
0.00
0.50
1.00
1.50
2.00
2.50
3.00
3.50
Max Min Average Median
-
Asset turnover ratio
9.47
1.40
4.09
1.40
0
2
4
6
8
10
Max Min Average Median
%
Water Loss cost - non revenue water cost
1403
335
790 716
0
500
1000
1500
Max Min Average Median
$ /
Mga
l
Earnings per million gallon of treated water produced

56
CHAPTER 5. PERFORMANCE BENCHMARKING RESULTS, ANALYSIS
AND LIMITATIONS – WASTEWATER UTILITIES
The indicators were defined based on research papers, books and reports on
benchmarking along with suggestions of utility personnel. The defined indicators
represent seven key areas and a total 89 indicators were used for data collection. The
collected data for this study is from 2011-2012. A committee consisting of
representatives of wastewater utilities and consultants was formed to review the results.
The committee members are experts from the wastewater industry, and provided their
feedback about the results.
The graphs show the maximum, minimum, average and median value for the data
collected for each indicator from all the 9 wastewater utilities. The results are also
available on WATERiD website and continuous data collection will be performed using
the web-based benchmarking data collection and result visualization platform. This will
enable the database to grow and will result in better database for future benchmarking.
Further, each graph has the maximum, minimum, average and median value for the
indicator and the definition is described below:
Maximum value: maximum of all the values collected from utilities for the indicator.
Minimum value: minimum of all the values collected from utilities for the indicator.
Average value: average of all the values collected from utilities for the indicator.
Median value: median of all the values collected from utilities for the indicator.
5.1 WASTEWATER AND BIOSOLIDS
Results and analysis:
The indicators in this category evaluate the performance related to environmental
impacts, including compliance with discharge consents, reuse of wastewater, and disposal
of Biosolids produced.
The result for each indicator is summarized in Table 16. It was found that most of the
utilities have a high value for compliance with discharge consent which is the percentage
of population equivalent (PE) served by wastewater plant complying with discharge
consents as summarized in Figure 88. PE for industrial waste is a quantitative expression
of the population load of commercial or industrial wastewater in terms of the number of
equivalent people that would create a waste of the same strength. One PE corresponds to
the population load of sewage generated by one inhabitant. Usually it corresponds to
BOD5 loads. BOD5 is defined as the biochemical oxygen demand of wastewater during
decomposition occurring over a 5-day period. Percentage for reuse of treated wastewater
shows a low percentage for most of the utilities as summarized in Figure 89. Percentage
for use of biosolids which are produced (Figure 90) by a wastewater treatment plant
shows an irregular trend among utilities and the value changes with the size of service

57
area and population served. Biosolids use (Figure 91) and biosolids disposal (Figure 92)
show irregular behavior for different utilities. A few utilities show higher values for
biosolids use and low values for biosolids disposal and a few utilities show the opposite
trends. The utilities with higher biosolids disposal can supply it for agriculture, products,
materials, etc.
Limitations:
1. One key issue found related to wastewater reuse was that reuse regulations may
impact a plant potential for reuse. For example, a utility explored the possibility
of reuse and found that there are at least two different levels of treatment required
depending upon the reuse application. In such case, the end user would have had
personnel exposed to the reclaimed water, and this would have required
significantly more treatment of the effluent and can make the project cost-
prohibitive. A benefit of reuse is in areas where there are nutrient limit, reuse of
the wastewater reduces the amount of nitrogen and phosphorus being discharged.
This may help plants meet permit limits and generate nitrogen and phosphorus for
nutrient trading, which can be an additional source of revenue.
Table 16. List of indicators, definition and results for wastewater and Biosolids
Indicator Definition Unit Max Min Average Median
Wastewater
Compliance
with
discharge
consents - last
1 year
current number of
Population Equivalent (PE)
served by WW treatment
plant complying with
discharge consents / Total
Population Equivalent (PE)
served x 100
% 100.00 43.48 81.80 100.00
Reuse
volume of wastewater reused
after treatment in last 1 year
/ Total volume of
wastewater treated in last 1
year x 100
% 8.10 0.00 1.59 0.00
Biosolids
Biosolid
production
dry weight of biosolids
produced in last 1 year /
Total Population Equivalent
(PE) served
lbs /
PE /
year
153.39 42.05 66.85 51.71

58
Biosolid use
dry weight of produced
biosolids used for
agriculture, products,
materials etc. - in last 1 year
/ dry weight of Biosolids
produced in last 1 year x 100
% 100.00 0.00 33.28 10.26
Biosolid
disposal
dry weight of Biosolids
disposed - in last 1 year / dry
weight of Biosolids
produced in last 1 year x 100
% 100.00 0.00 52.77 51.74
Figure 88. Compliance with discharge
consents - last 1 year
Figure 89. Reuse
Figure 90. Biosolids production
Figure 91. Biosolids use
100.00
43.48
90.58 100.00
0.00
50.00
100.00
150.00
Max Min Average Median
%
Compliance with discharge consents - last 1 year
8.10
0.00
1.59
0.00 0
2
4
6
8
10
Max Min Average Median
%
Reuse
153.39
42.05 66.85
51.71
0
50
100
150
200
Max Min Average Median
lbs/
PE/
year
biosolids production
100.00
0.00
33.28
10.26
0
20
40
60
80
100
120
Max Min Average Median
%
biosolids use

59
Figure 92. Biosolids disposal
5.2 EMPLOYEE INFORMATION
Results and analysis:
Employee related indicators are used to evaluate the efficiency and effectiveness of the
wastewater utility’s employees. Lin (2005), Berg and Lin (2007), Alsharif et al. (2008),
Lonborg (2005), Mugisha (2007), Lambert et al. (1993), Aida et al. (1998), and Tupper
and Resende (2004) are among researches who have considered number of employees (or
labor or staff) as one of the inputs in their studies.
The results for each indicator are summarized in Table 17. Total employees per 1000
population equivalents served (Figure 93) shows higher values for smaller and medium
sized utilities, and lower values for big sized utilities; the same is true for employee per
million gallons of wastewater treated (Figure 94). Percentage of employees in higher
management (Figure 95), human resources (Figure 96), financial and commercial (Figure
97), customer service (Figure 98), planning, designing and construction (Figure 99) and
wastewater quality monitoring (lab personnel) (Figure 101) are low. Percentage of
operations and maintenance employees (Figure 100) show higher value for all the utilities
since this is the main function of a wastewater utility.
Personnel training show irregular trends for utilities as summarized in Figure 102.
Working accidents is calculated as percentage of employees injured in the last 1 year.
Absentees due to accidents shows higher values for a few utilities which is an area of
concern as summarized in Figure 103 and Figure 104. Utilities with higher values in this
category should first determine the reasons for poor safety and then implement programs
to improve safety. Vaccination shows irregular results as shown in Figure 105 and a few
utilities show very low values for this indicator.
Limitations:
1. Functions like HR and Finance staff vary significantly between municipalities vs.
wastewater authorities. In a municipality, many of these functions are provided in
the general fund, and the utility then pays a PILOT (payment in lieu of taxes)
and/or makes a transfer of funds to the general fund for indirect costs. In an
authority they usually have those positions on staff.
100.00
0.00
52.77 51.74
0
20
40
60
80
100
120
Max Min Average Median
%
biosolid disposal

60
Table 17. List of indicators, definition and results for employee information
Indicator Definition Unit Max Min Average Median
Total
employee
Employee per
1000
population
equivalent
served
total no. of employees / total
population equivalent served
x 1000
number /
1000 3.26 0.14 1.03 0.91
Employee per
million
gallons of
wastewater
treated
total no. of employees /
Million gallons of
wastewater treated daily
number /
Mgal 9.57 1.39 5.05 4.68
Employee as
per function
Higher
management
employees
number of full time
equivalent employees
dedicated to directors,
central administration,
strategic planning, marketing
and communications, legal
affairs, environmental
management, business
development / total number
of employee x 100
% 23.81 0.65 7.83 3.43
Human
resources
employees
number of full time
employees dedicated to
personnel administration,
education and training,
occupational safety and
social activities / total
number of employee x 100
% 4.76 0.83 2.26 1.72

61
Financial and
commercial
employees
number of full time
equivalent employees
dedicated to economic and
financial planning, economic
administration, economic
controlling and purchasing /
total number of employee x
100
% 4.00 1.39 2.39 2.09
Customer
Service
employees
number of full time
equivalent employees
dedicated to customer
relations / total number of
employee x 100
% 13.52 2.00 9.39 12.64
Planning,
designing and
construction
employees
number of employees
working in planning,
designing & construction /
total number of employee x
100
% 16.67 3.77 9.71 7.50
Operations
and
maintenance
employees
number of employees
working in operations &
maintenance of the utility /
total number of employee x
100
% 66.84 25.83 50.64 59.24
Wastewater
quality
monitoring
employees
(lab
personnel)
number of lab testing
employees / total number of
employee x 100
% 11.18 1.59 4.76 3.14
Training
Personnel
training
total training hours for all the
employees in last 1 year /
total number of employees
hours /
employee
/ year
147.80 5.00 40.54 20.04
Personnel
health and

62
safety
Working
accidents - %
of employees
injured in last
1 year (%)
number of employees injured
on the job in the last 1 year /
total number of employees x
100
% 9.72 3.00 6.15 6.24
Absences due
to accidents
sum of all the absences due
to all the employees due to
reasons related to accident in
last 1 year / total number of
employees
days /
employee
/ year
1.36 0.15 0.63 0.50
Vaccination
total number of maintenance,
operations and lab testing
employees with vaccination
for sewage and waste related
diseases / total number of
employees in maintenance,
operations and lab testing x
100
% 100.00 0.00 51.90 44.79
Figure 93. Employee per 1000 population
equivalent served
Figure 94. Employee per million gallons of
wastewater treated daily
3.26
0.14
1.03 0.91
0
1
2
3
4
Max Min Average Median
nu
mb
er /
100
0
Employee per 1000 population equivalent served
9.57
1.39
5.05 4.68
0
5
10
15
Max Min Average Median
nu
mb
er /
Mga
l
Employee per million gallon of wastewater treated daily
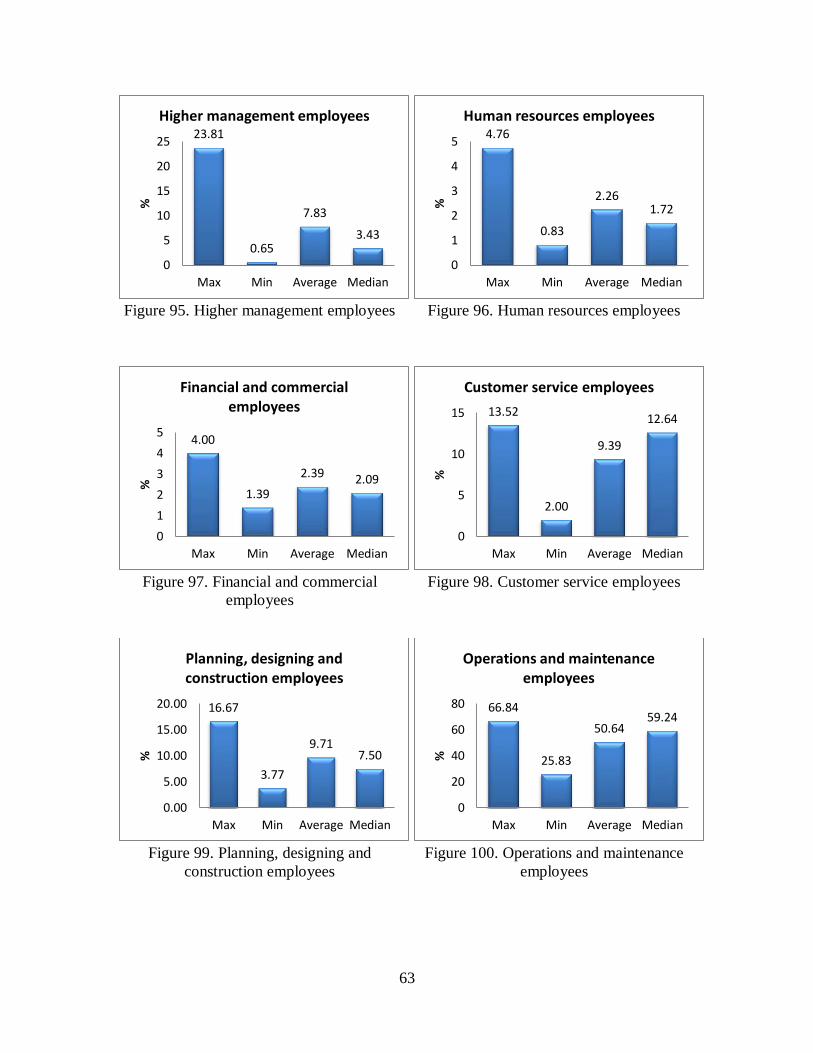
63
Figure 95. Higher management employees
Figure 96. Human resources employees
Figure 97. Financial and commercial
employees
Figure 98. Customer service employees
Figure 99. Planning, designing and
construction employees
Figure 100. Operations and maintenance
employees
23.81
0.65
7.83
3.43
0
5
10
15
20
25
Max Min Average Median
%
Higher management employees 4.76
0.83
2.26 1.72
0
1
2
3
4
5
Max Min Average Median
%
Human resources employees
4.00
1.39
2.39 2.09
0
1
2
3
4
5
Max Min Average Median
%
Financial and commercial employees 13.52
2.00
9.39
12.64
0
5
10
15
Max Min Average Median
%
Customer service employees
16.67
3.77
9.71 7.50
0.00
5.00
10.00
15.00
20.00
Max Min Average Median
%
Planning, designing and construction employees
66.84
25.83
50.64 59.24
0
20
40
60
80
Max Min Average Median
%
Operations and maintenance employees

64
Figure 101. Wastewater quality monitoring
employees (lab personnel)
Figure 102. Personnel training
Figure 103. Working accidents - % of
employees injured in last 1 year
Figure 104. Absences due to accidents
Figure 105. Vaccination
11.18
1.59
4.76 3.14
0
5
10
15
Max Min Average Median
%
Wastewater quality monitoring employees (lab personnel)
147.80
5.00
40.54 20.04
0
50
100
150
200
Max Min Average Median
ho
urs
/ e
mp
loye
e /
year
Personnel training
9.72
3.00
6.15 6.24
0
5
10
15
Max Min Average Median
%
workinga accidents - % of employees injured in last 1 year 1.36
0.15
0.63 0.50
0.00
0.50
1.00
1.50
Max Min Average Median
day
s /
emp
loye
e /
year
Absences due to accidents
100.00
0.00
61.76 69.00
0.00
20.00
40.00
60.00
80.00
100.00
120.00
Max Min Average Median
%
Vaccination
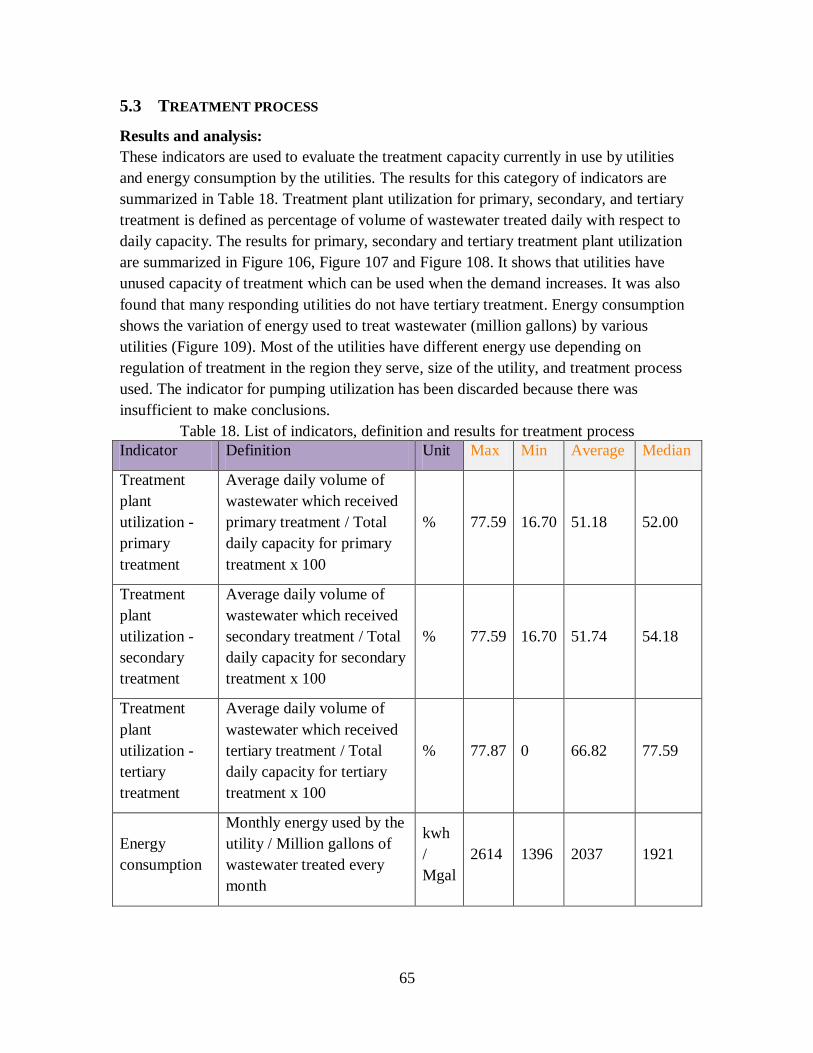
65
5.3 TREATMENT PROCESS
Results and analysis:
These indicators are used to evaluate the treatment capacity currently in use by utilities
and energy consumption by the utilities. The results for this category of indicators are
summarized in Table 18. Treatment plant utilization for primary, secondary, and tertiary
treatment is defined as percentage of volume of wastewater treated daily with respect to
daily capacity. The results for primary, secondary and tertiary treatment plant utilization
are summarized in Figure 106, Figure 107 and Figure 108. It shows that utilities have
unused capacity of treatment which can be used when the demand increases. It was also
found that many responding utilities do not have tertiary treatment. Energy consumption
shows the variation of energy used to treat wastewater (million gallons) by various
utilities (Figure 109). Most of the utilities have different energy use depending on
regulation of treatment in the region they serve, size of the utility, and treatment process
used. The indicator for pumping utilization has been discarded because there was
insufficient to make conclusions.
Table 18. List of indicators, definition and results for treatment process
Indicator Definition Unit Max Min Average Median
Treatment
plant
utilization -
primary
treatment
Average daily volume of
wastewater which received
primary treatment / Total
daily capacity for primary
treatment x 100
% 77.59 16.70 51.18 52.00
Treatment
plant
utilization -
secondary
treatment
Average daily volume of
wastewater which received
secondary treatment / Total
daily capacity for secondary
treatment x 100
% 77.59 16.70 51.74 54.18
Treatment
plant
utilization -
tertiary
treatment
Average daily volume of
wastewater which received
tertiary treatment / Total
daily capacity for tertiary
treatment x 100
% 77.87 0 66.82 77.59
Energy
consumption
Monthly energy used by the
utility / Million gallons of
wastewater treated every
month
kwh
/
Mgal
2614 1396 2037 1921

66
Figure 106. Treatment plant utilization -
primary treatment
Figure 107. Treatment plant utilization -
secondary treatment
Figure 108. Treatment plant utilization -
tertiary treatment
Figure 109. Energy consumption
5.4 TREATMENT PERFORMANCE
Results and analysis:
Quality of service is a vital ingredient in a utility’s ability to maintain profitability and
continued success. Service quality is a very important aspect of the water industry (Chen,
2005).
The results for indicators in this category are summarized in Table 19. Population
coverage is the percentage of population served in the service area and for most of the
utilities this number is high which shows a good coverage of population as summarized
in Figure 110. Total treatment level (Figure 111), primary treatment (Figure 112),
secondary treatment (Figure 113), and tertiary treatment (Figure 114) are the percentage
of wastewater treated which entered the treatment plant. The values for all these
treatment levels are close to 100% and it was found that few utilities do not have tertiary
treatment. Only 40% of participating utilities reported to use tertiary treatment.
The quality of treated water is very important for wastewater treatment facility, and for
every test two factors are important. The first one is to perform required number of tests,
77.59
16.70
51.18 52.00
0
20
40
60
80
100
Max Min Average Median
%
Treatment plant utilization - primary treatment
77.59
16.70
51.74 54.18
0
20
40
60
80
100
Max Min Average Median
%
Treatment plant utilization - secondary treatment
77.87
45.00
66.82 77.59
0
20
40
60
80
100
Max Min Average Median
%
Treatment plant utilization - tertiary treatment
2,614
1,396
2,037 1,921
0
500
1000
1500
2000
2500
3000
Max Min Average Median
kwh
/ M
gal
Energy consumption

67
and the second is to comply with the defined permit conditions. The results for all the
utilities show that more than the required numbers of test were performed. The result of
percentage of tests complying with the standard for total tests (Figure 115), BOD test
(Figure 117), COD test (Figure 119), TSS test (Figure 121), phosphorus test (Figure 123),
nitrogen test (Figure 127), fecal E.coli test (Figure 125), other tests (Figure 129),
Biosolids tests (Figure 131) and Industrial discharge tests (Figure 133) has been
summarized. The result for compliance with standards is close to 100% for most of the
utilities with few exceptions as shown for each type of test in Figure 116, Figure 118,
Figure 120, Figure 122, Figure 124, Figure 128, Figure 126, Figure 130, Figure 132, and
Figure 134.
Limitations:
1. Many utilities that have higher population coverage do not have effective
competition in a given area and there may be no market incentive to cut costs. So
the utility with higher population coverage does not necessarily mean a good
performance.
Table 19. List of indicators, definition and results for treatment performance
Indicator Definition Unit Max Min Average Median
Population
coverage
Total Population served /
Total population of the
service area x 100
% 100.00 48.25 88.88 100.00
Wastewater
Treatment
levels
Total treatment
level
Million gallons of
wastewater treated daily /
total daily volume of
wastewater entering the
treatment plant x 100
% 100.00 91.07 98.01 100.00
Primary
treatment level
Average daily volume of
wastewater which received
primary treatment / total
daily volume of
wastewater entering the
treatment plant x 100
% 100.00 95.00 99.29 100.00

68
Secondary
treatment level
Average daily volume of
wastewater which received
secondary treatment / total
daily volume of
wastewater entering the
treatment plant x 100
% 100.00 95.00 99.29 100.00
Tertiary
treatment level
Average daily volume of
wastewater which received
tertiary treatment / total
daily volume of
wastewater entering the
treatment plant x 100
% 100.00 0.00 64.05 92.15
Quality of
testing
Total tests
Total tests-
Total % of tests
compliant with
permit
conditions
total no. of tests complying
with permit conditions /
total no. of tests done x
100
% 100.00 86.62 97.89 100.00
Total tests-
Total % of
required test
done
total no. of tests done /
total no. of quality tests
required by permit
conditions x 100
% 118.39 100.00 103.00 100.00
Wastewater - BOD test
Wastewater -
BOD test-Total
% of tests
compliant with
permit
conditions
total no. of tests complying
with permit conditions /
total no. of tests done x
100
% 100.00 99.00 99.84 100.00
Wastewater -
BOD test-Total
% of required
test done
total no. of tests done /
total no. of quality tests
required by permit
conditions x 100
% 100.00 100.00 100.00 100.00

69
Wastewater - COD test
Wastewater -
COD test-Total
% of tests
compliant with
permit
conditions
total no. of tests complying
with permit conditions /
total no. of tests done x
100
% 100.00 98.98 99.49 99.49
Wastewater -
COD test-Total
% of required
test done
total no. of tests done /
total no. of quality tests
required by permit
conditions x 100
% 100.00 100.00 100.00 100.00
Wastewater - TSS test
Wastewater -
TSS test-Total
% of tests
compliant with
permit
conditions
total no. of tests complying
with permit conditions /
total no. of tests done x
100
% 100.00 98.99 99.83 100.00
Wastewater -
TSS test-Total
% of required
test done
total no. of tests done /
total no. of quality tests
required by permit
conditions x 100
% 100.00 100.00 100.00 100.00
Wastewater - phosphorus test
Wastewater -
phosphorus
test-Total % of
tests compliant
with permit
conditions
total no. of tests complying
with permit conditions /
total no. of tests done x
100
% 100.00 98.99 99.75 100.00
Wastewater -
phosphorus
test-Total % of
required test
done
total no. of tests done /
total no. of quality tests
required by permit
conditions x 100
% 100.00 100.00 100.00 100.00
Wastewater - nitrogen test

70
Wastewater -
nitrogen test-
Total % of tests
compliant with
permit
conditions
total no. of tests complying
with permit conditions /
total no. of tests done x
100
% 100.00 75.62 94.92 100.00
Wastewater -
nitrogen test-
Total % of
required test
done
total no. of tests done /
total no. of quality tests
required by permit
conditions x 100
% 132.23 100.00 113.91 111.71
Wastewater - fecal E.coli test
Wastewater -
Fecal E.coli
test-Total % of
tests compliant
with permit
conditions
total no. of tests complying
with permit conditions /
total no. of tests done x
100
% 100.00 98.99 99.80 100.00
Wastewater -
Fecal E.coli
test-Total % of
required test
done
total no. of tests done /
total no. of quality tests
required by permit
conditions x 100
% 100.00 100.00 100.00 100.00
Wastewater - other tests
Wastewater -
other tests-
Total % of tests
compliant with
permit
conditions
total no. of tests complying
with permit conditions /
total no. of tests done x
100
% 100.00 99.00 99.77 100.00
Wastewater -
other tests-
Total % of
required test
done
total no. of tests done /
total no. of quality tests
required by permit
conditions x 100
% 100.64 100.00 100.13 100.00
Biosolids tests

71
Biosolids tests-
Total % of tests
compliant with
permit
conditions
total no. of tests complying
with permit conditions /
total no. of tests done x
100
% 100.00 99.00 99.83 100.00
Biosolids tests-
Total % of
required test
done
total no. of tests done /
total no. of quality tests
required by permit
conditions x 100
% 100.00 100.00 100.00 100.00
Industrial discharge tests
Industrial
discharge tests-
Total % of tests
compliant with
permit
conditions
total no. of tests complying
with permit conditions /
total no. of tests done x
100
% 100.00 50.00 86.14 97.27
Industrial
discharge tests-
Total % of
required test
done
total no. of tests done /
total no. of quality tests
required by permit
conditions x 100
% 200.00 100.00 125.00 100.00
Figure 110. Population coverage
Figure 111. Total treatment level
100.00
48.25
88.88 100.00
0
20
40
60
80
100
120
Max Min Average Median
%
Population coverage
100.00
91.07
98.01 100.00
85
90
95
100
105
Max Min Average Median
%
Total treatment level

72
Figure 112. Primary treatment level
Figure 113. Secondary treatment level
Figure 114. Tertiary treatment level
Figure 115. Total tests - total % of tests
compliant with permit conditions
Figure 116. Total tests - total % of required
test done
100.00
95.00
99.29 100.00
92
94
96
98
100
102
Max Min Average Median
%
Primary treatment level
100.00
52.00
92.43 100.00
0.00
50.00
100.00
150.00
Max Min Average Median
%
Secondary treatment level
100.00
0.00
63.17
89.50
0.00
20.00
40.00
60.00
80.00
100.00
120.00
Max Min Average Median
%
Tertiary treatment level
100.00
86.62
97.89 100.00
75
80
85
90
95
100
105
Max Min Average Median
%
Total Tests - Total % of tests compliant with permit conditions
118.39
100.00 103.00
100.00
90
100
110
120
Max Min Average Median
%
Total Tests - Total % of required test done
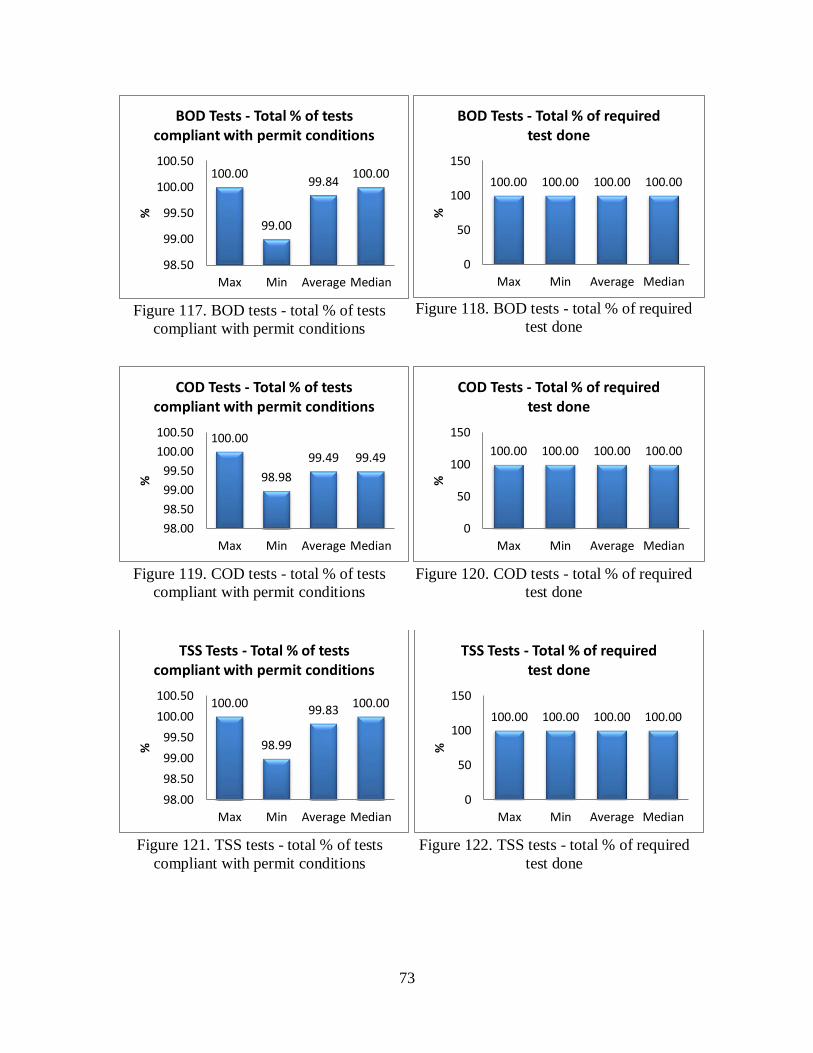
73
Figure 117. BOD tests - total % of tests
compliant with permit conditions
Figure 118. BOD tests - total % of required
test done
Figure 119. COD tests - total % of tests
compliant with permit conditions
Figure 120. COD tests - total % of required
test done
Figure 121. TSS tests - total % of tests
compliant with permit conditions
Figure 122. TSS tests - total % of required
test done
100.00
99.00
99.84 100.00
98.50
99.00
99.50
100.00
100.50
Max Min Average Median
%
BOD Tests - Total % of tests compliant with permit conditions
100.00 100.00 100.00 100.00
0
50
100
150
Max Min Average Median
%
BOD Tests - Total % of required test done
100.00
98.98
99.49 99.49
98.00
98.50
99.00
99.50
100.00
100.50
Max Min Average Median
%
COD Tests - Total % of tests compliant with permit conditions
100.00 100.00 100.00 100.00
0
50
100
150
Max Min Average Median
%
COD Tests - Total % of required test done
100.00
98.99
99.83 100.00
98.00
98.50
99.00
99.50
100.00
100.50
Max Min Average Median
%
TSS Tests - Total % of tests compliant with permit conditions
100.00 100.00 100.00 100.00
0
50
100
150
Max Min Average Median
%
TSS Tests - Total % of required test done

74
Figure 123. Phosphorus tests - total % of
tests compliant with permit conditions
Figure 124. Phosphorus tests - total % of
required test done
Figure 125. Fecal E.coli tests - total % of
tests compliant with permit conditions
Figure 126. Fecal E.coli tests - total % of
required test done
Figure 127. Nitrogen tests - total % of tests
compliant with permit conditions
Figure 128. Nitrogen tests - total % of
required test done
100.00
98.99
99.75 100.00
98.00
98.50
99.00
99.50
100.00
100.50
Max Min Average Median
%
Phosphorus Tests - Total % of tests compliant with permit
conditions
100.00 100.00 100.00 100.00
0
50
100
150
Max Min Average Median
%
Phosphorus Tests - Total % of required test done
100.00
98.99
99.80 100.00
98.00
98.50
99.00
99.50
100.00
100.50
Max Min Average Median
%
Fecal E.coli Tests - Total % of tests compliant with permit conditions
100.00 100.00 100.00 100.00
0
50
100
150
Max Min Average Median
%
Fecal E.coli Tests - Total % of required test done
100.00
75.62 94.92 100.00
0
50
100
150
Max Min Average Median
%
Nitrogen Tests - Total % of tests compliant with permit conditions
132.23
100.00 113.91 111.71
0
50
100
150
Max Min Average Median
%
Nitrogen Tests - Total % of required test done
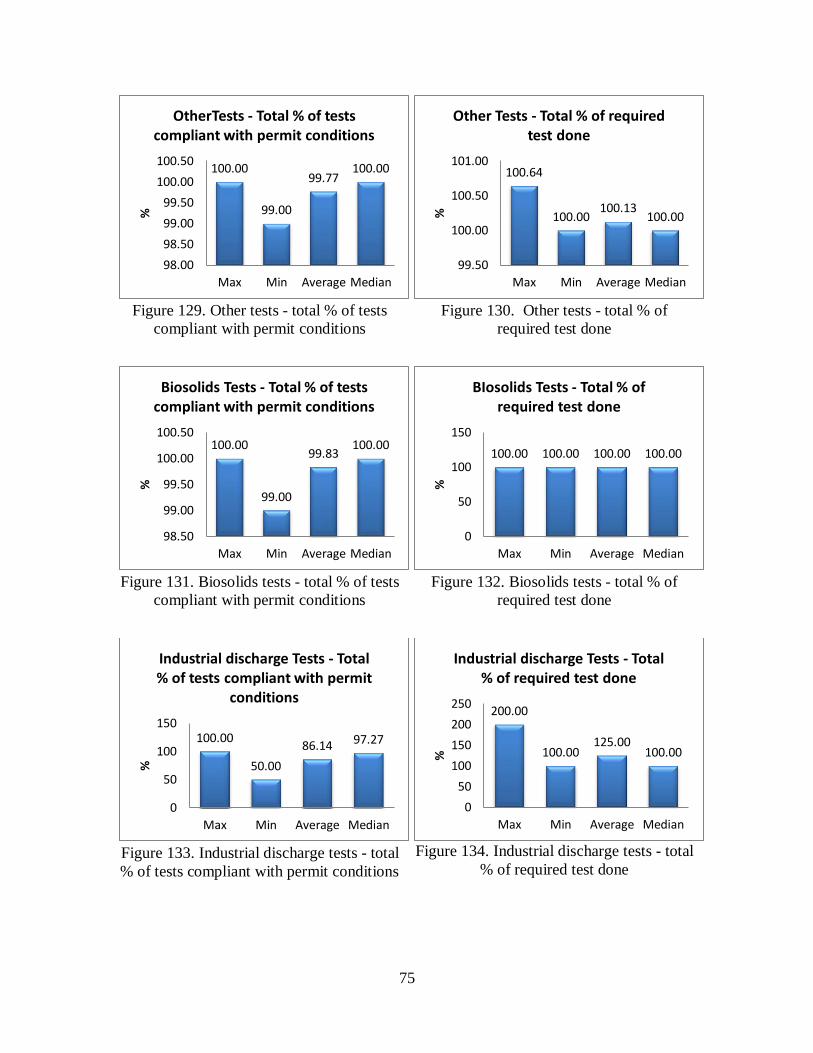
75
Figure 129. Other tests - total % of tests
compliant with permit conditions
Figure 130. Other tests - total % of
required test done
Figure 131. Biosolids tests - total % of tests
compliant with permit conditions
Figure 132. Biosolids tests - total % of
required test done
Figure 133. Industrial discharge tests - total
% of tests compliant with permit conditions
Figure 134. Industrial discharge tests - total
% of required test done
100.00
99.00
99.77 100.00
98.00
98.50
99.00
99.50
100.00
100.50
Max Min Average Median
%
OtherTests - Total % of tests compliant with permit conditions
100.64
100.00 100.13
100.00
99.50
100.00
100.50
101.00
Max Min Average Median
%
Other Tests - Total % of required test done
100.00
99.00
99.83 100.00
98.50
99.00
99.50
100.00
100.50
Max Min Average Median
%
Biosolids Tests - Total % of tests compliant with permit conditions
100.00 100.00 100.00 100.00
0
50
100
150
Max Min Average Median
%
BIosolids Tests - Total % of required test done
100.00
50.00
86.14 97.27
0
50
100
150
Max Min Average Median
%
Industrial discharge Tests - Total % of tests compliant with permit
conditions 200.00
100.00 125.00
100.00
0
50
100
150
200
250
Max Min Average Median
%
Industrial discharge Tests - Total % of required test done
76
5.5 OPERATIONAL PERFORMANCE
Results and analysis:
Berg et al. (2007) suggested that those responsible for utility operations can only manage
what they measure, so having information on productivity trends and relative
performance enables utility managers to direct attention to shortfalls. The indicators
related to operational performance evaluate efficient use of resources, reliability,
inspection of current assets, rehabilitation of existing assets, and losses due to low
operational performance. Inefficient or ineffective operations lead to higher costs.
The result for each indicator is summarized in Table 20. Sewer inspection is the
percentage of sewer inspected and sewer cleaning is the percentage of sewer cleaned by
the utilities. Manhole chamber inspection is the percentage of manhole inspected by
utilities. Sewer inspection (Figure 135), sewer cleaning (Figure 136), and manhole
inspection (Figure 137) show a low percentage. Aside from being impossible to inspect a
high percentage of these assets, it is unnecessary to do so. Utilities with good asset
management programs direct these activities where they are required, as opposed to
achieving a numbers goal. Pump inspection (Figure 138), system flow meters calibration
(Figure 139), and wastewater quality monitoring instrument calibration (Figure 140)
show a very high percentage and are close to 100% for all the utilities.
The renewal related indicators shows the variation of sewer replaced or rehabilitated
(Figure 141), manhole chamber replaced or rehabilitated (Figure 142), and manhole
covers replaced (Figure 143). These indicators are calculated as percentage replaced or
rehabilitated in the last one year.
Indicators for sewer blockage (Figure 144) and sewer breaks (Figure 145) show high
values for a few utilities and close to zero value for a few utilities. Utilities can inspect
the sewers on a regular basis and can plan to maintain sewers.
Limitation:
1. Sewer blockage and breaks are dependent on variables like the quality of material
used, age, location and others.
2. Higher values in the inspection and maintenance related indicators may mean a
higher concern by a utility regarding the current asset condition, but a lower value
does not always mean lower concern by a utility. It is a function of resources and
age of the system, and it may mean that a utility has a more robust asset
management system.
3. For every asset, there is an optimal replacement and/or renewal time. Replacing it
too soon wastes some of the remaining value of the asset and replacing it too late
leads to higher cost of replacement and maintenance. This should be considered
while analyzing the sustainability and rehabilitation related indicators.

77
Table 20. List of indicators, definition and results for operational performance
Indicator Definition Unit Max Min Average Median
Inspection and
maintenance
Sewer Inspection
length of sewer
inspected (miles)
/checked in last 1 year
/ total length of sewer
(miles) x 100
% 8.47 2.73 6.26 6.81
Sewer Cleaning
length of sewer
(miles) cleaned in last
1 year / total length of
sewer (miles) x 100
% 24.87 3.75 12.01 10.03
Manhole chamber
inspection
Total number of
Manhole chamber
inspected or checked
in last 1 year / Total
number of Manhole
chamber x 100
% 27.88 1.30 10.47 8.29
Pump inspection
Total number of
pumps inspected or
checked in last 1 year /
Total number of
pumps x 100
% 100.00 100.00 100.00 100.00
Calibration
System flow meters
total number of flow
meters calibrated in
last 1 year / total no. of
flow meters x 100
% 100.00 100.00 100.00 100.00
Wastewater quality
monitoring
total number of quality
monitoring instrument
calibrated in last 1
% 100.00 100.00 100.00 100.00

78
instrument year / total number of
quality monitoring
instrument x 100
Renewal
Sewer
replaced/rehabilitated
- in last 1 year
length of Sewer
(miles) replaced or
rehabilitated - in last 1
year / total length of
sewer (miles) x 100
% 3.47 0.00 1.23 0.97
Manhole chamber
replaced/rehabilitated
- in last 1 year
total no. of manhole
chambers replaced or
rehabilitated - in last 1
year / total no. of
manhole chambers x
100
% 1.93 0.00 0.85 0.43
Manhole covers
replaced - in last 1
year
no. of manhole covers
replaced - in last 1
year / total no. of
manhole covers x 100
% 12.88 0.04 2.56 0.96
Blockages and
breaks
Sewer blockage - in
last 1 year
total number of sewer
blocks occurred - in
last 1 year / total
length of sewer x 100
number
/ 100
mile
82.45 0.00 26.77 7.70
Sewer breaks - in last
1 year
Total number of sewer
breaks or damage to
the sewer - in last 1
year / total length of
sewer x 100
number
/ 100
mile
38.51 0.76 7.96 1.79

79
Figure 135. Sewer inspection
Figure 136. Sewer cleaning
Figure 137. Manhole chamber inspection
Figure 138. Pump inspection
Figure 139. System flow meters
Figure 140. Wastewater quality monitoring
instrument
8.47
2.73
6.26 6.81
0
2
4
6
8
10
Max Min Average Median
%
Sewer Inspection
24.87
3.75
12.01 10.03
0
5
10
15
20
25
30
Max Min Average Median
%
Sewer Cleaning
27.88
1.30
10.47 8.29
0
5
10
15
20
25
30
Max Min Average Median
%
Manhole chamber inspection
100.00 100.00 100.00 100.00
0
20
40
60
80
100
120
Max Min Average Median
%
Pump inspection
100.00 100.00 100.00 100.00
0
20
40
60
80
100
120
Max Min Average Median
%
System flow meters - calibration
100.00 100.00 100.00 100.00
0
50
100
150
Max Min Average Median
%
Wastewater quality monitoring instrument - calibratin

80
Figure 141. Sewer replaced/rehabilitated -
in last 1 year
Figure 142. Manhole chamber
replaced/rehabilitated - in last 1 year
Figure 143. Manhole covers replaced - in
last 1 year
Figure 144. Sewer blockage - in last 1 year
Figure 145. Sewer breaks - in last 1 year
5.6 CUSTOMER ENQUIRIES
Results and analysis:
Customer satisfaction is defined as "the number of customers, or percentage of total
customers’, whose reported experience with a firm, its products, or its services (ratings)
3.47
0.00
1.23 0.97
0
1
2
3
4
Max Min Average Median
%
Sewer replaced/rehabilitated - in last 1 year
1.93
0.00
0.85 0.43
0
1
2
3
Max Min Average Median
%
Manhole chamber replaced/rehabilitated - in last 1
year
12.88
0.04
2.56 0.96
0
5
10
15
Max Min Average Median
%
Manhole covers replaced - in last 1 year
82.45
0.00
26.77
7.70
0
20
40
60
80
100
Max Min Average Median
nu
mb
er /
100
mile
Sewer blockage - in last 1 year
38.51
0.76
7.96 1.79
0
10
20
30
40
50
Max Min Average Median
nu
mb
er
/ 1
00 m
ile
Sewer breaks - in last 1 year
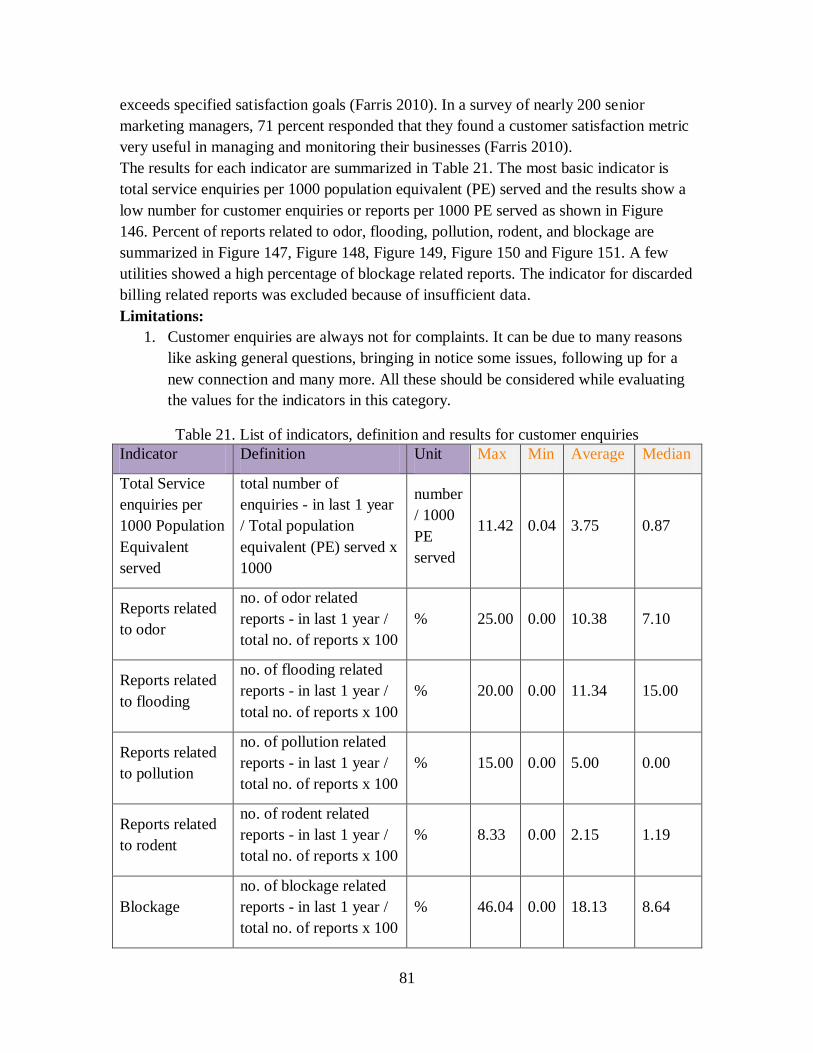
81
exceeds specified satisfaction goals (Farris 2010). In a survey of nearly 200 senior
marketing managers, 71 percent responded that they found a customer satisfaction metric
very useful in managing and monitoring their businesses (Farris 2010).
The results for each indicator are summarized in Table 21. The most basic indicator is
total service enquiries per 1000 population equivalent (PE) served and the results show a
low number for customer enquiries or reports per 1000 PE served as shown in Figure
146. Percent of reports related to odor, flooding, pollution, rodent, and blockage are
summarized in Figure 147, Figure 148, Figure 149, Figure 150 and Figure 151. A few
utilities showed a high percentage of blockage related reports. The indicator for discarded
billing related reports was excluded because of insufficient data.
Limitations:
1. Customer enquiries are always not for complaints. It can be due to many reasons
like asking general questions, bringing in notice some issues, following up for a
new connection and many more. All these should be considered while evaluating
the values for the indicators in this category.
Table 21. List of indicators, definition and results for customer enquiries
Indicator Definition Unit Max Min Average Median
Total Service
enquiries per
1000 Population
Equivalent
served
total number of
enquiries - in last 1 year
/ Total population
equivalent (PE) served x
1000
number
/ 1000
PE
served
11.42 0.04 3.75 0.87
Reports related
to odor
no. of odor related
reports - in last 1 year /
total no. of reports x 100
% 25.00 0.00 10.38 7.10
Reports related
to flooding
no. of flooding related
reports - in last 1 year /
total no. of reports x 100
% 20.00 0.00 11.34 15.00
Reports related
to pollution
no. of pollution related
reports - in last 1 year /
total no. of reports x 100
% 15.00 0.00 5.00 0.00
Reports related
to rodent
no. of rodent related
reports - in last 1 year /
total no. of reports x 100
% 8.33 0.00 2.15 1.19
Blockage
no. of blockage related
reports - in last 1 year /
total no. of reports x 100
% 46.04 0.00 18.13 8.64

82
Figure 146. Total service enquiries per
1000 population equivalent served
Figure 147. Reports related to odor
Figure 148. Reports related to flooding
Figure 149. Reports related to rodent
Figure 150. Reports related to pollution
Figure 151. Reports related to Blockage
11.42
0.04
3.75
0.87
0
5
10
15
Max Min Average Median
nu
mb
er /
100
0 P
E
Total Service enquiries per 1000 Population Equivalent served
25.00
0.00
10.38 7.10
0
5
10
15
20
25
30
Max Min Average Median
%
Reports related to odour
20.00
0.00
11.34
15.00
0
5
10
15
20
25
Max Min Average Median
%
Reports related to flooding
8.33
0.00
2.15 1.19
0
2
4
6
8
10
Max Min Average Median
%
Reports related to rodent
15.00
0.00
5.00
0.00 0
5
10
15
20
Max Min Average Median
%
Reports related to pollution
46.04
0.00
18.13
8.64
0
10
20
30
40
50
Max Min Average Median
%
Reports related to blockage

83
5.7 FINANCIAL PERFORMANCE
Analysis and Results:
Financial performance is a measure of how well a utility can use assets from its primary
mode of business and generate revenues. Measuring the results of a utility’s policies and
operations in monetary terms is a brief definition of financial performance. Financial
results are reflected in the utility’s return on investment, return on assets, value added,
total cost, revenue generated, cost coverage, profit etc.
The results are summarized in Table 22. The indicators in the revenue section are revenue
per population equivalent (PE), percentage of service revenue, and percentage of other
revenue. The revenue per PE show an irregular trend and varies with the size and location
of the utility as summarized in Figure 152. It was observed that most of the revenue
generated by utilities comes from service and other revenue sources show a low
percentage as summarized in Figure 153 and Figure 154. The indicators in the cost
section summarize total cost per population equivalent (PE) served (Figure 155), capital
cost per million gallons (mgal) treated wastewater (Figure 156) and operating cost per
mgal treated wastewater (Figure 157). Operational cost is defined by the type of
operation, which are operation cost for sewer system (Figure 158, treatment (Figure 159),
electricity or energy (Figure 160), testing (Figure 161), and other (Figure 162). The
results show that a major cost belongs to sewer system operation and wastewater
treatment.
Expenses related indicators summarize total expenses (Figure 163), percentage of
expenses on new assets (Figure 164) and percentage of total expenses on replacement and
renovation (Figure. 165). Some utilities show high values for percentage of expenses on
new assets and some utilities show a high value for percentage of expenses on
replacement and renovation of existing assets. The expenses on new and existing assets
depend on the age and current condition or existing assets. Sewer collection rate is
summarized in Figure 166. Total cost coverage is summarized in Figure 167. Operational
cost coverage is summarized in Figure 168. Liquidity ratio and asset turnover ratios have
been shown in Figure 169 and Figure 170. Earning per million gallons of wastewater
treated is summarized in (Figure 171). A few utilities show profit value as zero because
those utilities are publically owned and some of them cannot have net income.
Limitations:
1. In general, high values for indicators related to revenue show better financial
performance but these values vary with the number of PE served, size of utility,
location of utility and others. Hence utilities with high revenue are not always the
best performers.
2. In general, lower values for indicators related to cost show better financial
performance but these values vary with the number of PE served, size of utility,
location of utility and others. So utilities with low cost are not always the best
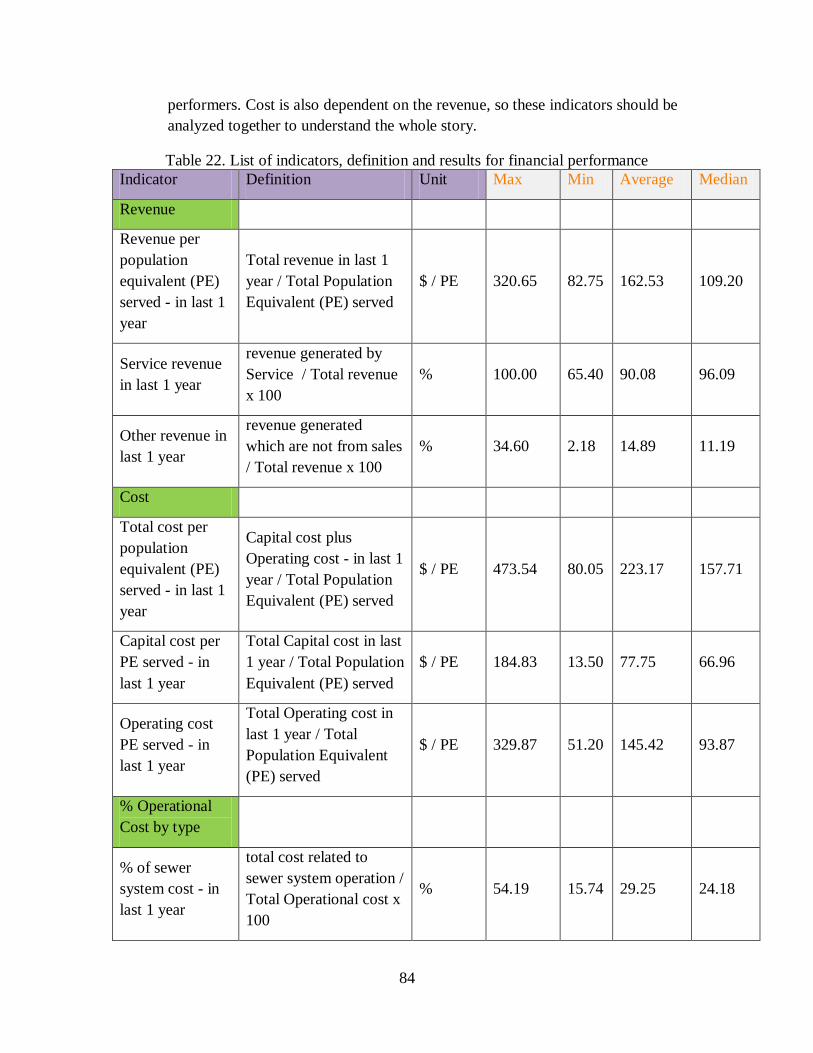
84
performers. Cost is also dependent on the revenue, so these indicators should be
analyzed together to understand the whole story.
Table 22. List of indicators, definition and results for financial performance
Indicator Definition Unit Max Min Average Median
Revenue
Revenue per
population
equivalent (PE)
served - in last 1
year
Total revenue in last 1
year / Total Population
Equivalent (PE) served
$ / PE 320.65 82.75 162.53 109.20
Service revenue
in last 1 year
revenue generated by
Service / Total revenue
x 100
% 100.00 65.40 90.08 96.09
Other revenue in
last 1 year
revenue generated
which are not from sales
/ Total revenue x 100
% 34.60 2.18 14.89 11.19
Cost
Total cost per
population
equivalent (PE)
served - in last 1
year
Capital cost plus
Operating cost - in last 1
year / Total Population
Equivalent (PE) served
$ / PE 473.54 80.05 223.17 157.71
Capital cost per
PE served - in
last 1 year
Total Capital cost in last
1 year / Total Population
Equivalent (PE) served
$ / PE 184.83 13.50 77.75 66.96
Operating cost
PE served - in
last 1 year
Total Operating cost in
last 1 year / Total
Population Equivalent
(PE) served
$ / PE 329.87 51.20 145.42 93.87
% Operational
Cost by type
% of sewer
system cost - in
last 1 year
total cost related to
sewer system operation /
Total Operational cost x
100
% 54.19 15.74 29.25 24.18

85
% of Treatment
cost - in last 1
year
total cost related to
Treatment and testing
cost / Total Operational
cost x 100
% 62.00 3.45 38.67 49.64
% of Energy /
Electricity used
cost - in last 1
year
total cost related to
Energy or Electricity
used / Total Operational
cost
% 19.22 4.33 8.29 5.42
% of testing
related cost - in
last 1 year
total cost related to
testing / Total
Operational cost x 100
% 5.37 0.24 3.10 3.70
Any other
operational cost -
in last 1 year
any other cost / Total
Operational cost x 100 % 55.35 10.74 34.62 37.79
Expenses
Total expenses -
in last 1 year
Total expenses on plant
and equipment - new +
replacement +
renovation - In the last 1
year / Total Population
Equivalent (PE) served
$ / PE 184.83 5.54 86.57 102.42
% on New assets
- in last 1 year
Expenses on new assets
/ Total investment x 100 % 100.00 0.79 35.78 20.12
% on
Replacement and
renovation - in
last 1 year
Expenses on
replacement and
renovation of existing
assets / Total investment
x 100
% 99.21 34.07 68.82 71.00
Sewer collection
rate
Sewer collection
rate which utility
charges the
consumer
as per the standard
utility rate
$ / 1000
gal 5.27 2.33 3.96 4.77
Efficiency

86
Total cost
coverage
total revenue in last 1
year / total cost in last 1
year
- 1.40 0.74 1.02 0.98
Operational cost
coverage
total revenue in last 1
year / total operational
cost in last 1 year
- 3.44 0.97 1.67 1.42
Current Ratio
(Liquidity
measure)
total current assets value
/ total current liabilities
value
- 7.15 1.11 3.07 1.80
Asset turnover
ratio
Sales revenue in last 1
year / total current assets
value
- 0.60 0.18 0.43 0.47
Earnings
Earnings per
million gallons
of wastewater
treated
Total earning - in last 1
year / Total wastewater
treated in last 1 year
$ / Mgal 1891.92 0.00 569.57 106.64
Figure 152. Revenue per population
equivalent (PE) served - in last 1 year
Figure 153. Service revenue in last 1 year
320.65
82.75
162.53 109.20
0
100
200
300
400
Max Min Average Median
$/P
E
Revenue per population equivalent (PE) served - in last 1
year 100.00
65.40
90.08 96.09
0
20
40
60
80
100
120
Max Min Average Median
%
Service revenue in last 1 year

87
Figure 154. Other revenue in last 1 year
Figure 155. Total cost per population
equivalent (PE) served - in last 1 year
Figure 156. Capital cost per PE served - in
last 1 year
Figure 157. Operating cost per PE served -
in last 1 year
Figure 158. % of sewer system cost - in last
1 year
Figure 159. % of treatment cost - in last 1
year
34.60
2.18
14.89 11.19
0
10
20
30
40
Max Min Average Median
%
Other revenue in last 1 year
473.54
80.05
223.17 157.71
0
200
400
600
Max Min Average Median
$/P
E
Total cost per population equivalent (PE) served - in last 1
year
473.54
80.05
223.17 157.71
0
200
400
600
Max Min Average Median
$/P
E
Total cost per population equivalent (PE) served - in last 1
year
329.87
51.20
145.42 93.87
0
100
200
300
400
Max Min Average Median
$/P
E
Operating cost per population equivalent (PE) served - in last 1
year
54.19
15.74
29.25 24.18
0
20
40
60
Max Min Average Median
%
% of sewer system cost - in last 1 year
62.00
3.45
38.67 49.64
0
20
40
60
80
Max Min Average Median
%
% of Treatment cost - in last 1 year

88
Figure 160. % of energy / electricity used
cost - in last 1 year
Figure 161. % of testing related cost - in
last 1 year
Figure 162. Any other operational cost - in
last 1 year
Figure 163. Total expenses - in last 1 year
Figure 164. % on new assets - in last 1 year
Figure. 165 % on replacement and
renovation - in last 1 year
19.22
4.33 8.29
5.42
0
5
10
15
20
25
Max Min Average Median
%
% of Energy / Electricity used cost - in last 1 year
5.37
0.24
3.10 3.70
0
2
4
6
Max Min Average Median
%
% of testing related cost - in last 1 year
55.35
10.74
34.62 37.79
0
20
40
60
Max Min Average Median
%
% of Any other operational cost - in last 1 year 184.83
5.54
86.57 102.42
0
50
100
150
200
Max Min Average Median
$/P
E
Total expenses- in last 1 year
100.00
0.79
35.78
20.12
0
20
40
60
80
100
120
Max Min Average Median
%
% on New assets - in last 1 year
99.21
34.07
68.82 71.00
0
20
40
60
80
100
120
Max Min Average Median
%
% on Replacement and renovation - in last 1 year

89
Figure 166. Sewer collection rate which
utility charges the consumer
Figure 167. Total cost coverage
Figure 168. Operational cost coverage
Figure 169. Liquidity ratio
Figure 170. Asset turnover ratio
Figure 171. Earnings per million gallons of
wastewater treated
5.27
2.33
3.96 4.77
0
1
2
3
4
5
6
Max Min Average Median
$/10
00ga
l
Sewer collection rate which utility charges the consumer 1.40
0.74
1.02 0.98
0.00
0.50
1.00
1.50
Max Min Average Median
-
Total cost coverage
3.44
0.97
1.67 1.42
0
1
2
3
4
Max Min Average Median
-
Operational cost coverage
7.15
1.11
3.07
1.80
0
2
4
6
8
Max Min Average Median
-
Liquidity Ratio
0.60
0.18
0.43 0.47
0.00
0.20
0.40
0.60
0.80
Max Min Average Median
-
Asset turnover ratio
1891.92
0.00
569.57
106.64
0
500
1000
1500
2000
Max Min Average Median
%
Earnings per million gallon of wastewater treated

90
CHAPTER 6. WEB-BASED PERFORMANCE BENCHMARKING FOR
DRINKING WATER AND WASTEWATER
A web interface is developed where utilities can compare self-performance with other
similar utilities. Based on the analysis results of performance indicators utilities can
evaluate the areas of underperformance. Utilities have the option of comparing
performance for every indicator with overall maximum, overall minimum, average, and
median for defined indicators. Utilities have access to their respective data but cannot
access data of any other utilities. Interested utilities can participate using the link –
http://waterid.org/content/drinking-water-and-wastewater-utility-benchmarking
This web-based benchmarking platform is a part of WATERiD project. WATERiD is a
knowledge database and contains information on both drinking water and wastewater
infrastructure. Information about utility performance benchmarking, pipeline condition
assessment, pipeline renewal engineering, subsurface utility engineering information for
locating pipelines, management practices, models and tools, costs, and product
qualification are parts of the project. The different categories in WATERiD are
summarized in Figure 172 and utility benchmarking is highlighted.
Figure 172. WATERiD categories

91
6.1 WEB INTERFACE
The data was collected from 10 drinking water and 9 wastewater utilities using
benchmarking data-mining sheets. This process of data collection and result display is
done using web interface on WATERiD and the process involves:
1. Data Collection: Utilities interested in participation can access the WATERiD –
Benchmarking page (http://waterid.org/content/benchmarking-participation) to
download the data mining sheet and send the data mining sheets with data for the
indicators to the benchmarking team at Virginia Tech. Data is saved at a secured
location on WATERiD which is accessible by utility personnel and the
benchmarking team at Virginia Tech. The data provided by utilities is analyzed
and benchmarking results are made available to the participating utilities.
2. Visualization of results: Once the data is collected and analyzed, it is converted
to useful information and that should be easily accessible to the participating
utilities. This was achieved by using a web interface using which utility personnel
can access the results and make comparisons. A web interface gives user a
flexible way of generating and visualizing results. Only the overall benchmarking
results are shared on the WATERiD website. The utility specific information is
shared with the respective utilities using the Google Fusion tables.
6.2 DATASHEETS
Performance indicators were defined based on literature sources and were used in the
data-mining process. The data-mining sheet was reviewed by utility personnel. The data
sheet has formulas defined to evaluate the value of the indicator based on the input data.
In the example below (Figure 173), the utility personnel provide the data and predefined
formula calculates the value for indicator. There is also a comment box for the utility
personnel to provide feedback, comments and suggestions on the indicator for further
clarification and for future improvement of the indicator.

92
Sr.
no Indicator Unit Response Comment
1
Employee per
million gallons of
water produced
number / Mgal please enter value
for a and b
1a
Total number of
employee number
1b
Average water
produced per day Mgal
Figure 173. Sample indicator for data collection
6.3 LINKS TO RESOURCES
Many resources have been used like journal and conference papers, books and reports on
benchmarking to develop the methodology, process and indicators for benchmarking. The
resources related to drinking water and wastewater is available at
http://waterid.org/content/drinking-water-utility-benchmarking-results and
http://waterid.org/content/wastewater-utility-benchmarking-results
6.3.1 Synthesis Reports
Synthesis reports were developed for each area of research in the WATERiD project.
These areas of research are performance benchmarking, condition assessment, renewal
engineering, management practice, subsurface utility engineering, product qualification
and cost. These reports contain a summary of the research findings and were developed
for the funding agencies (EPA and WERF).
6.3.2 Participating Utility Information
WATERiD has been able to collect and present a huge amount of information with the
help of utilities. List of participating utilities for all studies in WATERiD project are
available at http://waterid.org/content/participating-utilities-0. Utility profile page for
each participating utilities were created and information about the participants are
available at http://waterid.org/directory/util.
6.3.3 Other benchmarking initiatives
Links to major benchmarking initiatives around the globe are available on WATERiD to
gain knowledge about other initiatives. Link to other benchmarking initiatives are
available at – http://waterid.org/content/drinking-water-and-wastewater-utility-
benchmarking.
automatically calculates the value - please do not edit
Please provide your response here
Please provide your comments here on the values

93
CHAPTER 7. SUMMARY
This thesis presents the results of a web-based performance benchmarking for drinking
water and wastewater utilities. The work involved an extensive utility data mining
process for gathering information on performance indicators. This data was used to
evaluate and compare performance of utilities with other participants. The results helped
the participating utilities to evaluate the overall performance and identify the areas with
scope of improvement. The major contribution of this research is the creation of a
database, and development of a web-based data collection and result display
benchmarking platform which is part of national WATERiD database.
7.1 CONCLUSION
Research shows that aging drinking water and wastewater infrastructure has become a
problem and requires a substantial investment to maintain as well as to keep up with
demands. Evaluating the overall performance of utility is a key component to helping
utilities understand the areas of underperformance. In the study a process of
benchmarking that could meet the needs of utility performance evaluation is defined. To
achieve this, a list of comprehensive and quantitative indicators was identified and used
for the process of data collection. A robust methodology was used which provides a
holistic view of utility performance. A web-based data collection and result display
process that can be used repeatedly to support future benchmarking efforts has been
defined. A data base for indicator values has been created using the data gathered for this
study, and future participants can make comparisons for the performance indicators using
this database. Over time, more data will be collected and that will provide utilities with
access to a better database to make comparisons. Overall, this research provides
information to implement benchmarking methodologies among utilities to evaluate and
improve performance. Along with this, it will help to educate personnel of the utilities on
the use of benchmarking for performance evaluation, performance improvement,
resource allocation, and better future planning.
7.2 RECOMMENDATIONS AND FUTURE WORK
This research produced valuable insights into the benefits of benchmarking for
performance evaluation of drinking water and wastewater utilities, despite the fact that
the indicator data obtained through data mining was limited. This project is a step which
provides utilities a web-based performance benchmarking platform for quantitative and
comprehensive performance evaluation. It is recommended that drinking water and
wastewater utilities use benchmarking for performance evaluation. Although, these
indicators provide good information, practice benchmarking is also important to improve
performance. The web-based benchmarking will enable online data collection which will
be used to evaluate the change in performance of the utilities in future benchmarking.

94
Indicators, methodology, and the process of benchmarking can be improved based on the
recommendation of utilities and users. The visualization platform can be improved based
on the suggestions from drinking water and wastewater utilities.
Future work involves an expansion of the utilities involved in data mining, which will
produce results and trends with more confidence, and will improve the database. When
initially targeting utilities for data mining purposes, care should be taken to gather data
from a variety of utility sizes in a variety of geographical locations. Apart from this, this
research focuses only on the performance evaluation and potential solutions for
improvement. It does not identify the reasons for underperformance of utilities. The next
phase in this research can be analyzing the results for each participant for each set of
indicators, and finding possible reasons for underperformance, followed by suggesting
solutions for improvement using the best practices. Finally, the participants have not been
given a score based on a predetermined scale. The next step can include evaluating a
score using mathematical techniques like DEA (data envelope analysis). By using this
technique, the score for each set of indicators can be calculated and used to evaluate an
overall score for each participant.

95
REFERENCES
2009. Report card for America’s infrastructure [online]. American Society of Civil
Engineers. Available from: www.infrastructurereportcard.org [Accessed 2 May 2012].
Abbott, M., Wang, W. C., and Cohen, B. (2011). “The long-term reform of the water and
wastewater industry: The case of Melbourne in Australia”. Utilities Policy, 19(2), 115-
122.
Abusam, A., Keesman, K. J., Spanjers, H., and van Straten, G. (2004). “Benchmarking
procedure for full-scale activated sludge plants”. Control Engineering Practice, 12(3),
315-322.
Aida, K., William, W. C., Jesús, T. P., and Toshiyuki, S. (1998). “Evaluating water
supply services in Japan with RAM: A range-adjusted measure of inefficiency.” Omega,
International Journal of Management Science, 26 2, 207–232.
Alegre, H., Hirner, W., Baptista, J. M., and Parena, R. (2000). “Performance indicators
for water supply services.” IWA (International Water Association) manual of best
practice, IWA Publishing, London.
Alsharif, K., Feroz, E. H., Klemer, A., and Raab, R. (2008). “Governance of water supply
systems in the Palestinian territories: A data envelopment analysis approach to the
management of water resources.” J. Environ. Manage., 87, 80–94.
American Water Works Association (2012). “Buried No Longer: Confronting America’s
Water Infrastructure Challenge”. Denver: American Water Works Association
Barber, E. (2004). “Benchmarking the management of projects: A review of current
thinking. International Journal of Project Management”, 22(4), 301-307. doi:
10.1016/j.ijproman.2003.08.001
Berg, Sanford and María Luisa Corton (2007), “Water utility benchmarking for
managerial and policy decisions: lessons from developing countries”, International Water
Association Conference on Performance Assessment of Urban Infrastructure Services,
Valencia.
Berg, Sanford V. (2007). “Conflict Resolution: Benchmarking Water Utility
Performance,” Public Administration and Development, 27(1): 1-11.
Berg, Sanford V., and Julie Padowski. (2007). "Overview of Water Utility Benchmarking
Methodologies: From Indicators to Incentives." University of Florida, Department of
Economics, PURC Working Paper.
Boyko, C. T., Gaterell, M. R., Barber, A. R. G., Brown, J., Bryson, J. R., Butler, D., . . .
Rogers, C. D. F. (2012). “Benchmarking sustainability in cities: The role of indicators
96
and future scenarios.” Global Environmental Change, 22(1), 245-254. doi:
10.1016/j.gloenvcha.2011.10.004
Berg, V. S., and Lin, C. (2007). “Consistency in performance rankings: The Peru water
sector.” J. Appl. Econ., 40, 793–805.
Cagle, R. F. "Infrastructure Asset Management: An Emerging Direction." Proc., 47th
Annual Meeting of AACE International, June 22, 2003 - June 25, 2003, Association for
the Advancement of Cost Engineering, PM021-PM026.
Camp, R. (1989). “The search for industry best practices that lead to superior
performance”. Productivity Press.
Chen, L. (2005). "Service quality and prospects for benchmarking: Evidence from the
Peru water sector." Utilities Policy, 13(3), 230-239.
Corton, M. L., and Berg, S. V. (2009). "Benchmarking Central American water utilities."
Utilities Policy, 17(3-4), 267-275.
Dassler, T., Parker, D., and Saal, D. S. (2006). "Methods and trends of performance
benchmarking in UK utility regulation." Utilities Policy, 14(3), 166-174.
Farris, P. (2010). “Marketing metrics: the definitive guide to measuring marketing
performance”, FT Press, Upper Saddle River, N.J.
Francis, G., Humphreys, I., and Fry, J. (2002). "The benchmarking of airport
performance." Journal of Air Transport Management, 8(4), 239-247.
Gitman, Lawrence J.; Carl D. McDaniel (2005). “The Future of Business: The
Essentials.” Mason, Ohio: South-Western. ISBN 0-324-32028-0.
Henning, T. F. P., Muruvan, S., Feng, W. A., and Dunn, R. C. (2011). "The development
of a benchmarking tool for monitoring progress towards sustainable transportation in
New Zealand." Transport Policy, 18(2), 480-488.
Hernández-Sancho, F., and Sala-Garrido, R., (2009). “Technical efficiency and cost
analysis in wastewater treatment processes: A DEA approach. Desalination.”, 249(1),
230-234.
Hernandez-Sancho, F., Molinos-Senante, M., and Sala-Garrido, R., (2011). “Energy
efficiency in Spanish wastewater treatment plants: A non-radial DEA approach.” Science
of the Total Environment, 409(14), 2693-2699.
Lambert, D., Dichev, D., and Raffiee, K. (1993). “Ownership and sources of inefficiency
in provision of water services.” Water Resour. Res., 29, 1573–1578.
Lee, S.-H., Thomas, S. R., and Tucker, R. L. (2005). "Web-based benchmarking system
for the construction industry." Journal of Construction Engineering and Management,
131(7), 790-798.

97
Lin, C. (2005). “Incorporating service quality & prospects of benchmarking: Evidence
from the Peru water sector.” Utilities Policy, 13(3), 230–239.
Longborg, R. (2005). “Regulation, organization, and efficiency benchmarking of publicly
and privately owned utility companies.” Proc., 3rd ECPR Conf., ECR Publishing,
Budapest.
Lowry, M. N., and Getachew, L. (2009). "Statistical benchmarking in utility regulation:
Role, standards and methods." Energy Policy, 37(4), 1323-1330.
Matos, R., Cardoso, A., Ashley, R., Duarte, P., Molinari, A., and Schulz, A., 2003.
“Performance indicators for wastewater services.” IWA (International Water
Association) manual of best practice, IWA Publishing, London.
Mugisha, S. (2007). “Effects of incentive applications on technical efficiencies:
Empirical evidence from Ugandan water utilities.” Utilities Policy, 15, 225–233.
Shleifer, A. (1985). "A theory of yardstick competition." Rand Journal of Economics,
16(3), 319-327.
Tupper, H. C., and Resende, M. (2004). “Efficiency and regulatory issues in the Brazilian
water and sewage sector: An empirical study.” Utilities Policy, 12(1), 29–40.
Watson, G. H. (1993). “Strategic Benchmarking: How To Rate Your Company's
performance against the world's best.” J. Wiley and Sons, 0471586005, 9780471586005

98
APPENDIX A: DATA MINING SHEET – GENERAL INFORMATION OF
UTILITIES
Sr No Information Response Comment
1 Name of the Utility
2
Type of Utility (Drinking water,
Wastewater or both - Drinking
water and Wastewater)
3 Address of the utility
Address 1
Address 2
City
State
Zip Code
4 Representative for further
discussions
Representative 1
Designation
phone
Representative 2
Designation
phone
Representative 3
Designation
phone
Representative 4
Designation
phone
5 Areas in which utility provides
service
County
City

99
APPENDIX B: DATA MINING SHEET – DRINKING WATER
Essential
Preferable
Water resource
utilization
Indicator Definition Unit Response Comment
1 Inefficiency of use
of water resource
total Water lost due to
leakage and overflow
/ Total treated water
produced x 100
%
2
Reused or
recycled supplied
water
volume of water
reused or recycled /
total volume of water
entering the utility for
treatment x 100
%
3 Water resources
availability
total volume of water
entering the utility for
treatment / Total
volume of water
available as per
withdrawal permit
from lakes, river and
other sources x 100
%
Employee information
Indicator Definition Unit Response Comment
Total employee
4 Employee per
1000 connection
total no. of employees
/ number of
connections x 1000
number /
1000
5
Employee per
million gallons of
water produced
per day
total no. of employees
/ Million gallons of
water produced daily
number /
Mgal
Employee as per
function

100
6
Higher
management
employees
number of full time
equivalent employees
dedicated to directors,
central administration,
strategic planning,
marketing and
communications, legal
affairs, environmental
management, business
development / total
number of employee x
100
%
7 Human resources
employees
number of full time
employees dedicated
to personnel
administration,
education and
training, occupational
safety and social
activities / total
number of employee x
100
%
8
Financial and
commercial
employees
number of full time
equivalent employees
dedicated to economic
and financial
planning, economic
administration,
economic controlling
and purchasing / total
number of employee x
100
%
9 Customer Service
employees
number of full time
equivalent employees
dedicated to customer
relations / total
number of employee x
100
%
10
Planning,
designing and
construction
employees
number of employees
working in planning,
designing &
construction / total
number of employee x
100
%

101
11
Operations and
maintenance
employees
number of employees
working in operations
& maintenance of the
utility / total number
of employee x 100
%
12
Water quality
monitoring
employees (lab
personnel)
number of lab testing
employees / total
number of employee x
100
%
Training
13 Personnel training
total training hours for
all the employees in
last 1 year / total
number of employees
hours /
employee/
year
Personnel health
and safety
14
working accidents
- % of employees
injured in last 1
year
number of employees
injured on the job in
the last 1 year / total
number of employees
x 100
%
15 Absences due to
accidents
sum of all the
absences due to all the
employees due to
reasons related to
accident in last 1 year
/ total number of
employees
number /
employee
/ year
Physical assets
Indicator Definition Unit Response Comment
16 Treatment plant
utilization
average Volume of
water treated daily /
Maximum daily water
treatment capacity x
100
%
17
Water produced
vs. Treated water
storage capacity
average Volume of
water treated daily /
capacity of treated
water storage
reservoir x 100
%
18 Capacity of Raw average of daily raw %

102
water storage
reservoir
water input to
treatment system /
capacity of raw water
reservoirs x 100
19 Pumping
utilization
sum, for all installed
pumps, of the number
of average daily
operation hours
multiplied by the per
hour pumping
capacity for 1 day /
Sum, for all installed
pumps, 24 multiplied
by the per hour
pumping capacity x
100
%
20 Total Main length length of total main miles
20 a Transmission
main
length of
transmission main miles
20 b Distribution main length of distribution
main miles
21 Valve density
total no of isolating
valves / total miles of
distribution main
length
number /
mile
22 Hydrant density
total no of hydrants /
total miles of
distribution main
length
number /
mile
23 Meters
total number of
meters / total number
of connections x 100
%
24 Energy
consumption
monthly energy used
by the utility / Total
Population served
Kwm/
month /
person

103
Service quality
Indicator Definition Unit Response Comment
25 Population
coverage
total Population
served / Total
population of the
service area x 100
%
Water supply
Reliability
26 Main breaks
total number of main
breaks in last 1 year /
Total main length x
100
number /
100 miles
27
Water
interruptions -
unplanned
27a
% connections
with interruptions
of less than 4
hours in last 1
year
number of
connections
experiencing
disruptions of less
than 4 hours in last 1
year / Total number of
connections x 100
%
27b
% connections
with interruptions
between 4-12
hours in last 1
year
number of
connections
experiencing
disruptions of between
4-12 hours in last 1
year / Total number of
connections x 100
%
27c
% connections
with interruptions
of greater than 12
hours in last 1
year
number of
connections
experiencing
disruptions of greater
than 12 hours in last 1
year / Total number of
connections x 100
%
28
Total % of
connections
experiencing
disruption in last 1
year
total number of
connections
experiencing
disruption in last 1
year / Total number of
connections x 100
%
Quality of
Supplied water
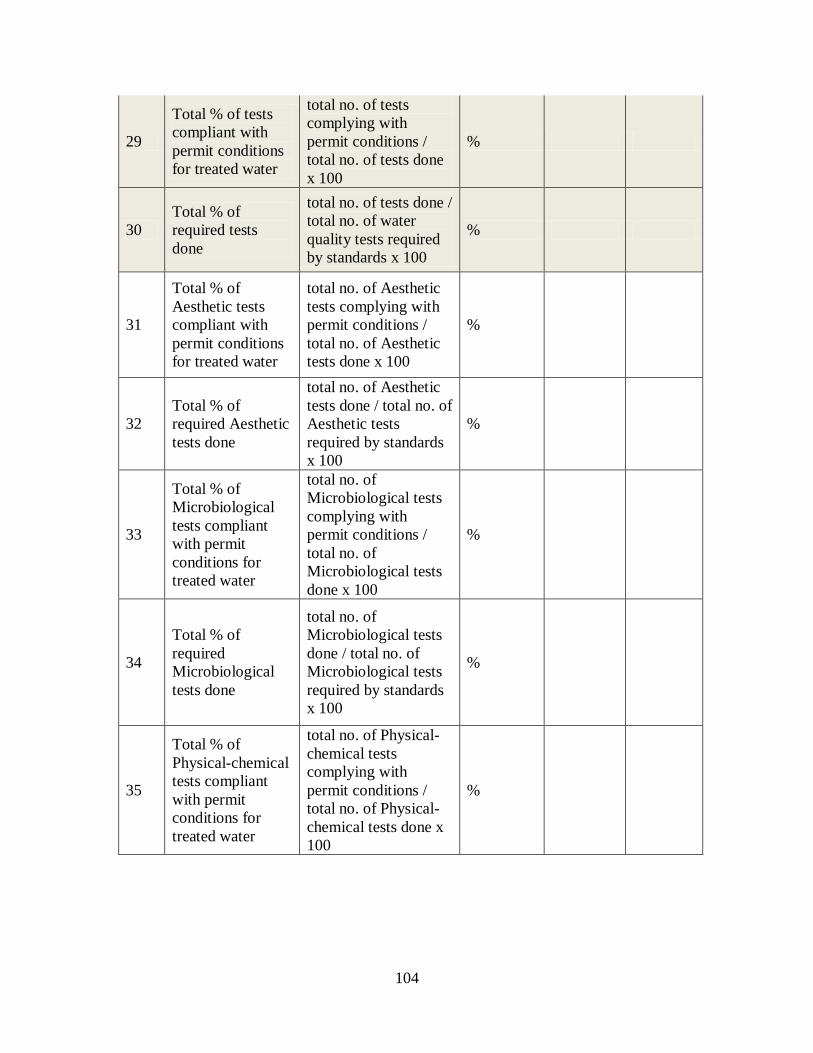
104
29
Total % of tests
compliant with
permit conditions
for treated water
total no. of tests
complying with
permit conditions /
total no. of tests done
x 100
%
30
Total % of
required tests
done
total no. of tests done /
total no. of water
quality tests required
by standards x 100
%
31
Total % of
Aesthetic tests
compliant with
permit conditions
for treated water
total no. of Aesthetic
tests complying with
permit conditions /
total no. of Aesthetic
tests done x 100
%
32
Total % of
required Aesthetic
tests done
total no. of Aesthetic
tests done / total no. of
Aesthetic tests
required by standards
x 100
%
33
Total % of
Microbiological
tests compliant
with permit
conditions for
treated water
total no. of
Microbiological tests
complying with
permit conditions /
total no. of
Microbiological tests
done x 100
%
34
Total % of
required
Microbiological
tests done
total no. of
Microbiological tests
done / total no. of
Microbiological tests
required by standards
x 100
%
35
Total % of
Physical-chemical
tests compliant
with permit
conditions for
treated water
total no. of Physical-
chemical tests
complying with
permit conditions /
total no. of Physical-
chemical tests done x
100
%
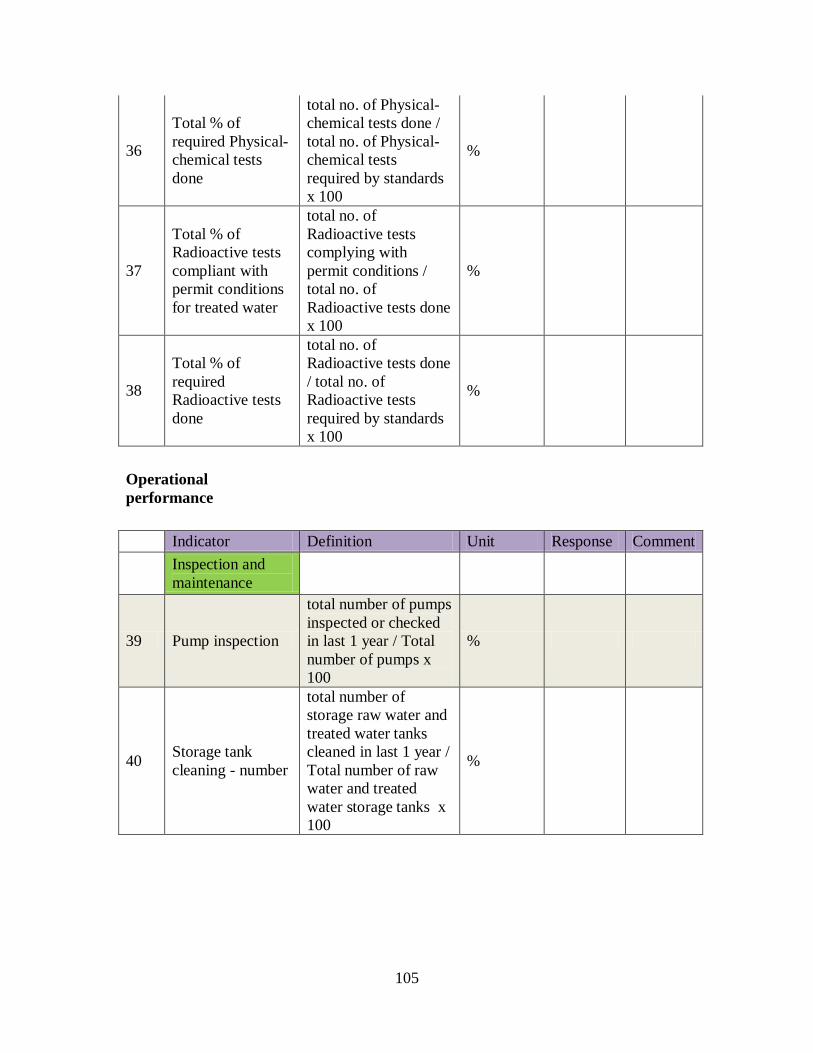
105
36
Total % of
required Physical-
chemical tests
done
total no. of Physical-
chemical tests done /
total no. of Physical-
chemical tests
required by standards
x 100
%
37
Total % of
Radioactive tests
compliant with
permit conditions
for treated water
total no. of
Radioactive tests
complying with
permit conditions /
total no. of
Radioactive tests done
x 100
%
38
Total % of
required
Radioactive tests
done
total no. of
Radioactive tests done
/ total no. of
Radioactive tests
required by standards
x 100
%
Operational
performance
Indicator Definition Unit Response Comment
Inspection and
maintenance
39 Pump inspection
total number of pumps
inspected or checked
in last 1 year / Total
number of pumps x
100
%
40 Storage tank
cleaning - number
total number of
storage raw water and
treated water tanks
cleaned in last 1 year /
Total number of raw
water and treated
water storage tanks x
100
%

106
41 Storage tank
cleaning - volume
total volume of raw
water and treated
water storage tanks
cleaned in last 1 year /
Total volume of all
raw water and treated
water storage tanks x
100
%
42 Main inspection
total length of
transmission and
distribution main
pipes inspected -
physical inspection for
proper working
condition, internal
inspection by video,
flow measurements to
calculate head loss
etc. / Total length of
mains x 100
%
43 Valve Inspection
number of valves
inspected - checked to
insure it is operational
/ Total number of
valves x 100
%
44 Hydrant
inspection
number of hydrants
inspected - checked to
insure it is operational
/ Total number of
hydrants x 100
%
Instrumentation
calibration
45
System flow
meter calibration -
in last 1 year
number of meters
calibrated / total
number of meters x
100
%
46 Meter replacement
rate - in last 1 year
number of meters
calibrated / total
number of meters x
100
%
47
Pressure meter
calibration - in last
1 year
number of meters
calibrated / total
number of meters x
100
%

107
48
Water level meter
calibration - in last
1 year
number of meters
calibrated / total
number of meters x
100
%
49
Online water
quality monitoring
equipment
calibration - in last
1 year
number of equipment
calibrated / total
number of equipment
x 100
%
Sustainability/
rehabilitation
50 Leakage control
number of leaks or
main breaks detected
and repaired - in last 1
year / total length of
main x 100
number /
100 miles
51
Transmission
Main replaced /
rehabilitated - in
last 1 year
length of transmission
mains replaced or
rehabilitated- in last 1
year (miles) / Total
length of transmission
mains (miles) x 100
%
52
Distribution Main
replaced /
rehabilitated - in
last 1 year
length of distribution
mains replaced or
rehabilitated- in last 1
year (miles) / Total
length of distribution
mains (miles) x 100
%
53
Valves
replacement - in
last 1 year
no. of valves replaced
/ total no. of valves x
100
%
54
Service
connection
rehabilitation - in
last 1 year
no. of service
connections replaced
or renovated / total
number of
connections x 100
%
55
Pump
refurbishment - in
last 1 year
number of pumps
refurbished / total
number of pumps x
100
%
56 Pump replacement
- in last 1 year
number of pumps
replaced / total
number of pumps x
%

108
100
Water losses
57 Water loss per
connection
total water lost in
gallons or total non-
revenue water - in last
1 year / Total number
of connections
gallons /
connection
58 % water lost
total water lost or
total non-revenue
water - in last 1 year /
Total treated water
produced - in last 1
year
%
Water meter
59 Operational
meters
no. of working
customer meters/total
customer meters x 100
%
60
Unmetered water -
volume which is
charged but not
metered
volume of supplied
water which is not
metered - daily
average / Total
volume of treated
water supplied - daily
average x 100
%
Customer enquiries
Indicator Definition Unit Response Comment
61
Service enquiries
per 100
connection
total number of
enquiries - in last 1
year / total number of
connections
number /
100
connection
62 Pressure related
reports
no. of pressure related
reports - in last 1 year
/ total no. of reports x
100
%
63 Continuity related
reports
no. of Continuity
related reports - in last
1 year / total no. of
reports x 100
%

109
64
Water quality -
taste related
reports
no. of taste related
reports - in last 1 year
/ total no. of reports x
100
%
65
Water quality -
odor related
reports
no. of odor related
reports - in last 1 year
/ total no. of reports x
100
%
66 Interruption
related reports
no. of Interruption
related reports - in last
1 year / total no. of
reports x 100
%
67 Billing related
no. of Interruption
related reports - in last
1 year / total no. of
reports x 101
%
Financial performance
Indicator Definition Unit Response Comment
Revenue
68
Revenue per Mgal
treated water
produced - in last
1 year
total revenue in last 1
year / Total treated
water produced in last
1 year
$ / Mgal
69 Sales revenue in
last 1 year
revenue generated by
sales / Total revenue
x 100
%
70 Other revenue in
last 1 year
revenue generated
which are not from
sales / Total revenue x
100
%
Cost
71
Total cost per
Mgal treated
water produced -
in last 1 year
capital cost plus
Operating cost - in last
1 year / Total treated
water produced in last
1 year
$ / Mgal
72
Capital cost per
Mgal treated
water produced -
in last 1 year
total Capital cost in
last 1 year / Total
treated water
produced in last 1 year
$ / Mgal

110
73
Operating cost per
Mgal treated
water produced -
in last 1 year
total Operating cost in
last 1 year / Total
treated water
produced in last 1 year
$ / Mgal
% Operational
Cost by type
74
% of
Transmission,
storage and
distribution cost -
in last 1 year
total cost related to
Transmission, storage
and distribution
process / Total
Operational cost
%
75
% of Water
Treatment and
water testing cost
- in last 1 year
total cost related to
Water Treatment and
water testing / Total
Operational cost
%
76
% of Energy /
Electricity used
cost - in last 1
year
total cost related to
Energy / Electricity
used / Total
Operational cost
%
77
% of Meter
management and
connection related
cost - in last 1
year
total cost related to
Meter management
and connection related
/ Total Operational
cost
%
78
Any other
operational cost -
in last 1 year
any other cost / Total
Operational cost %
Expenses on
assets
79 Total expenses -
in last 1 year
total expenses on
plant and equipment –
new / replacement /
renovation - In the last
1 year / Total treated
water produced in last
1 year
$ / Mgal
80 % on New assets -
in last 1 year
expenses on new
assets / Total expenses
x 100
%
81
% on
Replacement and
renovation - in last
1 year
expenses on
replacement and
renovation of existing
assets / Total expenses
x100
%

111
Water rate
(calculated using
sales revenue and
water produced)
82
Average Water
charges from
direct
consumption
total Sales revenue -
in last 1 year / Total
treated water
produced in last 1 year
$ / Mgal
83
Water rate which
utility charges the
consumer
as per the standard
utility rate $ / Mgal
Efficiency
84 Total cost
coverage
total revenue in last 1
year / total cost in last
1 year
-
85 Operational cost
coverage
total revenue in last 1
year / total operational
cost in last 1 year
-
86
Current Ratio
(Liquidity
measure)
total current assets
value / total current
liabilities value
-
87 Asset turnover
ratio
sales revenue in last 1
year / total current
assets value
-
88
Water Loss cost -
non revenue water
cost
estimated cost of non-
revenue water - in last
1 year / Total
Operating cost in last
1 year x 100
%
Earnings
89
Earnings per
million gallons of
treated water
produced
total earnings - in last
1 year /Total treated
water produced in last
1 year
$ / Mgal

112
APPENDIX C: DATA MINING SHEET – WASTEWATER
Essential
Preferable
Wastewater and biosolids
Sr.
No Indicator Definition Unit Response Comment
Wastewater
1
Compliance with
discharge consents -
last 1 year
current number of
Population
Equivalent (PE)
served by WW
treatment plant
complying with
discharge consents
/ Total Population
Equivalent (PE)
served x 100
%
2 Reuse
volume of
wastewater reused
after treatment in
last 1 year / Total
volume of
wastewater treated
in last 1 year x 100
%
Biosolids
3 Biosolid production
dry weight of
biosolids produced
in last 1 year /
Total Population
Equivalent (PE)
served
lbs / PE /
year
4 Biosolid use
dry weight of
produced biosolids
used for
agriculture,
products, materials
etc. - in last 1 year /
dry weight of
Biosolids produced
in last 1 year x 100
%

113
5 Biosolid disposal
dry weight of
Biosolids disposed
- in last 1 year / dry
weight of Biosolids
produced in last 1
year x 100
%
Employee information
Sr.
No Indicator Definition Unit Response Comment
Total employee
6
Employee per 1000
population
equivalent served
total no. of
employees / total
population
equivalent served
x 1000
number /
1000
7
Employee per
million gallons of
wastewater treated
total no. of
employees /
Million gallons of
wastewater treated
daily
number /
Mgal
Employee as per
function
8 Higher management
employees
number of full time
equivalent
employees
dedicated to
directors, central
administration,
strategic planning,
marketing and
communications,
legal affairs,
environmental
management,
business
development / total
number of
employee x 100
%

114
9 Human resources
employees
number of full time
employees
dedicated to
personnel
administration,
education and
training,
occupational safety
and social activities
/ total number of
employee x 100
%
10
Financial and
commercial
employees
number of full time
equivalent
employees
dedicated to
economic and
financial planning,
economic
administration,
economic
controlling and
purchasing / total
number of
employee x 100
%
11 Customer Service
employees
number of full time
equivalent
employees
dedicated to
customer relations /
total number of
employee x 100
%
12
Planning, designing
and construction
employees
number of
employees working
in planning,
designing &
construction / total
number of
employee x 100
%
13
Operations and
maintenance
employees
number of
employees working
in operations &
maintenance of the
utility / total
number of
employee x 100

115
14
Wastewater quality
monitoring
employees (lab
personnel)
number of lab
testing employees /
total number of
employee x 100
%
Training
15 Personnel training
total training hours
for all the
employees in last 1
year / total number
of employees
hours /
employee
/ year
Personnel health and
safety
16
Working accidents -
% of employees
injured in last 1 year
(%)
number of
employees injured
on the job in the
last 1 year / total
number of
employees x 100
%
17 Absences due to
accidents
sum of all the
absences due to all
the employees due
to reasons related
to accident in last 1
year / total number
of employees
days /
employee
/ year
18 Vaccination
total number of
maintenance,
operations and lab
testing employees
with vaccination
for sewage and
waste related
diseases / total
number of
employees in
maintenance,
operations and lab
testing x 100
%

116
Treatment process
Sr.
No Indicator Definition Unit Response Comment
19
Treatment plant
utilization - primary
treatment
average daily
volume of
wastewater which
received primary
treatment / Total
daily capacity for
primary treatment x
100
%
20
Treatment plant
utilization -
secondary treatment
average daily
volume of
wastewater which
received secondary
treatment / Total
daily capacity for
secondary
treatment x 100
%
21
Treatment plant
utilization - tertiary
treatment
average daily
volume of
wastewater which
received tertiary
treatment / Total
daily capacity for
tertiary treatment x
100
%
22 Energy consumption
monthly energy
used by the utility /
Million gallons of
wastewater treated
every month
kwh /
Mgal
23 Pumping utilization
sum, for all
installed pumps, of
the number of
average daily
operation hours
multiplied by the
per hour pumping
capacity for 1 day /
Sum, for all
installed pumps, 24
multiplied by the
per hour pumping
capacity x 100
%

117
Treatment performance
Sr.
No Indicator Definition Unit Response Comment
24 Population coverage
total Population
served / Total
population of the
service area x 100
Wastewater
Treatment levels
25 Total treatment level
million gallons of
wastewater treated
daily / total daily
volume of
wastewater
entering the
treatment plant x
100
%
26 Primary treatment
level
average daily
volume of
wastewater which
received primary
treatment / total
daily volume of
wastewater
entering the
treatment plant x
100
%
27 Secondary treatment
level
average daily
volume of
wastewater which
received secondary
treatment / total
daily volume of
wastewater
entering the
treatment plant x
100
%
28 Tertiary treatment
level
average daily
volume of
wastewater which
received tertiary
treatment / total
daily volume of
%

118
wastewater
entering the
treatment plant x
100
Quality of testing
Total tests
29
Total tests-Total %
of tests compliant
with permit
conditions
total no. of tests
complying with
permit conditions /
total no. of tests
done x 100
%
30 Total tests-Total %
of required test done
total no. of tests
done / total no. of
quality tests
required by permit
conditions x 100
%
Wastewater - BOD test
31
Wastewater - BOD
test-Total % of tests
compliant with
permit conditions
total no. of tests
complying with
permit conditions /
total no. of tests
done x 100
%
32
Wastewater - BOD
test-Total % of
required test done
total no. of tests
done / total no. of
quality tests
required by permit
conditions x 100
%
Wastewater - COD test
33
Wastewater - COD
test-Total % of tests
compliant with
permit conditions
total no. of tests
complying with
permit conditions /
total no. of tests
done x 100
%
34
Wastewater - COD
test-Total % of
required test done
total no. of tests
done / total no. of
quality tests
required by permit
conditions x 100
%
Wastewater - TSS test
35
Wastewater - TSS
test-Total % of tests
compliant with
permit conditions
total no. of tests
complying with
permit conditions /
total no. of tests
done x 100
%
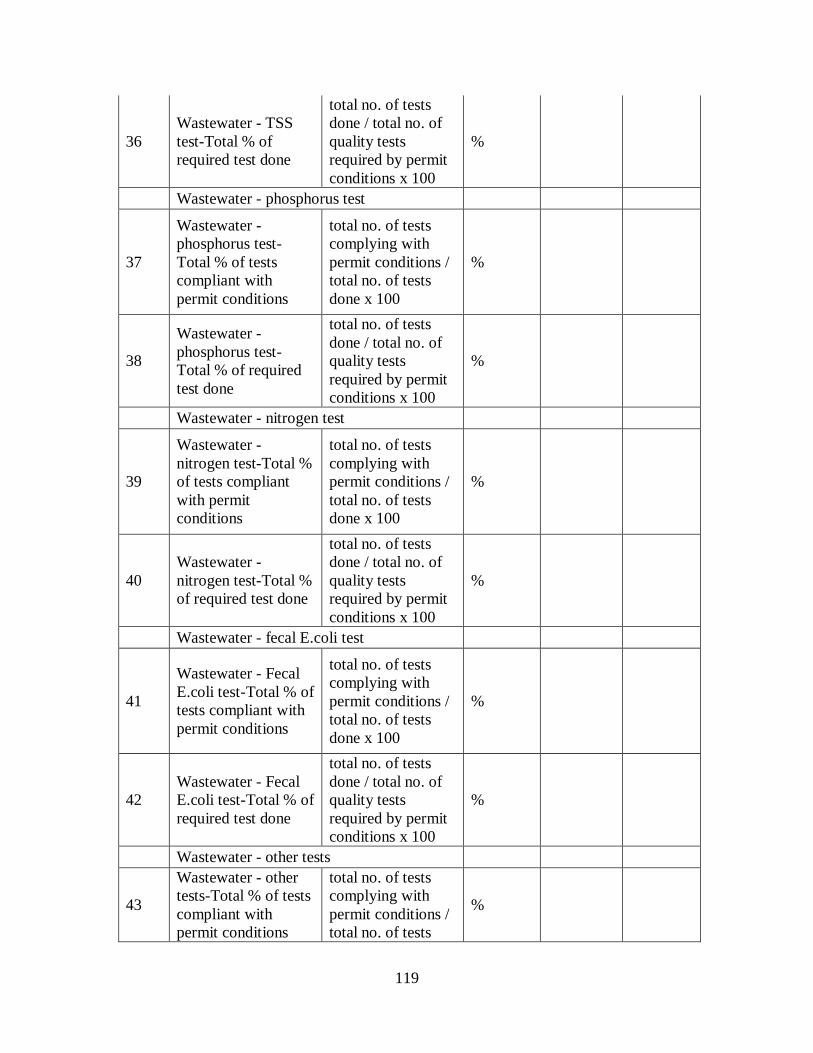
119
36
Wastewater - TSS
test-Total % of
required test done
total no. of tests
done / total no. of
quality tests
required by permit
conditions x 100
%
Wastewater - phosphorus test
37
Wastewater -
phosphorus test-
Total % of tests
compliant with
permit conditions
total no. of tests
complying with
permit conditions /
total no. of tests
done x 100
%
38
Wastewater -
phosphorus test-
Total % of required
test done
total no. of tests
done / total no. of
quality tests
required by permit
conditions x 100
%
Wastewater - nitrogen test
39
Wastewater -
nitrogen test-Total %
of tests compliant
with permit
conditions
total no. of tests
complying with
permit conditions /
total no. of tests
done x 100
%
40
Wastewater -
nitrogen test-Total %
of required test done
total no. of tests
done / total no. of
quality tests
required by permit
conditions x 100
%
Wastewater - fecal E.coli test
41
Wastewater - Fecal
E.coli test-Total % of
tests compliant with
permit conditions
total no. of tests
complying with
permit conditions /
total no. of tests
done x 100
%
42
Wastewater - Fecal
E.coli test-Total % of
required test done
total no. of tests
done / total no. of
quality tests
required by permit
conditions x 100
%
Wastewater - other tests
43
Wastewater - other
tests-Total % of tests
compliant with
permit conditions
total no. of tests
complying with
permit conditions /
total no. of tests
%

120
done x 100
44
Wastewater - other
tests-Total % of
required test done
total no. of tests
done / total no. of
quality tests
required by permit
conditions x 100
%
Biosolids tests
45
Biosolids tests-Total
% of tests compliant
with permit
conditions
total no. of tests
complying with
permit conditions /
total no. of tests
done x 100
%
46
Biosolids tests-Total
% of required test
done
total no. of tests
done / total no. of
quality tests
required by permit
conditions x 100
%
Industrial discharge tests
47
Industrial discharge
tests-Total % of tests
compliant with
permit conditions
total no. of tests
complying with
permit conditions /
total no. of tests
done x 100
%
48
Industrial discharge
tests-Total % of
required test done
total no. of tests
done / total no. of
quality tests
required by permit
conditions x 100
%
Operational performance
Sr.
No Indicator Definition Unit Response Comment
Inspection and
maintenance
49 Sewer Inspection
length of sewer
inspected (miles)
/checked in last 1
year / total length
of sewer (miles) x
100
%

121
50 Sewer Cleaning
length of sewer
(miles) cleaned in
last 1 year / total
length of sewer
(miles) x 100
%
51 Manhole chamber
inspection
Total number of
Manhole chamber
inspected or
checked in last 1
year / Total number
of Manhole
chamber x 100
%
52 Storage and CSOs
inspection rate
no. of storage tanks
and CSOs
inspected or
checked in last 1
year / total no. of
storage tanks and
CSOs x 100
%
53 Storage and CSOs
inspected volume
volume of Storage
tanks and CSOs
inspected or
checked in last 1
year / total volume
of storage tanks
and CSOs x 100
%
54 Storage and CSOs
cleaning
volume of Storage
tanks and CSOs
cleaned / total
volume of storage
tanks and CSOs x
100
%
55 Pump inspection
total number of
pumps inspected or
checked in last 1
year / Total number
of pumps x 100
%
Calibration
56 System flow meters
total number of
flow meters
calibrated in last 1
year / total no. of
flow meters x 100
%

122
57
Wastewater quality
monitoring
instrument
total number of
quality monitoring
instrument
calibrated in last 1
year / total number
of quality
monitoring
instrument x 100
%
Renewal
58
Sewer
replaced/rehabilitated
- in last 1 year
length of Sewer
(miles) replaced or
rehabilitated - in
last 1 year / total
length of sewer
(miles) x 100
%
59
Manhole chamber
replaced/rehabilitated
- in last 1 year
total no. of
manhole chambers
replaced or
rehabilitated - in
last 1 year / total
no. of manhole
chambers x 100
%
60
Manhole covers
replaced - in last 1
year
no. of manhole
covers replaced - in
last 1 year / total
no. of manhole
covers x 100
%
Blockages and
breaks
61 Sewer blockage - in
last 1 year
total number of
sewer blocks
occurred - in last 1
year / total length
of sewer x 100
number /
100 mile
62 Sewer breaks - in last
1 year
total number of
sewer breaks or
damage to the
sewer - in last 1
year / total length
of sewer x 100
number /
100 mile

123
Customer enquiries
Sr.
No Indicator Definition Response Comment
63
Total Service
enquiries per 1000
Population
Equivalent served
total number of
enquiries - in last 1
year / Total
population
equivalent (PE)
served x 1000
number /
1000 PE
served
64 Reports related to
odor
no. of odor related
reports - in last 1
year / total no. of
reports x 100
%
65 Reports related to
flooding
no. of flooding
related reports - in
last 1 year / total
no. of reports x 100
%
66 Reports related to
pollution
no. of pollution
related reports - in
last 1 year / total
no. of reports x 100
%
67 Reports related to
rodent
no. of rodent
related reports - in
last 1 year / total
no. of reports x 100
%
68 Blockage
no. of blockage
related reports - in
last 1 year / total
no. of reports x 100
%
69 Billing related
no. of Billing
related complains -
in last 1 year / total
no. of reports x 100
%

124
Financial performance
Sr.
No Indicator Definition Unit Response Comment
Revenue
70
Revenue per
population
equivalent (PE)
served - in last 1 year
total revenue in last
1 year / Total
Population
Equivalent (PE)
served
$ / PE
71 Service revenue in
last 1 year
revenue generated
by Service / Total
revenue x 100
%
72 Other revenue in last
1 year
revenue generated
which are not from
sales / Total
revenue x 100
%
Cost
73
Total cost per
population
equivalent (PE)
served - in last 1 year
capital cost plus
Operating cost - in
last 1 year / Total
Population
Equivalent (PE)
served
$ / PE
74 Capital cost per PE
served - in last 1 year
total Capital cost in
last 1 year / Total
Population
Equivalent (PE)
served
$ / PE
75 Operating cost PE
served - in last 1 year
total Operating cost
in last 1 year /
Total Population
Equivalent (PE)
served
$ / PE
% Operational Cost
by type
76 % of sewer system
cost - in last 1 year
total cost related to
sewer system
operation / Total
Operational cost x
100
%

125
77 % of Treatment cost
- in last 1 year
total cost related to
Treatment and
testing cost / Total
Operational cost x
100
%
78
% of Energy /
Electricity used cost
- in last 1 year
total cost related to
Energy or
Electricity used /
Total Operational
cost
%
79 % of testing related
cost - in last 1 year
total cost related to
testing / Total
Operational cost x
100
%
80
Any other
operational cost - in
last 1 year
any other cost /
Total Operational
cost x 100
%
Expenses
81 Total expenses - in
last 1 year
total expenses on
plant and
equipment - new +
replacement +
renovation - In the
last 1 year / Total
Population
Equivalent (PE)
served
$ / PE
82 % on New assets - in
last 1 year
expenses on new
assets / Total
investment x 100
%
83
% on Replacement
and renovation - in
last 1 year
expenses on
replacement and
renovation of
existing assets /
Total investment x
100
%
Sewer collection rate
84
Sewer collection rate
which utility charges
the consumer
as per the standard
utility rate
$ / 1000
gal
Efficiency

126
85 Total cost coverage
total revenue in last
1 year / total cost in
last 1 year
-
86 Operational cost
coverage
total revenue in last
1 year / total
operational cost in
last 1 year
-
87 Current Ratio
(Liquidity measure)
total current assets
value / total current
liabilities value
-
88 Asset turnover ratio
Sales revenue in
last 1 year / total
current assets value
-
Earnings
89
Earnings per million
gallons of
wastewater treated
total earning - in
last 1 year / Total
wastewater treated
in last 1 year
$ / Mgal