gcseprep.com · web view2019/05/01 · 1.3 biological molecules – lipids questions. q1. (a) some...
TRANSCRIPT
1.3 BIOLOGICAL MOLECULES – LIPIDS QUESTIONS
Q1. (a) Some seeds contain lipids. Describe how you could use the emulsion test to show that a seed contains lipids.
___________________________________________________________________
___________________________________________________________________
___________________________________________________________________
___________________________________________________________________
___________________________________________________________________
___________________________________________________________________
___________________________________________________________________
(Extra space)________________________________________________________
___________________________________________________________________
___________________________________________________________________(3)
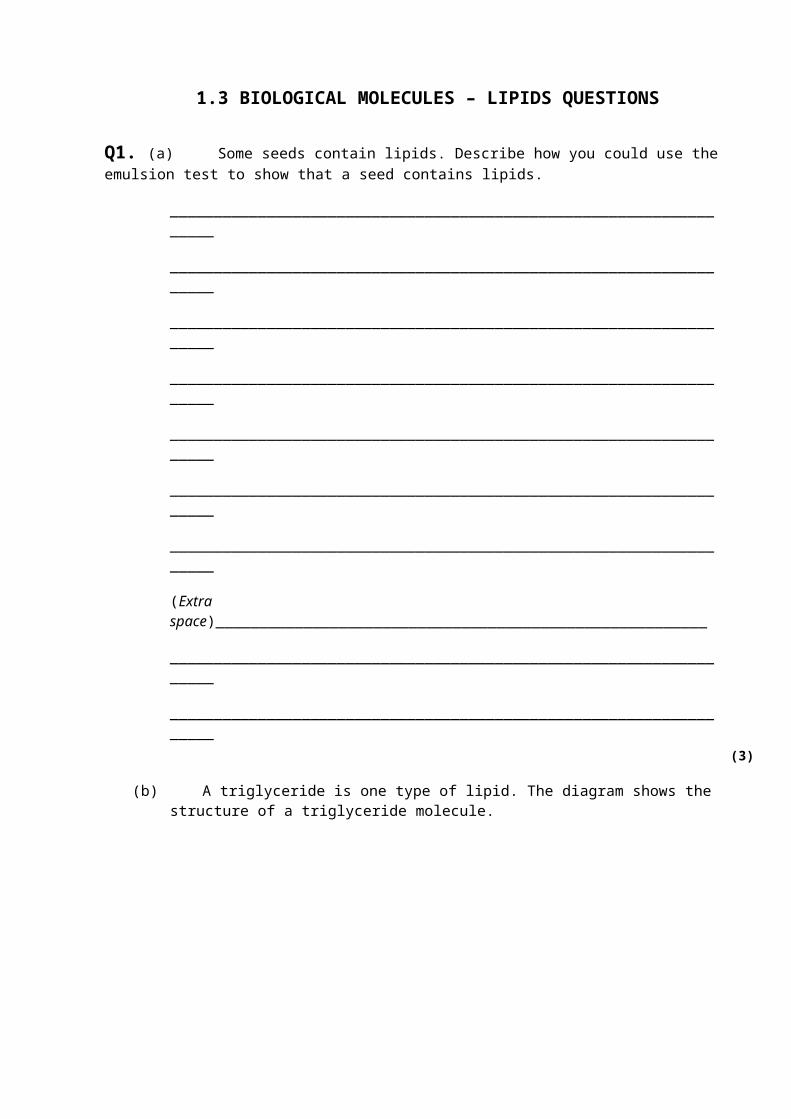
(b) A triglyceride is one type of lipid. The diagram shows the structure of a triglyceride molecule.
(i) A triglyceride molecule is formed by condensation. From how many molecules is this triglyceride formed?
(1)
(ii) The structure of a phospholipid molecule is different from that of a triglyceride.Describe how a phospholipid is different.
______________________________________________________________
______________________________________________________________
______________________________________________________________
______________________________________________________________
______________________________________________________________(2)
(iii) Use the diagram to explain what is meant by an unsaturated fatty acid.
______________________________________________________________
______________________________________________________________
______________________________________________________________
______________________________________________________________
______________________________________________________________(2)
(Total 8 marks)
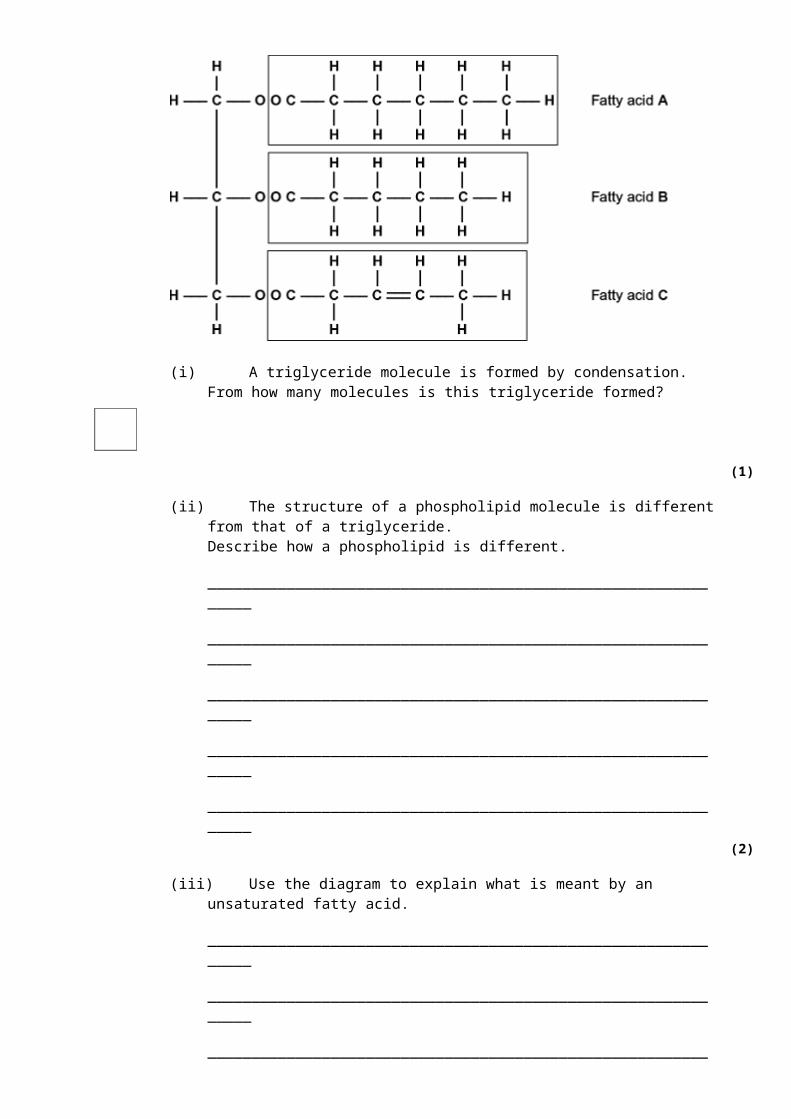
Q2. The diagram shows four biological molecules.
(a) Give the full name of:
Molecule A _____________________________________________________
Molecule B _____________________________________________________(2)
(b) What type of molecule is molecule C?
___________________________________________________________________(2)
(c) Glycine, shown in the diagram, is an amino acid.
In the space below, draw a diagram to show the dipeptide produced when two molecules of glycine are joined together.
(2)
(d) Name the other molecule formed when two molecules of glycine are joined together.
___________________________________________________________________(1)
(Total 7 marks)
Q3. (a) Omega-3 fatty acids are unsaturated. What is an unsaturated fatty acid?
___________________________________________________________________
___________________________________________________________________
___________________________________________________________________
___________________________________________________________________(2)
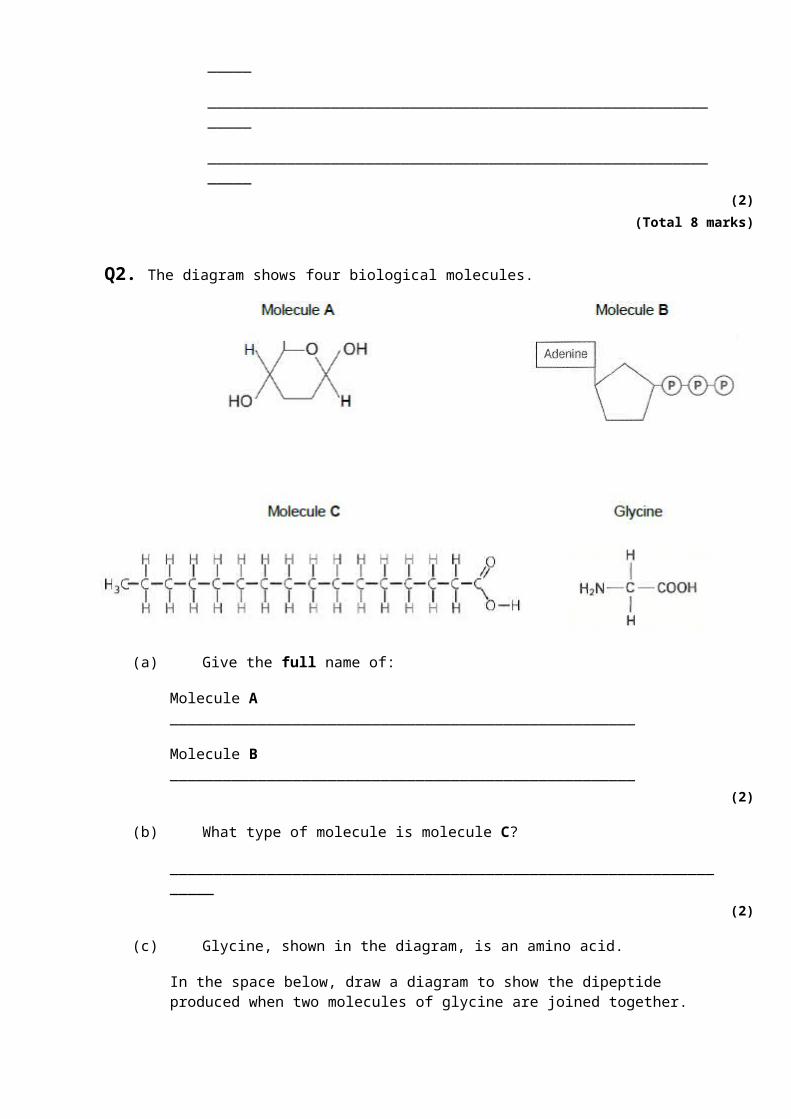
(b) Scientists investigated the relationship between the amount of omega-3 fatty acids eaten per day and the risk of coronary heart disease. The graph shows their results.
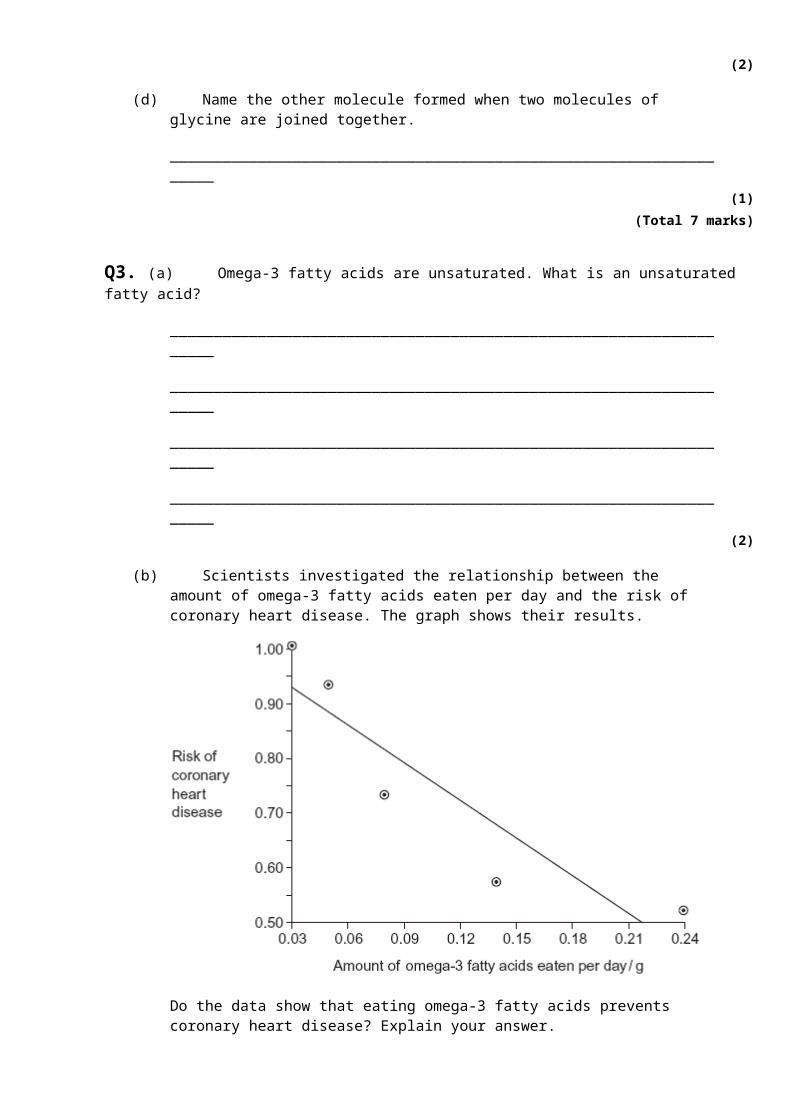
Do the data show that eating omega-3 fatty acids prevents coronary heart disease? Explain your answer.
___________________________________________________________________
___________________________________________________________________
___________________________________________________________________
___________________________________________________________________
___________________________________________________________________
___________________________________________________________________
___________________________________________________________________(3)
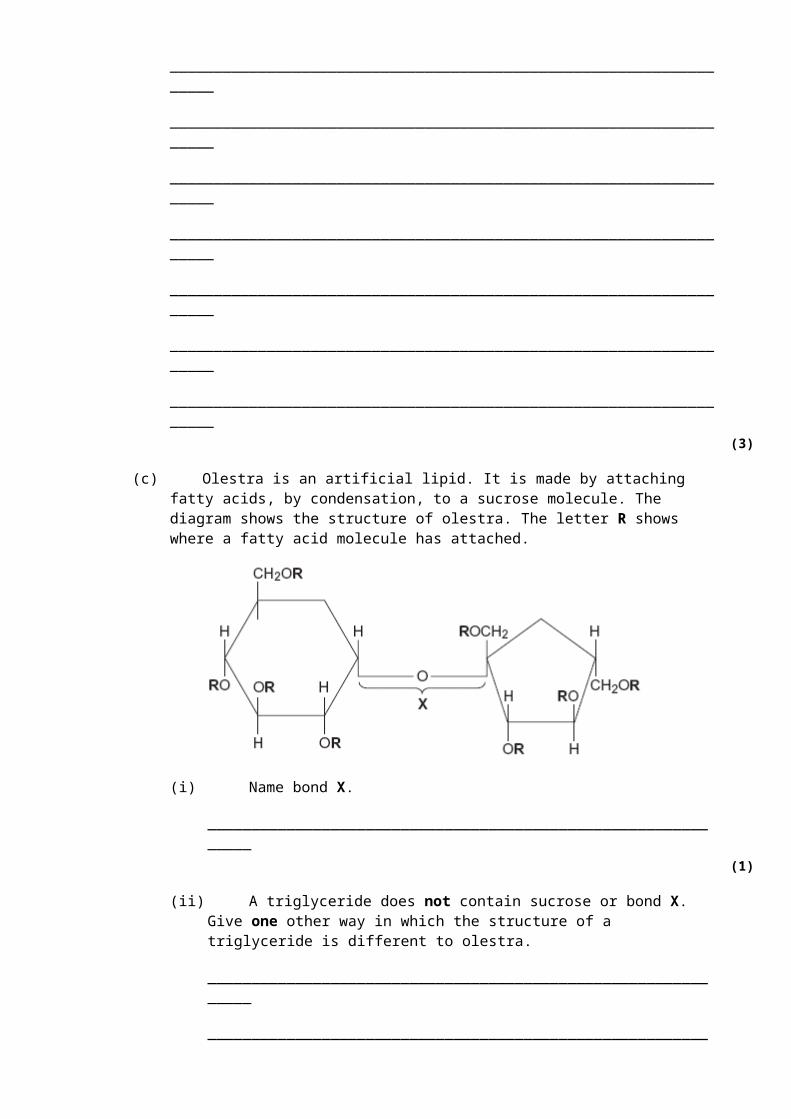
(c) Olestra is an artificial lipid. It is made by attaching fatty acids, by condensation, to a sucrose molecule. The diagram shows the structure of olestra. The letter R shows where a fatty acid molecule has attached.
(i) Name bond X.
______________________________________________________________(1)
(ii) A triglyceride does not contain sucrose or bond X. Give one other way in which the structure of a triglyceride is different to olestra.
______________________________________________________________
______________________________________________________________(1)
(iii) Starting with separate molecules of glucose, fructose and fatty acids, how many molecules of water would be produced when one molecule of olestra is formed?
(1)
(Total 8 marks)
Q4. Triglycerides are taken into the body as part of a balanced diet. These triglycerides contain fatty acids including omega-3 fatty acids. It has been discovered that omega-3 fatty acids are associated with health benefits. The benefits include faster development of nerve cells and clearer vision. Omega-3 fatty acids are also associated with protection from heart disease, arthritis and cancer.
Figure 1 shows how omega-3 and other fatty acids are taken in and used by the bodies of animals including humans.
Figure 1
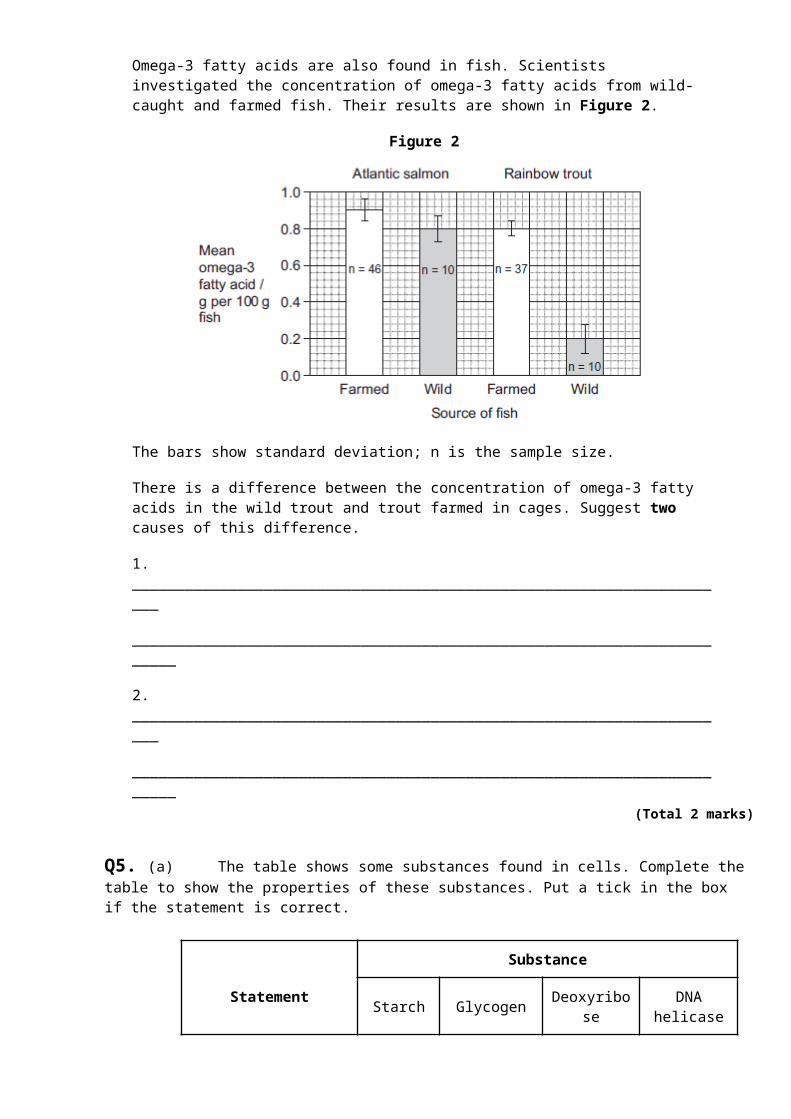
Omega-3 fatty acids are also found in fish. Scientists investigated the concentration of omega-3 fatty acids from wild-caught and farmed fish. Their results are shown in Figure 2.
Figure 2

The bars show standard deviation; n is the sample size.
There is a difference between the concentration of omega-3 fatty acids in the wild trout and trout farmed in cages. Suggest two causes of this difference.
1. _____________________________________________________________________
_______________________________________________________________________
2. _____________________________________________________________________
_______________________________________________________________________(Total 2 marks)
Q5. (a) The table shows some substances found in cells. Complete the table to show the properties of these substances. Put a tick in the box if the statement is correct.
Substance
Statement Starch Glycogen Deoxyribose DNA helicase
Substance contains only the elements carbon, hydrogen and oxygen
Substance is made from amino acid monomers
Substance is found in both animal cells and plant cells
(4)
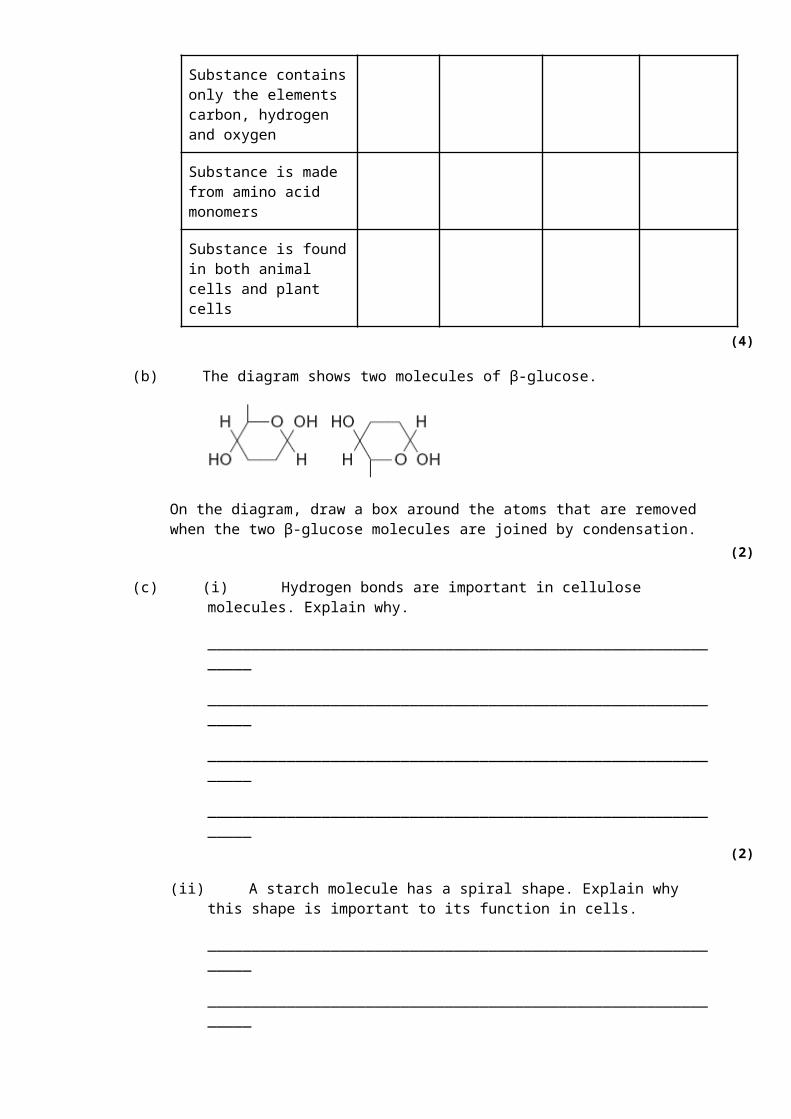
(b) The diagram shows two molecules of β-glucose.
On the diagram, draw a box around the atoms that are removed when the two β-glucose molecules are joined by condensation.
(2)
(c) (i) Hydrogen bonds are important in cellulose molecules. Explain why.
______________________________________________________________
______________________________________________________________
______________________________________________________________
______________________________________________________________(2)
(ii) A starch molecule has a spiral shape. Explain why this shape is important to its function in cells.
______________________________________________________________
______________________________________________________________
______________________________________________________________(1)
(Total 9 marks)
Q6. (a) Starch and protein are biologically important polymers.
(i) Explain what is meant by a polymer.
______________________________________________________________
______________________________________________________________(1)
(ii) Give one example of a biologically important polymer other than starch or protein.
______________________________________________________________(1)
(b) In an investigation, the enzyme amylase was mixed in a test tube with a buffer solution and a suspension of starch. The amylase broke down the starch to maltose. When all the starch had been broken down, a sample was removed from the test tube and tested with biuret reagent.
(i) Explain why a buffer solution was added to the amylase-starch mixture.
______________________________________________________________
______________________________________________________________
______________________________________________________________(2)
(ii) What colour would you expect the sample to go when tested with biuret reagent?
______________________________________________________________(1)
(iii) Give an explanation for your answer to part (ii)
______________________________________________________________
______________________________________________________________
______________________________________________________________(2)
(Total 7 marks)
Q7. (a) Describe the difference between the structure of a triglyceride molecule and the structure of a phospholipid molecule.
___________________________________________________________________
___________________________________________________________________
___________________________________________________________________(1)
(b) Describe how you would test for the presence of a lipid in a sample of food.
___________________________________________________________________
___________________________________________________________________
___________________________________________________________________
___________________________________________________________________(2)
(c) Animal fats contain triglycerides with a high proportion of saturated fatty acids. If people have too much fat in their diet, absorption of the products of fat digestion can increase the risk of obesity. To help people lose weight, fat substitutes can be used to replace triglycerides in food.
Describe how a saturated fatty acid is different from an unsaturated fatty acid.
___________________________________________________________________
___________________________________________________________________
___________________________________________________________________(1)
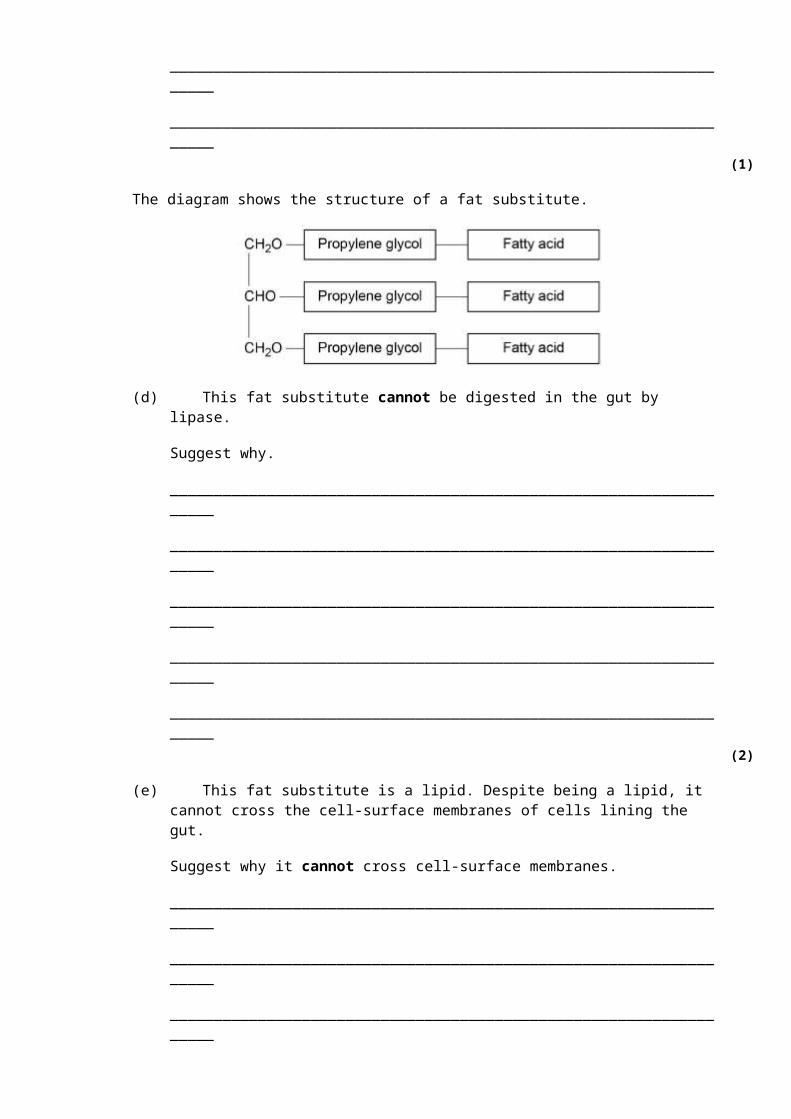
The diagram shows the structure of a fat substitute.
(d) This fat substitute cannot be digested in the gut by lipase.
Suggest why.
___________________________________________________________________
___________________________________________________________________
___________________________________________________________________
___________________________________________________________________
___________________________________________________________________(2)
(e) This fat substitute is a lipid. Despite being a lipid, it cannot cross the cell-surface membranes of cells lining the gut.
Suggest why it cannot cross cell-surface membranes.
___________________________________________________________________
___________________________________________________________________
___________________________________________________________________(1)
(Total 7 marks)
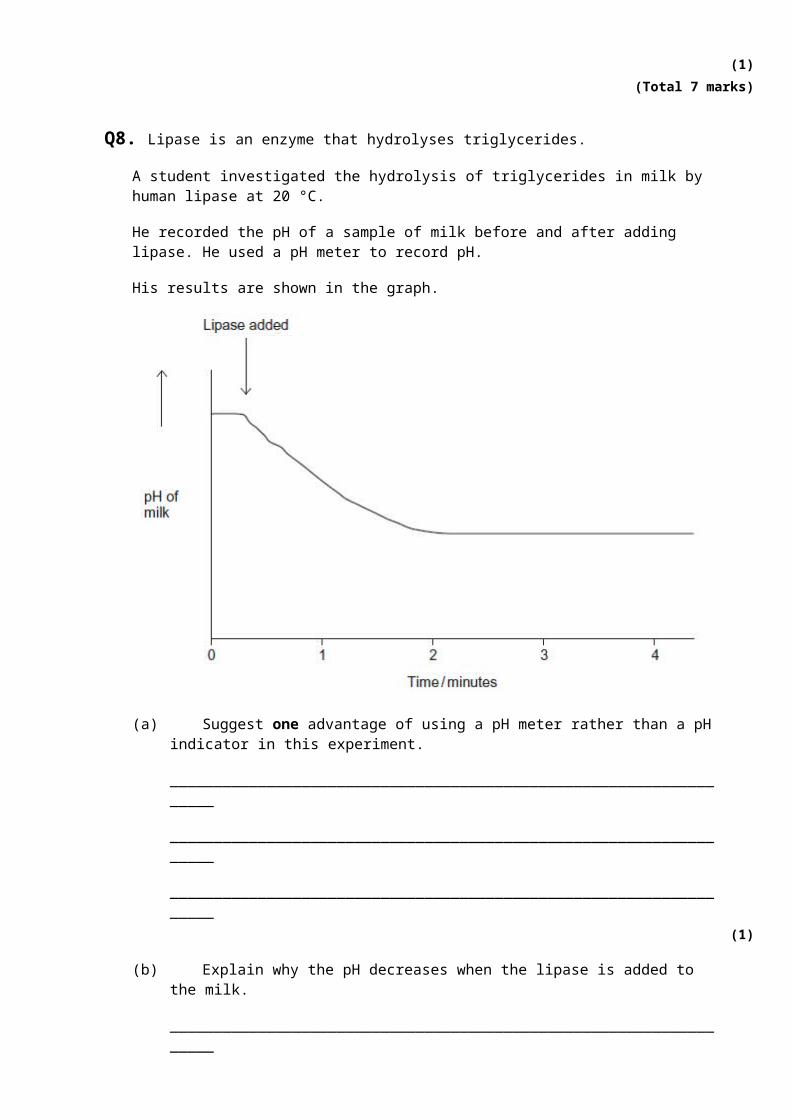
Q8. Lipase is an enzyme that hydrolyses triglycerides.
A student investigated the hydrolysis of triglycerides in milk by human lipase at 20 °C.
He recorded the pH of a sample of milk before and after adding lipase. He used a pH meter to record pH.
His results are shown in the graph.
(a) Suggest one advantage of using a pH meter rather than a pH indicator in this experiment.
___________________________________________________________________
___________________________________________________________________
___________________________________________________________________(1)
(b) Explain why the pH decreases when the lipase is added to the milk.
___________________________________________________________________
___________________________________________________________________
___________________________________________________________________(1)
(c) Suggest why the pH remained constant after 2 minutes.
___________________________________________________________________
___________________________________________________________________
___________________________________________________________________
___________________________________________________________________
___________________________________________________________________(2)
(d) The student carried out his experiment at 20 °C. He then repeated the experiment at 15 °C.Draw a line on the graph to show the results you would expect at 15 °C.
(2)
(Total 6 marks)
Q9. Triglycerides are taken into the body as part of a balanced diet. These triglycerides contain fatty acids including omega-3 fatty acids. It has been discovered that omega-3 fatty acids are associated with health benefits. The benefits include faster development of nerve cells and clearer vision. Omega-3 fatty acids are also associated with protection from heart disease, arthritis and cancer.
The following figure shows how omega-3 and other fatty acids are taken in and used by the bodies of animals including humans.
Use the information in the figure to explain two ways in which fatty acids are important in the formation of new cells.
1. _____________________________________________________________________
_______________________________________________________________________
_______________________________________________________________________
_______________________________________________________________________
2. _____________________________________________________________________
_______________________________________________________________________
_______________________________________________________________________
_______________________________________________________________________(Total 4 marks)
Q10. In an investigation, the effects of caffeine on performance during exercise were measured. One group of athletes (A) was given a drink of decaffeinated coffee. Another group (B) was given a drink of decaffeinated coffee with caffeine added. One hour later the athletes started riding an exercise bike and continued until too exhausted to carry on. Three days later the same athletes repeated the experiment, with the drinks exchanged.
(a) (i) The researchers added caffeine to decaffeinated coffee. Explain why they did not just use normal coffee.
______________________________________________________________
______________________________________________________________(1)
(ii) The performance of the athletes might have been influenced by how they expected the caffeine to affect them. How could the researchers avoid this possibility?
______________________________________________________________
______________________________________________________________(1)
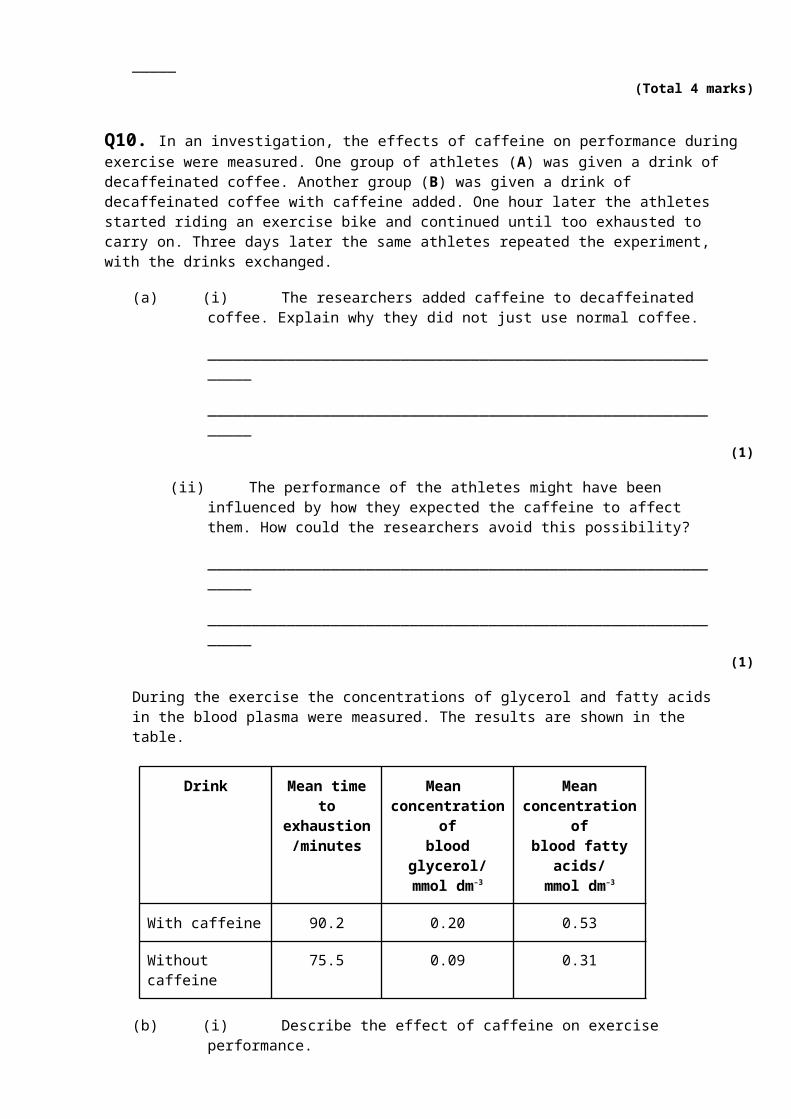
During the exercise the concentrations of glycerol and fatty acids in the blood plasma were measured. The results are shown in the table.
Drink Mean time to exhaustion
/minutes
Mean concentration ofblood glycerol/
mmol dm–3
Meanconcentration of
blood fatty acids/
mmol dm–3
With caffeine 90.2 0.20 0.53
Without caffeine 75.5 0.09 0.31
(b) (i) Describe the effect of caffeine on exercise performance.
______________________________________________________________
______________________________________________________________(1)
(ii) Suggest one explanation for the higher glycerol and fatty acid concentrations in the blood plasma of the athletes after they were given caffeine.
______________________________________________________________
______________________________________________________________
______________________________________________________________
______________________________________________________________(2)
(c) The researchers measured the volumes of carbon dioxide exhaled and oxygen inhaled during the exercise. From the results they calculated the respiratory quotient (RQ), using the formula

When a person is respiring carbohydrate only, RQ = 1.0
When a person is respiring fatty acids only, RQ = 0.7
(i) The basic equation for the respiration of glucose is
C6H12O6 + 6O2 → 6CO2 + 6H2O
Explain why the RQ for glucose is 1.0.
______________________________________________________________
______________________________________________________________
______________________________________________________________
______________________________________________________________(2)
(ii) The researchers found that, when the athletes were given the drink containing caffeine, their mean RQ was 0.85. When given the drink without caffeine their mean RQ was 0.92.
The researchers concluded that when the athletes had caffeine they used glycogen more slowly than when they did not have caffeine, and that the store of glycogen in their muscles was used up less quickly during the exercise.
Explain the evidence from the information above and from the table which supports these conclusions.
______________________________________________________________
______________________________________________________________
______________________________________________________________
______________________________________________________________
______________________________________________________________
______________________________________________________________(3)
(Total 10 marks)
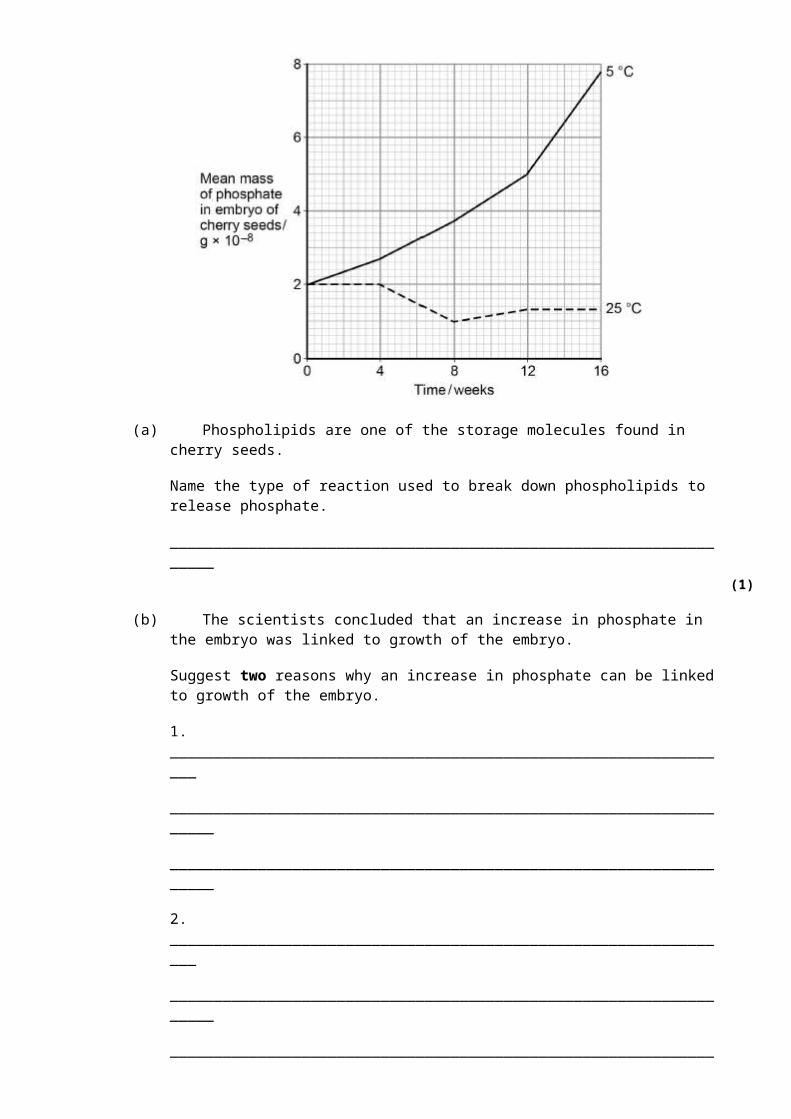
Q11. The seeds of some plant species require chilling (exposure to low temperatures) before the embryos they contain grow into plants. During chilling, storage molecules in the seed that contain phosphate are broken down and phosphates are transported to the embryo. Scientists investigated the change in the mass of phosphate in the embryos of cherry seeds exposed to two different temperatures for 16 weeks.
The following graph shows their results.

(a) Phospholipids are one of the storage molecules found in cherry seeds.
Name the type of reaction used to break down phospholipids to release phosphate.
___________________________________________________________________(1)
(b) The scientists concluded that an increase in phosphate in the embryo was linked to growth of the embryo.
Suggest two reasons why an increase in phosphate can be linked to growth of the embryo.
1. _________________________________________________________________
___________________________________________________________________
___________________________________________________________________
2. _________________________________________________________________
___________________________________________________________________
___________________________________________________________________(2)
(c) Calculate the ratio of the mean mass of phosphate found at 5 °C to the mean mass of phosphate found at 25 °C after 9 weeks of chilling.
Ratio = ____________________
(1)
(d) The chilling requirement of seeds of certain plant species is considered to be an adaptation for survival in countries with seasonal changes in environmental conditions.
Suggest how this adaptation may enable these plant species to survive and respond to seasonal changes.
___________________________________________________________________
___________________________________________________________________
___________________________________________________________________
___________________________________________________________________
___________________________________________________________________
___________________________________________________________________
___________________________________________________________________
___________________________________________________________________
___________________________________________________________________
___________________________________________________________________(3)
(Total 7 marks)
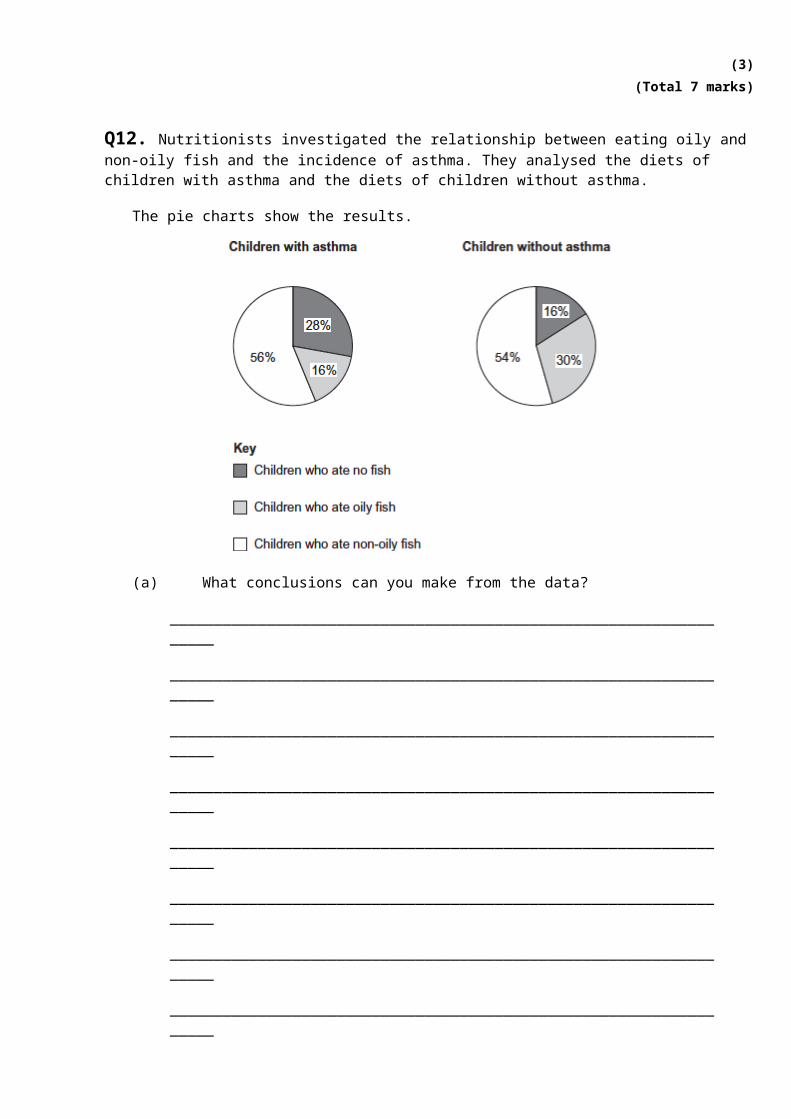
Q12. Nutritionists investigated the relationship between eating oily and non-oily fish and the incidence of asthma. They analysed the diets of children with asthma and the diets of children without asthma.
The pie charts show the results.
(a) What conclusions can you make from the data?
___________________________________________________________________
___________________________________________________________________
___________________________________________________________________
___________________________________________________________________
___________________________________________________________________
___________________________________________________________________
___________________________________________________________________
___________________________________________________________________
[Extra space] _______________________________________________________
___________________________________________________________________(3)
(b) Describe how you could use the emulsion test to show the presence of oil in a sample of fish.
___________________________________________________________________
___________________________________________________________________
___________________________________________________________________
___________________________________________________________________
___________________________________________________________________
___________________________________________________________________
___________________________________________________________________
___________________________________________________________________
[Extra space] _______________________________________________________
___________________________________________________________________(3)
(Total 6 marks)
Q13. Scientists investigated the effect of lipase and a 3% bile salts solution on the digestion of triglycerides. The graph below shows their results.
(a) Describe what curve Y shows about the effect of lipase and bile salts on the pH of the mixture.
___________________________________________________________________
___________________________________________________________________
___________________________________________________________________
___________________________________________________________________
___________________________________________________________________(2)
(b) The concentration of lipase did not change during the course of the investigation.Explain why.
___________________________________________________________________
___________________________________________________________________
___________________________________________________________________(1)
(c) One of the scientists decided to repeat the investigation at a temperature 10°C below the original temperature.Describe how you would expect his plotted curve to be different from curve Z.
___________________________________________________________________
___________________________________________________________________(1)
(Total 4 marks)
Q14. Newborn babies can be fed with breast milk or with formula milk. Both types of milk contain carbohydrates, lipids and proteins.
• Human breast milk also contains a bile-activated lipase. This enzyme is thought to be inactive in milk but activated by bile in the small intestine of the newborn baby.
• Formula milk does not contain a bile-activated lipase.
Scientists investigated the benefits of breast milk compared with formula milk.
(a) The scientists used kittens (newborn cats) as model organisms in their laboratory investigation.
Other than ethical reasons, suggest two reasons why they chose to use cats as model organisms.
1. _________________________________________________________________
___________________________________________________________________
2. _________________________________________________________________
___________________________________________________________________(2)
(b) Before starting their experiments, the scientists confirmed that, like human breast milk, cat’s milk also contained bile-activated lipase.
To do this, they added bile to cat’s milk and monitored the pH of the mixture.
Explain why monitoring the pH of the mixture could show whether the cat’s milk contained lipase.
___________________________________________________________________
___________________________________________________________________
___________________________________________________________________
___________________________________________________________________(2)
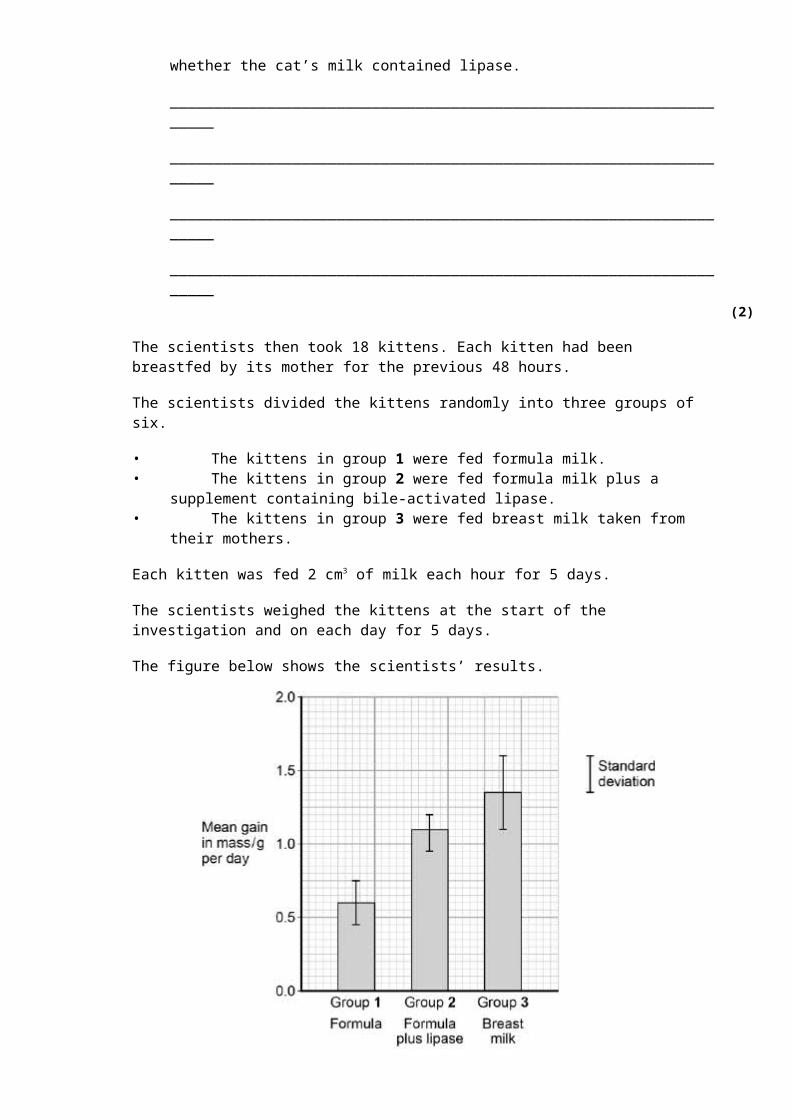
The scientists then took 18 kittens. Each kitten had been breastfed by its mother for the previous 48 hours.
The scientists divided the kittens randomly into three groups of six.
• The kittens in group 1 were fed formula milk.• The kittens in group 2 were fed formula milk plus a supplement containing bile-
activated lipase.• The kittens in group 3 were fed breast milk taken from their mothers.
Each kitten was fed 2 cm3 of milk each hour for 5 days.
The scientists weighed the kittens at the start of the investigation and on each day for 5 days.
The figure below shows the scientists’ results.

Type of milk given to kittens
(c) What can you conclude from the figure about the importance of bile-activated lipase in breast milk?
___________________________________________________________________
___________________________________________________________________
___________________________________________________________________
___________________________________________________________________
___________________________________________________________________
___________________________________________________________________
(Extra space) _______________________________________________________
___________________________________________________________________
___________________________________________________________________(3)
(Total 7 marks)
Q15. (a) Describe how you would test a piece of food for the presence of lipid.
___________________________________________________________________
___________________________________________________________________
___________________________________________________________________(2)
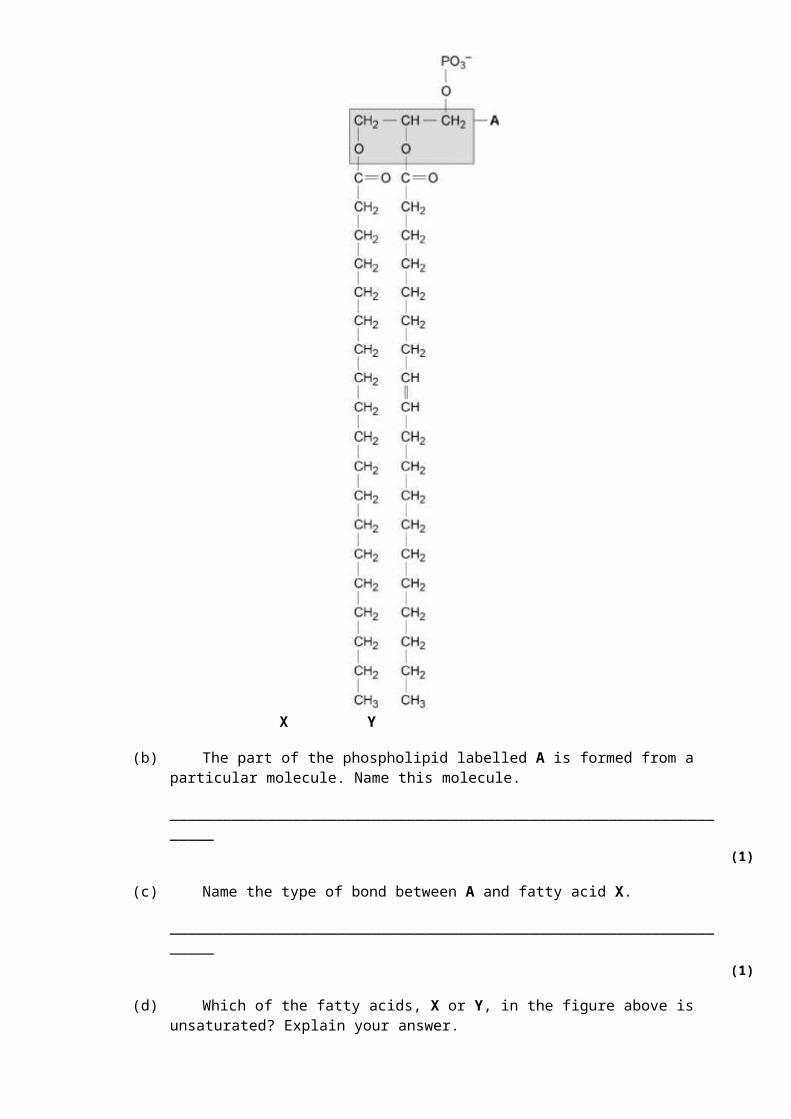
The figure below shows a phospholipid.
X Y
(b) The part of the phospholipid labelled A is formed from a particular molecule. Name this molecule.
___________________________________________________________________(1)
(c) Name the type of bond between A and fatty acid X.
___________________________________________________________________(1)
(d) Which of the fatty acids, X or Y, in the figure above is unsaturated? Explain your answer.
___________________________________________________________________
___________________________________________________________________
___________________________________________________________________
___________________________________________________________________(1)
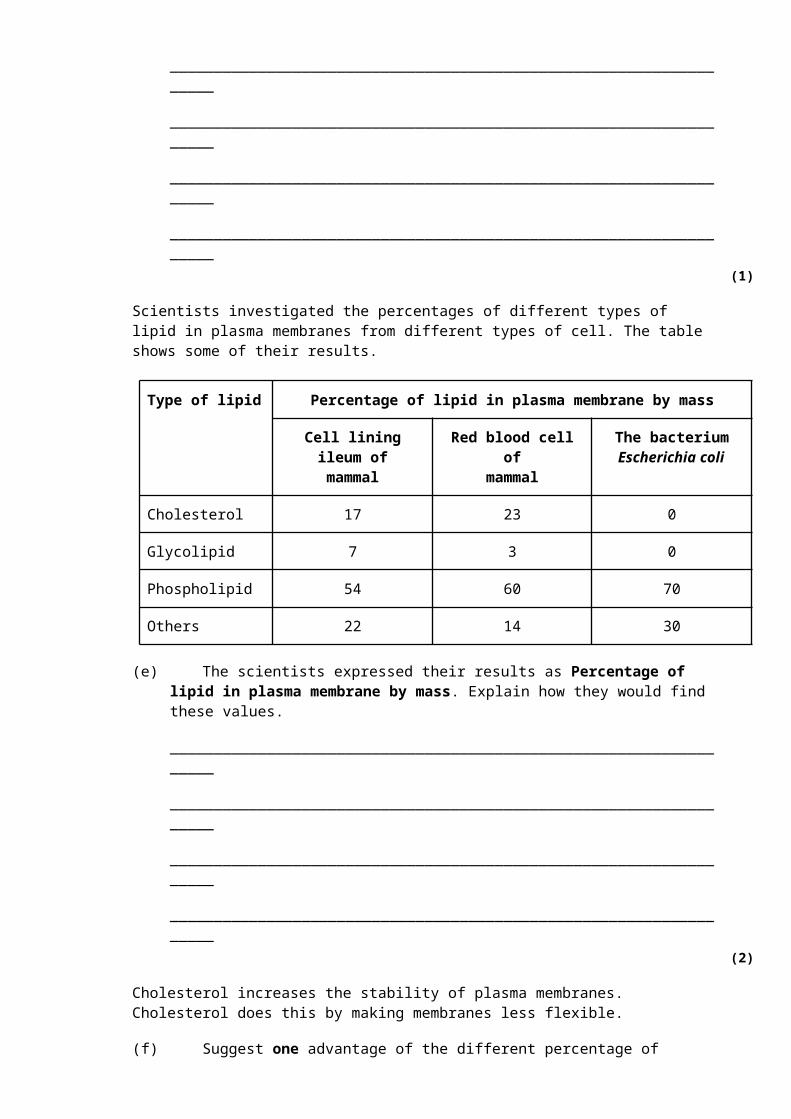
Scientists investigated the percentages of different types of lipid in plasma membranes from different types of cell. The table shows some of their results.
Type of lipid Percentage of lipid in plasma membrane by mass
Cell lining ileum ofmammal
Red blood cell ofmammal
The bacteriumEscherichia coli
Cholesterol 17 23 0
Glycolipid 7 3 0
Phospholipid 54 60 70
Others 22 14 30
(e) The scientists expressed their results as Percentage of lipid in plasma membrane by mass. Explain how they would find these values.
___________________________________________________________________
___________________________________________________________________
___________________________________________________________________
___________________________________________________________________(2)
Cholesterol increases the stability of plasma membranes. Cholesterol does this by making membranes less flexible.
(f) Suggest one advantage of the different percentage of cholesterol in red blood cells compared with cells lining the ileum.
___________________________________________________________________
___________________________________________________________________
___________________________________________________________________(1)
(g) E. coli has no cholesterol in its cell-surface membrane. Despite this, the cell maintains a constant shape. Explain why.
___________________________________________________________________
___________________________________________________________________
___________________________________________________________________
___________________________________________________________________(2)
(Total 10 marks)

Q16. Omega-3 fatty acids are found in cows’ milk. Scientists investigated changes in the concentration of omega-3 fatty acids in milk when cows were moved from eating grass in fields to eating corn in cattle sheds. The following figure shows the results of one investigation.
(a) The concentration of omega-3 fatty acids in milk changed when cows were fed on corn instead of grass. Describe how.
___________________________________________________________________
___________________________________________________________________
___________________________________________________________________
___________________________________________________________________(2)
(b) (i) Calculate the rate of decrease in the mean omega-3 fatty acid concentration between 0 and 40 days.Show your working.
Answer____________________% per day(2)
(ii) The omega-3 fatty acid concentration is expressed as a percentage of total fat.Explain the advantage of this.
______________________________________________________________
______________________________________________________________
______________________________________________________________
______________________________________________________________(2)
(iii) One farmer concluded from the graph that feeding cows on corn reduces the omega-3 fatty acid content in milk. Evaluate this conclusion.
______________________________________________________________
______________________________________________________________
______________________________________________________________
______________________________________________________________
______________________________________________________________
______________________________________________________________
______________________________________________________________
______________________________________________________________
Extra space___________________________________________________
______________________________________________________________
______________________________________________________________
______________________________________________________________(4)
(Total 10 marks)
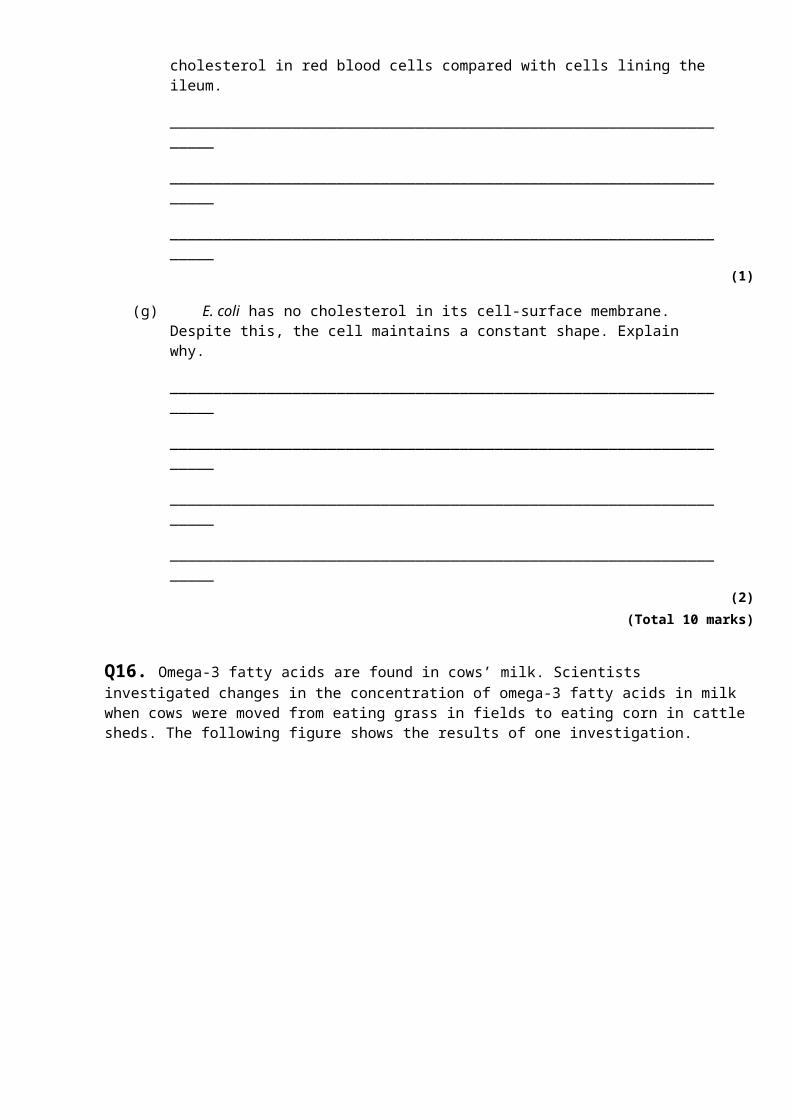
Q17. Omega-3 fatty acids are also found in fish. Scientists investigated the concentration of omega-3 fatty acids from wild-caught and farmed fish. Their results are shown in the figure below.
The bars show standard deviation; n is the sample size.
It is not possible to conclude from the data that the concentration of omega-3 fatty acids in the farmed salmon is higher than that of the wild salmon. Use the data to explain why.
_______________________________________________________________________
_______________________________________________________________________
_______________________________________________________________________
_______________________________________________________________________(Total 2 marks)
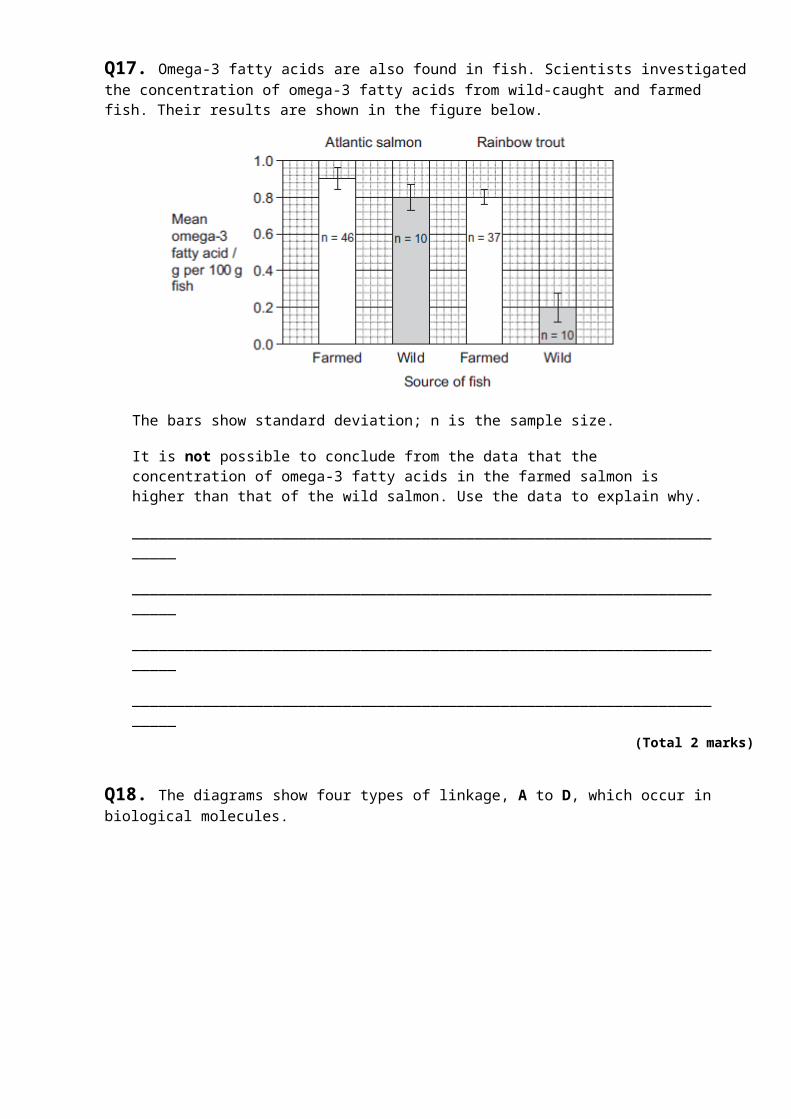
Q18. The diagrams show four types of linkage, A to D, which occur in biological molecules.
(a) Name the chemical process involved in the formation of linkage B.
___________________________________________________________________(1)
(b) Give the letter of the linkage which
(i) occurs in a triglyceride molecule;
______________________________________________________________(1)
(ii) might be broken down by the enzyme amylase;
______________________________________________________________(1)
(iii) may occur in the tertiary, but not the primary structure of protein.
______________________________________________________________(1)
(c) Describe how a saturated fatty acid differs in molecular structure from an unsaturated fatty acid.
___________________________________________________________________
___________________________________________________________________
___________________________________________________________________
___________________________________________________________________(2)
(Total 6 marks)

Q19. A student investigated the effect of lipase concentration on the hydrolysis of lipids.
He took a beaker containing a suspension of lipids. He placed a pH probe attached to a data logger into the beaker. After 5 minutes, he added the lipase solution. The data logger recorded the pH. The apparatus used is shown in the diagram below.
(a) The student did not add a buffer to the lipase solution.
Explain why.
___________________________________________________________________
___________________________________________________________________
___________________________________________________________________(1)
(b) Give two variables the student would have controlled in this investigation.
1. _________________________________________________________________
2. _________________________________________________________________(2)
(c) Give the suitable control for this investigation.
___________________________________________________________________
___________________________________________________________________(1)
The data logger recorded the pH. The graph below shows what happened after he added the lipase solution.
(d) Draw a tangent on the graph and use it to calculate the rate of change at 5 minutes.
Rate of change at 5 minutes = _________________ pH minute−1
(2)
(e) Explain the results shown in the graph.
___________________________________________________________________
___________________________________________________________________
___________________________________________________________________
___________________________________________________________________
___________________________________________________________________(2)
(f) The student repeated the experiment with a higher concentration of lipase solution.Describe and explain the results you would expect him to get.
___________________________________________________________________
___________________________________________________________________
___________________________________________________________________
___________________________________________________________________
___________________________________________________________________
___________________________________________________________________
___________________________________________________________________(3)
(Total 11 marks)
Q20. (a) Name the substance that muscles use as their immediate energy source.
___________________________________________________________________ (1)
(b) Sports scientists investigated the change in energy sources used during exercise.They measured the percentage of energy obtained from carbohydrate and the percentage of energy obtained from fat in two groups of athletes.• Group A exercised at different intensities for the same time.• Group B exercised at the same intensity for different times.They calculated the intensity of the exercise as a percentage of VO2 max.VO2 max is the maximum volume of oxygen the athletes can take in per minute.
The results for Group A are shown in Figure 1 and the results for Group B are shown in Figure 2.
Figure 1
Figure 2
(i) Calculate the ratio of the percentage of energy from carbohydrate to the
percentage of energy from fat when the intensity of exercise is 70% VO2 max. Show your working.
Answer ___________________________________(2)
(ii) A person wishes to lose some body fat by exercising. What sort of exercise would be most effective? Use the information in Figures 1 and 2 to explain your answer.
______________________________________________________________
______________________________________________________________
______________________________________________________________
______________________________________________________________
______________________________________________________________
______________________________________________________________
(Extra space) ___________________________________________________
______________________________________________________________
______________________________________________________________(3)
(Total 6 marks)
Q21. (a) Figure 1 shows the structure of a molecule of glycerol and a molecule of fatty acid.
Figure 1
Draw a diagram to show the structure of a triglyceride molecule.

(2)
(b) Explain why triglycerides are not considered to be polymers.
___________________________________________________________________
___________________________________________________________________(1)
(c) Figure 2 shows two types of fat storage cell. Mammals living in cold conditions have more brown fat cells than mammals living in tropical conditions.
Figure 2
Using evidence from Figure 2 to support your answer, suggest how the function of brown fat cells differs from that of white fat cells.
___________________________________________________________________
___________________________________________________________________
___________________________________________________________________
___________________________________________________________________
___________________________________________________________________
___________________________________________________________________(3)
(Total 6 marks)
Q22. (a) Dietary recommendations are that lipid intake should make up 30% of energy intake. The recommended energy intake for most women aged 19-49 is 8100 kJ day–1.The energy content of lipid is 37.8 kJ g–1. Calculate the recommended lipid intake per day for these women. Show your working.

Answer ____________________ g(2)
In humans, triglycerides are the main form of dietary lipids. They are digested in the gut and the products of digestion are absorbed by the small intestine.
(b) Describe a biochemical test that could be performed on a sample of food to determine whether it contained triglycerides.
___________________________________________________________________
___________________________________________________________________
___________________________________________________________________
___________________________________________________________________(2)
(c) The diagram shows the events that occur in the absorption of monoglycerides and fatty acids. These molecules enter the epithelial cells of the small intestine by diffusion. Once inside they are reassembled into triglycerides in organelle Q. The triglyceride molecules are formed into chylomicrons in organelle T. Chylomicrons are made from many triglyceride molecules surrounded with protein molecules. The chylomicrons leave the cell and enter vessel S.
(i) Explain the importance of the structures labelled P.
______________________________________________________________
______________________________________________________________(1)
(ii) Name
R; ____________________________________________________________
S. ____________________________________________________________(2)
(iii) Describe the role played by organelle U in the formation of chylomicrons.
______________________________________________________________
______________________________________________________________
______________________________________________________________
______________________________________________________________(2)
(iv) Suggest how the chylomicrons leave the epithelial cell. Give a reason for your answer.
______________________________________________________________
______________________________________________________________
______________________________________________________________
______________________________________________________________(2)
(Total 11 marks)