econsac.weebly.comeconsac.weebly.com/.../module_1_past_paper_questions.docx · web viewconstruct a...
TRANSCRIPT

Module 1 Past Paper Questions – Paper 2
June 2015 #1
Table 1 shows the quantity of chocolate bars that Romain consumes in a given period of time, the total utility and marginal utility associated with the consumption of chocolate bars.
TABLE 1
Chocolate Bars Total Utility Marginal Utility0 01 202 353 474 05 45
(a) (i) Copy Table 1 into your answer booklet and complete it to show the total utility and the marginal utility derived from the consumption of 1 to 5 chocolate bars.[5 marks](ii) Define EACH of the following terms:
a) Total utility [2 marks]b) Marginal utility [2 marks]c) Law of diminishing marginal utility [2 marks]
(iii) State the point at which Romain
a) Begins to lose satisfaction from his consumption of each additional chocolate bar. [1 mark]
b) Maximizes his satisfaction from consuming chocolate bars. [1 mark](b) Assume that the maximum amount that Romain is willing to pay for a chocolate bar is
$5.00 and the current market price is $2.50. At this price Romain is willing and able to purchase 6 chocolate bars.
(i) Define the term ‘consumer surplus.’ [2 marks](ii) Draw Romain’s demand curve. [4 marks](iii) On the demand curve in (b)(ii) above, shade and label the TOTAL consumer
surplus. [2 marks](c) With reference to marginal utility theory, justify the shape of Romain’s demand curve
for chocolate bars. [4 marks]Total 25 marks

June 2015 # 2
The following equations are for the demand and supply curves in the market for pens.
Demand: Qd = 20 – 2P
Supply: Qs = 5 + 3P
Where Qd is the quantity demanded, Qs is the quantity supplied, and P is the price per pen, in dollars.
(a) (i) Define the term ‘market equilibrium’. [2 marks](ii) Copy Table 2 into your answer booklet and complete it to show the quantity of pens demanded and the quantity supplied.
TABLE 2
Price per Unit Quantity Demanded Quantity Supplied1234
(iii) Use the information from the completed Table 2 to draw a diagram that shows
a) The demand curve and the supply curve for pens [3 marks]b) The equilibrium price and quantity [2 marks]
(iv) a) If the government sets a price of $2 per pen, state the name of this type of intervention. [1
mark]
b) Explain, giving details, the market outcome at this price. [3 marks]
(b) In an effort to balance the budget, the government has decided to apply a specific tax of $1 per pen levied on the producer.
(i) Illustrate this change on the diagram in (a)(iii) above. [5 marks]
(ii) Analyse the total welfare effect (consumer surplus, producer surplus, government revenue and deadweight loss) of the tax. Refer to the diagram in (b)(i) above to support your analysis. [4 marks]
Total 25 marks

June 2014 #1
The ideological nation of Utopia devotes all its resources: land, labour, capital and entrepreneurship, to producing food and clothing.
(a) (i) Define the term ‘scarcity’. [2 marks](ii) Draw and label a graph of the production possibilities frontier (PPF) for Utopia.
[3 marks]
(iii) Using the PPF from (a)(ii) above, explain howa) The concept of opportunity cost is related to the problem of scarcity.
[5 marks]
b) Economic growth can be achieved in Utopia. [3 marks](b) (i) State TWO differences between a ‘command economy’ and a ‘free market
economy.’ [4 marks](ii) Given the disadvantages of a centrally planned economy, discuss TWO possible
economic reasons for the downfall of this type of economic system over the last three decades. [8 marks]
Total 25 marks
June 2014 # 2
ABC Company Ltd which produces genuine cow leather, is increasing the unit price of leather so as to remain a viable entity. The following information applies to ABC.
When the price of leather increased from $9 to $10 the quantity demanded decreased from 150 to 110 units.
(a) (i) List THREE determinants of price elasticity of demand. [3 marks](ii) Calculate the price elasticity of demand (using the arc method) and interpret the results. [8 marks]
(b) (i) Sketch and label the demand curve with which ABC Company Ltd is faced, showing revenue before and after the price change. [4 marks](ii) Advise ABC Company Ltd. On a decision that is in the best interest of the company. (Justify your answer). [3 marks]
(c) (i) Define the term ‘consumer surplus’. [2 marks](ii) The government has decided to support the genuine cow leather industry by imposing an effective price floor in the market.Using a well-labelled diagram, illustrate consumer surplus after the imposition of the price floor. [5 marks]
Total 25 marks
June 2013 #1
(a) Define EACH of the following terms:(i) Demand [2 marks](ii) Supply [2 marks](iii) Equilibrium [2 marks]
(b) The following table shows the individual demand schedules (pints per week) of three buyers of ice cream and the market supply of ice cream for a week.
Buyers Price of Ice Cream$1 $2 $3 $4 $5
John 12 9 6 1 0Anita 10 7 5 1 0Kwesi 8 5 3 0 0
Market DemandMarket Supply 3 8 14 21 30
Copy the table above into your answer booklet and complete it to show the market demand for ice cream. [2 marks]
(c) Carefully draw and label a graph showing(i) Equilibrium [2 marks](ii) Equilibrium price [2 marks](iii) Equilibrium quantity [2 marks]
(d) To reduce obesity and raise revenue, the government imposes a specific tax on each pint of ice cream sold. (i) Referring to your graph in (c), explain how the increase in taxes will affect the
market supply for ice cream. [7 marks](ii) State whether the government’s objectives of reducing obesity and raising
revenue have been achieved. Justify your answer. [4 marks]Total 25 marks
June 2013 # 2
(a) Define EACH of the following terms:(i) Marginal cost [2 marks](ii) Average variable cost [2 marks]
(b) (i) Identify ONE factor that causes the supply curve to change by creating movement along the curve, and explain how the change is caused.[4 marks]

(ii) Identify TWO factors that cause the supply curve to change by shifting to the left or to the right, and explain how the change is caused. [8
marks](c) With the use of a correctly labelled graph, explain the relationship between the
marginal cost curve and the supply curve in a competitive market. [9 marks]Total 25 marks
June 2012 #1
A consumer is consuming a combination of Good X and Good Y at equilibrium A. The price of Good X falls. The consumer therefore moves to another equilibrium, B.
(a) (i) a) Define the terms ‘indifference curve’ and ‘budget line.’ [2 marks]b) Draw a diagram showing an indifference curve and a budget line, and use the diagram to explain consumer equilibrium. [8 marks]
(ii) Using the diagram in (a)(1)b) above, explain how a decrease in the price of Good X moves the consumer to equilibrium B. [5 marks]
(b) (i) The change from equilibrium A to equilibrium B is the total change.
Explain what is meant by EACH of the following terms:a) ‘Substitution Effect’ [2 marks]b) Income Effect [2 marks]
(ii) With the aid of a diagram, explain the income and substitution effects using EITHER the Hicksian approach or the Slutskian approach. [6 marks]
Total 25 marks
June 2012 # 2
A perfectly competitive firm producing microchips has recorded its fixed cost as $128. Its output levels and variable costs are shown in the table below.
Output Level Variable Cost$
Total Cost$
Marginal Cost$
Average Fixed Cost$
Average Total Cost $
0 0 128 - - -1 562 903 1084 116
(a) (i) Write the formula for EACH of the following costs:a) Total cost

b) Marginal costc) Average fixed costd) Average total coste) Variable cost [5 marks]
(ii) Copy and complete the table to show the FOUR costs for EACH level of output.[8
marks]
(b) With the aid of a diagram, explain the relationship between the ‘marginal cost’ and the ‘average total cost.’ [6 marks]
(c) With the aid of a diagram, explain the relationship among the ‘marginal cost curve’, the ‘supply curve’ and the ‘average variable cost curve.’ [6 marks]
Total 25 marks
June 2011 #1
(a) (i) Carefully draw and label a production possibility frontier (PPF) diagram.[4
marks](ii) Use your diagram to explain the following concepts:
a) Scarcity [3 marks]b) Choice [3 marks]c) Opportunity Cost [3 marks]
(b) (i) State THREE assumptions on which the PPF is based. [3 marks](ii) Use the PPF diagram to distinguish among the following levels of production.
a) Efficient [3 marks]b) Inefficient [3 marks]c) Unattainable [3 marks]
Total 25 marks
June 2011 # 2
(a) (i) With the aid of indifference curves, explain consumer equilibrium. [10 marks](ii) Using the indifference curves drawn in (a)(i), explain how consumer equilibrium changes when consumer income increases. [3 marks]
(b) (i) Draw a demand and supply diagram for a good. [4 marks](ii) Use the diagram, in (b)(i) above, to explain the effect on equilibrium price and quantity of an
a) Increase in consumer income [4 marks]b) Improvement in the technology used in producing a good. [4 marks]

Total 25 marks
June 2010 #1
(a) Using suitable examples, explain EACH of the following concepts:(i) Total Utility [3 marks](ii) Marginal Utility [3 marks](iii) The law of diminishing marginal utility [3 marks]
(b) Table 1 below is an incomplete table showing utility maximization for bread and buns. The price of bread is $1 per loaf and the price of buns is $1 per bag.
Table 1: UTILITY MAXIMIZATION
Unit of Goods(loaves of bread/bag of buns)
Total Utility Marginal Utility Marginal Utility Per Dollar
(MU/Price)Bread Bun Bread Bun Bread Bun
0 0 0 0 0 0 01 6 52 11 93 15 124 18 145 20 15
(i) Copy and complete the table in your answer booklet. [5 marks](ii) Using the information from the Table 1, draw the consumer’s demand curve for
bread. [5 marks](iii) If the consumer has a budget of $5 to spend, determine how many loaves of bread
and how many bags of buns she can buy to maximize her satisfaction. Explain your answer. [4 marks]
(iv) If the price of a loaf of bread rises to $2, what combination of bread and buns will maximize the consumer’s utility? [2 marks]
Total 25 marks
June 2010 # 2

(a) (i) Define the term ‘demand’ [2 marks](ii) Explain the ‘law of demand’ [4 marks](iii) Explain how a ‘change in demand’ differs from a ‘change in the quantity demanded.’
[4 marks]
(b) (i) Identify THREE factors, other than the price of beef, that influence the demand for beef. [3 marks](ii) Discuss why EACH factor identified in (b)(i) above influences the demand for beef.
[12 marks]
Total 25 marks
Specimen paper 2010 #1
(a) Distinguish between normal good and inferior good. [4 marks](b) Use the indifference curve approach to explain consumer equilibrium. [12 marks](c) Show, with the aid of a diagram, the income and substitution effect of a fall in price.
[9 marks]
Total 25 marks
Specimen paper 2010 #2
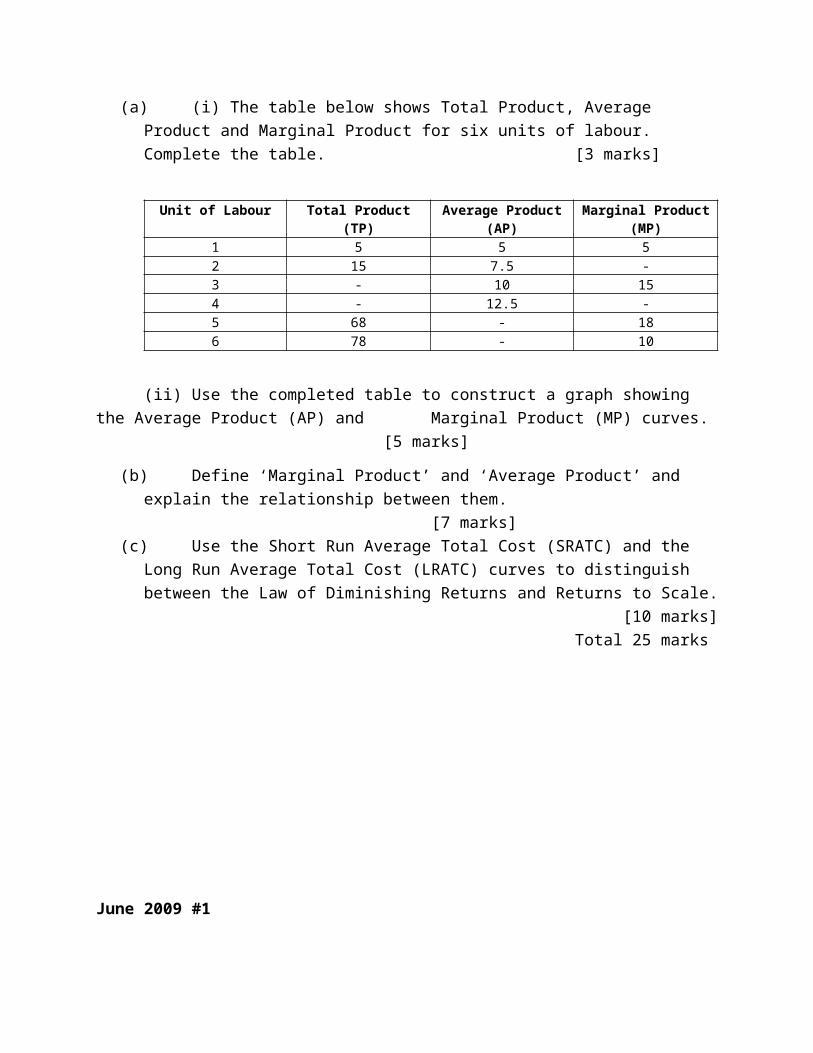
(a) (i) The table below shows Total Product, Average Product and Marginal Product for six units of labour. Complete the table. [3 marks]
Unit of Labour Total Product(TP)
Average Product(AP)
Marginal Product(MP)
1 5 5 52 15 7.5 -3 - 10 154 - 12.5 -5 68 - 186 78 - 10
(ii) Use the completed table to construct a graph showing the Average Product (AP) and Marginal Product (MP) curves. [5
marks]
(b) Define ‘Marginal Product’ and ‘Average Product’ and explain the relationship between them. [7 marks]

(c) Use the Short Run Average Total Cost (SRATC) and the Long Run Average Total Cost (LRATC) curves to distinguish between the Law of Diminishing Returns and Returns to Scale. [10 marks]
Total 25 marks
June 2009 #1
(a) (i) Define the term ‘market’. [2 marks](ii) Use a demand and supply diagram to explain how the market allocates scarce resources. Your explanation must include the following:a) Equilibrium [8 marks]b) Disequilibrium [8 marks]c) The effect on equilibrium of a fall in the demand for the commodity. [8 marks]
(b) (i) With reference to the market for milk, explain the economic effect of an effective price floor. [6 marks](ii) Explain how an effective price floor leads to inefficient resource allocation.
[12 marks]
(c) Governments impose price floors despite their negative effects. Justify governments’ use of price floors. [6 marks]
Total 50 marks
June 2009 # 2
(a) (i) Define the term ‘supply’. [2 marks](ii) Explain the law of supply. [6 marks](iii) Explain how a change in supply differs from a change in the quantity supplied.
[6 marks]
(b) (i) Identify FOUR major factors, other than the price of eggs,that influence the supply of eggs. [4 marks]

(ii) State how EACH of the factors identified in (b)(i) above influences supply.[12
marks](c) Explain why EACH factor in (b)(i) influences supply the way it does. [20 marks]
Total 50 marks
Regional paper June 2008 #1
(a) Define ANY THREE of the following terms:(i) Scarcity(ii) Production Possibilities Frontier(iii) Opportunity Cost(iv) Production Function(v) Price Elasticity of Demand [6 marks]
(b) The mythical country Caricombia can produce the following combinations of food and capital goods given its resource endowment:
Possibilities a b c d e f
Food: 0 1 2 3 4 5
Capital goods: 30 28 24 18 10 0
Draw a graph in which you plot Caricombia’s production possibilities frontier (PPF) with food on the horizontal axis. [9 marks]
(c) (i) Show on the diagram you plotted in (b) above, ONE point that is attainable and ONE point that is unattainable and explain why you chose those points. [4 marks](ii) Show on the diagram ONE point that is efficient and ONE point that is inefficient and explain why you chose these points. [4 marks]

(d) (i) Discuss the assumption that you have made about Caricombia’s technology in drawing your diagram. [3 marks](ii) Explain the effects of an improvement in Caricombia’s food technology on its PPF. Show this on your diagram. [5 marks](iii) Explain the effect of an increase in all of Caricombia’s resources on its PPF. Show this on your diagram. [5 marks]
(e) (i) Calculate the opportunity cost of increasing food production from ‘3’ to ‘4’ (‘d’ to ‘e’).[5
marks](ii) Explain how the cost of producing food changes as more food is produced. In your explanation indicate what is responsible for the changes in the cost of food.
[4 marks](iii) Explain how Caricombia’s PPF will be affected in the future if it chooses to produce at point ‘e’ rather than point ‘c’. [5 marks]
Total 50 marks
Regional paper June 2008 # 2
An increase in the relative price of chicken during the Christmas season will have both a substitution effect and an income effect.
(a) Explain how an increase in the relative price of chicken will have BOTH a substitution effect AND an income effect and say what the net effect is likely to be. [6 marks]
(b) List TWO major factors that can shift the demand curve of chicken to the right and discuss the relationship of EACH factor to the demand for chicken. [6 marks]
(c) List TWO major factors that can shift the supply curve of chicken to the left and discuss the relationship of EACH factor to the demand for chicken. [6 marks]
(d) A 5% rise in the price of beef decrease the quantity of beef demanded by 10% and increases the quantity of chicken demanded by 15%. A 10% increase in income increases the quantity of chicken demanded by 8%.(i) Write the formula for calculating the cross-elasticity of demand and calculate the
cross-elasticity of demand between beef and chicken. [4 marks](ii) Explain how a consumer can determine whether a good is a normal good or an
inferior good. [4 marks]
(e) (i) Explain THREE determinants of price elasticity of demand, OTHER THAN time.[6
marks](ii) Draw the graphs illustrating a) perfect elasticity and b) perfect inelasticity.
[4 marks]
(iii) Show, using a graph, how elasticity can change along a straight-line downward sloping demand curve. [8 marks]
(f) Discuss TWO ways that time impacts on price elasticity of demand for a product.[6
marks]Total 50 marks
June 2008 #1
(a) (i) With the aid of a diagram showing education and medical services, explain what is meant by ‘production possibilities frontier (PPF).’ [12 marks](ii) State TWO assumptions on which the PPF is based. [4 marks]
(b) Using the production possibilities frontier, discuss the following:(i) Scarcity(ii) Choice(iii) Increasing Opportunity Cost [18 marks]
(c) (i) Define the following terms:a) Allocative efficiencyb) Production efficiency [6 marks]
(d) State how the following will affect the production possibilities frontier:(i) Decrease in resources(ii) Improvement in technology [6 marks]
Total 50 marks

June 2008 # 2
(a) Using a demand and supply diagram, explain how a rapid economic expansion in China and India may affect EACH of the following dimensions of the market for oil, everything else remaining the same.(i) Demand(ii) Supply(iii) Quantity bought and sold(iv) Price [38 marks]
(b) Analyze the likely effects of an increase in oil prices on the market for food.[12
marks]Total 50 marks
June 2007 #1
Table 1 shows the utility that Abina gets from the consumption of video games and novels.
Quantity Utility from Video Games
Utility fromNovels
Marginal Utility Marginal Utility per Dollar
VideoGames
Novels VideoGames
Novels
0 0 01 30 302 40 383 48 444 54 465 58 47

Abina has $100 per month to spend on video games and novels. Video games cost $20 each and novels cost $20 each.
(a) (i) Define “marginal utility.” [2 marks]
(ii) Calculate Abina’s marginal utility froma) Video games [5 marks]b) Novels [5 marks]
(b) Draw a diagram showing Abina’s budget constraint. [5 marks]
(c) (i) Calculate the marginal utility per dollar of Abina’s consumption choices.[5
marks](ii) State the optimal number of video games and the optimal number of novels that Abina will consume in a month. [2 marks]
(d) State how EACH of the following will affect the quantity of video games and novels consumed by Abina:(i) An increase in the money she has to spend by $20, ceteris paribus. [2 marks](ii) An increase in the price of ONE of the goods, ceteris paribus. [2 marks]
(e)Table 2 Rental Housing Market
Price Per Unit$
Quantity Demanded(‘000 Units Per Month)
Quantity Supplied(‘000 Units Per Month)
140130120110100
2025303540
3934302522
Table 2 shows the market for rental housing.
(i) Using the information from Table 2 above, draw a diagram that showsa) The demand curve and the supply curve for housing [5 marks]b) The equilibrium price of housing and the equilibrium quantity of
housing. [2 marks]

(ii) In order to assist low-income earners the Government fixes a price ceiling of $110 on the rent.a) Show the price ceiling on your diagram at (i) above. [3 marks]b) State the likely effects of this policy on
i) The availability of housing [6 marks]ii) Consumer and producer surplus [6 marks]
Total 50 marks
June 2007 # 2
A garment manufacturer’s short-run production function is shown in the table below.
Labour (L) per day
(L)
Output (Q)Garments per day
(Q)
Average PhysicalProduct
(APP)
Marginal Physical Product(MPP)
0 0 0 01 52 123 224 305 366 40

(a) (i) Write the formulae for average physical product and marginal physical product.[2
marks]
(ii) Copy the table in your answer booklet and complete it. [6 marks]
(b) (i) Draw a diagram showing average and marginal product curves. [8 marks]
(ii) Discuss the relationship between the average physical product curve and the marginal physical product curve. [6 marks]
(iii) Explain why the marginal product of the firm first increases and then decreases as more units of labour are added. [9 marks]
(c) Construct a table to show the Total Fixed Cost, Total Variable Cost, Total Cost, Average Variable Cost, Average Total Cost and Marginal Cost for garments produced if the manufacturer’s Total Fixed Cost is $30.00 and his variable costs consist of wages of $20 per worker per day. [12 marks]
(d) (i) Write the formula for calculating the elasticity of demand the manufacturer faces when he sells 30 garments when the price is $4 per garment, and when he sells 25 when the price is $5 per garment. [2 marks]
(e) Calculate the elasticity of demand and state how his total revenue would be affected by an increase in price. [5 marks]
Total 50 marks
June 2006 #1
(a) Define the following terms:(i) Equilibrium price [2 marks](ii) Pareto efficiency [2 marks](iii) Price ceiling [2 marks]
(b) Discuss FOUR main factors that influence EACH of the following:(i) The demand for beef [12 marks](ii) The supply of beef [12 marks]
(c) A government imposes a ceiling on the price of milk in order to increase the quantity of milk consumed by low-income families. Using your knowledge of how the market operates, explain

(i) Why all low-income families may not be able to increase their consumption of milk [6 marks]
(ii) How consumers and producers will react to the new situation. [4 marks](iii) What the Government might do to maintain the legal price. [3 marks](iv) What the Government might do to ensure that the low-income families benefit
from the pricing policy. [3 marks]
(d) Identify ONE advantage and ONE disadvantage of the free market allocation of resources. [4 marks]
Total 50 marks
June 2006 # 2
(a) (i) Define the term ‘production function.’ [2 marks](ii) State where EACH of the three stages of production begins and ends. [9 marks](iii) With the aid of the diagram on page 3, explain why production tends to occur in Stage TWO of the production stages and not in Stage ONE or Stage THREE.
Total Product
Output

[9 marks]
(b) Explain the law of diminishing returns. [6 marks]
(c) Explain the following concepts:(i) Constant returns to scale(ii) Increasing returns to scale(iii) Decreasing returns to scale(iv) Economies of scale [8 marks]
(d) (i) Discuss ONE reason for economies of scale and ONE reason for diseconomies of scale.[8
marks]
Average Product
Average Product
Marginal Product
Marginal Product
Input
Input
0
0

(ii) Explain how economies and diseconomies of scale influence the shape of the long-run average cost curve of a firm. [8 marks]
Total 50 marks
June 2005 #1
The following table shows labour inputs for different levels of output at John and Sons Ltd.
Labour (L) Output (Q) Average PhysicalProduct
(APP)
MarginalPhysicalProduct(MPP)
AverageVariable
Cost(AVC)
MarginalCost(MC)
0 0 0 0 0 01 30 - - - -2 70 - - - -3 120 - - - -4 200 - - - -5 260 - - - -

6 300 - - - -
Annual wages, which are the only variable costs (VC), amount to $10,000 annually. The price of the product is $200.
(a) Copy the table above in your answer booklet and complete it. [12 marks]
(b) Define EACH of the following OR write the formula for calculating it(i) Average physical product (APP)(ii) Marginal physical product (MPP)(iii) Average variable cost (AVC)(iv) Marginal cost (MC) [8 marks]
(c) State what happens to average physical product (APP) and marginal physical product (MPP) as output increases. [2 marks]
(d) State what happens to average variable cost (AVC) and marginal cost (MC) as output increases. [2 marks]
(e) (i) How will output be affected when a variable input is added to a fixed input?[4
marks](ii) How do increasing levels of output affect costs? [4 marks]
(f) Draw a diagram showing the marginal cost curve (MC) and the price ($200) of the product. [12 marks]
(g) What level of output will the firm produce? State how you arrived at your answer. [6 marks]
Total 50 marks
June 2005 # 2
(a) Define the following terms:(i) Demand(ii) Supply [4 marks]
(b) Briefly explain the difference between a ‘change in demand’ and a ‘change in the quantity demanded.’ [2 marks]
The diagram below represents the demand for digital cameras.

(c) (i) Copy the diagram above in your answer booklet. [2 marks]
(ii) Identify the equilibrium price and state the quantity of digital cameras traded at that price. [2 marks]
(d) (i) List FIVE factors that will influence the demand for digital cameras. [5 marks](ii) Explain how FOUR of the factors listed in (d)(i) above, will affect the demand for digital cameras. [12 marks]
(e) With the aid of a diagram show how an increase in ONE of the four factors in (d)(ii) above will affect the demand curve. [6 marks]
(f) (i) List FIVE factors that will influence the supply of digital cameras. [5 marks]
(ii) Explain how FOUR of the factors listed in (f)(i) above will affect the supply of digital cameras. [12 marks]
Total 50 marks
200
175
150
125
100
010 20 30 40 50 60
Price of cameras ($)
Quantity
S D

June 2004 #1
(a) (i) Define the term ‘indifference curve’. [4 marks](ii) State TWO characteristics of indifference curves. [4 marks]
(b) (i) Define the term ‘budget line’. [4 marks](ii) What information is needed to draw a budget line? [6 marks]
(c) Joan has $60.00 to spend on milk and movies. The price of milk is $3.00 per litre and the price of movies is $1.50 each. Draw an indifference curve diagram showing the quantity of milk and the quantity of movies that Joan will choose at consumer equilibrium.
[12 marks]
(d) ‘If the price of milk decreases to $2.00 per litre, Joan will be able to buy more milk, but will instead buy more of both commodities.’
Explain this statement using income and substitution effects. [20 marks]
June 2004 # 2
Labour(No. of
workers)
Output(shirts per
day)
TotalVariable
Cost (TVC)
TotalCost(TC)
Average Variable
Cost (AVC)
AverageTotal
Cost (ATC)
MarginalCost(MC)
0 0 0 0 0 0 01 4 252 10 503 13 754 15 1005 16 125
The table above shows the labour/output relationship and the variable cost for Ann’s Shirt Factory. The wage rate is $25.00 a day per worker and the fixed cost is $25.00.
(a) Draw the table above in your answer booklet and complete it. [20 marks]
(b) (i) Draw a typical average total cost curve. [3 marks](ii) Explain why the average total cost falls at first and then rises. [3 marks](iii) Draw a typical marginal cost curve. [5 marks](iv) Why does the marginal cost curve cut the average total cost curve at its minimum?
[5 marks]
(c) When the price of shirts increases from $5.00 to $6.00 EACH the supply of shirts increases from 20 to 25.
(i) Draw the curve implied by this information. [4 marks](ii) Write the formula for the price elasticity of the supply of shirts and calculate it.
[6 marks]
(iii) Based on your calculation of the price elasticity of the supply of shirts what will be the increase in the supply of shirts? [4 marks]

June 2003 #1
(a) (i) Define the term ‘subsidy’ [3 marks](ii) State ONE reason why governments grant subsidies. [4 marks]
(b) The government of the United States of America gives a subsidy to poultry farmers on EACH unit of output. The farmers operate under a perfectly competitive market.
With the use of diagrams state the likely effects of the subsidy on the following:
(i) Price of poultry in the firm and in the industry(ii) Number of firms in the poultry industry(iii) Profits [28 marks]
(c) How will the subsidy given to poultry farmers in the United States of America affect the (i) price, (ii) profits, and (iii) size of the poultry industry in CARICOM member states?
[15 marks]
Total 50 marks
June 2003 # 2
(a) Briefly explain the term ‘consumer choice problem’. [5 marks]
(b) A consumer has $100 to spend on TWO commodities. Commodity A is priced at $10 EACH and commodity B is priced at $20 EACH.
(i) Draw the consumer’s budget line that fits this information. [12 marks](ii) On the diagram you have drawn in (b)(i) above, draw an indifference curve to
illustrate the consumer’s equilibrium point at which MRSa,b = Pa/Pb

[8 marks]
(iii) Why will the consumer choose the point indicated on the budget line and NOT a higher OR lower point? [5 marks]
(iv) State TWO events that will allow the consumer to move to a higher indifference curve. [20 marks]
Total 50 marks
June 2002 #1
(a) Explain what is meant by the concept ‘the market.’ [5 marks]
(b) How will an increase in the demand for fruits affect the reallocation of resources in the market for (i) land, (ii) capital, and (iii) labour? [45 marks]
June 2002 # 2
(a) (i) Draw a typical short run average total cost curve of a firm. [5 marks](ii) Account for the shape of the curve in (a)(i) above. [15 marks]
(b) Explain, with the use of a diagram, the relationship between the firm’s short run and its long run average total cost curves. [30 marks]
Pilot paper June 2001 #1
Joe spends his weekly allowance on food and other goods. Use marginal utility approach to do EACH of the following:
(a) Derive Joe’s demand curve for food. [40 marks]
(b) Explain the advantages that the indifference curve approach has over the marginal utility approach in explaining consumer behaviour. [10 marks]
Pilot paper June 2001 # 2
Explain how EACH of the following would react in both the short run and the long run if there is a permanent increase in the demand for sugar:
(a) A competitive sugar firm [15 marks](b) A competitive sugar industry [35 marks]
Total 50 marks