· web viewnumber of hour’s patients spent in physical restraint for every 1000 inpatient hours....
TRANSCRIPT

QUARTERLY REPORT ON ORGANIZATIONAL PERFORMANCE EXCELLENCE
FOURTH STATE FISCAL QUARTER 2018April, May, June 2018
Carolyn Dimek, RN, MSActing Superintendent
August 16, 2018

Table of Contents
Introduction.............................................................................................................................2
Comparative Statistics..............................................................................................................3
Joint Commission:Hospital Based Inpatient Psychiatric Services (HBIPS)................................................12Contract Management...............................................................................................13Medication Management...........................................................................................14Inpatient Consumer Survey........................................................................................16Fall Reduction Strategies............................................................................................23Pain Assessment.........................................................................................................26
Quality Assurance & Performance Improvement (QAPI):Dietary........................................................................................................................28Facilities......................................................................................................................30Health Information Management..............................................................................34Human Resources……………………………………………………………………………………………………38Infection Control........................................................................................................43Medical Staff.............................................................................................................. 49Nursing.......................................................................................................................57Outpatient & Forensic Services..................................................................................64Pharmacy Services......................................................................................................70Risk Management.......................................................................................................76Social Services............................................................................................................79Staff Education and Development..............................................................................82Therapeutic Services..................................................................................................85
2

Introduction
This edition of the Dorothea Dix Psychiatric Center Quarterly Report on Organizational Performance Excellence is designed to address overall organizational performance in a systems improvement approach instead of a purely compliance approach.
There are three major sections that make up this report:
The first section reflects traditional measures related to Comparative Statistics.
The second section describes the hospital’s performance with regard to Joint Commission performance measures that are derived from the Hospital Based Inpatient Psychiatric Services (HBIPS) and priority focus areas that are referenced in the Joint Commission standards:
I. Data Collection (PI.01.01.01)II. Data Analysis (PI.02.01.01, PI.02.01.03)III. Performance Improvement (PI.03.01.01)
The third section encompasses those departmental process improvement projects that are designed to improve the overall effectiveness and efficiency of the hospital’s operations and contribute to the system’s overall strategic performance excellence.
As with any change in how organizations operate, there are early adopters and those whose adoption of system changes is delayed. It is anticipated that over the next year, further contributors to this section of strategic performance excellence will be added as opportunities for improvement and methods of improving operational functions are defined.
3

Jul Aug Sep Oct Nov Dec Jan Feb Mar Apr May Jun1Q2018 2Q2018 3Q2018 4Q2018
0.00
0.20
0.40
0.60
0.80
1.00
1.20
1.40
1.60
1.80
2.00
Patient Injury Rate#
of p
atien
t inj
urie
s tha
t occ
urre
d fo
r eve
ry 1
000
inpa
tient
day
s
Number of patient injury incidents that occurred for every 1000 inpatient days. For example, a rate of 0.5 means that one injury occurred for each 2000 inpatient days. The NRI standards for measuring patient injuries differentiate between injuries that are considered reportable to the Joint Commission as a performance measure and those injuries that are of a less severe nature. While all injuries are currently reported internally, only certain types of injuries are documented and reported to NRI for inclusion in the performance measure analysis process. This comparative statistic graph only includes those events that are considered “Reportable” by NRI.
4

COMPARATIVE STATISTICS
“Non-reportable” injuries include those that require: 1) No Treatment, or 2) Minor First Aid
Reportable injuries include those that require: 3) Medical Intervention, 4) Hospitalization or where, 5) Death Occurred.
Injury Severity:
No Treatment: The injury received by a patient may be examined by a clinician but no treatment is applied to the injury.
Minor First Aid: The injury received is of minor severity and requires the administration of minor first aid.
Medical Intervention Needed: The injury received is severe enough to require the treatment of the patient by a licensed practitioner, but does not require hospitalization.
Hospitalization Required: The injury is so severe that it requires medical intervention and treatment as well as care of the injured patient at a general acute care medical ward within the facility or at a general acute care hospital outside the facility.
Death Occurred: The injury received was so severe that it resulted in, or complications of the injury lead to, the termination of the life of the injured patient.
Type and Cause of Injury by Month
Type - Cause April May June 4Q2018Accident 1 1 2Fall 1 1Patient to Patient Incident 1 1 2Self-Injurious Behavior 2 1 3Other 0Total 1 4 3 8
Severity of Injury by Month Severity April May June 4Q2018
No Treatment 1 1Minor First Aid 1 3 1 5Medical Intervention Required 1 1 2Hospitalization Required 0Death Occurred 0Total 1 4 3 8
5

COMPARATIVE STATISTICS
Jul Aug Sep Oct Nov Dec Jan Feb Mar Apr May Jun1Q2018 2Q2018 3Q2018 4Q2018
0.00
0.10
0.20
0.30
0.40
0.50
0.60
Elopement Rate
# of
elo
pmen
ts th
at o
ccur
red
for e
very
100
0 in
patie
nt d
ays
Number of elopement incidents that occurred for every 1000 inpatient days. For example, a rate of 0.25 means that one elopement occurred for each 4000 inpatient days.
6

COMPARATIVE STATISTICS
Jul Aug Sep Oct Nov Dec Jan Feb Mar Apr May Jun1Q2018 2Q2018 3Q2018 4Q2018
0.00
5.00
10.00
15.00
20.00
25.00
30.00
30 Day Readmissions
% o
f disc
harg
es th
at re
turn
ed
with
in 3
0 da
ys
Percent of discharges from the facility that returned within 30 days of a discharge of the same patient from the same facility. For example, a rate of 10.0 means that 10% of all discharges were readmitted within 30 days.
7

COMPARATIVE STATISTICS
Jul Aug Sep Oct Nov Dec Jan Feb Mar Apr May Jun1Q2018 2Q2018 3Q2018 4Q2018
0.00
2.00
4.00
6.00
8.00
10.00
12.00
14.00
16.00
18.00
Percent of Patients Restrained
% o
f pati
ents
who
wer
e re
stra
ined
at l
east
onc
e
Percent of unique patients who were restrained at least once. The NRI and Joint Commission standards require that all types of restraint, including manual holds of less than five minutes be included in this indicator. For example, rates of 4.0 means that 4% of the unique patients served were restrained at least once, for any amount of time.
8

COMPARATIVE STATISTICS
Jul Aug Sep Oct Nov Dec Jan Feb Mar Apr May Jun1Q2018 2Q2018 3Q2018 4Q2018
0.00
0.50
1.00
1.50
2.00
2.50
Restraint Hours
# of
hou
rs p
atien
ts sp
ent i
n re
stra
int
for e
very
100
0 in
patie
nt h
ours
Number of hour’s patients spent in restraint for every 1000 inpatient hours. For example, a rate of 1.6 means that two hours were spent in restraint for each 1250 inpatient hours.
9

COMPARATIVE STATISTICS
Jul Aug Sep Oct Nov Dec Jan Feb Mar Apr May Jun1Q2018 2Q2018 3Q2018 4Q2018
0.00
2.00
4.00
6.00
8.00
10.00
12.00
Percent of Patients Secluded
% o
f pati
ents
se
clude
d at
leas
t onc
e
Percent of unique patients who were secluded at least once. For example, a rate of 3.0 means that 3% of the unique patients served were secluded at least once.
10

COMPARATIVE STATISTICS
Jul Aug Sep Oct Nov Dec Jan Feb Mar Apr May Jun1Q2018 2Q2018 3Q2018 4Q2018
0.00
0.50
1.00
1.50
2.00
2.50
3.00
3.50
4.00
4.50
5.00
Seclusion Hours
# of
hou
rs p
atien
ts sp
ent i
n se
clusio
n fo
r eve
ry 1
000
inpa
tient
hou
rs
Number of hours patients spent in seclusion for every 1000 inpatient hours. For example, a rate of 0.8 means that one hour was spent in seclusion for each 1250 inpatient hours.
11

COMPARATIVE STATISTICS
4Q2018 Confinement Event Breakdown
Manual Hold
Mechanical Restraint
Locked Seclusio
n
Grand Total % of Total Cumulative %
MD1305 15 10 25 46.30% 46.30%MD1168 5 2 7 14 25.93% 72.22%MD0844 2 2 4 7.41% 79.63%MD2141 2 2 4 7.41% 87.04%MD0506 1 1 2 3.70% 90.74%MD2143 1 1 2 3.70% 94.44%MD1439 1 1 2 3.70% 98.15%MD1789 1 1 1.85% 100.00%
28 3 23 54
Unit MH MR LS Chamberlain 20 0 14Hamlin 8 3 9Knox 0 0 0
2015 2016 2017 20180
102030405060708090
100
Confinement Events
Fiscal Year
Num
ber
of E
vent
s
12
Event Apr May JunManual Hold 8 8 12Mechanical Restraint 0 1 2Locked Seclusion 5 8 10

COMPARATIVE STATISTICS
Hospital Based Inpatient Psychiatric Services (HBIPS)
The Inpatient Psychiatric Facility Quality Reporting System (IPFQRS) measures are required by the Centers for Medicare & Medicaid Services (CMS) and The Joint Commission (the hospitals accrediting agency). These measures were created due to a request made to The Joint Commission in 2003 to identify and implement a set of core performance measures for hospital-based inpatient psychiatric services. The measures have changed over the years.
IPFQRS Measures
July
201
7
Augu
st 2
017
Sept
embe
r 201
7
Oct
ober
201
7
Nov
embe
r 201
7
Dece
mbe
r 201
7
Janu
ary
2018
Febr
uary
201
8
Mar
ch 2
018
April
201
8
May
201
8
June
201
8
HBIPS-1: Percent of inpatients screened within the first three days of admission for risk of violence to self or others, substance use, psychological trauma history, and patient strengths.TJC target: 95%
100% 100% 100% 100% 90% 100% 100% 100% 100% 100% 100% 100%
HBIPS-2: Number of hour’s patients spent in physical restraint for every 1000 inpatient hours.TJC target: < 0.43
0.01 0.03 0.01 0.00 0.01 0.06 0.14 0.01 0.00 0.01 0.06 0.14
HBIPS-3:Number of hour’s patients spent in seclusion for every 1000 inpatient hours.TJC target: < 0.35
0.25 0.24 0.03 0.03 0.03 0.10 0.40 0.53 0.21 0.16 0.30 0.31
HBIPS-5:Percept of patients with appropriate justification for discharge on multiple antipsychotic medications.TJC target: 63%
100% 100% * * 100% * * 100% 100% * 100% 100%
* No patients were discharged on multiple antipsychotics this month
13

COMPARATIVE STATISTICS
Note: TJC targets typically run approximately 6 months behind; the TJC targets above were for the 4 th
quarter of calendar year 2017 (October-December 2017).Contract Management
TJC LD.04.03.09 The same level of care should be delivered to patients regardless of whether services are provided directly by the hospital or through contractual agreement. Leaders provide oversight to make sure that care, treatment, and services provided directly are safe and effective. Likewise, leaders must also oversee contracted services to make sure that they are provided safely and effectively.
4Q2018 ResultsContractor Program Administrator Summary of PerformanceAffiliated Laboratory Christine Bellatty, RN
Acting Director of NursingAll indicators met standards.
Casella Waste Systems Mark FaulknerDirector of Facilities
All indicators met standards.
CES, Inc. Mark FaulknerDirector of Facilities
All indicators met or exceeded standards.
Comprehensive Pharmacy Services
Carolyn DimekActing Superintendent
All indicators met or exceeded standards.
Liberty Healthcare Physicians and/or Mid-Levels on Call
Dr. Michelle GardnerClinical Director
All indicators met standards.
Liberty Healthcare Psychiatric Nurse Practitioner
Dr. Michelle Gardner Clinical Director
All indicators met standards.
MD-IT Transcription Michelle WelchMedical Records Administrator
All indicators met standards.
Northeast Cardiology Associates (NECA)
Dr. Michelle Gardner Clinical Director
Indicator met standards.
Norris, Inc. Mark FaulknerDirector of Facilities
All indicators met standards.
Otis Elevator Mark FaulknerDirector of Facilities
All indicators met standards.
Penobscot Community Health Care (PCHC)
Dr. Michelle Gardner Clinical Director
All indicators met standards.
Project Staffing Carol DavisBusiness Manager
All indicators exceeded standards.
Securitas Mark FaulknerDirector of Facilities
All indicators met or exceeded standards.
UniFirst Mark FaulknerDirector of Facilities
All indicators met standards.
Worldwide Travel Staffing Christine Bellatty, RNActing Director of Nursing
All indicators met standards.
14

JOINT COMISSION
Medication Management
Medication Errors and Adverse Reactions
TJC PI.01.01.01 EP14: The hospital collects data on the following: Significant medication errors. (See also LD.04.04.01, EP 2; MM.08.01.01, EP 1)
TJC PI.01.01.01 EP15: The hospital collects data on the following: Significant adverse drug reactions. (See also LD.04.04.01, EP 2; MM.08.01.01, EP 1)
Jul Aug Sep Oct Nov Dec Jan Feb Mar Apr May Jun1Q2018 2Q2018 3Q2018 4Q2018
0.00
10.00
20.00
30.00
40.00
50.00
60.00
Medication Error Rate
# of
med
icatio
n er
ror e
vent
s tha
t oc
curr
ed f
or e
very
100
0 ep
isode
s of c
are
Number of medication error events that occurred for every 100 episodes of care (duplicated patient count). For example, a rate of 1.6 means that two medication error events occurred for each 125 episodes of care.
Note: The April 2018 medication error rate is higher than normal due to two patients receiving multiple medications late on a particular day.
15

JOINT COMISSION
Apr May Jun Jul Aug Sep Oct Nov Dec Jan Feb Mar Apr May Jun2018
0
5
10
15
20
25
Medication Errors by Type
Num
ber o
f Eve
nts
16

JOINT COMISSION
Inpatient Consumer Survey
TJC PI.01.01.01 EP16: The hospital collects data on the following: Patient perception of the safety and quality of care, treatment, and services.
In order to gain a perspective on the quality of care provided to our patients from the patient’s perspective, Dorothea Dix Psychiatric Center conducts and the Inpatient Customer Survey.
The Inpatient Customer Survey (ICS) is a standardized national survey of customer satisfaction. The National Association of State Mental Health Program Directors Research Institute (NRI) collects data from state psychiatric hospitals throughout the country in an effort to compare the results of patient satisfaction in six areas or domains of focus. These domains include Outcomes, Dignity, Rights, Participation, Environment, and Empowerment.
NRI Inpatient Consumer Survey (ICS) Response Rate:
April May June 4Q2018Number of patients discharged 5 9 6 20Number of survey responses 1 4 2 7Survey response rate 20% 44% 33% 35%
Note: The following graphs contain the results of the Inpatient Consumer Survey. If there is no result for a particular month, it indicates that no surveys were completed for that month.
17

JOINT COMISSION
Jul Aug Sep Oct Nov Dec Jan Feb Mar Apr May Jun1Q2018 2Q2018 3Q2018 4Q2018
0.00
10.00
20.00
30.00
40.00
50.00
60.00
70.00
80.00
90.00
100.00
Patient Survey Outcome of Care Domain
% o
f pati
ents
with
pos
itive
resp
onse
s
Outcome Domain
1. I am better able to deal with crisis.2. My symptoms are not bothering me as much.
3. I do better in social situations.4. I deal more effectively with daily problems.
18

JOINT COMISSION
Jul Aug Sep Oct Nov Dec Jan Feb Mar Apr May Jun1Q2018 2Q2018 3Q2018 4Q2018
0.00
10.00
20.00
30.00
40.00
50.00
60.00
70.00
80.00
90.00
100.00
Patient SurveyDignity Domain
% o
f pati
ents
wih
t pos
itive
resp
onse
s
Dignity Domain1. I was treated with dignity and respect.2. Staff here believed that I could grow, change and recover.
3. I felt comfortable asking questions about my treatment and medications.4. I was encouraged to use self-help/support groups.
19

JOINT COMISSION
Jul Aug Sep Oct Nov Dec Jan Feb Mar Apr May Jun1Q2018 2Q2018 3Q2018 4Q2018
0.00
10.00
20.00
30.00
40.00
50.00
60.00
70.00
80.00
90.00
100.00
Patient SurveyRights Domain
% o
f pati
ents
with
pos
itive
resp
onse
s
Rights Domain
1. I felt free to complain without fear of retaliation.2. I felt safe to refuse medication or treatment during my hospital stay.
3. My complaints and grievances were addressed.
20

JOINT COMISSION
Jul Aug Sep Oct Nov Dec Jan Feb Mar Apr May Jun1Q2018 2Q2018 3Q2018 4Q2018
0.00
10.00
20.00
30.00
40.00
50.00
60.00
70.00
80.00
90.00
100.00
Patient Survey Participation in Treatment Domain
% o
f pati
ents
with
pos
itive
resp
onse
s
Participation Domain
1. I participated in planning my discharge.2. Both I and my doctor, or therapist from the community, were actively involved in my hospital
treatment plan.3. I had an opportunity to talk with my doctor or therapist from the community prior to discharge.
21

JOINT COMISSION
Jul Aug Sep Oct Nov Dec Jan Feb Mar Apr May Jun1Q2018 2Q2018 3Q2018 4Q2018
0.00
10.00
20.00
30.00
40.00
50.00
60.00
70.00
80.00
90.00
100.00
Patient SurveyFacility Environment Domain
% o
f pati
ents
with
pos
itive
resp
onse
s
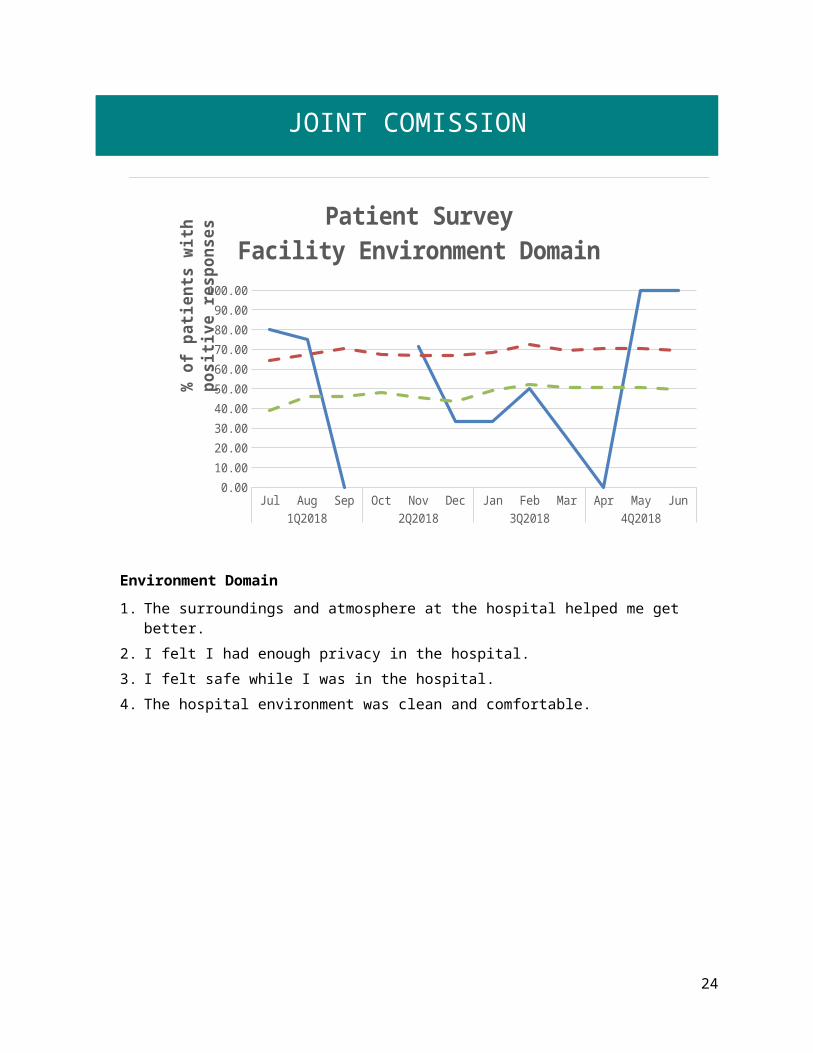
Environment Domain
1. The surroundings and atmosphere at the hospital helped me get better.2. I felt I had enough privacy in the hospital.
3. I felt safe while I was in the hospital.4. The hospital environment was clean and comfortable.
22

JOINT COMISSION
Jul Aug Sep Oct Nov Dec Jan Feb Mar Apr May Jun1Q2018 2Q2018 3Q2018 4Q2018
0.00
10.00
20.00
30.00
40.00
50.00
60.00
70.00
80.00
90.00
100.00
Patient SurveyEmpowerment Domain
% o
f pati
ents
with
pos
itive
resp
onse
s
Empowerment Domain
1. I had a choice of treatment options.2. My contact with my doctor was helpful.
3. My contact with nurses and therapists was helpful.
23
JOINT COMISSION
Fall Reduction Strategies
TJC PI.01.01. EP38 The hospital evaluates the effectiveness of all fall reduction activities including assessment, interventions and education.
Jul Aug
Sep Oct
Nov
Dec Jan Feb
Mar
Apr
May Jun Jul Aug
Sep Oct
Nov
Dec Jan Feb
Mar
Apr
May Jun
2017 2018
0123456789
10
Number of FallsWitnessed & Unwitnessed
Numb
er of
Falls
24

JOINT COMISSION
Fall Reduction Nursing Interventions Christine Bellatty, RN
Up to 50% of hospitalized patients are at risk for falls, and almost half of those who fall suffer an injury (American Nurse Today, Special Supplement to American Nurse Today - Best Practices for Falls Reduction: A Practical Guide. Multiple authors, March 2011, 6. No 2). The objective of Nursing’s Fall Performance Improvement measure is to ensure compliance with Nursing Procedure F-10 with the overall objective of ensuring that information is gathered about each patient for problem identification to ensure health and safety needs are met.
All patient falls 4Q2018
Falls risk assessment completed?
Fall Risk Score >6Problem 6.1 initiated
Falls Risk Stickeron Kardex
2Yes: 1No: 0N/A: 1
Yes: 1No: 0N/A: 1
This measure had a 6-month spot check
completed and continues to meet goal
at 100%
Overall Compliance 100% 100% 100% 100%
Data Analysis: 4Q2018 shows two falls all meeting definition of a fall. Overall compliance was 100%.
The question “Fall risk sticker on Kardex” was evaluated by a one-year spot check in April 2018, to ensure consistent and reliable documentation compliance. Documentation continued to meet goal of 100% compliance. This element has been resolved.
The question “Falls Risk Assessment Completed?” met goal of 100% nursing documentation compliance for four consecutive months containing falls. This element will be removed from aggregation and evaluated by six-month spot check in December 2018 to ensure consistent and reliable documentation compliance.
25

JOINT COMISSION
1Q2017 2Q2017 3Q2017 4Q2017 1Q2018 2Q2018 3Q2018 4Q20180
5
10
15
20
25
Patient Falls by Quarter
Num
ber o
f fal
ls
Action Plan: Auditing Nurse Supervisor provides education to staff during auditing process. Nursing administration will continue to follow up and audit all falls. Due to decreased compliance in nursing documentation for Falls Risk Assessment, Falls documentation packets were formed, including 565R Falls Documentation Checklist, and distributed to each unit in order to increase patient safety and overall compliance. Charge Nurse Checklist was created to improve patient care/safety and to ensure proper documentation is being completed.
26

JOINT COMISSION
Pain Assessment Christine Bellatty, RN
Pain Audit Shift Assessment
Untreated pain impairs an individual’s ability to carry out their activities of daily living diminishing his or her quality of life; it can cause anxiety, fear, anger, or depression. Nursing acknowledges the impact of untreated pain on patient recovery and for this reason the objective of Nursing’s Pain PI is to ensure patients are being assessed for pain and re-assessed if required. The procedure for Pain Audit Shift Assessment was updated to include a change in form; patient pain assessments are completed once daily. Documentation of patient pain at least every 24 hours is acceptable practice and meets regulations. The 2Q2017 measurements are comprised of November and December as October auditing was deferred during the revision process. Audits were initiated in January 2013, January and February 2013 comprise the baseline data of 33%.
Results
Target Data elementsBaselineJan/Feb
20131Q2018 2Q2018 3Q2018 4Q2018 YTD
90% Compliance
Number of audits completed 36 104 122 113 112 451
Number of audits having 1 shift assessment completed that assesses for the presence and intensity of pain within 24 hours
12 100 98 97 109 404
Overall Compliance 33% 96% 80% 86% 97% 90%
Data Analysis: 4Q2018 shows an increase above goal to 97%; this is an 11% increase from previous quarter.
27

JOINT COMISSION
1Q2018 2Q2018 3Q2018 4Q20180%
10%
20%
30%
40%
50%
60%
70%
80%
90%
100%
Quarterly Compliance Pain Shift Assessment Audits
Action Plan: Nursing exceeded goal this Quarter. Nursing Administration will continue to collect data and monitor the process to ensure that pain is being assessed and documented at least every 24 hours for every patient. Clinical Nurse Managers will address staff members that are not completing these assessments. Pain Management forms, procedure and documentation have been recently updated to improve patient care and documentation. Also, a Charge Nurse Checklist has been distributed to each unit, with education, to ensure appropriate documentation is completed.
28

JOINT COMISSION
Dietary Wendy Schriver, RD
I. Measure Name: ServSafe Training
Measure Description: ServSafe is a food and beverage safety training and certificate program administered by the National Restaurant Association. Type of Measure: Performance Improvement
Results
TargetBaseline 1Q2018 2Q2018 3Q2018 4Q2018 YTD
1Q201793%
100% 100% 100% 100% 100%
Actual 50%7/14
67%10/15
76%10/13
86%13/15
70%40/57
Data Analysis: At the end of the 4Q2018 86% of current employees in the department completed ServSafe training. This is down from the baseline of 93% due to staff turnover in the department or staff certifications may have expired. A class was taught to four employees during 4Q2018 which helped towards meeting the department’s goal.
Action Plan: We will plan on offering the class to the remaining staff. The department is currently fully staffed which also helps with meeting the goal. Food safety training is also reinforced in the department when needed.
29

QUALITY ASSURANCE & PERFORMANCE IMPROVEMENT
II. Measure Name: Cleaning Schedule and Checklist
Measure Description: Dietary staff will complete and maintain proper sanitation process for kitchen equipment
Type of Measure: Performance Improvement
Results
TargetBaseline 1Q2018 2Q2018 3Q2018 4Q2018 YTD
1Q201849%
100% 100% 100% 100% 100%
Actual 49%63/129
97%125/129
90%359/401
99%353/357
89%900/1016
Methodology: The Food Service Manager or designee will verify completion of sanitation processes for kitchen equipment through validation of sanitation schedule and checklist to ensure equipment is clean and sanitary. The dietetic services workers will be responsible for documenting completion of each task. The supervisor will review the sheets and complete a sanitation inspection of the kitchen equipment on a weekly basis.
Data Analysis: 4Q2018: 91 days, 357 duties, 353 completed for 99% completion
o Cook Weekly duties: 168 duties, 165 completedo Cook Monthly duties: 39 duties, 39 completedo FSW Weekly duties: 130 duties, 130 completedo FSW Bi-Weekly/Monthly duties: 20 duties, 19 completed
Action Plan: Completion of cleaning duties improved with the goal being 99% met for 4Q2018. The department will continue to work on training staff when needed to assure all duties are completed. Keeping the department fully staffed also helps with completion of all duties. The adequate completion of cleaning duties is part of ongoing quality assurance in the department.
30

QUALITY ASSURANCE & PERFORMANCE IMPROVEMENT
Facilities Mark Faulkner
I. Measure Name: Access Control
Measure Description: Measure the success of the hospitals ability to maintain access control for terminated (including resigned, retired, and transferred) employees.
Type of Measure: Performance Improvement
Results
TargetUnit Baseline 1Q2018 2Q2018 3Q2018 4Q2018 YTD
Number of opportunities
for access control
verification
New Measure1Q2018
88%
100% 100% 100% 100% 100%
Actual 88%15/17
100%18/18
80%16/20
87%14/16
89%63/71
Methodology: The Plant Maintenance Engineer will maintain a database of keys/badge received within 24 hours of termination (including resigned, retired, and transferred) of the employee. The Plant Maintenance Engineer will compare weekly with the terminated employee list provided by Human Resources to analyze effectiveness of the program.
The numerator will be the total number of opportunities identified on the Facilities keys/badge database that were received within 24 hours and the denominator will be the total number of employees terminated that week as per to the Human Resources terminated employee list. The performance percentage (performance ratio) will be the numerator divided by the denominator.
Data Analysis: During the 4Q2018, 16 employees were terminated from employment per the terminated employee list provided by Human Resources. 14 keys/badge were received by Facilities within 24 hours for a success rate of 87%.
Action Plan: None needed at this time.
31
QUALITY ASSURANCE & PERFORMANCE IMPROVEMENT
II. Measure Name: Main Entrance Sign Out/In Log Verification
Measure Description: Analyze the Main Entrance Sign Out/In Log to verify contraband that is allowed for patient use off grounds (belts and shoelaces) is successfully removed upon reentry to the hospital. Verification of this will be done using the Incident Reports completed if contraband is found on the patient units.
Type of Measure: Quality Assurance
Results
TargetUnit Baseline 1Q2018 2Q2018 3Q2018 4Q2018 YTD
Number of opportunities
for contraband
to enter
New Measure1Q2018
100%
100% 100% 100% 100% 100%
Actual 100%847/847
100%786/786
100%678/678
100%730/730
100%3041/3041
Methodology: The Director of Facilities (DOF) and the Site Security Supervisor will perform quarterly audits of the main entrance sign out/in log to verify that all contraband allowed for patient use off grounds is successfully removed and logged upon re-entry to the hospital. Verification of successful screenings will be conducted by referencing incident reports completed if contraband allowed for patient use off grounds is found on patient units.
The denominator will be the total number of opportunities identified in the main entrance sign out/in log with the numerator being the total number of incident reports completed where contraband was found on a patient unit that should have been removed upon re-entry from an off grounds pass. The performance percentage (performance ratio) will be the numerator divided by the denominator.
Data Analysis: During the 4Q2018, 730 opportunities for contraband to re-enter the hospital were identified by using the Main Entrance Sign Out/In Log that indicates contraband allowed for patient use off grounds. 730 items listed were removed upon re-entry to the hospital resulting in zero IR’s of contraband found on a patient unit resulting from Main Entrance Sign Out/In Contraband Log for a 100% success rate.
Action Plan: None needed at this time.
32

QUALITY ASSURANCE & PERFORMANCE IMPROVEMENT
III. Measure Name: Personal Protective Equipment Assessments
Measure Description: Personal Protective Equipment (PPE) Assessments will be conducted randomly on employees performing tasks associated with the need to use PPE.
Type of Measure: Quality Assurance
Results
TargetUnit Baseline 1Q2018 2Q2018 3Q2018 4Q2018 YTD
Number of opportunities
for PPE Assessment
New Measure1Q2018
93%
100% 100% 100% 100% 100%
Actual 93%14/15
93%14/15
96%25/26
93%14/15
94%67/71
Methodology: The Institutional Safety & Maintenance Director and the Director of Facilities will perform 15 unannounced PPE Assessments per quarter to ensure proper PPE is being utilized during tasking. Partial Hazard Communication Program effectiveness will be assessed by using data from the opportunity to properly comply with the Hazard Communication Program versus non-compliance.
The denominator will be the total number of unannounced PPE Assessments conducted during the quarter for Facilities staff conducting tasking that requires PPE. The numerator will be the total number of PPE assessments conducted during the quarter for Facilities staff where proper PPE was utilized while performing tasking that requires PPE. The performance percentage (performance ratio) will be the numerator divided by the denominator.
Data Analysis: During the 4Q2018, 15 PPE assessments were performed. Of the 15 assessments performed, 14 were performing tasking while utilizing the proper PPE; therefore, the overall compliance rate for the quarter is 93%.
Action Plan: None needed at this time.
33

QUALITY ASSURANCE & PERFORMANCE IMPROVEMENT
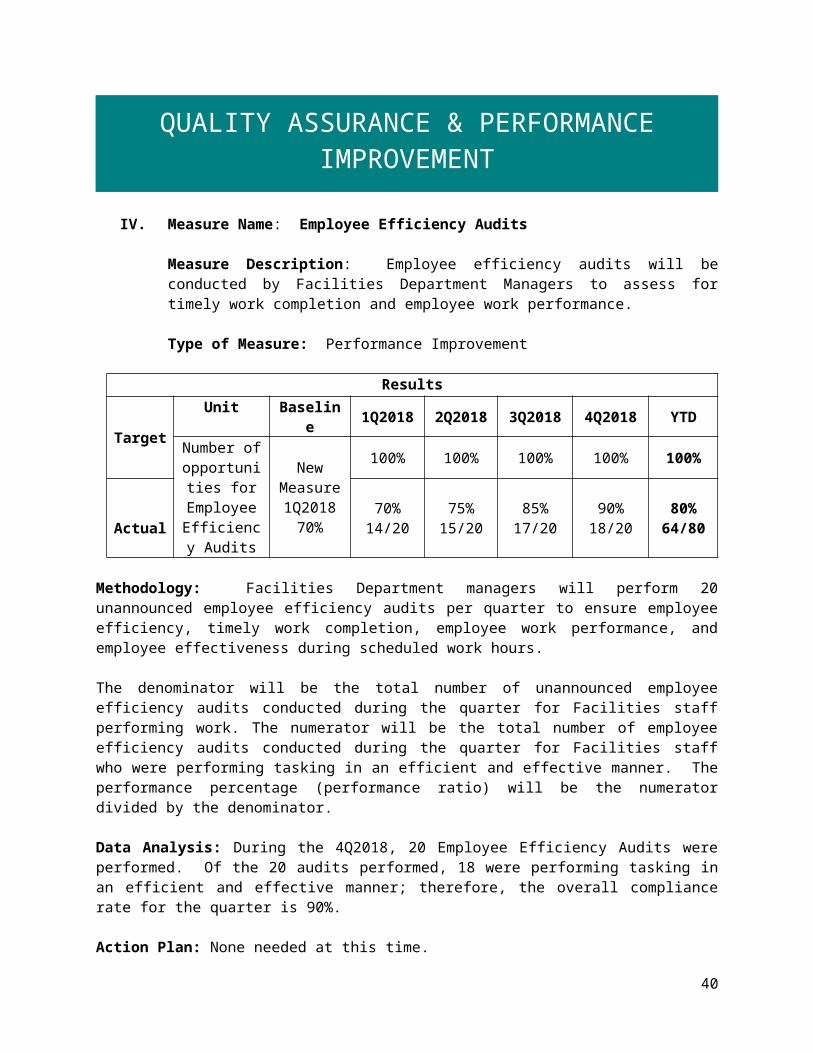
IV. Measure Name: Employee Efficiency Audits
Measure Description: Employee efficiency audits will be conducted by Facilities Department Managers to assess for timely work completion and employee work performance.
Type of Measure: Performance Improvement
Results
TargetUnit Baseline 1Q2018 2Q2018 3Q2018 4Q2018 YTD
Number of opportunities for Employee
Efficiency Audits
New Measure1Q2018
70%
100% 100% 100% 100% 100%
Actual 70%14/20
75%15/20
85%17/20
90%18/20
80%64/80
Methodology: Facilities Department managers will perform 20 unannounced employee efficiency audits per quarter to ensure employee efficiency, timely work completion, employee work performance, and employee effectiveness during scheduled work hours.
The denominator will be the total number of unannounced employee efficiency audits conducted during the quarter for Facilities staff performing work. The numerator will be the total number of employee efficiency audits conducted during the quarter for Facilities staff who were performing tasking in an efficient and effective manner. The performance percentage (performance ratio) will be the numerator divided by the denominator.
Data Analysis: During the 4Q2018, 20 Employee Efficiency Audits were performed. Of the 20 audits performed, 18 were performing tasking in an efficient and effective manner; therefore, the overall compliance rate for the quarter is 90%.
Action Plan: None needed at this time.
34

QUALITY ASSURANCE & PERFORMANCE IMPROVEMENT
Health Information Management Michelle Welch, RHIT
I. Measure Name: Discharge Instructions (Transition of Record)
Measure Description: To improve health outcomes/patient care next level of care providers need to know details of precipitating events immediately preceding hospital admission, the patient’s treatment course during hospitalization including rationale and target symptoms for medications changed, discharge medications and next level of care recommendations (American Association of Community Psychiatrists [AACP], 2001). CMS 482.43 (d) Necessary medical information must be provided not only for patients being transferred, but also for those being discharged home, to make the patient’s physician aware of the outcome of hospital treatment or follow-up care needs.
Methodology: Medical Records will review all discharged charts monthly for completion of all elements of the Discharge Instructions (SW Release Plan, Nursing discharge instructions, discharge summary) to assess ongoing compliance with transmittal to follow-up providers within 24 hours of discharge. All discharged charts will be reviewed monthly to ensure a compliance rate of 90% or greater for 4 consecutive months using the clinical pertinence audit tool. The denominator is all discharged charts within the audit month. The numerator will be all discharged charts in compliance within the audit month.
Type of Measure: Performance Improvement
Results
TargetUnit Baseline 1Q2018 2Q2018 3Q2018 4Q2018 YTD
Percent of transition of
record transmitted to next level of
care within 24 hours of
discharge
95% 95% 95% 95% 95% 95%
Actual 92% 100% 100% 100% 100% 100%
Data Analysis: The YTD result is 100%. The target has been surpassed all four quarters of FY2018.
Action Plan: The above is a new performance indicator for medical records. The plan is to take the above PI to review with staff. Making staff aware of the new performance indicators and the compliance issues will hopefully generate compliance with the above.
35

QUALITY ASSURANCE & PERFORMANCE IMPROVEMENT
II. Measure Name: Medical Billing Submission
Measure Description: To improve the process of medical coding and billing. Medical coding and billing is simply stated as the process of communication between the provider and the insurance company. The billing process begins with the medical care provider/patient visit. The patient’s health record is then updated summarizing the diagnosis, treatment and any pertinent information. The provider then sends a superbill to the reimbursement specialist to enter in the database.
Methodology: The reimbursement specialist will receive all provider superbills within seven days. Ward clerks will have the labels on the superbills on Mondays for all patients on the units and provide the providers with them so that they may submit the superbill to Medical Records reimbursement specialist for processing. The denominator will be the total number of superbills that are submitted for the month. The numerator will be the number of superbills that were submitted within seven days.
Type of Measure: Performance Improvement
Results
TargetUnit Baseline 1Q2018 2Q2018 3Q2018 4Q2018 YTD
Percent of superbills
received within 7 days of
provider/# of patient
encounter.
90% 90% 90% 90% 90% 90%
Actual 75% 70% 88% 87% 87% 83%
Data Analysis: 4Q2018 remained the same as 3Q2018, is above baseline, and only 3% away from meeting the target.
Action Plan: The above is a new performance indicator for medical records. The plan is to take the above PI to review with Medical Staff. Making Medical Staff aware of the new performance indicators and the compliance issues will hopefully generate compliance with the above.
36

QUALITY ASSURANCE & PERFORMANCE IMPROVEMENT
III. Measure Name: Release of Information
Measure Description: Coordinate the release of health information to requestors including patients, physicians, other health care providers, and insurance companies within 24 hours or the next business day. Excluded: transition of record
Methodology: Medical Records will respond to authorizations to release information within 24 hours or the next business day after receipt. The releases will be reviewed monthly to ensure a compliance rate of 98% or greater using the release of information log. The denominator is the number of releases for the month. The numerator will be all releases that were responded to within the specified time frame.
Type of Measure: Quality Assurance
Results
TargetUnit Baseline 1Q2018 2Q2018 3Q2018 4Q2018 YTD
Percent of requests
responded to within 24 hrs.
4Q201797%
98% 98% 98% 98% 98%
Actual 98% 100% 100% 100% 99%
Data Analysis: 4Q2018 data remained the same as 3Q2018, above both baseline and target.
Action Plan: The above is a quality assurance indicator for medical records. The plan is to take the above QA to review with medical records staff. Making staff aware of the compliance issues will hopefully generate compliance with the above.
37

QUALITY ASSURANCE & PERFORMANCE IMPROVEMENT
IV. Measure Name: Medical Record Review Process
Measure Description: To ensure uniform construction of all medical records to enhance the effectiveness of the contribution to patient care made by complete and concise medical records.
Methodology: Medical Records will review all discharged charts monthly for completion, including accuracy and timeliness. All discharged charts will be reviewed monthly to ensure a compliance rate of 98% or greater using the clinical pertinence audit tool. The denominator is all discharged charts within the audit month. The numerator will be all discharged charts in compliance within the audit month.
Type of Measure: Quality Assurance
Results
TargetUnit Baseline 1Q2018 2Q2018 3Q2018 4Q2018 YTD
Percent of discharge charts in compliance.
4Q2017100%
98% 98% 98% 98% 98%
Actual 91% 94% 94% 80% 90%
Data Analysis: 4Q2018 had 4 out of 20 records that were not complete and accurate within the 30-day time frame resulting in data compliance at 80%. This falls below the baseline as well as target.
Action Plan: The above is a quality assurance indicator for medical records. The plan is to take the above QA to review with all staff. Making staff aware of the compliance issues will hopefully generate compliance with the above.
38

QUALITY ASSURANCE & PERFORMANCE IMPROVEMENT
Human Resources Donald Williams
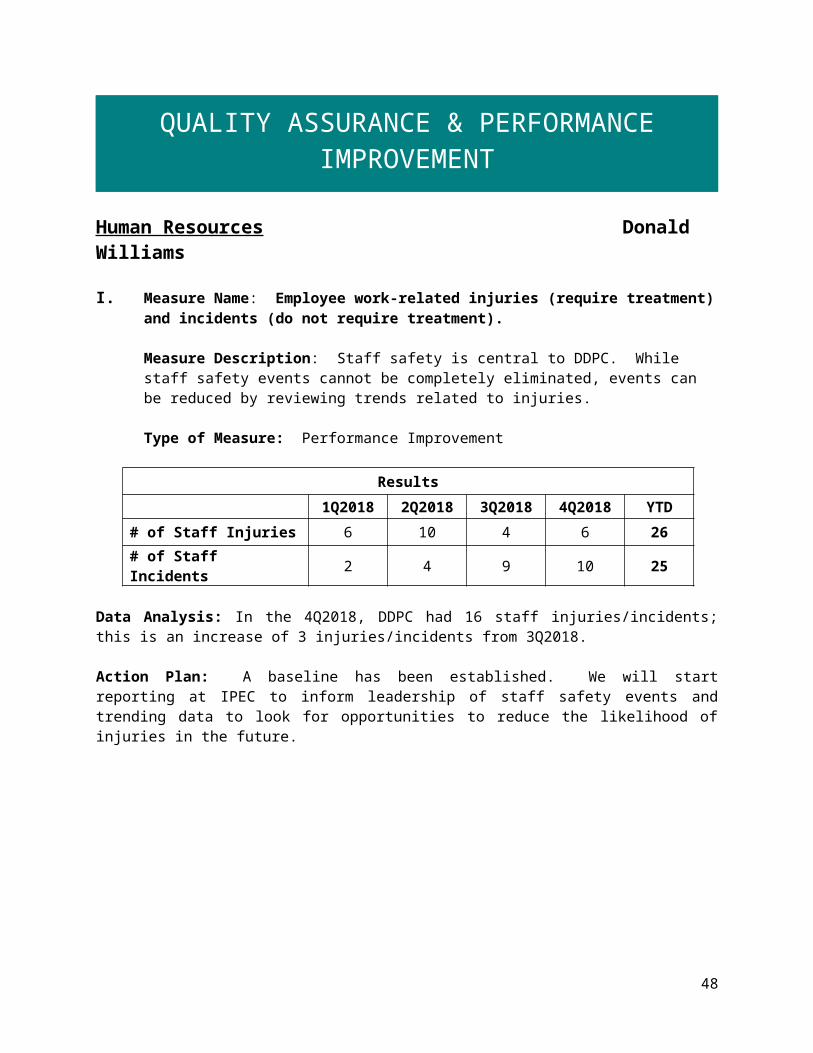
I. Measure Name: Employee work-related injuries (require treatment) and incidents (do not require treatment).
Measure Description: Staff safety is central to DDPC. While staff safety events cannot be completely eliminated, events can be reduced by reviewing trends related to injuries.
Type of Measure: Performance Improvement
Results
1Q2018 2Q2018 3Q2018 4Q2018 YTD
# of Staff Injuries 6 10 4 6 26
# of Staff Incidents 2 4 9 10 25
Data Analysis: In the 4Q2018, DDPC had 16 staff injuries/incidents; this is an increase of 3 injuries/incidents from 3Q2018.
Action Plan: A baseline has been established. We will start reporting at IPEC to inform leadership of staff safety events and trending data to look for opportunities to reduce the likelihood of injuries in the future.
1Q2018 2Q2018 3Q2018 4Q20180123456789
1011
Staff Injuries & Incidents
# of Staff Injuries # of Staff Incidents
# of E
vent
s
39
QUALITY ASSURANCE & PERFORMANCE IMPROVEMENT
Patient to Staff Assa
ult
Patient - Assi
sting
Falls In Parkin
g Lot
Falls - S
lipped/Tripped
Repetitive Task
EquipmentOther
0
5
10
15
20
25
Causes of Staff Injuries/Incidents FY2018
1Q2018 2Q2018 3Q2018 4Q2018 YTD
II. Measure Name: Vacancies filled within 45 days of posting.
Measure Description: The hospital will maintain an adequate workforce to maintain safety and provide therapeutic care for patients.
Type of Measure: Performance Improvement
Results
TargetBaseline 1Q2018 2Q2018 3Q2018 4Q2018 YTDFY2016 Average 100% 100% 100% 100% 100%
Average Quarter Vacancy Rate % 15% 12% 8% 5% 7% 8%
# Vacancies Posted 14 25 29 29 26 109
# Vacancies Posted Filled Within 45 Days
6 6 10 15 15 46
% Posted & Filled 40% 24% 34% 51% 58% 42%
40

QUALITY ASSURANCE & PERFORMANCE IMPROVEMENT
Within 45 Days
Data Analysis: This new data collection is an effort to reduce extended time periods of vacant positions.
Action Plan: Increase percentage rate of filled quarterly posted vacancies within 45 days of posting.
1Q2018 2Q2018 3Q2018 4Q2018 YTD0
20
40
60
80
100
120
Vacancies
# of Vacancies # of Vacancies Filled # of Vacancies Filled within 45 Days of Posting
41

QUALITY ASSURANCE & PERFORMANCE IMPROVEMENT
1Q2018 2Q2018 3Q2018 4Q20180%
10%
20%
30%
40%
50%
60%
70%
80%
90%
100%
24%
34%
51%58%
% of Vacancies Filled within 45 Days of Posting
III. Measure Name: Performance Evaluations completed by due date.
Measure Description: DDPC evaluates staff based on performance expectations that reflect their job responsibilities. This evaluation is documented in the HR Personnel File by is due date.
Type of Measure: Performance Improvement
Results
Target
Baseline 1Q2018 2Q2018 3Q2018 4Q2018 YTDMonthly Average FY2016
100% 100% 100% 100% 100%
# Due 43 38 44 30 40 152
# Completed on Time 17 38 43 29 40 150
% Completed on Time 38% 100% 99% 99% 100% 99%
Data Analysis: Performance Evaluations continue to be completed by due date in 4Q2018.
Action Plan: None needed at this time.
42

QUALITY ASSURANCE & PERFORMANCE IMPROVEMENT
1Q2018 2Q2018 3Q2018 4Q20180
5
10
15
20
25
30
35
40
45
50
Performance Evaluations Completed On Time
# of Performance Reviews Due # of Performance Reviews completed on time
1Q2018 2Q2018 3Q2018 4Q20180%
10%
20%
30%
40%
50%
60%
70%
80%
90%
100%
Percent of Performance Reviews Completed On Time
% C
ompl
eted
On
Tim
e
43

QUALITY ASSURANCE & PERFORMANCE IMPROVEMENT
Infection Control Michelle Harriman, RN
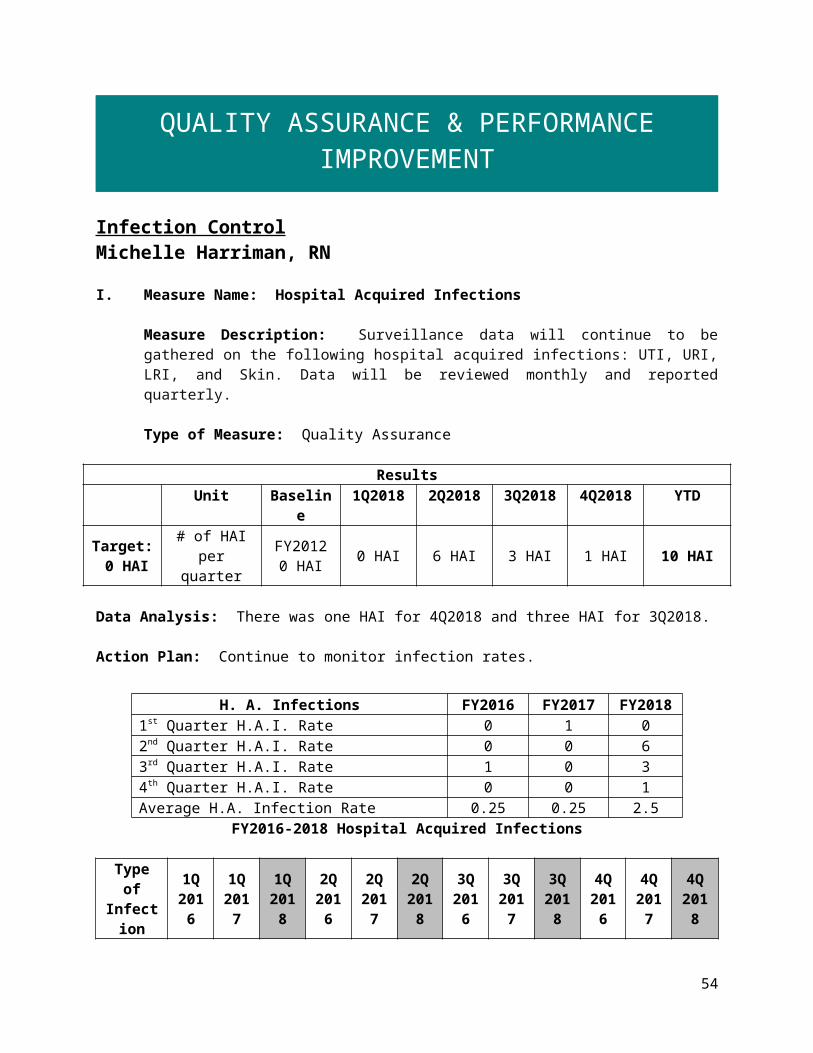
I. Measure Name: Hospital Acquired Infections
Measure Description: Surveillance data will continue to be gathered on the following hospital acquired infections: UTI, URI, LRI, and Skin. Data will be reviewed monthly and reported quarterly.
Type of Measure: Quality Assurance
ResultsUnit Baseline 1Q2018 2Q2018 3Q2018 4Q2018 YTD
Target: 0 HAI
# of HAI per quarter
FY20120 HAI 0 HAI 6 HAI 3 HAI 1 HAI 10 HAI
Data Analysis: There was one HAI for 4Q2018 and three HAI for 3Q2018.
Action Plan: Continue to monitor infection rates.
FY2016-2018 Hospital Acquired Infections
Type of Infection
1Q 2016
1Q 2017
1Q 2018
2Q 2016
2Q 2017
2Q 2018
3Q 2016
3Q 2017
3Q 2018
4Q 2016
4Q 2017
4Q 2018
UTI 0 0 0 0 0 0 0 0 0 0 0 1URI 0 0 0 0 0 1 0 0 1 0 0 0 LRI 0 1 0 0 0 0 0 0 0 0 0 0 Skin 0 0 0 0 0 2 1 0 0 0 0 0 Totals 0 0 0 0 0 3 1 0 1 0 0 1 Infection Rate 0 0.26 0 0 0 0.77 0.28 0 0.27 0 0 0.28
Multi-drug resistant organisms (MDRO) for 4Q2018: 0Cases of Legionnaires Disease for 4Q2018: 0
44
H. A. Infections FY2016 FY2017 FY20181st Quarter H.A.I. Rate 0 1 02nd Quarter H.A.I. Rate 0 0 63rd Quarter H.A.I. Rate 1 0 34th Quarter H.A.I. Rate 0 0 1Average H.A. Infection Rate 0.25 0.25 2.5

QUALITY ASSURANCE & PERFORMANCE IMPROVEMENT
II. Measure Name: Patient & Family Education on Hand Hygiene/Cough Etiquette
Measure Description: Prior to discharge, a questionnaire will be distributed to each patient that includes the following questions:
D1: I received information on how to stay healthy by washing my hands
D2: I received information on how to cover my cough or sneeze to prevent the spread of illness
Type of Measure: Performance Improvement
ResultsUnit Baseline 1Q2018 2Q2018 3Q2018 4Q2018 YTD
Target:D1 90%
Quarterly response rate
“agree/strongly agree” for D1 & D2 is set at 90%
2012: D1 response rate: 80%
77% 61% 70% 64% 68%
Target:D2 90%
2012: D2 response rate: 80%
65% 61% 100% 75% 75%
Data Analysis: 4Q2018 response rate for question D1 was 64%, a decrease of 6% from the previous quarter. 4Q2018 response rate for question D2 was 75%, a decrease of 25% from the previous quarter.
Number of discharges: 20Number of questionnaires received: 10Return rate for FY2018: 50%
Action Plan: For FY2018, the goal remains at 90% compliance rate. IC RN will increase presence on the units, offering education to patients, and ensuring that Purell is being offered/encouraged at meal times.
45

QUALITY ASSURANCE & PERFORMANCE IMPROVEMENT
1Q 2Q 3Q 4Q0%
10%
20%
30%
40%
50%
60%
70%
80%
90%
100%
D1 Quarterly Response Rate"Y
es"
they
rece
ived
in
form
ation
1Q 2Q 3Q 4Q0%
10%
20%
30%
40%
50%
60%
70%
80%
90%
100%
D2 Quarterly Response Rate
"Yes
" th
ey re
ceiv
ed
info
rmati
on
46

QUALITY ASSURANCE & PERFORMANCE IMPROVEMENT
1Q2017 2Q2017 3Q2017 4Q2017 1Q2018 2Q2018 3Q2018 4Q2018
-60%
-40%
-20%
0%
20%
40%
60%
80%
100%
120%
Quarterly Incremental Increases/Decreases
III. Measure Name: Healthcare Worker (HCW) Hand Hygiene
Measure Description: HCW hand hygiene is being monitored on each unit with a minimum of 10 “direct observations” during a 24-hour period per month. This is currently the “gold star” and the most reliable method for assessing adherence rates.
Type of Measure: Performance Improvement
ResultsUnit Baseline
1Q2017 1Q2018 2Q2018 3Q2018 4Q2018 YTD
Target: sustained level of compliance
that approaches 90%
HCW hand hygiene
compliance rate per unit per quarter
Knox: 93% 93% 87% 70% 87% 84%
Hamlin: 87% 100% 83% 90% 90% 91%
Chamberlain: 93% 100% 83% 90% 93% 92%
Data Analysis: In 4Q2018, Knox’s compliance rate was 87%, an increase of 17% from the previous quarter; Hamlin’s compliance rate was 90%, same as the previous quarter; and Chamberlain’s compliance rate was 93%, an increase of 3% from the previous quarter.
47
QUALITY ASSURANCE & PERFORMANCE IMPROVEMENT
Action Plan: Continue to monitor HCW hand hygiene compliance per CDC guidelines. Educate staff on how missed opportunities could be corrected.
1Q17 2Q17 3Q17 4Q17 1Q18 2Q18 3Q18 4Q18 1Q19 2Q19 3Q19 4Q190%
20%
40%
60%
80%
100%
120%
Healthcare Worker Hand Hygiene Compliace Rate
% C
ompl
ianc
e
IV. Measure Name: Quantiferon Gold testing on all admissions
Measure Description: Surveillance data will continue to be gathered on the following data and will be reviewed monthly and reported quarterly.
Type of Measure: Quality Assurance
ResultsUnit Baselin
e1Q2018 2Q2018 3Q201
84Q2018 YTD
Target: 80% % per quarter 1Q201868% 68% 86% 63% 90% 76%
Data Analysis: 90% of all admissions were tested for TB using the Quantiferon Gold test in 4Q2018. This is a 27% increase to date. This is a new measure beginning FY2018.
Action Plan: Continue to monitor adherence rates and educate staff on requirement.
48

QUALITY ASSURANCE & PERFORMANCE IMPROVEMENT
Jul Aug Sep Oct Nov Dec Jan Feb Mar Apr May June0%
20%
40%
60%
80%
100%
120%
Quantiferon Gold
V. Measure Name: Influenza Immunizations
Measure Description: The standard goal is to have a sustained level of compliance that approaches and achieves the 90% compliance rate established in the National Flu Initiative for 2020. Employee flu vaccination compliance is measured annually.
Type of Measure: Performance Improvement
ResultsUnit Baseline FY2016 FY2017 FY2018 FY2019 FY2020
Target: 90%
Percent of employees who receive the flu vaccination
FY201581% 69% 75% 75%
Data Analysis: For FY2018 the employee flu vaccination compliance rate is 75%. DDPC’s employee flu vaccination compliance rate has remained the same as FY2017.
Action Plan: Continue to educate staff and promote influenza vaccinations.
49

QUALITY ASSURANCE & PERFORMANCE IMPROVEMENT
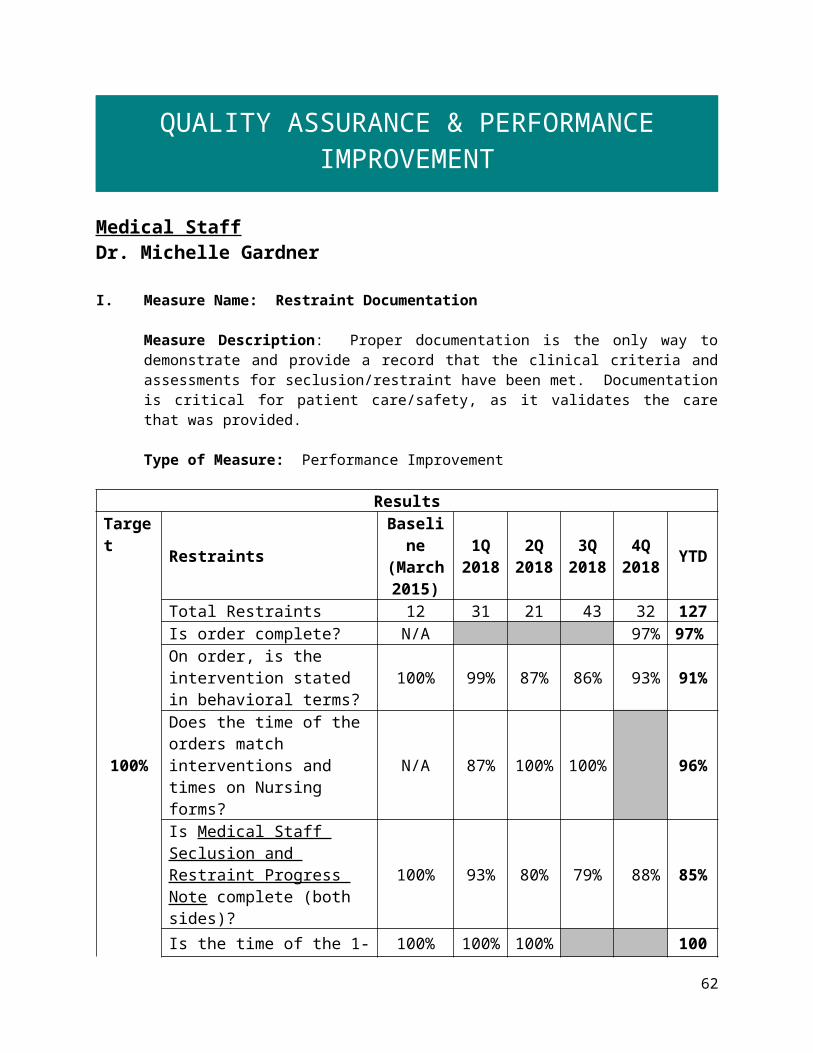
Medical Staff Dr. Michelle Gardner
I. Measure Name: Restraint Documentation
Measure Description: Proper documentation is the only way to demonstrate and provide a record that the clinical criteria and assessments for seclusion/restraint have been met. Documentation is critical for patient care/safety, as it validates the care that was provided.
Type of Measure: Performance Improvement
ResultsTarget
RestraintsBaseline (March 2015)
1Q 2018
2Q 2018
3Q2018
4Q2018 YTD
Total Restraints 12 31 21 43 32 127 Is order complete? N/A 97% 97%
On order, is the intervention stated in behavioral terms?
100% 99% 87% 86% 93% 91%
100%Does the time of the orders match interventions and times on Nursing forms?
N/A 87% 100% 100% 96%
Is Medical Staff Seclusion and Restraint Progress Note complete (both sides)?
100% 93% 80% 79% 88% 85%
Is the time of the 1-hour face to face within an hour of the event?
100% 100% 100% 100%
If PA, did PA consult with attending? 100%
Are the details of the event similar on all forms? 100% 98% 95% 100% 100% 98%
Did the medical provider participate in the Seclusion and Restraint treatment plan review?
N/A 97% 100% 99%
Overall Compliance 100% 96% 94% 91% 95% 95%
50

QUALITY ASSURANCE & PERFORMANCE IMPROVEMENT
Data Analysis: There were 32 restraints in the 4Q2018, with an overall compliance of 95%, 11 less restraint events than last quarter’s 43, and a 4% increase in compliance from 91%. Six-month spot checks were performed on the following elements:
o Question “Medical Staff Seclusion and Restraint Progress Note-is the time of the 1 hour face-to-face within 1 hour of the event?” 6-month spot check performed in April 2018. This element continues to meet goal of 100%. One-year spot check will be performed in October 2018.
o Question “On Form # 470 TX Focused Treatment Plan Review did the physician participate in treatment planning?” 6-month spot check performed in June 2018. This element continues to meet goal of 100%. One-year spot check will be performed in December 2018.
The following was removed from aggregation after a one-year spot check was completed in May 2018 and proved to continue to meet compliance goal of 100%. Element will continue to be audited to ensure compliance, however not reported.
o “If PA, did PA consult with attending?”
1Q 20182Q 2018
3Q 20184Q 2018
0%30%60%90%
Medical Staff Restraint DocumentationFY2018
Is order complete?On order, is the intervention stated in behavioral terms? Does the time of the orders match interventions and times on Nursing forms?Is Medical Staff Seclusion and Restraint Progress Note complete (both sides)?Is the time of the 1 hour face to face within an hour of the event?If PA, did PA consult with attending?Are the details of the event similar on all forms?Did the medical provider participate in the Seclusion and Restraint treatment plan review?Overall Compliance
% co
mplia
nce
51

QUALITY ASSURANCE & PERFORMANCE IMPROVEMENT
Goal: 100% Compliance with Medical Staff Documentation
Action Plan: The plan is to continue to monitor compliance with the above data elements, discuss, and address non-compliance in documentation and procedure with medical staff.
II. Measure Name: Seclusion Documentation
Measure Description: Proper documentation is the only way to demonstrate and provide a record that the clinical criteria and assessments for seclusion/restraint have been met. Documentation is critical for patient care/safety, as it validates the care that was provided.
Type of Measure: Performance Improvement
ResultsTarget
SeclusionsBaseline (March 2015)
1Q 2018
2Q 2018
3Q2018
4Q2018 YTD
Total Seclusions 7 11 5 26 18 60 Is order complete? N/A 100% 100%
On order, is the intervention stated in behavioral terms? 92% 94% 89% 76% 88% 87%
100%Does the time of the orders match interventions and times on Nursing forms?
N/A 94% 100% 88% 94%
Is Medical Staff Seclusion and Restraint Progress Note complete (both sides)? 100% 33% 89% 92% 71%
Is the time of the 1-hour face to face within an hour of the event? 100% 75% 100% 89%
If PA, did PA consult with attending? 92%
Are the details of the event similar on all forms? 100%
Did the medical provider participate in the Seclusion and Restraint treatment plan review?
N/A 96% 100% 100% 99%
Overall Compliance 96% 95% 81% 80% 95% 90%
Data Analysis: 4Q2018 shows overall compliance of 95% with 18 locked door seclusion events compared to 3Q2018, 26 events and 80% compliance.
52

QUALITY ASSURANCE & PERFORMANCE IMPROVEMENT
The following element was evaluated by 6-month spot check in June 2018 and proved to continue to meet 100% compliance:
o Did the physician participate in treatment planning? One-year spot check will be performed in December 2018, to evaluate and ensure consistent and reliable documentation compliance.
The following was removed from aggregation after a one-year spot check was completed and proved to continue to meet 100% compliance. Element will continue to be audited to ensure consistent compliance, however not reported.
o Is order complete? The following element failed 6-month spot check in June 2018, with overall compliance of 88%. This
will be reintroduced into reporting: o Does the time of the orders match interventions and times on Nursing forms?
1Q 20182Q 2018
3Q 20184Q 2018
0%20%40%60%80%
100%
Medical Staff Seclusion DocumentationFY2018
Is order complete?On order, is the intervention stated in behavioral terms? Does the time of the orders match interventions and times on Nursing forms?Is Medical Staff Seclusion and Restraint Progress Note complete (both sides)?Is the time of the 1 hour face to face within an hour of the event?If PA, did PA consult with attending?Are the details of the event similar on all forms?Did the medical provider participate in the Seclusion and Restraint treatment plan review?
% Com
plian
ce
53
QUALITY ASSURANCE & PERFORMANCE IMPROVEMENT
Goal: 100% Compliance with Medical Staff Documentation
Action Plan: The plan is to continue to monitor compliance with the above data elements, discuss, and address non-compliance in documentation and procedure with medical staff.
III. Measure Name: All elements of a medication order are complete.
Measure Description: To promote safe medication ordering by defining the required elements of a complete medication order. CMS 482.23 (c) Medications Drugs must be administered in response to an order from a practitioner, or on the basis of a standing order which is appropriately authenticated subsequently by a practitioner. In accordance with standard practice, all practitioner orders for the administration of drugs and biologicals must include at least the following:
• Name of the patient;• Age and weight of the patients, or other dose calculation requirements, when applicable;• Date and time of the order;• Drug name;• Dose, frequency, and route;• Exact strength or concentration, when applicable;• Quantity and/or duration, when applicable;• Specific instructions for use, when applicable; and• Name of the prescriber.
Type of Measure: Performance Improvement
Methodology: The Medical Director will review data provided by Medical Record monthly for compliance with all elements of a medication order. Ten to 15 medication orders per unit will be reviewed monthly by unit clerks for compliance with the elements of a medication order using and audit tool with a check of box of “yes” or “no”. The denominator will be all orders within the audit month. The numerator will be the elements of the order that are within compliance.
Goal: The goal is to have a combined compliance score of 100% with each element of a medication order for four consecutive months. The threshold is set at 90%. The results of the audits will be reported to the IPEC committee quarterly and the Advisory board.
54

QUALITY ASSURANCE & PERFORMANCE IMPROVEMENT
Data Elements Baseline 4Q2016 1Q2018 2Q2018 3Q2018 4Q2018 YTD
# of Medication orders reviewed 245 274 207 300 213 994
Medication order sheet has patient name, DOB and hospital number ID (2 patient identifiers)?
100% 100% 100% 100%
Date and time of the order 99% 99% 100% 99%Medication name 99% 100% 99% 100%Medication dose 96% 99% 96% 97% 96% 97%Route of administration 94% 97% 96% 93% 98% 96%Frequency of administration and/or dosing interval
92% 100% 98% 98% 99%
Indication for use 90% 98% 96% 97% 99% 98%Authorized prescribers signature and credentials 97% 99% 100% 99% 99% 99%
Telephone orders completed, signed, dated and timed w/in 72 hr.
97% 100% 92% 96%
Overall Compliance 96% 99% 97% 98% 97% 98%
55

QUALITY ASSURANCE & PERFORMANCE IMPROVEMENT
1Q2018 2Q2018 3Q2018 4Q20180
0.2
0.4
0.6
0.8
1
FY 2018Medical Staff Performance Improvement:
Documentation of Elements of a Medication Order
Medication order sheet has Pt name, DOB, and hospital ID (2 Pt identifiers)Date and time of the orderMedication nameMedication doseRoute of administrationFrequency of administration and/or dosing intervalIndication for useAuthorized prescriber's signature and credentialsTelephone orders completed, signed, dated and timed w/in 72 hrs.
% Com
pliance
Data Analysis: Overall compliance for 4Q2018 is 97%, 1% decrease from 3Q2018.
Action Plan: Information will be disseminated monthly to medical staff. The Clinical Director will review and address compliance issues with medical staff.
56

QUALITY ASSURANCE & PERFORMANCE IMPROVEMENT
IV. Measure Name: Inpatient psychiatry discharge progress note documented day of discharge or within 24 hours.
Measure Description: The inpatient discharge summary is a document clearly encompassing the patient’s full admission, treatment, and discharge; the discharge summary is required to be completed and signed no later than 30 days following discharge. The inpatient psychiatry discharge progress note is designed to be a useful hand-off tool for communication at time of discharge that also increases patient safety by ensuring receiving providers are well-informed to provide appropriate treatment for the patient. Dropped handoffs may cause harm to patients, regardless of clinician skill (Lin, 2014). The inpatient psychiatry discharge progress note completed on the same day, or within 24 hours of discharge decreases the chances of handoff error, miscommunication, and omission of vital information necessary for receiving providers to provide continuity in care.
Methodology: Medical staff performance improvement auditing and reporting for this measure is completed via EMR and the medical staff compliance nurse. A monthly report will be run from EMR to gather discharged patient data; each patient’s record will be audited in EMR to assess timeliness of inpatient psychiatry discharge progress note.
Type of Measure: Performance Improvement
Results
TargetUnit Baseline 1Q2018 2Q2018 3Q2018 4Q2018 YTD% of
discharge notes
completed within 24
hours
1Q201896%
100% 100% 100% 100% 100%
Actual 96%22/23
91%31/34
88%23/26
100%20/20
93%96/103
Data Analysis: 4Q2018 goal of 100% was obtained. There was a total of 20 discharges by five providers in the months of April, May and June.
Action Plan: Will continue to monitor compliance with procedure and report any deficiencies to clinical director.
57

QUALITY ASSURANCE & PERFORMANCE IMPROVEMENT
Nursing Christine Bellatty, RN
I. Measure Name: Restraint Audits – Patient Safety
Measure Description: Proper documentation is the only way to demonstrate and provide a record that the clinical criteria and assessments for seclusion/restraint have been met. Documentation is critical for patient care/safety, as it validates the care that was provided. The audits were initiated January of 2015.
Type of Measure: Performance Improvement
Results
Target Data Elements BaselineAug ‘15
1Q2018
2Q2018
3Q2018
4Q2018 YTD
100%
# of Events 11 31 21 43 32 1274. Is Form 408 Nursing Seclusion/Restraint Progress Note complete?
50% 86% 100% 99% 100% 96%
5. On Form 408 Nursing Seclusion/Restraint Progress Note, Form 470 Nursing Assessment Protocol for Seclusion and Restraint, and Physician Orders do times match for interventions initiated and time of events?
100% 79% 100% 100% 93%
9. Are details of event similar on all forms without discrepancies 408, 409, and Order sheets?
100% 98% 95% 100% 98%
15. Were debriefings DB1 & DB2 completed at appropriate times? 100% 100% 100% 100% 100% 100%
16. Is patient debriefing in the chart? 100% 100% 93% 100% 100% 98%
19. Was Form 470 TX Focused Treatment Plan Review completed within 24 hours?
95% 91% 82% 93% 85% 87%
Overall Compliance 95% 95% 97% 96% 96% 96%
Data Analysis: Baseline data compiled August 2015, with updates to Seclusion and Restraint procedure, forms, and audit tool since that time.
58

QUALITY ASSURANCE & PERFORMANCE IMPROVEMENT
4Q2018 showed an overall compliance rate of 96%, consistent with previous quarter, improved by 8% from 2015 baseline data. All elements audited were improved from baseline, or remained consistent at 100%. There were 32 restraint events this quarter, a reduction from last quarter’s 43 events. Numerous restraint events can be contributed to same-patient manual holds over the course of the quarter.
Knox had 0 restraint events this quarter. Hamlin had 11 restraint event this quarter, with an overall compliance rate of 95% for all
elements audited. Chamberlain had 21 restraint events this quarter, with an overall compliance rate of 80% for all
elements audited.
Nursing documentation was extracted and separated from Medical Staff documentation except for one data element, #9 “Are details of event similar on all forms without discrepancies, #408, #409 and Order sheets”, as this reflected equivalent documentation responsibilities prior to goal accomplishment.
Note: The following elements have been removed from aggregate data and are reported via numbers only in monthly reporting, beginning in May 2018, due to one-year spot check of meeting 100% goal.
“Were debriefings (DB1 and DB2) completed at appropriate times?” “Is Patient Debriefing in the chart?”
59

QUALITY ASSURANCE & PERFORMANCE IMPROVEMENT
Knox Hamlin Chamberlain Overall0%
10%
20%
30%
40%
50%
60%
70%
80%
90%
100% 95%
80%88%
Restraint Compliance by Unit4Q2018
% C
ompl
ianc
e
Knox Hamlin Chamberlain Total0
5
10
15
20
25
30
35
0
11
21
33
Number of Restraints by Unit4Q2018
# of
Res
trai
nts
Action Plan: Nursing staff shows improvement in documentation, but remains below goal. Nursing will continue to audit the documentation of patient restraints monthly and re-evaluate quarterly. Nursing will compare data gathered from Meditech reporting to ensure all coercive events are captured. There is a possibility that prior to beginning this cross-check in 2015 that events were not captured for data collection. Checklists were created for each unit to follow to improve patient safety and nursing documentation.
60

QUALITY ASSURANCE & PERFORMANCE IMPROVEMENT
II. Measure Name: Seclusion Documentation
Measure Description: Proper documentation is the only way to demonstrate and provide a record that the clinical criteria and assessments for seclusion/restraint have been met. Documentation is critical for patient care/safety, as it validates the care that was provided.
Type of Measure: Performance Improvement
Results
Target Data Elements BaselineAug ‘15
1Q2018
2Q2018
3Q2018
4Q2018 YTD
100% Compliance
# of Events 7 11 5 25 18 4111. On Form # 407RN 2 Hour Seclusion and Restraint Breaks 2-hour breaks are completed at appropriate intervals and signed by RN?
50% 75% 100% 100% 100% 94%
12. On Form #407RN 2 Hour Seclusion and Restraint Breaks is time ended for S/R completed and signed by RN
50% 100% 100%
13. On Form #407 Seclusion & Restraint Monitoring and Assessment 15-minute checks are completed at appropriate intervals, with Pt’s behavior documented in behavioral terms as it pertains to release criteria, times, dated, and initialed by staff?
92% 100% 96%
14. On Form #407 Seclusion & Restraint Monitoring and Assessment did each staff member that initialed 15-minute checks complete last page of form with signature and title?
100% 100% 100% 94% 100% 99%
15. Were debriefings DB1 & DB2 completed at appropriate times?
100% 94% 100% 100% 98%
16. Is patient debriefing in the chart? 100% 94% 89% 100% 100% 96%
61
QUALITY ASSURANCE & PERFORMANCE IMPROVEMENT
19. Was Form # 470 TX Focused Treatment Plan Review completed within 24 hours?
17% 96% 78% 92% 75% 85%
Overall Compliance 80% 92% 93% 97% 96% 94%
Data Analysis: Baseline data compiled August 2015 with updates to Seclusion and Restraint procedure, forms, and audit tool since that time.
4Q2018 showed an overall compliance rate for 18 seclusion events of 96%, a decrease of 1% from last quarter’s 97%.
Knox had 0 seclusion events during the quarter. Hamlin had 9 seclusion events during the quarter, with an overall compliance rate of 96%. Chamberlain had 9 seclusion events with an overall compliance rate of 82%.
Spot check was performed in April 2018 on the following element:o (#12) “On Form #407RN 2 Hour Seclusion and Restraint Breaks is time ended for S/R
completed and signed by RN?”This element continues to have compliance rate of 100%; will be evaluated by spot check in October 2018 to ensure ongoing compliance.
Spot check was performed in June 2018 on the following element:o (#15) “Were debriefings DB1 & DB2 completed at appropriate times?”
This element continues to have compliance rate of 100%; will be evaluated by spot check in December 2018 to ensure ongoing compliance.
Nursing documentation met the 100% goal for 4 consecutive months for the following elements. These elements will be evaluated by spot-check in 6 months to evaluate and ensure consistent and reliable documentation compliance.
o (#11) “On Form # 407RN 2 Hour Seclusion and Restraint Breaks 2-hour breaks are completed at appropriate intervals and signed by RN?”
o (#14) “On Form #407 Seclusion & Restraint Monitoring and Assessment did each staff member that initialed 15-minute checks complete last page of form with signature and title?”
o (#16) “Is patient debriefing in the chart?”
Nursing documentation met the 100% goal for 12 consecutive months for the following element. This question will be removed from reporting, however remain in auditing as numbers to monitor.
o (#13) “On Form #407 Seclusion & Restraint Monitoring and Assessment 15-minute checks are completed at appropriate intervals, with Pt’s behavior documented in behavioral terms as it pertains to release criteria, times, dated, and initialed by staff?”
62

QUALITY ASSURANCE & PERFORMANCE IMPROVEMENT
Knox Hamlin Chamberlain Overall0%
10%
20%
30%
40%
50%
60%
70%
80%
90%
100% 96%
82%89%
Seclusion Compliance by Unit4Q2018
% C
ompl
ianc
e
63

QUALITY ASSURANCE & PERFORMANCE IMPROVEMENT
Knox Hamlin Chamberlain Total0
2
4
6
8
10
12
14
16
18
20
9 9
18
Number of Seclusions by Unit 4Q2018
# of
Sec
lusio
ns
Action Plan: Nursing staff remains below goal and will continue to audit the documentation of patient seclusions monthly and re-evaluate quarterly. Nursing documentation will be extracted and separated from Medical Staff documentation. Nursing will compare data gathered from Meditech reporting to ensure all coercive events are captured. There is a possibility that prior to beginning this cross-check in 2015 that events were not captured for data collection. Checklists were created for each unit to follow to improve patient safety and nursing documentation.
64

QUALITY ASSURANCE & PERFORMANCE IMPROVEMENT
Outpatient & Forensic Services Robyn Fransen, LSW
I. Measure Name: Timeliness of Medical Record Documentation for Outpatient Services
Measure Description: All progress notes are promptly filed and readily available in the patient’s medical record. This information is necessary to monitor the patient’s condition and this and other necessary information must be in the patient’s medical record. In order for necessary information to be used it must be promptly filed and available in the medical record so that health care staff involved in the patient’s care can access/retrieve this information in order to monitor the patient’s condition and provide appropriate treatment and patient services.
Type of Measure: Performance Improvement
Results
Target Data elements BaselineFY2016
1Q2018
2Q2018
3Q 2018
4Q2018 YTD
90%
# of Notes 778 455 399 431 357 1642Psychiatric notes entered within 72 hours? 83% 81% 62% 70% 83% 74%
Nursing notes entered within 72 hours? 98% 97% 94% 87% 100% 95%
Social Work notes entered within 72 hours? 88% 91% 97% 92% 95% 94%
Psychology notes entered within 72 hours? 78% 96% 87% 69% 100% 88%
Overall Compliance 89% 93% 91% 84% 96% 91%
65

QUALITY ASSURANCE & PERFORMANCE IMPROVEMENT
1Q2018 2Q2018 3Q2018 4Q20180%
20%
40%
60%
80%
100%
Outpatient Medical Record Documentation
Psychiatric notes entered within 72 hoursNursing notes netered within 72 hoursSocial Work notes entered within 72 hoursPsychology notes entered within 72 hoursOverall
% C
ompl
ianc
e
Data Analysis: All data elements increased from 3Q2018 to 4Q2018 and Overall compliance increased from 84% to 96 %, which exceeds the goal of 90% overall compliance
Action Plan: Continue to audit notes monthly, remind staff of the policy for completing notes, and holding monthly meetings during which documentation will be an ongoing discussion. Concerns are forwarded to the appropriate supervisor so that they can be addressed individually as part of ongoing competency evaluations and will begin to track documentation by individual staff member to assist with this.
II. Measure Name: Timeliness of Initial and Annual Assessment Documentation for Outpatient Services
Measure Description: All initial and annual assessments (psychiatric, nursing, social work) are completed and filed in the patient’s medical record and in the electronic medical record within 30 days of the patient’s admission and annual date. This information is necessary to monitor the patient’s condition. It must be in the patient’s medical record. Health care staff involved in the patient’s care must be able to access/retrieve this information to monitor the patient’s condition and provide appropriate treatment and patient services; therefore, necessary information must be entered and available in the medical record promptly.
Type of Measure: Performance Improvement
66

QUALITY ASSURANCE & PERFORMANCE IMPROVEMENT
Results
Target Data elements BaselineFY2016
1Q 2018
2Q 2018
3Q 2018
4Q 2018 YTD
100%
# of Assessments 8 4 2 2 2 8Psychiatric assessment complete and entered within 30 days? 50% 67% 100% 50% 100% 79%
Nursing assessment complete and entered within 30 days? 88% 100% 100% 100% 100% 100%
Social Work assessment complete and entered within 30 days? 88% 50% 100% 100% 100% 88%
Overall Compliance 75% 70% 100% 83% 100% 89%
1Q2018 2Q2018 3Q2018 4Q20180%
20%
40%
60%
80%
100%
Outpatient Initial and Annual Assessment Documentation
Psychiatric assessment complete and entered within 30 days?Nursing assessment complete and entered within 30 days?Social Work/Dual Diagnosis assesment compelte and entered within 30 days?Overall Compliance
Data Analysis: There were 2 clients with annual assessments due and all were completed and signed within the 30-day time frame. Overall compliance increased from 83% for 3Q2018 to 100% for 4Q2018.
Action Plan: We will continue to audit all assessments monthly, flagging any upcoming or currently due assessments and setting weekly reminders on outlook to begin one month before annual date to remind staff of the upcoming due date. Will also complete weekly checks in Meditech when an annual is due to ensure that assessments are being entered successfully. This will remain a performance improvement measure until 100% compliance goal is met again for four consecutive quarters.
67

QUALITY ASSURANCE & PERFORMANCE IMPROVEMENT
III. Measure Name: Documentation of Supervision hours
Measure Description: Licensing for outpatient services requires minimum supervision to be licensed to provide services to our patients. The outpatient program manager will review the outpatient supervision log monthly to assess ongoing compliance with the requirement of minimum supervision/consultation of one-hour consultation/supervision per month for DDPC outpatient employees licensed to practice independently and 4 hours per month for those employees not licensed to practice independently.
Type of Measure: Quality Assurance
ResultsTarget Data elements Baseline
May-Sept2015
1Q2018
2Q2018
3Q2018
4Q2018 YTD
100% compliance
Social Work staff has received 4 hours of more of documented supervision per month? 100% 100% 100% 100% 100% 100%
Nursing Staff have received 1 hour or more of documented supervision per month? 100% 100% 100% 67% 100% 92%
Therapy Staff have received 1 hour or more of documented supervision per months? 100% 100% 100% 100% 100% 100%
Overall Compliance 100% 100% 100% 89% 100% 97%
1Q2018 2Q2018 3Q2018 4Q20180%
20%
40%
60%
80%
100%
Supervision Hours Documentation
Social Work staff has received 4 hours or more of documented supervision per monthNursing Staff have received 1 hour or more of documented supervision per monthTherapy Staff have received 1 hour or more of documented supervision per monthOverall Compliance
68

QUALITY ASSURANCE & PERFORMANCE IMPROVEMENT
Data Analysis: All data elements were at 100% for 4Q2018. Overall compliance rate for Outpatient services was 100% which meets the target goal.
Action Plan: In June of 2015 Outpatient Services began tracking supervision hours to determine whether the supervision process needed to be corrected due to a deficiency noted during the licensing survey. The goal was to have 100% compliance for four consecutive months with the supervision/consultation requirements stated in the DHHS, DLRS Mental Health Agency Licensing Standards SUP.2. and this goal was met. Due to the recent increase in outpatient staff and additional therapy services being offered supervision will be monitored as a quality assurance measure to ensure continued compliance. Staff have been notified of supervision requirements and this continues to be an agenda item at monthly staff meetings. If there continue to be deficiencies this will be moved to a performance improvement indicator.
IV. Measure Name: Timeliness of amendment of treatment plans to reflect changes in court orders
Measure Description: Any change in the court ordered privileges for a NCR outpatient need to be reflected within the treatment plan within a timely manner, seven days, to ensure that the court order is being followed. Updating the treatment plan makes staff aware of any new restrictions or privileges. If the treatment plan is not amended in a timely manner it could cause the patient or staff to violate those privileges which could affect the patient’s ability to obtain increased privileges, modified release, and ultimately release and discharge from the custody of the Commissioner.
Type of Measure: Performance Improvement
ResultsTarget Data elements 1Q2018 2Q2018 3Q2018 4Q2018 YTD
100%
Total # of new court orders? 0 0 0 0 0# Of treatment plan updates completed within 7 days? N/A N/A N/A N/A N/A
Overall Compliance N/A N/A N/A N/A N/A
Data Analysis: No new court orders in 4Q2018 for outpatient services. We will also include inpatient services if it is determined that we will follow this guideline in that setting as well.
Action Plan: Continue to monitor all new court orders and treatment plans for compliance.
69

QUALITY ASSURANCE & PERFORMANCE IMPROVEMENT
V. Measure Name: Timeliness of notification of receipt of court hearing notice.
Measure Description: Whenever a NCR patient petitions the court for a change in privileges, a court hearing notice is sent. When the notice is received by administration, the patient’s treatment team and the Director of Forensics need to be notified the same business day as there is required reports which are due within 10 days of receipt of notice of hearing. If notification is not received in a timely manner, then the Institutional report could be delayed which could delay State Forensic Services evaluation and could impact the court process.
Type of Measure: Performance Improvement
ResultsTarget Data elements 1Q2018 2Q2018 3Q2018 4Q2018 YTD
100%
Total # of notice of court hearing received? 1 1 0 3 5# Of notifications received by treatment team on the day the hearing notice was received?
1 0 0 0 1
Overall Compliance 100% 0% N/A 0% 20%
Data Analysis: There were four notices received for 4Q2018 and overall compliance was 0%, however three of the notices were not received through administration and were received by the patients directly. One hearing notice was received by administration but the team was not notified.
Action Plan: A process has been developed with the administrative secretary, with an identified list of teams to notify when a court hearing notice is received. Direct handoff of the original notice will also be given on the day of receipt to the unit ward clerk or outpatient services so the notification can be filed in the chart in a timely manner.
70

QUALITY ASSURANCE & PERFORMANCE IMPROVEMENT
Pharmacy Services Michael Migliore, RPh
I. Measure Name: Medication Management – Controlled Substance Loss Data
Measure Description: Daily and monthly comparison of Pyxis vs CII Safe Transaction Report.
Type of Measure: Quality Assurance
Unit Baseline 1Q2018 2Q2018 3Q2018 4Q2018 YTDTarget
Rx
FY20175.9/
month
0 0 0 0 0# of
discrepancies
4.66/month
10.67/month
2.66/month 16/month 8.5/month
Number of CS lost 0 0 0 0 0 0
Data Analysis: The average number of controlled substance discrepancies per month for 4Q2018 was 16. This figure represents the number of discrepancies that occurred and not the number of controlled substance doses lost. Discrepancies typically result from miscounts, all of which have been investigated and reconciled. The increase in monthly discrepancies for 4Q2018 was the result of a new package count size for a controlled substance that was ordered due to a drug shortage from the wholesaler.
Action Plan and Comments: Continue to remain vigilant and to educate staff on proper automated dispensing cabinet procedures to avoid the creation of discrepancies.
II. Measure Name: Fiscal Accountability
Measure Description: Tracking of Dispensed Discharged Prescriptions
Type of Measure: Quality Assurance
Unit Baseline 1Q2018 2Q2018 3Q2018 4Q2018 YTD
Target
All
FY2017 $383.87
for 35 /Rxs$10.97/Rx
0 0 0 0 0
Actual $4.44/3 Rxs $8.34/6 Rxs $88.03/15 Rxs N/A $100.81/
24 Rxs
$/Rx $1.48 $1.39 $5.87 N/A $4.20
Data Analysis: There were no discharge prescriptions dispensed during 4Q2018.
71

QUALITY ASSURANCE & PERFORMANCE IMPROVEMENT
Action Plan and Comments: The pharmacy department will continue to monitor and reduce discharge medication costs.
Comments: The Baseline quarterly cost figure for 2018 is $25.20 compared to $383.87 for 2017. The baseline cost of a prescription decreased to $1.05 per quarter for 2018 from $10.97 for 2017 and the 2018 baseline number of prescriptions is reported as 6 per quarter down from 35 per quarter in 2017.
III. Measure Name: Invalid Orders
Measure Description: Incomplete/Invalid Orders
Type of Measure: Performance Improvement
April-17May-17June-17July-17
August-17September-17
October-17November-17December-17
January-18February-18
March-18April-18May-18June-18
0 2 4 6 8 10 12 14 16 18
1013
411
01
714
8
415
3
173
Monthly Totals of Invalid/Incomplete Orders
Background: With a zero-tolerance policy for invalid orders, every prescribed order must contain the drug name, strength, administration route, dosing frequency, provider signature, order time and date, accurate allergy and adverse drug reaction information, and indication. Receiving an invalid order by the pharmacist requires documentation, copying and returning the invalid order to the prescriber for remediation as well as contacting and informing the unit of the invalid order.
72

QUALITY ASSURANCE & PERFORMANCE IMPROVEMENT
Data Analysis: For the 4Q2018, the total number of invalid orders reported were 28 or 9.33 per month. Missing indications once again topped the list. All providers were informed and the orders were filled in time for the medications to be dispensed per policy. Compared to the same quarter 2017, there has been a slight increase in reported invalid orders.
Action Plan: Tracking incomplete orders will continue until the implementation of electronic health records scheduled to be implemented in the upcoming year. The system will contain hard stops preventing providers to proceed to initiate an order that is not complete.
IV. Measure Name: Polyantipsychotic Therapy (PAPT) Therapy
Measure Description: The use of two or more antipsychotic medications is discouraged as current evidence suggests little to no added benefit with an increase in adverse effects when more than one antipsychotic is used. The Joint Commission Core (TJC) Measure HBIPS-5 requires that justification be provided when more than one antipsychotic is used. Three appropriate justifications are recognized: 1) Failure of three adequate monotherapy trials, 2) Plan to taper to monotherapy (cross taper) and 3) Augmentation of clozapine therapy. This measure aligns itself with the HBIPS-5 core measure and requires the attending psychiatrist to provide justification for using more than one antipsychotic. In addition to the justification, the clinical/pharmacological appropriateness is also evaluated.
Type of Measure: Performance Improvement
Results
% Of Census 1Q2018 2Q2018 3Q2018 4Q201
8 YTD
On 1 Antipsychotic 53 60 64 60 59
On 2 Antipsychotic 30 28 32 36 32
On >3 Antipsychotic 4 4 0 1 2
Results
% Of Census 1Q2018 2Q2018 3Q201
8 4Q2018 YTD
Failed 3> Monotherapy 33 45 30 22 33
Clozapine Augmentation 13 9 10 11 11
Tapering to Monotherapy 53 45 60 66 56
Results% Of Census 1Q201 2Q2018 3Q2018 4Q2018 YTD
73
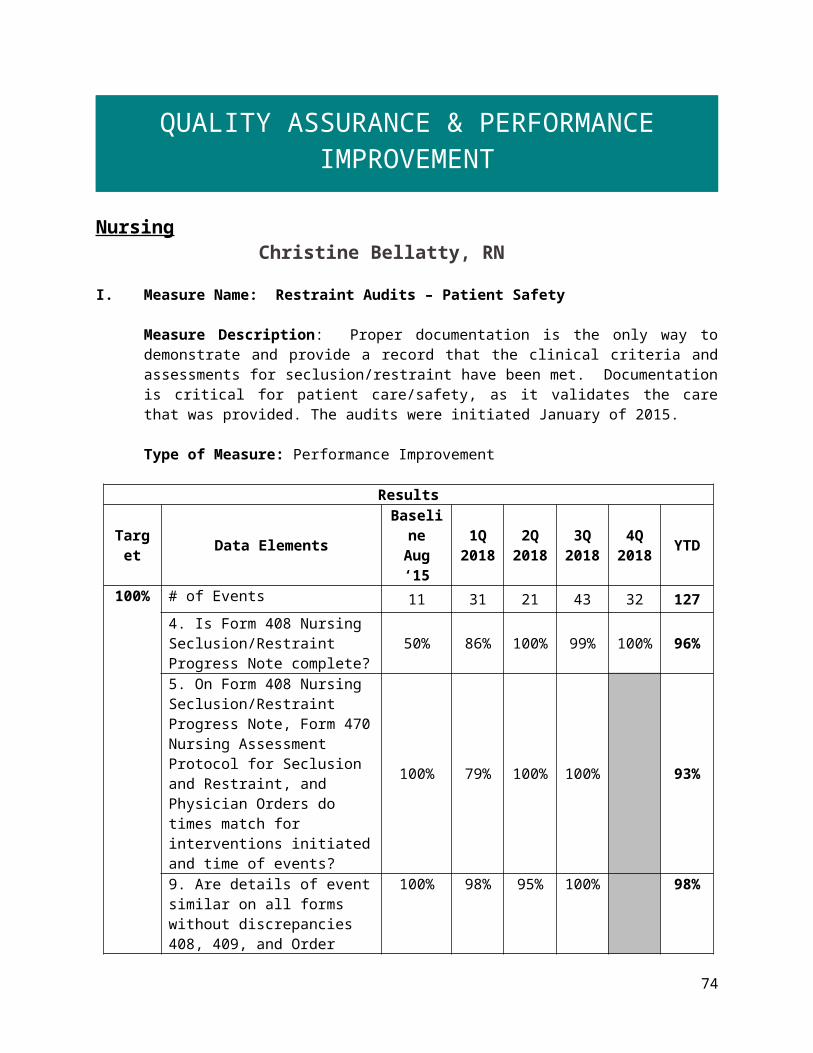
QUALITY ASSURANCE & PERFORMANCE IMPROVEMENT
8With Appropriate Justification 100 100 100 100 100
Without Appropriate Justification 0 0 0 0 0
Data Analysis: All medication profiles in the hospital are reviewed on admission and in each month of the quarter for antipsychotic medication orders. Attending psychiatrists are required to complete a Polyantipsychotic Therapy Justification Form when a patient is prescribed more than one antipsychotic.
Action Plan: Pharmacy will continue to monitor for and alert prescribers to provide appropriate justification for polyantipsychotic therapy.
V. Measure Name: Metabolic Monitoring
Measure Description: Metabolic syndrome is a well-known side effect of second generation antipsychotics (SGAs). The purpose of this monitor is to ensure that DDPC is appropriately monitoring therapy for those patients prescribed SGAs.
Type of Measure: Performance Improvement
ResultsUnit Baseline 1Q2018 2Q2018 3Q2018 4Q2018 YTD
Target Complete/ Up-to-date
Metabolic Parameters
N/A75% 75% 75% 75% 85%
Actual 66% 88% 96% 94% 94%
Data Analysis: The pharmacy collects data around specified parameters to monitor the metabolic status of all patients in the hospital who are receiving atypical antipsychotics during the quarter. Data elements collected are BMI (body mass index), blood pressure, fasting blood glucose, hemoglobin A1c, HDL cholesterol, and triglycerides.
Action Plan: We will monitor the stated parameters for metabolic syndrome in patients prescribed second generation/atypical antipsychotic therapy. The patient’s right to refuse assessment (weight, blood pressure and lab work) has been identified as a contributing factor to not being able to fully assess metabolic status. We will continue to work with the medical staff to identify patients whose metabolic profiles are incomplete/inconclusive, in order that we may more accurately monitor the population for the hallmark parameters.
Comments: In patients receiving antihypertensive medications, we conclude that the patient’s untreated blood pressure is greater than 130/85. In patients receiving insulin or oral/injectable
74

QUALITY ASSURANCE & PERFORMANCE IMPROVEMENT
antihyperglycemics, we conclude that the patient’s fasting blood glucose >110. In patients receiving statins or other cholesterol-modifying therapy we conclude dyslipidemia.Of the 13 patients who met the criteria for Metabolic Syndrome, twelve were continuing patients with varying lengths of hospitalization, and one was a new admission with no prior hospitalizations at DDPC.
4Q2018Patients with complete/up-to-date parameters 47/50Patients with incomplete/outdated parameters 3/50Patients who meet criteria for metabolic syndrome 13Patients who do not meet criteria for metabolic syndrome
37
Patients who cannot be classified at this time 5
VI. Measure Name: Veriform Medication Room Audits
Measure Description: Quarterly Completion by Unit Audits
Type of Measure: Quality Assurance
Results Unit Baseline 1Q2018 2Q2018 3Q2018 4Q2018 YTD
Target
All FY2017100%
100% 100% 100% 100% 100%
Actual 100% 100% 100% 100% 100%
Methodology: Monthly, the Pharmacy Department performs comprehensive inspections of medication rooms, central supply areas, and the medical clinic. Over 44 criteria are monitored in the audits utilizing Veriform software.
Data Analysis: The medication room audits have been concluded for 4Q2018 without completion deficiencies. Pharmacy continues to strive for audits that are 100% complete Action Plan: The Pharmacy Department will continue to send reminders early in the process to ensure that completion, compliance, verification and reporting is performed in a timely fashion.
Comments: Continuous monitoring of the medication room audits and approval by the responsible individuals has again provided satisfactory results for this quarter.
75

QUALITY ASSURANCE & PERFORMANCE IMPROVEMENT
VII. Measure Name: Medication Dispensing Process
Measure Unit Baseline 4Q2016 Goal 1Q2018 2Q2018 3Q2018 4Q2018
Controlled Substance Loss Data:Daily Pyxis-CII Safe Compare Report. All 0% Target:
Actual:0%0%
0%0%
0%0%
0%0%
Monthly CII Safe Vendor Receipt Report.
Rx 0 Target:Actual:
00
00
00
00
Monthly Pyxis Unresolved Controlled Drug Discrepancies.
All 0/month
Target:Actual:
014
(4.66/mo.)
032
(10.67/mo.)
08
(2.66/mo.)
016
(8.5/mo.)
Measures of drug reactions, adverse drug events and other management data.
Rx 1.25/year
Target:Actual:
00
00
00
010
Resource Documentation Reports of Clinical Interventions.
Rx 397/quarter
Target:Actual:
100%32
100%68
100%7
100%297
Psychiatric Emergency Process: Monthly audit of all psych emergencies measures against 8 criteria.
All 100% Target:Actual:
100%100%
100%100%
100%100%
100%100%
Operational Audit:Monthly audit of 8 operational indicators from CPS contract. *
Rx 100% Target:Actual:
100%88%
100%100%
100%100%
100%100%
* a corrective action plan was provided and initiated immediately
76

QUALITY ASSURANCE & PERFORMANCE IMPROVEMENT
Risk Management Heather Racine, RN, BSN
I. Measure Name: Allegations of Abuse, Neglect, and Exploitation
Measure Description: All patients have the right to be free from abuse, neglect or exploitation, as well as the fear of being abused, neglected or exploited. Allegations or information indicating that abuse, neglect, or exploitation may have occurred must be thoroughly and promptly investigated with appropriate follow-up action taken.
Type of Measure: Performance Improvement
Methodology: The numerator will be all allegations for the quarter that were found to be promptly investigated with appropriate follow-up action taken. The denominator will be all allegations for the quarter.
ResultsUnit Baseline 1Q2018 2Q2018 3Q2018 4Q2018 YTD
Target:100%
compliance with
allegation process
# of allegations per quarter
1Q2018100%14/14
100%14/14
100%14/14
87%27/31
73%11/15
89%66/74
Data Analysis: There were 15 allegations of abuse reported for 4Q2018. 11 of the allegations for 4Q2018 were promptly reported and all 15 were thoroughly investigated with appropriate follow-up action taken. The compliance rate is 73%.
For 4Q2018, there were two allegations that were not promptly reported due to the patient reporting them in a grievance.
For 3Q2018, there were a few delays in reporting four of these allegations due to receiving the allegation via interoffice mail, the allegation being reported by the patient in a grievance, and there was a delay on two of these allegations due to the Risk Manager, expectantly, being out.
Action Plan: Will continue to thoroughly and promptly investigate all allegations of abuse, neglect, and exploitation and follow-up with appropriate action. Education has been provided to staff to not send incidence reports via interoffice mail. Education has also been provided to staff about completing an incident report when allegations are made in grievances.
77

QUALITY ASSURANCE & PERFORMANCE IMPROVEMENT
Jul Aug Sep Oct Nov Dec Jan Feb Mar Apr May Jun0
2
4
6
8
10
12
14
FY2018 Allegations of Abuse, Neglect, and Exploitation Reporting
# o
f Alle
gati
ons
1Q 2Q 3Q 4Q0
5
10
15
20
25
30
35
FY2018 Quarterly Compliance with Reporting Alle-gations of Abuse, Neglect, and Exploitation
# of
Alle
gati
ons
II. Measure Name: Incident Reports
Measure Description: As a learning organization DDPC realize that every patient safety event (from minor events to events that cause major harm to patients) must be reported. When patient safety events are continuously reported, experts within DDPC can define the problem, identify solutions, achieve sustainable results, and disseminate the changes or lessons learned to the rest of the hospital. As a learning organization, DDPC provides staff with information
78

QUALITY ASSURANCE & PERFORMANCE IMPROVEMENT
regarding improvements based on reported concerns and this helps foster trust that encourages further reporting.
Type of Measure: Quality Assurance
Methodology: All patient safety events for the quarter that were not reported via an incident report. Monitoring for unreported patient safety events will occur via morning report, Superintendent Dashboard, and rounds.
ResultsUnit Baseline 1Q2018 2Q2018 3Q2018 4Q2018 YTD
Target:100%
compliance
# of incident reports not
reported per quarter
1Q20187 7 0 7 3 17
Data Analysis: There were three incidences that were not reported via an incident report for 4Q2018.
Action Plan: We will continue to monitor for unreported patient safety events.
Jul Aug Sep Oct Nov Dec Jan Feb Mar Apr May Jun
3
2 2
0 0 0
5
2
0
1
2
0
Number of Incidences Not ReportedFY2018
79

QUALITY ASSURANCE & PERFORMANCE IMPROVEMENT
Social Services Tammy Cooper, LCSW
I. Measure Name: 30 Day Readmissions Modified Root Cause Analyses
Measure Description: Once the hospital has identified potentially preventable readmissions, it is expected to conduct an in-depth review of the discharge planning process for a sample of such readmission (at least 10% of potentially preventable readmissions, or 15 cases/quarter, whichever is larger is suggested but not required), in order to determine whether there was an appropriate discharge planning evaluation, discharge plan, and implementation of the discharge plan. Having identified factors that contribute to preventable readmissions, hospitals are expected to revise their discharge planning and related processes to address these factors.
Type of Measure: Quality Assurance
Data Analysis: There was one 30 day readmission in 4Q2018. The readmission was in the month of April. This readmission was do to a patients inability to be seen by a medication management provider in a timely manner and prior to discharge a referral for therapy should have been part of the discharge plan.
Action Plan: Continue to assess all 30-day readmissions. When there is a 30-day readmission complete a Modified Root Cause Analysis within 45 days and report out findings.
II. Measure Name: Grievance Compliance and Documentation
Measure Description: Addressing grievances in a timely manner allows potential rights violations to be resolved quickly therefore allowing patients and staff to continue to focus on treatment. A Nurse Supervisor must speak with the patient within four hours of notification of the grievance. Social Services must deliver a response to the patient within five days, with five days more if the grievant is notified, and with agreement of the Patient Advocate.
80
Results
Target Data elements Baseline4Q2016
1Q2018
2Q2018
3Q2018
4Q2018 YTD
Readmissions within 30 days of discharge 2 2 1 0 1 4
Progressive Treatment Plan (PTP) readmissions within 30 days 1 2 1 0 1 4
45-day root cause analyses due within the quarter 2 2 1 0 1 4
100%Compliance with completion of a 45-day modified root cause analysis for all 30-day readmissions
100% 100% 100% N/A 100% 100%

QUALITY ASSURANCE & PERFORMANCE IMPROVEMENT
Measure Type: Performance ImprovementResults
Target Data elements BaselineFY2016
1Q2018
2Q2018
3Q2018
4Q2018 YTD
100%
# of Events 46 51 9 95 63 218Unit Staff compliant with addressing grievance? 89% 86% 89% 95% 90% 90%
Unit Staff completed form correctly (boxes checked, dated/timed, all signatures completed, Nurse Supervisor notified)?
63% 73% 11% 46% 62% 48%
*Nursing Supervisor compliant with addressing grievance within 4 hours? 86% 84% 89% 78% 68% 80%
Nurse Supervisor completed form correctly (boxes checked, dated/timed, all signatures completed, forwarded to Social Worker)?
61% 88% 89% 78% 56% 78%
*Social Worker compliant with addressing grievance within 5 days or within 5 more days if extension is requested?
100% 94% 100% 83% 100% 94%
*Overall Compliance of Nursing Supervisor and Social Worker addressing grievance
80% 89% 94% 83% 84% 88%
81

QUALITY ASSURANCE & PERFORMANCE IMPROVEMENT
1Q2018 2Q2018 3Q2018 4Q20180
10
20
30
40
50
60
70
80
90
100
Grievance Compliance & Documentation
Element 1Element 2Element 3Element 4Element 5Element 6
% Co
mpl
iance
Element 1: Unit Staff compliant with addressing grievance Element 2: Unit Staff completed form correctly and notified Nurse Supervisor Element 3: Nurse Supervisor addressed grievance within four hours Element 4: Nurse Supervisor completed form correctly and forwarded to Social Worker Element 5: Social Worker addressed grievance within five days or more than five days if extension is
requested Element 6: Overall Compliance of Nursing Supervisor and Social Worker Addressing Grievance
Data Analysis: Data elements for Unit Staff completing form correctly and for Social worker addressing grievance within 5 days increased from 3Q2018 to 4Q2018. All other data elements decreased from 3Q2018. Overall Compliance for Nursing Supervisor and Social Worker addressing grievance increased from 83% to 84% but remains below the goal of 100%. The area of the most concern is grievances not being addressed by Nurse Supervisors with in the 4-hour time frame, however, there has been a significant increase in the number of grievances over the past year which could be attributing to the overall compliance decreasing as there are significantly more to respond to within the time frames given. Action Plan: Will explore offering a refresher training by patient advocate and grievance responder. Continue to provide feedback to Director of Nursing and supervisors when forms are not completed correctly.
82

QUALITY ASSURANCE & PERFORMANCE IMPROVEMENT
Staff Education and Development Kendra Davis, RN, BSN
I. Measure Name: Mandatory Staff Education
Measure Description: Both direct and non-direct care employees of Dorothea Dix Psychiatric Center are required to complete monthly mandatory staff education. The Staff Education Department will conduct monthly audits using the education database.
Type of Measure: Performance Improvement
Methodology: The numerator will be the number of learning packets sent out and the denominator will be the number of learning packets completed on time. The goal is for 100% compliance of learning packets completed by staff education year end, December 31 st of each year.
# of Learning Packets Sent
# of Learning Packets Completed on Time
% Compliance YTD
Jan-17 444 444 100%Feb-17 666 666 100%Mar-17 888 888 100%Apr-17 818 817 100%May-17 766 766 100%Jun-17 673 673 100%Jul-17 222 222 100%
Aug-17 222 222 100%Sep-17 100 100 100%Oct-17 0 0 -Nov-17 0 0 -Dec-17 220 194 88%Jan-18 207 177 86%Feb-18 642 477 74%Mar-18 735 586 80%Apr-18 618 432 70%May-18 731 475 65%Jun-18 900 768 85%
YTD 8852 7907 89%
Data Analysis: For staff education 4Q2018, 74% of education learning packets were completed on time which falls below the 100% goal.
83

QUALITY ASSURANCE & PERFORMANCE IMPROVEMENT
Jan-17
Feb-17
Mar-17
Apr-17
May-17
Jun-17
Jul-17
Aug-17
Sep-17
Oct-17
Nov-17
Dec-17
Jan-18
Feb-18
Mar-18
Apr-18
May-18
Jun-18
YTD0%
10%
20%
30%
40%
50%
60%
70%
80%
90%
100%
Mandatory Staff Education Compliance
% Compliance YTD
Action Plan: Staff Education will complete monthly audits, send monthly e-mails to staff that have not completed their learning packets, send a notice to supervisors by the 3Q of the calendar year to address their staff that are out of compliance, and alert the superintendent of employees out of compliance.
II. Measure Name: RN/MHW Additional Continuing Education
Measure Description: Both Registered Nurses and Mental Health Workers are required to have additional continuing education specific to their discipline.
Type of Measure: Performance Improvement
Methodology: The numerator will be the number of RN/MHW’s that completed their additional continuing education requirements for the quarter and the denominator will be the total number of RN/MHW’s for the quarter. The goal is for 100% compliance by the staff education year end, December 31st of each year.
Data Analysis: None completed this quarter.
84

QUALITY ASSURANCE & PERFORMANCE IMPROVEMENT
III. Measure Name: Direct Care Staff Skills Fair
Measure Description: All direct care staff members are required to attend Staff Education’s Skills Fair.
Type of Measure: Performance Improvement
Methodology: The numerator will be the number of RN/MHW’s that attended the Direct Care Staff Skills Fair for the quarter and the denominator will be the total number of RN/MHW’s for the quarter. The goal is to have 100% compliance of Skills Fair attendance by the Staff Education year end, December 31st of each year.
Data Analysis: None completed this quarter.
85

QUALITY ASSURANCE & PERFORMANCE IMPROVEMENT
Therapeutic Services Lisa J. Hall, OTR/L
I. Measure Name: Provider Direct Patient Contact
Measure Description: To receive effective treatment that will allow patients to return to a satisfying and meaningful life in their chosen community, staff must provide engagement, assessment and treatment that is targeted to meet their individual needs. Staff are expected to spend at least 50% of their available time interacting with patients.Numerator: number of hours spent in direct contact with patientsDenominator: number of hours available to spend in direct contact with patients
Type of Measure: Quality Assurance
ResultsUnit Baseline 1Q2018 2Q2018 3Q2018 4Q2018 YTD
Target Percent of staff
meeting expectation
Avg. FY2017
70%
90% 90% 90% 90% 90%
Actual 94%17/18
82%14/17
71%12/17
89%16/18
84%59/70
Data Analysis: Out of eight staff members who submitted direct care stats, six met or exceeded the department goal of 50%. Ten staff members have previously met the goal for four consecutive months and are not required to submit stats until 1Q2019. One staff member is on maternity leave and only two staff members have yet to reach the goal.
Action Plan: Continue with monthly monitoring for staff who have not met the department goal for four consecutive months. Performance issues will be addressed on an individual basis. This measure will be used as a supervisory tool and no longer reported externally.
II. Measure Name: Timely Assessment / Improving Health Outcomes
Measure Description: To receive effective treatment that will allow patients to return to a satisfying and meaningful life in their chosen community; staff must provide engagement, assessment and treatment that is targeted to meet their individual needs. The formal beginning to a treatment relationship begins with an assessment of strengths and needs to guide the treatment plan. At each treatment plan meeting staff is expected to come prepared to share their area of expertise and propose what treatment offerings they will make available to the patient. To best guide treatment, discipline specific assessments must be complete and available in the patient record.
Type of Measure: Performance Improvement
86

QUALITY ASSURANCE & PERFORMANCE IMPROVEMENT
Occupational Therapy (10d)
Psychology (30d) Recreational Therapy (10d)
Substance Abuse (10d)0
5
10
15
20
25
0%
10%
20%
30%
40%
50%
60%
70%
80%
90%
100%
Timeliness of Evaluations: 4Q2018
# of
Ord
ers
Data Analysis: All disciplines fell below the 90% target.
Action Plan: Address performance issues with individual staff and fill vacant positions. Update evaluation documentation policy to clarify expectations.
A. Substance Abuse Assessment
Goal: Substance abuse assessment completed within seven calendar days of the referral.
Numerator – Substance abuse assessments completed within seven days of referral.Denominator – All substance abuse assessment referrals received.
ResultsUnit Baseline 1Q2018 2Q2018 3Q2018 4Q2018 YTD
Target Percent of assessments
completed on time
Avg. FY2017
65%
90% 90% 90% 90% 90%
Actual 33%3/9
56%5/9
33%2/6
56%5/9
45%15/33
87

QUALITY ASSURANCE & PERFORMANCE IMPROVEMENT
B. Psychology – Issue Specific Evaluation
Goal: Psychological evaluations completed within 30 days of referral.
Numerator – Psychological evaluations completed within 30 days of referral.Denominator – All psychological evaluations received.
ResultsUnit Baseline 1Q2018 2Q2018 3Q2018 4Q2018 YTD
Target Percent of assessments
completed on time.
42%(Avg.)
FY2017
90% N/A 90% 90% 90%
Actual 100%3/3 N/A 100%
1/157%4/7
73%8/11
C. Occupational Therapy Goal: Occupational therapy, issue-specific and living skill evaluations will be completed within ten days of referral.Numerator – Occupational therapy evaluations completed within ten days of referral.Denominator – All occupational therapy evaluations received.
ResultsUnit Baseline 1Q2018 2Q2018 3Q2018 4Q2018 YTD
Target Percent of assessments
completed on time
77%(Avg.)
4Q2018
N/A N/A N/A 90% 90%
Actual N/A N/A N/A 77%17/22
77%17/22
D. Recreational Therapy Goal: Recreational therapy evaluations will be completed within ten days of referral.Numerator – Recreational therapy evaluations completed within ten days.Denominator – All recreational therapy evaluations received.
ResultsUnit Baseline 1Q2018 2Q2018 3Q2018 4Q2018 YTD
TargetPercent of
assessments completed on
time
0%(Avg.)
4Q2018N/A N/A N/A 90% 90%
N/A N/A N/A 0% 0%
88

QUALITY ASSURANCE & PERFORMANCE IMPROVEMENT
Actual 0/1 0/1
E. DietaryGoal: Dietary evaluations will be completed within ten days of referral.Numerator – Dietary evaluations completed within ten days.Denominator – All dietary evaluations received.
ResultsUnit Baseline 1Q2018 2Q1028 3Q2018 4Q2018 YTD
Target Percent of assessments
completed on time
0%(Avg.)
4Q2018
N/A N/A N/A 90% 90%
Actual N/A N/A N/A 0%0/0
0%0/0
III. Measure Name: Provision of Therapeutic Services
Measure Description: To receive active treatment at a frequency and intensity to provide efficient treatment and discharge planning, the goal is for 75% of the patient population to engage in 14 hours of active treatment provided by the therapeutic services department each week. Of the 24 charts audited each month (72 per quarter), the goal is for 75% of the charts audited to reflect at least 14 hours of therapeutic services per week. The hours of treatment, per patient, will be rounded to the nearest whole number. Numerator – Number of charts containing 14 or more hours of documented treatment by therapeutic services personnel.Denominator – Total number of charts audited.
Type of Measure: Performance Improvement
ResultsUnit Baseline 1Q201
82Q2018 3Q201
84Q2018 YTD
Target 14 hours of documented
treatment per chart
25%45% 55% 65% 75% 45%
Actual 14%10/72
7%5/72
6%4/72
13%9/72
10%28/288
89

QUALITY ASSURANCE & PERFORMANCE IMPROVEMENT
<=4 >=5 <=9
>=10 < 14>=14 <=19
>=20
05
101520253035
Treatment Hours: Q1Treatment Hours: Q2
Treatment Hours: Q3Treatment Hours: Q4
Hourly Treatment Distribution: FY2018
Treatment Hours: Q1 Treatment Hours: Q2 Treatment Hours: Q3 Treatment Hours: Q4
Treatment hours per patient
# of
cha
rts
Data Analysis: Nine out of seventy-two patient charts audited contained documented treatment provided by Therapeutic Service that met or exceeded 14 hours in a week. This is more than double the number of charts that met the goal over the previous quarter but is still well below the set goal for the quarter (75%) and the established baseline (25%).
Action Plan: July 2018 – revised group schedule. Continued use of documentation log and group enrollment database. Two additional staff members began orientation.
90