psychology2logs.files.wordpress.com… · web view · 2018-02-041.3 data recording, analysis and...
TRANSCRIPT

1.3 DATA RECORDING, ANALYSIS AND PRESENTATION
INFERENTIAL STATISTICS
INFERENTIAL STATISTICS CHECKLIST
CONTENT: HIGHLIGHT THE FOLLOWING TO ILLUSTRATE YOUR UNDERSTANDING
SYMBOLS =, <, <<, >>,>
NORMAL DISTRIBUTION CURVES
SKEWED DISTRIBUTION CURVES
SIGNIFICANCE LEVELS
PROBABILITY
CRITERIA AND USE OF PARAMETRIC TEST
CRITERIA AND USE OF SPECIFIC NON PARAMETRIC INFERENTIAL
TEST (MANN-WHITNEY U TEST,
WILLCOXON SIGNED RANKS TEST,
CHI SQUARE,
BINOMIAL SIGN TEST,
SPEARMANS RHO)
TYPE 1 ERROR
TYPE 2 ERROR
1

KEY SYMBOLS:
= equal to
/= not equal to
> greater than
>> much greater than
< less than
<< much less than
KEY TERMS:
Observed value
The number produced after the various steps and calculations for a statistical test
have been carried out. Basically, the final result/number
Critical value
A value taken from a statistical test table, which must be reached in order for results
to be significant. In Psychology, it is typically <0.05
Ranks
Order the data
DISTRIBUTION CURVES
Distribution curves are used to display the data gathered from a research study.
There are three types of distribution curves:
2

Skewed positive Normally distributed Skewed negative
1. NORMAL DISTRIBUTION CURVE
- The mode, median and mean are together in the centre
- The proportion of scores falling on either side of the centre is the same - 50% of the
scores to the left of the centre and 50% of the scores to the right (symmetrical)
-
Example: A researcher was looking at the time it took Charlotte and Rachel’s participant sample to complete a test. The mean time is 15 minutes, and the standard deviation is 2 minutes. Looking at the first image below, this shows that 68% of participants (-1 +1) have scores between 13 minutes and 17 minutes [2 minutes (SD) above and below 15 (MEAN)].
When we are looking at normal distributions, 95% of the data lie within the first two standard deviations of the mean. And so, if we look at -2 and +2 on the graph below, we can say 95% of the participants completed their test within 11 minutes and 19 minutes (2 standard deviations of the mean).
Like any data set, there will be extreme scores. In normally distributed graphs, these are displayed in the ‘tail’ to the right of two standard deviations. These are half of the remaining 5%. So 2.5% each side. These individuals may have completed the test extremely slow or extremely fast.
3

2. SKEWED DISTRIBUTIONS
In normal distribution curves, all measures of central tendency lie together in the middle. However, in skewed distributions this is not the case. There is a greater spread of scores on one side (See images on page 1).
COMPLETE ACTIVITY 1 ON YOUR A3 SHEET
Hypotheses in inferential statistics
Inferential statistics tell us whether what we have found is likely to be found by anyone else doing similar research. In other words, inferential statistics answer the following questions; What is the probability of us getting our results by chance? Or, have we got our results because there is a relationship or correlation between the IV and the DV?
In statistical testing we aim to reject our null hypothesis. This is what we do when we can show that it is unlikely what we have found is due to chance. If this is the case, we would say our results are significant and reject our null hypothesis. We would also accept our alternative hypothesis. Whereas, if it is likely we got the results by chance, we would accept our null hypothesis, stating the results we received are non-significant, and due to chance
SIGNIFICANCE LEVELS
How do we know if the results are significant or non-significant?
Ideally, psychologists want to be 100% sure that the IV has affected the DV. However, this is rarely case and so, the most ocmmon level of significance used by psychologists is 95%. This would mean, there is a 95% certainty that the IV has affected the DV
For example: If I conducted a study that investigated the effects of a crowd on sporting performance, I would have two scores: one for a sporting performance with no crowd and one with a crowd. Let’s imagine that each participant took ten free throws in basketball.
If the mean score (out of ten free throws taken) for no crowd was 8, and for crowd it was 5, we can say that there is a difference between the groups.
Using an inferential statistics test tells us whether the gap is large enough to say that the IV (crowd or no crowd) has affected the results and that the results were not due to chance.
If the stats test says I have a significant result then I can be 95 per cent sure that crowds have an effect on sports performance.
P Values
P = probability of the results being due to chance
< = is less than
0.05 = 5%
P<0.05 ‘The probability of getting this result by chance is less than 5 times in one hundred’ This is your ‘level of significance’
COMPLETE ACTIVITY 2 A, B AND C ON YOUR A3 SHEET
4

5

PROBABILITY
What is probability?
Probability is the measure of how likely an event is to occur out of the number of possible outcomes. In Psychology, we use probability because we want to know what the chances of changes in the DV occurring are, to ensure the IV really did cause a change in the DV.
Calculating probabilities can seem tricky at first, but once you learn the simple formula, you’ll be able to do it easily.
How to calculate probability
Step 1: Define your events and outcomes
Probability is the likelihood of one or more events, divided by the number of possible outcomes.
Example 1: What is the likelihood of choosing a day that falls on the weekend when randomly picking a day of the week?
Event>> Picking Saturday or Sunday
Number of outcomes>> 7 (days of the week)
Example 2: A jar contains 4 blue marbles, 5 red marbles and 11 white marbles. If a marble is drawn from the jar at random, what is the probability that this marble is red?
Event>> Picking a red
Number of outcomes>> 20
Step 2: Divide the number of events by the number of possible outcomes
This will give us the probability of a single event occurring.
Example 1: 2 (days) divided by 7 (days)
2/7 = 28.5%
Example 2: five (marbles) out of 20 (marbles)
5/20 = 25%
6

COMPLETE THE FOLLOWING QUESTIONS
1) Tossing the coin
a) If you toss a coin, what is the probability of landing on the tails
side of the coin? Explain why.
b) After the coin lands on tails five times in a row, what is the
probability of getting a tail on the sixth throw? Explain why.
7

2) Rolling a dice
a) What is the probability of rolling a 6? Explain why.
b) What is the probability of rolling either a 2 or a 3? Explain
why.
c) What is the probability of rolling an odd number? Explain
why.
8

3) Choosing a card from a pack of cards
a) From a pack of 52 cards, what are the chances of picking
a heart? Explain why.
b) What is the probability of choosing the queen of hearts?
Explain why.
c) What is the probability of a choosing a red card? Explain
why.
9

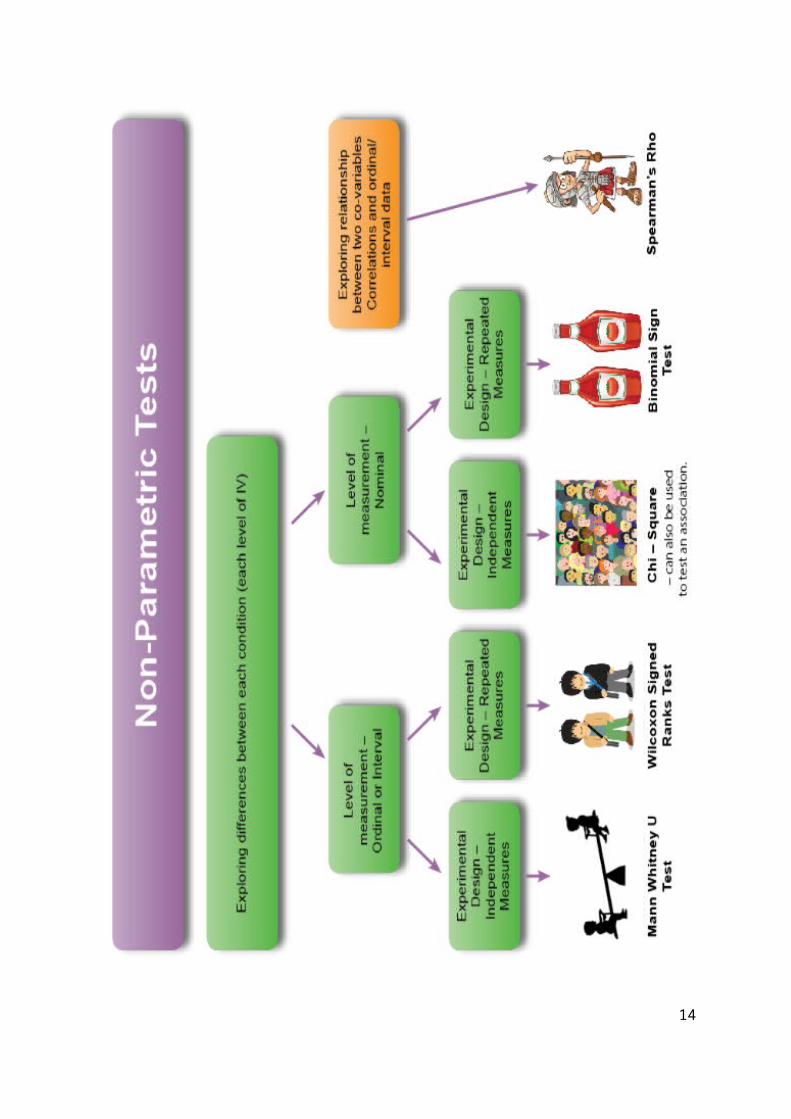
Selecting which inferential statistics to use
There are two types of tests you can select from:
If you have a distribution graph which is not normal. There are a range of non-parametric tests to use. Often, it can be confusing when to use each test. However, aspects to bear in mind when choosing the appropriate non-parametric test are:
1) Type of Data –do the findings from the study use nominal, ordinal or interval data?
2) Experimental Design – have you used independent measures or repeated
measures design?
3) Differences in conditions – are you exploring differences in performance, test
scores, between two conditions in your experimental study?
4) Are you looking for a relationship (or correlation) between the co-variables?
Type of data Independent measures
Repeated measures Correlation
Nominal Chi Squared test Binominal Sign Test N/AOrdinal Mann Whitney U Test Wilcoxon T Signed
Ranks TestSpearman’s Rho Correlation Coefficient
Interval Ratio These require parametric data (interval/ratio, data has to have curve of normal distribution, similar variance). For A level Psychology we treat interval ratio as ordinal so use the same tests as ordinal
10
NON-PARAMETRIC TEST
Does not assume the population is normally
distributed
Are used when distributions are non-normal
PARAMETRIC TEST
Assume that the source population is normally distributed
TYPES OF PARAMETRIC TESTS:
t-test
TYPES OF NON-PARAMETRIC TESTS
Mann Whitney U
Wilcoxon Signed Ranks
Chi-Square
Binomial Sign
Spearmans Rho

11

Psychology A Level 2018
NOTE: for Wilcoxon Signed Ranks Test, Level of significance is t NOT w

USING STATISTICAL TESTS
Read over the following scenarios. Using your inferential statistics check list, identify which statistical test should be used.
You should then identify three reasons why you have chosen this test. You must contextualise your answers (refer to the words in the scenario provided).S
Scenario 1:
A psychology teacher wanted to compare the effectiveness of two A Level textbooks in making psychology easy and fun to study.
The teacher decided to conduct research with students on the course to decide which new books to choose. On a piece of paper, students had to rate (out of 10, with 10 being “We love this textbook – BUY BUY BUY”) the overall likelihood of choosing the student-centred psychology textbook. Out of 12 participants, 6 of the participants gave ratings for one of the textbooks (Textbook A), and the other 6 participants gave ratings for the other textbook (Textbook B).
Scenario 2:
Psychologists were interested in knowing whether a group of students’ abilities to memorise words was because of the ear that they used to hear the words during listening tasks. In order to investigate this, participants were individually presented with an audio recording of a list of words. These were randomly presented to the left or right ear. Participants gave two sets of scores – words remembered correctly from the left ear and words remember correctly from the right ear.
When the mean and standard deviation were calculated, it was found that the data was positively skewed which suggested that the data was not normally distributed. As a result, a Wilcoxon’s was used to examine the difference between each ear and to see if the difference did not occur by chance.

Scenario 3:
On a recent trip to London, a research psychologist could not help but notice the number of people walking in streets with earphones. Surprised by this one afternoon, the research psychologist decided to conduct an observation. She observed the number of people with earphones in their ears and to see if there was a difference in the frequency between male and females.
Scenario 4:
Two students wanted to examine whether their peers would be willing to share their French fries when in the school refectory. The two students wanted to know if a celebrity was sitting on their table or if students from another school were sitting on their table, would their peers be willing to share their French Fries. They hypothesised that students would be more likely to share with a celebrity.
Scenario 5:

Fifteen students in a Psychology undergraduate course, where asked how long they have had their Social Media profile and were asked to rate, on a 5-point scale from 1= not at all to 5 =, their beliefs about whether Facebook is an effective social media tool to connect with their friends.
TYPES OF ERROR:
Type 1 error
Type 2 error
When using parametric tests type ___ error is more likely to occur.

Revision and RecapTask 1: Novel Situation
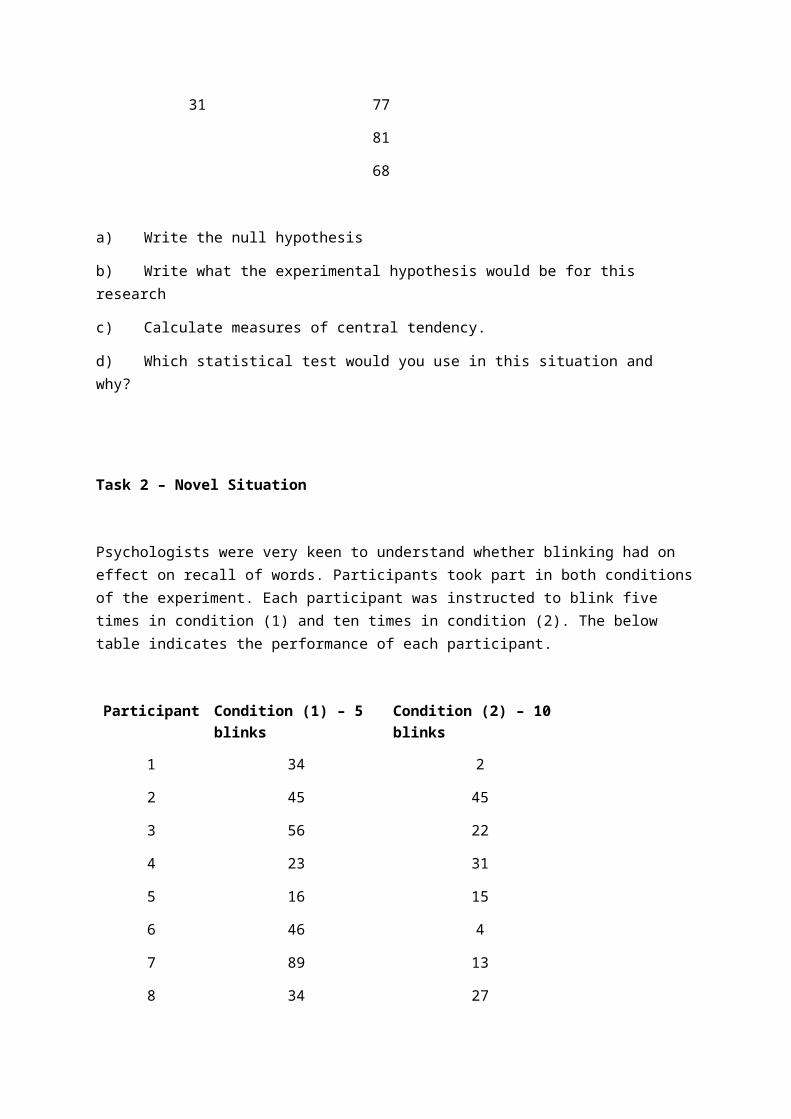
Children’s tendency to stereotype according to traditional gender roles was observed. They were asked questions about several stories. It was assumed by the researchers that children whose mothers had a traditional role would be more likely to produce stereotyping than those whose mothers had a full time job. The maximum score was 100, indicating extreme stereotyping. Two groups were used: one with mothers who had full time paid employment and one whose mothers did not work outside the home.
Mothers had full time job Mothers with no job
17 19
32 63
39 78
27 29
58 35
25 59
31 77
81
68
a) Write the null hypothesis
b) Write what the experimental hypothesis would be for this research
c) Calculate measures of central tendency.
d) Which statistical test would you use in this situation and why?
Task 2 – Novel Situation
Psychologists were very keen to understand whether blinking had on effect on recall of words. Participants took part in both conditions of the experiment. Each participant was instructed to blink five times in condition (1) and ten times in condition (2). The below table indicates the performance of each participant.
Participant Condition (1) – 5 blinks Condition (2) – 10 blinks

1 34 2
2 45 45
3 56 22
4 23 31
5 16 15
6 46 4
7 89 13
8 34 27
9 58 30
10 76 21
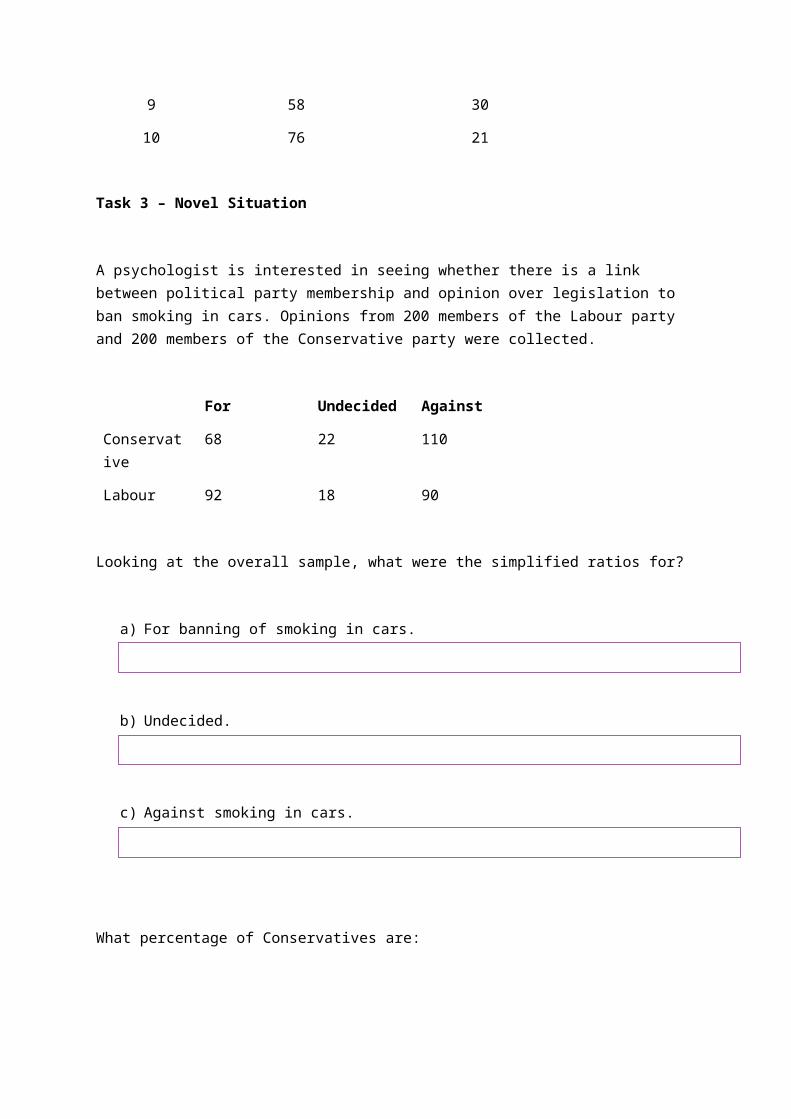
Task 3 – Novel Situation
A psychologist is interested in seeing whether there is a link between political party membership and opinion over legislation to ban smoking in cars. Opinions from 200 members of the Labour party and 200 members of the Conservative party were collected.
For Undecided Against
Conservative 68 22 110
Labour 92 18 90
Looking at the overall sample, what were the simplified ratios for?
a) For banning of smoking in cars.
b) Undecided.
c) Against smoking in cars.

What percentage of Conservatives are:
a) For banning of smoking in cars.
b) Undecided
c) Against smoking in cars.
What is the ratio of Labour supporters who are?
a) For banning of smoking in cars.
b) Undecided.
c) Against smoking in cars.
What is the null hypothesis for this psychological research?
What is the experimental hypothesis?
Give details of the statistical test you would conduct.

Task 4
Use the box below to choose two behavioural topics to link to design an experiment (choose 1 behaviour from column one and 1 impact on individuals from column 2).
Behaviour Participants Location
Eating sweets Friends and non-friends School playground
Playing games on phone Celebrities and non-celebrities Shopping centre
Lending money Crocodiles and Chickens Canteen
Memorising telephone numbers
Robots and Humans Library
Learning tongue twisters Superheroes and non-superheroes
Concert hall
a) Create an experimental and null hypothesisFor example; more sweets will be shared with friends than with other people in the school playground.
b) Imagine participants are in the specified role, for example, super heroes and non-superheroes. Would they be willing to share sweets?

c) Collect data which should be in the form of the value of yes or no. Decide which value will be assigned positive or negative numbers.
d) Which statistical test would you conduct?
e) Create a table and calculate the observed value.
Task 5 Recently, there has been research to indicate that the number of years people have been watching TV determines whether they will become richer.
a) Identify the null hypothesis.
b) Create a 5 point rating scale of values from 1=disagree to 5 =agree.
c) Select 10 participants.
d) Collate data on years participants have been watching TV and their ratings.
e) Create a table of raw data.
f) Which statistical test would you conduct and why?
g) Find the critical value of the data collected.
h) Is your study significant or not significant? Explain your answer.

Task 6
What do you remember?
a) Which test is used when predicting a difference for an independent measures design with ordinal/interval data?
b) What is the difference between Mann-Whitney and Wilcoxon tests?
c) Which two tests are used for nominal data?
d) How is Spearman’s different to the other tests?
e) Where is a critical value found? Which two factors must be considered when choosing the correct value?
f) In which tests must the observed value be greater than the critical value in order for results to be significant?
g) How do we calculate degrees of freedom and why do we need to know them?