webinar: defects: pay me now and pay me later
TRANSCRIPT

ITMPI005
1
Webinar: Defects: Pay Me Now and Pay Me Later
June 28, 2012
Time
Please note: The audio portion of this webinar is only accessible through the telephone dial-in number
that you received in your registration confirmation email.
Your logo here

2
Joseph Schofield Independent Consultant, President of the International
Function Point Users Group
Michael Milutis Director of Marketing
Computer Aid, Inc. (CAI)
Your logo here
3
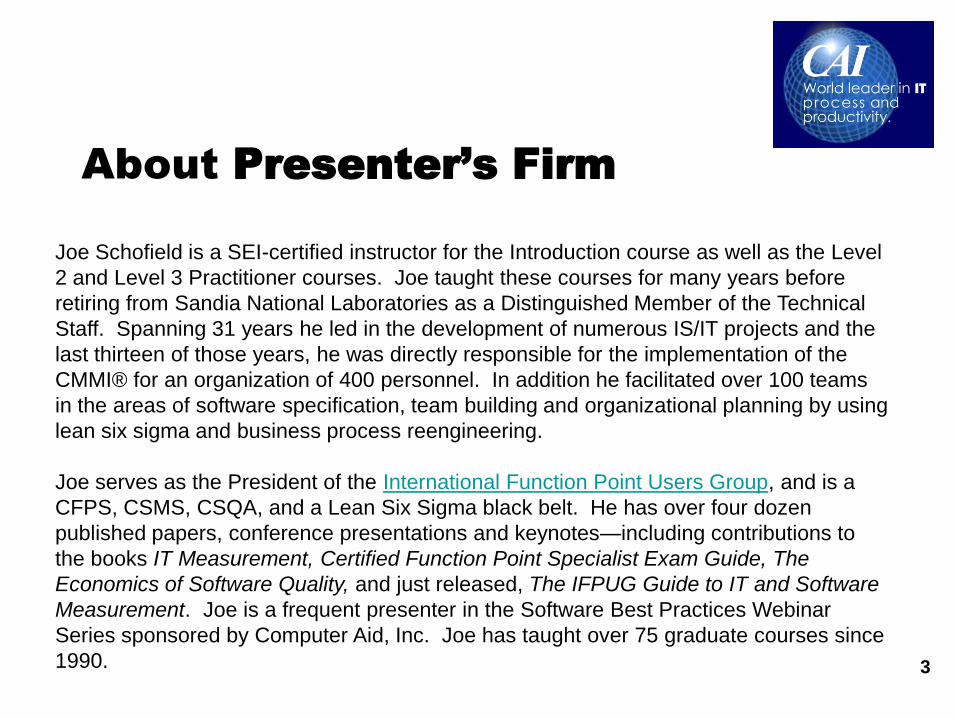
About Presenter’s Firm
Joe Schofield is a SEI-certified instructor for the Introduction course as well as the Level
2 and Level 3 Practitioner courses. Joe taught these courses for many years before
retiring from Sandia National Laboratories as a Distinguished Member of the Technical
Staff. Spanning 31 years he led in the development of numerous IS/IT projects and the
last thirteen of those years, he was directly responsible for the implementation of the
CMMI® for an organization of 400 personnel. In addition he facilitated over 100 teams
in the areas of software specification, team building and organizational planning by using
lean six sigma and business process reengineering.
Joe serves as the President of the International Function Point Users Group, and is a
CFPS, CSMS, CSQA, and a Lean Six Sigma black belt. He has over four dozen
published papers, conference presentations and keynotes—including contributions to
the books IT Measurement, Certified Function Point Specialist Exam Guide, The
Economics of Software Quality, and just released, The IFPUG Guide to IT and Software
Measurement. Joe is a frequent presenter in the Software Best Practices Webinar
Series sponsored by Computer Aid, Inc. Joe has taught over 75 graduate courses since
1990.
4
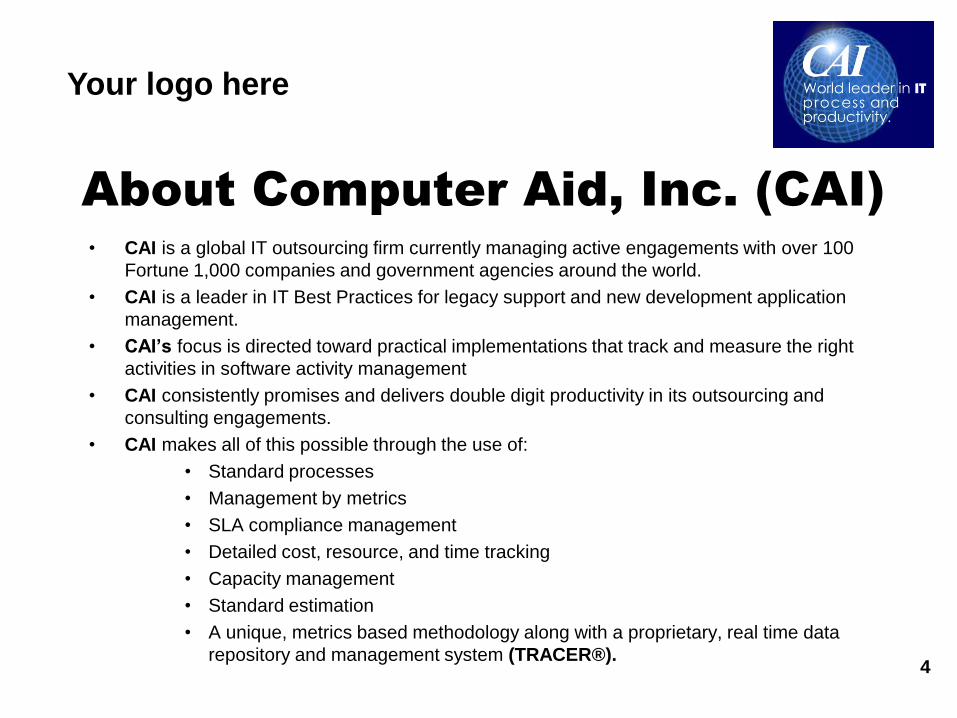
• CAI is a global IT outsourcing firm currently managing active engagements with over 100
Fortune 1,000 companies and government agencies around the world.
• CAI is a leader in IT Best Practices for legacy support and new development application
management.
• CAI’s focus is directed toward practical implementations that track and measure the right
activities in software activity management
• CAI consistently promises and delivers double digit productivity in its outsourcing and
consulting engagements.
• CAI makes all of this possible through the use of:
• Standard processes
• Management by metrics
• SLA compliance management
• Detailed cost, resource, and time tracking
• Capacity management
• Standard estimation
• A unique, metrics based methodology along with a proprietary, real time data
repository and management system (TRACER®).
About Computer Aid, Inc. (CAI)
Your logo here

5
NOW AVAILABLE!
ONLINE WEBINAR RECORDINGS
ANYTIME ACCESS!
WWW. ITMPI.ORG / LIBRARY
6
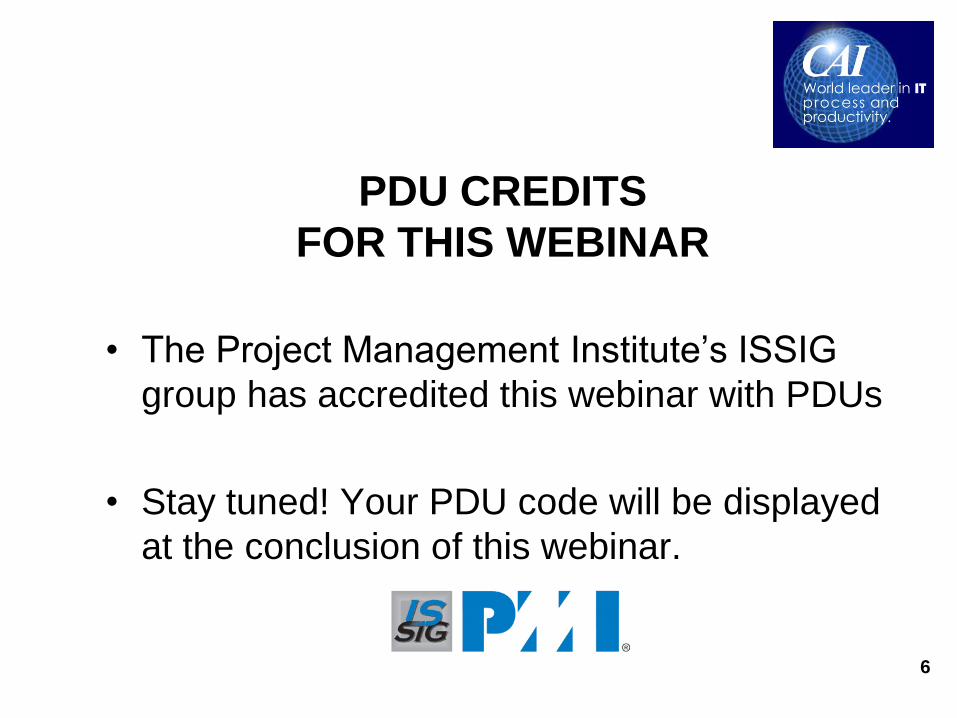
• The Project Management Institute’s ISSIG
group has accredited this webinar with PDUs
• Stay tuned! Your PDU code will be displayed
at the conclusion of this webinar.
PDU CREDITS
FOR THIS WEBINAR

7
Your logo here
8
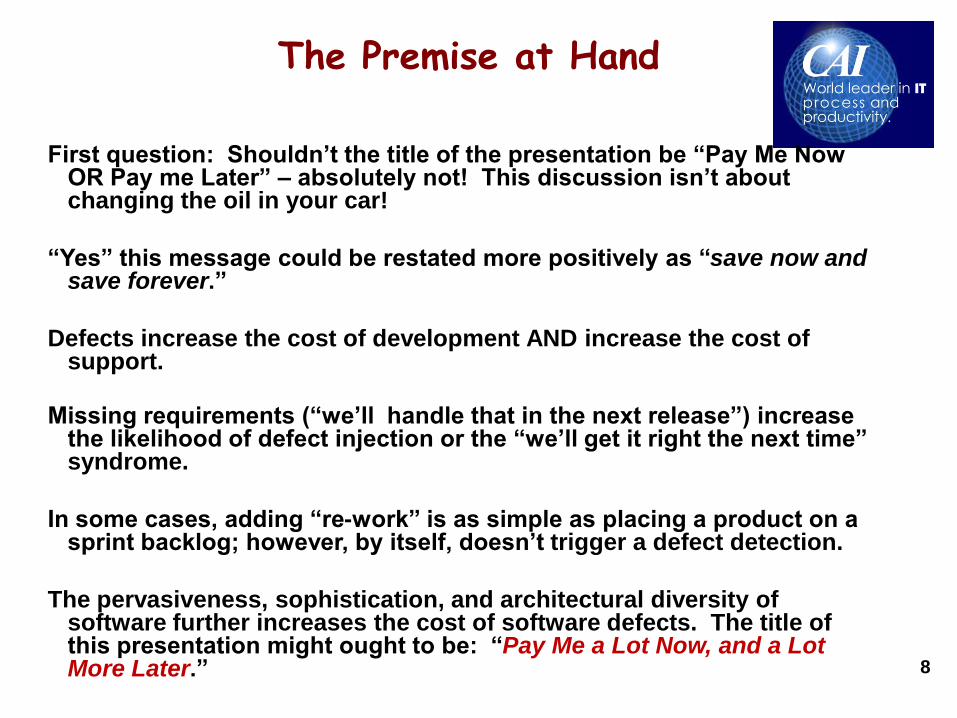
The Premise at Hand
First question: Shouldn’t the title of the presentation be “Pay Me Now OR Pay me Later” – absolutely not! This discussion isn’t about changing the oil in your car!
“Yes” this message could be restated more positively as “save now and save forever.”
Defects increase the cost of development AND increase the cost of support.
Missing requirements (“we’ll handle that in the next release”) increase the likelihood of defect injection or the “we’ll get it right the next time” syndrome.
In some cases, adding “re-work” is as simple as placing a product on a sprint backlog; however, by itself, doesn’t trigger a defect detection.
The pervasiveness, sophistication, and architectural diversity of software further increases the cost of software defects. The title of this presentation might ought to be: “Pay Me a Lot Now, and a Lot More Later.”
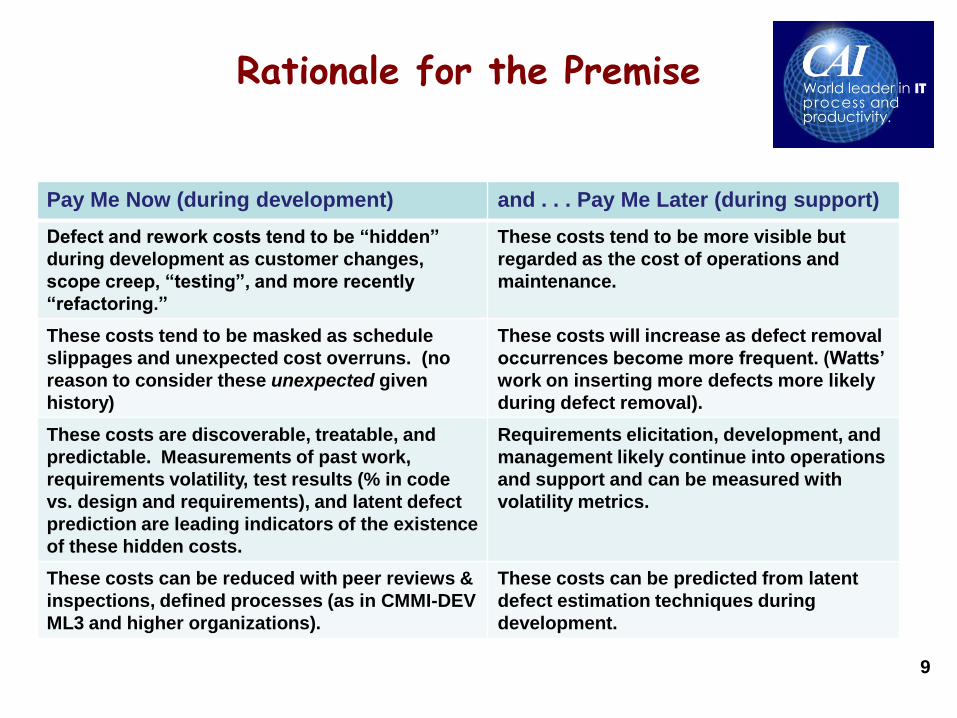
9
Rationale for the Premise
Pay Me Now (during development) and . . . Pay Me Later (during support)
Defect and rework costs tend to be “hidden”
during development as customer changes,
scope creep, “testing”, and more recently
“refactoring.”
These costs tend to be more visible but
regarded as the cost of operations and
maintenance.
These costs tend to be masked as schedule
slippages and unexpected cost overruns. (no
reason to consider these unexpected given
history)
These costs will increase as defect removal
occurrences become more frequent. (Watts’
work on inserting more defects more likely
during defect removal).
These costs are discoverable, treatable, and
predictable. Measurements of past work,
requirements volatility, test results (% in code
vs. design and requirements), and latent defect
prediction are leading indicators of the existence
of these hidden costs.
Requirements elicitation, development, and
management likely continue into operations
and support and can be measured with
volatility metrics.
These costs can be reduced with peer reviews &
inspections, defined processes (as in CMMI-DEV
ML3 and higher organizations).
These costs can be predicted from latent
defect estimation techniques during
development.
10
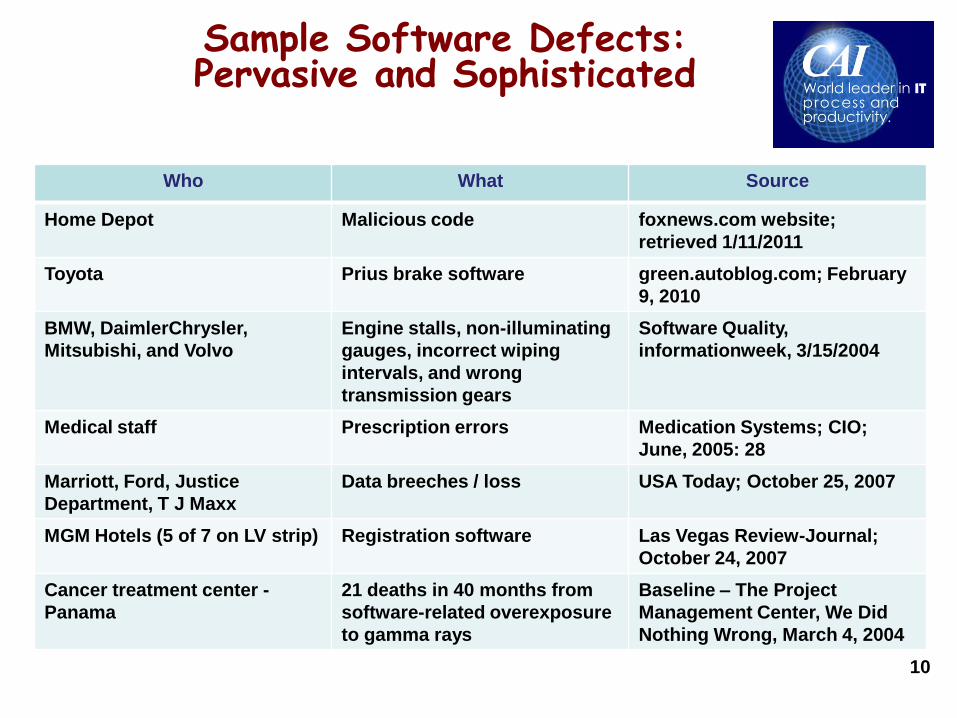
Sample Software Defects: Pervasive and Sophisticated
Who What Source
Home Depot Malicious code foxnews.com website;
retrieved 1/11/2011
Toyota Prius brake software green.autoblog.com; February
9, 2010
BMW, DaimlerChrysler,
Mitsubishi, and Volvo
Engine stalls, non-illuminating
gauges, incorrect wiping
intervals, and wrong
transmission gears
Software Quality,
informationweek, 3/15/2004
Medical staff Prescription errors Medication Systems; CIO;
June, 2005: 28
Marriott, Ford, Justice
Department, T J Maxx
Data breeches / loss USA Today; October 25, 2007
MGM Hotels (5 of 7 on LV strip) Registration software Las Vegas Review-Journal;
October 24, 2007
Cancer treatment center -
Panama
21 deaths in 40 months from
software-related overexposure
to gamma rays
Baseline – The Project
Management Center, We Did
Nothing Wrong, March 4, 2004
11
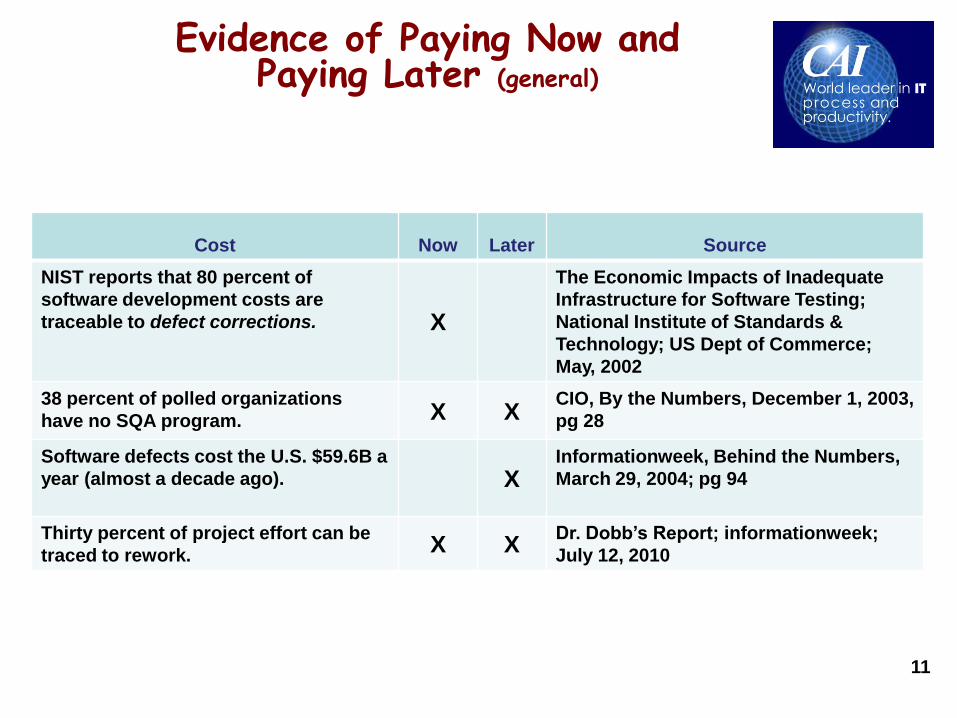
Evidence of Paying Now and Paying Later (general)
Cost Now Later Source
NIST reports that 80 percent of
software development costs are
traceable to defect corrections. X
The Economic Impacts of Inadequate
Infrastructure for Software Testing;
National Institute of Standards &
Technology; US Dept of Commerce;
May, 2002
38 percent of polled organizations
have no SQA program. X X CIO, By the Numbers, December 1, 2003,
pg 28
Software defects cost the U.S. $59.6B a
year (almost a decade ago). X Informationweek, Behind the Numbers,
March 29, 2004; pg 94
Thirty percent of project effort can be
traced to rework. X X
Dr. Dobb’s Report; informationweek;
July 12, 2010
12
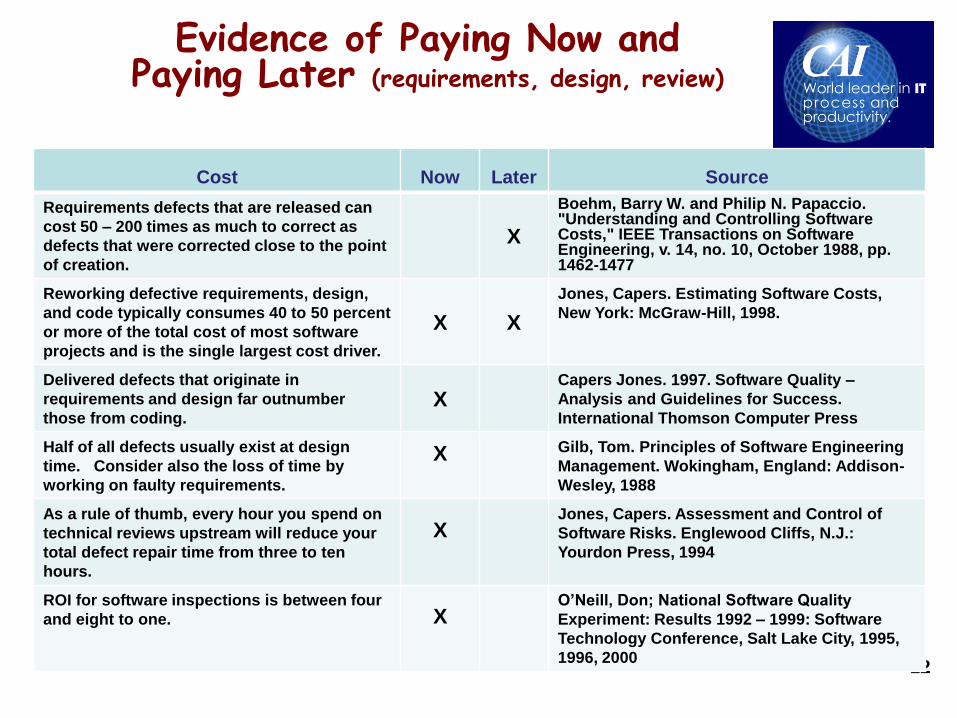
Evidence of Paying Now and Paying Later (requirements, design, review)
Cost Now Later Source
Requirements defects that are released can
cost 50 – 200 times as much to correct as
defects that were corrected close to the point
of creation.
X
Boehm, Barry W. and Philip N. Papaccio. "Understanding and Controlling Software Costs," IEEE Transactions on Software Engineering, v. 14, no. 10, October 1988, pp. 1462-1477
Reworking defective requirements, design,
and code typically consumes 40 to 50 percent
or more of the total cost of most software
projects and is the single largest cost driver.
X X
Jones, Capers. Estimating Software Costs,
New York: McGraw-Hill, 1998.
Delivered defects that originate in
requirements and design far outnumber
those from coding. X
Capers Jones. 1997. Software Quality –
Analysis and Guidelines for Success.
International Thomson Computer Press
Half of all defects usually exist at design
time. Consider also the loss of time by
working on faulty requirements.
X
Gilb, Tom. Principles of Software Engineering
Management. Wokingham, England: Addison-
Wesley, 1988
As a rule of thumb, every hour you spend on
technical reviews upstream will reduce your
total defect repair time from three to ten
hours.
X
Jones, Capers. Assessment and Control of
Software Risks. Englewood Cliffs, N.J.:
Yourdon Press, 1994
ROI for software inspections is between four
and eight to one. X
O’Neill, Don; National Software Quality
Experiment: Results 1992 – 1999: Software
Technology Conference, Salt Lake City, 1995,
1996, 2000
13
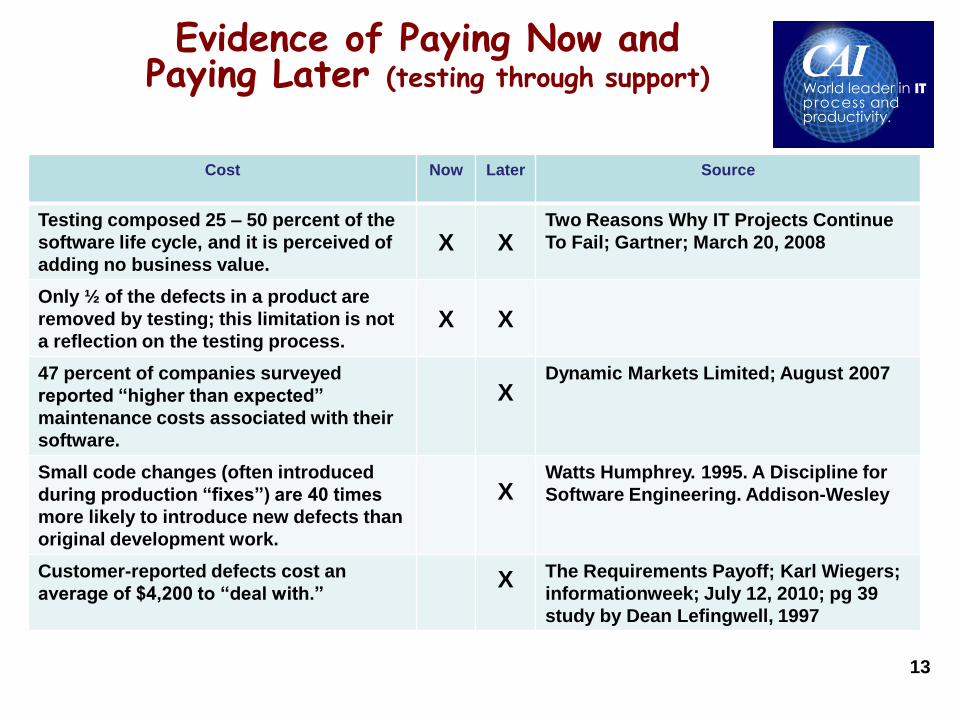
Evidence of Paying Now and Paying Later (testing through support)
Cost Now Later Source
Testing composed 25 – 50 percent of the
software life cycle, and it is perceived of
adding no business value. X X
Two Reasons Why IT Projects Continue
To Fail; Gartner; March 20, 2008
Only ½ of the defects in a product are
removed by testing; this limitation is not
a reflection on the testing process. X X
47 percent of companies surveyed
reported “higher than expected”
maintenance costs associated with their
software.
X
Dynamic Markets Limited; August 2007
Small code changes (often introduced
during production “fixes”) are 40 times
more likely to introduce new defects than
original development work.
X
Watts Humphrey. 1995. A Discipline for
Software Engineering. Addison-Wesley
Customer-reported defects cost an
average of $4,200 to “deal with.” X
The Requirements Payoff; Karl Wiegers;
informationweek; July 12, 2010; pg 39
study by Dean Lefingwell, 1997
14
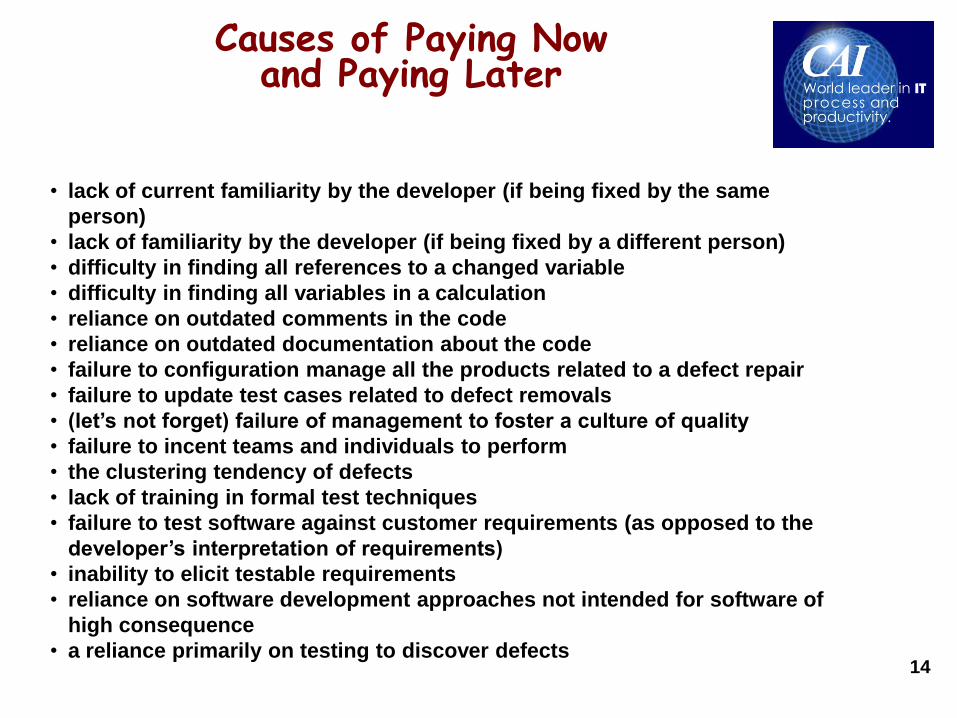
Causes of Paying Now and Paying Later
• lack of current familiarity by the developer (if being fixed by the same
person)
• lack of familiarity by the developer (if being fixed by a different person)
• difficulty in finding all references to a changed variable
• difficulty in finding all variables in a calculation
• reliance on outdated comments in the code
• reliance on outdated documentation about the code
• failure to configuration manage all the products related to a defect repair
• failure to update test cases related to defect removals
• (let’s not forget) failure of management to foster a culture of quality
• failure to incent teams and individuals to perform
• the clustering tendency of defects
• lack of training in formal test techniques
• failure to test software against customer requirements (as opposed to the
developer’s interpretation of requirements)
• inability to elicit testable requirements
• reliance on software development approaches not intended for software of
high consequence
• a reliance primarily on testing to discover defects
15
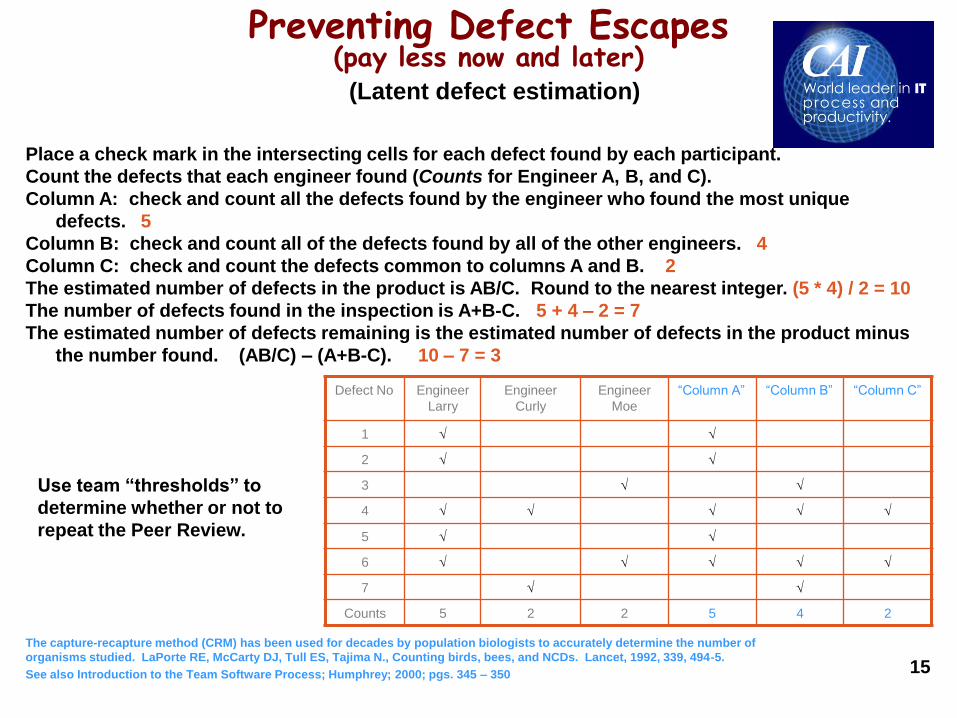
Place a check mark in the intersecting cells for each defect found by each participant.
Count the defects that each engineer found (Counts for Engineer A, B, and C).
Column A: check and count all the defects found by the engineer who found the most unique
defects. 5
Column B: check and count all of the defects found by all of the other engineers. 4
Column C: check and count the defects common to columns A and B. 2
The estimated number of defects in the product is AB/C. Round to the nearest integer. (5 * 4) / 2 = 10
The number of defects found in the inspection is A+B-C. 5 + 4 – 2 = 7
The estimated number of defects remaining is the estimated number of defects in the product minus
the number found. (AB/C) – (A+B-C). 10 – 7 = 3
The capture-recapture method (CRM) has been used for decades by population biologists to accurately determine the number of
organisms studied. LaPorte RE, McCarty DJ, Tull ES, Tajima N., Counting birds, bees, and NCDs. Lancet, 1992, 339, 494-5.
See also Introduction to the Team Software Process; Humphrey; 2000; pgs. 345 – 350
Preventing Defect Escapes (pay less now and later) (Latent defect estimation)
Use team “thresholds” to
determine whether or not to
repeat the Peer Review.
Defect No Engineer
Larry
Engineer
Curly
Engineer
Moe
“Column A” “Column B” “Column C”
1
2
3
4
5
6
7
Counts 5 2 2 5 4 2
16
Quick Hits on Capture-Recapture Method
• CRM can be used to predict the number of estimated defects remaining in a product. This estimate can then be used to make quantified, data-driven decision on how to proceed with a software product. IFPUG MetricViews; Winter 2008
• Used by Jerry Weinberg to estimate remaining typos based on how many his reviewers found. Beyond Defect Removal: Latent Defect Estimation with Capture Recapture Method; CrossTalk, August 2007
• Try this: Something Fishy (statistics) from PBS Mathline. www.pbs.org/mathline
• A quickie primer – Capture-recapture and Removal Methods. www.ento.vt.edu~sharov/PopEcol/lec2/caprecap.html
• A more detailed look – Life Cycle-Based Defect Removal with Capture Recapture Methods. Computer Aid, Inc. webinar, April 22, 2008
• A quickie history – Capture-Recapture History. www.pitt.edu/~yuc2/cr/history.htm

Where do defects go after they die? (it depends on if they’ve been saved or not!)
prevented (changes to SILC and
project defined process)
Observation
Ind
ivid
ua
l V
alu
e
1413121110987654321
25
20
15
10
5
0
-5
-10
-15
_X=5.47
UCL=23.75
LCL=-12.82
Project Plan Defects per Hour Review
discovered (PR, Testing, Customer)
analyzed
*captured / saved (recorded)
Defects get defined (organizational glossary)
*left unsaved (not recorded) these defects are of
no value to the process, and, likely to be repeated
18
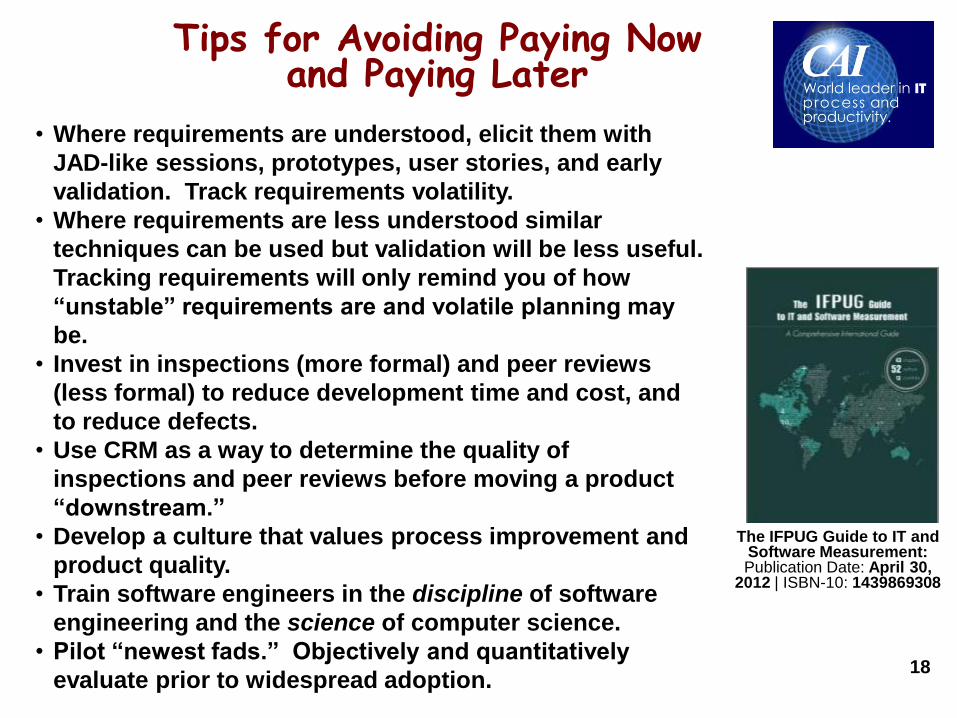
Tips for Avoiding Paying Now and Paying Later
• Where requirements are understood, elicit them with
JAD-like sessions, prototypes, user stories, and early
validation. Track requirements volatility.
• Where requirements are less understood similar
techniques can be used but validation will be less useful.
Tracking requirements will only remind you of how
“unstable” requirements are and volatile planning may
be.
• Invest in inspections (more formal) and peer reviews
(less formal) to reduce development time and cost, and
to reduce defects.
• Use CRM as a way to determine the quality of
inspections and peer reviews before moving a product
“downstream.”
• Develop a culture that values process improvement and
product quality.
• Train software engineers in the discipline of software
engineering and the science of computer science.
• Pilot “newest fads.” Objectively and quantitatively
evaluate prior to widespread adoption.
The IFPUG Guide to IT and Software Measurement: Publication Date: April 30,
2012 | ISBN-10: 1439869308

19
Questions?
Your logo here
20 20
CAI Sponsors
The IT Metrics Productivity Institute:
• Clearinghouse repository of best practices: WWW.ITMPI.ORG
• Weekly educational newsletter: WWW.ITMPI.ORG / SUBSCRIBE
• Weekly webinars hosted by industry leaders: WWW.ITMPI.ORG / WEBINARS
• ACCESS WEBINAR RECORDINGS ANYTIME AT WWW.ITMPI.ORG / LIBRARY
21
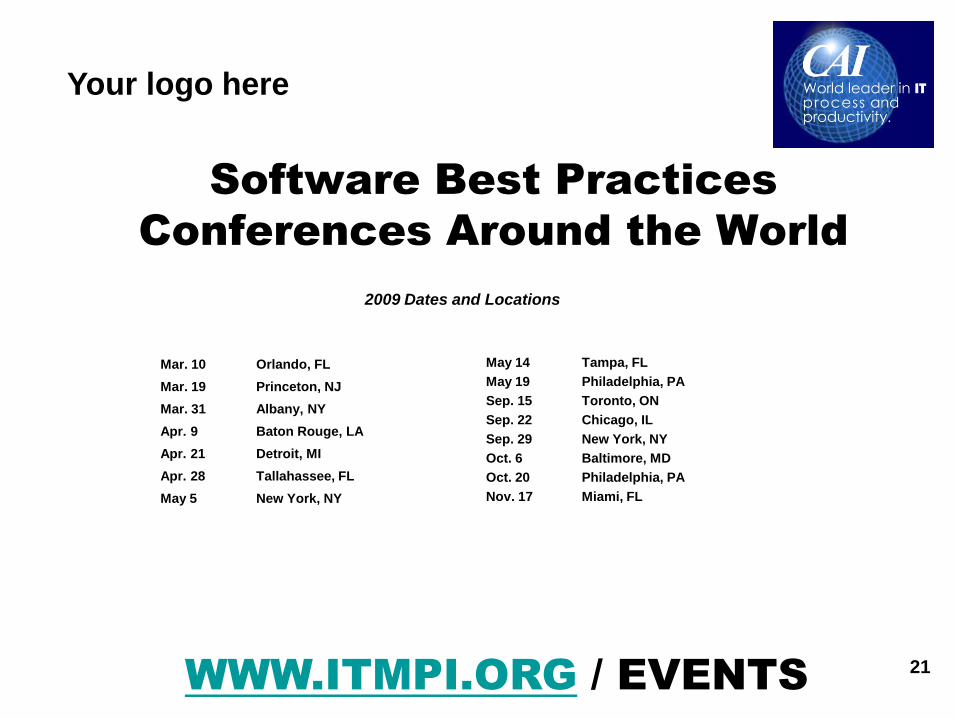
Software Best Practices
Conferences Around the World
WWW.ITMPI.ORG / EVENTS
Mar. 10 Orlando, FL
Mar. 19 Princeton, NJ
Mar. 31 Albany, NY
Apr. 9 Baton Rouge, LA
Apr. 21 Detroit, MI
Apr. 28 Tallahassee, FL
May 5 New York, NY
Your logo here
2009 Dates and Locations
May 14 Tampa, FL
May 19 Philadelphia, PA
Sep. 15 Toronto, ON
Sep. 22 Chicago, IL
Sep. 29 New York, NY
Oct. 6 Baltimore, MD
Oct. 20 Philadelphia, PA
Nov. 17 Miami, FL
22
Michael Milutis Director of Marketing
Computer Aid, Inc. (CAI)
Presenter Name 1 Title
Organization
Email Address
Your logo here