week 2 assignment: mining for data overviewlmknight.wikispaces.com/file/view/edld_5333_week_2...edld...
TRANSCRIPT
EDLD 5333 Leadership for Accountability Leanne Knight ET8025
Lamar University 1 of 14
Week 2 Assignment: Mining for Data
Overview
In this week’s lecture, we discussed the Texas accountability system and the Academic Excellence Indicator System (AEIS) as a school improvement tool in relation to No Child Left Behind. This week, you will perform Step 2 of the comprehensive needs assessment, which you will use later to develop a campus action plan.
In this assignment, you will explore the Academic Excellence Indicator System (AEIS) data, locate reports that are critical to your campus improvement team, and compare your selected campus’ performance to AEIS standards. Your goal in completing this data analysis is to determine areas of strength and weakness and identify patterns and trends at your selected campus.
EDLD 5333 Leadership for Accountability Leanne Knight ET8025
Lamar University 2 of 14
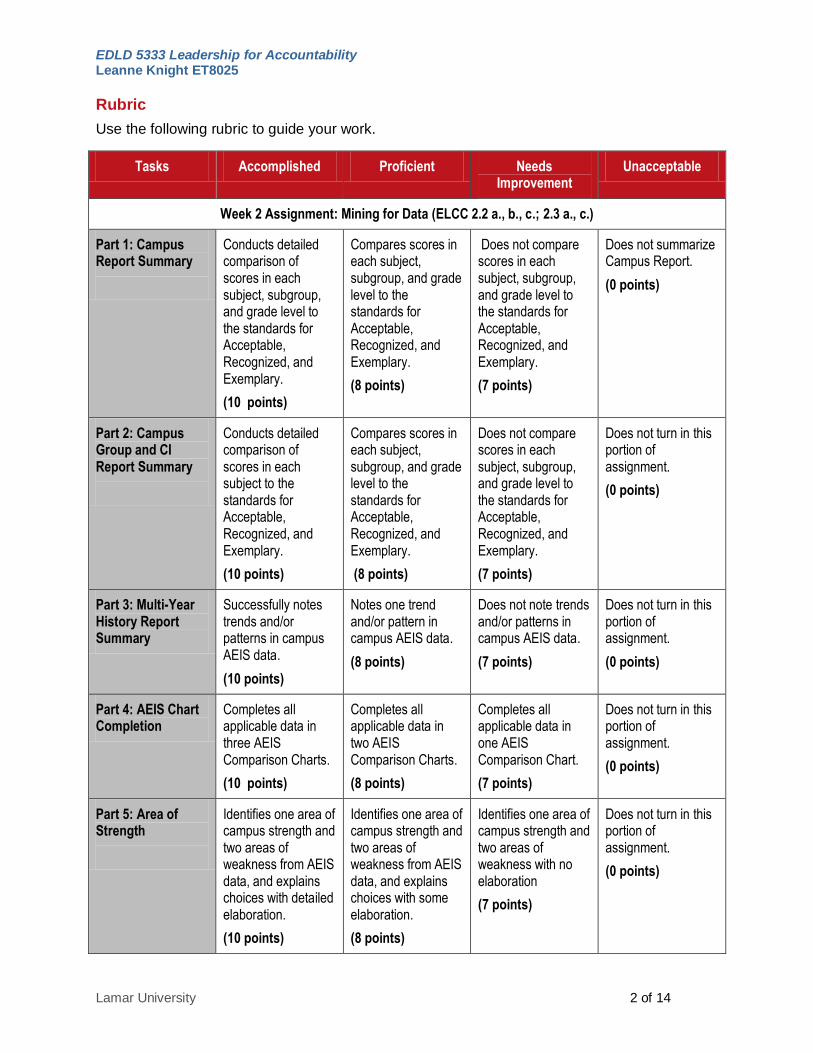
Rubric
Use the following rubric to guide your work.
Tasks Accomplished Proficient Needs Improvement
Unacceptable
Week 2 Assignment: Mining for Data (ELCC 2.2 a., b., c.; 2.3 a., c.)
Part 1: Campus Report Summary
Conducts detailed comparison of scores in each subject, subgroup, and grade level to the standards for Acceptable, Recognized, and Exemplary.
(10 points)
Compares scores in each subject, subgroup, and grade level to the standards for Acceptable, Recognized, and Exemplary.
(8 points)
Does not compare scores in each subject, subgroup, and grade level to the standards for Acceptable, Recognized, and Exemplary.
(7 points)
Does not summarize Campus Report.
(0 points)
Part 2: Campus Group and CI Report Summary
Conducts detailed comparison of scores in each subject to the standards for Acceptable, Recognized, and Exemplary.
(10 points)
Compares scores in each subject, subgroup, and grade level to the standards for Acceptable, Recognized, and Exemplary.
(8 points)
Does not compare scores in each subject, subgroup, and grade level to the standards for Acceptable, Recognized, and Exemplary.
(7 points)
Does not turn in this portion of assignment.
(0 points)
Part 3: Multi-Year History Report Summary
Successfully notes trends and/or patterns in campus AEIS data.
(10 points)
Notes one trend and/or pattern in campus AEIS data.
(8 points)
Does not note trends and/or patterns in campus AEIS data.
(7 points)
Does not turn in this portion of assignment.
(0 points)
Part 4: AEIS Chart Completion
Completes all applicable data in three AEIS Comparison Charts.
(10 points)
Completes all applicable data in two AEIS Comparison Charts.
(8 points)
Completes all applicable data in one AEIS Comparison Chart.
(7 points)
Does not turn in this portion of assignment.
(0 points)
Part 5: Area of Strength
Identifies one area of campus strength and two areas of weakness from AEIS data, and explains choices with detailed elaboration.
(10 points)
Identifies one area of campus strength and two areas of weakness from AEIS data, and explains choices with some elaboration.
(8 points)
Identifies one area of campus strength and two areas of weakness with no elaboration
(7 points)
Does not turn in this portion of assignment.
(0 points)
EDLD 5333 Leadership for Accountability Leanne Knight ET8025
Lamar University 3 of 14
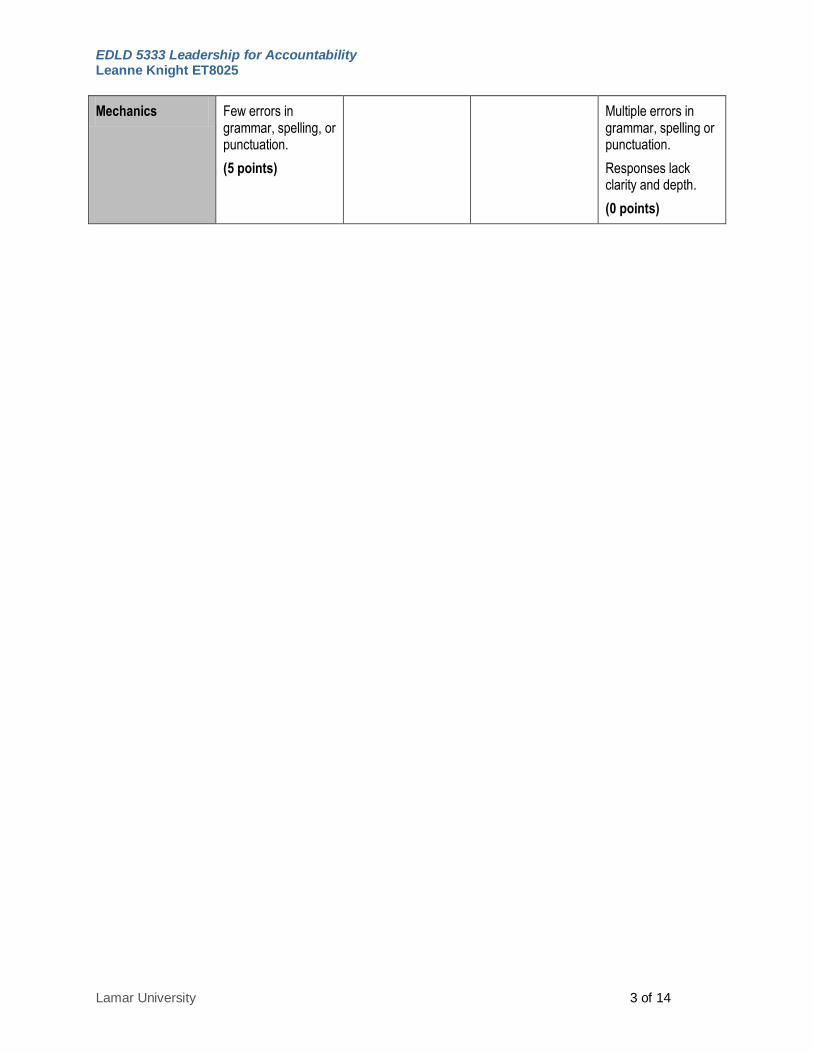
Mechanics Few errors in grammar, spelling, or punctuation.
(5 points)
Multiple errors in grammar, spelling or punctuation.
Responses lack clarity and depth.
(0 points)
EDLD 5333 Leadership for Accountability Leanne Knight ET8025
Lamar University 4 of 14
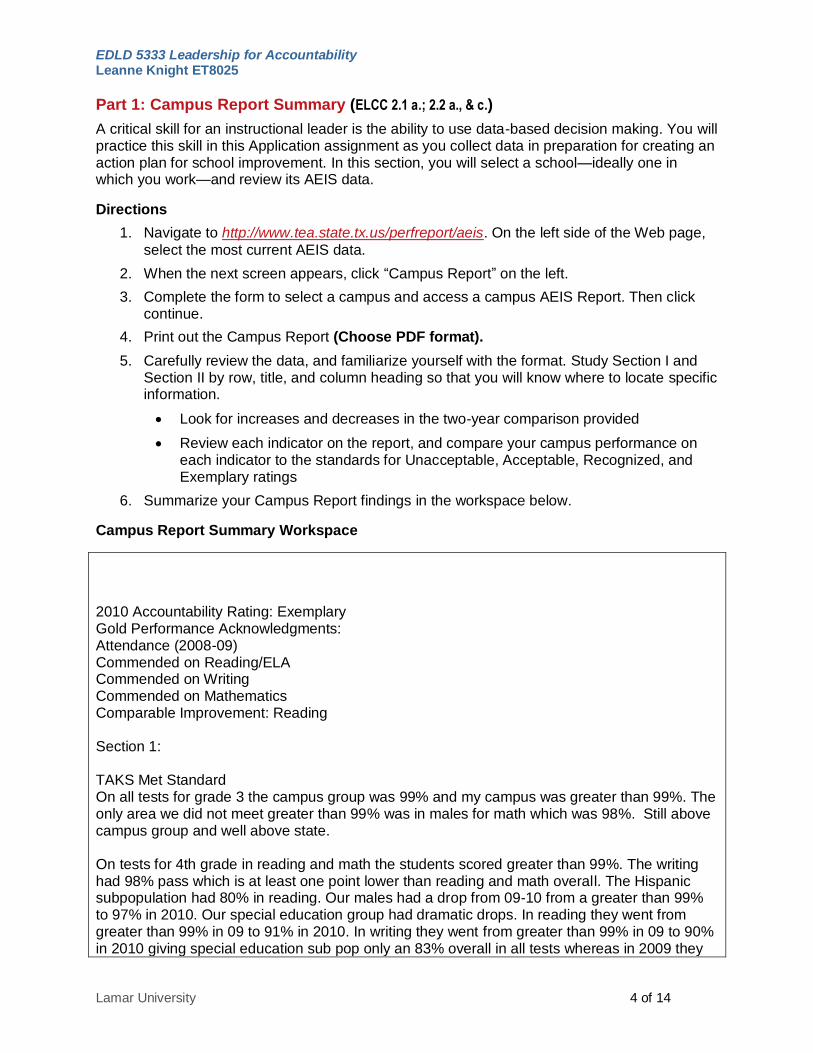
Part 1: Campus Report Summary (ELCC 2.1 a.; 2.2 a., & c.)
A critical skill for an instructional leader is the ability to use data-based decision making. You will practice this skill in this Application assignment as you collect data in preparation for creating an action plan for school improvement. In this section, you will select a school—ideally one in which you work—and review its AEIS data.
Directions
1. Navigate to http://www.tea.state.tx.us/perfreport/aeis. On the left side of the Web page,
select the most current AEIS data.
2. When the next screen appears, click ―Campus Report‖ on the left.
3. Complete the form to select a campus and access a campus AEIS Report. Then click continue.
4. Print out the Campus Report (Choose PDF format).
5. Carefully review the data, and familiarize yourself with the format. Study Section I and Section II by row, title, and column heading so that you will know where to locate specific information.
Look for increases and decreases in the two-year comparison provided
Review each indicator on the report, and compare your campus performance on each indicator to the standards for Unacceptable, Acceptable, Recognized, and Exemplary ratings
6. Summarize your Campus Report findings in the workspace below.
Campus Report Summary Workspace
2010 Accountability Rating: Exemplary Gold Performance Acknowledgments: Attendance (2008-09) Commended on Reading/ELA Commended on Writing Commended on Mathematics Comparable Improvement: Reading Section 1: TAKS Met Standard On all tests for grade 3 the campus group was 99% and my campus was greater than 99%. The only area we did not meet greater than 99% was in males for math which was 98%. Still above campus group and well above state. On tests for 4th grade in reading and math the students scored greater than 99%. The writing had 98% pass which is at least one point lower than reading and math overall. The Hispanic subpopulation had 80% in reading. Our males had a drop from 09-10 from a greater than 99% to 97% in 2010. Our special education group had dramatic drops. In reading they went from greater than 99% in 09 to 91% in 2010. In writing they went from greater than 99% in 09 to 90% in 2010 giving special education sub pop only an 83% overall in all tests whereas in 2009 they
EDLD 5333 Leadership for Accountability Leanne Knight ET8025
Lamar University 5 of 14
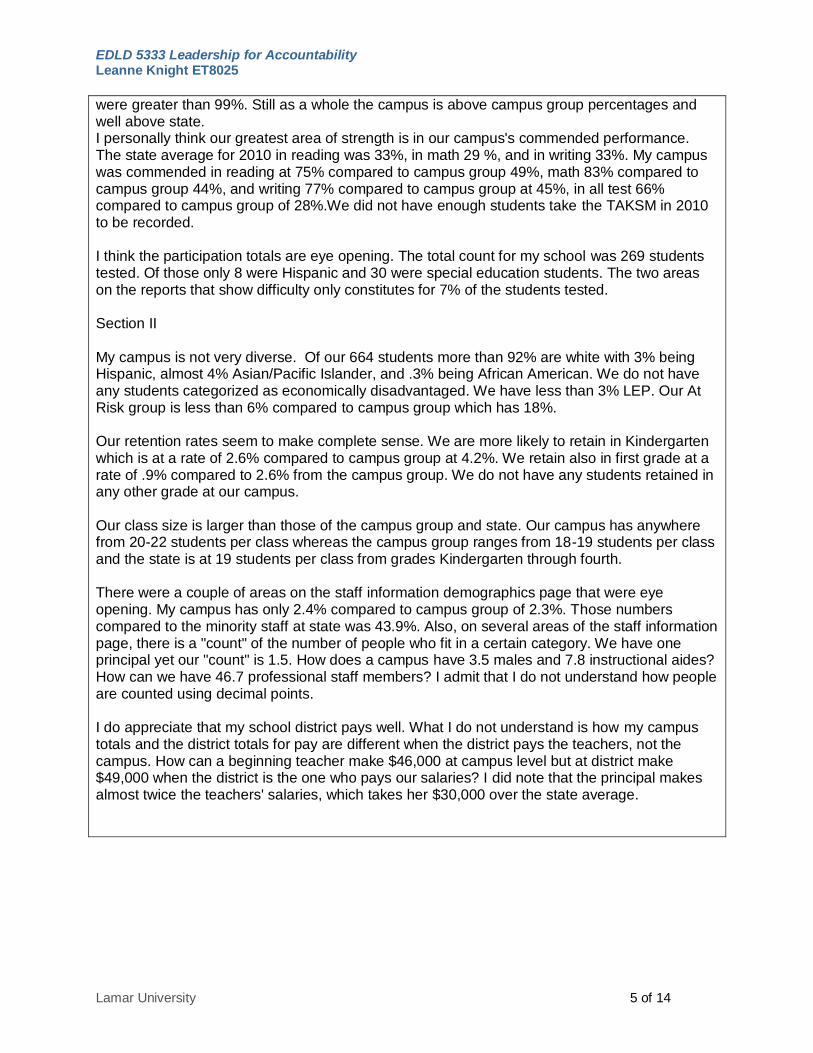
were greater than 99%. Still as a whole the campus is above campus group percentages and well above state. I personally think our greatest area of strength is in our campus's commended performance. The state average for 2010 in reading was 33%, in math 29 %, and in writing 33%. My campus was commended in reading at 75% compared to campus group 49%, math 83% compared to campus group 44%, and writing 77% compared to campus group at 45%, in all test 66% compared to campus group of 28%.We did not have enough students take the TAKSM in 2010 to be recorded. I think the participation totals are eye opening. The total count for my school was 269 students tested. Of those only 8 were Hispanic and 30 were special education students. The two areas on the reports that show difficulty only constitutes for 7% of the students tested. Section II My campus is not very diverse. Of our 664 students more than 92% are white with 3% being Hispanic, almost 4% Asian/Pacific Islander, and .3% being African American. We do not have any students categorized as economically disadvantaged. We have less than 3% LEP. Our At Risk group is less than 6% compared to campus group which has 18%. Our retention rates seem to make complete sense. We are more likely to retain in Kindergarten which is at a rate of 2.6% compared to campus group at 4.2%. We retain also in first grade at a rate of .9% compared to 2.6% from the campus group. We do not have any students retained in any other grade at our campus. Our class size is larger than those of the campus group and state. Our campus has anywhere from 20-22 students per class whereas the campus group ranges from 18-19 students per class and the state is at 19 students per class from grades Kindergarten through fourth. There were a couple of areas on the staff information demographics page that were eye opening. My campus has only 2.4% compared to campus group of 2.3%. Those numbers compared to the minority staff at state was 43.9%. Also, on several areas of the staff information page, there is a "count" of the number of people who fit in a certain category. We have one principal yet our "count" is 1.5. How does a campus have 3.5 males and 7.8 instructional aides? How can we have 46.7 professional staff members? I admit that I do not understand how people are counted using decimal points. I do appreciate that my school district pays well. What I do not understand is how my campus totals and the district totals for pay are different when the district pays the teachers, not the campus. How can a beginning teacher make $46,000 at campus level but at district make $49,000 when the district is the one who pays our salaries? I did note that the principal makes almost twice the teachers' salaries, which takes her $30,000 over the state average.
EDLD 5333 Leadership for Accountability Leanne Knight ET8025
Lamar University 6 of 14
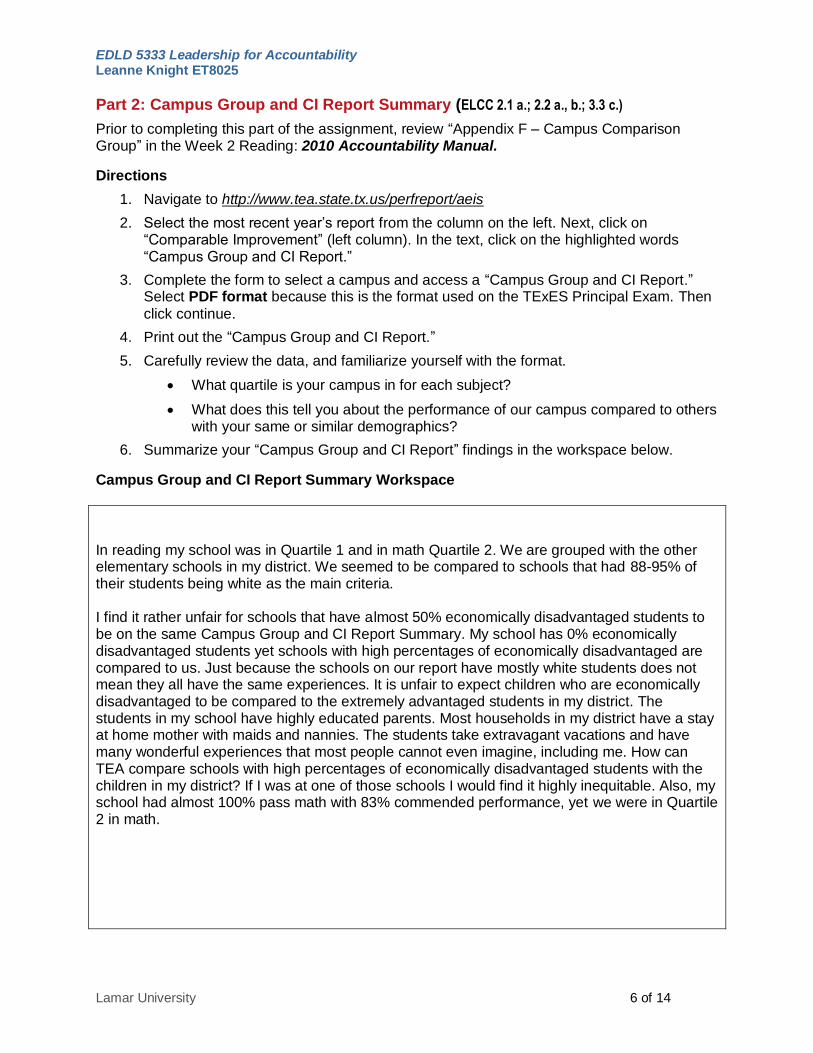
Part 2: Campus Group and CI Report Summary (ELCC 2.1 a.; 2.2 a., b.; 3.3 c.)
Prior to completing this part of the assignment, review ―Appendix F – Campus Comparison Group‖ in the Week 2 Reading: 2010 Accountability Manual.
Directions
1. Navigate to http://www.tea.state.tx.us/perfreport/aeis
2. Select the most recent year’s report from the column on the left. Next, click on ―Comparable Improvement‖ (left column). In the text, click on the highlighted words ―Campus Group and CI Report.‖
3. Complete the form to select a campus and access a ―Campus Group and CI Report.‖ Select PDF format because this is the format used on the TExES Principal Exam. Then
click continue.
4. Print out the ―Campus Group and CI Report.‖
5. Carefully review the data, and familiarize yourself with the format.
What quartile is your campus in for each subject?
What does this tell you about the performance of our campus compared to others with your same or similar demographics?
6. Summarize your ―Campus Group and CI Report‖ findings in the workspace below.
Campus Group and CI Report Summary Workspace
In reading my school was in Quartile 1 and in math Quartile 2. We are grouped with the other elementary schools in my district. We seemed to be compared to schools that had 88-95% of their students being white as the main criteria. I find it rather unfair for schools that have almost 50% economically disadvantaged students to be on the same Campus Group and CI Report Summary. My school has 0% economically disadvantaged students yet schools with high percentages of economically disadvantaged are compared to us. Just because the schools on our report have mostly white students does not mean they all have the same experiences. It is unfair to expect children who are economically disadvantaged to be compared to the extremely advantaged students in my district. The students in my school have highly educated parents. Most households in my district have a stay at home mother with maids and nannies. The students take extravagant vacations and have many wonderful experiences that most people cannot even imagine, including me. How can TEA compare schools with high percentages of economically disadvantaged students with the children in my district? If I was at one of those schools I would find it highly inequitable. Also, my school had almost 100% pass math with 83% commended performance, yet we were in Quartile 2 in math.

EDLD 5333 Leadership for Accountability Leanne Knight ET8025
Lamar University 7 of 14
Part 3: Multi-Year History Report Summary (ELCC 2.1 a.; 2.2 a., b., c.; 2.3 a., b., c.)
Directions
1. Navigate to http://www.tea.state.tx.us/perfreport/aeis.
2. On the left, click Multi-Year: Schools.
3. Complete the form to select a campus and access a campus ―Multi-Year History Report.‖
4. Select the most current span of years in PDF format because this is the format used on
the TExES Principal Exam. Then click continue.
5. Print out the ―Campus Data Multi-Year History.‖
6. Carefully review the data, and familiarize yourself with the format.
Look for increases and decreases in performance by subject, grade level, and subgroups. Compare campus results with state, district, and campus group.
Note patterns and/or trends you see over time.
7. Summarize the patterns and/or trends noted in the data in the workspace below.
Multi-Year History Report Summary Workspace
In 2003 we had overall 97% passing with a growth to 99% in 2009 and a small drop to 98% in 2010. The area that seems to be the most troublesome would be our small subpopulation of Hispanics. In 2003 we did not have enough students to have that even counted. From 2004-09 our Hispanic population had a passing rate of greater than 99% passing. Unfortunately, in 2010 our Hispanic population dropped to 88% passing in Reading. As far as growth is concerned, when the school has always had almost everyone pass TAKS there isn't much room for growth in that area so the campus does not show growth except maybe by 1%. Since my campus is K-4 we are only tested at 3rd and 4th grade with math, reading, and writing (4th only). The second part of the report does not pertain to my campus since it pertains to 7 th-12th grade.
EDLD 5333 Leadership for Accountability Leanne Knight ET8025
Lamar University 8 of 14
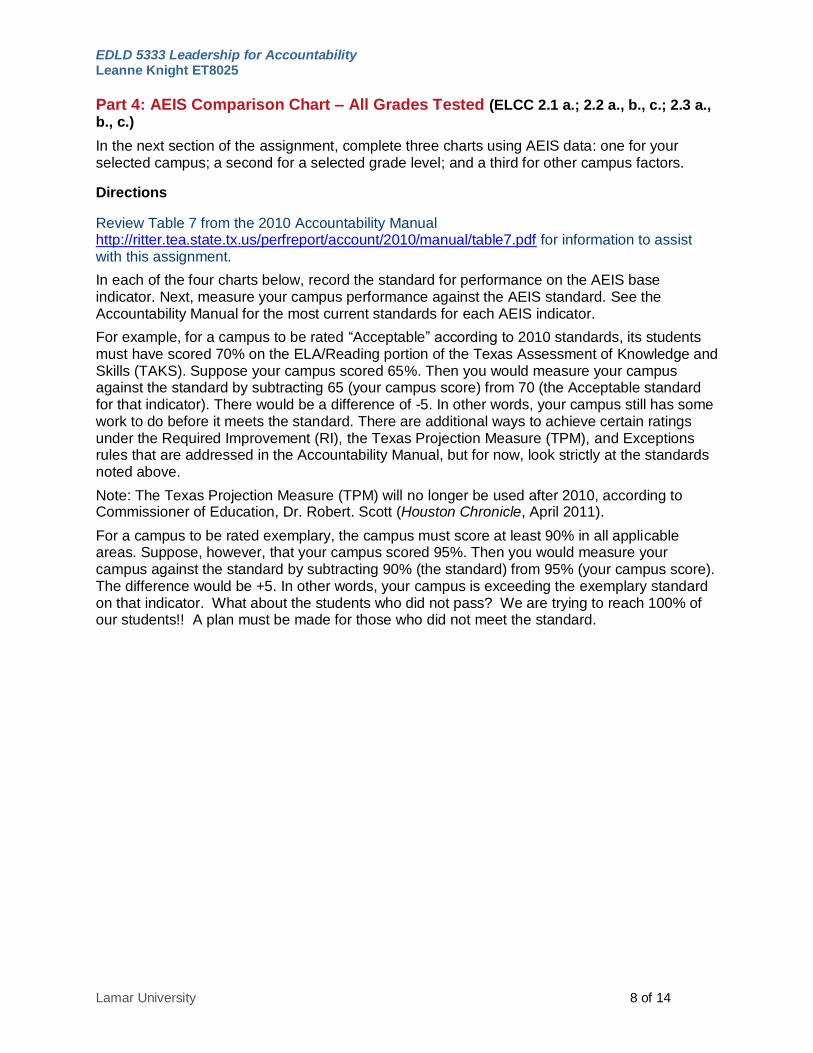
Part 4: AEIS Comparison Chart – All Grades Tested (ELCC 2.1 a.; 2.2 a., b., c.; 2.3 a., b., c.)
In the next section of the assignment, complete three charts using AEIS data: one for your selected campus; a second for a selected grade level; and a third for other campus factors.
Directions
Review Table 7 from the 2010 Accountability Manual http://ritter.tea.state.tx.us/perfreport/account/2010/manual/table7.pdf for information to assist with this assignment.
In each of the four charts below, record the standard for performance on the AEIS base indicator. Next, measure your campus performance against the AEIS standard. See the Accountability Manual for the most current standards for each AEIS indicator.
For example, for a campus to be rated ―Acceptable‖ according to 2010 standards, its students must have scored 70% on the ELA/Reading portion of the Texas Assessment of Knowledge and Skills (TAKS). Suppose your campus scored 65%. Then you would measure your campus against the standard by subtracting 65 (your campus score) from 70 (the Acceptable standard for that indicator). There would be a difference of -5. In other words, your campus still has some work to do before it meets the standard. There are additional ways to achieve certain ratings under the Required Improvement (RI), the Texas Projection Measure (TPM), and Exceptions rules that are addressed in the Accountability Manual, but for now, look strictly at the standards noted above.
Note: The Texas Projection Measure (TPM) will no longer be used after 2010, according to Commissioner of Education, Dr. Robert. Scott (Houston Chronicle, April 2011).
For a campus to be rated exemplary, the campus must score at least 90% in all applicable areas. Suppose, however, that your campus scored 95%. Then you would measure your campus against the standard by subtracting 90% (the standard) from 95% (your campus score). The difference would be +5. In other words, your campus is exceeding the exemplary standard on that indicator. What about the students who did not pass? We are trying to reach 100% of our students!! A plan must be made for those who did not meet the standard.
EDLD 5333 Leadership for Accountability Leanne Knight ET8025
Lamar University 9 of 14
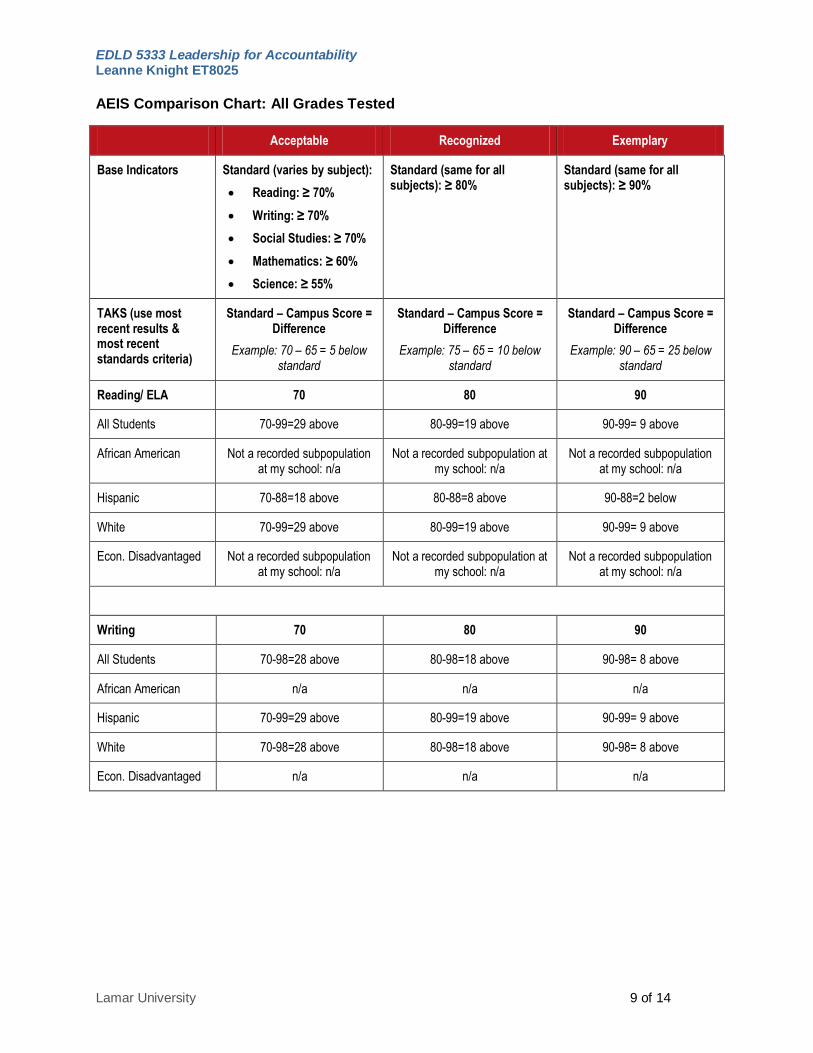
AEIS Comparison Chart: All Grades Tested
Acceptable Recognized Exemplary
Base Indicators Standard (varies by subject):
Reading: ≥ 70%
Writing: ≥ 70%
Social Studies: ≥ 70%
Mathematics: ≥ 60%
Science: ≥ 55%
Standard (same for all subjects): ≥ 80%
Standard (same for all subjects): ≥ 90%
TAKS (use most recent results & most recent standards criteria)
Standard – Campus Score = Difference
Example: 70 – 65 = 5 below standard
Standard – Campus Score = Difference
Example: 75 – 65 = 10 below standard
Standard – Campus Score = Difference
Example: 90 – 65 = 25 below standard
Reading/ ELA 70 80 90
All Students 70-99=29 above 80-99=19 above 90-99= 9 above
African American Not a recorded subpopulation at my school: n/a
Not a recorded subpopulation at my school: n/a
Not a recorded subpopulation at my school: n/a
Hispanic 70-88=18 above 80-88=8 above 90-88=2 below
White 70-99=29 above 80-99=19 above 90-99= 9 above
Econ. Disadvantaged Not a recorded subpopulation at my school: n/a
Not a recorded subpopulation at my school: n/a
Not a recorded subpopulation at my school: n/a
Writing 70 80 90
All Students 70-98=28 above 80-98=18 above 90-98= 8 above
African American n/a n/a n/a
Hispanic 70-99=29 above 80-99=19 above 90-99= 9 above
White 70-98=28 above 80-98=18 above 90-98= 8 above
Econ. Disadvantaged n/a n/a n/a
EDLD 5333 Leadership for Accountability Leanne Knight ET8025
Lamar University 10 of 14
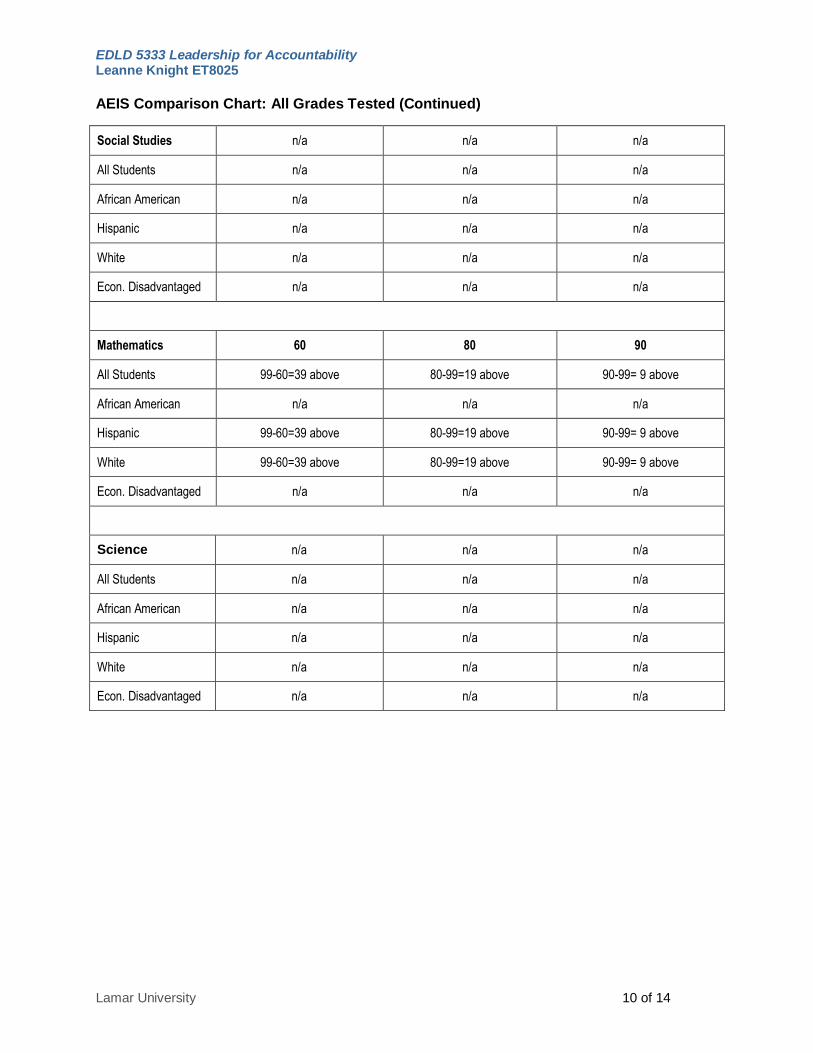
AEIS Comparison Chart: All Grades Tested (Continued)
Social Studies n/a n/a n/a
All Students n/a n/a n/a
African American n/a n/a n/a
Hispanic n/a n/a n/a
White n/a n/a n/a
Econ. Disadvantaged n/a n/a n/a
Mathematics 60 80 90
All Students 99-60=39 above 80-99=19 above 90-99= 9 above
African American n/a n/a n/a
Hispanic 99-60=39 above 80-99=19 above 90-99= 9 above
White 99-60=39 above 80-99=19 above 90-99= 9 above
Econ. Disadvantaged n/a n/a n/a
Science n/a n/a n/a
All Students n/a n/a n/a
African American n/a n/a n/a
Hispanic n/a n/a n/a
White n/a n/a n/a
Econ. Disadvantaged n/a n/a n/a
EDLD 5333 Leadership for Accountability Leanne Knight ET8025
Lamar University 11 of 14
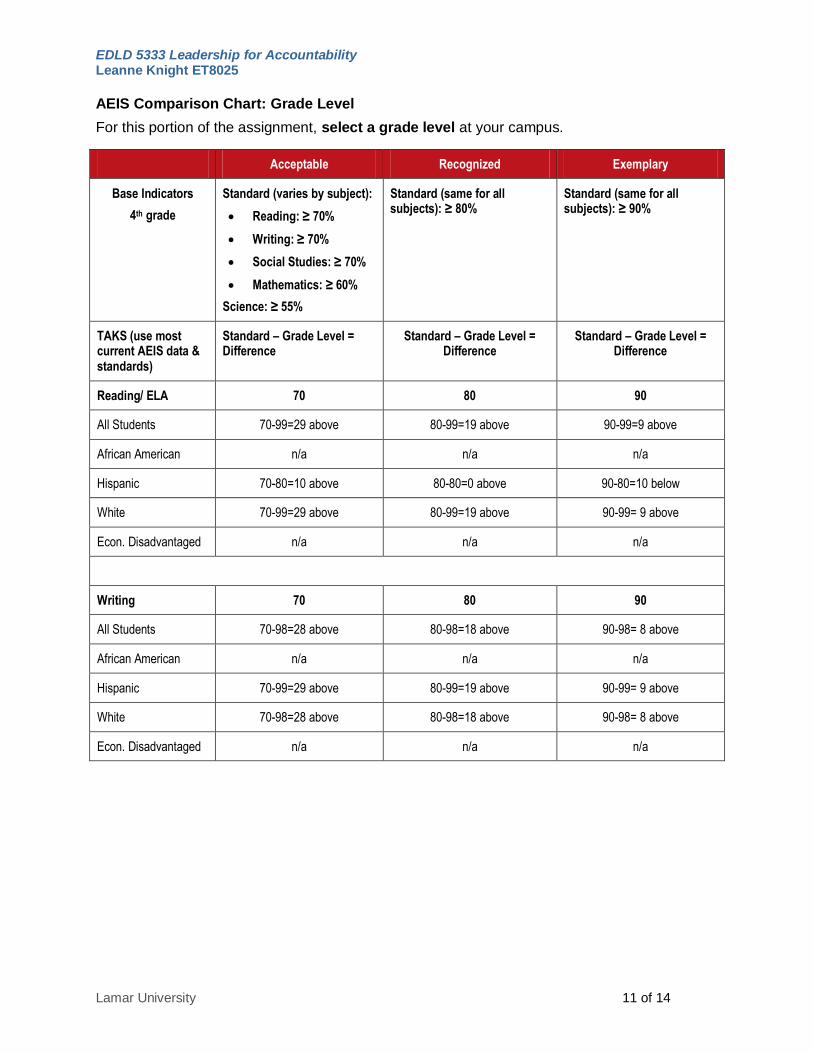
AEIS Comparison Chart: Grade Level
For this portion of the assignment, select a grade level at your campus.
Acceptable Recognized Exemplary
Base Indicators
4th grade
Standard (varies by subject):
Reading: ≥ 70%
Writing: ≥ 70%
Social Studies: ≥ 70%
Mathematics: ≥ 60%
Science: ≥ 55%
Standard (same for all subjects): ≥ 80%
Standard (same for all subjects): ≥ 90%
TAKS (use most current AEIS data & standards)
Standard – Grade Level = Difference
Standard – Grade Level = Difference
Standard – Grade Level = Difference
Reading/ ELA 70 80 90
All Students 70-99=29 above 80-99=19 above 90-99=9 above
African American n/a n/a n/a
Hispanic 70-80=10 above 80-80=0 above 90-80=10 below
White 70-99=29 above 80-99=19 above 90-99= 9 above
Econ. Disadvantaged n/a n/a n/a
Writing 70 80 90
All Students 70-98=28 above 80-98=18 above 90-98= 8 above
African American n/a n/a n/a
Hispanic 70-99=29 above 80-99=19 above 90-99= 9 above
White 70-98=28 above 80-98=18 above 90-98= 8 above
Econ. Disadvantaged n/a n/a n/a
EDLD 5333 Leadership for Accountability Leanne Knight ET8025
Lamar University 12 of 14
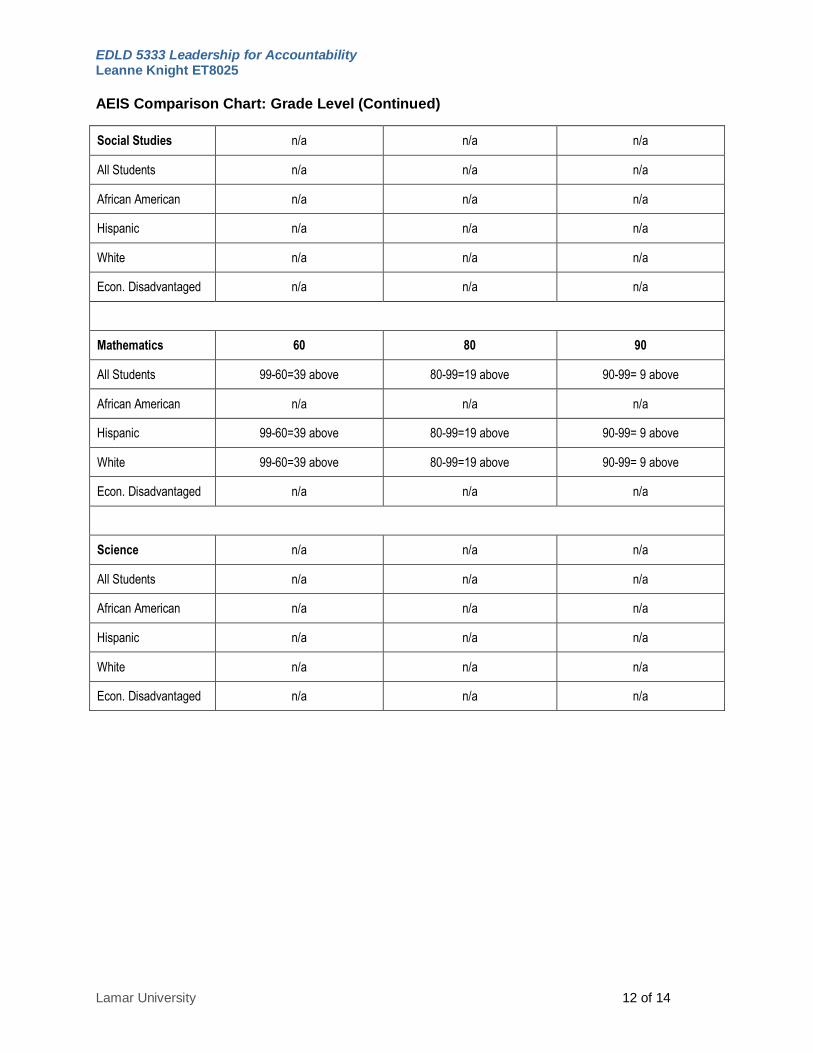
AEIS Comparison Chart: Grade Level (Continued)
Social Studies n/a n/a n/a
All Students n/a n/a n/a
African American n/a n/a n/a
Hispanic n/a n/a n/a
White n/a n/a n/a
Econ. Disadvantaged n/a n/a n/a
Mathematics 60 80 90
All Students 99-60=39 above 80-99=19 above 90-99= 9 above
African American n/a n/a n/a
Hispanic 99-60=39 above 80-99=19 above 90-99= 9 above
White 99-60=39 above 80-99=19 above 90-99= 9 above
Econ. Disadvantaged n/a n/a n/a
Science n/a n/a n/a
All Students n/a n/a n/a
African American n/a n/a n/a
Hispanic n/a n/a n/a
White n/a n/a n/a
Econ. Disadvantaged n/a n/a n/a
EDLD 5333 Leadership for Accountability Leanne Knight ET8025
Lamar University 13 of 14
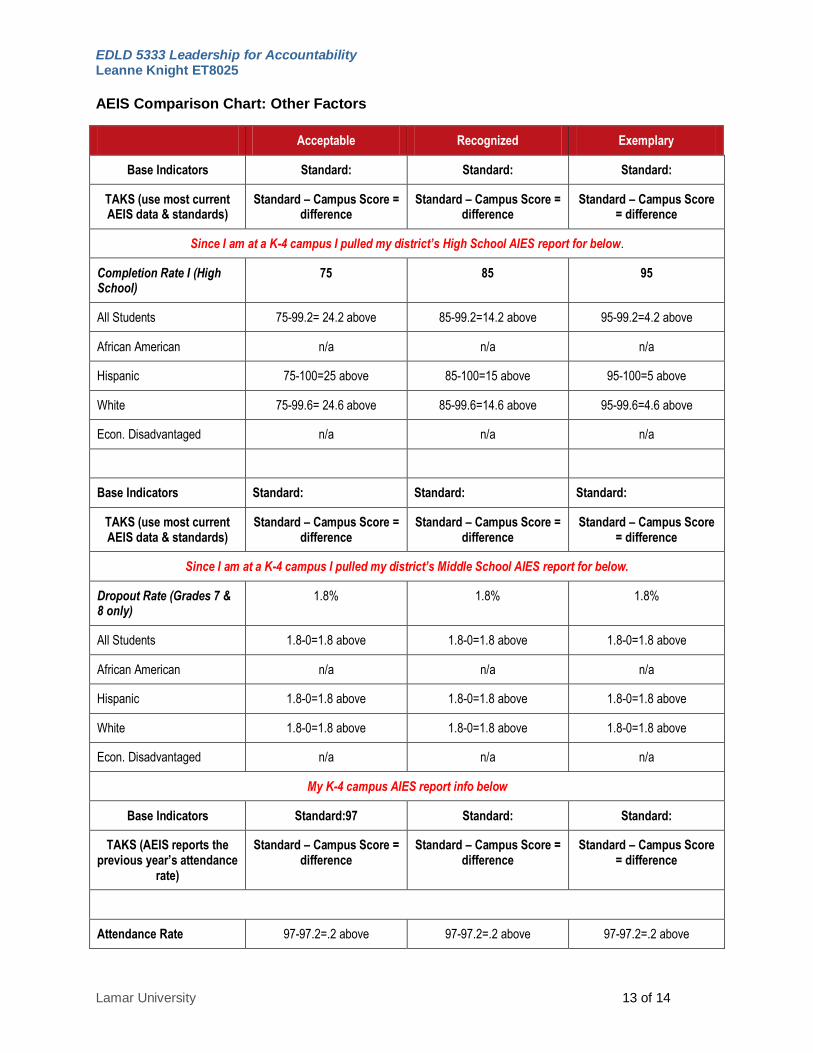
AEIS Comparison Chart: Other Factors
Acceptable Recognized Exemplary
Base Indicators Standard: Standard: Standard:
TAKS (use most current AEIS data & standards)
Standard – Campus Score = difference
Standard – Campus Score = difference
Standard – Campus Score = difference
Since I am at a K-4 campus I pulled my district’s High School AIES report for below.
Completion Rate I (High School)
75 85 95
All Students 75-99.2= 24.2 above 85-99.2=14.2 above 95-99.2=4.2 above
African American n/a n/a n/a
Hispanic 75-100=25 above 85-100=15 above 95-100=5 above
White 75-99.6= 24.6 above 85-99.6=14.6 above 95-99.6=4.6 above
Econ. Disadvantaged n/a n/a n/a
Base Indicators Standard: Standard: Standard:
TAKS (use most current AEIS data & standards)
Standard – Campus Score = difference
Standard – Campus Score = difference
Standard – Campus Score = difference
Since I am at a K-4 campus I pulled my district’s Middle School AIES report for below.
Dropout Rate (Grades 7 & 8 only)
1.8% 1.8% 1.8%
All Students 1.8-0=1.8 above 1.8-0=1.8 above 1.8-0=1.8 above
African American n/a n/a n/a
Hispanic 1.8-0=1.8 above 1.8-0=1.8 above 1.8-0=1.8 above
White 1.8-0=1.8 above 1.8-0=1.8 above 1.8-0=1.8 above
Econ. Disadvantaged n/a n/a n/a
My K-4 campus AIES report info below
Base Indicators Standard:97 Standard: Standard:
TAKS (AEIS reports the previous year’s attendance
rate)
Standard – Campus Score = difference
Standard – Campus Score = difference
Standard – Campus Score = difference
Attendance Rate 97-97.2=.2 above 97-97.2=.2 above 97-97.2=.2 above
EDLD 5333 Leadership for Accountability Leanne Knight ET8025
Lamar University 14 of 14
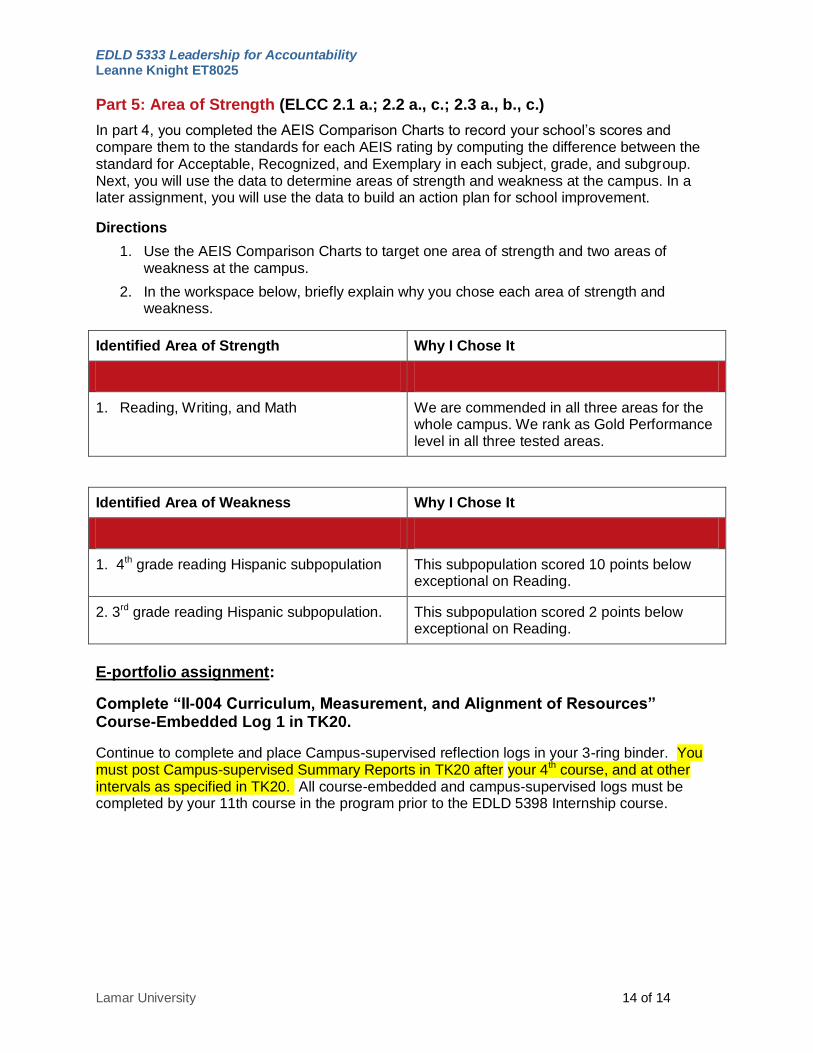
Part 5: Area of Strength (ELCC 2.1 a.; 2.2 a., c.; 2.3 a., b., c.)
In part 4, you completed the AEIS Comparison Charts to record your school’s scores and compare them to the standards for each AEIS rating by computing the difference between the standard for Acceptable, Recognized, and Exemplary in each subject, grade, and subgroup. Next, you will use the data to determine areas of strength and weakness at the campus. In a later assignment, you will use the data to build an action plan for school improvement.
Directions
1. Use the AEIS Comparison Charts to target one area of strength and two areas of weakness at the campus.
2. In the workspace below, briefly explain why you chose each area of strength and weakness.
Identified Area of Strength Why I Chose It
1. Reading, Writing, and Math We are commended in all three areas for the whole campus. We rank as Gold Performance level in all three tested areas.
Identified Area of Weakness Why I Chose It
1. 4th grade reading Hispanic subpopulation This subpopulation scored 10 points below exceptional on Reading.
2. 3rd grade reading Hispanic subpopulation. This subpopulation scored 2 points below exceptional on Reading.
E-portfolio assignment:
Complete “II-004 Curriculum, Measurement, and Alignment of Resources” Course-Embedded Log 1 in TK20.
Continue to complete and place Campus-supervised reflection logs in your 3-ring binder. You must post Campus-supervised Summary Reports in TK20 after your 4th course, and at other intervals as specified in TK20. All course-embedded and campus-supervised logs must be completed by your 11th course in the program prior to the EDLD 5398 Internship course.