week- 5 interest rates and stock market money and banking econ 311 thursday 7 - 9:45 instructor:...
TRANSCRIPT

Week- 5 Interest Rates and Stock Market
Money and Banking Econ 311Thursday 7 - 9:45
Instructor: Thomas L. Thomas

Response over Time to an Increase in Money Supply Growth

Risk Structure of Interest Rates
Bonds with the same maturity have different interest rates due to: Default risk Liquidity Tax considerations

Long-Term Bond Yields, 1919–2011
Sources: Board of Governors of the Federal Reserve System, Banking and Monetary Statistics, 1941–1970; Federal Reserve; www.federalreserve.gov/releases/h15/data.htm.

Risk Structure of Interest Rates (cont’d)
Default risk: probability that the issuer of the bond is unable or unwilling to make interest payments or pay off the face value U.S. Treasury bonds are considered default free
(government can raise taxes). Risk premium: the spread between the interest rates
on bonds with default risk and the interest rates on (same maturity) Treasury bonds

Bond Ratings by Moody’s, Standard and Poor’s, and Fitch

Risk Structure of Interest Rates (cont’d)
Liquidity: the relative ease with which an asset can be converted into cash Cost of selling a bond Number of buyers/sellers in a bond market
Income tax considerations Interest payments on municipal bonds are exempt
from federal income taxes.

Term Structure of Interest Rates
Bonds with identical risk, liquidity, and tax characteristics may have different interest rates because the time remaining to maturity is different
Yield curve: a plot of the yield on bonds with differing terms to maturity but the same risk, liquidity and tax considerations Upward-sloping: long-term rates are above
short-term rates Flat: short- and long-term rates are the same Inverted: long-term rates are below short-term rates

Facts that the Theory of the Term Structure of Interest Rates Must Explain
1. Interest rates on bonds of different maturities move together over time
2. When short-term interest rates are low, yield curves are more likely to have an upward slope; when short-term rates are high, yield curves are more likely to slope downward and be inverted
3. Yield curves almost always slope upward

Three Theories to Explain the Three Facts
1. Expectations theory explains the first two facts but not the third
2. Segmented markets theory explains fact three but not the first two
3. Liquidity premium theory combines the two theories to explain all three facts

Expectations Theory
The interest rate on a long-term bond will equal an average of the short-term interest rates that people expect to occur over the life of the long-term bond
Buyers of bonds do not prefer bonds of one maturity over another; they will not hold any quantity of a bond if its expected return is less than that of another bond with a different maturity
Bond holders consider bonds with different maturities to be perfect substitutes

Expectations Theory: Example
Let the current rate on one-year bond be 6%. You expect the interest rate on a one-year bond to
be 8% next year. Then the expected return for buying two one-year
bonds averages (6% + 8%)/2 = 7%. The interest rate on a two-year bond must be 7% for
you to be willing to purchase it.

Expectations Theory (cont’d)
Explains why the term structure of interest rates changes at different times
Explains why interest rates on bonds with different maturities move together over time (fact 1)
Explains why yield curves tend to slope up when short-term rates are low and slope down when short-term rates are high (fact 2)
Cannot explain why yield curves usually slope upward (fact 3)
Segmented Markets Theory
Bonds of different maturities are not substitutes at all The interest rate for each bond with a different maturity is
determined by the demand for and supply of that bond Investors have preferences for bonds of one maturity over
another If investors generally prefer bonds with shorter maturities
that have less interest-rate risk, then this explains why yield curves usually slope upward (fact 3)

Liquidity Premium & Preferred Habitat Theories
The interest rate on a long-term bond will equal an average of short-term interest rates expected to occur over the life of the long-term bond plus a liquidity premium that responds to supply and demand conditions for that bond
Bonds of different maturities are partial (not perfect) substitutes

Liquidity Premium Theory

Preferred Habitat Theory
Investors have a preference for bonds of one maturity over another
They will be willing to buy bonds of different maturities only if they earn a somewhat higher expected return
Investors are likely to prefer short-term bonds over longer-term bonds

The Relationship Between the Liquidity Premium (Preferred Habitat) and Expectations Theory


o Common Stock is the principal way that corporations raise equity capital
o Stockholders those who own stock – own an interest in the corporation proportional to the shares they own.
o The most important rights are the right to vote and to be a residual claimant of al the funds flowing into the firm (cash flows). (What do we mean by residual)
o Dividends are payments made periodically (usually quarterly to the stockholders (shareholders).
Stock

o A basic principal of finance is that the value of any investment is found by computing the present value of all cash flows that the investment will generate over its life. (How do we measure a corporation’s life from an investor’s point of view?)
o Similar to the net present value formula in chapter 4 the discounted cash flows on equity consists of one dividend payments and the final sales price.
=
Where P0 = the current price of the stock at the presentDiv1
= dividend paid at the end of year 1 = the required return on an equity investment
P1 = the price of the stock at the end of the period or the predicted sales price of the stock
Example assume the current price for a share of stock is $50. Also assume that the required return is 12% the dividend is $0.16 and the forecasted sales price is $60.00
= = $0.14 + $53.57 = $53.71
o Would you buy the stock?
One Period Valuation
The Generalized Dividend Valuation Model
1 20 1 2
0
01
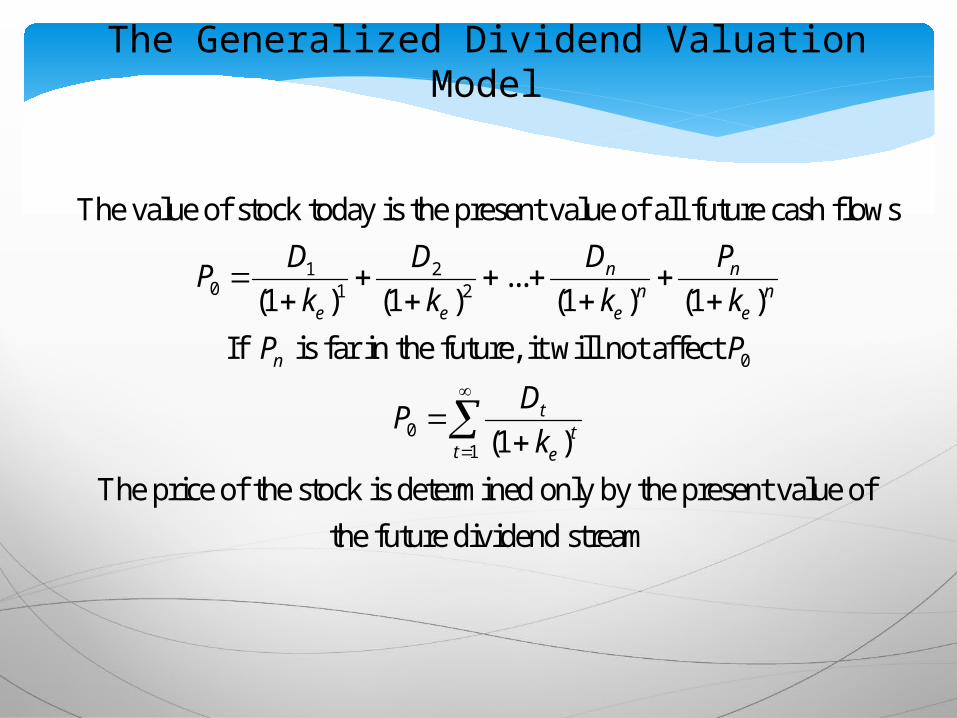
The value of stock today is the present value of all future cash flows
...(1 ) (1 ) (1 ) (1 )
If is far in the future, it will not affect
(1 )
The price of the
n nn n
e e e e
n
tt
t e
D PD DP
k k k k
P P
DP
k
stock is determined only by the present value of
the future dividend stream

The Gordon Growth Model

The Required Return (k)
Depends on
the risk-free rate (rf),
the return on the market (rm), and the stock's beta.

Relationship Between Risk and Required Return
2.0
1.51.00.5
20
15
10
5
k=3.5% +(10% - 3.5%)ß
B
A
Required Return (%)
Risk ß
1.8
0.8
8.7
15.2

Substitution of Cash Flow for Earnings and Dividends
Emphasis on firm’s ability to generate cash
May be applied when firm does not pay a dividend

How the Market Sets Prices
The price is set by the buyer willing to pay the highest price
The market price will be set by the buyer who can take best advantage of the asset
Superior information about an asset can increase its value by reducing its perceived risk
Information is important for individuals to value each asset.
When new information is released about a firm, expectations and prices change.
Market participants constantly receive information and revise their expectations, so stock prices change frequently
Application: The Global Financial Crisis and the Stock Market
Financial crisis that started in August 2007 led to one of the worst bear markets in 50 years.
Downward revision of growth prospects: ↓g. Increased uncertainty: ↑ke
Gordon model predicts a drop in stock prices. Explain why the formula suggests a drop in prices?

The Theory of Rational Expectations
Adaptive expectations: Expectations are formed from past experience only. Changes in expectations will occur slowly over time as data changes. However, people use more than just past data to form their expectations
and sometimes change their expectations quickly.
Expectations will be identical to optimal forecasts using all available information
Even though a rational expectation equals the optimal forecast using all available information, a prediction based on it may not always be perfectly accurate It takes too much effort to make the expectation the best guess possible
Best guess will not be accurate because predictor is unaware of some relevant information
This is due to What???????

Formal Statement of the Theory
expectation of the variable that is being forecast
= optimal forecast using all available information
e of
e
of
X X
X
X

Rationale Behind the Theory
The incentives for equating expectations with optimal forecasts are especially strong in financial markets. In these markets, people with better forecasts of the future get rich.
The application of the theory of rational expectations to financial markets (where it is called the efficient market hypothesis or the theory of efficient capital markets) is thus particularly useful

Implications of the Theory
If there is a change in the way a variable moves, the way in which expectations of the variable are formed will change as well Changes in the conduct of monetary policy (e.g. target the
federal funds rate)
The forecast errors of expectations will, on average, be zero and cannot be predicted ahead of time.
The Efficient Market Hypothesis: Rational Expectations in Financial Markets
1
Recall
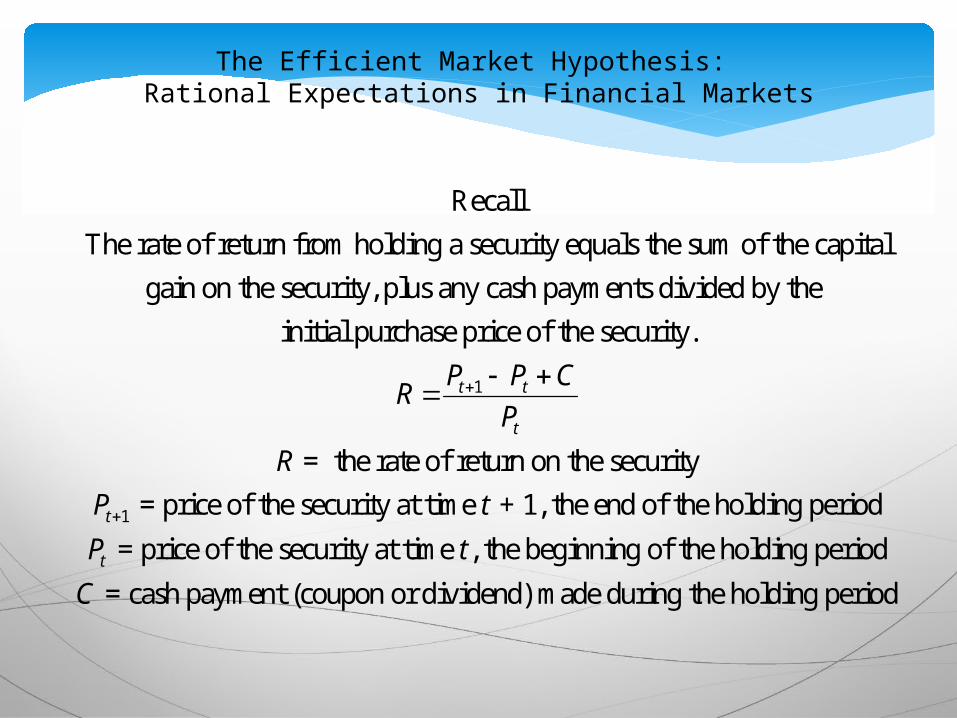
The rate of return from holding a security equals the sum of the capital
gain on the security, plus any cash payments divided by the
initial purchase price of the security.
= the r
t t
t
P P CR
P
R
1
ate of return on the security
= price of the security at time + 1, the end of the holding period
= price of the security at time , the beginning of the holding period
= cash payment (coupon
t
t
P t
P t
C
or dividend) made during the holding period

The Holding Period Return (HPR)
The percentage earned on an investment during a period of time
HPR = P1 + D - P0
P0
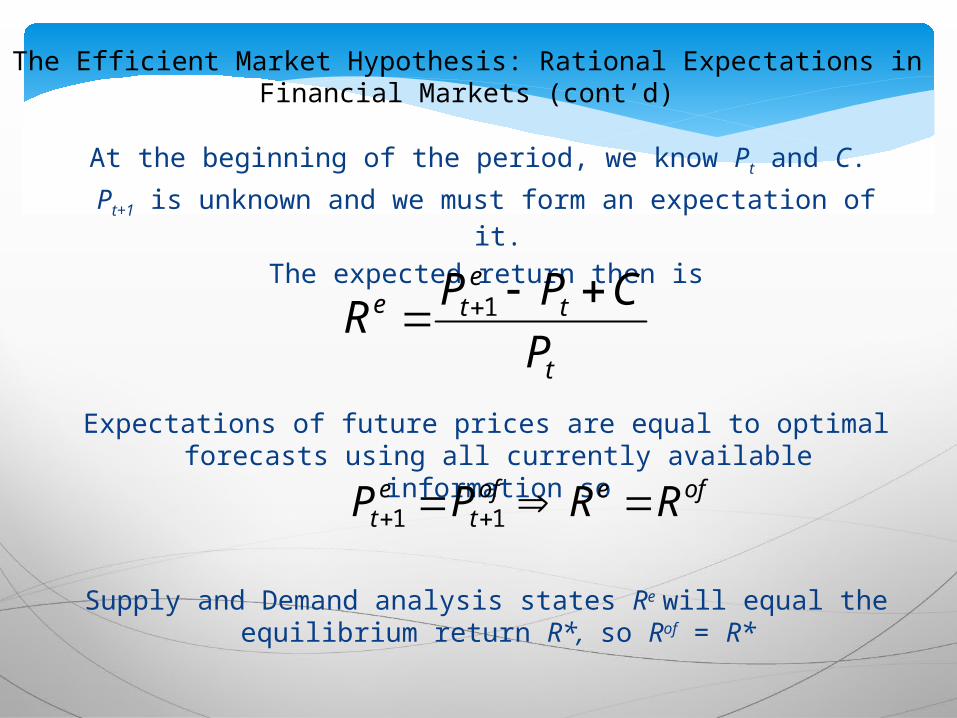
The Efficient Market Hypothesis: Rational Expectations in Financial Markets (cont’d)
At the beginning of the period, we know Pt and C.
Pt+1 is unknown and we must form an expectation of it.
The expected return then is
Expectations of future prices are equal to optimal forecasts using all currently available information so
Supply and Demand analysis states Re will equal the equilibrium return R*, so Rof = R*
t
te
te
P
CPPR
1
ofeoft
et RRPP 11
Why the Efficient Market Hypothesis Does Not Imply that Financial Markets are Efficient
Some financial economists believe all prices are always correct and reflect market fundamentals (items that have a direct impact on future income streams of the securities) and so financial markets are efficient
However, prices in markets like the stock market are unpredictable- This casts serious doubt on the stronger view that financial markets are efficient
The Efficient Market Hypothesis
Hard to beat the market on a risk-adjusted basis consistently
Earning a higher return is not necessarily outperforming the market.
Considering risk is also important.

Assumptions Concerning Efficient Markets
Large number of competing participants
Information is readily available.
Transaction costs are small.

Random Walk
Another term for efficient markets
Does not imply security prices are randomly determined.
Implies day-to-day price changes are random

Random Walk
Successive prices changes are independent. Today's price does not forecast tomorrow's
price. Current price embodies all known
information. Prices quickly change in response to new
information By the time most investors know the
information, the price change has already occurred

Rationale Behind the Hypothesis

Implications of Efficient Markets
Security prices embody known information. The playing field is level. Specifying financial goals may be more
important than seeking undervalued stocks.

Degree of Market Efficiency
The forms of the efficient market hypothesis: the weak form the semi-strong form the strong form

The Weak Form
Studying past price and volume data will not lead to superior investment results.
While the weak form suggests that using price data will not produce superior results, using financial analysis may produce superior returns.

The Semi-Strong Form
Studying economic and accounting data will not lead to superior investment returns.
Studying inside information may lead to superior returns.

The Strong Form
Using inside information will not lead to superior investment returns.
Anomalies
Empirical results generally support: the weak form, and the semi-strong form.
Possible exceptions to the efficient market hypothesis, called anomalies, appear to exist.

Anomalies and Returns
Empirical evidence of the existence of an anomaly does not mean the individual can take advantage of the anomaly.
The anomaly can still exist and the market be effectively efficient from the individual investor's perspective.

How Valuable are Published Reports by Investment Advisors?
Information in newspapers and in the published reports of investment advisers is readily available to many market participants and is already reflected in market prices
So acting on this information will not yield abnormally high returns, on average
The empirical evidence for the most part confirms that recommendations from investment advisers cannot help us outperform the general market

Efficient Market Prescription for the Investor
Recommendations from investment advisors cannot help us outperform the market
A hot tip is probably information already contained in the price of the stock
Stock prices respond to announcements only when the information is new and unexpected
A “buy and hold” strategy is the most sensible strategy for the small investor