week of february 20, 2018 weekly relative · pdf fileweekly relative value tom slefinger is...
TRANSCRIPT
Weekly Relative Value
Tom Slefinger is Senior Vice President, Director of Institutional Fixed Income Sales at Balance Sheet Solutions.
www.balancesheetsolutions.org
Will the Economic Recovery Die of Old Age?
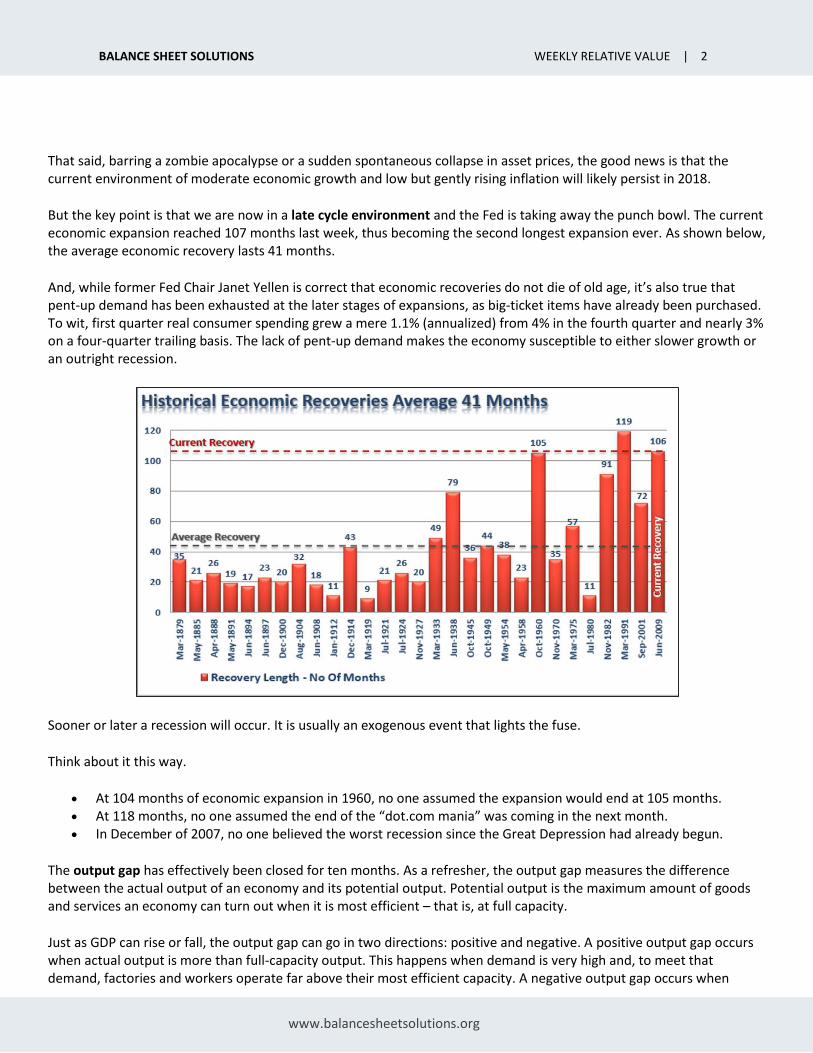
Many credit unions have been hearing and reading about the strength of the economy, the lack of recession on the horizon and the Fed’s track to increase the federal funds rates for the next two years. That view is widely based on recent commentary from Wall Street and Federal Reserve members. That view is also embedded in the so-called “dot plot,” which shows the median projections of the Federal Open Market Committee. As one can glean from the graph below, the Fed is expected to increase the federal funds rate into next year, with rates reaching 3% by mid-2020.
Should I Follow the Dots?
In other words, the Fed sees nothing but blue skies ahead. But let’s face it – how can 12 men in the Eccles Building know the future? Spoiler: They don’t! Fed Chair Jerome Powell and company do not have a crystal ball. In fact, Chairman Powell recently commented that these dot projections are nothing more than “assumptions.” And as a reminder, the Fed has one of the worst forecasting records on Planet Earth. In the past 13 rate hike cycles since 1950, 10 have led to a recession. Folks, 77% of the time the Fed has raised rates until something breaks.
WEEK OF MAY 7, 2018
THIS WEEK… • Slower Growth, Higher
Inflation & a More Aggressive Fed
PORTFOLIO STRATEGY • Market Outlook Insights
• Is Cash King?
“I think it's a myth that expansions die of old age… So, the fact that this has been quite a long expansion doesn’t lead me to believe that… its days are numbered.”
– Former Federal Reserve Chair Janet Yellen, December 16, 2015
BALANCE SHEET SOLUTIONS WEEKLY RELATIVE VALUE | 2
www.balancesheetsolutions.org
That said, barring a zombie apocalypse or a sudden spontaneous collapse in asset prices, the good news is that the current environment of moderate economic growth and low but gently rising inflation will likely persist in 2018.
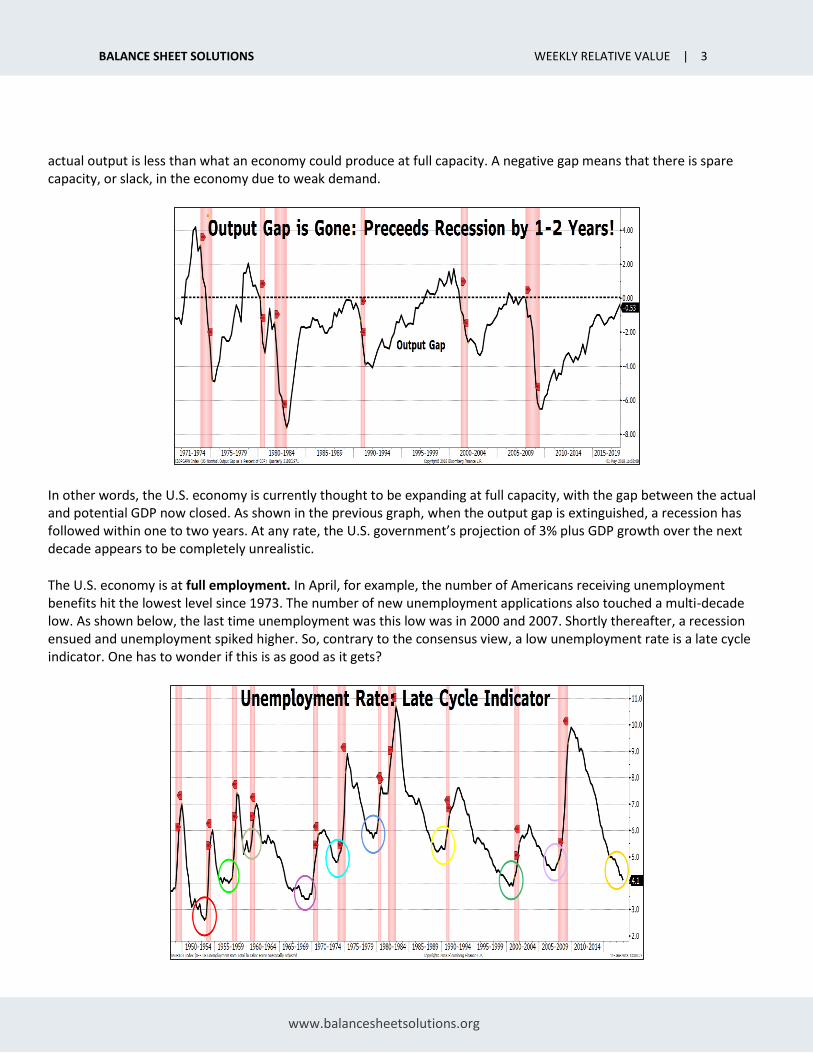
But the key point is that we are now in a late cycle environment and the Fed is taking away the punch bowl. The current economic expansion reached 107 months last week, thus becoming the second longest expansion ever. As shown below, the average economic recovery lasts 41 months.
And, while former Fed Chair Janet Yellen is correct that economic recoveries do not die of old age, it’s also true that pent-up demand has been exhausted at the later stages of expansions, as big-ticket items have already been purchased. To wit, first quarter real consumer spending grew a mere 1.1% (annualized) from 4% in the fourth quarter and nearly 3% on a four-quarter trailing basis. The lack of pent-up demand makes the economy susceptible to either slower growth or an outright recession.
Sooner or later a recession will occur. It is usually an exogenous event that lights the fuse.
Think about it this way.
• At 104 months of economic expansion in 1960, no one assumed the expansion would end at 105 months. • At 118 months, no one assumed the end of the “dot.com mania” was coming in the next month. • In December of 2007, no one believed the worst recession since the Great Depression had already begun.
The output gap has effectively been closed for ten months. As a refresher, the output gap measures the difference between the actual output of an economy and its potential output. Potential output is the maximum amount of goods and services an economy can turn out when it is most efficient – that is, at full capacity.
Just as GDP can rise or fall, the output gap can go in two directions: positive and negative. A positive output gap occurs when actual output is more than full-capacity output. This happens when demand is very high and, to meet that demand, factories and workers operate far above their most efficient capacity. A negative output gap occurs when
BALANCE SHEET SOLUTIONS WEEKLY RELATIVE VALUE | 3
www.balancesheetsolutions.org
actual output is less than what an economy could produce at full capacity. A negative gap means that there is spare capacity, or slack, in the economy due to weak demand.
In other words, the U.S. economy is currently thought to be expanding at full capacity, with the gap between the actual and potential GDP now closed. As shown in the previous graph, when the output gap is extinguished, a recession has followed within one to two years. At any rate, the U.S. government’s projection of 3% plus GDP growth over the next decade appears to be completely unrealistic.
The U.S. economy is at full employment. In April, for example, the number of Americans receiving unemployment benefits hit the lowest level since 1973. The number of new unemployment applications also touched a multi-decade low. As shown below, the last time unemployment was this low was in 2000 and 2007. Shortly thereafter, a recession ensued and unemployment spiked higher. So, contrary to the consensus view, a low unemployment rate is a late cycle indicator. One has to wonder if this is as good as it gets?

BALANCE SHEET SOLUTIONS WEEKLY RELATIVE VALUE | 4
www.balancesheetsolutions.org
We are now witnessing late cycle inflationary pressures.
The Employment Cost Index is accelerating notably, and all 10 industries saw their growth rates gain steam in the first quarter. This is a far more relevant measure than average hourly earnings. On top of that, manufacturing prices paid are at a seven-year high, backlogs at a 14-year high, and vendor delivery delays are moving back above the 61 level. These are all signs that we are witnessing bottleneck pressures and capacity strains.
The personal consumption expenditures (PCE) deflator (the Fed’s preferred inflation metric) is already at 2%, and above the Fed’s year-end forecast of 1.9%. Indeed, the 0.2% gain in wages and salary income in March was absorbed by rising prices, leaving real work-based earnings stagnant in real (core inflation-adjusted) terms. (Hence the “stag” before the “flation.”) And stagflation pinches consumer pocketbooks as inflation eats into nominal wage growth.
The core rate is 1.9%, which puts the 1.625% funds rate into perspective. Look at the graph below. The spread between fed funds and the core PCE has been negative since 2008. Today, it is still negative. This has never occurred at any time in recorded history so late in the cycle. In other words, monetary policy has never been more accommodative. And despite the recent rate hikes, the Fed remains extremely accommodative.
This is noteworthy especially for those of us (myself included) who have clung to the low inflation view for so long. That story will come back at some point, but for now it is clearly out of vogue.
The risks of a cyclical inflation overshoot in 2018 are rising given the additional fiscal stimulus, recent rises in commodity prices and super-easy financial conditions. Global structural forces are still weighing down inflation, but the cyclical pressures are clearly on the up.
Is the Fed Behind the Curve?

BALANCE SHEET SOLUTIONS WEEKLY RELATIVE VALUE | 5
www.balancesheetsolutions.org
SLOWER GROWTH, FASTER INFLATION & A MORE AGGRESSIVE FED
The economic recovery to date has been based on increased levels of debt and lower interest rates to spur growth. But that is changing fast as the Fed has become much more hawkish. The Fed has told us that the optimal funds rate for an economy that is fully employed and characterized by price stability is just under 3%. According to that formula, that means at least five more hikes.
So, what happens when rates rise?
1. The cost of servicing debt reduces future productive investment. 2. Corporate capital expenditures are dependent on borrowing costs. 3. Corporate share buyback plans, a major driver of asset prices, and dividend issuances have been done using
cheap debt. 4. Higher borrowing costs lead to lower profit margins for corporations. 5. Housing is negatively impacted. People buy payments, not houses, and rising rates mean higher
payments. Higher rates combined with record-high home prices are not a good combination. That trend will “make the median starter home unaffordable.”
6. Consumers are impacted by higher borrowing rates. 7. Zombie companies will feel the pain. The leveraged loan market has surpassed $1 trillion in size for the first time
and is beginning to rival the entire public non-investment-grade market. UBS research estimates that we are just three more Fed rate hikes away from a serious era of rising defaults and delinquencies.
“What if marginal interest expense pressures are the true recession signal [cause of economic weakness] and the yield curve is just a correlated input to that process? If so, for the first time, the Fed is hiking into what is already the
most hostile refit period in 35-years.” – Donald Swain, CFA
BALANCE SHEET SOLUTIONS WEEKLY RELATIVE VALUE | 6
www.balancesheetsolutions.org
As rates continue to rise in an extremely leveraged economy, they ultimately act as a “brake” on economic activity. As shown in the previous graph, in a heavily leveraged economy, the change in interest expense has been a good predictor of economic weakness. (Red shaded areas denote recessions.)
History suggests that most recessions occur three years after the hiking process has commenced. With the Fed continuing to hike rates in the U.S., tightening monetary conditions, the previous three-year time horizon is now substantially shorter. More importantly, the “average” timeframe between an initial rate hike and recession was based on economic growth rates, which were substantially higher than they are currently.
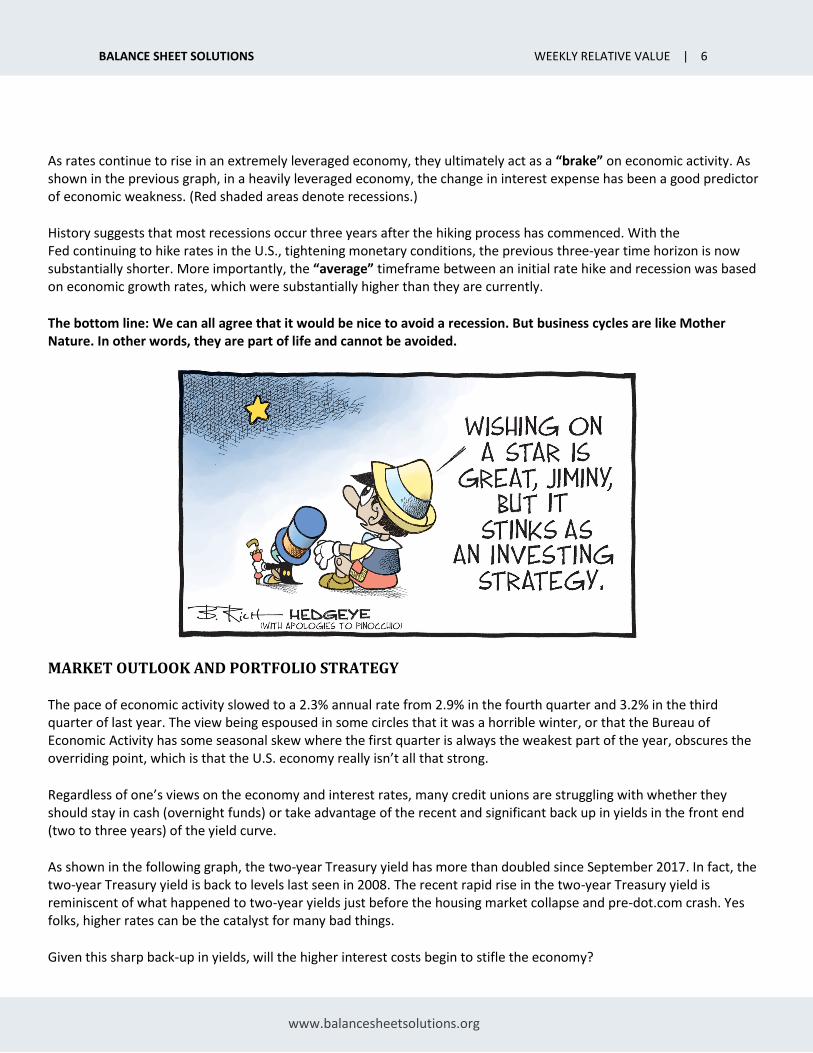
The bottom line: We can all agree that it would be nice to avoid a recession. But business cycles are like Mother Nature. In other words, they are part of life and cannot be avoided.
MARKET OUTLOOK AND PORTFOLIO STRATEGY
The pace of economic activity slowed to a 2.3% annual rate from 2.9% in the fourth quarter and 3.2% in the third quarter of last year. The view being espoused in some circles that it was a horrible winter, or that the Bureau of Economic Activity has some seasonal skew where the first quarter is always the weakest part of the year, obscures the overriding point, which is that the U.S. economy really isn’t all that strong.
Regardless of one’s views on the economy and interest rates, many credit unions are struggling with whether they should stay in cash (overnight funds) or take advantage of the recent and significant back up in yields in the front end (two to three years) of the yield curve.
As shown in the following graph, the two-year Treasury yield has more than doubled since September 2017. In fact, the two-year Treasury yield is back to levels last seen in 2008. The recent rapid rise in the two-year Treasury yield is reminiscent of what happened to two-year yields just before the housing market collapse and pre-dot.com crash. Yes folks, higher rates can be the catalyst for many bad things.
Given this sharp back-up in yields, will the higher interest costs begin to stifle the economy?
BALANCE SHEET SOLUTIONS WEEKLY RELATIVE VALUE | 7
www.balancesheetsolutions.org
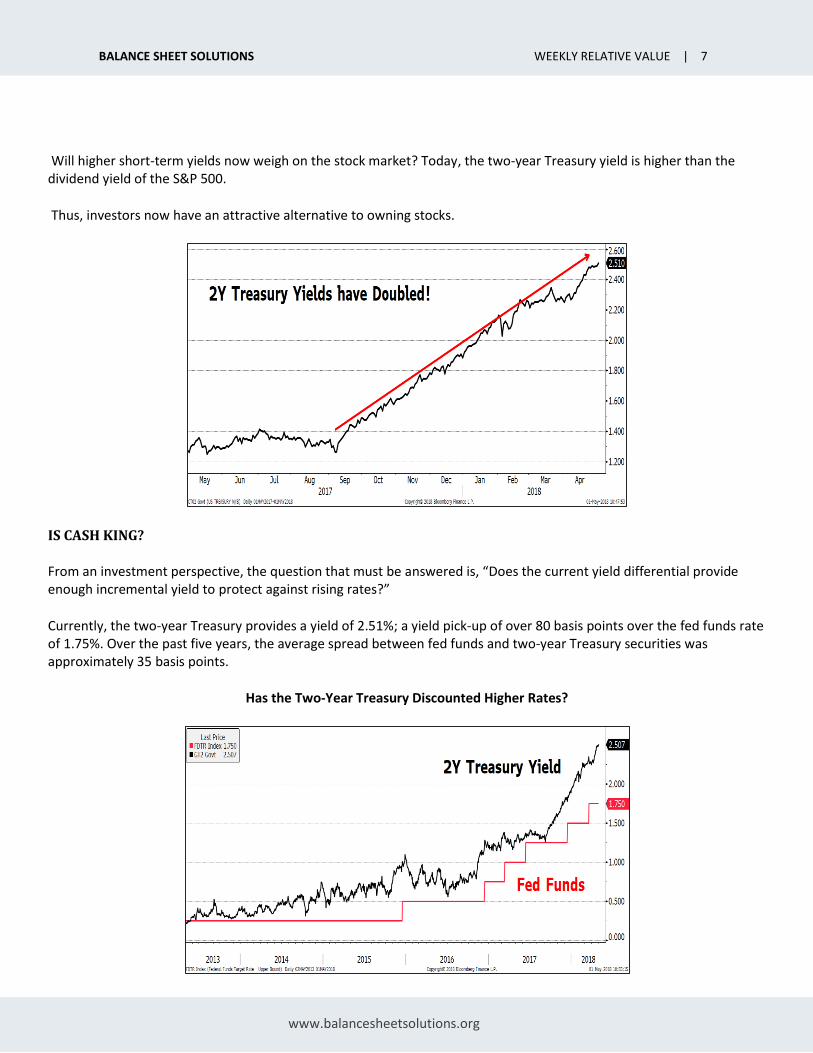
Will higher short-term yields now weigh on the stock market? Today, the two-year Treasury yield is higher than the dividend yield of the S&P 500.
Thus, investors now have an attractive alternative to owning stocks.
IS CASH KING?
From an investment perspective, the question that must be answered is, “Does the current yield differential provide enough incremental yield to protect against rising rates?”
Currently, the two-year Treasury provides a yield of 2.51%; a yield pick-up of over 80 basis points over the fed funds rate of 1.75%. Over the past five years, the average spread between fed funds and two-year Treasury securities was approximately 35 basis points.
Has the Two-Year Treasury Discounted Higher Rates?

BALANCE SHEET SOLUTIONS WEEKLY RELATIVE VALUE | 8
www.balancesheetsolutions.org
But the Fed has all but guaranteed that they will be raising rates further. So, what’s the hurry, right?
Maybe things are not as obvious as they look. Let’s run a total rate of return analysis.
In the following scenario we assume the conventional wisdom holds true and the Fed does, indeed, steadily hike rates by 175 basis points over the next 24 months. Using this assumption, the comparative total returns of a two-year Agency security versus holding fed funds over a two-year time horizon are plotted below. The results may be surprising.
As one can quickly glean from the table – even if the Fed hikes rates as projected – the two-year Treasury will generate a holding period return of 5.13% versus a holding period return of 3.72% from fed funds.
If you were to invest in higher-yielding securities, (i.e. bank notes), the relative advantage of investing in the two-year part of the yield curve would increase further (5.70% vs. 3.72%).
But let’s take a contrarian perspective. As we enter the late innings of the economic expansion, (let’s call it the bottom of the seventh) what happens if the conventional wisdom does not hold true?
What if we have reached peak growth? What if the “everything bubble” (i.e. stocks, high-yield, commercial real estate, etc.) bursts? What if China slows? What if…
The Fed would be quick to abandon its rate hiking process and targets.
And if the Fed halts its rate hikes and moves to “neutral” or starts “reducing” rates, owning the two-year part of the curve, today would prove quite prescient and rewarding.
Obviously, there are no guarantees what will happen in the future. However, based on the total return analysis, one could conclude that investors are being compensated for investing in the two-year part of the yield curve today even if the Fed continues to hike rates into the future. In other words, two-year Treasuries and bank notes offer an attractive risk-return trade-off versus staying in overnight funds.
Total Rate of Return Analysis
Total Return (24 mons)
2Y Treasuries 5.13%
2Y Bank Notes 5.70
Fed Funds* 3.72%
*Federal funds rate increases 175 basis points:
• 25 basis points in June 2018
• 25 basis points in December 2018
• 25 basis points in March 2019
• 25 basis points in June 2019
• 25 basis points in December 2019
• 25 basis points in March 2020
• 25 basis points in June 2020

BALANCE SHEET SOLUTIONS WEEKLY RELATIVE VALUE | 9
www.balancesheetsolutions.org
Note: Registration is now open for the 2018 Credit Union Executive Leadership Symposium, September 5-7 at the Westin River North in Chicago, IL! You will hear from a wide range of speakers, including NFL Legend Mike Ditka, “The Attitude Guy” Sam Glenn, as well as credit union industry experts. Plus, back by popular demand, CUNA Mutual’s Steven Rick and Balance Sheet Solutions’ Tom Slefinger will battle it out in another round of “Dueling Market Views.” Please visit alloyacorp.org/symposium2018 to view to view the agenda and to register.
MORE INFORMATION
In terms of relative value, please see the Relative Value Analysis.
For more information about credit union investment strategy, portfolio allocation and security selection, please contact the author at [email protected] or (800) 782-2431, ext. 2753.
Tom Slefinger, Senior Vice President, Director of Institutional Fixed Income Sales, and Registered Representative of ISI, has more than 30 years of fixed income portfolio management experience. He has developed and successfully managed various high profile domestic and global fixed income mutual funds. Tom has extensive expertise in trading and managing virtually all types of domestic and foreign fixed income securities, foreign exchange and derivatives in institutional environments.
At Balance Sheet Solutions, Tom is responsible for developing and managing operations associated with institutional fixed income sales. In addition to providing strategic direction, Tom is heavily involved in analyzing portfolios, developing investment portfolio strategies and identifying appropriate sectors and securities with the goal of optimizing investment portfolio performance at the credit union level.
Information contained herein is prepared by ISI Registered Representatives for general circulation and is distributed for general information only. This information does not consider the specific investment objectives, financial situations or needs of any specific individual or organization that may receive this report. Neither the information nor any opinion expressed constitutes an offer, or an invitation to make an offer, to buy or sell any securities. All opinions, prices, and yields contained herein are subject to change without notice. Investors should understand that statements regarding prospects might not be realized. Please contact Balance Sheet Solutions to discuss your specific situation and objectives.