welcome to the new - canadian pacific · pdf filethe new cp. we’ve driven ... of 1995...
TRANSCRIPT

INVESTOR FACT BOOK 2014
WELCOME TO THE NEW

A leaner fleet, infrastructure and
workforce working harder to deliver
more. This is the key concept behind
the new CP. We’ve driven continuous
rapid improvement across all platforms.
We’re operating more efficiently with
less; we’re more agile; we’re faster;
and, we’re creating more service
offerings in areas we’re now competitive
in. Our growth is coming to life with
increasing speed and it’s opening a
whole new world of opportunity.
WELCOME TO THE NEW CP


This Investor Fact Book contains certain forward-looking information within the meaning of the United States Private Securities Litigation Reform Act of 1995 and under Canadian Securities laws. This forward looking information relates, but not limited, to Canadian Pacifi c’s operations, priorities and plans, anticipated fi nancial performance, business prospects, planned capital expenditures, programs, strategies and fi nancial guidance. This forward-looking information also includes, but is not limited to, statements concerning expectations, beliefs, plans, goals, objectives, assumptions and statements about possible future events, conditions, and results of operations or performance.
Forward-looking information may contain statements with words such as “anticipate”,
“believe”, “expect”, “plan” or similar words suggesting future outcomes.
By its nature, CP’s forward-looking information involves numerous assumptions, inherent risks and uncertainties that could cause actual results to differ materially from the forward-looking information, including but not limited to the following factors:
changes in business strategies; general North American and global economic, credit and business conditions; risks in agricultural production such as weather conditions and insect populations; the availability and price of energy commodities; the effects of competition and pricing pressures; industry capacity; shifts in market demand; changes in commodity prices; uncertainty surrounding timing and volumes of commodities being shipped by CP; infl ation; changes in laws and regulations, including regulation of rates; changes in taxes and tax rates; potential increases in maintenance and operating costs; uncertainties of investigations, proceedings or other types of claims and litigation; labour disputes; risks and liabilities arising from derailments; transportation of dangerous goods; timing of completion of capital and maintenance projects; currency and interest rate fl uctuations; effects of changes in market conditions and discount rates on the fi nancial position of pension plans and investments, including long-term fl oating rate notes; and various events that could disrupt operations, including severe weather, droughts, fl oods, avalanches and earthquakes as well as security threats and
governmental response to them, and technological changes.
Undue reliance should not be placed on forward-looking information as actual results may differ materially from the forward-looking information. Forward-looking information is not a guarantee of future performance.
The foregoing list of factors is not exhaustive. These and other factors are detailed from time to time in reports fi led by CP with securities regulators in Canada and the United States. Reference should be made to “Management’s Discussion and Analysis” in CP’s annual and interim reports, Annual Information Form and Form 40-F.
Readers are cautioned not to place undue reliance on forward-looking information. Forward-looking information is based on current expectations, estimates and projections and it is possible that predictions, forecasts, projections, and other forms of forward-looking information will not be achieved by CP. Except as required by law, CP undertakes no obligation to update publicly or otherwise revise any forward-looking information, whether as a result of new information, future events or otherwise.
FORWARD LOOKING INFORMATION

TABLE OF CONTENTS
LETTER FROM THE CEO 4
COMPANY PROFILE 6
PERFORMANCE 18
NETWORK 20
LINES OF BUSINESS 34
Bulk 36 Merchandise 58 Intermodal 84
INVESTOR FOCUS 92
Capital Expenditures 92 Information Technology 96 Regulatory 98 Labour Relations 100 Driving Shareholder Value 102
APPENDIX 104
3

At CP, we’ve strengthened our operations and attitude company wide.
We’re no longer catching up, but setting the pace. And being in the front
means having the best vantage point for seizing opportunities fi rst.
I see no end to our runway. Because we’re the ones building it. There is no resting on our laurels and past success. We want to continually change the expectations of what it means to be great railroaders. We’re not just looking to be the best; we want to redefi ne what that word means each year. This Investor Fact Book allows us to tell you how our new attitude applies to all areas of our business, from top to bottom. And, importantly, this book shows how we’re building a stronger more successful company for the long-term.
Our transformation over the last two years has been nothing short of remarkable. We’ve dramatically improved
the operating performance of the company; our operating ratio is approaching industry best; and, we’ve generated signifi cant value for shareholders. But the journey is far from over. We have been investing in our future – rebuilding the network from the ground up – to operate safer, more effi ciently and add valuable capacity. We continue to build and develop a strong team of leaders with a railroader mindset and a culture of clear accountability.
Combined with an improved cost structure and service offering, we are poised for the next phase of our journey: accelerated growth. By leveraging the top line opportunities with further
margin improvement, we’ll drive further earnings growth and free cash fl ow generation which will enable us to continue to reward shareholders.
Our hope is that this book will serve as a valuable resource in understanding the markets we serve, the strengths of our franchise, our operating philosophy and the tremendous opportunity ahead of us.
Sincerely,
E. Hunter HarrisonChief Executive Offi cer
SETTING THE PACE
4 | INVESTOR FACT BOOK 2014
LETTER FROM THE CEO

We are poised for the next phase of our journey: accelerated growth.”E. Hunter Harrison
5

We are able to extend our network reach through alliances and connections with other major Class 1 railroads in North America. This allows us to provide competitive services and access to markets across North America beyond our own rail network. We are able to provide service to markets in Europe and the Pacifi c Rim through direct access to Port of Montreal and Port Metro Vancouver, respectively. Our network in the U.S. Northeast also allows us to access the ports of Philadelphia and New York.
We are driving change as we move through our transformational journey to become North America’s best performing rail carrier, while creating long-term value for shareholders. We are focused on providing customers with industry leading rail service, optimizing our assets, and
reducing costs while remaining a leader in rail safety.
We fi nished 2013 with a full year operating ratio of 69.9%, an improvement of 710 basis points. For 2014, we expect to have a mid-60s operating ratio – two years ahead of our original schedule.
Headquartered in Calgary, Alberta, CP is a transcontinental railroad
in Canada and the United States providing logistics and supply
chain expertise. Our 15,000 employees provide rail and intermodal
transportation services across a network of approximately 13,700 miles,
serving the principal business centres of Canada, the U.S. Midwest and
U.S. Northeast.
A SERVICE-DRIVEN RAILROAD
We are driving change as we move through our transformational journey to become North America’s best performing rail carrier.
6 | INVESTOR FACT BOOK 2014
COMPANY PROFILE

PROVIDE SERVICEDelivering effi cient and consistent service is essential. We promise only what we can do, and we always do what we have promised.
CONTROL COSTSControlling and removing unnecessary costs from the organization, eliminating bureaucracy and continuing to identify productivity enhancements are the keys to success.
OPTIMIZE ASSETSThrough longer sidings, improved asset utilization, and increased train lengths, we are moving increased volumes with fewer locomotives and railcars while unlocking capacity for future growth potential.
DEVELOP PEOPLEWe recognize none of the other foundations can be achieved without our people. Every employee is a railroader and we are shaping a new culture focused on a passion for service with integrity in everything we do.
OPERATE SAFELYEach year, we safely move millions of carloads of freight across North America while ensuring the safety of our people and the communities through which we operate. Safety is never to be compromised.
Our strategy is based on fi ve foundations
7

We can offer a superior product to a range of shippers who have previously turned to trucking or other carriers.
8 | INVESTOR FACT BOOK 2014
COMPANY PROFILE

DOMESTIC INTERMODAL
Time is critical when your business is on the line. To succeed, our customers need their goods on shelves, not en route – and they need to get it there fi rst. We’ve cut 20 hours off of our regular Toronto-Calgary intermodal service, making it the fastest service available. The result: volumes in this corridor are up 27% year-over-year as more Canadian businesses are taking advantage of our industry-leading service to become more competitive and grow their bottom lines.
COAL SUPPLY CHAIN
Existing customers benefi t, too. Improvements in asset velocity and effi ciency are creating win-win opportunities for both our company and existing customers to move more product with fewer cars, reduce down time and increase loading capacity. We’re converting performance into margin expansion and market share gains for all parties in the supply chain.
We’ve reduced coal transit times by 12.5 hours – enabling our long-time customer, Teck Resources, to get their products to market faster and have greater capacity to grow their business.
STRATEGY
With more reliable and effi cient service, we can offer a superior product to a range of shippers who have previously turned to trucking or other carriers. We are working to leverage our network strengths and service performance to replicate our intermodal offering in other key markets and expand our approach to the merchandise segments such as steel, aggregates, chemicals, and automotive.
Delivering good service is the fi rst key. Doing what we say we’ll do
is essential to making CP the most reliable rail service in the market.
PROVIDE SERVICE
At CP, my job is all about moving customers’ products from one place to another and making sure the work is done safely and quickly.“
Suresh Kumar Harish – Conductor, Winnipeg Yard
9

HEAD OFFICE RELOCATION
We are continuing to drive an operating focus through the organization. A key step in that culture change has been the relocation of the company’s headquarters from a downtown Calgary corporate offi ce building to our Ogden Rail Yard. The result: $20 million in annual lease cost savings and a renewed focus on what matters most – the railroad.
INSOURCING I.T.
For the past decade, our information systems have been largely developed and supported by outsourced resources. We’re looking to simplify, modernize and insource key IT functions; build in-house expertise; and, remove dependencies on third-parties. This will allow our IT team to respond faster and at a signifi cantly lower cost.
STRATEGY
There is no shortage of opportunities across the network to improve operational effi ciency and drive out costs. A strategic emphasis on continuous improvement and an aggressive, ongoing focus on productivity in every corner of the business will bear fruit for years to come.
Being a low-cost provider combined with great service is an unbeatable
combination. We look at every cost, even small items, to improve.
CONTROL COSTS
My team and I provide the paperwork the train crews are required to have in order to move trains. Controlling costs is a regular part of our day-to-day activities, right down to our customer contact, inventory and job performance.“
Heather Hanna – Director, Network Services Operations
10 | INVESTOR FACT BOOK 2014
COMPANY PROFILE
There is no shortage of opportunities to improve operational effi ciency.
11

We will move increased volumes with fewer locomotives and railcars.
12 | INVESTOR FACT BOOK 2014
COMPANY PROFILE

OPTIMIZING OUR FLEET
We continue to streamline our asset base, resulting in signifi cantly fewer locomotives and more than 10,000 fewer railcars. These surplus assets have generated more than $17 million in scrap metal, saved $30 million in annual lease charges, and enabled our company to earn rental income through the sublease of 75 high-horsepower locomotives to another rail carrier. The opportunities don’t stop there. Dramatic improvements to cash fl ow generation also enable us to
optimize our balance sheet and further reduce expense savings as we buy out leases on core assets.
TAKING A HARD LOOK AT THE NETWORK
We are developing a network that provides customers with the best possible service at the lowest possible cost. That means carefully assessing the entire network for other opportunities to optimize our track infrastructure for velocity, cost effi ciency and alignment with growth initiatives. In 2014, we announced the sale of 660
miles on the west end of our Dakota, Minnesota & Eastern line for US$210 million.
A comprehensive process is currently underway to inventory and monetize up to an additional $2 billion in other non-core real estate over the next several years.
STRATEGY
Through longer sidings, improved asset utilization and increased train lengths, we will move more traffi c with fewer locomotives and railcars while unlocking capacity for future growth potential.
Highly productive assets drive better service at a reduced cost.
Doing more with less drives profi table growth.
Lisa Bryson – Assistant Superintendent, Brandon, Manitoba
We are always watching for opportunities to be more effi cient. If a locomotive is going to sit for any reason, break it off and do something with it. Look for opportunities to capture every moment. The goal is to utilize our locomotives 24 hours a day, every day.”
OPTIMIZE ASSETS
13
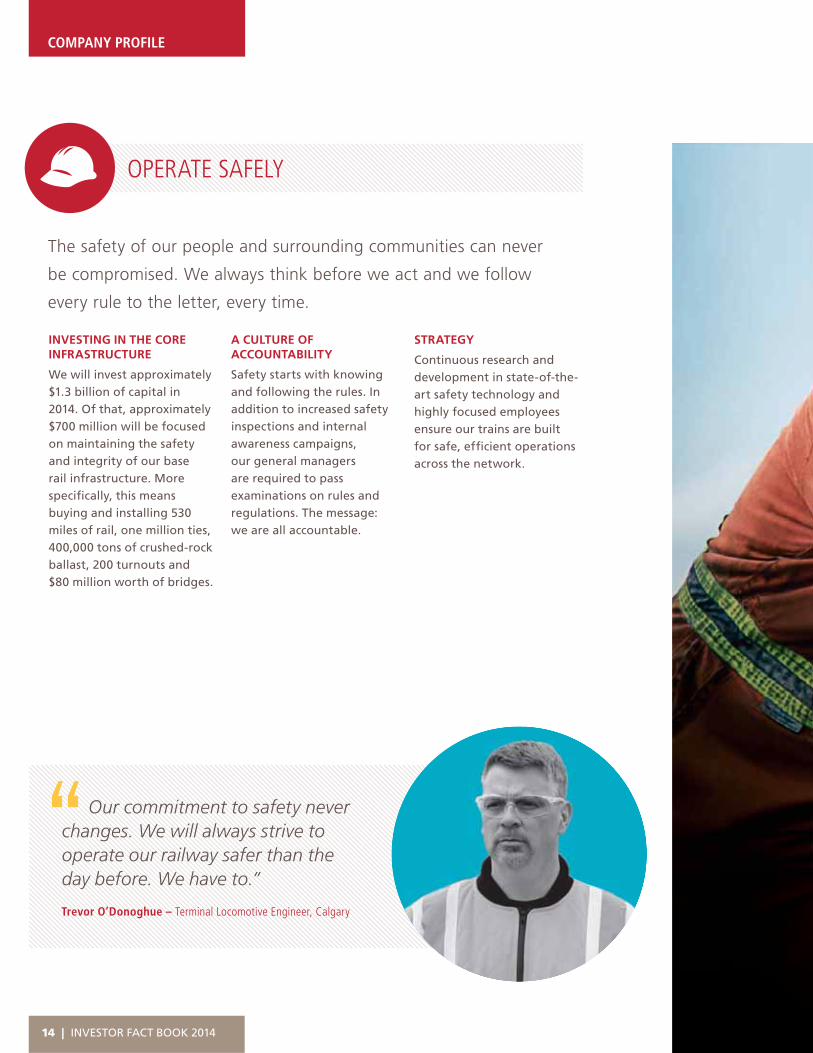
INVESTING IN THE CORE INFRASTRUCTURE
We will invest approximately $1.3 billion of capital in 2014. Of that, approximately $700 million will be focused on maintaining the safety and integrity of our base rail infrastructure. More specifi cally, this means buying and installing 530 miles of rail, one million ties, 400,000 tons of crushed-rock ballast, 200 turnouts and $80 million worth of bridges.
A CULTURE OF ACCOUNTABILITY
Safety starts with knowing and following the rules. In addition to increased safety inspections and internal awareness campaigns, our general managers are required to pass examinations on rules and regulations. The message: we are all accountable.
STRATEGY
Continuous research and development in state-of-the-art safety technology and highly focused employees ensure our trains are built for safe, effi cient operations across the network.
The safety of our people and surrounding communities can never
be compromised. We always think before we act and we follow
every rule to the letter, every time.
OPERATE SAFELY
Our commitment to safety never changes. We will always strive to operate our railway safer than the day before. We have to.”
Trevor O’Donoghue – Terminal Locomotive Engineer, Calgary
14 | INVESTOR FACT BOOK 2014
COMPANY PROFILE

We ensure our trains are built for safe, effi cient operations across the network.
15

We’re working to develop a culture of railroaders.
16 | INVESTOR FACT BOOK 2014
COMPANY PROFILE

BUILDING THE BENCH STRENGTH
Through internal promotions and the recruitment of experienced executives from outside the company, we have assembled a management team that brings renewed passion and fresh perspectives to create a new industry leader. People drive performance and we are putting the right people in place to get it done.
A NEW SALES FOCUS
We’ve taken the principles of accountability and
performance – a culture of execution – to the marketing and sales team. Earlier this year, we introduced a new Sales Incentive Program designed to motivate and reward those who are profi tably selling our new service into the marketplace.
MANAGEMENT CONDUCTOR TRAINING
We are building a culture of railroaders. Whether you crunch numbers, sell service, develop software or manage projects, becoming a qualifi ed conductor or
engineer is a requirement. It is also the single best way for a management employee to learn what the business is truly about and is a fundamental cornerstone to the development of our railroad culture.
STRATEGY
We’re working to develop the kind of people we want: passionate about railroading, hungry for success, driven to achieve.
The passion, skills and dedication of our people fuel the engine of our
growth and success. We teach them, nurture them and reward them.
DEVELOP PEOPLE
Ben Serena – Superintendent Operations, Calgary & Alberta South
Good leaders set a positive example. They’re disciplined. They communicate well. They make sure their team understands the value in the new direction and they always look for ways to take results to another level.”
17

FINANCIAL & STATISTICAL HIGHLIGHTS
(1) These earnings measures have no standardized meanings prescribed by U.S. GAAP and, therefore, are unlikely to be comparable to similar measures of other companies.
(2) See Page 110 for a reconciliation of non-GAAP measures.
$ in millions, except per share data or unless otherwise indicated 2011 2012 2013 2013 2014
FINANCIAL HIGHLIGHTSTotal revenues 5,177 5,695 6,133 2,992 3,190 Operating income 967 949 1,420 782 1,010 Adjusted operating income, excluding signifi cant items (1)(2) 967 1,309 1,844 773 1,010 Net income 570 484 875 469 622
Income, excluding signifi cant items (1)(2) 538 753 1,132 463 622 Diluted earnings per share 3.34 2.79 4.96 2.66 $3.54Adjusted diluted earnings per share (1)(2) 3.15 4.34 6.42 2.63 $3.52Free cash (1)(2) (724) 93 530 171 534
Financial RatiosOperating ratio 81.3% 83.3% 76.8% 73.9% 68.3%Adjusted operating ratio (1)(2) 81.3% 77.0% 69.9% 73.9% 68.3%Debt-to-total capitalization 50.7% 47.9% 40.7% 45.9% 39.8%
STATISTICAL HIGHLIGHTSRevenue ton miles (millions) 129,059 135,032 144,249 72,154 72,804 Carloads (thousands) 2,597 2,669 2,688 1,327 1,307 Train weight (tons) 6,593 6,709 7,573 7,337 7,924
Train length (feet) 5,860 5,981 6,530 6,369 6,634 Fuel effi ciency (Gallons per 1000 GTMs) 1.18 1.15 1.06 1.09 1.05 11.
61.0
6,09
6,39
,369
7,
369
7,3
69
7,33
9
1337
1,337
71,3
7
7232
72,27
1
2,127
1.0
,157
6.0
154
6,605
54
6,65
4
63
7,
634
7,9
34
,92
4
4
1924
45
1,3
24
45.9
7,30
4
75.9%
7230
739%
72,07
73.%
2,87
73.9
%
80
739%
804
739%
04
3.9%
4
.9%9%%
3
%
39399.86
.8%68
8%
68.%
1
68.3
%
17
683%
71
68.%
271
8.3%
2.6
.3%
.63
3%
263
%
2.3
%
2.6
66 4
646
6463
63
5
3
$53
4
$334
46
$3.4
469
$3.5
4
69
$3.52
79
$352
77
$3.52
73
3.54
3
54
3
64
7
62
78
22
2782
2
2,982
2
2,992
6
992
62
92
1622
2
1,022
,012
01010
1
0
2
1,
20
1,0
20
,01
01
3010
13
3,110
3
3,190
3
19090 0
220201014144
1ST HALF
18 | INVESTOR FACT BOOK 2014
PERFORMANCE

TOTAL REVENUES
REVENUE TON MILES (MILLIONS)
TRAIN WEIGHT (TONS) TRAIN LENGTH (FEET)
FUEL EFFICIENCY (GALLONS PER 1000 GTMS)
ADJUSTED DILUTED EARNINGS PER SHARE (1)(2)
8.8%
5.7%7.2% 5.6%
5.2%
Key Metrics & Compound Annual Growth Rate(2011–2013)
42.8%ADJUSTED OPERATING RATIO(1)(2)
1,140 BP REDUCTION
19
VANCOUVERVANCOUVER
KINGSGATECOUTTS
CALGARY
EDMONTON
WETASKIWIN
BULK –
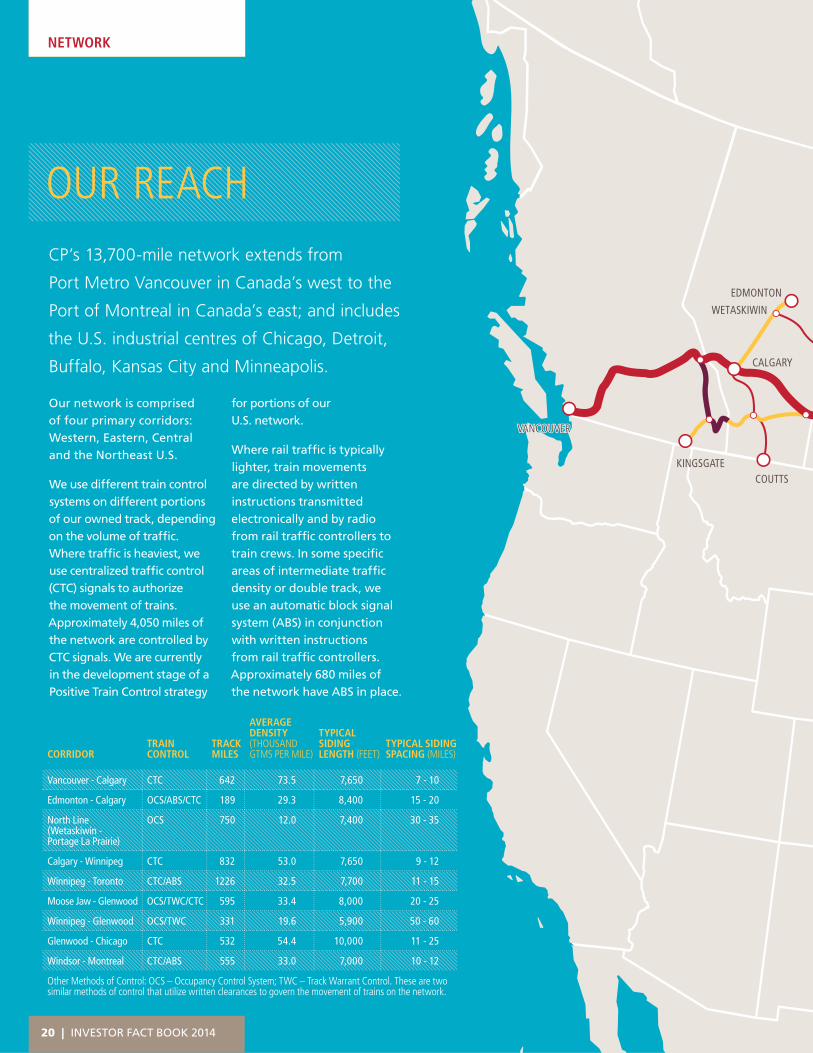
CP’s 13,700-mile network extends from
Port Metro Vancouver in Canada’s west to the
Port of Montreal in Canada’s east; and includes
the U.S. industrial centres of Chicago, Detroit,
Buffalo, Kansas City and Minneapolis.
Our network is comprised of four primary corridors: Western, Eastern, Central and the Northeast U.S.
We use different train control systems on different portions of our owned track, depending on the volume of traffi c. Where traffi c is heaviest, we use centralized traffi c control (CTC) signals to authorize the movement of trains. Approximately 4,050 miles of the network are controlled by CTC signals. We are currently in the development stage of a Positive Train Control strategy
for portions of our U.S. network.
Where rail traffi c is typically lighter, train movements are directed by written instructions transmitted electronically and by radio from rail traffi c controllers to train crews. In some specifi c areas of intermediate traffi c density or double track, we use an automatic block signal system (ABS) in conjunction with written instructions from rail traffi c controllers. Approximately 680 miles of the network have ABS in place.
OUR REACH
CORRIDORTRAIN CONTROL
TRACK MILES
AVERAGE DENSITY (THOUSAND GTMS PER MILE)
TYPICAL SIDING LENGTH (FEET)
TYPICAL SIDING SPACING (MILES)
Vancouver - Calgary CTC 642 73.5 7,650 7 - 10
Edmonton - Calgary OCS/ABS/CTC 189 29.3 8,400 15 - 20
North Line (Wetaskiwin - Portage La Prairie)
OCS 750 12.0 7,400 30 - 35
Calgary - Winnipeg CTC 832 53.0 7,650 9 - 12
Winnipeg - Toronto CTC/ABS 1226 32.5 7,700 11 - 15
Moose Jaw - Glenwood OCS/TWC/CTC 595 33.4 8,000 20 - 25
Winnipeg - Glenwood OCS/TWC 331 19.6 5,900 50 - 60
Glenwood - Chicago CTC 532 54.4 10,000 11 - 25
Windsor - Montreal CTC/ABS 555 33.0 7,000 10 - 12
Other Methods of Control: OCS – Occupancy Control System; TWC – Track Warrant Control. These are two similar methods of control that utilize written clearances to govern the movement of trains on the network.
NETWORK
20 | INVESTOR FACT BOOK 2014

SUDBURY
TORONTO
NEW YORK
PORTAGE LA PRAIRIE
LLOYDMINSTER
SASKATOON
REGINA
WINNIPEG
DULUTH
THUNDER BAY
TORONTO
BUFFALODETROIT
PHILADELPHIA
NEW YORK
ALBANY
MONTREAL
CHICAGO
MILWAUKEE
KANSAS CITY
MINNEAPOLIS/ST. PAUL
TRACYOVER 45 MILLION
30-45 MILLION
15-30 MILLION
UP TO 15 MILLION
AVERAGE DENSITY(GTMs per route mile)
21

VANCOUVER
HUNTINGDON
R
NGDNGDON
BNSF
PRODUCTS
The Western Corridor is our primary route for bulk and resource products traffi c from Western Canada to the Port Metro Vancouver for export. We also handle signifi cant volumes of intermodal containers and domestic merchandise traffi c.
FEEDER LINES
We support our Western Corridor with four signifi cant feeder lines. The “Coal Route” links southeastern B.C. coal deposits to the Western Corridor and to coal terminals at Port Metro Vancouver. The “Edmonton-Calgary Route” provides rail access to Alberta’s Industrial Heartland in addition to petrochemical facilities in central Alberta. The “Pacifi c CanAm Route” connects Calgary and Medicine Hat, Alberta, with Pacifi c Northwest rail routes at Kingsgate, B.C.
THE WESTERN CORRIDOR: VANCOUVER-THUNDER BAY
The Western Corridor links Vancouver with Thunder Bay in Canada.
With service through Calgary, the Western Corridor is an important part
of our routes between Vancouver and the U.S. Midwest, and between
Vancouver and Eastern Canada. The Western Corridor provides access
to the Port of Thunder Bay, Canada’s primary Great Lakes bulk terminal.
via the Crowsnest Pass. The “North Line Route” provides rail service to customers from Winnipeg to Calgary through Portage la Prairie Manitoba; Yorkton and Saskatoon, Saskatchewan; and Wetaskiwin, Alberta. This line is an important collector of Canadian grain and fertilizer, serving the potash mines located east and west of Saskatoon and many high-throughput grain elevator and processing facilities. In addition, this line provides direct access to refi ning and upgrading facilities at Lloydminster, Alberta and Western Canada’s largest pipeline terminal at Hardisty, Alberta.
CONNECTIONS
Our Western Corridor connects with the Union Pacifi c Railroad (UP) at Kingsgate; and with Burlington Northern Santa Fe, LLC (BNSF) at Coutts,
Alberta, and at New Westminster and Huntingdon in B.C. This corridor also connects with Canadian National (CN) at many locations including Thunder Bay, Winnipeg, Regina, Saskatoon, Red Deer, Calgary, Edmonton and several locations in the Greater Vancouver area.
YARDS AND REPAIR FACILITIES
We support rail operations on the Western Corridor with main rail yards at Vancouver, Calgary, Edmonton, Moose Jaw, Winnipeg and Thunder Bay. We also have major intermodal terminals at Vancouver, Calgary, Edmonton, Regina and Winnipeg. We have locomotive and rail car repair facilities at Golden, Vancouver, Calgary, Moose Jaw and Winnipeg.
NETWORK
22 | INVESTOR FACT BOOK 2014

SASKATOON
SUDBURY
KINGSGATE
FORT STEELE
COUTTS
CALGARY
EDMONTON
WETASKIWIN
GOLDEN
MEDICINE HAT
MOOSE JAW
LLOYDMINSTER
HARDISTY
YORKTON
REGINAPORTAGE LA PRAIRIE
WINNIPEG
DULUTH
THUNDER BAY
TORONTO
BUFFALO
DETROITCHICAGO
MILWAUKEE
KANSAS CITY
MINNEAPOLIS/ST. PAUL
TRACY
NNNKINNNNNGGGGSSSGGGGGAAAAAAAATTTTAAAA EEE
STEELE
UP
COUTTTTS
MED
BNSF
CONNECTIONS
23
COUTTS
CALGARY
WETASKIWIN
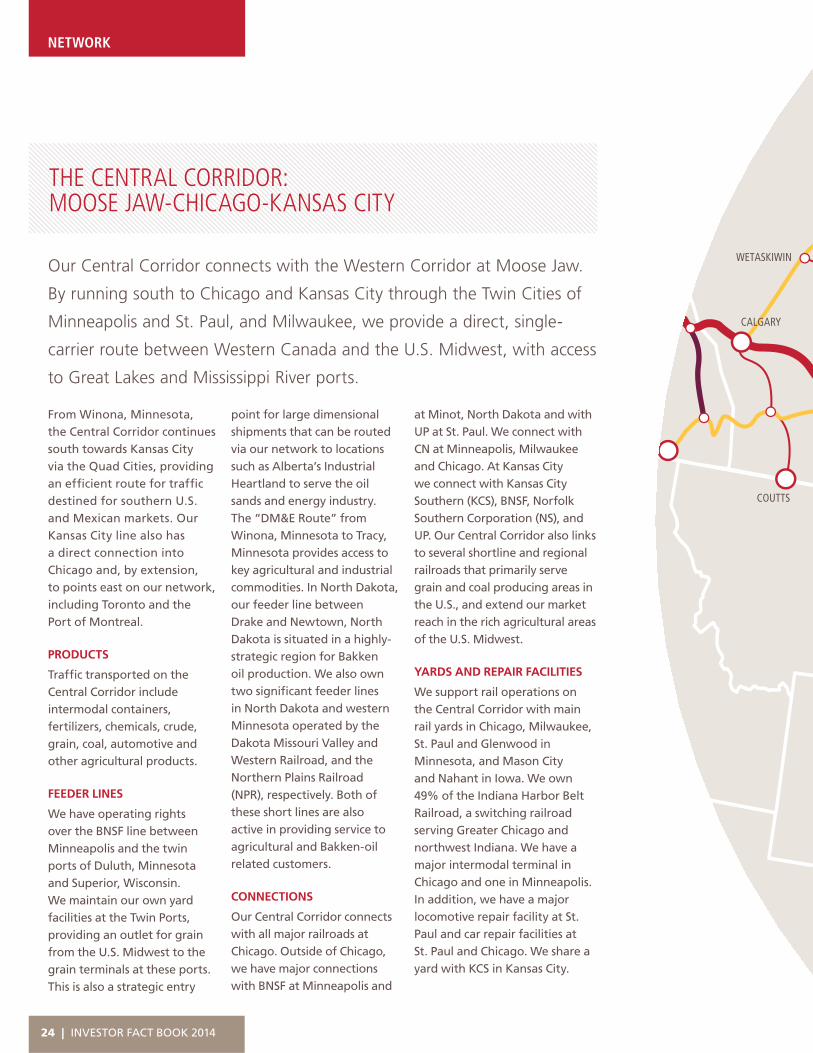
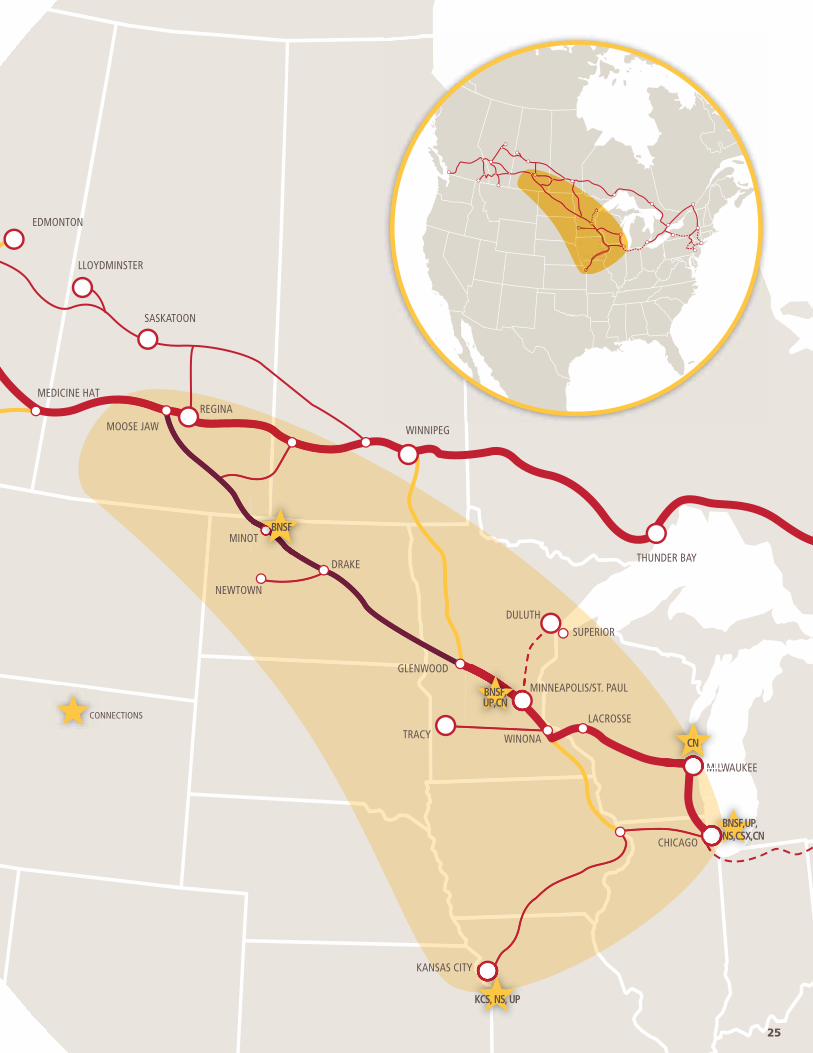
From Winona, Minnesota, the Central Corridor continues south towards Kansas City via the Quad Cities, providing an effi cient route for traffi c destined for southern U.S. and Mexican markets. Our Kansas City line also has a direct connection into Chicago and, by extension, to points east on our network, including Toronto and the Port of Montreal.
PRODUCTS
Traffi c transported on the Central Corridor include intermodal containers, fertilizers, chemicals, crude, grain, coal, automotive and other agricultural products.
FEEDER LINES
We have operating rights over the BNSF line between Minneapolis and the twin ports of Duluth, Minnesota and Superior, Wisconsin. We maintain our own yard facilities at the Twin Ports, providing an outlet for grain from the U.S. Midwest to the grain terminals at these ports. This is also a strategic entry
THE CENTRAL CORRIDOR: MOOSE JAW-CHICAGO-KANSAS CITY
Our Central Corridor connects with the Western Corridor at Moose Jaw.
By running south to Chicago and Kansas City through the Twin Cities of
Minneapolis and St. Paul, and Milwaukee, we provide a direct, single-
carrier route between Western Canada and the U.S. Midwest, with access
to Great Lakes and Mississippi River ports.
point for large dimensional shipments that can be routed via our network to locations such as Alberta’s Industrial Heartland to serve the oil sands and energy industry. The “DM&E Route” from Winona, Minnesota to Tracy, Minnesota provides access to key agricultural and industrial commodities. In North Dakota, our feeder line between Drake and Newtown, North Dakota is situated in a highly-strategic region for Bakken oil production. We also own two signifi cant feeder lines in North Dakota and western Minnesota operated by the Dakota Missouri Valley and Western Railroad, and the Northern Plains Railroad (NPR), respectively. Both of these short lines are also active in providing service to agricultural and Bakken-oil related customers.
CONNECTIONS
Our Central Corridor connects with all major railroads at Chicago. Outside of Chicago, we have major connections with BNSF at Minneapolis and
at Minot, North Dakota and with UP at St. Paul. We connect with CN at Minneapolis, Milwaukee and Chicago. At Kansas City we connect with Kansas City Southern (KCS), BNSF, Norfolk Southern Corporation (NS), and UP. Our Central Corridor also links to several shortline and regional railroads that primarily serve grain and coal producing areas in the U.S., and extend our market reach in the rich agricultural areas of the U.S. Midwest.
YARDS AND REPAIR FACILITIES
We support rail operations on the Central Corridor with main rail yards in Chicago, Milwaukee, St. Paul and Glenwood in Minnesota, and Mason City and Nahant in Iowa. We own 49% of the Indiana Harbor Belt Railroad, a switching railroad serving Greater Chicago and northwest Indiana. We have a major intermodal terminal in Chicago and one in Minneapolis. In addition, we have a major locomotive repair facility at St. Paul and car repair facilities at St. Paul and Chicago. We share a yard with KCS in Kansas City.
NETWORK
24 | INVESTOR FACT BOOK 2014
TRACY
EDMONTON
MOOSE JAW
GLENWOOD
WINONA
LACROSSE
MINOT
NEWTOWN
DRAKE
LLOYDMINSTER
SASKATOON
REGINA
WINNIPEG
DULUTH
THUNDER BAY
CHICAGO
MILWAUKEE
SUPERIOR
KANSAS CITY
MINNEAPOLIS/ST. PAUL
MEDICINE HAT
OTBNSF
Y
KCS, NS, UP
MILWLL
BNSF,UP,CN
CN
BNSF,UP,NS,CSX,CN
CONNECTIONS
25
TRACY
GLENWOOD
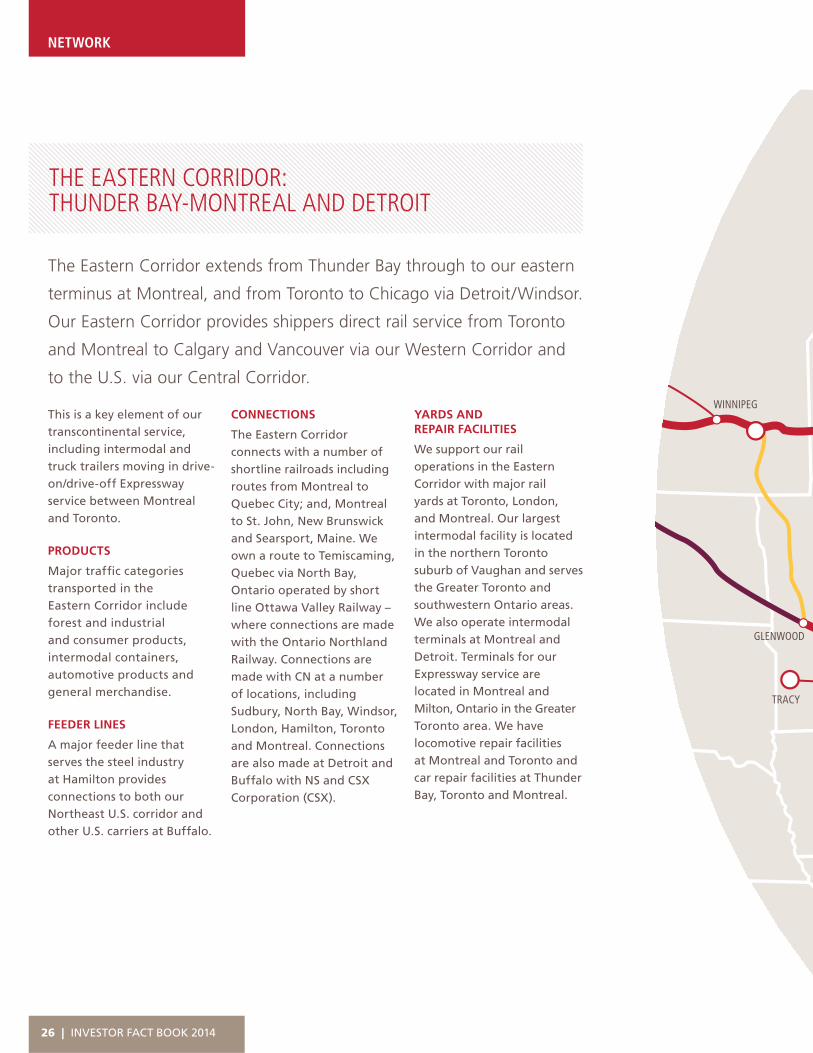
WINNIPEGThis is a key element of our transcontinental service, including intermodal and truck trailers moving in drive-on/drive-off Expressway service between Montreal and Toronto.
PRODUCTS
Major traffi c categories transported in the Eastern Corridor include forest and industrial and consumer products, intermodal containers, automotive products and general merchandise.
FEEDER LINES
A major feeder line that serves the steel industry at Hamilton provides connections to both our Northeast U.S. corridor and other U.S. carriers at Buffalo.
THE EASTERN CORRIDOR: THUNDER BAY-MONTREAL AND DETROIT
The Eastern Corridor extends from Thunder Bay through to our eastern
terminus at Montreal, and from Toronto to Chicago via Detroit/Windsor.
Our Eastern Corridor provides shippers direct rail service from Toronto
and Montreal to Calgary and Vancouver via our Western Corridor and
to the U.S. via our Central Corridor.
CONNECTIONS
The Eastern Corridor connects with a number of shortline railroads including routes from Montreal to Quebec City; and, Montreal to St. John, New Brunswick and Searsport, Maine. We own a route to Temiscaming, Quebec via North Bay, Ontario operated by short line Ottawa Valley Railway – where connections are made with the Ontario Northland Railway. Connections are made with CN at a number of locations, including Sudbury, North Bay, Windsor, London, Hamilton, Toronto and Montreal. Connections are also made at Detroit and Buffalo with NS and CSX Corporation (CSX).
YARDS AND REPAIR FACILITIES
We support our rail operations in the Eastern Corridor with major rail yards at Toronto, London, and Montreal. Our largest intermodal facility is located in the northern Toronto suburb of Vaughan and serves the Greater Toronto and southwestern Ontario areas. We also operate intermodal terminals at Montreal and Detroit. Terminals for our Expressway service are located in Montreal and Milton, Ontario in the Greater Toronto area. We have locomotive repair facilities at Montreal and Toronto and car repair facilities at Thunder Bay, Toronto and Montreal.
NETWORK
26 | INVESTOR FACT BOOK 2014

SUDBURY
TEMISCAMING
NORTH BAY
WINONA
DULUTH
THUNDER BAY
TORONTO
BUFFALO
GUELPH JTN
DETROIT/WINDSOR
PHILADELPHIA
NEW YORK
ALBANY
MONTREAL
QUEBEC CITY
CHICAGO
HAMILTON
LONDON
CLEVELAND
MILWAUKEE
KANSAS CITY
MINNEAPOLIS/ST. PAUL
NS,CSX
ONS,CSX
BNSF,UP,NS,CSX,CN
CONNECTIONS
27

PRODUCTS
Major traffi c categories transported in the Northeast U.S. Corridor include ethanol, lumber, crude, metals, minerals and consumer products.
FEEDER LINES
The Northeast U.S. Corridor connects with important feeder lines. Our route between Montreal and Harrisburg, in combination with trackage rights over other railroads, provides us with direct access to New
THE NORTHEAST U.S. CORRIDOR: BUFFALO AND MONTREAL TO NEW YORK
The Northeast U.S. Corridor provides an important link between the
major population centres of Eastern Canada, the U.S. Midwest and
the U.S. Northeast. The corridor extends from Montreal to Harrisburg,
Pennsylvania via Plattsburgh, New York and Albany in New York’s
Capital District Region.
York. Agreements with NS provide us with access to shippers and receivers in the Conrail “shared asset” regions of New Jersey via Harrisburg. The “Southern Tier Route” between Guelph Junction, Ontario, Buffalo and Binghamton in New York includes haulage rights over NS lines. This route links industrial southern Ontario with key U.S. connecting rail carriers at Buffalo and provides access to short line carriers along the Buffalo to Binghamton route.
CONNECTIONS
We have major connections with NS at Harrisburg, Binghamton and Allentown, and with CSX at Buffalo. Shortline connections exist with multiple players throughout the corridor.
YARDS AND REPAIR FACILITIES
We support our Northeast U.S. Corridor with a major rail yard in Binghamton. We have locomotive and car repair facilities in Montreal and Binghamton.
NETWORK
28 | INVESTOR FACT BOOK 2014

SUDBURY
TORONTO
GUELPH JTN
HAMILTON
BUFFALO
DETROIT/WINDSOR
PHILADELPHIA
ALLENTOWN
HARRISBURG
NEW YORK
ALBANY
PLATTSBURGH
MONTREAL
BINGHAMTONTONNNNN NSNS,CSX
ALLLLENA
NS
ARRISBURG
NS
CONNECTIONS
29
VANCOUVER
NETWORK
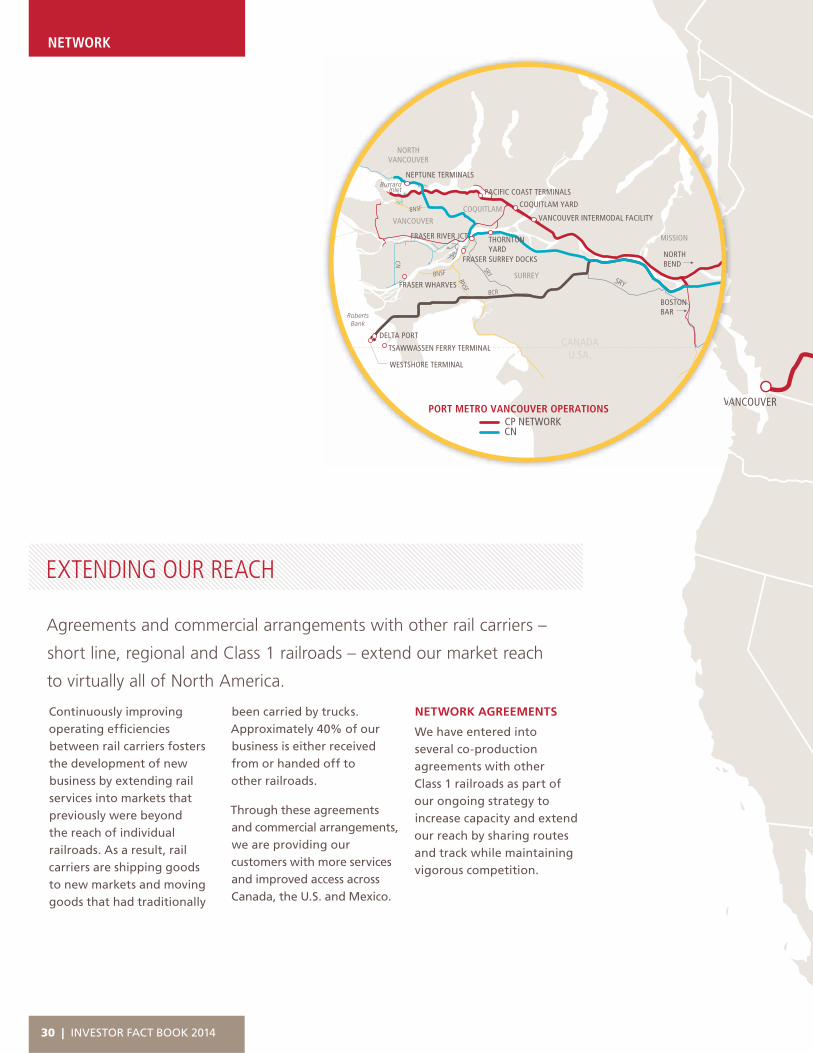
Agreements and commercial arrangements with other rail carriers –
short line, regional and Class 1 railroads – extend our market reach
to virtually all of North America.
Continuously improving operating effi ciencies between rail carriers fosters the development of new business by extending rail services into markets that previously were beyond the reach of individual railroads. As a result, rail carriers are shipping goods to new markets and moving goods that had traditionally
EXTENDING OUR REACH
been carried by trucks. Approximately 40% of our business is either received from or handed off to other railroads.
Through these agreements and commercial arrangements, we are providing our customers with more services and improved access across Canada, the U.S. and Mexico.
VAAVVPORT METRO VANCOUVER OPERATIONS
CANADAU.SA.
RobertsBank
BurrardInlet
WESTSHORE TERMINAL
TSAWWASSEN FERRY TERMINAL
FRASER WHARVES
FRASER RIVER JCT.
FRASER SURREY DOCKSNORTHBEND
BOSTONBAR
THORNTON YARD
COQUITLAM YARD
PACIFIC COAST TERMINALS
NEPTUNE TERMINALS
CP NETWORKCN
VANCOUVER INTERMODAL FACILITY
DELTA PORT
SURREY
MISSION
VANCOUVER
BNSF
CN
BCR
SRY
SRY
BNSF
BNSF
COQUITLAM
NORTHVANCOUVER
NETWORK AGREEMENTS
We have entered into several co-production agreements with other Class 1 railroads as part of our ongoing strategy to increase capacity and extend our reach by sharing routes and track while maintaining vigorous competition.
30 | INVESTOR FACT BOOK 2014
SUDBURY
KINGSGATECOUTTS
CALGARY
EDMONTON
LLOYDMINSTER
SASKATOON
REGINAWINNIPEG
DULUTH
THUNDER BAY
TORONTO
BUFFALO
DETROIT
PHILADELPHIA
NEW YORK
ALBANY
MONTREAL
CHICAGO
MILWAUKEE
KANSAS CITY
MINNEAPOLIS/ST. PAUL
TRACY
G
THUNDER BAY
CN HAULAGE ON CP LINE
FRANZ
SUDBURY
WATERFALL
PARRY SOUND
SAULT-SAINTE-MARIE
WESTBOUND TRAINS ON CP LINES
ONTARIO OPERATIONS
EASTBOUND TRAINS ON CN LINESCP NETWORKCNOTHER
KANSA
MILWAUKEE
CHICAGO
DETROIT
CLEVELAND
BUFFALO
TORONTO
BENSENVILLEYARD
CP NETWORKCP HAULAGE ON CSX LINECP TRACKAGE ON NS LINE
CHICAGO TO BUFFALO HAULAGE AGREEMENT
31

NETWORK
In 2008, our company and CN renegotiated the Fraser Canyon directional running zone agreement. This agreement allows both companies to mitigate the effects of steep and diffi cult operating terrain and improve fl uidity for import and export goods.
Our company, CN, and shippers benefi t from a series of agreements to realize effi ciencies and improve rail service to and from Canada’s largest, busiest and most diversifi ed port: Port Metro Vancouver.
THESE AGREEMENTS PROVIDE:
• reciprocal access to Vancouver’s north and south shores, with our potash and coal trains having direct access to Neptune Terminals and CN sulphur trains having direct access to Pacifi c Coast Terminals;
• the option to operate longer, heavier trains; and
• a reciprocal interchange at CN’s Thornton Yard and our Coquitlam Yard that replaces a less effi cient interchange arrangement.
These reciprocal arrangements have been enhanced to optimize railroad infrastructure in the Lower Mainland of B.C. Under these arrangements, we operate the trains of both railroads using our crews a distance of approximately 127 miles from Boston Bar to the terminals on the south shore of Burrard Inlet in Vancouver and return to North Bend. CN operates the trains of both railroads using CN crews a distance of approximately
PORT METRO VANCOUVER OPERATIONS
n
PORT METRO VANCOUVER OPERATIONS
CANADAU.SA.
RobertsBank
BurrardInlet
WESTSHORE TERMINAL
TSAWWASSEN FERRY TERMINAL
FRASER WHARVES
FRASER RIVER JCT.
FRASER SURREY DOCKSNORTHBEND
BOSTONBAR
THORNTON YARD
COQUITLAM YARD
PACIFIC COAST TERMINALS
NEPTUNE TERMINALS
CP NETWORKCN
VANCOUVER INTERMODAL FACILITY
DELTA PORT
SURREY
MISSION
VANCOUVER
BNSF
CN
BCR
SRY
SRY
BNSF
BNSF
COQUITLAM
NORTHVANCOUVER
140 miles from Boston Bar to the terminals on the north shore of Burrard Inlet and return to North Bend. We provide all switching on the south shore of Burrard Inlet and CN provides all switching on the north shore of Burrard Inlet. In addition, we operate some CN trains a distance of approximately 135 miles to or from the Roberts Bank at Delta Port.
32 | INVESTOR FACT BOOK 2014
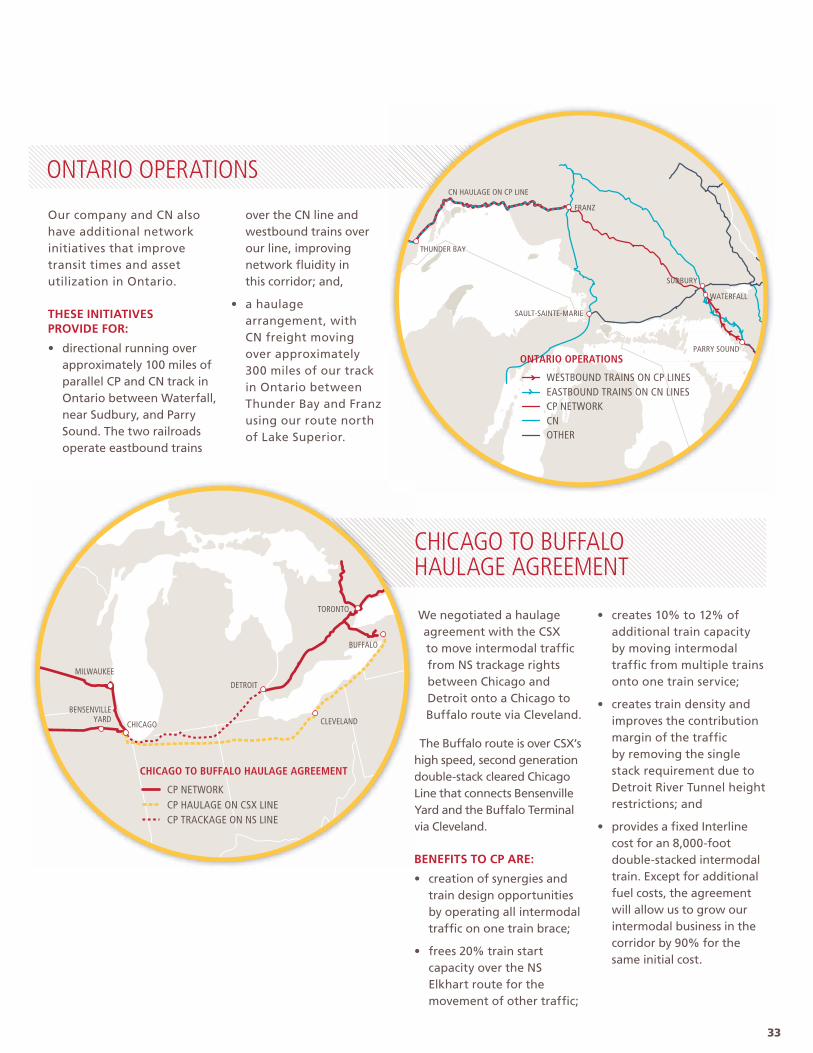
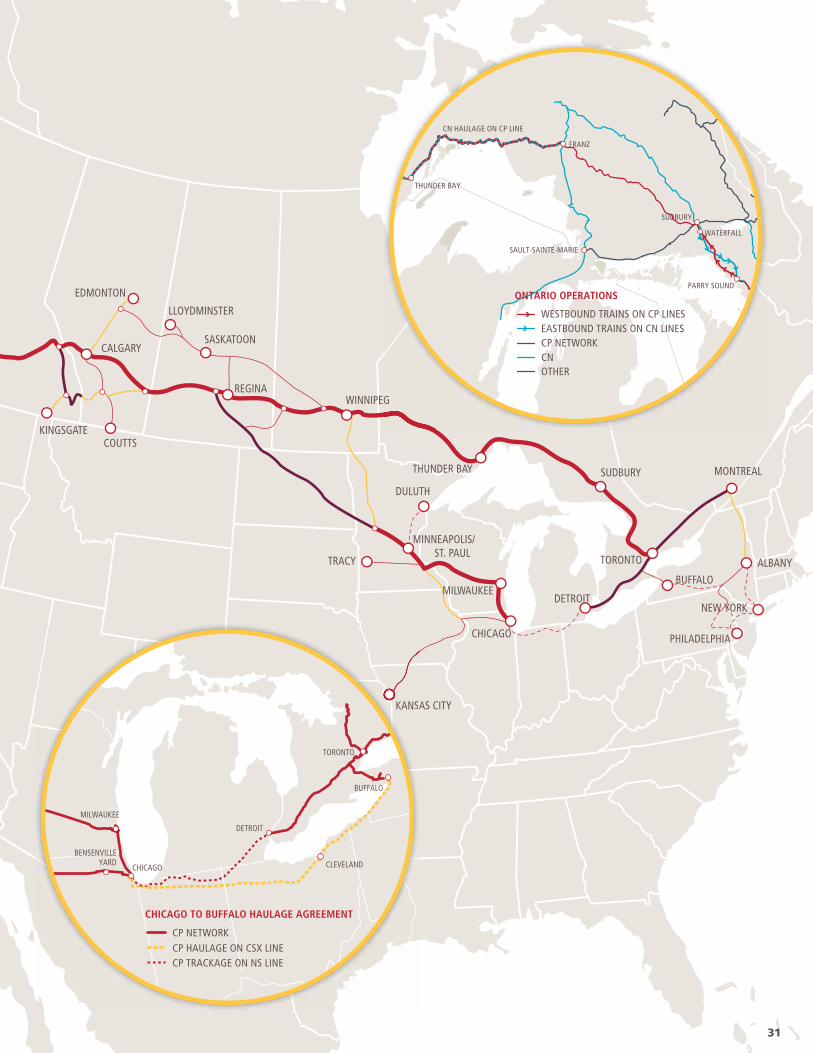
We negotiated a haulage agreement with the CSX to move intermodal traffi c from NS trackage rights between Chicago and Detroit onto a Chicago to Buffalo route via Cleveland.
The Buffalo route is over CSX’s high speed, second generation double-stack cleared Chicago Line that connects Bensenville Yard and the Buffalo Terminal via Cleveland.
BENEFITS TO CP ARE:
• creation of synergies and train design opportunities by operating all intermodal traffi c on one train brace;
• frees 20% train start capacity over the NS Elkhart route for the movement of other traffi c;
• creates 10% to 12% of additional train capacity by moving intermodal traffi c from multiple trains onto one train service;
• creates train density and improves the contribution margin of the traffi c by removing the single stack requirement due to Detroit River Tunnel height restrictions; and
• provides a fi xed Interline cost for an 8,000-foot double-stacked intermodal train. Except for additional fuel costs, the agreement will allow us to grow our intermodal business in the corridor by 90% for the same initial cost.
Our company and CN also have additional network initiatives that improve transit times and asset utilization in Ontario.
THESE INITIATIVES PROVIDE FOR:
• directional running over approximately 100 miles of parallel CP and CN track in Ontario between Waterfall, near Sudbury, and Parry Sound. The two railroads operate eastbound trains
over the CN line and westbound trains over our line, improving network fl uidity in this corridor; and,
• a haulage arrangement, with CN freight moving over approximately 300 miles of our track in Ontario between Thunder Bay and Franz using our route north of Lake Superior.
ONTARIO OPERATIONS
CHICAGO TO BUFFALO HAULAGE AGREEMENT
Yv
MILWAUKEE
CHICAGO
DETROIT
CLEVELAND
BUFFALO
TORONTO
BENSENVILLEYARD
CP NETWORKCP HAULAGE ON CSX LINECP TRACKAGE ON NS LINE
CHICAGO TO BUFFALO HAULAGE AGREEMENT
THUNDER BAY
CN HAULAGE ON CP LINE
FRANZ
SUDBURY
WATERFALL
PARRY SOUND
SAULT-SAINTE-MARIE
WESTBOUND TRAINS ON CP LINES
ONTARIO OPERATIONS
EASTBOUND TRAINS ON CN LINESCP NETWORKCNOTHER
33

Our freight revenues are derived from 12 lines of business representing a diversifi ed and balanced portfolio of goods transported between a wide range of origins and destinations.
We organize our freight traffi c into three business groups based on the service and equipment requirements of our customers – bulk, merchandise and intermodal. Bulk commodities, which typically move in large volumes across long distances, include grain, coal, potash, fertilizers and sulphur. Merchandise products
CP’s product and geographic diversity
creates a powerful base from which to
drive sustainable, profi table growth.
typically move in trains of mixed freight and in a variety of car types containing a range of products such as fi nished vehicles and automotive parts, chemicals and plastics, crude oil, forest products, as well as metals, minerals, and consumer products. Intermodal traffi c consists largely of high-value, time-sensitive retail goods in overseas containers that can be transported by train, ship and truck, and in domestic containers and trailers that can be moved by train and truck.
BULK 42%
MERCHANDISE 36%
INTERMODAL 22%
TRAFFIC MIX(% OF 2013 FREIGHT REVENUE)
CHEMICALS & PLASTICS 10%
CRUDE 6%
METALS, MINERALS & CONSUMER PRODUCTS 10%
AUTOMOTIVE 7%
FOREST PRODUCTS 3%
INTERNATIONAL 11%
DOMESTIC 11%
CANADIAN GRAIN 67%REGULATED 42%NON-REGULATED 25%
US GRAIN 33%DOMESTIC 25%EXPORT 8%
DOMESTIC 51%
INTERNATIONAL 49%
POTASH 55%EXPORT 30%DOMESTIC 25%
FERTILIZER 31%CROSS-BORDER 22%CANADA 6%U.S. 3%
SULPHUR 14%
CANADIAN COAL 89%EXPORT 85%DOMESTIC 4%
US COAL 11%DOMESTIC 8%EXPORT 3%
GRAIN(BASED ON 2013 REVENUES OF $1,300M)
INTERMODAL(BASED ON 2013 REVENUES OF $1,328M)
COAL(BASED ON 2013 REVENUES OF $627M)
FERTILIZERS & SULPHUR(BASED ON 2013 REVENUES OF $570M)
BU
LK
INTE
RM
OD
AL
BUSINESS MIX
LINES OF BUSINESS
LINES OF BUSINESS
34 | INVESTOR FACT BOOK 2014

GLOBAL 36%
CROSS-BORDER 30%
DOMESTIC 34%
GEOGRAPHIC DISTRIBUTION (% OF 2013 FREIGHT REVENUE)
EUROPE 5%ASIA 31%
CROSS-BORDER 30% CANADA 16%
US 18%
U.S. GRAIN 7%
CANADIANGRAIN 15%
FERTILIZERS & SULPHUR 5%
COAL 10%
POTASH 5%
PULP 43%
LUMBER 29%
PAPER 19%
PANEL 7%
OTHER 2%
FOREST PRODUCTS(BASED ON 2013 REVENUES OF $206M)
METALS, MINERALS & CP(BASED ON 2013 REVENUES OF $608M)
CRUDE(BASED ON 2013 REVENUES OF $375M)
AGGREGATES 48%
STEEL 34%
CONSUMER PRODUCTS 12%
MINES & METALS 6%
BAKKEN 54%
WESTERN CANADIAN 46%
MER
CH
AN
DIS
E
2013 AVERAGE LENGTH OF HAUL (MILES)
844 = CORPORATE AVERAGE
CRUDE
DOMESTIC INTERMODAL
INTERNATIONAL INTERMODAL
POTASH
CANADIAN GRAIN
FOREST PRODUCTS
CHEMICALS & PLASTICS
AUTOMOTIVE
FERTILIZER & SULPHUR
U.S. GRAIN
COAL
METALS MINERALS & CONSUMER PRODUCTS
1,678
1,666
1,611
1,068
898
787
786
729
706
629
600
499
FINISHED VEHICLES& PARTS 92%ORIGIN CANADA 65%ORIGIN US 20%ORIGIN MEXICO 7%
MACHINERY 6%
USED VEHICLES 2%
AUTOMOTIVE(BASED ON 2013 REVENUES OF $403M)
CHEMICALS & PLASTICS(BASED ON 2013 REVENUES OF $565M)
PETROLEUM PRODUCTS 57%
CHEMICALS 31%
PLASTICS 12%
35

BULK
Our grain portfolio is segmented geographically into Canadian and U.S. grain markets that include the movement of agricultural products from key producing regions in North America to both domestic and international markets.
The domestic movement of grain is made up of the movement of whole grains, such as wheat, canola, corn, soybeans and specialty crops to grain processors via origins in Western Canada and the Midwest U.S. We then move the resulting fi nished products and by-products from these processors.
Grain is CP’s single largest commodity, accounting for 22% of our
freight revenues. Grain transported by CP consists of both whole
grains – such as wheat, corn, soybeans and canola – and processed
products such as meals, oils and fl our.
In addition to moving product for domestic use in both Canada and the U.S., our network reach utilizes multiple export terminals for shipments overseas, with major outlets on the West and East coasts, as well as rail partners to service Mexico and the southern ports in the U.S.
In 2013, we moved approximately 438,000 carloads of grain and grain products, resulting in $1.3 billion of revenue. Through the fi rst half of 2014, we have increased these volumes by nearly 6%, driven predominantly by a large crop in the U.S. and a record crop in Canada.
GRAIN
Our network reach utilizes multiple export terminals for shipments overseas.
36 | INVESTOR FACT BOOK 2014
0
5,000
10,000
15,000
20,000
25,000
30,000
35,000
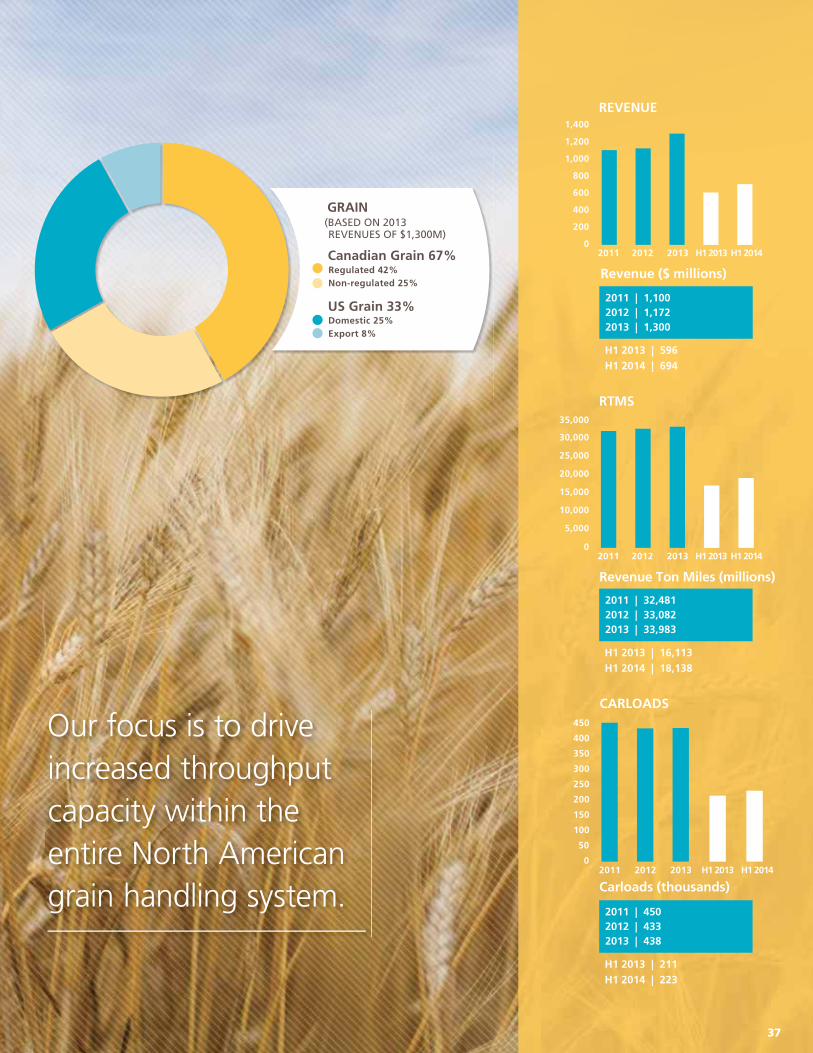
RTMS
Revenue Ton Miles (millions)
2011 2012 2013 H1 2013 H1 2014
H1 2013 | 16,113H1 2014 | 18,138
2011 | 32,4812012 | 33,0822013 | 33,983
0
200
400
600
800
1,000
1,200
1,400
2011 2012 2013 H1 2013 H1 2014
REVENUE
Revenue ($ millions)
H1 2013 | 596H1 2014 | 694
2011 | 1,1002012 | 1,1722013 | 1,300
0
50
100
150
200
250
300
350
400
450
2011 2012 2013 H1 2013 H1 2014
CARLOADS
Carloads (thousands)
H1 2013 | 211H1 2014 | 223
2011 | 4502012 | 4332013 | 438
Canadian Grain 67%Regulated 42%Non-regulated 25%
Domestic 25%Export 8%
US Grain 33%
GRAIN (BASED ON 2013 REVENUES OF $1,300M)
Our focus is to drive increased throughput capacity within the entire North American grain handling system.
37
VANCOUVER
BULK – GRAIN
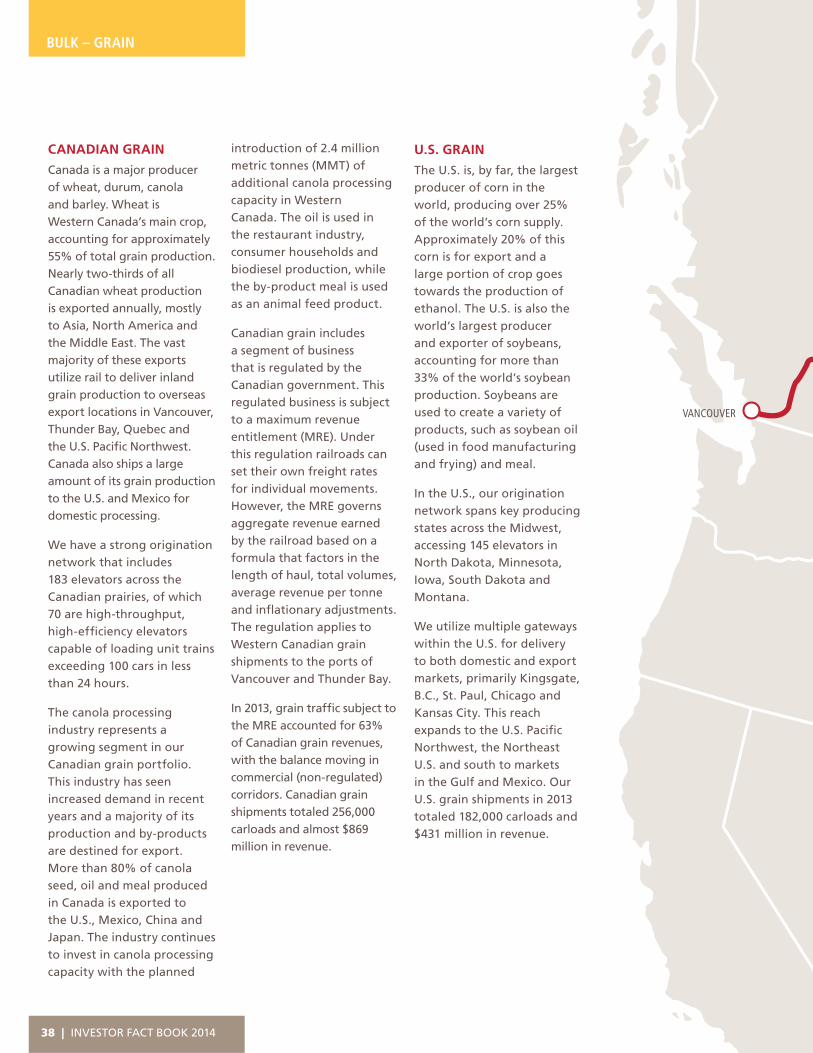
CANADIAN GRAIN
Canada is a major producer of wheat, durum, canola and barley. Wheat is Western Canada’s main crop, accounting for approximately 55% of total grain production. Nearly two-thirds of all Canadian wheat production is exported annually, mostly to Asia, North America and the Middle East. The vast majority of these exports utilize rail to deliver inland grain production to overseas export locations in Vancouver, Thunder Bay, Quebec and the U.S. Pacifi c Northwest. Canada also ships a large amount of its grain production to the U.S. and Mexico for domestic processing.
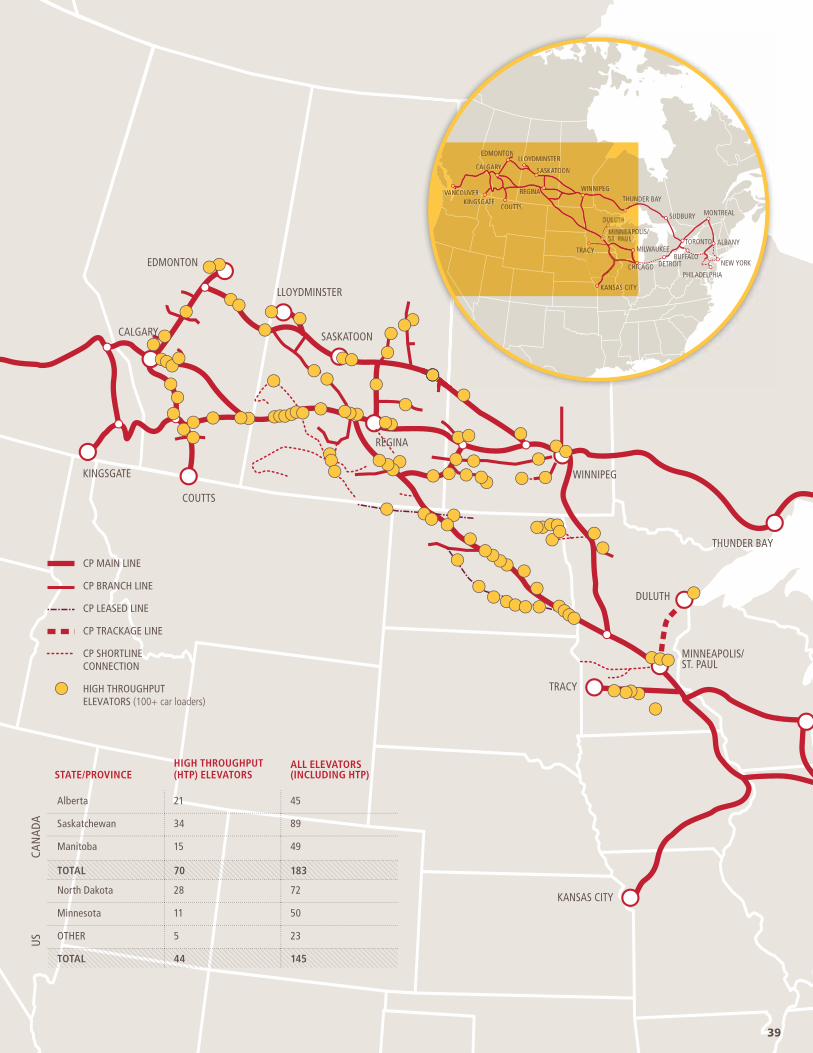
We have a strong origination network that includes 183 elevators across the Canadian prairies, of which 70 are high-throughput, high-effi ciency elevators capable of loading unit trains exceeding 100 cars in less than 24 hours.
The canola processing industry represents a growing segment in our Canadian grain portfolio. This industry has seen increased demand in recent years and a majority of its production and by-products are destined for export. More than 80% of canola seed, oil and meal produced in Canada is exported to the U.S., Mexico, China and Japan. The industry continues to invest in canola processing capacity with the planned
U.S. GRAIN
The U.S. is, by far, the largest producer of corn in the world, producing over 25% of the world’s corn supply. Approximately 20% of this corn is for export and a large portion of crop goes towards the production of ethanol. The U.S. is also the world’s largest producer and exporter of soybeans, accounting for more than 33% of the world’s soybean production. Soybeans are used to create a variety of products, such as soybean oil (used in food manufacturing and frying) and meal.
In the U.S., our origination network spans key producing states across the Midwest, accessing 145 elevators in North Dakota, Minnesota, Iowa, South Dakota and Montana.
We utilize multiple gateways within the U.S. for delivery to both domestic and export markets, primarily Kingsgate, B.C., St. Paul, Chicago and Kansas City. This reach expands to the U.S. Pacifi c Northwest, the Northeast U.S. and south to markets in the Gulf and Mexico. Our U.S. grain shipments in 2013 totaled 182,000 carloads and $431 million in revenue.
introduction of 2.4 million metric tonnes (MMT) of additional canola processing capacity in Western Canada. The oil is used in the restaurant industry, consumer households and biodiesel production, while the by-product meal is used as an animal feed product.
Canadian grain includes a segment of business that is regulated by the Canadian government. This regulated business is subject to a maximum revenue entitlement (MRE). Under this regulation railroads can set their own freight rates for individual movements. However, the MRE governs aggregate revenue earned by the railroad based on a formula that factors in the length of haul, total volumes, average revenue per tonne and infl ationary adjustments. The regulation applies to Western Canadian grain shipments to the ports of Vancouver and Thunder Bay.
In 2013, grain traffi c subject to the MRE accounted for 63% of Canadian grain revenues, with the balance moving in commercial (non-regulated) corridors. Canadian grain shipments totaled 256,000 carloads and almost $869 million in revenue.
38 | INVESTOR FACT BOOK 2014
KINGSGATE
COUTTS
CALGARY
EDMONTON
LLOYDMINSTER
SASKATOON
REGINA
WINNIPEG
THUNDER BAY
KANSAS CITY
TRACY
MINNEAPOLIS/ST. PAUL
DULUTH
CP MAIN LINE
CP BRANCH LINE
CP LEASED LINE
CP TRACKAGE LINE
CP SHORTLINE CONNECTION
HIGH THROUGHPUTELEVATORS (100+ car loaders)
CAN
ADA
US
SUDBURY
VANCOUVERKINGSGATE
COUTTS
CALGARY
EDMONTONLLOYDMINSTER
SASKATOON
REGINA WINNIPEGTHUNDER BAY
TORONTO
BUFFALODETROIT
PHILADELPHIA
NEW YORK
ALBANY
MONTREAL
HICAGO
MILWAUKEE
KANSAS CITY
POLIS/
TRACY
VVAAVVV NNCOOUVEUVEUVERRRKINGSSSGGAAATAA E
COUTTS
LCALLGARYY
EEEDMONTONLLLLOOYDMINSTERR
SASKA OOTOAA ON
REGINAA NWINNIPEGTHUN
HICCICICI
M
KANSAAASSS CITY
POPPO
ACYACYTRA
STATE/PROVINCEHIGH THROUGHPUT (HTP) ELEVATORS
ALL ELEVATORS(INCLUDING HTP)
Alberta 21 45
Saskatchewan 34 89
Manitoba 15 49
TOTAL 70 183
North Dakota 28 72
Minnesota 11 50
OTHER 5 23
TOTAL 44 145
39

BULK – GRAIN
North America is well positioned to supply this growing demand for food and feed. Continued advancements in technology, fertilizers and plant genetics have increased yields in all of the major grains. Within both Canada and the U.S., the acreages farmed are growing, driven by better overall economic returns for farmers. These long-term demand trends have promoted continued strong production of wheat and
expansion in the production of canola, corn and soybeans in North America.
With the continued evolution of the North American marketplace, we have seen the opportunity for integration of both the U.S. and Canadian grain transportation programs, allowing us to broaden our destination reach and increase market share. We will continue to drive effi ciency improvements
Global population and economic growth are the major drivers in
projected grain demand. Countries like China and India, with population
and economic growth rates above the global average, are seeing
changes in dietary behaviour as their populations desire more proteins
and fats due to higher disposable incomes. These changes in diet
require new and expanded inputs for food and feed.
within the entire North American grain handling system, engaging customers and industry stakeholders in initiatives to maximize capabilities. These initiatives include development of new and more effi cient loading facilities, increasing and improving the capabilities of existing terminals, and maximizing rail capacity with increased asset utilization, longer trains and improved velocity.
OUTLOOK
40 | INVESTOR FACT BOOK 2014

CANADIAN GRAIN DESTINATIONS (CARLOADS %)
OUR PORTS AND TERMINALS
U.S. GRAIN DESTINATIONS (CARLOADS %)
128
+>39 MMT OF GRAIN ANNUALLY
FACILITIES ON THE
WEST COAST (IN VANCOUVER)
FACILITIES EAST COAST VIA
THUNDER BAY AND THROUGH OUR
EASTERN EXPORT PROGRAM
ACCESS TO FACILITIES VIA
PARTNERSHIP AGREEMENTS WITH
OTHER CLASS 1 RAILROADS IN THE
PACIFIC NORTHWEST
THESE FACILITIES ENABLE EXPORT VOLUMES
THUNDER BAY
VANCOUVER
TWIN CITIES& MIDWEST
OTHERSOUTH/SOUTHWEST
NORTHEAST
CROSSBORDER
26
20
2338
910
49
19
6
PACIFIC NORTHWEST
EASTERN CANADA
41

42
BULK – GRAIN
42 | INVESTOR FACT BOOK 2014
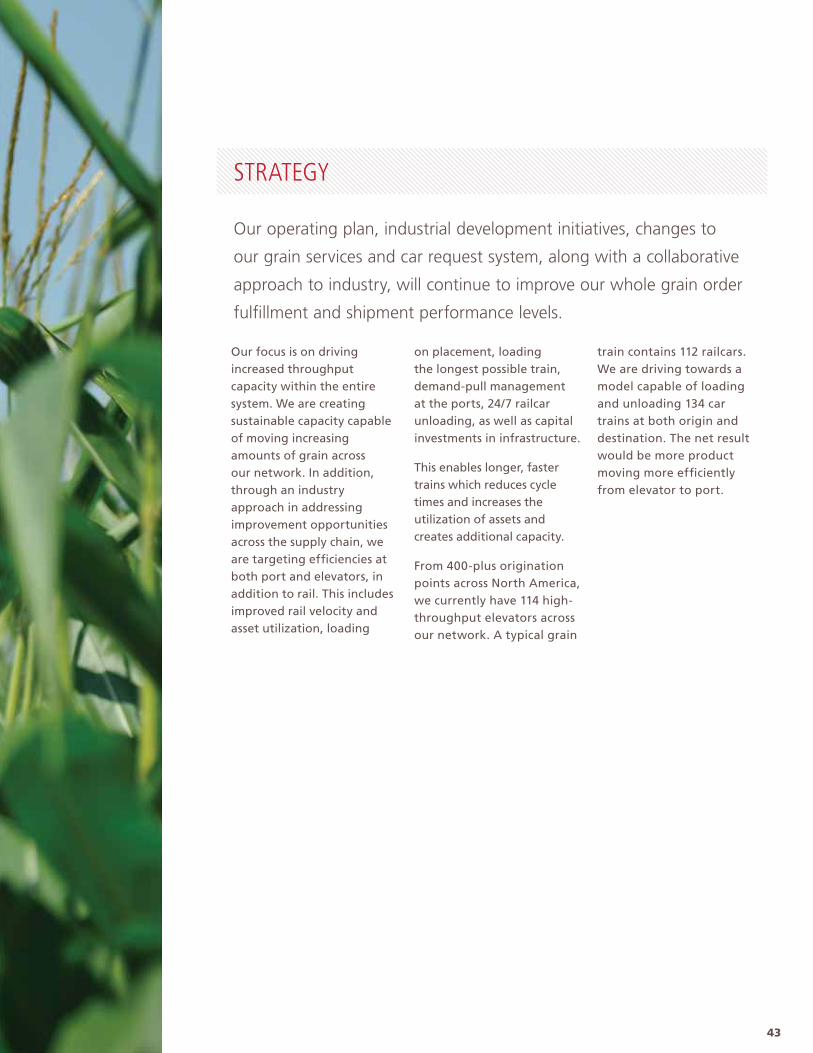
Our operating plan, industrial development initiatives, changes to
our grain services and car request system, along with a collaborative
approach to industry, will continue to improve our whole grain order
fulfi llment and shipment performance levels.
Our focus is on driving increased throughput capacity within the entire system. We are creating sustainable capacity capable of moving increasing amounts of grain across our network. In addition, through an industry approach in addressing improvement opportunities across the supply chain, we are targeting effi ciencies at both port and elevators, in addition to rail. This includes improved rail velocity and asset utilization, loading
on placement, loading the longest possible train, demand-pull management at the ports, 24/7 railcar unloading, as well as capital investments in infrastructure.
This enables longer, faster trains which reduces cycle times and increases the utilization of assets and creates additional capacity.
From 400-plus origination points across North America, we currently have 114 high-throughput elevators across our network. A typical grain
train contains 112 railcars. We are driving towards a model capable of loading and unloading 134 car trains at both origin and destination. The net result would be more product moving more effi ciently from elevator to port.
STRATEGY
43

BULK – POTASH, FERTILIZERS & SULPHUR
POTASHPotash, which makes up 55% of this portfolio, originates in Saskatchewan where we currently serve 10 mines. We move potash both domestically and for export. All potash shipments for export are handled by Canpotex, the world’s largest exporter of potash. In 2012, we began a 10-year transportation agreement with Canpotex for tonnes moving to the West Coast via Neptune Terminals in Vancouver and Portland Bulk Terminals in Portland. This traffi c is shipped to more than 30 countries, primarily in Asia, Latin America and Oceania. In 2013, we handled 68,000 carloads of export potash – approximately 70% went to Vancouver; 30% to Portland. Domestic potash is moved primarily to the U.S. Midwest for local application, via trainload and manifest service under long-term contracts with Mosaic, PotashCorp and Agrium. In 2013, we moved 38,000 carloads of potash domestically.
Potash, fertilizers and sulphur benefi t from the solid global fundamentals
of agribusiness and Canada’s position as the leading global producer of
potash. Our portfolio includes potash, chemical fertilizers and sulphur
shipped mainly from Western Canada to the ports of Vancouver and
Portland, as well as other Canadian and U.S. destinations.
FERTILIZERSFertilizers – which include urea, nitrogen solutions, phosphate rock, phosphate fertilizers and ammonium nitrate and sulphate – are transported throughout North America. Traffi c originates at CP-served production facilities, distribution points along the Mississippi River and various interchange points across the system. Traffi c is then moved to our local customers, primarily in the Dakotas and Corn Belt regions. We also have access to Canada’s largest nitrogen production facility in Medicine Hat and several other fertilizer production facilities in Alberta. Alberta originations accounted for roughly half of fertilizer revenues in 2013.
SULPHURSulphur is a by-product from the southern Alberta gas fi elds and oil refi ning process. While a large majority of sulphur is moved from the
plant where it is extracted, we also have local access to several sulphur handling and forming locations (we are the leading transporter of formed sulphur shipped from gas plants in southern Alberta to Port Metro Vancouver). Despite depleting gas fi elds and low gas prices, we are well positioned to handle increased volumes of sulphur out of the Alberta oilsands by way of truck to transload facilities strategically located in the Edmonton area, home also to greenfi eld sites being developed by key industry participants. In 2013, we moved 25,000 carloads of sulphur, approximately two-thirds moved as a formed product to Pacifi c Coast Terminals in Vancouver for export and the remainder moved in liquid form domestically to points in Idaho or the Southeast U.S. for use in fertilizer production.
POTASH, FERTILIZERS & SULPHUR
44 | INVESTOR FACT BOOK 2014
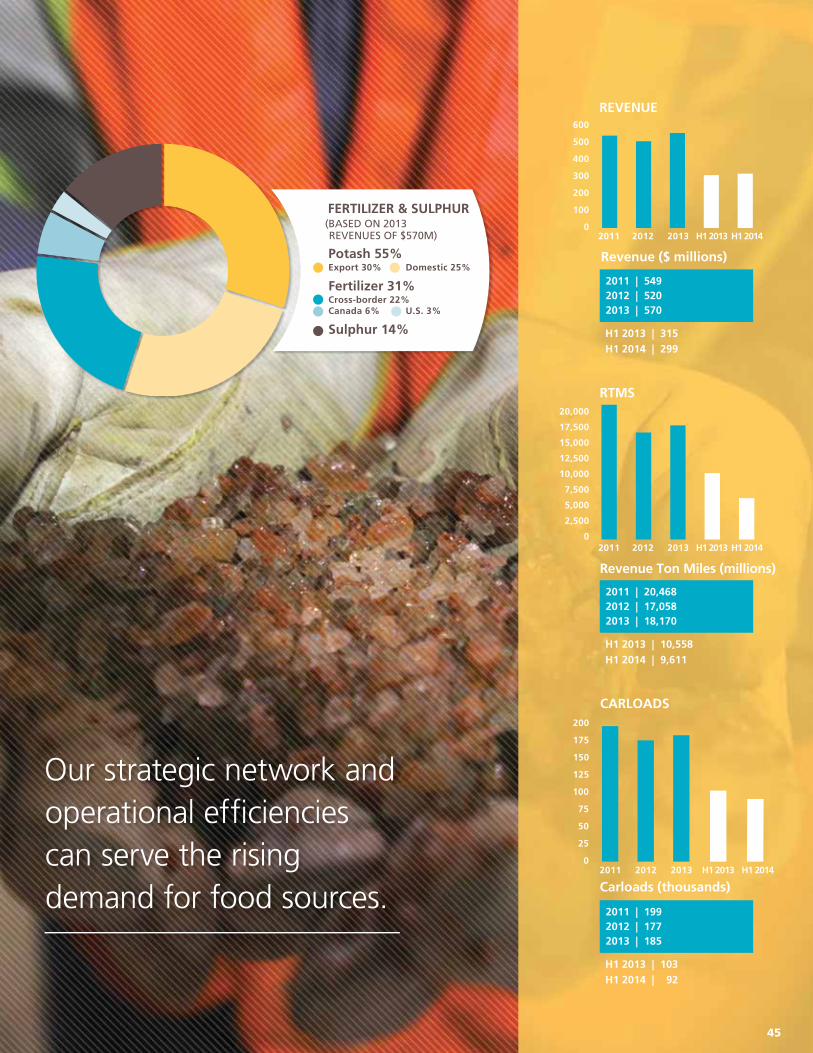
Potash 55%Export 30% Domestic 25%
Fertilizer 31%Cross-border 22% Canada 6% U.S. 3%
Sulphur 14%
FERTILIZER & SULPHUR(BASED ON 2013 REVENUES OF $570M)
0
100
200
300
400
500
600
2011 2012 2013 H1 2013 H1 2014
REVENUE
Revenue ($ millions)
H1 2013 | 315H1 2014 | 299
2011 | 5492012 | 5202013 | 570
0
50
25
75
100
125
150
175
200
2011 2012 2013 H1 2013 H1 2014
CARLOADS
Carloads (thousands)
H1 2013 | 103H1 2014 | 92
2011 | 1992012 | 1772013 | 185
0
5,000
2,500
10,000
7,500
15,000
12,500
17,500
20,000
RTMS
Revenue Ton Miles (millions)
H1 2013 | 10,558H1 2014 | 9,611
2011 | 20,4682012 | 17,0582013 | 18,170
2011 2012 2013 H1 2013 H1 2014
Our strategic network and operational effi ciencies can serve the rising demand for food sources.
45

VANCOUVER
KINGSGATE
COUTTS
CALGARY
EDMONTON
NEPTUNE TERMINALSAnnual Throughput Capacity: 11.5 MMTStorage Capacity: 0.21 MMT
PORTLAND BULK TERMINALSEstimated Annual Capacity: 4.0 MMTStorage Capacity: 0.135 MMT
These markets are driven considerably by rising demand for food sources due to population growth, changes in monetary levels and increasing diversity in diets.
High agricultural commodity prices provide incentives for farmers in market-oriented economies to invest in fertilizers and other inputs for higher productivity. Countries such as China and India have strong government support,
in the form of direct farm or input subsidies, to: increase productivity; ensure domestic food security; and, reduce exposure to price signals.
The outlook for the fertilizer industry remains positive with populations continuing to grow and the demand for effi cient land use and healthy sustainable crops remaining steady. In the next fi ve years, tight inventories and strong crop prices are expected to
OUTLOOK
Potash has become one of the most expensive and important
crop inputs. With much of North America and Europe already
established in stable fertilizer usage patterns, the leaders in
fertilizer growth are currently India, China and Brazil.
persist in the agricultural commodity markets because of the need to supply the fast-rising food, feed, fi bre and bioenergy markets. This is anticipated to drive strong fertilizer demand, although high crop-price volatility could result in signifi cant year-over-year variations.
While this sector is subject to short-term demand fl uctuations, the long-term prospects remain promising.
BULK – POTASH, FERTILIZERS & SULPHUR
46 | INVESTOR FACT BOOK 2014

SUDBURY
LLOYDMINSTER
SASKATOON
REGINAWINNIPEG
DULUTH
THUNDER BAY
TORONTO
BUFFALO
DETROIT
PHILADELPHIA
NEW YORK
ALBANY
MONTREAL
CHICAGO
MILWAUKEE
KANSAS CITY
MINNEAPOLIS/ST. PAUL
TRACY
THUNDER BAY TERMINALSEstimated Annual Capacity: 11 MMTStorage Capacity: 2 MMT
2
3
45
117
8 9
10
6
1
SASKATOON
LANIGAN
JANSENYORKTON
MOOSE JAW
WEYBURN
ESTEVAN
REGINA
POTASH MINE
EXPORT TERMINAL
1
COMMODITY FLOWS: Export potash volumes move in unit trains from mines in Saskatchewan to port facilities in Vancouver and Portland. Some volumes move eastward through Thunder Bay to the St. Lawrence Seaway. Domestic potash moves by both unit train and manifest service to the U.S. Midwest.
POTASH MINE MINE TYPE OPERATOR
ESTIMATED NAMEPLATE CAPACITY
1. Vanscoy Conventional mine
Agrium 2.1 MMT
2. Cory Conventional mine
Potash Corp 3.0 MMT
3. Patience Lake Solution mine Potash Corp 0.3 MMT
4. Allan Conventional mine
Potash Corp 4.0 MMT
5. Colonsay Conventional mine
Mosaic 2.3 MMT
6. Lanigan Conventional mine
Potash Corp 3.8 MMT
7. Belle Plaine Solution mine Mosaic 2.8 MMT
8/9. Esterhazy (K1 & K2)
Conventional mine
Mosaic 5.3 MMT
10. Rocanville Conventional mine
Potash Corp 3.0 MMT
11. Legacy (production estimated to start in mid 2016)
Solution mine K+S 2.86 MMT
47

Potash destined for Vancouver now moves in 170-car-unit trains compared to the previous model of 142 cars, maximizing capacity and effi ciency and moving more product with fewer train starts. The investments and upgrades that we have been making on our North Line track have strengthened operating effi ciencies, including reducing total route miles by more than 200 miles.
Our primary strategy surrounding the fertilizer portfolio over the next fi ve years is to concentrate on regional supply and demand models that project a growing demand for urea. This could result in a reliance on urea imports possibly beginning to compete in our natural footprint. We are working to understand how to push down the “tidal line” of imports and gain market share from the trucking industry.
STRATEGY
We are focused on collaborating with potash supply chain participants
to drive further improvements and operational effi ciencies. Recent
examples include a drop-and-lift program that: reduces switching;
allows assets to cycle more quickly and move to market faster; and,
reduces resource costs for both our company and customers.
With sulphur, we are expanding our footprint beyond originating facilities in southern Alberta. While we maintain our traditional markets, we are growing our northern Alberta capabilities by creating truck-to-rail transload capacity, allowing us to handle oilsands sulphur, and investigating further opportunities to partner with key industry participants at greenfi eld sites in the Edmonton area.
MAXIMIZING CAPACITY AND EFFICIENCY AND MOVING MORE PRODUCT WITH FEWER TRAIN STARTS
VS.170 142CARUNITS
CARUNITS
200MILESUPGRADES ON OUR NORTH LINE TRACK HAVE REDUCED TOTAL ROUTE MILES BY MORE THAN
BULK – POTASH, FERTILIZERS & SULPHUR
48 | INVESTOR FACT BOOK 2014

K+S will be putting more than 100 years of mining experience and world-class expertise to work on the Legacy Project potash mine near Moose Jaw, Saskatchewan. The Legacy Project will be the fi rst new greenfi eld potash mine built in Saskatchewan in nearly 40 years and will be exclusively served by CP.
Mine production is expected to begin in the fall of 2016 and is anticipated to ramp up to two million tonnes of production capacity by the end of 2017. The mine’s capacity is expected to gradually increase to 2.86 million tonnes thereafter.
The Legacy Project is considered key to K+S’s growth strategy. It allows K+S to expand their potash
capacities, extend the average remaining life of their mines; and, strengthen K+S’s competitiveness in Europe and abroad. Our expertise in the effi cient movement of bulk products and our ability to offer the shortest route from the mine to K+S’s domestic and export markets made us a natural transportation partner. K+S has also signed an agreement with port service provider Pacifi c Coast Terminals that will allow K+S to build and operate a new warehouse and handling facility in Vancouver.
With a unit train loop track and high speed loading capabilities, the Legacy mine will have the most modern rail infrastructure of all of the Saskatchewan potash mines.
Serving new potash customers
SPOTLIGHT
PORT CAPACITY AND INVESTMENT
CP will be the exclusive rail carrier for potash shipments from the K+S Legacy mine .
NEPTUNE TERMINALS
Neptune boasts modern, state-of-the-art equipment and handling processes. Potash throughput capacity at Neptune Terminals was increased in 2011 to 11.5 million tonnes annually from 8.5 million tonnes. Our port partners have invested $50 million including a dumper upgrade, a surge bin and
tonnes. The layout includes three loop tracks and can hold three Canpotex trains. The dumper is gravity fed and can hold four cars at one time. The storage shed can hold 135,000 tonnes of potash. A plan to double the storage capacity at the terminal was identifi ed in 2010 as part of its long-term plan.
THUNDER BAY TERMINALS
Thunder Bay Terminals is a bulk handling facility in Ontario with access to the St. Lawrence Seaway. Specializing in bulk handling the terminal has an annual throughput capacity of 11 million tonnes.
conveyor improvements. Plans are also in place for an $89-million investment to create one million tonnes per year of phosphate rock capacity at the terminal.
PORTLAND BULK TERMINALS
Portland Bulk Terminals is owned by Canpotex and currently has throughput capacity of four million
49

METALLURGICAL COAL
Metallurgical coal is a primary feedstock in the steel manufacturing process. Metallurgical coal has lower ash and sulphur contents with the volatile constituents driven off – attractive qualities for steel production. Southeast B.C. coal is considered of high quality and one of the more sought after coals on the market.
CP serves both the metallurgical and thermal coal markets.
Our Canadian coal business primarily consists of metallurgical coal
transported from southeastern B.C. to the ports of Vancouver
and Thunder Bay, and to the U.S. Midwest. Our U.S. coal business
is mainly the transportation of thermal coal and petroleum coke
within the U.S. Midwest or for export through West Coast ports.
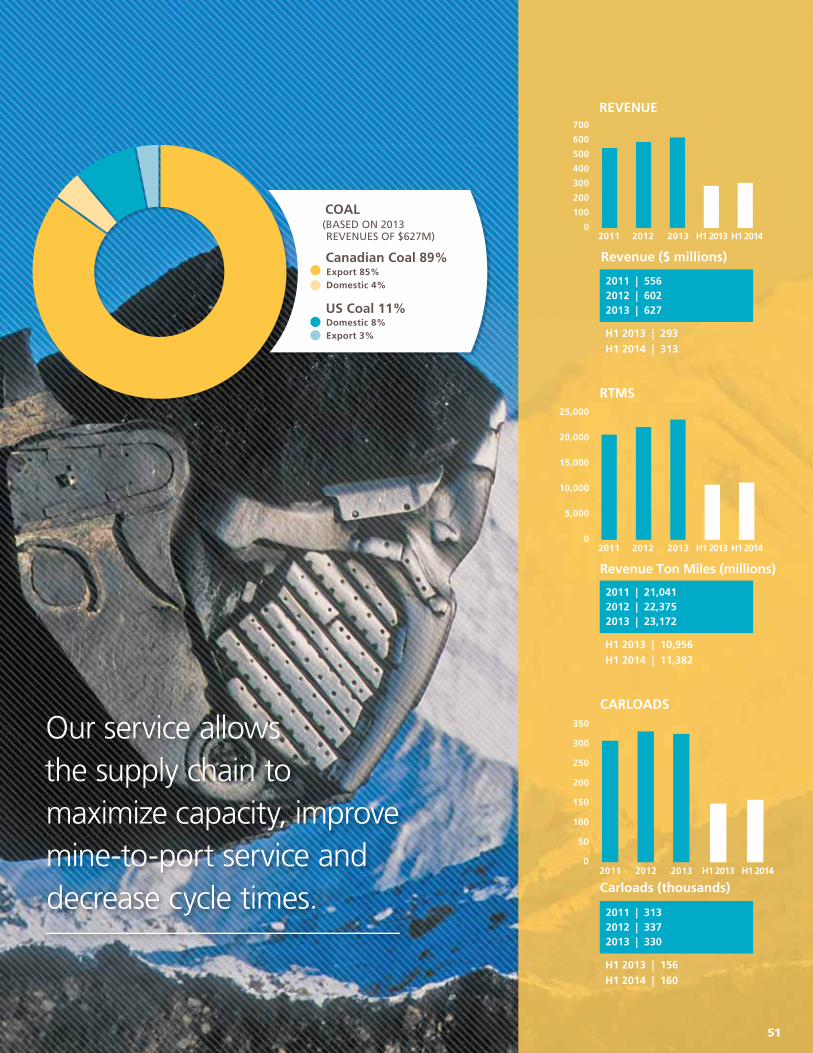
COAL
THERMAL COAL
Thermal coal is used for domestic and export power generation. Thermal coal is made attractive by middle to high British Thermal Unit (BTU) values and low amounts of sulphur, mercury and other impurities. Thermal coal is used as a fuel to produce electricity through combustion.
PETROLEUM COKE
Petroleum coke (or petcoke) is a carbonaceous material that results from the coking process during upgrading. Petroleum coke is used in power generation and aluminum production.
BULK – COAL
METALLURGICAL COAL
THERMAL COAL
PETROLEUM COKE
8884
% OF REVENUE
50 | INVESTOR FACT BOOK 2014
0
100
200
300
400
500
600
700
2011 2012 2013 H1 2013 H1 2014
REVENUE
Revenue ($ millions)
H1 2013 | 293H1 2014 | 313
2011 | 5562012 | 6022013 | 627
0
50
100
150
200
250
300
350
2011 2012 2013 H1 2013 H1 2014
CARLOADS
Carloads (thousands)
H1 2013 | 156H1 2014 | 160
2011 | 3132012 | 3372013 | 330
0
5,000
10,000
15,000
20,000
25,000
RTMS
Revenue Ton Miles (millions)
H1 2013 | 10,956H1 2014 | 11,382
2011 | 21,0412012 | 22,3752013 | 23,172
2011 2012 2013 H1 2013 H1 2014
Canadian Coal 89%Export 85%Domestic 4%
Domestic 8%Export 3%
US Coal 11%
COAL(BASED ON 2013 REVENUES OF $627M)
Our service allows the supply chain to maximize capacity, improve mine-to-port service and decrease cycle times.
51

VANCOUVER
KINGSGATE
COUTTS
CALGARY
EDMONTON
NEPTUNE TERMINALSEstimated Annual Capacity: 12.5 MMTExpansion Capacity: 18.5 MMT in 2015
RIDLEY TERMINALSEstimated Annual Capacity: 12 MMTExpansion Capacity: 24 MMT by end of 2014
WESTSHORE TERMINALSEstimated Annual Capacity: 33 MMTExpansion Capacity: 36 MMT in 2018
BULK – COAL
CANADIAN COAL
Our Canadian coal portfolio is comprised almost entirely of metallurgical coal shipments, with more than 28 million metric tonnes (MMT) transported in 2013 – equating to approximately 245,000 carloads and $560 million of revenue.
The coal is produced at Teck Resources’ fi ve southeast B.C. mines, which are considered to be among the most productive in the world. This coal is exported through Westshore and Neptune terminals in Vancouver and is destined to steel makers located in the Pacifi c Rim, Europe and South America. We have a 10-year transportation agreement with Teck which expires in 2021.
In 2013, more than 93% of our Canadian coal shipments were exported from the West Coast. The remaining 7% went to Thunder Bay terminals or rail direct to receivers in the Great Lakes area.
U.S. COAL
We moved 85,000 carloads of U.S. coal in 2013, generating $67 million of revenue. We receive U.S. coal from connecting railroads serving the thermal coal fi elds in the Powder River Basin (PRB) in Montana and Wyoming. It is then delivered to power generating facilities in the Midwest states of Minnesota, Illinois and Iowa.
We also move PRB coal destined for export from Sweetgrass, Montana through Edmonton to Ridley Terminals in Prince Rupert for delivery into Asia for power generation. Driven by increases in Asian demand, this market continues to be opportunistic with export volumes tied closely to world pricing levels of other key producing regions.
COMMODITY FLOWS: Canadian coal traffi c consists primarily of metallurgical coal transported from southeastern B.C. to the ports of Vancouver and Thunder Bay, and to the U.S. Midwest.
U.S. coal traffi c consists primarily of thermal coal which originates with other carriers in Montana or Wyoming and is interchanged with us for delivery to the U.S. Midwest or for export through West Coast ports.
52 | INVESTOR FACT BOOK 2014

SUDBURY
LLOYDMINSTER
SASKATOON
REGINA WINNIPEG
DULUTHTHUNDER BAY
TORONTO
BUFFALO
DETROIT
PHILADELPHIA
NEW YORK
ALBANY
MONTREAL
CHICAGO
MILWAUKEE
KANSAS CITY
TRACY
MINNEAPOLIS/ST. PAUL
THUNDER BAY TERMINALSEstimated Annual Capacity: 11 MMT
CANADIAN PACIFIC
PRINCIPAL HAULAGE OR TRACKAGE RIGHTS
COAL SOURCE
COAL MINE1
PRIMARY TRAFFIC FLOWS1
2
3
4
5
GOLDEN
OKE CALGARY
FORDING (9 MMT)
COUTTS
LETHBRIDGE
FORT STEELE
KINGSGATE
GREENHILLS (5.2 MMT)
LINE CREEK (3.5 MMT)
ELKVIEW (6.5 MMT)
COAL MOUNTAIN (2.7 MMT)
MMT = ANNUAL PRODUCTION CAPACITY IN MILLION METRIC TONNES
53

Population growth and climate are the main catalysts for thermal coal demand. An estimated 40% of the world’s electricity comes from coal. In the U.S., the fi gure is roughly one-third, down from nearly 50% just four years ago. The combination of regulatory changes calling for stricter controls on emissions and abundant gas supplies at near historic lows in recent years have resulted in some short- and long-term conversion to gas in the U.S. However, U.S. demand could slowly begin to rebound with any increases in gas prices. Although coal-produced electricity may be moderating in North America, China is building coal generated facilities every year and is extremely dependent on this energy source.
Economic growth in developing countries is driving global steel demand with long-term growth expected to continue. Accordingly, global seaborne metallurgical coal demand is expected to increase to meet the needs of both
our traditional markets in Japan, Europe and Korea; as well as growth markets in China, India and Brazil. The corresponding increase in demand for Canadian-based metallurgical coal will be met by announced Teck expansion plans and greenfi eld development in both northeast and southeast B.C.
We have been in discussions with a number of parties regarding mine development plans near our mainline in southeast B.C. With a reserve of high-quality coal at these locations, our current and potential partners are expected to maintain a strong position in the metallurgical coal marketplace. Our supply chain is an effi cient and reliable way to get coal from these mines to the ports and loaded onto vessels.
In the U.S., proposed domestic power-plant emission regulations and competitiveness of natural gas as a viable alternative will continue to challenge
The demand for steel production is driven by population growth
and corresponding increases in GDP, urbanization and industrial
development. China, India, Indonesia and Brazil are expected to account
for the majority of the incremental demand for metallurgical coal.
the coal industry. Our primary movements originate on Class 1 rail partners out of the PRB, destined to utility providers for electrical generation in the U.S. Midwest. Our volumes have not been impacted to the extent seen across the marketplace, largely due to the fact that the power generation facilities we serve have less ability to switch to gas with their current infrastructure. As well, these facilities are newer and have been able to meet regulatory standards with relatively less investment.
Growth in Asian demand will continue to present opportunities for incremental movements of PRB-originating coal. We participate in the most effi cient route to Prince Rupert’s Ridley Terminal and are well positioned to capitalize on future opportunities to supply the market.
OUTLOOK
BULK – COAL
54 | INVESTOR FACT BOOK 2014

There was a time when people said bulk trains couldn’t be scheduled. However, our trains carrying Teck coal to two Port Metro Vancouver terminals are now running close to clockwork.
We move fi ve trains a day – one every four hours – shipping more coal than we did a year ago at this time. And with fewer trains.
With customer collaboration, successful implementation and execution, ongoing process improvement and clear communication, we are providing better service to our largest customer than ever before.
The most signifi cant shift was fl ipping the entire shipping philosophy on its head. Instead of pushing the largest amount of coal possible to be stock piled at the distribution terminals, a new operating philosophy called “pull-to-demand” (PTD) was launched.
PTD focuses on serving demand. In the past, coal would pile up at the terminals – more coal than the terminals could load on incoming ocean vessels. Meanwhile, full trains were plugging up the tracks, sometimes waiting for days before terminals had capacity to empty the incoming freight.
This situation damaged our system: crews got out of balance; cars jammed up waiting to get unloaded; and, we kept adding cars at the loading zones. The fl eet size became bloated, network speed was impacted and service was sub-optimal.
Today, coal trains run at evenly spaced intervals, with a consistent fl ow to ports.
With this new improved service, our partners can better schedule production, inventory, and vessels.
Moving more, and on time
SPOTLIGHT
Today, coal trains run at evenly spaced intervals, with a consistent fl ow to ports.
55
In 2012, we transitioned the export supply network to 152-car unit trains (previously 129 cars), allowing the supply chain to maximize capacity, improve mine-to-port service and decrease cycle times.
In conjunction with our partners, we are continually developing and introducing a suite of supply chain tools to provide all parties visibility to performance, metrics and train movements. This provides for aligned planning and execution between our operations
teams, the ports and mines. Additional investments in technology include remote load-out systems being introduced for the fi rst time at one mine (with potential for rollout at additional locations). This enables Teck’s load-out operators to control the train remotely while loading the train at the same time. The technology also reduces the number of our crews required to complete the load-out process and optimizes resource planning and asset utilization for both Teck and our company.
We continue to invest in building a world-class coal and transportation
model. Our service is based on highly effi cient unit trains that travel in
continuous motion from the mine to port and back.
Our collaborative approach with customers is an ongoing commitment resulting in a continuous improvement to the supply chain and supporting technologies. This includes communication and data-sharing initiatives, a pull-to-demand strategy and ongoing review and revision to ensure programs are working as anticipated. These strategies, along with expansion plans in both new and existing mine production and West Coast port capacity, will ensure we can meet current and expected growth in future demand.
STRATEGY
BULK – COAL
56 | INVESTOR FACT BOOK 2014
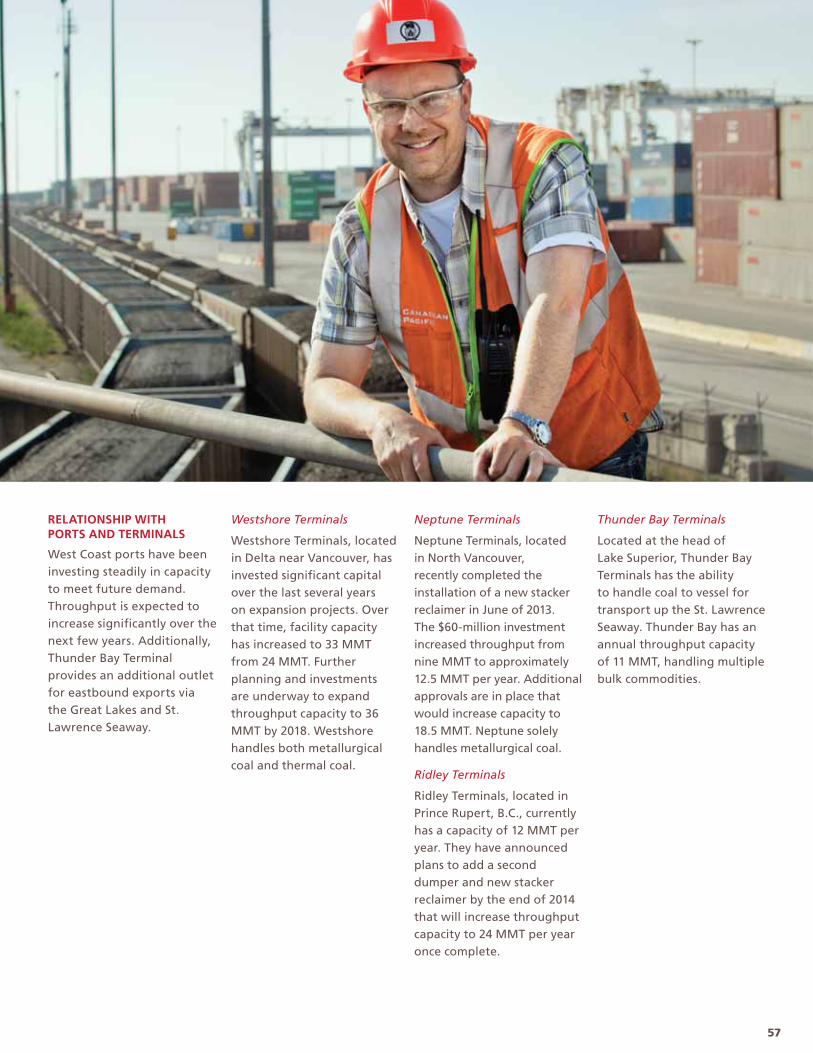
RELATIONSHIP WITH PORTS AND TERMINALS
West Coast ports have been investing steadily in capacity to meet future demand. Throughput is expected to increase signifi cantly over the next few years. Additionally, Thunder Bay Terminal provides an additional outlet for eastbound exports via the Great Lakes and St. Lawrence Seaway.
Westshore Terminals
Westshore Terminals, located in Delta near Vancouver, has invested signifi cant capital over the last several years on expansion projects. Over that time, facility capacity has increased to 33 MMT from 24 MMT. Further planning and investments are underway to expand throughput capacity to 36 MMT by 2018. Westshore handles both metallurgical coal and thermal coal.
Neptune Terminals
Neptune Terminals, located in North Vancouver, recently completed the installation of a new stacker reclaimer in June of 2013. The $60-million investment increased throughput from nine MMT to approximately 12.5 MMT per year. Additional approvals are in place that would increase capacity to 18.5 MMT. Neptune solely handles metallurgical coal.
Ridley Terminals
Ridley Terminals, located in Prince Rupert, B.C., currently has a capacity of 12 MMT per year. They have announced plans to add a second dumper and new stacker reclaimer by the end of 2014 that will increase throughput capacity to 24 MMT per year once complete.
Thunder Bay Terminals
Located at the head of Lake Superior, Thunder Bay Terminals has the ability to handle coal to vessel for transport up the St. Lawrence Seaway. Thunder Bay has an annual throughput capacity of 11 MMT, handling multiple bulk commodities.
57
58 | INVESTOR FACT BOOK 2014
MERCHANDISE
CP’s crude-by-rail services have been growing at a rapid pace. Carloads
have grown from 11,000 in 2011 to 90,000 in 2013, making crude our
fastest growing line of business.
The crude-by-rail model was developed in 2010 in response to inadequate pipeline takeaway capacity in the quickly growing Bakken shale region. We proved in the Bakken that rail could provide reliable takeaway capacity and ratable delivery to refi neries. Since this time, the model has successfully moved north into the light-, mid- and heavy-grades of Saskatchewan and Alberta crude.
There are several elements of the crude-by-rail model that make it sustainable.
CAPACITY
Rail capacity is immediately available, easy to access and has lower upfront capital costs relative to pipeline projects.
OPTIONALITY
Rail provides industry with access to all refi ning markets from all producing regions. Rail serves as a
CRUDE
supplement to pipelines that do not provide either suffi cient capacity or access to markets. With rail, the industry has the ability to supply consistent refi ning requirements or to quickly move between markets to capture the benefi t of changing conditions.
FLEXIBILITY
Rail provides solutions for both small- and large-scale operations, and accommodates terms ranging from a few months to several years.
SPEED TO MARKET
Rail can reliably provide faster transit times than pipelines. This time difference translates into lower inventory costs, faster working capital turns and lower cost of carry.
VALUE
Although rail is not always equal to existing pipelines in terms of price, the model provides more compelling value through its service features. In the case of heavy oil, rail economics become more compelling. Where bitumen is required to be diluted up to 30% to travel in pipelines, rail can transport it in general purpose tank cars at dilution levels of 15% to 20% or in insulated tank cars with little to no dilution. Thus, rail reduces the requirement to both purchase and move diluent.
Importantly, we are the only railroad with access to all of the Bakken light-sweet crude, the medium-grade oil producing regions in Alberta, and the heavier oil production in northern Alberta and Saskatchewan.

Bakken 54%Western Canada 46%
CRUDE(BASED ON 2013 REVENUES OF $375M)
Our optionality not only provides the industry with fl exibility, but ensures we can capture volumes as markets change.
0
200
100
300
400
2011 2012 2013 H1 2013 H1 2014
REVENUE
Revenue ($ millions)
H1 2013 | 189H1 2014 | 218
2011 | 292012 | 2062013 | 375
0
25
50
75
100
2011 2012 2013 H1 2013 H1 2014
CARLOADS
Carloads (thousands)
H1 2013 | 46H1 2014 | 49
2011 | 112012 | 542013 | 90
0
5,000
2,500
7,500
10,000
12,500
15,000
RTMS
Revenue Ton Miles (millions)
H1 2013 | 7,131H1 2014 | 7,174
2011 | 1,0962012 | 7,3032013 | 13,898
2011 2012 2013 H1 2013 H1 2014
59

60 | INVESTOR FACT BOOK 2014
We have a strong origination franchise for crude oil throughout Alberta,
Saskatchewan and North Dakota. Crude-by-rail has evolved from
smaller truck-to-rail manifest facilities into the development of larger
scale unit train terminals.
We are connected at these origin facilities with direct production as well as pipeline access. Additional crude-by-rail projects are currently being contemplated and progressed, and we are well positioned to take on additional capacity.
We move crude oil to refi ning markets in Eastern Canada, the Northeast U.S., the Midwest, the Gulf Coast and the West Coast. The majority of these volumes travel to destination through connections with our interline railroad partners. While potential exists in all
OUTLOOK
markets, our most signifi cant growth in the near term will continue to be in the Gulf Coast and Northeast U.S. markets.
We expect to move 115,000-120,000 carloads of crude in 2014 and anticipate it will grow to nearly 200,000 carloads in 2015.
We expect to move 115,000-120,000 carloads of crude in 2014 and anticipate it will grow to nearly 200,000 carloads in 2015.
MERCHANDISE – CRUDE
FPO
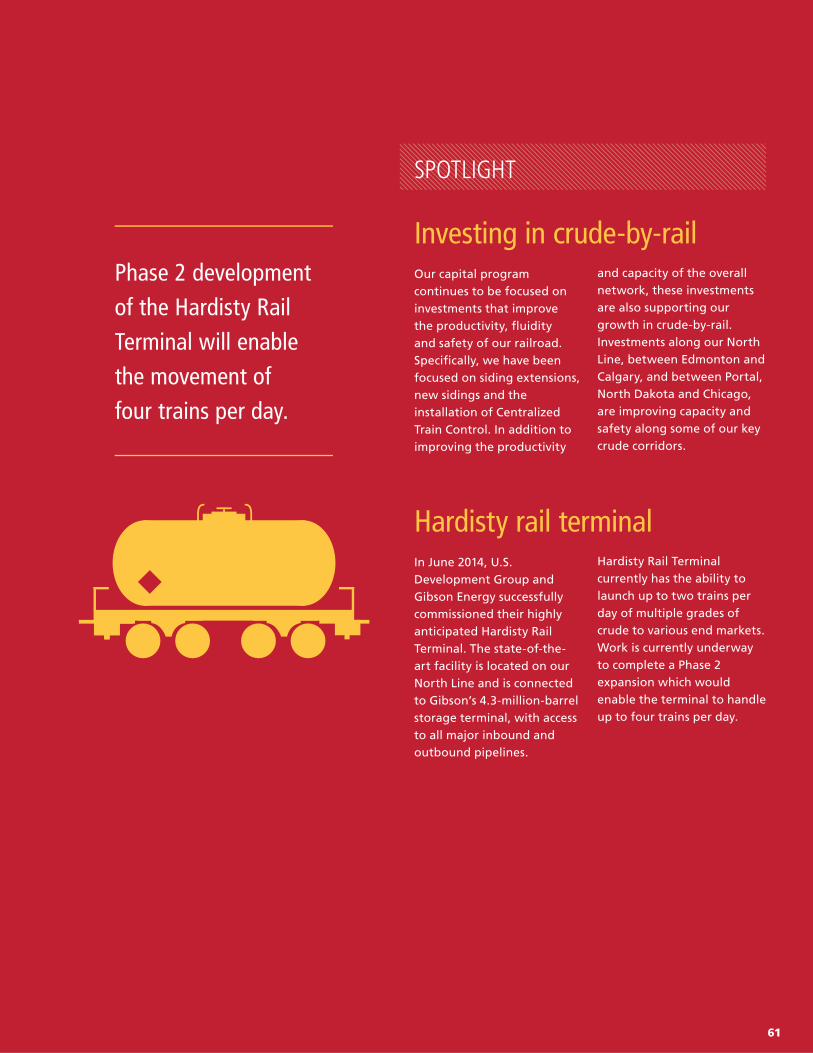
Our capital program continues to be focused on investments that improve the productivity, fl uidity and safety of our railroad. Specifi cally, we have been focused on siding extensions, new sidings and the installation of Centralized Train Control. In addition to improving the productivity
In June 2014, U.S. Development Group and Gibson Energy successfully commissioned their highly anticipated Hardisty Rail Terminal. The state-of-the-art facility is located on our North Line and is connected to Gibson’s 4.3-million-barrel storage terminal, with access to all major inbound and outbound pipelines.
Investing in crude-by-rail
Hardisty rail terminal
SPOTLIGHT
Phase 2 development of the Hardisty Rail Terminal will enable the movement of four trains per day.
and capacity of the overall network, these investments are also supporting our growth in crude-by-rail. Investments along our North Line, between Edmonton and Calgary, and between Portal, North Dakota and Chicago, are improving capacity and safety along some of our key crude corridors.
Hardisty Rail Terminal currently has the ability to launch up to two trains per day of multiple grades of crude to various end markets. Work is currently underway to complete a Phase 2 expansion which would enable the terminal to handle up to four trains per day.
61
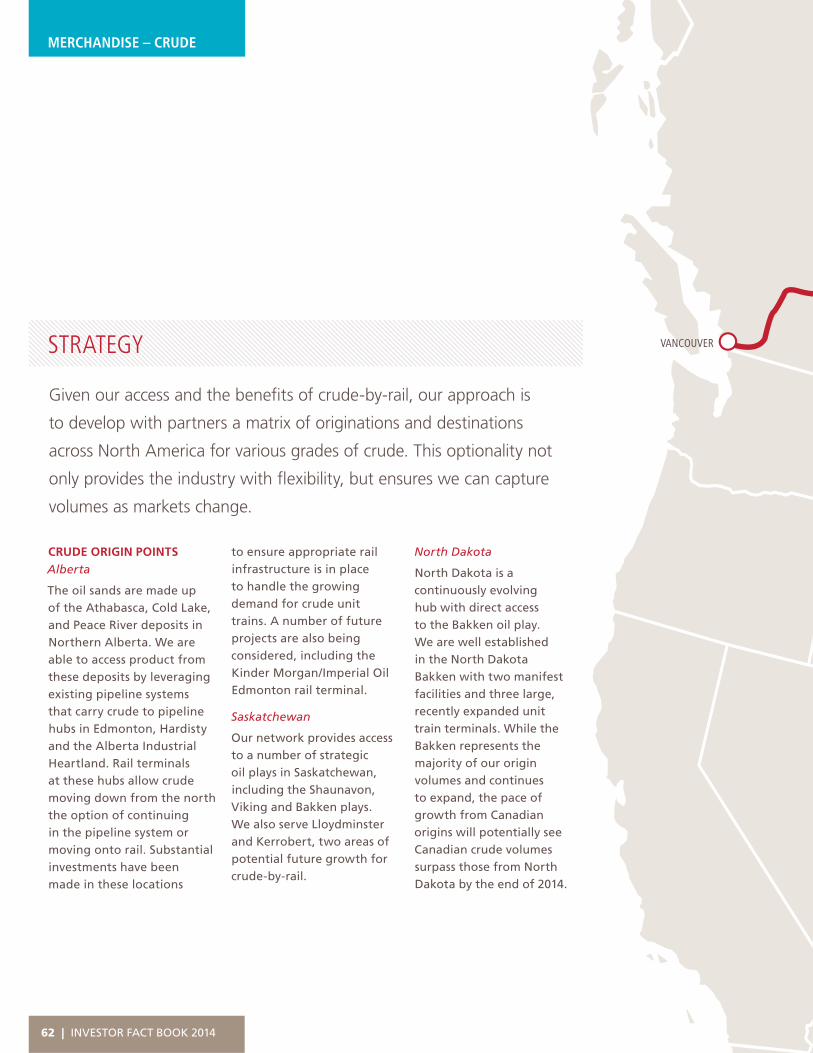
VANCOUVER
62 | INVESTOR FACT BOOK 2014
STRATEGY
Given our access and the benefi ts of crude-by-rail, our approach is
to develop with partners a matrix of originations and destinations
across North America for various grades of crude. This optionality not
only provides the industry with fl exibility, but ensures we can capture
volumes as markets change.
CRUDE ORIGIN POINTSAlberta
The oil sands are made up of the Athabasca, Cold Lake, and Peace River deposits in Northern Alberta. We are able to access product from these deposits by leveraging existing pipeline systems that carry crude to pipeline hubs in Edmonton, Hardisty and the Alberta Industrial Heartland. Rail terminals at these hubs allow crude moving down from the north the option of continuing in the pipeline system or moving onto rail. Substantial investments have been made in these locations
to ensure appropriate rail infrastructure is in place to handle the growing demand for crude unit trains. A number of future projects are also being considered, including the Kinder Morgan/Imperial Oil Edmonton rail terminal.
Saskatchewan
Our network provides access to a number of strategic oil plays in Saskatchewan, including the Shaunavon, Viking and Bakken plays. We also serve Lloydminster and Kerrobert, two areas of potential future growth for crude-by-rail.
North Dakota
North Dakota is a continuously evolving hub with direct access to the Bakken oil play. We are well established in the North Dakota Bakken with two manifest facilities and three large, recently expanded unit train terminals. While the Bakken represents the majority of our origin volumes and continues to expand, the pace of growth from Canadian origins will potentially see Canadian crude volumes surpass those from North Dakota by the end of 2014.
MERCHANDISE – CRUDE

KINGSGATE
COUTTS
CALGARY
EDMONTON
LLOYDMINSTER
SASKATOON
REGINA
WINNIPEG
DULUTH
THUNDER BAY
CHICAGO
MILWAUKEE
KANSAS CITY
TRACY
MINNEAPOLIS/ST. PAUL
CURRENTLY MOVING CRUDE
UNDER DEVELOPMENT
LIGHT CRUDE OIL DEPOSITS
MEDIUM CRUDE OIL DEPOSITS
HEAVY CRUDE OIL DEPOSITS
1
1
MANIFEST
1. Scotford, AB2. Calmar/Texaco Spur, AB3. Tilley, AB4. Bowden, AB5. Rimbey, AB6. Lethbridge, AB7. Lloydminster, SK8. Instow, SK9. Dollard, SK10. Southhall, SK11. Estevan, SK12. Unity, SK (1)13. Unity, SK (2)
TRAINLOAD
14. Bruderheim, AB15. Hardisty, AB16. Stampede, ND17. Van Hook, ND18. New Town, ND19. Stoughton, SK20. Kerrobert, SK21. Edmonton, AB22. Plaza, ND
63
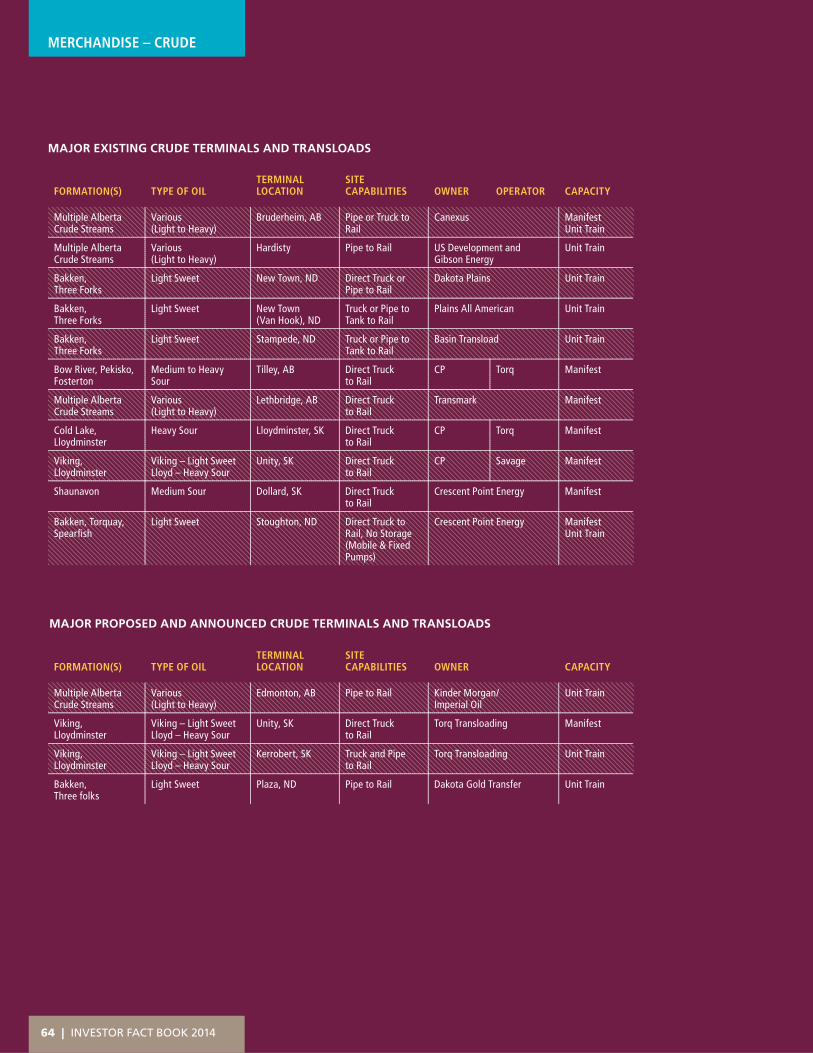
64 | INVESTOR FACT BOOK 2014
MERCHANDISE – CRUDE
FORMATION(S) TYPE OF OILTERMINAL LOCATION
SITE CAPABILITIES OWNER OPERATOR CAPACITY
Multiple Alberta Crude Streams
Various (Light to Heavy)
Bruderheim, AB Pipe or Truck to Rail
Canexus ManifestUnit Train
Multiple Alberta Crude Streams
Various (Light to Heavy)
Hardisty Pipe to Rail US Development and Gibson Energy
Unit Train
Bakken, Three Forks
Light Sweet New Town, ND Direct Truck or Pipe to Rail
Dakota Plains Unit Train
Bakken, Three Forks
Light Sweet New Town (Van Hook), ND
Truck or Pipe to Tank to Rail
Plains All American Unit Train
Bakken, Three Forks
Light Sweet Stampede, ND Truck or Pipe to Tank to Rail
Basin Transload Unit Train
Bow River, Pekisko, Fosterton
Medium to Heavy Sour
Tilley, AB Direct Truck to Rail
CP Torq Manifest
Multiple Alberta Crude Streams
Various (Light to Heavy)
Lethbridge, AB Direct Truck to Rail
Transmark Manifest
Cold Lake, Lloydminster
Heavy Sour Lloydminster, SK Direct Truck to Rail
CP Torq Manifest
Viking, Lloydminster
Viking – Light SweetLloyd – Heavy Sour
Unity, SK Direct Truck to Rail
CP Savage Manifest
Shaunavon Medium Sour Dollard, SK Direct Truck to Rail
Crescent Point Energy Manifest
Bakken, Torquay, Spearfi sh
Light Sweet Stoughton, ND Direct Truck to Rail, No Storage (Mobile & Fixed Pumps)
Crescent Point Energy ManifestUnit Train
FORMATION(S) TYPE OF OILTERMINAL LOCATION
SITE CAPABILITIES OWNER CAPACITY
Multiple Alberta Crude Streams
Various (Light to Heavy)
Edmonton, AB Pipe to Rail Kinder Morgan/Imperial Oil
Unit Train
Viking, Lloydminster
Viking – Light SweetLloyd – Heavy Sour
Unity, SK Direct Truck to Rail
Torq Transloading Manifest
Viking, Lloydminster
Viking – Light SweetLloyd – Heavy Sour
Kerrobert, SK Truck and Pipe to Rail
Torq Transloading Unit Train
Bakken, Three folks
Light Sweet Plaza, ND Pipe to Rail Dakota Gold Transfer Unit Train
MAJOR EXISTING CRUDE TERMINALS AND TRANSLOADS
MAJOR PROPOSED AND ANNOUNCED CRUDE TERMINALS AND TRANSLOADS

CRUDE DESTINATION ACCESS
Our main crude unloading destination is the Global Partners terminal located in Albany, NY. This terminal is a rail-to-vessel operation where the vessels serve refi neries along the Canadian and U.S. East Coast, and U.S. Gulf Coast. We also access other refi neries and terminals through established foreign-line partnerships. PADDs 1, 3 and 5 are particular points of interest for our crude-by-rail destination reach.
• PADD 1 (U.S. East Coast): predominantly processes light sweet crude that can be sourced from our Bakken terminals.
• PADD 3 (U.S. Gulf Coast): contains a large proportion of the refi neries capable of processing heavy crude, making it a preferred outlet for product coming
SUDBURY
VANCOUVER
KINGSGATECOUTTS
PADD 5West Coast
PADD 4Rocky Mountain PADD 2
Midwest
PADD 3Gulf Coast
PADD 1East Coast
CALGARY
EDMONTONLLOYDMINSTER
SASKATOON
REGINAWINNIPEG
DULUTH
THUNDER BAY
TORONTO
BUFFALODETROIT
PHILADELPHIA
NEW YORK
ALBANY
MONTREAL
CHICAGO
MILWAUKEE
KANSAS CITY
MINNEAPOLIS/ST. PAUL
TRACY
from the oil sands. This was the primary market for Canadian crude-by-rail volumes in 2013.
• PADD 5 (West Coast): There are a number of rail projects being pursued in this district that, once complete, could source product from Western Canada. We can provide the shortest route miles from Western Canada into California.
As the markets evolve, the necessity for tidewater access continues to grow. Foreign crude demand in Asia and Europe is increasing and we are investigating ways in which these markets can be reached. We are looking to leverage our position on the West Coast, St. Lawrence Seaway, Great Lakes and the Mississippi River to access both foreign and domestic markets.
Corridors andfl exibility
We continue to explore ways to extract end-to-end supply chain effi ciencies by interchanging traffi c with foreign line partners to deliver faster transit times and alleviate congestion in key pinch points. It is our goal to continue to
deliver crude production to high-growth refi ning destinations. Access to numerous interchange points provides our customers with the fl exibility of accessing their markets through various routes. It also provides contingency options to make improvements to service as needed.
CLASS 1 RAIL PARTNERS
INTERCHANGE LOCATIONS
CRUDE MARKET ACCESS
BNSF New Westminster, Coutts, Noyes
PADDs 2, 3, 4, 5
UP Kansas City, Kingsgate PADDs 2, 3, 5
CSX Chicago PADD 1
NS Chicago PADD 1
KCS Kansas City PADDs 2,3
65

66 | INVESTOR FACT BOOK 2014
MERCHANDISE
In addition to fi nished vehicles, we handle shipments of automotive parts, machinery and Canadian personal and pre-owned vehicles.
Right from the production plant, we provide direct rail service to fi ve of the eight southern Ontario auto producers, and service two others through transload facilities in the region. We also handle a signifi cant number of shipments via gateway interchange with our foreign line counterparts.
We operate a number of automotive compounds in key markets across Canada
CP is a key player in the North American automotive supply chain.
Our automotive portfolio consists of four fi nished vehicle traffi c
segments: import vehicles that move through Port Metro Vancouver
to Eastern Canadian markets; Canadian-produced vehicles that ship
to the U.S. from Ontario production facilities; U.S.-produced vehicles
that ship within the U.S. as well as cross-border into Canadian markets;
and, Mexican-produced vehicles that ship to the U.S. and Canada.
and the U.S. These facilities operate seven days a week and provide customers with vehicle loading and unloading services. Through our coast-to-coast Canadian rail network – that stems into the U.S. Midwest – and well-positioned compounds, we are ideally situated to access key markets and port facilities.
In 2013, we handled 145,000 carloads of automotive product equating to $403 million in revenue. Approximately 51% of these revenues originated in Ontario; 20% originated in the U.S.; 14% were imports originating at Port Metro Vancouver; and, 7% were imports originating in Mexico.
AUTOMOTIVE
We continue to lead the industrywith the lowest damage frequenciesfor fi nished vehicles.

AUTOMOTIVE(BASED ON 2013 REVENUES OF $403M)
Finished Vehicles& Parts 92%Origin Canada 65%Origin US 20%Origin Mexico 7%
Machinery 6%Used Vehicles 2%
0
100
200
300
400
500
2011 2012 2013 H1 2013 H1 2014
REVENUE
Revenue ($ millions)
H1 2013 | 203H1 2014 | 192
2011 | 3382012 | 4252013 | 403
0
25
50
75
100
125
150
175
2011 2012 2013 H1 2013 H1 2014
CARLOADS
Carloads (thousands)
H1 2013 | 73H1 2014 | 67
2011 | 1452012 | 1622013 | 146
0
500
1,000
1,500
2,000
2,500
RTMS
Revenue Ton Miles (millions)
H1 2013 | 1,233H1 2014 | 1,111
2011 | 2,0802012 | 2,4822013 | 2,329
2011 2012 2013 H1 2013 H1 2014
We are perfectly poised to handle the upward trend in the market.
67

68 | INVESTOR FACT BOOK 2014
KINGSGATE
VANCOUVER
14%VANCOUVER
OUTLOOK
STRATEGY
ALIGNMENT WITH INDUSTRY LEADERS
Our automotive franchise is built around alignment with strong industry performers, such as Toyota and Honda. Through strategic partnerships, the lowest damage frequency in the industry, and our solid product offerings, we are ideally positioned for retention and growth with our core customer base. This strong base lays the foundation for growth with other industry participants as we look to foster and build a fully integrated automotive network.
PRODUCTION SHIFT TO MEXICO
As more import models shift production to North America (Mexico), we stand to benefi t from adjusted traffi c fl ows that will change from “west to east” across Canada to a more “south to north” axis as we leverage our Kansas City Gateway to interchange traffi c bound for the U.S. Midwest and Canada. This shift will allow us to optimize overall car supply as more loads will originate offl ine and terminate in Canada, and eliminates the need to source empty equipment from elsewhere on the network.
LOW COST GROWTH
Strategically developed cost-reduction initiatives and shifting production to Mexico are both crucial to improving the overall profi tability of our automotive franchise. By replacing high empty-car repositioning with an increase in in-bound loads, we will signifi cantly reduce our cost structure while increasing effectiveness and effi ciency.
Further, the operational changes we’ve made over the last two years have created the capacity in our fl eet and facilities to accommodate the growth prospects ahead of us without the need for signifi cant capital investment.
We will work with our automotive partners and stakeholders to
execute our operating plan and strategy. Our anticipated growth
will come from focusing on key metrics and providing fl uid on-time
service to all of our customers.
MERCHANDISE – AUTOMOTIVE
Volumes in the second half of 2014 and fi rst half of 2015 will be challenged due to the loss of a major customer. However, North American lightweight vehicle production and vehicle sales remain strong over the next
few years. We are perfectly poised to handle the upward trend in the market. We are aligned with industry leaders in the marketplace and strategically equipped to handle shifting production. We are also well-equipped
to fulfi ll the North American trend in market demand for trucks and SUVs.

SUDBURY
COUTTS
LLOYDMINSTER
DULUTH
THUNDER BAY
TORONTO
BUFFALO
PHILADELPHIA
NEW YORK
ALBANY
MONTREAL
CHICAGO
KANSAS CITY
MINNEAPOLIS/ST. PAUL
TRACY
EDMONTON
SASKATOON
REGINAWINNIPEG
ST. LUC
QUEBEC
CALGARY
WINDSOR
EC ROW
COTTAGE GROVE
AGINCOURT
SAINT JOHN
MILWAUKEE
51%
20%
ONTARIO
UNITED STATES
COMMODITY FLOWS: We access a network of automotive compounds facilitating fi nal delivery of vehicles to dealers throughout Canada, Minnesota and the Northeast U.S.
7%MEXICO
CITY
SUDBURY
BUFFALO
WINDSOR
TORONTO
HONDA ALLISTON
GMOSHAWA
CHRYSLERBRAMPTON
TOYOTAWOODSTOCK
CHRYSLERWINDSOR
GM INGERSOLL
TOYOTACAMBRIDGE
LONDON
CANADIAN PACIFIC
PRINCIPAL HAULAGE OR
AUTOMOTIVE COMPOUNDS
FINISHED VEHICLE ORIGINATIONS(based on revenues)
TRACKAGE RIGHTS
%
69

MERCHANDISE
70 | INVESTOR FACT BOOK 2014
In 2013, we handled 232,000 carloads of metals, minerals and consumer products equating to $608 million, or 10% of total freight revenues.
AGGREGATES
Aggregates are comprised of coarse particulate and composite materials such as frac sand, cement, clay, gravel, salt, and gypsum. Aggregates are used in a variety of functions: from base materials under foundations and roadways to use in the hydraulic fracturing process.
Frac sand and cement make up approximately 75% of all aggregate shipments. Frac sand originates at mines
Metals, minerals and consumer products continue to be one of CP’s
highest growth portfolios. The portfolio is involved in the transportation
of a diverse mix of input materials which includes aggregates, steel,
consumer products and non-ferrous metals.
located along our network in Iowa and Wisconsin and moves to a diverse set of shale plays across North America. The majority of our cement traffi c is direct-line haul traffi c produced in Alberta, Iowa, Ontario or Montana and shipped to construction and energy
projects in North Dakota, Alberta, Manitoba and the U.S. Midwest.
Demand for the remainder of aggregate products is primarily driven by construction-sector growth and ships both to and from a variety of locations across our network.
METALS, MINERALS & CONSUMER PRODUCTS
Frac sand and cement make up approximately 75% of all aggregate shipments.

METALS, MINERALS & CONSUMER PRODUCTS (BASED ON 2013 REVENUES OF $608M)
Aggregates 48%Steel 34%Consumer Products 12%Mines & Metals 6%
0
100
200
300
400
600
500
2011 2012 2013 H1 2013 H1 2014
REVENUE
Revenue ($ millions)
H1 2013 | 285H1 2014 | 331
2011 | 4992012 | 5502013 | 608
0
50
100
150
200
250
2011 2012 2013 H1 2013 H1 2014
CARLOADS
Carloads (thousands)
H1 2013 | 112H1 2014 | 116
2011 | 2182012 | 2222013 | 232
0
2,500
5,000
7,500
10,000
RTMS
Revenue Ton Miles (millions)
H1 2013 | 4,850H1 2014 | 5,411
2011 | 9,5042012 | 9,9332013 | 10,404
2011 2012 2013 H1 2013 H1 2014
We expect this upward trajectory to continue, targeting $1 billion in annual revenues by 2020.
71
72 | INVESTOR FACT BOOK 2014
STEEL
We transport steel in a variety of forms, including pipe, coil, plate and scrap. The Ontario, Saskatchewan and Iowa steel mills we serve are major suppliers to industries spanning oil and gas, transportation, packaging and construction. End products include steel pipe, automobiles, railcars and appliances.
Approximately one-third of steel revenues are derived from the movement of scrap steel, used as an input material for the production
In particular, frac sand, steel pipe and cement will lead future growth, driven by the strength in the energy sector and further development of North American shale plays. We currently have fi ve frac sand mines on our lines, with plans to develop two new facilities and two plant expansions in 2015. Meanwhile, our largest cement customer, Lafarge, has begun expansion on its Exshaw plant to support growing North American shale development. The Exshaw expansion, expected to be complete in 2015,
of coil, pipe and cast-iron products. Shipments of scrap metal originate from centres across North America and primarily funnel toward key steelmaking facilities in Regina, Saskatchewan and Montpelier, Iowa.
MINES & METALS
We carry mined non-ferrous base metals such as copper, ores, lead, zinc and aluminum. Unrefi ned ores are transported from mines to smelters and refi neries for processing. We then ship the processed metal to end customers in the automobile
industry and makers of consumer products such as appliances and batteries.
CONSUMER PRODUCTS
Consumer products consist of a diverse mix of goods such as food products, building materials, packaging products, waste products, private railroad equipment, and other miscellaneous goods. Approximately half of the portfolio is represented by food products such as frozen French fries, meats, vegetables, sugar, and beverages.
will increase production by approximately 60%.
Increased steel production will also result in steady growth of input materials, such as scrap steel. We expect improvements in asset velocity and subsequent empty order fulfi llment will enable us to capture a large portion of that growth.
Although mines and metals are expected to remain somewhat fl at in the near term, we will continue to work closely with customers on new opportunities.
There is potential growth for copper and we anticipate growth in aluminum as a result of new government regulations seeking to improve fuel effi ciency. This has spurred some steel-for-aluminum substitution as car manufacturers look for ways to cut vehicle weight.
As the economy continuesits recovery in North America, and construction programs pick up, we expect the remainder of the portfolioto grow with, or slightly above, GDP.
OUTLOOK
With an extensive rail network and signifi cant improvements in service
reliability and cycle times, our portfolio is well positioned to continue to
outpace GDP for the next several years.
MERCHANDISE – METALS, MINERALS & CONSUMER PRODUCTS

The innovative technique of multi-stage horizontal fracturing has signifi cantly increased the economics of shale projects and the number of wells being drilled in North America on an annual basis. Frac sand is used as a proppant in the hydraulic fracturing process to keep fractures and pores open so that oil and gas can fl ow out.
We have direct access into Wisconsin, the largest producer of the highly sought after Northern White frac sand. We originate traffi c directly from frac sand mines located along our track in Iowa and Wisconsin and move the product in customer-owned cars to a diverse set of shale plays including the Bakken, Marcellus, Eagleford and Western Canadian Sedimentary Basin either via single line haul or in
concert with one of our many interchange partners.
In 2013, we moved approximately 31,000 carloads of frac sand, a 54% increase from the year previous. We expect frac sand shipments will continue to grow at a rapid pace – 60,000 annual carloads estimated by 2016. This growth will come in the form of increased traffi c from existing customers, new facilities emerging on our lines, and through additional volumes - bound for the Bakken or Western Canada - being interchanged to us.
The importance of frac sand to the hydraulic fracturing process and the great distances between the shale plays and silica deposits, necessitates shipment by rail. As the number of wells in North America continues to grow, so, too, will shipments of sand by rail.
Frac sand fuelling growth
SPOTLIGHT
We expect frac sand shipments will continue to grow at a rapid pace.
MARCELLUS
BARNETT
BAKKENEAGLE FORD
PERMIAN
OTHER
WESTERNCANADA
9
9 18
16
1414
12
5 2 1WOODFORD
NIOBARA HAYNESVILLE
FRAC SAND DESTINATIONS (SHALE PLAYS / % CARLOADS)
73
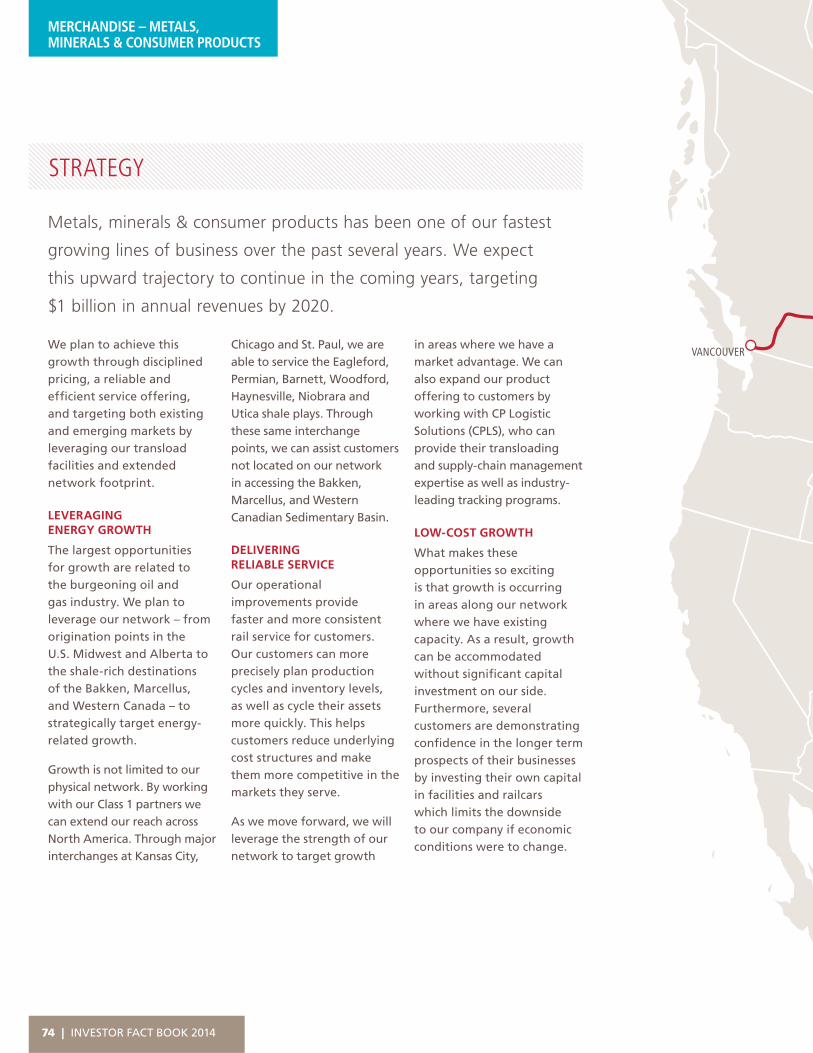
74 | INVESTOR FACT BOOK 2014
VANCOUVERWe plan to achieve this growth through disciplined pricing, a reliable and effi cient service offering, and targeting both existing and emerging markets by leveraging our transload facilities and extended network footprint.
LEVERAGING ENERGY GROWTH
The largest opportunities for growth are related to the burgeoning oil and gas industry. We plan to leverage our network – from origination points in the U.S. Midwest and Alberta to the shale-rich destinations of the Bakken, Marcellus, and Western Canada – to strategically target energy-related growth.
Growth is not limited to our physical network. By working with our Class 1 partners we can extend our reach across North America. Through major interchanges at Kansas City,
Metals, minerals & consumer products has been one of our fastest
growing lines of business over the past several years. We expect
this upward trajectory to continue in the coming years, targeting
$1 billion in annual revenues by 2020.
Chicago and St. Paul, we are able to service the Eagleford, Permian, Barnett, Woodford, Haynesville, Niobrara and Utica shale plays. Through these same interchange points, we can assist customers not located on our network in accessing the Bakken, Marcellus, and Western Canadian Sedimentary Basin.
DELIVERING RELIABLE SERVICE
Our operational improvements provide faster and more consistent rail service for customers. Our customers can more precisely plan production cycles and inventory levels, as well as cycle their assets more quickly. This helps customers reduce underlying cost structures and make them more competitive in the markets they serve.
As we move forward, we will leverage the strength of our network to target growth
in areas where we have a market advantage. We can also expand our product offering to customers by working with CP Logistic Solutions (CPLS), who can provide their transloading and supply-chain management expertise as well as industry-leading tracking programs.
LOW-COST GROWTH
What makes these opportunities so exciting is that growth is occurring in areas along our network where we have existing capacity. As a result, growth can be accommodated without signifi cant capital investment on our side. Furthermore, several customers are demonstrating confi dence in the longer term prospects of their businesses by investing their own capital in facilities and railcars which limits the downside to our company if economic conditions were to change.
MERCHANDISE – METALS, MINERALS & CONSUMER PRODUCTS
STRATEGY

SUDBURY
KINGSGATECOUTTS
CALGARY
EDMONTON
LLOYDMINSTER
SASKATOON
REGINAWINNIPEG
DULUTH
THUNDER BAY
TORONTO
BUFFALO
DETROIT
PHILADELPHIA
NEW YORK
ALBANY
MONTREAL
CHICAGO
MILWAUKEE
KANSAS CITY
MINNEAPOLIS/ST. PAUL
TRACY
SAND PRODUCERS’ FACILITIES ON CP NETWORK
SAND PRODUCER PLANT
ANNUAL CAPACITY (MILLION TONS)
STARTDATE DESTINATIONS
Unimin Tunnel City, WI
2.0 Q1 2014 ND, NEUS, TX, WCAN
Manley, WI 0.3 Pre 2008 LA, CO, AB
US Silica
Sparta, WI 1.6 Q1 2013 TX, NEUS, OK, WCAN, ND
Pattison Sands
Clayton, IA 1.5 Pre 2008 TX, NEUS
Smart Sand
Oakdale, WI 2.0 Q3 2012 TX, NEUS, WCAN
Victory Silica
Winona, MN (Transload)
0.4 Q1 2014 WCAN
Total: 7.8
COMMODITY FLOWS: The majority of our frac sand traffi c moves from the U.S. Midwest to the Bakken Shale Formation, Marcellus Shale, Eagle Ford, Permian and to the Canadian West.
PRIMARY TRAFFIC FLOWS
PRINCIPAL HAULAGE ORTRACKAGE RIGHTS
FRAC SAND ORIGIN
CANADIAN PACIFIC
75

76 | INVESTOR FACT BOOK 2014
MERCHANDISE MERCHANDISE
PETROLEUM PRODUCTS
Petroleum products consist of commodities such as liquid petroleum gas (LPG), gasoline, diesel, condensate (diluent), asphalt and lubricant oils. In Western Canada, the majority of our petroleum shipments originate in Saskatchewan and in the Alberta Industrial Heartland, Canada’s largest hydrocarbon processing region and one of the world’s most attractive locations for chemical, petrochemical, oil, and gas investment. Our network also reaches the Bakken formation in Saskatchewan and North Dakota. Although the Bakken is better known for its oil production, the region continues to present exciting opportunities for petroleum growth given our ability to provide effi cient truck-to-rail transportation solutions for condensate, LPG and natural gas liquids (NGL).
CP’s chemicals and plastics portfolio encompasses a wide variety
of commodities that ship across our network. Petroleum products
represent the largest segment of this portfolio, followed by chemicals
and plastics, respectively.
Our connectivity to several rail interline partners gives us strong and long-term exposure to refi neries and export facilities in the Pacifi c Northwest and Gulf Coast, as well as refi neries and emerging shale plays in the Northeast U.S. – notably the Marcellus and Utica shale plays. In addition, our interline connections provide us access to the Texas and Louisiana petrochemical corridor and port connections, enabling our customers to penetrate the market not only in Canada, but throughout the U.S. and beyond.
CHEMICALS
Our chemical shipments originate from one of four key regions: Eastern Canada (primarily Ontario and Quebec), Alberta, the U.S. Midwest and the Gulf of Mexico. Our chemical carloads include products such as ethylene glycol,
styrene, sulphuric acid, methanol, sodium chlorate, caustic soda, insecticides and herbicides as well as soda ash which move to end markets in Canada, the U.S. and overseas via the North American ports.
PLASTICS
Plastics are most heavily used in food packaging and consumer products, building and construction materials, and automotive materials. The most commonly shipped plastic resins are polyethylene and polypropylene. A little under half of our plastic shipments originate in central and northern Alberta where we have a strong presence with petrochemical manufacturers. The durability and moisture resistance of plastic means it can remain in storage, or be transloaded into silos, with very little impact to the integrity of the product.
CHEMICALS & PLASTICS
| INVESTOR FACT BOOK 201476

CHEMICALS & PLASTICS (BASED ON 2013 REVENUES OF $565M)
Petroleum Products 57%Chemicals 31%Plastics 12%
0
100
200
300
400
500
600
2011 2012 2013 H1 2013 H1 2014
REVENUE
Revenue ($ millions)
H1 2013 | 277H1 2014 | 302
2011 | 4892012 | 5122013 | 565
0
25
50
75
100
125
150
175
200
2011 2012 2013 H1 2013 H1 2014
CARLOADS
Carloads (thousands)
H1 2013 | 99H1 2014 | 94
2011 | 1922012 | 1932013 | 197
0
500
250
750
1,000
1,250
1,500
RTMS
Revenue Ton Miles (millions)
H1 2013 | 6,969H1 2014 | 6,532
2011 | 13,5222012 | 13,2332013 | 13,573
2011 2012 2013 H1 2013 H1 2014
The Bakken formation presents exciting opportunities for growth given our ability to provide effi cient truck-to-rail transportation solutions.
77

78 | INVESTOR FACT BOOK 2014
VANCOUVER
Diluent indemandGrowing Canadian production of oil sands requires diluent to blend it to pipeline-fl ow specifi cations as heavy crude oil or bitumen does not fl ow at ambient temperatures and pressures. Blending requirements vary depending on the type of crude oil (heavy, bitumen, synthetic). In
general, blending bitumen with diluent requires approximately a 70:30 bitumen to diluent ratio. Shipping heavy oil or bitumen by rail requires little to no diluent, which is a signifi cant advantage for our customers. We also see tremendous opportunity in bringing heavy crude oil trains to market and then using the same railcars to move the diluent back into Alberta.
As the production from the oil sands has grown signifi cantly, the resulting demand for diluent exceeds domestic production. We have direct access to the major diluent offl oading facilities in Alberta. The strength of our network and proven experience in the transportation of energy products positions us for success in bringing diluent from the U.S. and various Canadian shale plays into Alberta.
SPOTLIGHT
In particular, there is signifi cant potential to move LPG from Western Canada to the Canadian and U.S. West Coast, as well as to the U.S. Midwest. We also anticipate substantial opportunity to grow our condensate volumes – particularly from the Bakken, Marcellus and Utica plays to the Alberta diluent market.
Chemicals are used as raw input materials in the
manufacturing of goods critical to the North American economy. Our chemical shipments primarily serve the oil and gas, automotive, food and beverage, construction, plastics, and forest products industries. Demand will be closely correlated with the performance of the North American economy.
The abundance of competitively priced energy products and feedstock
The continued development of a growing number of oil-and-gas
related plays across North America, combined with tight pipeline take-
away capacity, are expected to create attractive growth opportunities
for petroleum products.
OUTLOOK
(such as natural gas) are also expected to benefi t the plastics industry through improved margins, facility expansions and new project approvals. There are a number of expansion projects slated over the next several years – such as the expansion at the Nova Chemicals facility in Joffre, Alberta – that could benefi t our plastics segment.
MERCHANDISE –CHEMICALS & PLASTICS
| INVESTOR FACT BOOK 201478

SUDBURY
KINGSGATECOUTTS
CALGARY
EDMONTON
LLOYDMINSTER
SASKATOON
REGINAWINNIPEG
DULUTHTHUNDER BAY
TORONTO
BUFFALO
DETROIT
PHILADELPHIA
NEW YORK
ALBANY
MONTREAL
CHICAGO
MILWAUKEE
KANSAS CITY
MINNEAPOLIS/ST. PAULTRACY
ALBERTA INDUSTRIAL HEARTLAND
BAKKEN OIL FORMATION
ETHANOL
MARCELLUS SHALE
79

80 | INVESTOR FACT BOOK 2014
MERCHANDISE
These fi nished paper products are often shipped in large rolls and transported to printing presses throughout North America. Lumber and panel products supply the home construction and renovation industries.
In 2013, we handled 66,000 carloads of forest products, equating to $206 million in revenue.
Pulp products comprise the largest segment of this portfolio, accounting for 43% of forest products revenues. We serve eight pulp mills in B.C., Ontario and Quebec. Approximately 55% of the pulp produced on our lines is consumed by the domestic North American market. The remaining 45% of the pulp is exported to Asia.
CP’s forest products franchise consists primarily of pulp, paper, lumber
and panel products. Pulp is the primary raw material used in the
manufacture of fi nished paper products, ranging from standard
newsprint and photocopier paper to coated papers used in magazines.
Lumber and panel account for 36% of forest product revenues. We directly serve nine lumber and panel mills in North America. However, we are able to extend our reach and grow our business by utilizing strategically located transload facilities. We have key transload facilities established in B.C., Alberta, Saskatchewan, Ontario and Quebec. Lumber and panel shipments originate primarily in Western Canada, with B.C. and Alberta shipments
accounting for 83% of revenues. The business is shipped to markets across North America.
Paper products, accounting for 19% of revenues, are comprised of newsprint and paperboard. Newsprint originates primarily in Quebec and Ontario. Paperboard typically originates on foreign lines and is interchanged with us for delivery to Minnesota and Wisconsin.
We are able to extend our reach and grow our business by utilizing strategically located transload facilities.
FOREST PRODUCTS
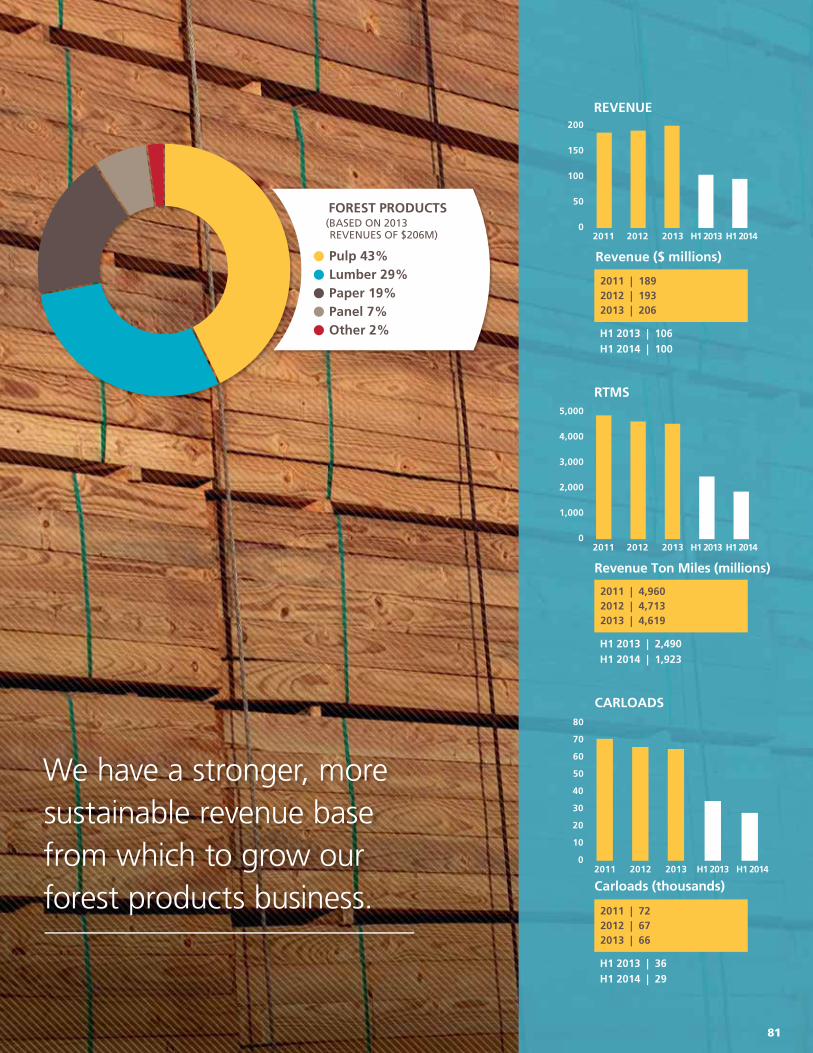
Pulp 43%Lumber 29%Paper 19%Panel 7%Other 2%
FOREST PRODUCTS(BASED ON 2013 REVENUES OF $206M)
We have a stronger, more sustainable revenue base from which to grow our forest products business.
0
100
50
150
200
2011 2012 2013 H1 2013 H1 2014
REVENUE
Revenue ($ millions)
H1 2013 | 106H1 2014 | 100
2011 | 1892012 | 1932013 | 206
0
20
10
30
40
50
60
70
80
2011 2012 2013 H1 2013 H1 2014
CARLOADS
Carloads (thousands)
H1 2013 | 36H1 2014 | 29
2011 | 722012 | 672013 | 66
0
1,000
2,000
3,000
4,000
5,000
RTMS
Revenue Ton Miles (millions)
H1 2013 | 2,490H1 2014 | 1,923
2011 | 4,9602012 | 4,7132013 | 4,619
2011 2012 2013 H1 2013 H1 2014
81
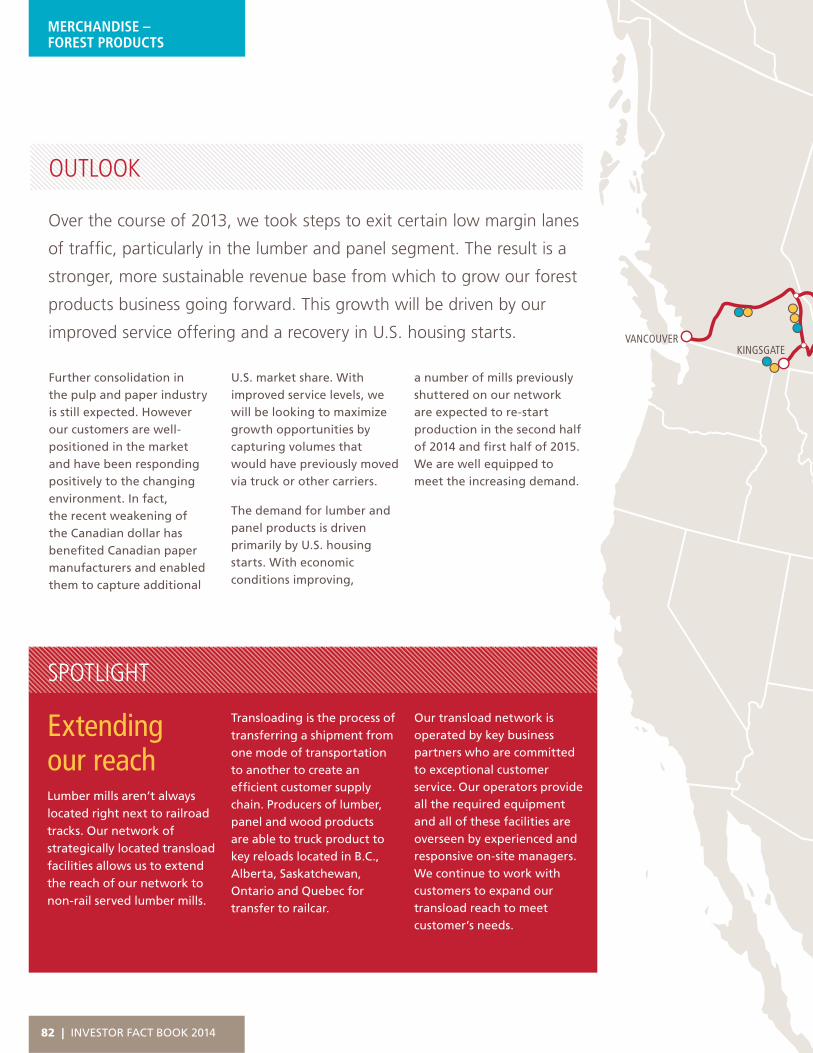
82 | INVESTOR FACT BOOK 2014
VANCOUVERKINGSGATE
Further consolidation in the pulp and paper industry is still expected. However our customers are well-positioned in the market and have been responding positively to the changing environment. In fact, the recent weakening of the Canadian dollar has benefi ted Canadian paper manufacturers and enabled them to capture additional
OUTLOOK
Over the course of 2013, we took steps to exit certain low margin lanes
of traffi c, particularly in the lumber and panel segment. The result is a
stronger, more sustainable revenue base from which to grow our forest
products business going forward. This growth will be driven by our
improved service offering and a recovery in U.S. housing starts.
U.S. market share. With improved service levels, we will be looking to maximize growth opportunities by capturing volumes that would have previously moved via truck or other carriers.
The demand for lumber and panel products is driven primarily by U.S. housing starts. With economic conditions improving,
a number of mills previously shuttered on our network are expected to re-start production in the second half of 2014 and fi rst half of 2015. We are well equipped to meet the increasing demand.
MERCHANDISE –FOREST PRODUCTS
Extending our reach Lumber mills aren’t always located right next to railroad tracks. Our network of strategically located transload facilities allows us to extend the reach of our network to non-rail served lumber mills.
Transloading is the process of transferring a shipment from one mode of transportation to another to create an effi cient customer supply chain. Producers of lumber, panel and wood products are able to truck product to key reloads located in B.C., Alberta, Saskatchewan, Ontario and Quebec for transfer to railcar.
Our transload network is operated by key business partners who are committed to exceptional customer service. Our operators provide all the required equipment and all of these facilities are overseen by experienced and responsive on-site managers. We continue to work with customers to expand our transload reach to meet customer’s needs.
SPOTLIGHT

SUDBURY
COUTTS
CALGARY
EDMONTON
LLOYDMINSTER
SASKATOON
REGINAWINNIPEG
DULUTH
THUNDER BAY
TORONTO
BUFFALO
DETROIT
PHILADELPHIA
NEW YORK
ALBANY
MONTREAL
CHICAGO
MILWAUKEE
KANSAS CITY
MINNEAPOLIS/ST. PAUL
TRACY
CANADIAN PACIFIC
CP SERVED PULP MILL
CP SERVED LUMBER MILL/TRANSLOAD
PRINCIPAL HAULAGE OR TRACKAGE RIGHTS
CP SHORTLINE CONNECTION
COMMODITY FLOWS: Forest products include lumber, wood pulp, paper products and panel transported from key producing areas in Western Canada, Ontario and Quebec to various destinations in North America.
83

Our intermodal portfolio is comprised of two main segments: domestic and international. Domestic intermodal primarily involves the distribution of domestic 53-foot container shipments within North America. International intermodal involves the movement of ocean-carrier owned marine containers through the ports and into North American inland markets, as well as export shipments of goods to Asia, Europe and beyond.
DOMESTIC
Our domestic intermodal segment, which represented 51% of intermodal revenues in 2013, covers a broad spectrum of industries including: food, retailers, less than truckload, trucking, forest
Beginning early 2013, CP intermodal began a renewal and rebalancing
of the portfolio. Our objectives were three-fold: improve the quality
of the book of business; leverage our faster and more consistent rail
service; and, grow in a controlled, sustainable and profi table way.
products and various other commodities and consumer-related products. Key service factors in domestic intermodal include: speed; consistent on-time delivery; the ability to provide door-to-door service; and, the availability of value-added services.
In 2013, 87% of our domestic intermodal business originated in Canada where we market our services directly to retailers and manufacturers, provide complete door-to-door service and maintain direct relationships with customers. In the U.S., our service is delivered predominantly through intermodal marketing companies (IMC).
INTERMODAL
INTERNATIONAL
Our international segment, which represented 49% of intermodal revenues in 2013, has a customer base primarily composed of ocean shipping lines. Containerized traffi c moves between ports in Vancouver, Montreal and New York, and inland points across Canada and the U.S. Import and export traffi c from Vancouver’s port is largely long-haul business destined for Eastern Canada and the U.S. Midwest and Northeast. Montreal’s port, a major year-round East Coast gateway to Europe, primarily serves markets in Canada and the U.S. Midwest. Our U.S. Northeast service connects the port of New York to Canada, offering a competitive alternative to trucks.
84 | INVESTOR FACT BOOK 2014
INTERMODAL

INTERMODAL(BASED ON 2013 REVENUES OF $1,328M)
Domestic 51% Canada 43%Cross-border 8%
Port Metro Vancouver 34% Port of Montreal 13% Other 2%
International 49%
0
250
500
750
1000
1250
1500
2011 2012 2013 H1 2013 H1 2014
REVENUE
Revenue ($ millions)
H1 2013 | 653H1 2014 | 667
2011 | 1,3032012 | 1,3702013 | 1,328
0
300
200
100
400
600
700
800
900
1000
2011 2012 2013 H1 2013 H1 2014
CARLOADS
Carloads (thousands)
H1 2013 | 491H1 2014 | 477
2011 | 9972012 | 1,0242013 | 1,004
0
5,000
10,000
15,000
25,000
20,000
RTMS
Revenue Ton Miles (millions)
H1 2013 | 11,854H1 2014 | 11,522
2011 | 23,9072012 | 24,8532013 | 24,101
2011 2012 2013 H1 2013 H1 2014
We believe the intermodal portfolio is poised to be a signifi cant growth engine over the next several years.
85
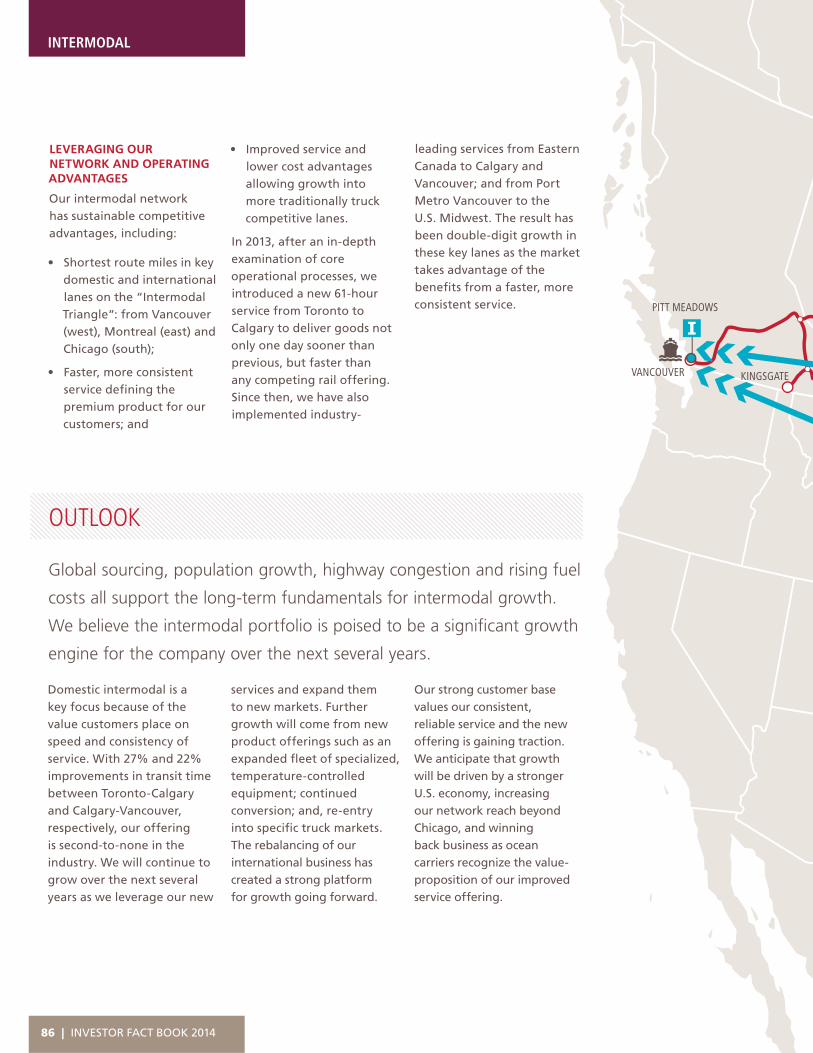
VANCOUVER KINGSGATE
PITT MEADOWS
Domestic intermodal is a key focus because of the value customers place on speed and consistency of service. With 27% and 22% improvements in transit time between Toronto-Calgary and Calgary-Vancouver, respectively, our offering is second-to-none in the industry. We will continue to grow over the next several years as we leverage our new
services and expand them to new markets. Further growth will come from new product offerings such as an expanded fl eet of specialized, temperature-controlled equipment; continued conversion; and, re-entry into specifi c truck markets.The rebalancing of our international business has created a strong platform for growth going forward.
Our strong customer base values our consistent, reliable service and the new offering is gaining traction. We anticipate that growth will be driven by a stronger U.S. economy, increasing our network reach beyond Chicago, and winning back business as ocean carriers recognize the value-proposition of our improved service offering.
OUTLOOK
Global sourcing, population growth, highway congestion and rising fuel
costs all support the long-term fundamentals for intermodal growth.
We believe the intermodal portfolio is poised to be a signifi cant growth
engine for the company over the next several years.
LEVERAGING OUR NETWORK AND OPERATING ADVANTAGES
Our intermodal network has sustainable competitive advantages, including:
• Shortest route miles in key domestic and international lanes on the “Intermodal Triangle“: from Vancouver (west), Montreal (east) and Chicago (south);
• Faster, more consistent service defi ning the premium product for our customers; and
• Improved service and lower cost advantages allowing growth into more traditionally truck competitive lanes.
In 2013, after an in-depth examination of core operational processes, we introduced a new 61-hour service from Toronto to Calgary to deliver goods not only one day sooner than previous, but faster than any competing rail offering. Since then, we have also implemented industry-
leading services from Eastern Canada to Calgary and Vancouver; and from Port Metro Vancouver to the U.S. Midwest. The result has been double-digit growth in these key lanes as the market takes advantage of the benefi ts from a faster, more consistent service.
86 | INVESTOR FACT BOOK 2014
INTERMODAL
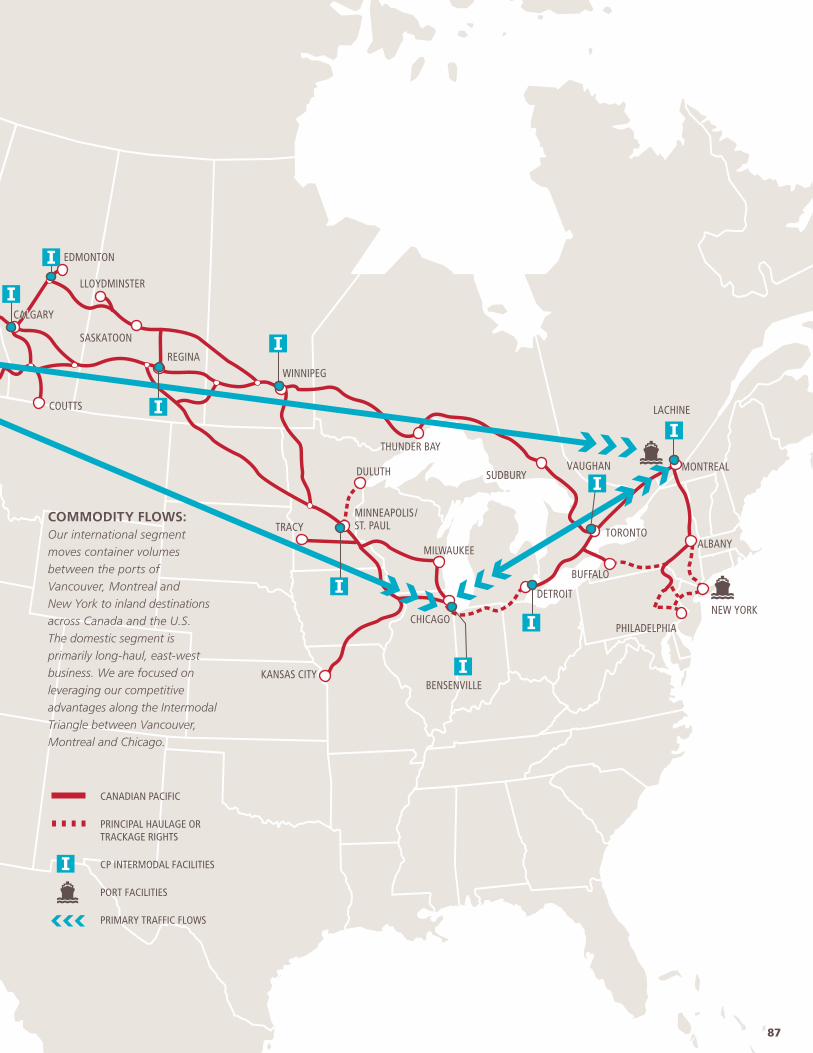
SUDBURY
COUTTS
LLOYDMINSTER
DULUTH
THUNDER BAY
TORONTO
BUFFALO
PHILADELPHIA
NEW YORK
ALBANY
MONTREAL
CHICAGO
KANSAS CITY
MINNEAPOLIS/ST. PAULTRACY
EDMONTON
SASKATOON
REGINAWINNIPEG
LACHINE
CALGARYCALGARY
DETROIT
BENSENVILLE
VAUGHAN
MILWAUKEE
PORT FACILITIES
PRIMARY TRAFFIC FLOWS
PRINCIPAL HAULAGE ORTRACKAGE RIGHTS
CP INTERMODAL FACILITIES
CANADIAN PACIFIC
COMMODITY FLOWS: Our international segment moves container volumes between the ports of Vancouver, Montreal and New York to inland destinations across Canada and the U.S. The domestic segment is primarily long-haul, east-west business. We are focused on leveraging our competitive advantages along the Intermodal Triangle between Vancouver, Montreal and Chicago.
87
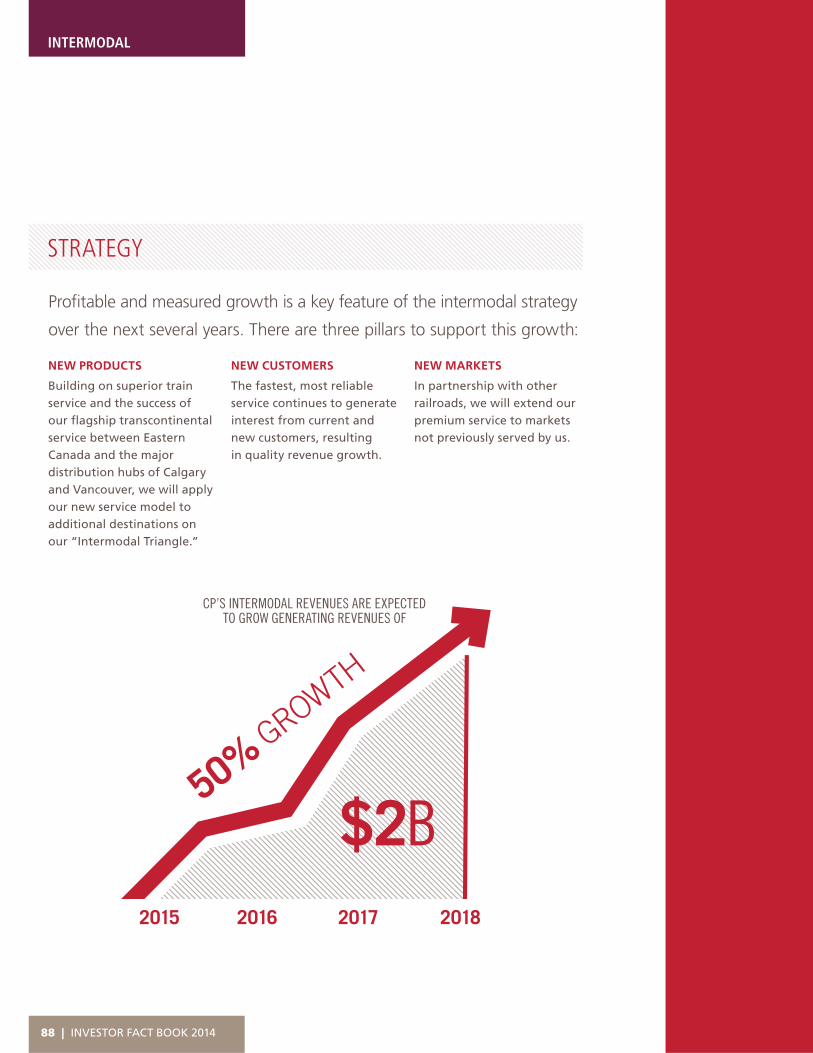
NEW PRODUCTS
Building on superior train service and the success of our fl agship transcontinental service between Eastern Canada and the major distribution hubs of Calgary and Vancouver, we will apply our new service model to additional destinations on our “Intermodal Triangle.”
NEW CUSTOMERS
The fastest, most reliable service continues to generate interest from current and new customers, resulting in quality revenue growth.
NEW MARKETS
In partnership with other railroads, we will extend our premium service to markets not previously served by us.
STRATEGY
Profi table and measured growth is a key feature of the intermodal strategy
over the next several years. There are three pillars to support this growth:
CP’S INTERMODAL REVENUES ARE EXPECTED TO GROW GENERATING REVENUES OF
50% G
ROWTH
$2B
2018201720162015
88 | INVESTOR FACT BOOK 2014
INTERMODAL

Our Expressway service is a multi-modal transportation system operating in the Montreal-Toronto corridor. We work in partnership with retailers, private fl eet operators and the trucking industry. This innovative system uses a fl exible drive-on, drive-off ramp system capable of handling a wide variety of trailers – including vans, fl ats, tankers and reefers – on specialized fl atcars in dedicated trains. The resulting combination provides the trailers and their contents with a ride quality similar or superior to over-the-road transport. Expressway’s market-driven schedules, competitive transit times and high productivity between Montreal and Toronto give trucking companies a lower cost alternative and the opportunity to re-deploy scarce resources, such as drivers, to other areas.
Expressway’s proven system, common operating platform and brand recognition has more than met the needs of a growing number of motor carriers. We believe Expressway’s unique system and partnership approach give us a competitive advantage over other multi-modal retailing specialty trailers in short-haul markets. In addition, Expressway continues to win government and community support as it works to divert trailers from congested highways and reduce greenhouse gases.
Expressway has also reaped the benefi ts of our company’s focus on improved operations. Faster transit times and improved reliability have resulted in double-digit growth in this segment. Carloads have grown from 36,000 carloads in 2012 to 48,000 carloads in 2013, an increase of 33%.
Expressway winning business
SPOTLIGHT
Expressway has more than met the needs of a growing number of motor carriers.
89

CP Logistics Solutions (CPLS) delivers logistics and transportation management solutions that create value within our customers’ supply chains.
When the movement of goods requires a single party to coordinate activities and information from end-to-end, CPLS works with railroads, truckers, facility operators, freight forwarders and other vendors to deliver integrated logistics solutions.
To bring the advantages of our rail services to customers, we focus on their goals through the lens of managing and controlling operational activities across different organizations and regions. Working with customers in a variety of industries – including packaged goods, bulk liquids, industrial materials and dimensional machinery – CPLS designs, builds and executes customized transportation solutions.
CPLS generates value for customers by:
• evaluating distribution and transportation strategies to meet a customer’s supply chain goals;
• designing and managing solutions that bring together the capabilities of a number of logistics service providers;
• sourcing lower-cost, quality providers of transportation, warehousing and distribution services;
• streamlining the delivery of goods through integrated logistics and transportation management solutions; and
• capturing and reporting performance information to identify opportunities for supply-chain performance improvement.
CPLS develops shipment plans that balance customer delivery commitments, mode selection and overall lowest total cost. We facilitate
the fl ow of goods across modes, facilities, borders and agencies. We also provide intervention, problem resolution and vendor management. Acting as an extension of a customer’s logistics team, CPLS integrates processes and technology at an operational level.
Our ability to provide effective solutions means we can respond to market changes in established industries such as food manufacturing and retailing, and new emerging markets such as energy and other industrial products. We provide custom design and manage multi-modal distribution solutions, delivering added value for both our customers and company. This winning combination enhances benefi ts to customers, while generating profi ts and new rail business. It is also integral to our goal of fl uidity and an important tool for us to be able to adapt and grow in new markets.
Offering customized supply chainmanagement solutions
SPOTLIGHT
INTERMODAL
90 | INVESTOR FACT BOOK 2014

91
VANCOUVER
As we turn our focus towards growth opportunities, the capacity generated through velocity and productivity will be supplemented with additional targeted corridor expansions and improvements. Core capital will continue to be focused on investments that improve the productivity, fl uidity and safety of our railroad.
TRACK AND ROADWAY
Track and roadway expenditures include the replacement and enhancement of our track infrastructure. Approximately $700 million of expenditures are dedicated annually to the renewal of depleted assets – namely rail, ties, ballast, signals and bridges. The remaining track and roadway expenditure, which amounted to $130 million in 2013, is targeted on network
CP’s focus on cost control and asset utilization has unleashed signifi cant
capacity across the railroad. We have generated surplus locomotives;
under-utilized track have been re-deployed; and, previously congested
hump yards that processed thousands of cars per day now process a
fraction of what they used to.
improvements to increase productivity, effi ciency and capacity.
Recent investments include:
• new sidings and siding extensions along our network to enable longer trains, improve transit times, and reduce train and crew starts. In 2013, we extended eight sidings along our mainline between Toronto and Vancouver. We are constructing or extending another 12 sidings in 2014. Work will be targeted along our North Line between Wetaskiwin, Alberta and Portage La Prairie, Manitoba; between Calgary and Edmonton; and between Glenwood and St. Paul in Minnesota;
• upgrades to signaling systems – specifi cally, the installation of Centralized Traffi c Control (CTC) – on
portions of our mainline between Portal, North Dakota and Glenwood. CTC not only provides for simplifi ed and safer movement of trains but also allows for switches to be lined from a remote centralized location eliminating the need for crews to stop and line switches manually. This effi ciency improves the travel time over a subdivision which ultimately increases capacity; and
• track upgrades to our North Line between Winnipeg and Edmonton, have increased corridor speed from 25 to 40 miles per hour, and improved service reliability.
CAPITAL EXPENDITURES
INVESTOR FOCUS
92 | INVESTOR FACT BOOK 2014

SUDBURY
KINGSGATECOUTTS
CALGARY
EDMONTONWETASKIWIN
SASKATOON
LLOYDMINSTER
REGINAMOOSE JAW
WINNIPEG
PORTAGE LA PRAIRIE
PORTAL
THUNDER BAY
TORONTO
BUFFALO
DETROITSUNBURY
ALBANY
NEW YORK
PHILADELPHIA
MONTREAL
CHICAGO
MILWAUKEE
KANSAS CITY
MINNEAPOLIS/ST. PAUL
DULUTH
TRACY
GLENWOOD
2013 CAPITAL EXPENDITURE (BASED ON SPEND OF $1.2 BILLION)
Track & Roadway 66%Rolling Stock 13%Information Systems 9%Buildings & Other 12%
2014E CAPITAL EXPENDITURE (BASED ON ESTIMATED SPEND OF $1.3 BILLION)
Track & Roadway 67%Rolling Stock 20%Information Systems 7%Buildings & Other 6%
0
0.50
0.25
0.75
1.00
1.50
1.25
CAPITAL INVESTMENTS
Capital investments ($ billions)
2012 | 1.1 2013 | 1.22014E | 1.32015E | Approximately 1.5
2012 2013 2014E 2015E
FUTURE CTC INSTALLATION
CURRENT CTC
OCS/TWC
DOUBLE TRACK (ABS)
HAULAGE OR TRACKAGERIGHTS ON FOREIGNRAILROAD
93

ROLLING STOCK
Investments in rolling stock have primarily been focused on the remanufacture of older four-axle yard and local service locomotives as well as six-axle SD40 road units. In addition to reducing maintenance costs and improving fuel effi ciency, these investments also reduce the number of units required through improved reliability, the allowance for interoperability with our existing road fl eet and better utilize horsepower. The remanufacture of our four-axle fl eet in 2013 and 2014 represents the fi rst major investment in new yard locomotives in several years and also allows us to stay ahead of the more restrictive 2015 Tier 4 emissions standards.
Other rolling stock investments include the purchase of existing railcars that had previously been leased and the acquisition of temperature-controlled intermodal containers to meet growing demand.
INFORMATION SYSTEMS
We have been investing roughly $100 million per year toward insourcing activities and the rationalization and modernization of our information systems. Insourcing activities have included the construction of new data centres in Calgary and Minneapolis to replace data centre space and hardware that had previously been leased from, and managed by, third-party vendors. There is also signifi cant work underway
to reduce the total number of supported applications while migrating to a standardized platform. The net result is a more responsive and less costly system infrastructure.
BUILDINGS AND OTHER
Building expenditures are focused on providing productive and safe work environments for our No. 1 asset: our people. In 2013, building expenditures were signifi cantly higher as we spent $40 million constructing and relocating our headquarters from a leased offi ce tower to Calgary’s Ogden Yard. The move is expected to save us approximately $20 million a year in lease costs.
Expanding Centralized Traffi c ControlCentralized Traffi c Control (CTC) is a system in which a rail traffi c controller (RTC) gives routing instructions to train crews using lineside signals and remotely controlled power switches. With the click of a mouse, the RTC can direct
train crews to proceed across main lines, or divert trains onto sidings, yard tracks or branch lines. In places where CTC is not in place, the RTC must issue instructions to crews by radio, and crews must stop their trains to line switches by hand. CTC uses track circuits to detect whether a stretch of track is occupied, and displays red signals to trains approaching occupied track “blocks.”
SPOTLIGHT
Currently, only a portion of CP’s route across Canada is CTC, as is the U.S. route between the Chicago area and Glenwood. However, most key secondary routes still rely on radio-issued instructions to train crews. Future investments in CTC will focus on completing the Portal to Glenwood corridor, the North Line from Calgary to Portage la Prairie and southern B.C. and Alberta.
INVESTOR FOCUS
94 | INVESTOR FACT BOOK 2014

95

INVESTOR FOCUS
| INVESTOR FACT BOOK 201496

Our information system applications capture shipment orders and both fi nancial and operational data. These systems also map out complex interconnections of freight cars, locomotives, facilities, and track and train crews to meet more than 10,000 individual customer service commitments daily.
Since 2013, our Information Technology (IT) structure and capabilities have been undergoing a fundamental change in direction with a focus on operations, asset utilization, cost control, service improvements and people development.
INTERNAL CAPABILITIES STRENGTHENED
We have a new approach to ownership and control of all areas related to IT. For the past decade, our IT systems have been largely developed and supported by outsourced resources or non-company staff. We have now insourced a large portion of these outsourced
CP relies on many information systems for resource planning,
scheduling, monitoring and reporting railroad traffi c, customer
relationships, accounting and fi nancial controls, staff records, payroll
and the safe effi cient execution of our operations.
contracts in 2013/2014 and built an internal team of “railroad” IT experts (infrastructure, networks, software development and support). We have transitioned from an 85% outsourced IT service to 80% internal support capabilities. This is leading to improved knowledge of our systems, reduced resolution times, reduced incident frequency and improved response times. We have strengthened our ability to build out our technical capability in line with business objectives.
In 2014, we also invested in new data centres in Calgary and Minneapolis to replace existing “outsourced” data centres that were service managed by external vendors. These new centres will provide the foundation for a reduction in the number of technology platforms and decommissioning of more than 800 mid-range servers and two mainframes, leading to reduced cost and improved service.
INFORMATION TECHNOLOGY
MORE INFORMED DECISIONS
Our “Railway Performance Monitoring” (RPM) application is a near real time dashboard that consolidates information from multiple sources into an easy to read geographical map interface of railroad operations. RPM is designed to provide visibility to key information to assist our operating personnel (from executive to the train master) in making rapid and informed decisions on train movements and other asset-related topics.
IMPROVED SECURITY AND REPORTING
Our new Environment, Health & Safety (EHS) system will provide an integrated solution replacing three existing legacy systems. EHS will deliver incident reporting, WCB claims, U.S. casualty management and regulatory incident management. The integration of these modules will feature strengthened security and access control and feature enhanced
reporting capabilities relating to legal, risk management, fi nance, operations and current government regulatory requirements, with an improved system security and access control.
We have also continued the build-out of our disaster recovery capability for technology systems that support business functions. This will ensure we can keep all aspects of the business functioning in the midst of any unplanned disruptive events.
97

It is too soon to determine what impact the changes proposed in Bill C-30 will have on our company’s fi nancial condition and operations.
After the tragic accident in Lac-Megantic, Quebec in July of 2013 following a signifi cant derailment involving a non-related short-line railroad, the Government of Canada implemented several measures pursuant to the Rail Safety Act and the Transportation of Dangerous Goods Act. These modifi cations implemented changes with respect to rules associated with securing unattended trains, the classifi cation of crude oil being imported, handled, offered for transport or transported and the provision of information to municipalities through which dangerous goods are transported by rail. These changes do not have a material impact on our operating practices.
Operations are subject to economic and safety regulation in Canada primarily by the Canadian Transportation Agency (the Agency) and Transport Canada through the Canada Transportation Act (CTA) and the Railway Safety Act. The CTA provides shipper rate and service remedies, including Final Offer Arbitration, competitive line rates and compulsory inter-switching in Canada. The Agency regulates the maximum revenue entitlement for the movement of grain, commuter and passenger access, charges for ancillary services and noise-related disputes. Transport Canada regulates safety-related aspects of railroad operations in Canada.
Our U.S. operations are subject to economic and safety regulation by the Surface Transportation Board (STB) and Federal Railroad Administration (FRA). The
CP’s railroad operations are subject to extensive federal laws,
regulations and rules in both Canada and the United States which
directly affect how operations and business activities are managed.
STB is an economic regulatory body with jurisdiction over railroad rate and service issues and reviewing proposed railroad mergers. The FRA regulates safety-related aspects of our railroad operations in the U.S. under the Federal Railroad Safety Act, as well as rail portions of other safety statutes. State and local regulatory agencies may also exercise limited jurisdiction over certain safety and operational matters of local signifi cance.
Various other regulators directly and indirectly affect our operations in areas such as health, safety, security and environmental and other matters. To mitigate statutory and regulatory impacts, we are actively and extensively engaged throughout the different levels of government and regulators, both directly and indirectly through industry associations, including the Association of American Railroads and the Railway
REGULATORY
Association of Canada. No assurance can be given to the content, timing or effect on our company of any anticipated legislation or further legislative action.
REGULATORY CHANGE
On March 26, 2014, the Canadian government introduced Bill C-30, “Fair Rail Act for Farmers”. This legislation requires our company and CN to move a minimum amount of grain specifi ed in the legislation or as specifi ed by the federal cabinet. In addition, it expands the terms and conditions associated with the interswitching provisions of the CTA in the provinces of Alberta, Saskatchewan and Manitoba. Bill C-30 also amends the Canada Grain Act to permit the regulation of contracts relating to grain and the arbitration of disputes respecting the provisions of those contracts. Bill C-30 received a second reading on March 28, 2014.
INVESTOR FOCUS
| INVESTOR FACT BOOK 201498

On November 19, 2013, the CTA initiated consultation on the current approach to determining the adequacy of railroad third-party liability coverage and solicited input on possible improvements to the current regulatory framework.
There is ongoing discussion with Canadian and American regulators concerning amendments to the regulation for the transportation of hazardous commodities including the tank cars used for the transportation of crude oil. The freight rail industry petitioned the U.S. Pipeline and Hazardous Materials Safety Administration in 2011 to adopt the industry’s new tank car standards. In November 2013, the industry renewed its request to the U.S. Pipeline and Hazardous Materials Safety Administration and also urged that existing cars used for crude oil and ethanol be retrofi tted to the higher standard or phased out of fl ammable service. We do not own any tank cars used for commercial transportation of hazardous commodities.
Bill C-52 was enacted by the Canadian government on June 26, 2013. This legislation provides shippers with the right to an agreement concerning the manner in which a railroad company must provide service to the shipper. If a service agreement cannot be reached through commercial negotiations, arbitration is available to the shipper to establish the terms of service. It is too soon to determine if this legislation will have a material impact on our company.
Congress did not reauthorize the Railway Safety Improvement Act and the Passenger Rail Investment and Improvement Act which expired at the end of September of 2013. It is uncertain whether legislation will be enacted in 2014.
The STB serves as both an adjudicatory and regulatory body. Matters pending before the STB include proposed rules to address its rate case processes and a petition by the National Industrial Transportation League for new reciprocal switching rules. No assurance can be given
that any future regulatory or legislative initiatives by the STB will not materially adversely affect the Company’s operations or its competitive or fi nancial position.
In the U.S., the Rail Safety Improvement Act requires Class 1 railroads to implement, by December 31, 2015, interoperable PTC on main track in the U.S. that has passenger rail traffi c or toxic inhalant hazard commodity traffi c. The legislation defi nes PTC as a system designed to prevent train-to-train collisions, over-speed derailments, incursions into established work zone limits, and the movement of a train through a switch left in the wrong position. The FRA has issued rules and regulations for the implementation of PTC, and we fi led our PTC Implementation Plans in April 2010, which outlined our solution for interoperability as well as our consideration of relative risk in the deployment plan. We are participating in
industry and government working groups to evaluate the scope of effort that will be required to comply with these regulatory requirements, and to further the development of an industry standard interoperable solution that can be supplied in time to complete deployment. At this time we estimate the cost to implement PTC as required for railroad operations in the U.S. to be up to US$328 million. As at June 30, 2014, total expenditures related to PTC were approximately $175 million.
99

CANADA
Within Canada there are seven bargaining units representing 8,300 Canadian unionized employees. From time-to-time, we negotiate to renew collective agreements with various unionized groups of employees. In such cases, the collective agreements remain in effect until the bargaining process has been exhausted (as per Canada Labour Code).
CP employs 15,000 employees across North America with 75% based
in Canada and the remainder in the United States. Unionized employees
represent 77% of our workforce and are represented by 39 bargaining units.
Agreements with unions representing Canadian running trades employees and Canadian car and locomotive repair employees expire at the end of 2014. Agreements with the other fi ve Canadian bargaining units are in place through at least December 31, 2017.
LABOUR RELATIONS
U.S.
In the U.S., there are currently 32 bargaining units on three subsidiary railroads representing 3,000 unionized employees.
All of the U.S. collective bargaining agreements are in place until the end of 2014, with the exception of two agreements on the Dakota, Minnesota & Eastern which became amendable at the end of 2013.
INVESTOR FOCUS
Hourly rated agreementsAn hourly based pay structure is commonplace in many industries. However, this straightforward concept still is considered somewhat uncommon for Train and Engine (T&E) employees among Class 1 railroads in North America. Yet the benefi ts are mutual to both employees and employers.
Hourly rated agreements introduce work/rest scheduling for employees and pay each employee the same all-inclusive hourly rate for work performed under their collective agreement. These agreements remove traditional work rules in order to provide operational fl exibility that enables our company to manage our business in the most effi cient and competitive manner. We also believe that due to
SPOTLIGHT
the competitive nature of today’s labor market, hourly agreements will also enhance our ability to attract and retain employees.
| INVESTOR FACT BOOK 2014100

CANADIAN UNIONS# OF EMPLOYEES AS AT JUNE 2014 TYPE OF EMPLOYEES
EXPIRATION
Teamsters Canada Rail Conference (TCRC - T&E) 3,289 Train & Engine Crews 31-Dec-14
Teamsters Canada Rail Conference Maintenance of Way Employees Division (TCRC - MWED) 2,476 Track Maintainers,
Buildings/Structures31-Dec-17
Unifor Local 101R (previously Canadian Auto Workers) 1315 Car & Locomotive Repair Employees
31-Dec-14
United Steel Workers of America Transportation Communications Local 1976 (TC-USWA) 644 Clerical Employees 31-Dec-17
International Brotherhood of Electrical Workers (IBEW) 436 Signal Maintainers 31-Dec-17
Teamsters Canada Rail Conference - Rail Canada Traffi c Controllers (TCRC - RCTC) 122 Rail Traffi c Controllers 31-Dec-20
Canadian Pacifi c Police Association (CPPA) 48 Police 31-Dec-17
Total 8,330
U.S. UNIONS
SOO LINE# OF EMPLOYEES AS AT JUNE 2014 TYPE OF EMPLOYEES EXPIRATION
United Transportation Union (UTU) 463 Train Service Employees 31-Dec-14
Teamsters (BMWE) 462 Track Maintainers 31-Dec-14
Teamsters (BLE&T) 409 Locomotive Engineers 31-Dec-14Transportation Communications International Union (TCU) 148 Clerical Employees 31-Dec-14Brotherhood of Railway Carmen - Division of Transportation Communication International Union (TCU-BRC) 125 Car Repair Employees 31-Dec-14
Brotherhood of Railway Signalmen (BRS) 113 Signal Maintainers 31-Dec-14International Association of Machinists & Areospace Workers (IAM) 96 Machinists 31-Dec-14
International Brotherhood of Electrical Workers (IBEW) 52 Electricians 31-Dec-14American Train Dispatchers Department - Division of Brotherhood of Locomotive Engineers (ATDD) 49 Train Dispatchers 31-Dec-14Soo Line Locomotive and Car Foremen Association (SLL&CFA) 24 Locomotive/Car Foremen 31-Dec-14
National Conference of Firemen and Oilers (NCF&O) 22 Mechanical Laborers 31-Dec-14
United Transportation Union - Yardmasters (UTU-Y) 20 Yardmasters 31-Dec-14
Various 2 Various 31-Dec-14
DELEWARE AND HUDSON
Teamsters (BMWE) 207 Track Maintainers 31-Dec-14
United Transportation Union (UTU) 70 Conductors & Trainpersons 31-Dec-14
Teamsters (BLE&T) 57 Locomotive Engineers 31-Dec-14
Brotherhood of Railway Signalmen (BRS) 37 Signal Maintainers 31-Dec-14
Brotherhood of Railway Carmen (BRC) 15 Car Repair Employees 31-Dec-14
Various 36 Various 31-Dec-14
DAKOTA, MINNESOTA AND EASTERN
Teamsters 271Locomotive Engineers (represent Conductors and Trainpersons on ICE network)
31-Dec-13
Brotherhood of Maintenance of Way (BMWED) 186 Track Maintainers 31-Dec-14
International Association of Machinists (IAM) 53 Mechanics 31-Dec-14
United Transportation Union (UTU) 48 Conductors & Trainpersons 31-Dec-13
Brotherhood of Railway Signalmen (BRS) 38 Signal Maintainers 31-Dec-14
Total 3,003
101

DRIVING SHAREHOLDER VALUE
We ended 2011 with an operating ratio of 81.3% - trailing the industry average by nearly 1,200 basis points. By the end of 2013, our operating ratio had improved to 69.9%, and we anticipate ending 2014 with a mid-60s operating ratio – two years ahead of plan.
Since embarking on our turnaround journey just over two years ago,
CP has transformed from the worst performing railroad in North America
to quickly approaching industry best.
Our stock price appreciation and market capitalization growth have been unprecedented. Since the start of 2012, our share price has grown by more than 280% and our market capitalization has increased from $11.7 billion to more than $33.4 billion.
DRIVING SHAREHOLDER VALUE
SHARE REPURCHASE PROGRAM
With a strong balance sheet and improved cash fl ow generation, we announced a normal course issuer bid (NCIB) in the fi rst quarter of 2014 to purchase up to 5.3 million common shares
0
50
100
150
Jan
12
Ap
r 12
Jul
12
Oct
12
Jan
13
Ap
r 13
Jul
13
Oct
13
Jan
14
Ap
r 14
200
250
300
350
CP SHARE PRICE PERFORMANCE – JANUARY 2012 TO JUNE 2014JANUARY 2012 = 100
CP (TSX)
CP (NYSE)
S&P Rail
S&P 500
S&P TSX
INVESTOR FOCUS
| INVESTOR FACT BOOK 2014102

30%
35%
40%
50%
45%
55%
2011 2012 2013 H1 2013 H1 2014
DEBT TO TOTAL CAPITALIZATION
Debt to Total Capitalization (%)
H1 2013 | 45.9%H1 2014 | 39.8%
2011 | 50.7%2012 | 47.9%2013 | 40.7%
$0.00
$1.00
$2.00
$3.00
$4.00
$5.00
$7.00
$6.00
2011 2012 2013 H1 2013 H1 2014
ADJUSTED DILUTED EARNINGS PER SHARE(1)
Adjusted Diluted Earnings per Share
H1 2013 | $2.64H1 2014 | $3.55
2011 | $3.152012 | $4.342013 | $6.42
(800)
(600)
(400)
(200)
0
200
600
400
2011 2012 2013 H1 2013 H1 2014
FREE CASH(1)
Free Cash ($ millions)
H1 2013 | 171H1 2014 | 534
2011 | (724)2012 | 932013 | 530
or three per cent of our common shares outstanding. The share repurchase program commenced on March 17, 2014, and is due to terminate no later than March 16, 2015.
From March 17, 2014 to June 30, 2014, we repurchased 3.3 million common shares at an average price of $172.90 per share.
We expect to amend the NCIB prior to expiration in order to increase the number of common shares that may be repurchased under the program.
DIVIDENDS
We currently pay a quarterly dividend of $0.35 per common share. Our Board of Directors gives consideration on a quarterly basis to the payment of future dividends.
BOND RATINGS
Credit ratings provide information relating to our fi nancing costs, liquidity and operations. Credit ratings affect our ability to obtain short-term and long-term fi nancing and/or the cost of such fi nancing. As a result of the signifi cant improvement in our operating results and
fi nancial position, we have received upgrades from all three agencies in the fi rst half of 2014.
• On April 16, 2014, Standard & Poor’s Ratings Services raised our long-term corporate credit rating to “BBB” from
“BBB-” and assigned a positive outlook to the rating.
• On April 24, 2014, Moody’s Investors Service upgraded our senior unsecured ratings to Baa2 from Baa3 and assigned a positive outlook to the rating.
• On June 5, 2014, DBRS upgraded our Issuer Rating, Unsecured Debentures and Medium-Term Notes ratings to “BBB” from “BBB(low)” and assigned a positive outlook to the ratings.
(1) See description of “Reconciliation of Non-GAAP measures to GAAP measures,” on page 110.
103

FINANCIALS
APPENDIX
QUARTERLY CONSOLIDATED STATEMENT OF INCOME$ in millions, except per share data or unless otherwise indicated
2012 2013 2014 H1Q1 Q2 Q3 Q4 Year Q1 Q2 Q3 Q4 Year Q1 Q2 2013 2014
REVENUESCanadian Grain 202 160 186 219 767 203 191 212 263 869 221 252 394 473U.S. Grain 86 73 110 136 405 111 91 107 122 431 106 115 202 221Coal 137 148 161 156 602 149 144 177 157 627 148 165 293 313Potash 63 97 59 62 281 82 95 66 69 312 80 101 177 181Fertilizers & Sulphur 63 53 52 71 239 70 68 63 57 258 54 64 138 118Forest Products 50 48 49 46 193 53 53 51 49 206 48 52 106 100Chemicals & Plastics 134 120 125 133 512 139 138 142 146 565 147 155 277 302Crude 28 48 59 71 206 92 97 78 108 375 104 114 189 218Metals, Minerals & Consumer Products
136 138 145 131 550 141 144 164 159 608 161 170 285 331
Automotive 105 116 105 99 425 97 106 95 105 403 88 104 203 192Domestic Intermodal 169 153 165 166 653 170 171 170 173 684 177 200 341 377International Intermodal 167 178 198 174 717 152 160 170 162 644 140 150 312 290Total freight revenues 1,340 1,332 1,414 1,464 5,550 1,459 1,458 1,495 1,570 5,982 1,474 1,642 2,917 3,116Other revenue 36 34 37 38 145 36 39 39 37 151 35 39 75 74
Total revenues 1,376 1,366 1,451 1,502 5,695 1,495 1,497 1,534 1,607 6,133 1,509 1,681 2,992 3,190
OPERATING EXPENSES Compensation and benefi ts 382 358 364 371 1,474 392 334 324 335 1,385 345 342 726 687Fuel 269 242 232 256 999 270 246 226 262 1,004 271 273 516 544Materials 43 41 40 42 166 44 35 36 45 160 52 47 79 99Equipment rents 50 56 52 48 206 46 44 44 39 173 41 40 90 81Depreciation and amortization 127 135 137 140 539 141 141 139 144 565 141 137 282 278Purchased services and other 231 295 251 267 1,044 240 277 241 240 998 236 255 517 491Asset impairment - - - 265 265 - - - 435 435 - - Labour restructuring - - - 53 53 - - - (7) (7) - -
Total operating expenses 1,102 1,127 1,075 1,442 4,746 1,133 1,077 1,010 1,493 4,713 1,086 1,094 2,210 2,180
Operating income 274 239 376 60 949 362 420 524 114 1,420 423 587 782 1,010 Other income and charges 13 19 2 3 37 3 8 - 6 17 - 3 11 3 Net interest expense 69 69 69 69 276 70 68 70 70 278 70 69 138 139
Income before income tax 192 151 305 (12) 636 289 344 454 38 1,125 353 515 633 868 Income tax expense (recovery) 50 48 81 (27) 152 72 92 130 (44) 250 99 144 164 243 Net income $ 142 $ 103 $ 224 $ 15 $ 484 $ 217 $ 252 $ 324 $ 82 $ 875 $ 254 $ 371 $ 469 $ 625
Operating ratio 80.1% 82.5% 74.1% 96.0% 83.3% 75.8% 71.9% 65.9% 92.9% 76.8% 72.0% 65.1% 73.9% 68.3%Adjusted operating ratio (1) 80.1% 78.5% 74.1% 74.8% 77.0% 76.4% 71.9% 65.9% 65.9% 69.9% 72.2% 65.1% 73.9% 68.3%
Diluted earnings per share $ 0.82 $ 0.60 $ 1.30 $ 0.08 $ 2.79 $ 1.24 $ 1.43 $ 1.84 $ 0.47 $ 4.96 $ 1.44 $ 2.11 $ 2.66 $ 3.54 Adjusted diluted earnings per share (1) $ 0.88 $ 0.90 $ 1.30 $ 1.28 $ 4.34 $ 1.21 $ 1.43 $ 1.88 $ 1.91 $ 6.42 $ 1.42 $ 2.11 $ 2.63 $ 3.52
(1) See description of “Reconciliation of Non-GAAP measures to GAAP measures,” on page 110.Certain of the comparative fi gures have been reclassifi ed in order to be consistent with the 2014 presentation.
| INVESTOR FACT BOOK 2014104
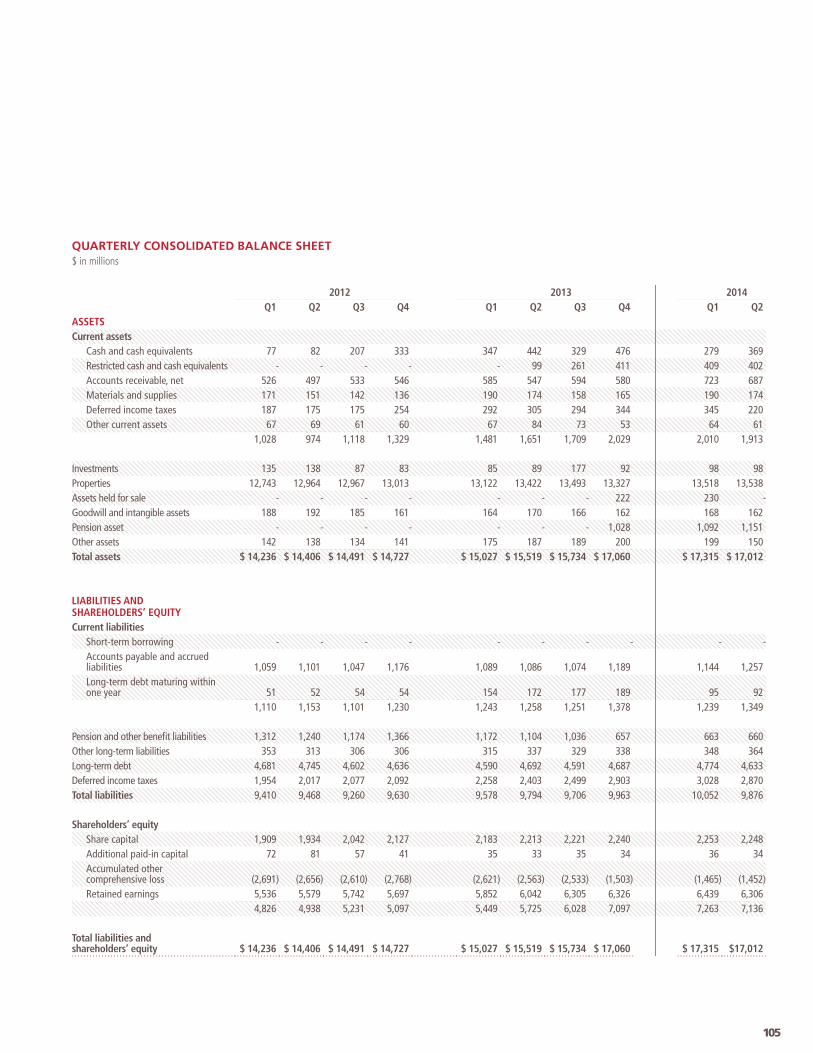
QUARTERLY CONSOLIDATED BALANCE SHEET$ in millions
2012 2013 2014Q1 Q2 Q3 Q4 Q1 Q2 Q3 Q4 Q1 Q2
ASSETSCurrent assets
Cash and cash equivalents 77 82 207 333 347 442 329 476 279 369 Restricted cash and cash equivalents - - - - - 99 261 411 409 402 Accounts receivable, net 526 497 533 546 585 547 594 580 723 687 Materials and supplies 171 151 142 136 190 174 158 165 190 174 Deferred income taxes 187 175 175 254 292 305 294 344 345 220 Other current assets 67 69 61 60 67 84 73 53 64 61
1,028 974 1,118 1,329 1,481 1,651 1,709 2,029 2,010 1,913
Investments 135 138 87 83 85 89 177 92 98 98 Properties 12,743 12,964 12,967 13,013 13,122 13,422 13,493 13,327 13,518 13,538 Assets held for sale - - - - - - - 222 230 - Goodwill and intangible assets 188 192 185 161 164 170 166 162 168 162 Pension asset - - - - - - - 1,028 1,092 1,151 Other assets 142 138 134 141 175 187 189 200 199 150 Total assets $ 14,236 $ 14,406 $ 14,491 $ 14,727 $ 15,027 $ 15,519 $ 15,734 $ 17,060 $ 17,315 $ 17,012
LIABILITIES AND SHAREHOLDERS’ EQUITYCurrent liabilities
Short-term borrowing - - - - - - - - - - Accounts payable and accrued liabilities 1,059 1,101 1,047 1,176 1,089 1,086 1,074 1,189 1,144 1,257 Long-term debt maturing within one year 51 52 54 54 154 172 177 189 95 92
1,110 1,153 1,101 1,230 1,243 1,258 1,251 1,378 1,239 1,349
Pension and other benefi t liabilities 1,312 1,240 1,174 1,366 1,172 1,104 1,036 657 663 660 Other long-term liabilities 353 313 306 306 315 337 329 338 348 364 Long-term debt 4,681 4,745 4,602 4,636 4,590 4,692 4,591 4,687 4,774 4,633 Deferred income taxes 1,954 2,017 2,077 2,092 2,258 2,403 2,499 2,903 3,028 2,870 Total liabilities 9,410 9,468 9,260 9,630 9,578 9,794 9,706 9,963 10,052 9,876
Shareholders’ equityShare capital 1,909 1,934 2,042 2,127 2,183 2,213 2,221 2,240 2,253 2,248 Additional paid-in capital 72 81 57 41 35 33 35 34 36 34 Accumulated other comprehensive loss (2,691) (2,656) (2,610) (2,768) (2,621) (2,563) (2,533) (1,503) (1,465) (1,452)Retained earnings 5,536 5,579 5,742 5,697 5,852 6,042 6,305 6,326 6,439 6,306
4,826 4,938 5,231 5,097 5,449 5,725 6,028 7,097 7,263 7,136
Total liabilities and shareholders’ equity $ 14,236 $ 14,406 $ 14,491 $ 14,727 $ 15,027 $ 15,519 $ 15,734 $ 17,060 $ 17,315 $17,012
105
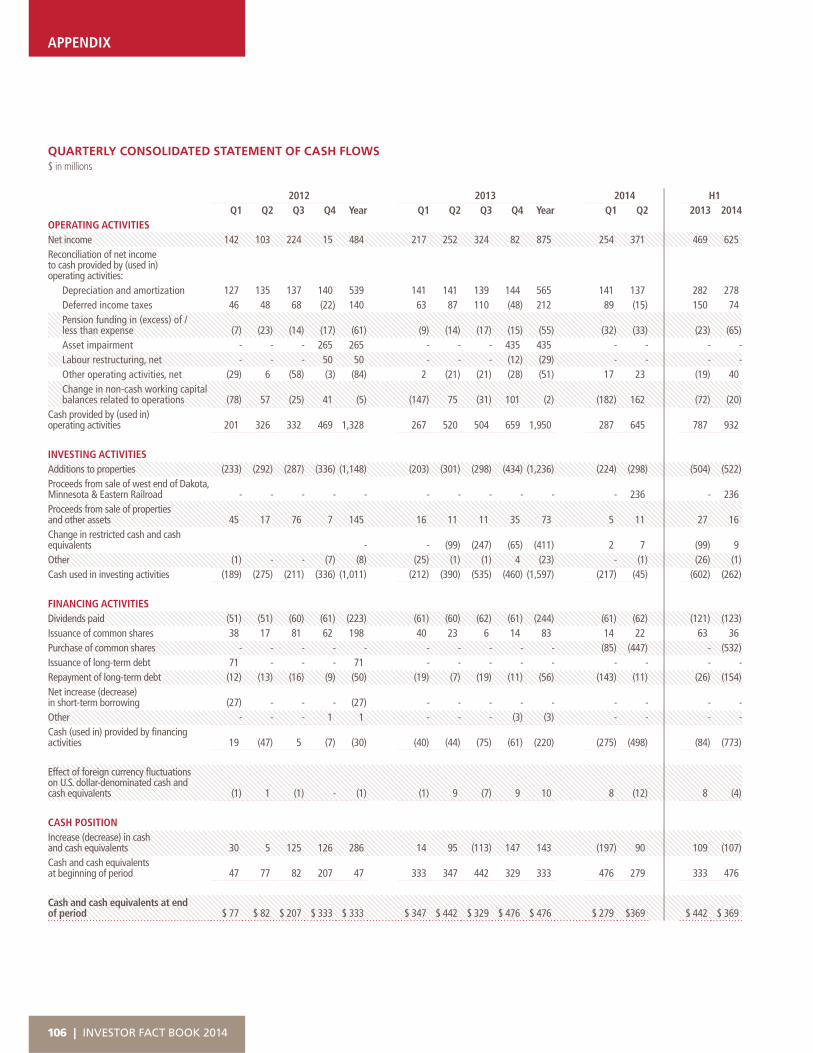
APPENDIX
QUARTERLY CONSOLIDATED STATEMENT OF CASH FLOWS$ in millions
2012 2013 2014 H1Q1 Q2 Q3 Q4 Year Q1 Q2 Q3 Q4 Year Q1 Q2 2013 2014
OPERATING ACTIVITIESNet income 142 103 224 15 484 217 252 324 82 875 254 371 469 625 Reconciliation of net income to cash provided by (used in) operating activities:
Depreciation and amortization 127 135 137 140 539 141 141 139 144 565 141 137 282 278 Deferred income taxes 46 48 68 (22) 140 63 87 110 (48) 212 89 (15) 150 74 Pension funding in (excess) of / less than expense (7) (23) (14) (17) (61) (9) (14) (17) (15) (55) (32) (33) (23) (65)Asset impairment - - - 265 265 - - - 435 435 - - - - Labour restructuring, net - - - 50 50 - - - (12) (29) - - - - Other operating activities, net (29) 6 (58) (3) (84) 2 (21) (21) (28) (51) 17 23 (19) 40 Change in non-cash working capital balances related to operations (78) 57 (25) 41 (5) (147) 75 (31) 101 (2) (182) 162 (72) (20)
Cash provided by (used in) operating activities 201 326 332 469 1,328 267 520 504 659 1,950 287 645 787 932
INVESTING ACTIVITIESAdditions to properties (233) (292) (287) (336) (1,148) (203) (301) (298) (434) (1,236) (224) (298) (504) (522)Proceeds from sale of west end of Dakota, Minnesota & Eastern Railroad - - - - - - - - - - - 236 - 236 Proceeds from sale of properties and other assets 45 17 76 7 145 16 11 11 35 73 5 11 27 16 Change in restricted cash and cash equivalents - - (99) (247) (65) (411) 2 7 (99) 9 Other (1) - - (7) (8) (25) (1) (1) 4 (23) - (1) (26) (1)Cash used in investing activities (189) (275) (211) (336) (1,011) (212) (390) (535) (460) (1,597) (217) (45) (602) (262)
FINANCING ACTIVITIESDividends paid (51) (51) (60) (61) (223) (61) (60) (62) (61) (244) (61) (62) (121) (123)Issuance of common shares 38 17 81 62 198 40 23 6 14 83 14 22 63 36 Purchase of common shares - - - - - - - - - - (85) (447) - (532)Issuance of long-term debt 71 - - - 71 - - - - - - - - - Repayment of long-term debt (12) (13) (16) (9) (50) (19) (7) (19) (11) (56) (143) (11) (26) (154)Net increase (decrease) in short-term borrowing (27) - - - (27) - - - - - - - - - Other - - - 1 1 - - - (3) (3) - - - - Cash (used in) provided by fi nancing activities 19 (47) 5 (7) (30) (40) (44) (75) (61) (220) (275) (498) (84) (773)
Effect of foreign currency fl uctuations on U.S. dollar-denominated cash and cash equivalents (1) 1 (1) - (1) (1) 9 (7) 9 10 8 (12) 8 (4)
CASH POSITIONIncrease (decrease) in cash and cash equivalents 30 5 125 126 286 14 95 (113) 147 143 (197) 90 109 (107)Cash and cash equivalents at beginning of period 47 77 82 207 47 333 347 442 329 333 476 279 333 476
Cash and cash equivalents at end of period $ 77 $ 82 $ 207 $ 333 $ 333 $ 347 $ 442 $ 329 $ 476 $ 476 $ 279 $369 $ 442 $ 369
| INVESTOR FACT BOOK 2014106

QUARTERLY STATISTICAL DATA
2012 2013 2014 H1Q1 Q2 Q3 Q4 Year Q1 Q2 Q3 Q4 Year Q1 Q2 2013 2014
VOLUMEGross Ton Miles (GTM) (millions) 62,688 60,926 64,536 66,204 254,354 67,679 67,232 64,188 68,531 267,629 62,349 71,333 134,910 133,682 Train Miles (thousands) 10,342 9,681 10,201 10,046 40,270 9,993 9,645 8,837 9,341 37,817 8,727 9,335 19,639 18,062 Revenue Ton Miles (RTM) (millions) 32,811 32,559 34,133 35,529 135,032 36,163 35,991 34,684 37,411 144,249 34,375 38,429 72,154 72,804 Carloads (thousands) 656 646 687 680 2,669 659 668 675 686 2,688 618 689 1,327 1,307
FUELFuel effi ciency (Gallons per 1,000 GTMs) 1.23 1.14 1.09 1.14 1.15 1.13 1.05 1.02 1.06 1.06 1.11 1.00 1.09 1.05 Average fuel price (U.S. dollars per U.S. gallon) 3.50 3.49 3.35 3.47 3.45 3.55 3.45 3.34 3.51 3.47 3.63 3.53 3.50 3.58 U.S. gallons of locomotive fuel consumed (millions) 76.6 68.8 69.4 74.4 289.2 75.7 69.8 64.7 71.4 281.7 68.3 70.3 145.6 138.7
OPERATIONSTrain speed (miles per hour) 18.7 17.5 18.3 17.6 18.0 18.0 18.6 18.7 17.6 18.2 15.9 18.1 18.4 17.1Terminal dwell (hours) 7.6 7.8 7.4 7.4 7.5 6.6 6.8 7.2 7.9 7.1 10.3 8.6 6.7 9.4Train weight (tons) 6,420 6,690 6,723 7,014 6,709 7,209 7,471 7,817 7,844 7,573 7,653 8,178 7,337 7,924Train length (feet) 5,757 5,955 6,021 6,198 5,981 6,298 6,444 6,746 6,668 6,530 6,371 6,880 6,369 6,634
SAFETY FRA personal injuries per 200,000 employee-hours 1.15 1.31 1.58 2.05 1.55 1.74 1.51 1.89 1.77 1.69 1.50 1.84 1.62 1.73FRA train accidents per million train-miles 1.58 1.43 1.98 1.68 1.67 1.96 1.94 1.78 1.35 1.78 0.92 1.03 1.95 1.08
PEOPLETotal employees (average) 16,671 17,327 17,572 16,369 16,999 14,920 15,471 14,974 14,677 15,011 14,246 14,787 15,196 14,516Total employees (end of period) 16,862 17,998 17,175 15,713 15,713 15,112 15,355 14,766 14,506 14,506 14,446 14,736 15,355 14,736Workforce (end of period) 18,945 19,505 18,587 16,907 16,907 16,108 16,053 15,318 14,977 14,977 14,774 14,960 16,053 14,960
107

APPENDIX
QUARTERLY COMMODITY DETAILS
2012 2013 2014 H1
Q1 Q2 Q3 Q4 Year Q1 Q2 Q3 Q4 Year Q1 Q2 2013 2014CARLOADSTHOUSANDS
Canadian Grain 68 54 60 66 248 59 61 61 75 256 62 78 120 140U.S. Grain 42 37 50 56 185 49 42 45 46 182 39 44 91 83Coal 78 82 89 88 337 81 75 90 84 330 78 82 156 160Potash 23 37 22 21 103 30 35 24 25 114 28 33 65 61Fertilizers & Sulphur 19 17 16 22 74 19 19 17 16 71 15 16 38 31Forest Products 18 16 17 16 67 18 18 15 15 66 14 15 36 29Chemicals & Plastics 52 45 47 49 193 51 48 49 49 197 45 49 99 94Crude 9 13 16 16 54 22 24 19 25 90 24 25 46 49Metals, Minerals & Consumer Products 54 55 59 54 222 54 58 61 59 232 56 60 112 116Automotive 42 42 39 39 162 35 38 35 38 146 30 37 73 67Domestic Intermodal 87 83 89 88 347 89 93 93 95 370 97 110 182 207International Intermodal 164 165 183 165 677 152 157 166 159 634 130 140 309 270
Total carloads 656 646 687 680 2,669 659 668 675 686 2,688 618 689 1,327 1,307
REVENUE TON MILESMILLIONS
Canadian Grain 6,066 4,795 5,364 5,924 22,149 5,375 5,272 5,363 6,854 22,864 5,846 7,074 10,647 12,920U.S. Grain 2,534 1,917 2,778 3,704 10,933 3,055 2,411 2,501 3,152 11,119 2,539 2,679 5,466 5,218Coal 5,205 5,329 6,032 5,809 22,375 5,640 5,316 6,440 5,776 23,172 5,441 5,941 10,956 11,382Potash 2,745 4,500 2,514 2,462 12,221 3,636 4,254 2,583 2,758 13,231 3,293 4,114 7,890 7,407Fertilizers & Sulphur 1,297 1,117 1,047 1,376 4,837 1,316 1,352 1,179 1,092 4,939 1,074 1,130 2,668 2,204Forest Products 1,215 1,169 1,200 1,129 4,713 1,223 1,267 1,093 1,036 4,619 920 1,003 2,490 1,923Chemicals & Plastics 3,533 2,961 3,289 3,450 13,233 3,534 3,435 3,218 3,386 13,573 3,206 3,326 6,969 6,532Crude 943 1,634 2,244 2,482 7,303 3,491 3,640 2,894 3,873 13,898 3,358 3,816 7,131 7,174Metals, Minerals & Consumer Products 2,560 2,425 2,533 2,415 9,933 2,511 2,339 2,825 2,729 10,404 2,713 2,698 4,850 5,411Automotive 659 658 604 561 2,482 604 629 533 563 2,329 514 597 1,233 1,111Domestic Intermodal 2,437 2,302 2,493 2,486 9,718 2,517 2,546 2,565 2,648 10,276 2,634 3,003 5,064 5,637International Intermodal 3,617 3,752 4,035 3,731 15,135 3,261 3,530 3,490 3,544 13,825 2,837 3,048 6,790 5,885
Total revenue ton-miles 32,811 32,559 34,133 35,529 135,032 36,163 35,991 34,684 37,411 144,249 34,375 38,429 72,154 72,804
| INVESTOR FACT BOOK 2014108
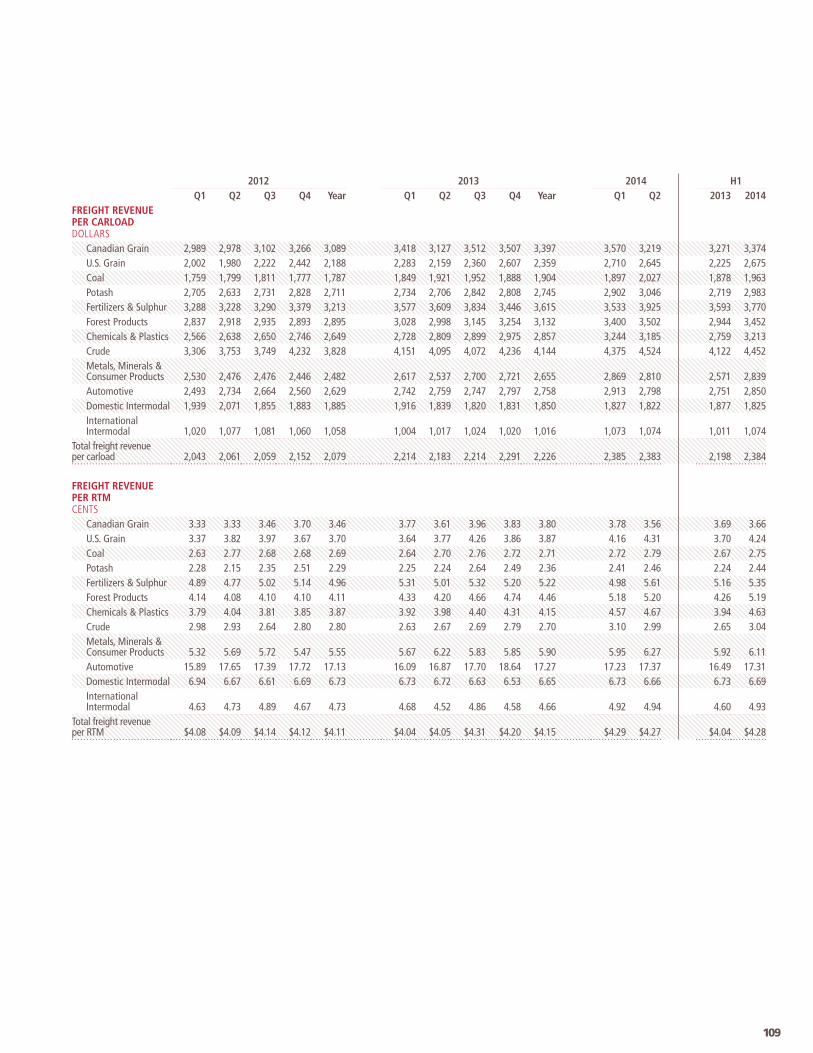
2012 2013 2014 H1Q1 Q2 Q3 Q4 Year Q1 Q2 Q3 Q4 Year Q1 Q2 2013 2014
FREIGHT REVENUE PER CARLOADDOLLARS
Canadian Grain 2,989 2,978 3,102 3,266 3,089 3,418 3,127 3,512 3,507 3,397 3,570 3,219 3,271 3,374U.S. Grain 2,002 1,980 2,222 2,442 2,188 2,283 2,159 2,360 2,607 2,359 2,710 2,645 2,225 2,675Coal 1,759 1,799 1,811 1,777 1,787 1,849 1,921 1,952 1,888 1,904 1,897 2,027 1,878 1,963Potash 2,705 2,633 2,731 2,828 2,711 2,734 2,706 2,842 2,808 2,745 2,902 3,046 2,719 2,983Fertilizers & Sulphur 3,288 3,228 3,290 3,379 3,213 3,577 3,609 3,834 3,446 3,615 3,533 3,925 3,593 3,770Forest Products 2,837 2,918 2,935 2,893 2,895 3,028 2,998 3,145 3,254 3,132 3,400 3,502 2,944 3,452Chemicals & Plastics 2,566 2,638 2,650 2,746 2,649 2,728 2,809 2,899 2,975 2,857 3,244 3,185 2,759 3,213Crude 3,306 3,753 3,749 4,232 3,828 4,151 4,095 4,072 4,236 4,144 4,375 4,524 4,122 4,452Metals, Minerals & Consumer Products 2,530 2,476 2,476 2,446 2,482 2,617 2,537 2,700 2,721 2,655 2,869 2,810 2,571 2,839Automotive 2,493 2,734 2,664 2,560 2,629 2,742 2,759 2,747 2,797 2,758 2,913 2,798 2,751 2,850Domestic Intermodal 1,939 2,071 1,855 1,883 1,885 1,916 1,839 1,820 1,831 1,850 1,827 1,822 1,877 1,825International Intermodal 1,020 1,077 1,081 1,060 1,058 1,004 1,017 1,024 1,020 1,016 1,073 1,074 1,011 1,074
Total freight revenue per carload 2,043 2,061 2,059 2,152 2,079 2,214 2,183 2,214 2,291 2,226 2,385 2,383 2,198 2,384
FREIGHT REVENUE PER RTM CENTS
Canadian Grain 3.33 3.33 3.46 3.70 3.46 3.77 3.61 3.96 3.83 3.80 3.78 3.56 3.69 3.66U.S. Grain 3.37 3.82 3.97 3.67 3.70 3.64 3.77 4.26 3.86 3.87 4.16 4.31 3.70 4.24Coal 2.63 2.77 2.68 2.68 2.69 2.64 2.70 2.76 2.72 2.71 2.72 2.79 2.67 2.75Potash 2.28 2.15 2.35 2.51 2.29 2.25 2.24 2.64 2.49 2.36 2.41 2.46 2.24 2.44Fertilizers & Sulphur 4.89 4.77 5.02 5.14 4.96 5.31 5.01 5.32 5.20 5.22 4.98 5.61 5.16 5.35Forest Products 4.14 4.08 4.10 4.10 4.11 4.33 4.20 4.66 4.74 4.46 5.18 5.20 4.26 5.19Chemicals & Plastics 3.79 4.04 3.81 3.85 3.87 3.92 3.98 4.40 4.31 4.15 4.57 4.67 3.94 4.63Crude 2.98 2.93 2.64 2.80 2.80 2.63 2.67 2.69 2.79 2.70 3.10 2.99 2.65 3.04Metals, Minerals & Consumer Products 5.32 5.69 5.72 5.47 5.55 5.67 6.22 5.83 5.85 5.90 5.95 6.27 5.92 6.11Automotive 15.89 17.65 17.39 17.72 17.13 16.09 16.87 17.70 18.64 17.27 17.23 17.37 16.49 17.31Domestic Intermodal 6.94 6.67 6.61 6.69 6.73 6.73 6.72 6.63 6.53 6.65 6.73 6.66 6.73 6.69International Intermodal 4.63 4.73 4.89 4.67 4.73 4.68 4.52 4.86 4.58 4.66 4.92 4.94 4.60 4.93
Total freight revenue per RTM $4.08 $4.09 $4.14 $4.12 $4.11 $4.04 $4.05 $4.31 $4.20 $4.15 $4.29 $4.27 $4.04 $4.28
109
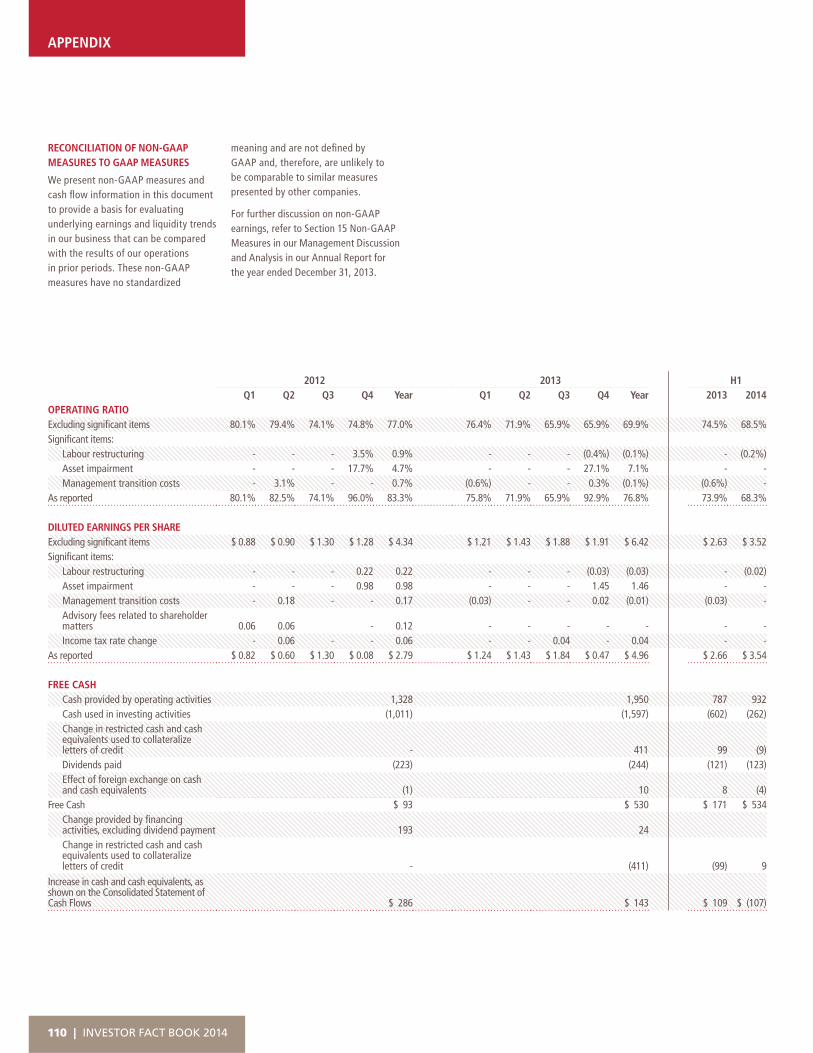
RECONCILIATION OF NON-GAAP MEASURES TO GAAP MEASURES
We present non-GAAP measures and cash fl ow information in this document to provide a basis for evaluating underlying earnings and liquidity trends in our business that can be compared with the results of our operations in prior periods. These non-GAAP measures have no standardized
meaning and are not defi ned by GAAP and, therefore, are unlikely to be comparable to similar measures presented by other companies.
For further discussion on non-GAAP earnings, refer to Section 15 Non-GAAP Measures in our Management Discussion and Analysis in our Annual Report for the year ended December 31, 2013.
APPENDIX
2012 2013 H1
Q1 Q2 Q3 Q4 Year Q1 Q2 Q3 Q4 Year 2013 2014OPERATING RATIOExcluding signifi cant items 80.1% 79.4% 74.1% 74.8% 77.0% 76.4% 71.9% 65.9% 65.9% 69.9% 74.5% 68.5%Signifi cant items:
Labour restructuring - - - 3.5% 0.9% - - - (0.4%) (0.1%) - (0.2%)Asset impairment - - - 17.7% 4.7% - - - 27.1% 7.1% - -Management transition costs - 3.1% - - 0.7% (0.6%) - - 0.3% (0.1%) (0.6%) -
As reported 80.1% 82.5% 74.1% 96.0% 83.3% 75.8% 71.9% 65.9% 92.9% 76.8% 73.9% 68.3% DILUTED EARNINGS PER SHAREExcluding signifi cant items $ 0.88 $ 0.90 $ 1.30 $ 1.28 $ 4.34 $ 1.21 $ 1.43 $ 1.88 $ 1.91 $ 6.42 $ 2.63 $ 3.52Signifi cant items:
Labour restructuring - - - 0.22 0.22 - - - (0.03) (0.03) - (0.02)Asset impairment - - - 0.98 0.98 - - - 1.45 1.46 - -Management transition costs - 0.18 - - 0.17 (0.03) - - 0.02 (0.01) (0.03) -Advisory fees related to shareholder matters 0.06 0.06 - 0.12 - - - - - - -Income tax rate change - 0.06 - - 0.06 - - 0.04 - 0.04 - -
As reported $ 0.82 $ 0.60 $ 1.30 $ 0.08 $ 2.79 $ 1.24 $ 1.43 $ 1.84 $ 0.47 $ 4.96 $ 2.66 $ 3.54
FREE CASHCash provided by operating activities 1,328 1,950 787 932 Cash used in investing activities (1,011) (1,597) (602) (262)Change in restricted cash and cash equivalents used to collateralize letters of credit - 411 99 (9)Dividends paid (223) (244) (121) (123)Effect of foreign exchange on cash and cash equivalents (1) 10 8 (4)
Free Cash $ 93 $ 530 $ 171 $ 534 Change provided by fi nancing activities, excluding dividend payment 193 24Change in restricted cash and cash equivalents used to collateralize letters of credit - (411) (99) 9
Increase in cash and cash equivalents, as shown on the Consolidated Statement of Cash Flows $ 286 $ 143 $ 109 $ (107)
lleeetteqetteequ
ter
Chqui
ers
Chauiv
rs o
Chaiva
of
hanvale
of c
angalen
f cr
ngeent
cre
ge ints
red
e ints u
edit
in rs us
dit
n reuse
t
resusedest
ed stri
ed totric
d to ricte
to ccted
o coted
coled c
ollad ca
llatcas
ateash
terash a
erah an
ralian
alizeand
izend c
zed cacasashshh
-- 4414111 9999 (9(9)9))
| INVESTOR FACT BOOK 2014110

111
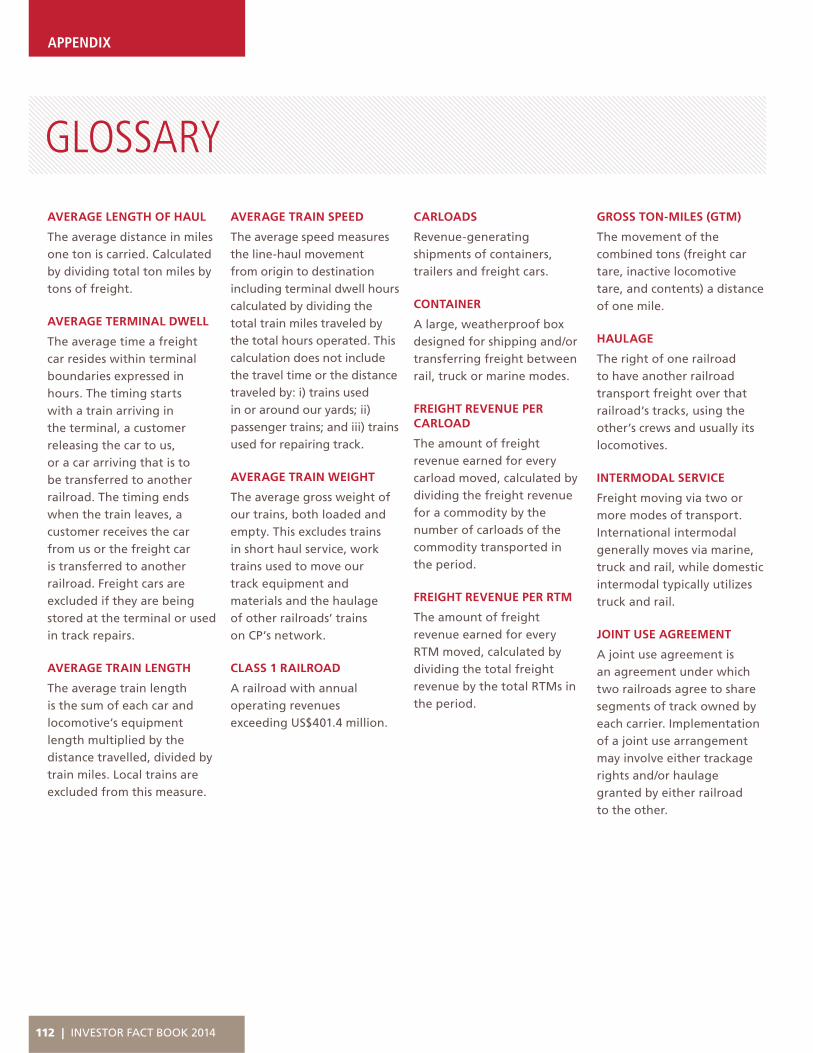
AVERAGE LENGTH OF HAUL
The average distance in miles one ton is carried. Calculated by dividing total ton miles by tons of freight.
AVERAGE TERMINAL DWELL
The average time a freight car resides within terminal boundaries expressed in hours. The timing starts with a train arriving in the terminal, a customer releasing the car to us, or a car arriving that is to be transferred to another railroad. The timing ends when the train leaves, a customer receives the car from us or the freight car is transferred to another railroad. Freight cars are excluded if they are being stored at the terminal or used in track repairs.
AVERAGE TRAIN LENGTH
The average train length is the sum of each car and locomotive’s equipment length multiplied by the distance travelled, divided by train miles. Local trains are excluded from this measure.
AVERAGE TRAIN SPEED
The average speed measures the line-haul movement from origin to destination including terminal dwell hours calculated by dividing the total train miles traveled by the total hours operated. This calculation does not include the travel time or the distance traveled by: i) trains used in or around our yards; ii) passenger trains; and iii) trains used for repairing track.
AVERAGE TRAIN WEIGHT
The average gross weight of our trains, both loaded and empty. This excludes trains in short haul service, work trains used to move ourtrack equipment and materials and the haulageof other railroads’ trains on CP’s network.
CLASS 1 RAILROAD
A railroad with annual operating revenues exceeding US$401.4 million.
CARLOADS
Revenue-generating shipments of containers, trailers and freight cars.
CONTAINER
A large, weatherproof box designed for shipping and/or transferring freight between rail, truck or marine modes.
FREIGHT REVENUE PER CARLOAD
The amount of freight revenue earned for every carload moved, calculated by dividing the freight revenue for a commodity by the number of carloads of the commodity transported in the period.
FREIGHT REVENUE PER RTM
The amount of freight revenue earned for every RTM moved, calculated by dividing the total freight revenue by the total RTMs in the period.
GROSS TON-MILES (GTM)
The movement of the combined tons (freight car tare, inactive locomotive tare, and contents) a distance of one mile.
HAULAGE
The right of one railroad to have another railroad transport freight over that railroad’s tracks, using the other’s crews and usually its locomotives.
INTERMODAL SERVICE
Freight moving via two or more modes of transport. International intermodal generally moves via marine, truck and rail, while domestic intermodal typically utilizes truck and rail.
JOINT USE AGREEMENT
A joint use agreement is an agreement under which two railroads agree to share segments of track owned by each carrier. Implementation of a joint use arrangement may involve either trackage rights and/or haulage granted by either railroad to the other.
GLOSSARY
112 | INVESTOR FACT BOOK 2014
APPENDIX

MAINLINE ROUTE
A primary rail line over which trains operate from terminal to terminal.
MARSHALLING
The activity of grouping and connecting together cars and locomotives in the correct sequence to make up a train that can safely travel between rail terminals.
METRIC TONNE
A metric tonne is 2,204.6 pounds.
OPERATING RATIO (OR)
The percentage of revenues expended in operating the railroad. It is calculated by dividing operating expenses by operating revenues.
REVENUE TON-MILE (RTM)
The movement of one revenue-producing ton of freight one mile.
RIGHT OF WAY
The property owned by a railroad on which tracks have been laid, including the track and land surrounding that track.
ROLLING STOCK
General term for all locomotives and railcars
SHORTLINE
A railroad that is not large enough to be classifi ed as a Class 1 or regional railroad.
SIDING
A section of track, separate from, but connecting to, the mainline. Sidings enable trains travelling in opposite directions to pass.
TRACK CAPACITY
The maximum number of trains that can operate safely over a given segment of track during a specifi ed time period (e.g., one day). Factors such as signal systems, siding lengths, number of tracks and geography all have an impact on track capacity.
TRACKAGE RIGHTS
The right of one railroad to operate over another railroad’s tracks, using its own crews and locomotives.
TRANSLOAD FACILITY
A transfer facility enabling the railroad to expand market reach through truck-to-rail service.
UNIT TRAIN
A freight train consisting of carloads of the same commodity moving from origin to one destination.
113
EXECUTIVE LEADERSHIP
E. Hunter HarrisonChief Executive Offi cer
Keith CreelPresident and Chief Operating Offi cer
Bart W. DemoskyExecutive Vice-President and Chief Financial Offi cer
Guido De CiccioSenior Vice-President Operations, Western Region
Peter EdwardsVice-President, Human Resources & Labour Relations
Paul A. GuthrieChief Legal Offi cer and Corporate Secretary
Robert JohnsonSenior Vice-President Operations, Southern Region
Jeff KampsenVice-President and Comptroller
Scott MacDonald Senior Vice-President Operations (System)
Tony MarquisSenior Vice-President Operations, Eastern Region
Michael RedekerVice-President andChief Information Offi cer
Mark WallaceVice-President, Corporate Affairs and Chief of Staff
BOARD OF DIRECTORS
Gary F. Colter Chairman of the BoardCanadian Pacifi c Railway Limited
PresidentCRS Inc.Mississauga, Ontario
William A. Ackman Founder, Chief Executive Offi cerPershing Square Capital Management, L.P.New York, New York
Isabelle Courville Corporate DirectorMontreal, Quebec
Krystyna T. Hoeg, C.A. Former President and Chief Executive Offi cerCorby Distilleries LimitedCorporate DirectorToronto, Ontario
Paul G. HaggisCorporate DirectorCanmore, Alberta
E. Hunter HarrisonChief Executive Offi cerCanadian Pacifi c Railway LimitedWellington, Florida
Paul C. HilalPartnerPershing Square Capital Management, L.P.New York, New York
Rebecca MacDonald Founder, Executive ChairJust Energy Group Inc.Toronto, Ontario
Dr. Anthony R. Melman President and Chief Executive Offi cerAcasta CapitalToronto, Ontario
Linda J. Morgan PartnerNossaman LLPBethesda, Maryland
Andrew F. Reardon Retired Chairman and Chief Executive Offi cer, TTX
Corporate DirectorMarco Island, Florida
Stephen C. Tobias Former Vice-Chairman and Chief Operating Offi cerNorfolk Southern CorporationGarnett, South Carolina
CORPORATE INFORMATION
114 | INVESTOR FACT BOOK 2014
APPENDIX
SHAREHOLDER ADMINISTRATION
Computershare Investor Services Inc., with transfer facilities in Montreal, Toronto, Calgary and Vancouver, serves as transfer agent and registrar for the Common Shares in Canada. Computershare Trust Company NA, Denver, Colorado, serves as co-transfer agent and co-registrar for the Common Shares in the United States.
For information concerning dividends, lost share certificates, estate transfers or for change in share registration or address, please contact the transfer agent and registrar by telephone at 1-877-4-CP-RAIL (1-877-427-7245) toll free North America or International (514) 982-7555, visit their website at www.investorcentre.com/cp; or write to:
Computershare Investor Services Inc. 100 University Avenue, 8th Floor Toronto, Ontario Canada M5J 2Y1
INVESTOR RELATIONS
Nadeem Velani Assistant Vice-President, Investor Relations
Maeghan Albiston Director, Investor Relations
Telephone: 403-319-3591 email: [email protected]
Mailing address Canadian Pacific 7550 Ogden Dale Road S.E. Calgary, AB T2C 4X9 Canada
SHAREHOLDER & INVESTOR CONTACT INFORMATION

www.cpr.ca