welcome to the surface water data viewer!
TRANSCRIPT

1
Welcome to the Surface Water Data Viewer!
The Surface Water Data Viewer is a mapping tool for the State of Wisconsin. It provides interactive web mapping tools for a variety of datasets, including chemistry, physical, and biological data. The data managed in layers that can be turned on and off as needed. The following page shows the homepage of the Surface Water Data Viewer (SWDV) with many commonly used features labeled. Descriptions of the features are as follows:
Toolbars: There are a variety of toolbars with different themes to help complete tasks using the SWDV. The toolbars can be used to display the layers available to the map, add or remove shapes, text, or measurement features, identify points, print maps, and more!
Search Bar: Using the search bar, you can search monitoring stations by number, locations by keyword, and waterbodies by WBIC. Be careful when using the search bar, partial matches do not always appear in the results.
Navigation Pane: The navigation pane is where results will appear from searches, where you are able to select layers for the map, and features for printing. You will be able to refine the data that is shown here, if desired. You can hide the navigation pane by clicking the left-facing arrow at the top.
Coordinates and Coordinate System: The coordinates will display for any point moused-over on the map. Click the black triangle to select your preferred method for displaying lat/long (DD, DMS, DDM, Mercator). The right-most option in this pane allows you to manually manage the scale of the map. Click on the scale tool, and selected the desired scale at which you wish to view the map. Select Go to implement changes.
Scale Bar: The scale bar shows the current extent of the map.
Whole State View: This view describes what is being shown on the main map relative to the entire state. A blue rectangle will cover the region of the state being shown on the map. You can also navigate the map by moving the blue square around the state-view map. If you print a map, this whole state view will print in the corner as a reference. You can minimize this view by clicking the corner-facing arrow in the top left edge of the box.
Show/Hide Toolbar: Use this button to hide the toolbar for a larger view of the map. If you have hidden the toolbar, you can also use this button to show it again.
Water Action Volunteers Welcome to the Surface Water Data Viewer! May 2017

2
Water Action Volunteers Welcome to the Surface Water Data Viewer! May 2017

3
Show/Hide Toolbar
Whole-State View
Navigation Pane
Scale Bar
Search Bar Toolbars
Coordinates and Coordinate System
Water Action Volunteers Welcome to the Surface Water Data Viewer! May 2017

4
When using the Surface Water Data Viewer, there are a variety of Toolbars that can be applied. Toolbars give you the ability to plot points on the map, make drawings, label points, measure distances, etc. The most common Toolbars that you will use are:
1. Maps & Data
2. Basic Tools
3. Locate & Identify
4. Draw & Measure
5. Additional Resources
Water Action Volunteers Welcome to the Surface Water Data Viewer! May 2017

5
The Maps & Data Toolbar
Upload Data: Use this tool to temporarily upload data from your computer to the map. Select the Upload Data tool. A dialogue box will appear. Use the Browse button to search for the file that you would like to upload. Once you have selected the file, select Upload to temporarily add the data to the map.
Print: This tool will print the current extent of the map, including all plotted points and drawings within that extent. The printed map will also include the Whole State View.
Export: This tool will export your current map to an image format. Formats include: BMP, JPEG, PNG, TIFF, GeoTIFF, and PDF. Select Include Georeference Data to download the spatial reference information embedded in the map. Checking this box will be helpful for maps downloaded for later use in other mapping applications.
Share: Use this tool to share your map via email or social media platform such as Facebook or Twitter.
Water Action Volunteers Welcome to the Surface Water Data Viewer! May 2017
Add Layers: Use this tool to temporarily add layers from an outside valid map service to the Surface Water Data Viewer map.

6
The Basic Toolbar
Home: The home button can be found in two places. The first is in the Basic Tools Toolbar. The second is in the ribbon at the bottom of the Navigation Pane.
Clicking on Home will open up the basic description of the SWDV in the Navigation Pane. If you have search results, don’t worry, clicking Home does not lose your results. You can return to your results by clicking the Results tab in the bottom ribbon. Home does not change the view on the map.
Show Layers: This tool opens a list in the navigation pane of data layers that can be applied to the map. See the following page for a screenshot of the Show Layers pane. These layers can be turned on or off to apply different datasets to the map.
Map Legend: The Map Legend describes each of the features on the map. As more layers are added to the map, it will become more complicated and more features will be added to the legend. When a map is printed, the legend will print alongside it. The accompanying image shows the initial map legend before additional layers have been applied to the map.
Water Action Volunteers Welcome to the Surface Water Data Viewer! May 2017

7 This is the list of layers that will appear when the Show Layers tool is selected. Scroll down through the Navigation Pane to view all available layer categories. Select the + on a layer category to view available layers within that category.
Monitoring Sites & Data is a common layer category that you may use in the SWDV. Here is an expanded view of the layers within that category.
Water Action Volunteers Welcome to the Surface Water Data Viewer! May 2017

8
Looking at the list of layers that you can apply, the variety can get overwhelming! There are a few that you may use more often than others.
For Citizen-based Stream Monitoring projects, regions are separated by HUC (Hydrologic Unit Code) 8 – Subbasins. To view the HUC 8s in Wisconsin, scroll through the list of layers to Watershed Boundaries. Click on the + sign to expand. Select the checkbox for Watershed
Boundaries as well as the 8-digit HUCs (Subbasins) option.
It will take a few seconds for the map to populate with this layer information.
You can use the Point Identify tool to learn more about each of these subbasins. You will learn more about the Point Identify tool in the following pages.
To turn off the HUC 8 layer, uncheck the box(es).
Water Action Volunteers Welcome to the Surface Water Data Viewer! May 2017

9
Another interesting map layer is the Great Lakes and Mississippi Basins layer. This layer delineates the major basins into which the subwatersheds of Wisconsin drain.
To turn on this layer, navigate again to the line of text that reads Watershed Boundaries and click the + to expand.
Check the box for Great Lakes and Mississippi Basins. The map will take a few seconds to populate with the data layer.
You can use the Point Identify tool to learn more about each of these basins. You will learn more about the Point Identify tool in the following pages.
To turn off the Great Lakes and Mississippi Basins layer, uncheck the box(es).
Water Action Volunteers Welcome to the Surface Water Data Viewer! May 2017

10
The most common map layer that you will likely use is the one that shows current and historic monitoring station points. This layer is very helpful when looking for monitoring data or if you are looking to set up a new monitoring location. In this section, you will see what the layer looks like, and how to turn it on and off. As you learn more about the toolbars, you will learn more about the features of this data layer.
To turn on this data layer, expand the text for Monitoring Sites & Data. To view all existing monitoring stations, check the boxes for
• Monitoring Sites & Data• Monitoring Station Points• Monit. Station Pts w/ Data• Monit. Station Pts w/o Data
This layer contains a lot of data. It may take up to a minute or two to populate the map. Each time you zoom to a new extent of the map, it may have to reload all of the points. Be patient!
Monitoring Station Point
Water Action Volunteers Welcome to the Surface Water Data Viewer! May 2017

11
Pan: Use the pan tool to drag the map, or to move your view across the map without selecting features or zooming.
Zoom In: Use this tool to enlarge a selected location. This can also be done by clicking on the + symbol adjacent to the Navigation Pane on the map.
Zoom Out: Use this tool to view a broader extent of the map. This can also be done by clicking on the – symbol adjacent to the Navigation Pane on the map.
Previous Extent: Use this tool to return to the previous view of the map. For example, if you were zoomed in on Waukesha County, and then you panned west to Grant County, Previous Extent will return you to a view of Waukesha County.
Next Extent: After selecting Previous Extent, use this tool to return forward to the last extent viewed. Using the previous example, this tool would return you to the view of Grant County.
Full Extent: Full State will zoom the map out to view the entire state. Any layers you have applied to map will remain.
Bookmarks: Use this tool to bookmark the current map extent. After creating bookmarks, select the Bookmarks tool to return to your saved map extents.
Point Identify: Use the Point Identify tool to gather information about features on the map. Select the tool, then click on the feature. Information will appear in the Navigation pane to the left.
For example, given this extent on the map, you have already turned on the Monitoring Station Points layer.
To learn more about the selected monitoring station, click on the Point Identify tool.
Use the mouse to click on the yellow triangle representing the monitoring station.
Water Action Volunteers Welcome to the Surface Water Data Viewer! May 2017

12
In the navigation pane to the left, a series of information appears. In this case, you are presented with the name of the monitoring station and the waterbody on which the station lies. The small map next to the name of the feature can be used to pan to the feature on the map. The results will also appear in the Results Box at the top of the map. The selected result in the Results Box will be marked on the map with a red marker icon. Use the left and right arrows to scroll to the result of your chose. The Point Identify tool can be used on any waterbody or map feature.
Results Box
Water Action Volunteers Welcome to the Surface Water Data Viewer! May 2017

13
For more information about the monitoring station, click on the name of the station. Further information will appear in the Navigation Pane.
Click on the List Symbol for further options regarding the identified point. The following options will appear:
Show Expanded View: Use this tool to open an expanded view of the feature details. This view will open as a pane in the bottom half of your screen.
Show Buffer Options: Use this tool to identify nearby features within a desired buffer zone of the identified point.
Zoom to Feature: Use this tool to zoon to the selected feature on the map.
Pan: This tool will pan the map to your selected feature.
Remove from Results: This option will remove this feature from the current set of results. The feature will still show up in future result sets.
List Symbol
Water Action Volunteers Welcome to the Surface Water Data Viewer! May 2017

14
To access monitoring data from this station, click Link to Monitoring Data. A new tab will open in your browser through the SWIMS database, displaying a table of monitoring data for the selected site. This data can be sorted by parameter using the Show specific parameter dropdown menu.
Water Action Volunteers Welcome to the Surface Water Data Viewer! May 2017

15
If you use the Results Box to select the waterbody, in this case the Yahara River, the entire body of water will be highlighted.
Water Action Volunteers Welcome to the Surface Water Data Viewer! May 2017
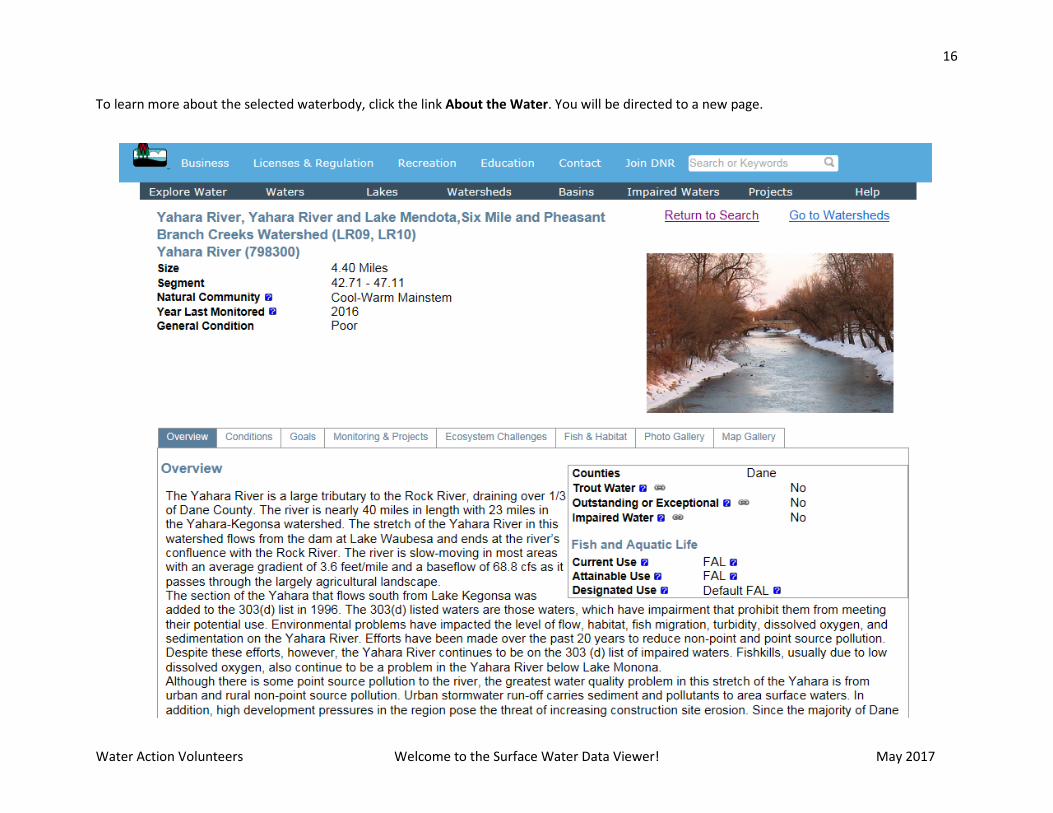
16
To learn more about the selected waterbody, click the link About the Water. You will be directed to a new page.
Water Action Volunteers Welcome to the Surface Water Data Viewer! May 2017

17
The Locate & Identify Toolbar
The Locate & Identify Toolbar contains a variety of tools to complete similar functions. In the same way that you can use the Point Identify tool in the Basic Toolbar to select a single point on which to gather more details, most of the tools in this toolbar will garner similar results.
To use the Identify tools, first select the Identify tool button. The Identify tool button is not named on the toolbar. Instead, it appears as whatever identification form you have selected. The basic tool is Point. The Point tool will be the default in the Locate & Identify Toolbar until changed by the user. From here, there are a variety of options for identification. Use the dropdown arrow to navigate these options. Each tool also has a series of accompanying options explained below.
Point: This tool functions the same as the Point Identify tool in the Basic Toolbar. This tool can be used to identify a single point on the map. Select the tool, and then select the desired location on the map. Any available, relevant information will appear in the results pane on the left side of the viewer.
Enable Buffering: This tool appears as an option for each Identify tool type. If you select Enable Buffering, the Buffer Options will appear in the Navigation Pane. Enter the buffer distance, and the distance units. Click Continue to apply the buffer. This will add any results to the results pane within the buffer zone of your drawn feature.
Water Action Volunteers Welcome to the Surface Water Data Viewer! May 2017

18
Enable Snapping: Snapping accounts for inaccuracy in your identified location. If Enable Snapping is selected, the Identify Tool will snap the point identifier to a feature within the circular snapping tool. Enable Snapping is available on all Identify tools except Rectangle.
Select Snapping Layers: This tool will open a list of Snappable Layers in the Navigation Pane. Select the layers to which you want the Enable Snapping tool to snap. The snapping tool will only snap to selected layers. This tool is available on all Identify tools except Rectangle.
Identifiable Layers: This option will produce a list of Identifiable Layers in the Navigation Pane. Select the layers for which you would like results to appear when using Identify tools. This option is available on all Identify tool types.
Freehand: Use this tool to freehand-draw a shape around a select area on the map. Any available, relevant information about features within the selected area (including, but not limited to monitoring station points, WBICs, municipality names, etc.) will appear in a list in the results pane on the left side of the viewer.
Line: Use this tool to draw a line or set of connected lines on the map. Relevant, available information about features through which the line passes will populate the results pane on the left side of the viewer. To begin drawing the line, click in the desired location on the map. To complete drawing the line, double click. To create adjoining lines, single click between line segments.
Water Action Volunteers Welcome to the Surface Water Data Viewer! May 2017

19
Polygon: Use this tool to draw a polygon around a desired location on the map. Relevant, available information about features within the drawn polygon will populate the results pane on the left side of the viewer. To draw the polygon, select a location for the starting vertex. Click on the map to place additional vertices. Double click to complete the polygon.
Rectangle: Use this tool to draw a rectangle around a desired location on the map. Relevant, available information about features within the rectangle will appear in the results pane on the left side of the viewer. To draw the rectangle, select a location for the starting vertex, and drag the mouse until the rectangle reaches the desired size.
Clear Selected: Use this tool to clear all Identify drawings from the map.
Query: Use this tool to perform an advanced search for a feature. Selecting Query will open a process in the Navigation Pane. Select the Data Source on which you would like to perform the Query. Conditions for the Query can then be changed for the Data Source. Select any of the conditions to provide a dropdown menu for Query options.
If necessary, Add Another Condition.
You can filter the search results spatially. Results can either be gathered from the entire map or from the current extent being viewed using the Spatial Filter dropdown menu.
Click Search to run the Query.
Filter: Use this tool to filter results. The conditions for this tool are similar to those in the the Query tool.
Water Action Volunteers Welcome to the Surface Water Data Viewer! May 2017

20
Find Location: Use this tool as a search feature to find specific features on the map. Selecting Find Location will generate a list of search options in the Navigation Pane. To find a location, select the feature radio button, and click Find.
Common Find Location options you may use could include:
City, Town, Village: Use this option to return results on a desired city, town, or village. Enter the location name into the Name search bar. Select Find to run the search.
Coordinates – DD: Search for a location using decimal degrees. Enter the Lat and Long into the respective search bars. Select the desired Zoom To size, and click Find.
Zoom To will define the extent of the map returned when you click Find.
Coordinates – DMS: Search for a location using the degrees, minutes, seconds format. Enter the values for Latitude and Longitude. Select the desired Zoom To size, and click Find.
Coordinates – WTM: Search for a location using the Wisconsin Transverse Mercator projection. Enter the values for X and Y. Select the desired Zoom To size, and click Find.
Water Action Volunteers Welcome to the Surface Water Data Viewer! May 2017

21
Rivers and Streams: Search for a River or Stream with this tool. Use the Search Type dropdown to select the parameter by which you would like to perform the search: Name or WBIC. If the Name or WBIC is known, enter it into the Value field. Use the County dropdown to select your search region. Click Find to run the search.
SWIMS Station: Use this tool to search by SWIMS Station ID. The monitoring stations used for the WAV Program are Points. Select the appropriate Search Type from the dropdown menu, SWIMS ID or Name. Enter the Value into the search bar. Click Find to run the search and return results.
Watershed: Use this tool to locate a specific watershed on the map. Select the desired Watershed from the dropdown menu. Click Find to return results.
Water Action Volunteers Welcome to the Surface Water Data Viewer! May 2017

22
The Draw & Measure Toolbar
The Draw & Measure Toolbar is an excellent tool for making your own custom maps. It is very helpful to show where individual monitoring sites are – you can type the names of the sites next to their identification points or color-code them! It is also useful if you need to perform calculations of area or distance on the map.
Draw Tools
To use any of the drawing tools, first select the desired tool from the Draw tool options. Similar to the Identify tool, use the dropdown to select the desired tool. The tool options will change once one of the nine drawing tools has been selected. A new section will appear with options for the drawing that you will apply to the map.
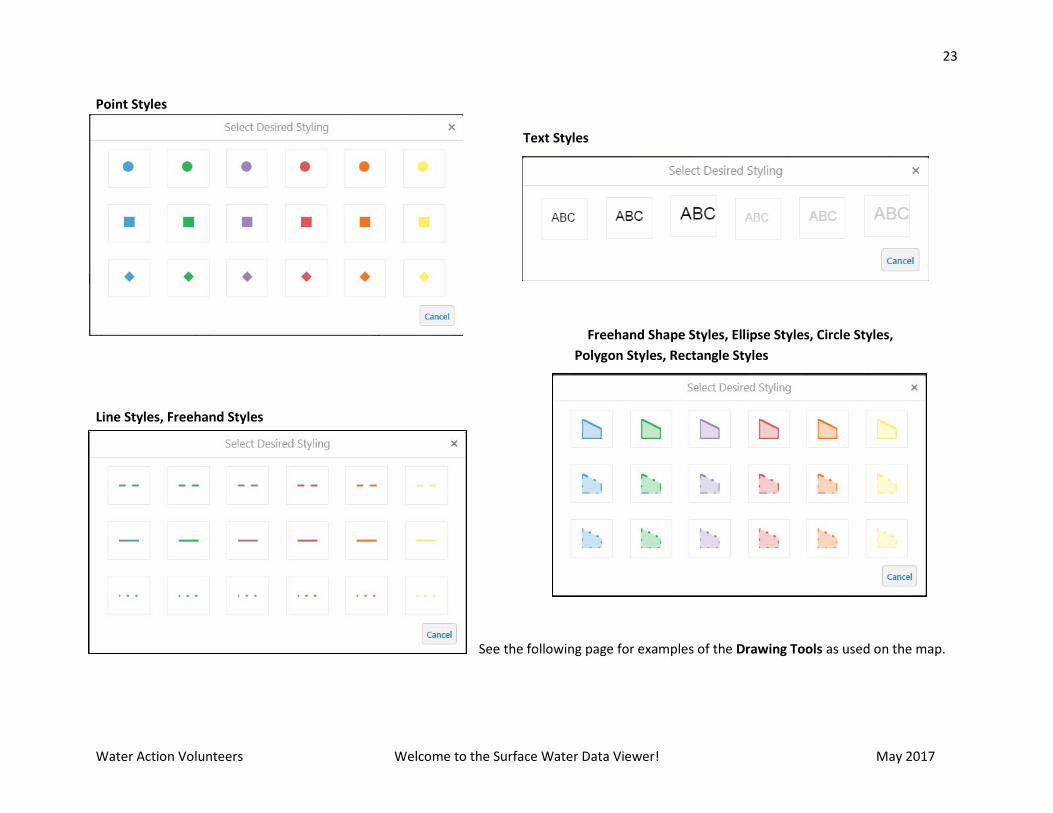
The Drawing Options for each tool include Enable Snapping, Select Snapping Layers, and Styles. The Styles will differ based on each tool selected.
Water Action Volunteers Welcome to the Surface Water Data Viewer! May 2017
23
Point Styles
Text Styles
Freehand Shape Styles, Ellipse Styles, Circle Styles, Polygon Styles, Rectangle Styles
Line Styles, Freehand Styles
See the following page for examples of the Drawing Tools as used on the map.
Water Action Volunteers Welcome to the Surface Water Data Viewer! May 2017

24
Water Action Volunteers Welcome to the Surface Water Data Viewer! May 2017

25
Measure Tools
To use any of the measuring tools, first select the desired tool from the Measure tool options. Similar to the Identify tool, use the dropdown to select the desired tool. The tool options will change once one of the seven Measure tools has been selected. A new section will appear with options for the measurement that you will apply to the map.
The Measuring Options for each tool include Distance Units, Area Units, Enable Snapping, and Select Snapping Layers.
Line: Use this tool to find the distance between points on the map. To begin measuring, select the Line tool, then click on your starting location on the map. Click each subsequent location to measure a distance. Distances will appear on the map along the drawn measurement line. The Total displays the sum of the distances that you have measured. Similar to the Line tool in the Draw Tools, to complete a Line measurement, double click the mouse.
Water Action Volunteers Welcome to the Surface Water Data Viewer! May 2017

26
Freehand Line: Use this tool to find the distance between points on the map not connected by a straight line. Click and drag your mouse along the desired measurement path. The Total will display the traced distance of the Freehand Line.
Use the following tools to find area over a specific region on the map. When using the area tools, Freehand Shape, Ellipse, Circle, Polygon, and Rectangle two types of information are generated: Perimeter and Area.
Freehand Shape: Similar to the Freehand Line, to use this tool, click and drag the mouse around the area to be measured. Release the mouse to complete the measurement.
The Ellipse and Circle tools work in the same way for measurements as they do for drawing. Draw the shape on the map over the location for which you would like to measure Area or Perimeter. The drawing will appear with measurement information upon release of the mouse.
Water Action Volunteers Welcome to the Surface Water Data Viewer! May 2017

27
Rectangle: Draw a Rectangle the same way that you would using the Draw Tools. When a Rectangle measurement is placed on the map, the length of each side of the rectangle will appear on the map as well as the total Perimeter and the Area of the shape.
Polygon: Use this tool in the same way you would the polygon tool in the Draw Tools. Click on the map at the point you wish to place the starting vertex. Continue to place vertices by clicking on the map until you have drawn the desired area. Double click to complete the measurement. Lengths will generate on the map for each leg of the drawing.
Water Action Volunteers Welcome to the Surface Water Data Viewer! May 2017

28
Edit Graphics
To make changes to the graphics added to the map from the Draw Tools or Measure Tools, use the Edit Graphics dropdown menu. There are three options for editing drawings and measurements made on the map:
Edit: Use this tool to edit a single feature created using the Draw Tools or Measure Tools. Editing works differently for each feature. Some features can be moved, resized, text added, angle changed, or a combination of the former. It is possible to change the Style of all drawings. To edit a feature, select Edit and then click on the drawn feature that you would like to change.
When editing Text, first make changes to the content of the Text. Select OK to move on to change the size, angle or location of the Text.
Erase: To erase a single feature created using the Draw Tools or Measure Tools, select Erase, and then click on the single feature that you would like to remove from the map.
Clear: Use this tool to clear all drawings on the map.
Export Drawings: Use this tool to export the drawings and measurements that you have created on the map as a shapefile for later use.
Editing Text
While most drawings created using the Draw Tools can be moved during editing, Points cannot. If you would like to move a Point, you must Erase the drawing and create a new one in the desired location.
Editing Drawings or Measurements
Water Action Volunteers Welcome to the Surface Water Data Viewer! May 2017

29
The Additional Features Toolbar
Help & FAQ Tools: If you need to troubleshoot any issues with the Surface Water Data Viewer, or would like to learn more about the features of the viewer, you can toggle through the resources in the Help & FAQ Tools. If you encounter a problem with the Surface Water Data Viewer, use the Contact tool to send a message to the Surface Water Data Viewer Team.
Other DNR Viewers
Use these tools to launch other DNR mapping applications.
Water Condition Viewer: The Water Condition Viewer is a mapping tool that focuses on water condition, monitoring, assessment and management data.
Lakes and AIS Viewer: The Lakes Condition Viewer allows users to search and map monitoring locations for lakes and aquatic invasive species (AIS)
Watershed Viewer: The Watershed Restoration Viewer is a mapping tool designed to help users view water quality improvement projects across the state.
Water Use Viewer: The Water Use Viewer is a mapping tool that allows the public to view the locations and volumes of high capacity wells and surface water withdrawals.
Water Action Volunteers Welcome to the Surface Water Data Viewer! May 2017
30
Other Features
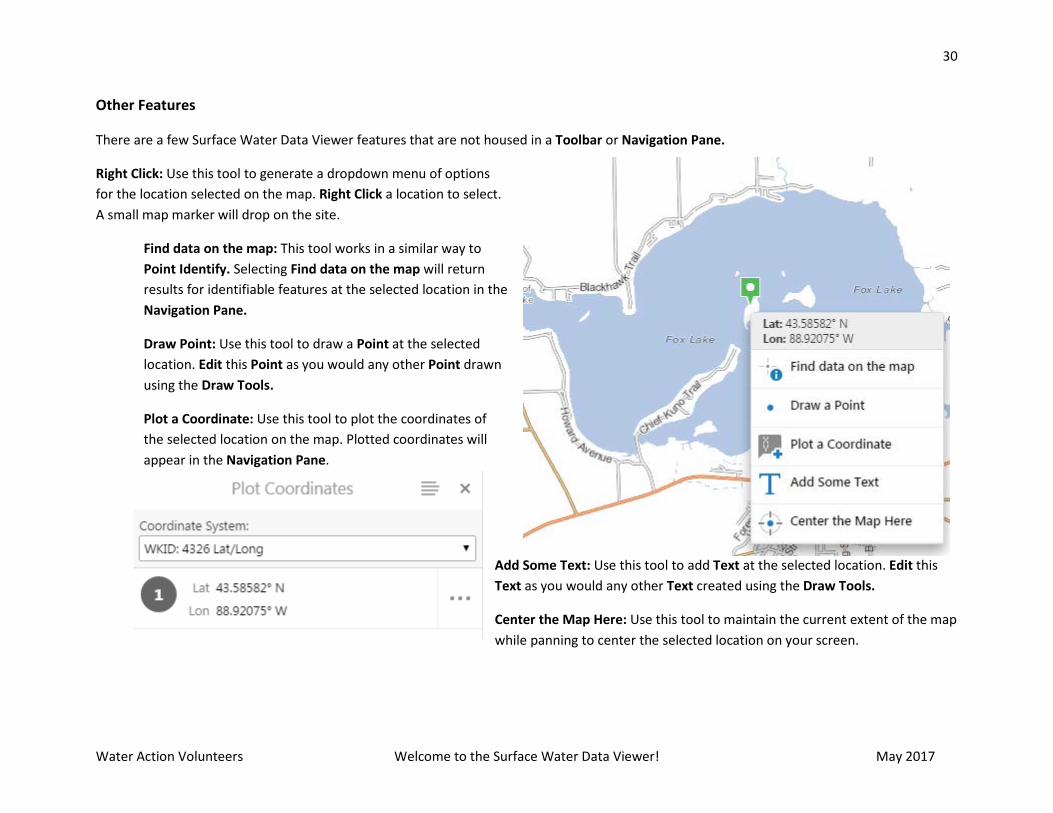
There are a few Surface Water Data Viewer features that are not housed in a Toolbar or Navigation Pane.
Right Click: Use this tool to generate a dropdown menu of options for the location selected on the map. Right Click a location to select. A small map marker will drop on the site.
Find data on the map: This tool works in a similar way to Point Identify. Selecting Find data on the map will return results for identifiable features at the selected location in the Navigation Pane.
Draw Point: Use this tool to draw a Point at the selected location. Edit this Point as you would any other Point drawn using the Draw Tools.
Plot a Coordinate: Use this tool to plot the coordinates of the selected location on the map. Plotted coordinates will appear in the Navigation Pane.
Add Some Text: Use this tool to add Text at the selected location. Edit this Text as you would any other Text created using the Draw Tools.
Center the Map Here: Use this tool to maintain the current extent of the map while panning to center the selected location on your screen.
Water Action Volunteers Welcome to the Surface Water Data Viewer! May 2017

31
Help Text: This tool will appear at the bottom of the screen when you use a map tool. The Help Text is meant to serve as a guide to using the features of the Surface Water Data Viewer. Here are some examples of Help Text.
When editing in Plot Coordinate
When creating a Freehand Shape
When using Zoom Out
When using Polygon to find Area
Thank you for using the Water Action Volunteers’ Guide to the Surface Water Data Viewer! If you have any further questions about using the viewer, do not hesitate to contact your WAV Coordinator.
Water Action Volunteers Welcome to the Surface Water Data Viewer! May 2017