welding project report.pdf
TRANSCRIPT

7/27/2019 welding project report.pdf
http://slidepdf.com/reader/full/welding-project-reportpdf 1/61
1
CHAPTER 1
INTRODUCTION
Among the welding typical problems and most important are the residual
stress/strain and the induced distortions in structures of the components. In order to get
better understand the welding process and its effects on structures, engineers and
researchers around the world, covering a large number of industries, have been trying to
create algorithms and methodologies to simulate the complete welding process or just
individual phases (e.g. the cooling phase). In recent years, due to the high expansion of
computer software, computations possibilities, many researchers identified the Finite
Element Analysis (FEA) as a reliable method for this purpose. Hence ANSYS is used for
the welding simulation.
1.1 Need of the Project
The need of the project arises due to the problem of inaccuracies that take place during the
heating or welding process of the production and hence increase partly from the thermal
distortions and partly in the form of dimensional variations due to human factors.
Furthermore, with the increasing use of the automation, it is necessary to quantify and
calculate the thermal distortions by means of mathematical models by using FEA, so that
the required tolerances of the automation process can be achieved as efficient as possible.
In order to improve planning and work scheduling by reducing the rework, to reduce the
production cost significantly by reducing the measurements and rework, and to improve the
quality of the weldment the significance of FEA is studied.
1.2 Scope of the Project
The problem of creation of residual stresses during welding steel plates leads to
dimensional inaccuracies and misalignments of structural members, which can result in
complex tasks or rework when tolerance limits are crossed. Hence cause increase in the
cost of production and leads to loss of time. In fabrication sector, for example, expenses
required for rework such as straightening could have a heavycost. Therefore, the problems
of distortion and residual stresses arealways of great concern in welding sector. In order to
deal with this problem, it is necessary to interpret the extent of distortion resulting from the

7/27/2019 welding project report.pdf
http://slidepdf.com/reader/full/welding-project-reportpdf 2/61
2
welding operations. One way to interpret the distortion and shrinkage of steel welding is
through numerical analysis such as finite element analysis (FEA). Once the techniques to
predict the distortion and shrinkage are recognised, then the problems can be controlled
accordingly. During the welding process, there are so many factors such as welding process
type, welding process parameters, preheat patterns, welding sequence, level of constraint
and joint details that contribute to the creation of the residual stresses in the welded
structure. By determining which parameters have an effect on the quality of the weld and
which factorswill give the most significant effect on the weld quality are the main aspects
in welding industry.
1.3 Problem Statement
In this project work the direct coupled field transient thermal structural analysis will be
carried out using finite element analysis for arc welding for a butt joint. To carry the FEA
two plates of ASTM 36 were considered to be welded. The dimensions of the plate were
taken as 200 x 100 x 3 mm for each plate. Welding was assumed to be done along 100 mm
length of the plate. The groove angle for welding was taken as 60º.
1.4Methodology of the Project
• The adapted experimental methodology is as follows,
– Collection of data or information for the arc welding simulation using Finite
element analysis software.
– 3D modeling of the weld and ASTM 36 steel plates to be welded using
CAD software
– Finite element model creation by using finite element software
– Carry out thermal analysis to find temperature distribution due to welding
process in the steel plate.
– Structural analysis of weld and welded plate to find residual stresses.
– To find out temperature distribution across the center line of the weld at 100
seconds after completion of welding process

7/27/2019 welding project report.pdf
http://slidepdf.com/reader/full/welding-project-reportpdf 3/61
3
– residual stress calculation due to welding by using FEA
– To find out strain across the center line of the weld after cooling of the
welded steel plate.
– Comparison of results from experiments with FEA results of residual
stresses observed due to welding
1.5 Objectives of the Project
This report introduces finite element analysis for the modeling of welds and it explains a
brief history of the simulation of welds. Welding is one of the reliable and highly effective
metal fabrication process which is widely used in industries. Localized and excessive
heating during the welding process, followed by rapid cooling causes to generate residual
stress and distortion in the weld and base metal. In the last few years various research
efforts have been directed towards the control of welding process parameters in order to
reduce the residual stress and distortion.
Objectives of the project are to find out -
1. Residual stresses in the welded parts due to phase change due to solidification of
weld with respect to distance from weld.
2. Temperature change with respect to time due to phase change to solidification of
weld with respect to distance from weld.
3. Strain in the welded parts due to phase change to solidification of weld with respect
to distance from weld.
4. Suitability of software to interpret residual stresses.

7/27/2019 welding project report.pdf
http://slidepdf.com/reader/full/welding-project-reportpdf 4/61
4
1.6 Publications
A paper has been published related to the project work entitled as “Finite Element
Analysis for Residual Stress, Strain and Temperature Characteristics of Butt Welded
Steel Plate” in International Journal of Scientific Research, Volume:2,Issue:6, June 2013,ISSN no. 2277 - 8179.
1.7 Use of Finite Element Analysis
Finite element analysis makes it possible to evaluate a detailed and complex structure with
a very short period of time. The adequate strength of the structure and the possibility of
improving the design during planning could justify the cost included in this analysis work.
FEA has also been known to analyze the structure that were significantly over designed and
built many decades ago.In absence of finite element analysis (or other numerical analysis)
development of structures must be based on manual calculations only. In case of complex
structures, the simplifying assumptions necessary to make any calculation possibly can lead
to a conservative and heavy design. An important factor of ignorance can remain as to
whether the structure will be adequate for all design loads. Considerable changes in designs
involve risk. Design will require prototypes to be built and field tested completely. The
field tests may include expensive strain gauging to evaluate strength and deformation of the
components.

7/27/2019 welding project report.pdf
http://slidepdf.com/reader/full/welding-project-reportpdf 5/61
5
CHAPTER 2
LITERATURE REVIEW
The research work in welding simulation was initializedmany years ago.Understanding of
the theory of heat flow is essential in order to study the welding processanalytically,numerically or experimentally. Rosenthal (1946) was the first researcher who succeeded in
developing an analytical solution of heat flow during welding based on conduction heat
transfer for determining the shape of the weld pool for two and three-dimensional welds.
By using the Fourier partial differential equation (PDE) of heat conduction, he initialized
the moving coordinate system to develop solutions for the point and line heat sources and
also applied this successfully to apply to a wide range of welding problems. His analytical
solutions for the heat flow made possible for the first time the analysis of the process from
the point of view of the welding parameters namely the voltage, current, welding speed,
and weld geometry. Due to the pioneering work done by Rosenthal,significant interest in
the thermal aspects of welding was developed by many researcherssuch as Goldak (1984)
The most critical and important input data required for welding thermal analysis are the
parametersnecessary to determine the heat input to the weldment by the arc. Goldak et al.
(1984) developeda mathematical model for welding heat sources based on a Gaussian
distribution of powerdensity. They proposed a double ellipsoidal distribution in order to
capture the size and shapeof the heat source of shallow and deeper penetrations.
Some of the researchers have alsodeveloped the thermal finite element simulation to
determine the temperature distribution of ametal.Over the past forty years, finite element
techniques have been used extensively in order topredict distortion and residual stresses due
to welding operations such as the studies byFriedman (1975), Michaleris and Debiccari
(1997) and Taylor et al. (1999). The finiteelement method has already been proven to be a
successful tool for the simulation of the complexwelding process as performed by Friedman
(1975). His 2-D finite element analysis work wasthen used by Taylor et al. (1999) for the
verification of their 3-D computational modeling of weldingphenomena.
The final results of finite element analysis done by Taylor et al. (1999) were inreasonable
agreement with the result obtained by Friedman (1975). Most of the welding research work
in the past was conducted to investigate the distribution and effect ofresidual stress and
distortion of welded metal component. It is possible to estimates the welding shrinkage in a
7/27/2019 welding project report.pdf
http://slidepdf.com/reader/full/welding-project-reportpdf 6/61
6
welded butt joint by applying amathematical model approach. Michaleris and Debiccari
conducted thermo-elasto-plastic finite element analysis for welding simulation to determine
thewelding distortion. It has been claimed by them that their approaches have been similar
toexperimental and empirical data. Not only the welding residual stress and distortion have
been studied by welding researchers,but also the effects of welding sequence, welding joint
geometry,welding parameter and rootopening has also been studied by several researchers
in the last years.Harwig et al. (1999) for example, studied the effect due to welding
parameters and electrodeclassification on the diffusible hydrogen content of gas shielded
flux cored arc welds.
In 1999,Tsai et al. studied the influence of welding sequence on warping and buckling
behavior of athin-plate panel structure. Tsai et al. (2004) have also investigated the effects
of weldingparameters and joint geometry on the distribution and magnitude of residual
stresses onthick-section butt joints.
As proven by the researchers, residual stress distribution and distortion in a weldedplate are
strongly affected by their interaction and by many parameters. Yet, certain aspects ofthe
welding phenomenon are still subjected to further research specifically the effects of
welding speed, restraint, heatinput, gap on arc welding responses and plate curvature as
appliedto curved steel plate welding.In the recent ten years, there is growing need to
concern about the numerical research on line heatingand welding process. Murakawa et al.
(2005) interpreted the hot cracking of a weldment usingtemperature-dependent interface
elements. Mahapatra et al. (2007) modeled the influence of theposition of tack weld
constraints on the angular distortions that were created in one-sided fillet weldingcreated by
SAW.
It is cleared from this literature review that the thermal reactions and the
resultingdistortions in a welded joint are strongly affected by various parameters and their
interactions.A number of finite-element (FE) models used for illustrating the effect of using
differentmodeling strategies for the simulation of the thermo-elasto-plastic stages of the
weldingprocess are applied by Mollicone et al. (2006)Adak and Mandal (2010) studied the
heat sinking as a method of distortion mitigation and usedthe pseudo-linear equivalent
constant rigidity concept for thermo-mechanical analysis of platesundergoing welding with
simultaneous heat sinking. The proposed concept was found to becomputationally more
efficient and simpler to model as compared to FEM for solving similarthermo-elasto-plastic

7/27/2019 welding project report.pdf
http://slidepdf.com/reader/full/welding-project-reportpdf 7/61
7
nonlinear problems.In 2011, Heinze et al. investigated a single-layer gas metal arc (GMA)
weld of 5 mm thickstructural steel is experimentally and numerically. The numerical
modeling begun with a meshanalysis based on modal analyses. The sensitivity of welding-
induced distortion is examinedrelated to different continuous cooling transformation (CCT)
diagrams.
Fusion welding includes heating by an intense heat source, melting and
solidification of parent metals, and often, addition of filler material in the localized fusion
zone during welding. The heat source causes nonuniform temperature distributions across
the joint and the parent metals. The computational weld pool models have became a
significant route for a priori estimation of weld pool dimensions, peak temperature, cooling
rate, and many other associated aspects of the weld pool and the surrounding heat-affected
zone. Particularly, finite element method-based weld pool models are found very useful to
interpret weld thermal cycle and fluid flow pattern at an early stage of welding process
development and product design. However, the complex geometry of real engineering
components and the complexity of welding processes itself have made the prediction of
weld thermal cycle and corresponding flow field to be a very difficult task. It is further
noticed that the accuracies of these quantitative calculations are largely dependent on the
accuracy of several input parameters in welding. Some of the input parameters are also not
certain in nature, and optimization algorithms are integrated with the numerical process
model to determine the suitable values of these uncertain input parameters for modeling
calculations.
Welding results in very complex thermal cycles which cause irreversible elastic
plastic strain and residual stresses in and around fusion zone and heat affected zone (HAZ).
Residual stresses may be an advantage and disadvantage in structural components
depending on their magnitude and nature. The beneficial effects of compressive stresses
have been widely used in industry as these effects are believed to reduce stress corrosion
cracking and brittle fracture and increase fatigue strength of the component. In large steel
fabrication industries such as marine structures, aero-space industry, shipbuilding, high
speed train guide ways and pressure vessels and piping in chemical and petrochemical
industry; the problem of residual stresses and overall distortion has been observed and
continue to be a major issue. It is well known fact that material response of structural
components is strongly affected by the residual stresses when subjected to structural and

7/27/2019 welding project report.pdf
http://slidepdf.com/reader/full/welding-project-reportpdf 8/61
8
thermal loads. Due to the presence of these residual stresses produced in and around the
weld zone the strength and life of the component is definitely reduced.
Welds are always an essential part of engineering components. Residual stresses
produced in the welded regions of the metal components, due to the nonlinear thermal
processes during welding, can have detrimental effects, such as hydrogen-induced cracking
,stress corrosion cracking, and reduced fatigue strength. Due to this reason it is pertinent to
simulate the welding process to predict the behavior of welded structures from finite
element residual stress and strain results.
CHAPTER 3

7/27/2019 welding project report.pdf
http://slidepdf.com/reader/full/welding-project-reportpdf 9/61
9
WELDING TECHNOLOGY
3.1 Introduction to Welding
In general, welding is defined as any process in which two or more pieces of metalare joined together by the application of heat, pressure, or a combination of both. Almostall
the processes may be grouped into two main categories: heat welding, in which the welding
process is achieved by heat; and pressure welding, where the welding process is achieved
by pressure. Heat welding is the welding which is used today. The most important welding
parameters are the welding speed and the arc energy per unit length of the weld.
[Jonsson,M., Karlsson, Lindgren L.E;1985]
During welding process, the weldment is locally heated due to the welding heat source.
Because of the non-uniform temperature distribution during the thermal cycle, incompatible
strains cause to develop thermal stresses in the components. These incompatible strains due
to dimensional changes related with solidification of the welded metal, plastic deformation
and metallurgical transformations are the major sources of residual stresses and
distortion.[M Sundar1, G Nandi, A Bandyopadhyay And S C Roy; 2005]
The parameters of the line heating process have major effect on thermal distribution and the
resulting residual deformation of the heated plate. The thermal transients are generally
dependent on various factors like torch height, gas pressure, torch speed, and nozzle size,
which then controls the residual deformation of the plate. [Biswas, P., Mandal, N.R. & Sha,
O.P. 2007]
Arc welding, which is a heat-type welding, is the most important
manufacturingoperation for the joining of structural components for a wide range of
applications, including ships, bridges, building structures, guide way for trains,
automobiles, and nuclear reactors, to give an example. It is necessary to provide a
continuous supply of either direct or alternating electric current, which is normally used todevelop an electric arc to generate enough heat to melt the metal and form a weld.
The arc welding process is a complex operation involving extremely high
temperatures, which produce high levels of residual stresses and severe distortions .
Theseextreme phenomena results in reduction of the strength of a structure, which becomes
vulnerabletocorrosion, buckling, fracture and other type of failures.

7/27/2019 welding project report.pdf
http://slidepdf.com/reader/full/welding-project-reportpdf 10/61
10
3.2 Types of Arc Welding
The most widely used types of arc welding processes are gas tungsten arc, gas
metal arc, shielded metal arc and submerged metal arc.
3.2.1 Shielded Metal Arc Welding (SMAW)
In shielded metal-arc welding, a metallic electrode which is used to conductelectricity, is
coated with flux and is connected to a source of electric current. The metal which is to be
welded isconnected to the other end of the same source used to supply current. By having
touch of the tip of theelectrode to the metal and then drawing it away, an electric arc is
developed. The intenseamount of heat of the arc causes to melt both parts to be welded and
alsothe point of the metal electrode. Thispoint of the metal electrode supplies filler metalfor the weld.
3.2.2 Gas Tungsten Arc Welding (GTAW)
In gas tungsten arc welding, a tungsten electrode is used instead of the metal electrode as
used in shielded metal arc welding. A chemically inert gas, such as helium, orhydrogen
,argon, is used to shield the metal from oxidation. The heat produced from the arc
formedbetween the electrode and metal melts the edges of the metal component. Metal used
for the weld may beadded by placing a bare wire in the arc or at the point of the weld. The
GTAW process can be used with almost all metals and produces a high-quality weld
between two joints. Instead of this, therate of welding is considerably slower as compared
to other types of welding processes.
3.2.3 Gas Metal Arc Welding (GMAW)
In this type of arc welding, a bare electrode is shielded from the air by surrounding it with
argon or carbon dioxide gas or by coating the electrode with some type of flux for welding.
The electrode is required tofeedinto the electric arc, and melts off in droplets so as to enter
the liquid metal that forms the weld.

7/27/2019 welding project report.pdf
http://slidepdf.com/reader/full/welding-project-reportpdf 11/61
11
3.2.4 Submerged Arc Welding (SAW)
This type of arc welding is similar to gas metal arc welding, but in this process no any gas
is used to shield the weld. Instead of gas the arc and tip of the wire are submerged beneath a
layer offusible, granular material formulated to produce a proper weld. This process is very
effective but is only used with steel.
3.3 Types of Welding Joints
Welds are made at the junction of the various pieces that cause to make up the weldment.
The junctionsof parts, or joints, are termed as the location where two or more members are
to be joined. Metal parts being joined to produce the weldment may be in the form of
castings, forgings, rolled plate, sheet, pipes, or billets. The five basic types of welding joints
for plates are explained below.[ Bai-Qiao Chen,2011]
3.3.1 Butt Joint
It is a joint between two members lying approximately in the same plane as shown in
Figure 3.1
Figure 3.1 -Butt Joint Arrangement.

7/27/2019 welding project report.pdf
http://slidepdf.com/reader/full/welding-project-reportpdf 12/61
12
3.3.2 Corner Joint
It isa joint between two members located nearly at right angles to each other in the form of
an angle as shown in Figure 3.2.
Figure 3.2 -Corner Joint Arrangement.
Figure 3.3 - Edge Joint Arrangement.

7/27/2019 welding project report.pdf
http://slidepdf.com/reader/full/welding-project-reportpdf 13/61
13
3.3.3 Edge Joint
It is a joint between the edges of two or more parallel or mainly parallel members or
components as shown in Figure 3.3
3.3.4 Lap Joint
It isajoint between two overlapping members as shown in Figure 3.4.
Figure3.4 - Lap Joint Arrangement.
3.3.5 T Joint
It is a joint between two members located nearly at right angles with respect to each other
in the form of a T as shown in Figure 3.5.

7/27/2019 welding project report.pdf
http://slidepdf.com/reader/full/welding-project-reportpdf 14/61
14
Figure 3.5 - T Joint Arrangement.
3.4 Technique of Arc Welding
Thetechnique of arc welding is related with complex physical phenomena
associated with electricity, magnetism, welding including heat, light, and sound. By the
application of intense heat, the metal at the joint between two parts is melted and is
allowed to intermix. In general, itisdescribed by an electric field between the positive
anode and the negative cathode which is surrounded by an ionization gas. In arc welding,
the intense heat required to melt metal is produced by an electric arc. On the surface of
metal, there is a thin layer of surface electrons andwhichare being accelerated in the field
towards the anode. These electrons get collide with the atoms in the gas, resulting in
impact ionization where these atoms are decomposed into electrons and positive ions,
which tend to cause further ionization. The amount of current of electrically charged
particles in the arc and the temperature are related with each other as high temperatures
increases ionization. The temperature rise is due to the released energy. To obtain
suitable welding conditions the temperature or the current must initially be brought up to
a certain level, which is achieved by igniting the arc.
Arcignition is achieved by the short circuit current which is produced as the anode
and the cathode are brought into direct contact. Due to direct contact, the short-circuit
current shortly increases the temperature and the current and subsequently the arc can be
maintained constant in the electric field existing under normal welding conditions when

7/27/2019 welding project report.pdf
http://slidepdf.com/reader/full/welding-project-reportpdf 15/61
15
applied. The arc is being surrounded by a magnetic field which directs the charged
particles towards the center of the arc, hence causing the arc to localize in the spots on
the anode and the cathode.During the period, when the electrically charged particles get
impacted on the anode and the cathode, the anode and the cathode spots are being heated
to high temperatures. This high temperature of approximately 3000 to 5000 C causes
both theelectrode and the welded metal, both to melt. Because ofthe suction force of the
plasma flow, the droplets of the electrode material are deposited on the metal.
Heat source
Heat affected zone
Melt-pool zone
Basemetal
Figure 3.6 - Illustration of Melt-Pool Zone and Heat Affected Zone (HAZ)
3.5 Heat Affected Zone (HAZ)

7/27/2019 welding project report.pdf
http://slidepdf.com/reader/full/welding-project-reportpdf 16/61
16
A welded joint normally consists of melt-pool zone (MPZ), heat affected zone (HAZ), and
unaffected base metal portion. The HAZ is generally defined as the portion of the base
metal which has not been melted and whose mechanical properties or microstructures have
been changed by the heat of the welding. The HAZ is crucial and important to the strength
of the weldment since the fracture and cracking occur inside the HAZ region. During
welding process, the temperature at this region is very much severe. As a result, it contains
a different types of microstructures, some of which may have weak toughness and strength
properties.Figure 3.6 shows a melt-pool zone (MPZ) and heat affected zone (HAZ) in the
weldment during welding. The effects of temperature distribution on microstructure of
material in the HAZ have been studied by Weisman (1976).

7/27/2019 welding project report.pdf
http://slidepdf.com/reader/full/welding-project-reportpdf 17/61
17
3.6 Theory of Welding Strains
Due to its nature, the welding process is one of the complicated transient procedure which
typically occurs in a 3-D (3-dimensional) structure. A typical welding simulation is
considered to be consists of two phases one is a transient heat flow analysis phase and
another is quasistatic plastic structural analysis phase. A reasonably good welding
simulation has requred to have a fine enough mesh in order to accommodate the high
thermal gradients that are developed (in time and in space) during the transient heat flow
analysis phase. At the same time, the mesh is required to be able to solve the plastic-
structural phase of the problem. [Cristian Simion,Corneliu Manu, Saleh Baset and Julian
Millard]
During the period ofthe heating and cooling cycles of a welding process, there are many
factors which affect shrinkage of the metal and therebymaking accurate predictions of
distortion complex and difficult. The mechanical and physical properties of the metal that
affect the degree of distortion change with respect tothe application of the heat. When the
temperature of the weld gets increasedthe modulus of elasticity, the yield strength and the
thermal conductivity of the steel decrease, whereas, the coefficient of thermal expansion and
the specific heat increase.
Thechanges in temperature and stresses during welding process have been studied by
Weisman (1976). To explain the temperature changes during welding, various cross-sections are required to be analyzed as shown in Figure 3.7(a).In some distance apart of the
welding torch i.e. section along A-A, the temperature gradient, ΔT due to the welding is
nearly zero. Along section B-B, which crosses the welding arc, at this section, the
temperature change is very high and the distribution is very uneven. Along section C-C,
having some distance behind the welding arc, the temperature change becomesmore even
and less steep. Finally, along section D-D, which is very much far from the welding arc, at
that section, the temperature change due to welding has reached to nearly zero.

7/27/2019 welding project report.pdf
http://slidepdf.com/reader/full/welding-project-reportpdf 18/61
(a) T
(b) Stres
Figure 3.7 – Schematic Rep
The effective distribution of st
and D- D are shown in F
stresses, xy,also exist, but the
thermal stresses due to weldin
section B-B are also nearly zer
heat-affected zone (HAZ) are
restrained by surrounding me
temperature in these regions is
as high due to the yield stre
magnitude of compressive stre
18
mperature distribution during welding
σ x distributionduring welding.
resentation of Changes of Temperature and Stre
Welding (Weisman, 1976).
resses x,in the X-direction at cross sections A
gure 3.7(b). Normal stresses in y-directi
y are usually much smaller than x.Along sec
g are nearly zero. Stresses in region below th
o because molten metal cannot support a load.
ormally compressive, because the expansion o
al where the temperature is generally lower.
high and the yield strength of material is low, t
gth of the material at the corresponding tem
ss gets to a maximum value with increasing dis
ses during
-A, B-B, C-C,
n, y,shearing
tion A-A, the
weld pool at
Stresses in the
these areas is
As the metal
e stresses are
erature. The
ance from the

7/27/2019 welding project report.pdf
http://slidepdf.com/reader/full/welding-project-reportpdf 19/61
19
weld or with decreasing temperature. Stresses in regions which are away from the weld line
tend to tensile to balance with the compressive stresses in areas near the weld.
At section C-C, where the welded metal and heat-affected zone have cooled, the
result is creation of tensile stresses in regions near the weld as they tend to shrink and
compressive stresses at greater distance. Finally, section D-D which represents a region
which is cooled-down and where high- tensile stresses are present in the HAZ zone and
compressive stresses exist in base plate normally away from the weld.
3.7 Types of Welding Strains
Duringwelding process, there are non-uniformheating and cooling cycles in the weld and
adjacent base metal, which produces complex thermal strains. The stresses formed due to
the strains produce internal forces resulting in shrinkage of the material. The stresses that
would exist in weldment after all external loads are removedare called residual stresses.
Depending on the shape of the structure welded and the shrinkage pattern , various strains
such as buckling, bending and rotation take place.
When steel structure parts are connected by welding, they are subjected to not only
welding residual stresses but also distortion. This distortion found in the welded structures
results due to four fundamental dimension changes that occur during welding process.
(Refer fig. 3.8)
1. Transverse shrinkage of butt joints which occurs due to dimensional reduction in the
directionwhich is perpendicular to the welding line.
2. Longitudinal shrinkage of butt joints which occurs due to dimensional reduction in a
direction parallel to the weld line. Themagnitude of the longitudinal shrinkage is
small as compared to the transverse shrinkage, which is about 1/1000 of the weld length
as reported by Weisman (1976).

7/27/2019 welding project report.pdf
http://slidepdf.com/reader/full/welding-project-reportpdf 20/61
(a)
(c)
Figure3.8 -Various Types of (b) Angular Change in a B
Distortion in a Fillet Joint.
20
(b)
(d)
elding Distortion - (a) Transverse Shrinkage intt-Joint; (c) Angular Change in a T-Joint; (d)
a Butt-Joint;Longitudinal

7/27/2019 welding project report.pdf
http://slidepdf.com/reader/full/welding-project-reportpdf 21/61
21
3. Angular distortion of butt joints which is caused due to an angular change that occurs due
to a non-uniform thermal contraction through the thickness of the plate. The thermal
contraction which is non-uniform originates from the uneven heating through the thickness
during welding.
4. Similar to the angular distortion of welds in butt joints, there is non-uniform thermal
contraction through the thickness of the flanges creates a moment M about the flange neutral
axes and cause angular distortion of fillet welds.
5. Longitudinal bending distortion is produced by bending stresses induced by the
longitudinal shrinkage forces of the welds which do not coinciding with the neutral axis of
the weldment.
3.8 Residual Stress
Theresidual stress is produced in the weldment primarily because the weld material
that has been melted contracts on cooling down from melting point to roomtemperature.
Residual stress getsincreases with increase in plate thickness. Arc voltage and welding
current, both have direct effect on the residual stress in the welding process. An increase in
the voltage and current increases heat input rate thus increasing residual stresses. Also,
increase in welding speed cause reduction in residual stresses but at the same time reduces
quality of weld as well.[Gurinder Singh Birar; 2013]Figure3.9shows the deflection of a
welded plate at the moment when a longitudinal edge is heated by amoving welding arc.
The metal which is near the heat sourceisheatedtohighertemperaturesthan the metal which is
away fromthe heat source. The hotter metal gets expands, and the plate firstdeforms as
shown by curve AB. Due to the presence ofplastic strains, when the plate cools to
roomtemperature, the final strain δ remains as shown by curve ABCD.

7/27/2019 welding project report.pdf
http://slidepdf.com/reader/full/welding-project-reportpdf 22/61
Figure3.9- Strain of Welded
To understand this phenomen
gap and without a gap. When
expands but the base metal pre
element 1 is in tension wherea
cools down, the opposite phe
base metal stops it to contract.
in tension as shown in Figure
such a way that the top surfac
case of the butt joint welding
is free to expand as it cools do
22
late under the Influence of a LongitudinalMovi
n, let’s consider a butt joint welding with tw
the weld material first starts solidifying, the h
vents it to get expand. As can be seen in the F
element 2 is under compression. At the time,
omena can be observed; the weld material co
Consequently, element 1 is in compression an
3.10 (b). As a result of which themetal plates
e is in tension and bottom surface is under co
ithout gap, less strain is expected due to the
n.
gHeat Source.
cases with a
eated material
igure 3.10 (a),
hen the weld
tracts but the
d element 2 is
ill deform in
pression. In
ottom surface

7/27/2019 welding project report.pdf
http://slidepdf.com/reader/full/welding-project-reportpdf 23/61
Figure 3.1
23
0- Contraction and Expansion Phenomena.

7/27/2019 welding project report.pdf
http://slidepdf.com/reader/full/welding-project-reportpdf 24/61
24
3.9 WeldingApplications
Welding application for the followingmaterials are explained below.
A) Steel:-
1. Structural carbon steel welded tostructuralcarbon steel.
2. Concrete reinforcing steel
3. Carbon or low-alloy and high-strength, steels for all types of piping
systems.
4. Rails.
5. Steel castings, carbon or high-strength and low-alloy.
6. Structural carbon steel welded tohigh- strength, low-alloy steel
7. High-strength and low-alloy steel weldedto high-strength andlow-alloy
steel.
B) Stainless steels.
1. Cryogenic vessels and piping materialsusedfor storage and transport of
extremelylow temperature liquids
2. Vacuumchambers.
3. All otheruses.
C) Nickel Steels andnickelalloysare used forcryogenicvessels andpipingsystems.
D) Alloys of Aluminum used for cryogenic vessels, piping systems,andotheruses.
E)Carbon and high-strength and low-alloy steels welded tostainlesssteels. An
exampleofthis useiswhen steel supports or stiffeners areattached to stainless steel
vessels.
3.10 Introduction to ASTM 36
As the material used for welding simulation is ASTM 36, itsvarious properties and
applications are necessary to know.ASTM 36 is the most commonly used mild steel and
hot-rolled steel. This hot rolled steel has excellent welding properties and also it is
suitable for tapping, drilling, grinding, punching and machining processes. The yield
strength of ASTM 36 is less compared to cold roll C1018, hence enablingASTM 36 to
bend more easily than C1018. Normally, larger diameters in ASTM 36 are not
manufactured since C1018 hot roll rounds are used. Steel shapes like channels, angles,

7/27/2019 welding project report.pdf
http://slidepdf.com/reader/full/welding-project-reportpdf 25/61
25
H-beams and I-beams can also be produced with ASTM 36. [30]
ASTM 36 is usually available in the following three forms:
1. Rectangle bar
2. Square bar
3. Circular rod
Table 3.1shows the Chemical composition, Table 3.2 shows Physical Properties and
Table 3.3 showsMechanical properties of ASTM 36 respectively.
Table 3.1 - Chemical Composition of ASTM 36
Element Content
Carbon, C 0.25 - 0.290 %Copper, Cu 0.20 %
Iron, Fe 98.0 %
Manganese, Mn 1.03 %
Phosphorous, P £ 0.040 %
Silicon, Si 0.280 %
Sulfur, S £ 0.050 %
Table 3.2 - Physical Properties of ASTM 36
Physical Properties Metric Imperial
Density 7.85 g/cc 0.284 lb/in
Table 3.3 - Mechanical Properties of ASTM 36
Mechanical Properties Metric Imperial
Tensile Strength, Ultimate 400 - 550 MPa 58000 - 79800 psi
Tensile Strength, Yield 250 MPa 36300 psi
Elongation at Break (in 200 mm) 20.0 % 20.0 %Elongation at Break (in 50 mm) 23.0 % 23.0 %
Modulus of Elasticity 200 GPa 29000 ksi
Bulk Modulus (typical for steel) 140 GPa 20300 ksi
Poissons Ratio 0.260 0.260
Shear Modulus 79.3 GPa 11500 ksi
7/27/2019 welding project report.pdf
http://slidepdf.com/reader/full/welding-project-reportpdf 26/61
26
Machining
The machinability rate of ASTM 36 is estimated to be 72%, and the average surface cutting
feed of ASTM 36 is 120 ft/min. Machining process of ASTM 36 steel is not as easy as AISI
1018 steel.
Welding
ASTM 36 steel is easy to weld by using any type of the welding, and the welds and joints so
formed are of excellent quality.
Heat Treatment
Any standard carburizing and hardening types of AISI 1018 steel is suitable for ASTM 36.
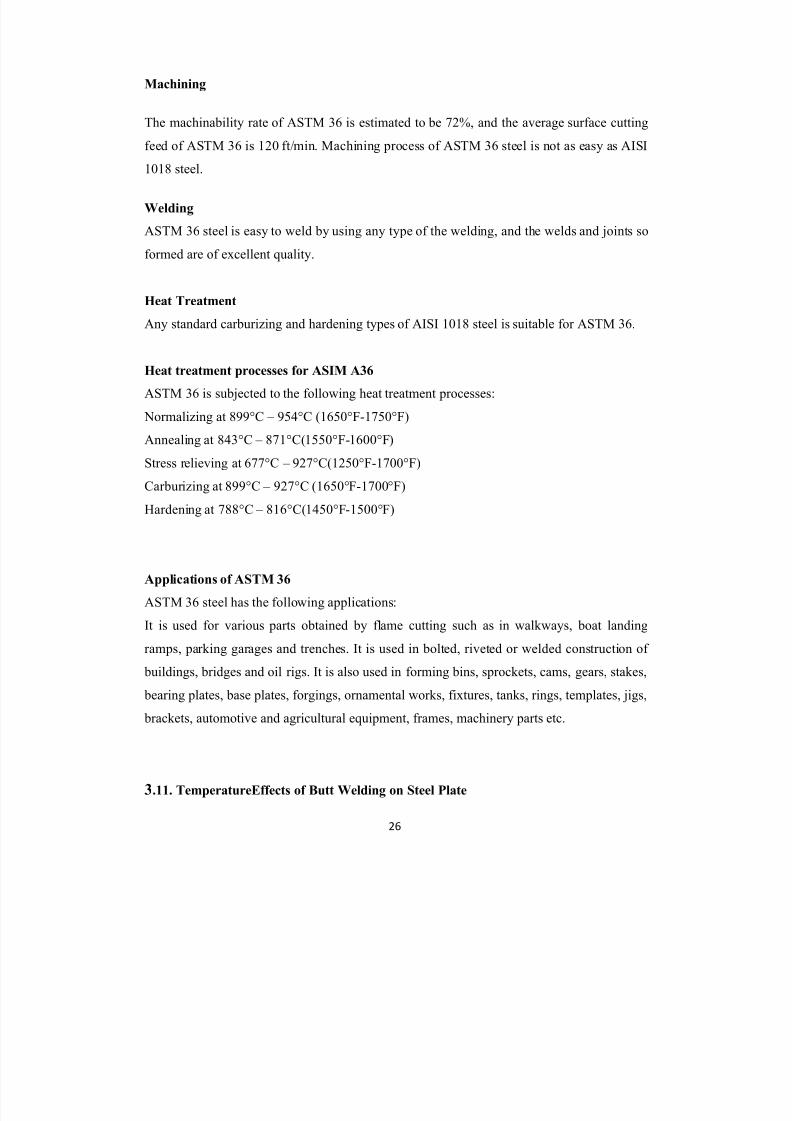
Heat treatment processes for ASIM A36
ASTM 36 is subjected to the following heat treatment processes:
Normalizing at 899°C – 954°C (1650°F-1750°F)
Annealing at 843°C – 871°C(1550°F-1600°F)
Stress relieving at 677°C – 927°C(1250°F-1700°F)
Carburizing at 899°C – 927°C (1650°F-1700°F)
Hardening at 788°C – 816°C(1450°F-1500°F)
Applications of ASTM 36
ASTM 36 steel has the following applications:
It is used for various parts obtained by flame cutting such as in walkways, boat landing
ramps, parking garages and trenches. It is used in bolted, riveted or welded construction of
buildings, bridges and oil rigs. It is also used in forming bins, sprockets, cams, gears, stakes,
bearing plates, base plates, forgings, ornamental works, fixtures, tanks, rings, templates, jigs,
brackets, automotive and agricultural equipment, frames, machinery parts etc.
3.11. TemperatureEffects of Butt Welding on Steel Plate

7/27/2019 welding project report.pdf
http://slidepdf.com/reader/full/welding-project-reportpdf 27/61
27
1. The heat affected zone of double-layer weld pass remains togreater extentthan single-layer
weld pass.
2. The changes in temperature gradient are quite small at a certain distance from weld pass
due to heat convection effect.
3. The temperature gradient of vertical weld pass is normally greater than the direction of
weld heat source.
4. With the same number of weld passes, heat affected zones get decreased with the increase
of weld speed.
5. When the heat source has shifted half the size of the parent material, there exists still high
temperature gradient where the heat source has initially caused effects.
3.12 Important Factors to Determine the Welding Quality
A) Strict control over welding proceduresandoperations is necessary in five cases
1. Distress in onemembercan causeatleast partial collapse or failurewith
somehazardto property and life ; applicationofthedesignload mayapproach
10,000 cycles overmanyyears.
2. Some of the welds necessary forstructural integrity are highly
stressed;applicationof thedesign loadmayexceed10,000 cyclesovermanyyears.
3. Empirical design requirementscompensate for overloads, mishandling,
“acts of God,” abuse and similar hazards; applicationof the designload
maybein the range ofnearly about 100,000cycles.
4. Failure of welds or components couldbecatastrophic, as in structures such
as bridges orhigh--pressure gas piping systems; fatigue ofmaterials must be
carefully considered in to account or applicationofdesign load is on the
order of 2 million cycles.
5. Applications require the highest qualityofmaterial and workmanship
throughout, such asfor nuclear, space, and ballistic applications
andforsystems subjected to extreme pressures,hazardous chemicals, or
temperatures.
B)Less control overweldingproceduresandoperations is needed where:

7/27/2019 welding project report.pdf
http://slidepdf.com/reader/full/welding-project-reportpdf 28/61
28
1. Stress levelsare toolow.
2. Welds are subjected occasionallyto design loads.
3. The structure is composed ofmanycomponents, and distress in one
memberwill result ininconvenience rather than collapse
orcatastrophicfailure.
CHAPTER 4
FINITE ELEMENT ANALYSIS
4.1 Introduction

7/27/2019 welding project report.pdf
http://slidepdf.com/reader/full/welding-project-reportpdf 29/61
29
At present the finite element method (FEM) is the most widely used tool for solving this
kind of thermal problems When the aim of the analysis is to determine the mechanical
effects of welding(residual stress and distortions) the simple approach is to consider the
thermal and mechanical relation only, because there is a weak connectionfrom mechanics to
heat flow. Heat generated bydeformation can be neglected) and hence the most used
approach is to carry a sequentially coupled thermal and mechanical analysis, if the structure
deformation during weldingdoes not change significantly. This aspect gives also
thepossibility for the use of general purpose finite element computer codes. [Viorel
Deaconu;2007]
The results obtained by FEA emphasize the ability of this method to give quality results, in
agreement with experimental results and also offer the possibility to a better understanding
of residual stress field characteristics. Despite the limitations related to the need for information related to the welding process and for complex material data and numerical
modeling remains actually the sole method which is able to fully characterize the residual
stress field through the whole structure without any limitations related to his geometry or
shape and size. Once having residual stress distributions information, subsequent
simulations related to stress relief carried by mechanical loading or by post weld heat
treatments can be performed. [Viorel Deaconu;2007]Following are the important aspects of
FEA
4.1.1 Simulationof Butt WeldingProcess
During fabrication of welded components residual stresses are produced as a result of non-
uniform temperature distribution during the welding process and particularly the cooling
processes. The residual stresses have a significant effect on the overall performance of the
components in service, [Pornwasa Wongpanya;2009]To simplify the welding simulation, it
is bettertoperform thermaland mechanicalanalyses separately.
At first, thecomputationof thetemperaturehistory duringweldingand
subsequentcoolingiscompletedand thistemperaturefield isapplied tothemechanicalmodel
asabodyforcetomaketheresidualstressanalysis. Theheatinputrequired duringwelding
ismodeledin commerciallyavailablesoftwareby using theequivalentheat
inputwhichincludesbodyheat flux.
Theamount ofheatinput,QR has been calculated by usingempiricalrelationshowninEq.1.
[M.Jeyakumar; 2011]Arcefficiency isdenotedby η,arcvoltagebyV,arccurrent byI.

7/27/2019 welding project report.pdf
http://slidepdf.com/reader/full/welding-project-reportpdf 30/61
30
Heat input = efficiency x voltage xcurrent
QR = η x V x I(1)
By usingequation (1)ofheatinputthe amount of heat input is determined.Bythermal
analysisthetemperature at different pointsarenoted. This
simulatedtemperaturefieldisthenused in analysis step forcalculatingthe residualstresses
andafterthat thevaluesof residual stressesarecalculated by doingstressanalysis.
4.1.2 Use of Finite Element Analysis
Finite element analysis is helpful to make it possible to evaluate a detailed and complex
structure, in a computer, during the planning of that structure. The possibility of improving
the design during planning and the adequate strength of the structure can justify the cost of
the analysis work. FEA has been known to improve the design ofthe structure that were built
many decades ago and significantly over designed.
In absence of finite element analysis (or other numerical analysis) development of structures
depends onlyupon hand calculations only. For complex structures, the simplified
assumptions which are required to make any calculation possible can lead to a conservative
and heavy design. Animportant factor of ignorance can remain as to whether the structure
will be adequate for all design loads. Significant changes in designs involve a lot of risk.
Design will require prototypes to be built and they should be field tested. These field tests
may involve expensive strain gauging to evaluate characteristics like strength and strain.
With the help of finite element analysis, the weight of a design can be optimized and
there could be a reduction in the number of prototypes built. Field-testing is required to
establish loading on structures, which can be used to do future design improvement by using
finite element analysis.
4.1.3 Advantages of FEA
The power of the finite element technique resides principally in its versatility. The
FEA can be applied to various physical problems. The body to be analyzed can be having
arbitrary size and shape, loads and various support conditions. The command mesh can mix
elements of differentphysical properties,types and shapes.

7/27/2019 welding project report.pdf
http://slidepdf.com/reader/full/welding-project-reportpdf 31/61
31
Another important feature of finite element method lies in the close physical
resemblance between the actual structure and its finite element model.
4.1.4 Limitations of FEA
1. A computer, a reliable program and intelligent use and software skills are essential.
2. Deep experience and good engineering judgment are needed in order to define a good
finite element model.
3. Different input data are required and voluminous output must be sorted and understood.
4. Specific numerical results are required to be found for specific problem.
5. The finite element analysis does not provide any close form of solution that allows
analytical study of the effects of changing parameters.
4.2 Geometric Modeling
The geometry and the element type are required to be considered together. Shellelement is
typically used for structure where the thickness is almost negligiblecompared to its length
and width. Nevertheless, a plate modeled with solid element would provide similar results.
The disadvantage can be found in the computation time. FEA provides large no. of choices
of elements. Following are the basic aspects of geometric modeling.
4.2.1 Mesh Generation
Mesh generation can be defined as the process of dividing the analysis continuum into a
number of discrete parts or finite elements. The finer the mesh, the better will be the result,
but the longer will be the analysis time. Hence, a compromise between accuracy & solution
speed is usually done. The mesh can be created manually. In the manually created mesh, it
will be noticed that the elements which are at the joint are smaller. This is termed as mesh
refinement, and it helps in allowing the stresses to be captured at the geometric discontinuity
(the junction). Manual meshing is somewhat a long & tedious process for models with any
degree of geometric complication, but providedwith useful tools emerging in pre-processors,
the work is becoming easy. Automatic mesh generators are found to be very useful &
popular. The mesh is being created automatically by a mesh engine; the only requirement is

7/27/2019 welding project report.pdf
http://slidepdf.com/reader/full/welding-project-reportpdf 32/61
32
to define the mesh density along the path of the model's edges. Automatic meshing has
limitations as related to mesh quality & solution accuracy. Automatic brick element (hex)
meshers are limited in function, but are getting steadily improving. Any mesh can be usually
applied to the model by simply selecting the mesh command on the preprocessor list
provided in the GUI.
4.2.2 Properties Assignment
Material properties (coefficients of expansion, friction, thermal conductivity, Young’s
modulus, Poisson’s ratio, the density, & if applicable, damping effect, specific heat etc.) are
required to be defined. In addition element properties may be needed to be set. If 2D
elements are going to be used, the thickness property is required. 1D-beam elements require
area, Ixx, Iyy, Ixy, J, & a direction cosine property, that defines the direction of the beam axis
in 3D space. Shell elements like 2D elements in 3D space which are 2½D in nature, require
neutral surface offset parameters to be defined & orientation also. Special elements
likemass, contact, spring, gap, coupling, damper etc. require properties to be defined for
their use and should be specific to the element type. Following properties of ASTM 36 were
considered during analysis by finite element method. Table no 4.1 shows thermal properties
while table no.4.2 shows mechanical properties of ASTM 36.
Table no.- 4.1 Thermal Material Properties
Temp Density Enthalpy Thermal Conductivity Specific
(k) (kg/m³) (J/m³) Expansion(1/k) (W/mk) Heat(J/kgk)
273 8038.7 9.76E+08 2.03E-05 13.29 456.28

7/27/2019 welding project report.pdf
http://slidepdf.com/reader/full/welding-project-reportpdf 33/61
33
293 8030.47 1.05E+09 1.99E-05 13.63 464.73
373 7997.02 1.35E+09 1.50E-05 14.99 494.23
473 7954.03 1.75E+09 1.96E-05 16.62 522.74
573 7909.76 2.16E+09 1.93E-05 18.19 543.93
673 7864.18 2.59E+09 2.03E-05 19.72 559.87
773 7817.31 3.03E+09 2.06E-05 21.26 572.69873 7769.13 3.48E+09 2.08E-05 22.81 584.49
973 7719.66 3.94E+09 2.12E-05 24.42 597.38
1073 7668.9 4.41E+09 2.15E-05 26.09 613.45
1173 7616.83 4.90E+09 2.21E-05 27.86 634.82
1273 7563.47 5.40E+09 2.26E-05 29.76 663.58
1373 7508.81 5.93E+09 2.29E-05 31.81 701.85
1473 7452.85 6.49E+09 2.33E-05 34.03 751.72
1573 7395.6 7.09E+09 2.37E-05 36.46 815.30
1673 7354.75 7.54E+09 2.40E-05 38.29 869.09
Table no. - 4.2 Mechanical Material Properties
Temp Yield Tensile Elastic
(k) Strength(N/m²) Strength(N/m²) Modulus(N/m²)
273 3.47E+08 6.45E+08 2.00E+11
293 3.20E+08 6.20E+08 1.96E+11
373 2.11E+08 5.20E+08 1.92E+11
473 1.67E+08 4.60E+08 1.84E+11573 1.45E+08 4.40E+08 1.76E+11
673 1.35E+08 4.20E+08 1.68E+11
773 1.29E+08 4.00E+08 1.60E+11
873 1.23E+08 3.80E+08 1.52E+11
973 1.17E+08 3.60E+08 1.44E+11
1073 1.11E+08 3.40E+08 1.35E+11
1173 1.05E+08 3.20E+08 1.27E+11
1273 9.90E+07 3.00E+08 1.19E+11
1373 6.60E+07 2.54E+08 1.05E+11
1473 2.40E+07 9.80E+07 2.00E+101573 1.05E+07 3.90E+07 7.00E+09
1673 1.00E+07 2.70E+07 5.56E+08

7/27/2019 welding project report.pdf
http://slidepdf.com/reader/full/welding-project-reportpdf 34/61
34
Figure4.1 Graph for Thermal Conductivity V/S Temperature
4.2.3 Graphs of Material Properties
For transient thermal structural coupled filed analysis temperature dependent
material properties as shown in fig 4.1, fig.4.2, fig.4.3, fig.4.4 &fig.4.5 areconsidered. The
specific heat of the material goes on increasing with the increase of temperature as shown in
figure 4.2.
0
5
10
15
20
25
30
35
40
45
2 2 9
3 5 9 1 0
1 1
1 2
1 1 6
C o n d u c t i v i t y ( W / m K )
Temp (K)
Conductivity
Conductivity

7/27/2019 welding project report.pdf
http://slidepdf.com/reader/full/welding-project-reportpdf 35/61
35
Figure 4.2 Graph for Specific Heat
Inverse to the specific heat property the density of ASTM 36 decreases with increase in
temperature as shown in fig.4.3
Figure 4.3 Graph for Density
0.00
100.00
200.00
300.00
400.00
500.00
600.00
700.00
800.00
900.00
1000.00
2 3 6 8 9 1 1
1 2
1 1 6
S p e c i f i c H e a t ( J / K g
K )
Temp (K)
Specific Heat
Specific Heat
7000
7200
7400
7600
7800
8000
8200
D e n s i t y K g / m 3
Temp (K)
Density
Density

7/27/2019 welding project report.pdf
http://slidepdf.com/reader/full/welding-project-reportpdf 36/61
36
Figure 4.4 Graph for Elastic Modulus
The elastic modulus of the material goes on decreasing with temperature as shown in
fig.4.4.When the material attains a temperature which is equal to 1373 K, the value of elastic
modulus begins to decrease drastically. Fig 4.5 shows Graph for Thermal Expansion against
various values of temperatures.
0.00E+00
5.00E+10
1.00E+11
1.50E+11
2.00E+11
2.50E+11
E l a
s t i c M o d u l u s ( N / m 2 )
Temp (K)
Elastic Modulus
Elastic Modulus

7/27/2019 welding project report.pdf
http://slidepdf.com/reader/full/welding-project-reportpdf 37/61
37
Figure 4.5 - Graph for Thermal Expansion
4.3 Applied Loads
Some specific type of load is usually applied to the analysis model. The loading may be in the form
of a pressure, a point load or a displacement in a stress (displacement) analysis, a heat flux or a
temperature in a thermal analysis & a fluid pressure or velocity in a fluid analysis. The loads may be
applied to an edge, a surface, a point, or even a complete body. The various loads should be in the
same units as used in the model geometry & material properties are to be specified. In the cases of
buckling analyses & modal (vibration) , a load is not required to have to be specified for the analysis
to run.
In this project analysis, load due to increase in temperature i.e. load due to heat flux was
considered.At first, thecomputationof thetemperaturehistory duringweldingand
subsequentcoolingiscompletedand thistemperaturefield isapplied tothemechanicalmodel
asabodyforcetomaketheresidualstressanalysis. Theheatinput required duringwelding
0.00E+00
5.00E-06
1.00E-05
1.50E-05
2.00E-05
2.50E-05
3.00E-05
2 2 9
3 8 9 1 0
1 1
1 2
1 3
1
T
h e r m a l E x p a n s i o n ( m / m
K )
Temp (K)
Thermal Expansion
Thermal Expansion

7/27/2019 welding project report.pdf
http://slidepdf.com/reader/full/welding-project-reportpdf 38/61
38
ismodeledin commerciallyavailablesoftwareby using theequivalentheat
inputwhichincludesbodyheat flux.
Theamount ofheatinput,QR has been calculated by
usingstandardrelationshowninEq.1.Arcefficiency isdenotedby η,arcvoltagebyV,arccurrent byI.Typicalweldingparameterstaken in thisstudy are,arcvoltage is considered30 volts,
arccurrent to be as 200 amp and arc efficiency70%.
Heat input = efficiency x voltage xcurrent
QR = η x V x I (1)
By usingequation (1)ofheatinputthe amount of heat input is determined. Bythermal
analysisthetemperature at different pointsarenoted. This
simulatedtemperaturefieldisthenused in analysis step forcalculatingthe residual
stressesandafterthat thevaluesof residual stressesarecalculated bymeans of stressanalysis.
4.4 BoundaryConditions
If a load is applied to the model, in that case in order to stop it accelerating infinitely through the
computer's virtual ether (which is mathematically alsoknown as a zero pivot),it is necessary that at
least one constraint or boundary condition must be applied. The structural boundary conditions areusually taken in the form of zero displacements, thermal boundary conditions such as temperatures
ranges are usually specified, fluid BCs are usually specified by pressures. A boundary condition may
be specified in order to act in all directions (x, y, z), or in some cases to certain directions only. They
can be placed or applied on key points, nodes, and areas or on lines. Boundry conditions's on lines
can be represented in the form of symmetric or anti-symmetric type boundary conditions, one
allowing in plane rotations &out of plane translations, whereas the other allowing in plane
translations & out of plane rotations for a given line. The applications of correct boundary conditions
are critical related to the accurate solution of the design problem. At least one boundary condition is
required to be applied to every model, in case when even buckling & modal analyses with no loads
applied.
The welding process simulation was carried out in three different steps. As the welding
process is time dependent the transient thermal structural coupled field analysis is carried out
by using following boundary conditions,
7/27/2019 welding project report.pdf
http://slidepdf.com/reader/full/welding-project-reportpdf 39/61
39
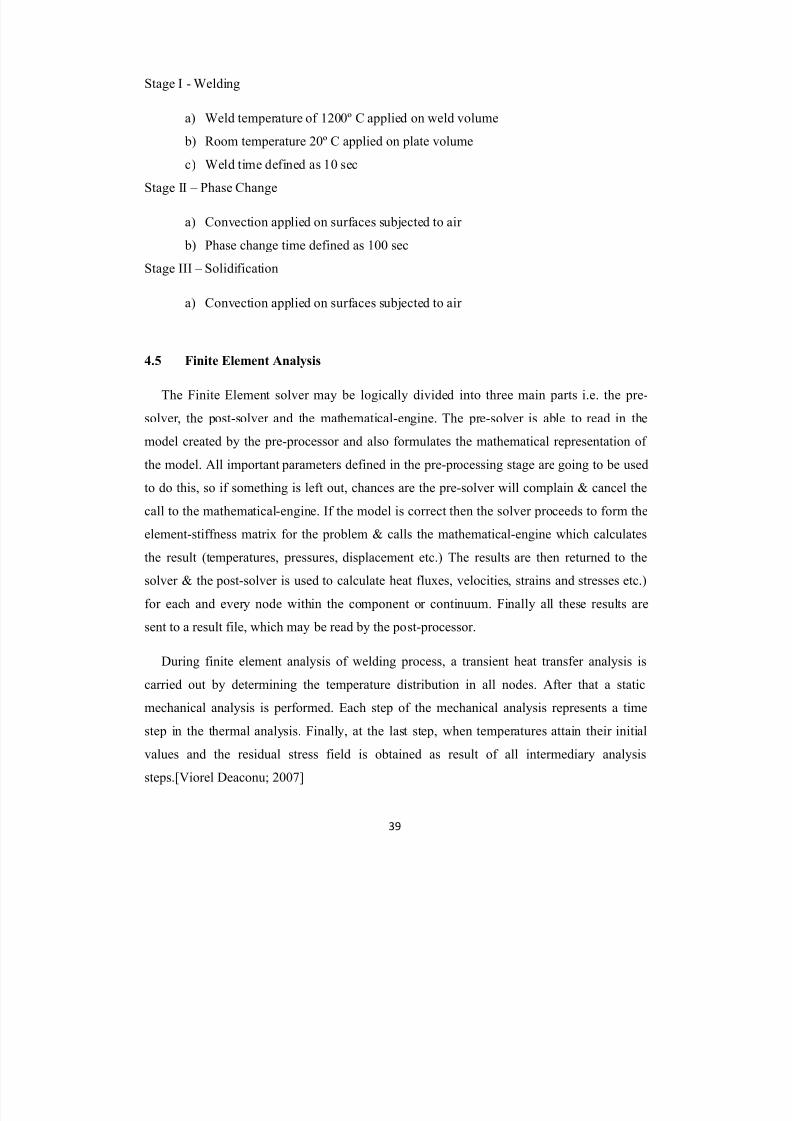
Stage I - Welding
a) Weld temperature of 1200º C applied on weld volume
b) Room temperature 20º C applied on plate volume
c) Weld time defined as 10 secStage II – Phase Change
a) Convection applied on surfaces subjected to air
b) Phase change time defined as 100 sec
Stage III – Solidification
a) Convection applied on surfaces subjected to air
4.5 Finite Element Analysis
The Finite Element solver may be logically divided into three main parts i.e. the pre-
solver, the post-solver and the mathematical-engine. The pre-solver is able to read in the
model created by the pre-processor and also formulates the mathematical representation of
the model. All important parameters defined in the pre-processing stage are going to be used
to do this, so if something is left out, chances are the pre-solver will complain & cancel the
call to the mathematical-engine. If the model is correct then the solver proceeds to form theelement-stiffness matrix for the problem & calls the mathematical-engine which calculates
the result (temperatures, pressures, displacement etc.) The results are then returned to the
solver & the post-solver is used to calculate heat fluxes, velocities, strains and stresses etc.)
for each and every node within the component or continuum. Finally all these results are
sent to a result file, which may be read by the post-processor.
During finite element analysis of welding process, a transient heat transfer analysis is
carried out by determining the temperature distribution in all nodes. After that a static
mechanical analysis is performed. Each step of the mechanical analysis represents a time
step in the thermal analysis. Finally, at the last step, when temperatures attain their initial
values and the residual stress field is obtained as result of all intermediary analysis
steps.[Viorel Deaconu; 2007]

7/27/2019 welding project report.pdf
http://slidepdf.com/reader/full/welding-project-reportpdf 40/61
40
4.6 Simulation
During simulation of welding process, the results of the analysis are read & interpreted.
They can be represented in the form of a contour plot, a table, deformed shape of the
component or the mode shapes and natural frequencies in case if frequency analysis isinvolved. Other results are also available for thermal, fluids and electrical analysis types.
Most of the post-processors provide an animation service, which is able to produce
animation & hence brings your model to life. Contour plots are generally the most effective
way of viewing results for structural type problems. Slices maybe made through 3D models
to facilitate the viewing of internal stress patterns. All post-processors nowadays include the
calculation of stress & strains in any of the x, y or z directions, or if requred in a direction at
an angle to the coordinate axes. The principal stresses and strains can also be plotted and if
required the yield stresses and strains can also be plotted according to the main theories of
failure (Von mises, St. Venant, Tresca etc.). Other necessary information such as plastic
strain, the strain energy, and creep strain may be obtained for certain types of analyses.

7/27/2019 welding project report.pdf
http://slidepdf.com/reader/full/welding-project-reportpdf 41/61
41
CHAPTER- 5
COUPLED FIELD ANALYSIS
5.1 Coupled Field Analysis
When the input of one of the field analysis depends on the results from another
analysis, the analyses are said to be coupled. A coupled-field analysis is defined as a
combination of analyses from different engineering disciplines (physics fields) that interact
to solve a global engineering problem; due to this, we often refer to a coupled-field analysis
as a multiphysics analysis.
The Coupled field analysis may be carried out using following two methods,
1. Direct Method
2. Sequential Method
5.1.1 Introduction to Direct Coupled Field Analysis
The direct method for doing a coupled-field analysis includes a single analysis that
uses a coupled-field element. There are different types of coupled filed analyses which are
available according to different engineering streams. For this dissertation work thermal
structural direct coupled field analysis is used for simulation of the welding process.
5.1.2 Objective of Direct Coupled Field Analysis
The aim of thermal structural direct coupled filed analysis is to simulate welding
process using finite element analysis and thereby find the residual stresses due to phase
change.

7/27/2019 welding project report.pdf
http://slidepdf.com/reader/full/welding-project-reportpdf 42/61
42
5.2 Steps for Coupled Field Analysis
Coupled field analysis consists of the following steps
1. Preprocessing:-
Create the model geometry.
Define Material Properties
Mesh generation.
2. Solution:-
Boundary conditions (loads & constraints)
Solve.
3. Post Processing:-
Review results
5.3 Modeling Geometry
The ultimate purpose of finite element analysis is to re-produce mathematically the
behavior of an actual engineering system. In other words, modeling geometry is used to
create an accurate mathematical model of a physical prototype. In the broadest sense, thismodel can comprises material properties, real constants, all the nodes, elements, boundary
conditions and other features that may be used to represent the physical system.
In terminology, the term model generation usually takes on the narrower meaning
which includes generating nodes & elements that can represent the spatial volumes &
connectivity of the actual system.
In thepresentstudy, thebutt-weldjointof twoASTM 36stainless steel plates is modeled
using a commerciallyavailable finite elementsoftware. Thetwo semi-
infiniteplatesofthejointare3mm thickand100mmwide(alongthewelding direction).Theweld-
grooveangleis 60°.3Dview oftheASTM 36steel plateisshowninFigure 5.1.

7/27/2019 welding project report.pdf
http://slidepdf.com/reader/full/welding-project-reportpdf 43/61
43
Figure5.1.-3D Model of the Plate to be Welded

7/27/2019 welding project report.pdf
http://slidepdf.com/reader/full/welding-project-reportpdf 44/61
44
Figure5.2 Geometry of the Plate to be Welded
Fig.5.2 showstheGeometry of the platetobebuttwelded.Meshcontrolisappliedtothe
weldmentarea.Plates arefixedattheends andheat convectionwasallowed atthetop surface
oftwo plates.
ASTM A 36steelmaterial can beweldedby using
differentmethodslikeelectricarcwelding,resistance andinductionweldingorby
meansofradiationprocess. Fromallthesetypestheanalysisofstainlesssteelinthis project is
beingperformed bymanual metalarc welding,or also known as MMAW.
5.4 Material Properties
Thetemperaturedependantthermalmaterialproperties forthe plates,thefillerweld material and
heataffectedzone (HAZ) were assumedto be thesame,see Table 1.Forthe mechanicalmaterial
properties, samematerial models were usedforthe

7/27/2019 welding project report.pdf
http://slidepdf.com/reader/full/welding-project-reportpdf 45/61
45
weldbeadsandthebasematerialsaccordingto theyieldstrength. The plasticitymaterialmodel
usedwas vonMisses rate-independentisotropicbilinearhardening.
Table 5.1.MaterialProperties [Dragi Stamenkovic; 2009]
Specific
heat
(J/kg°C)
Yield
stress
(MPa)
Thermal
expansion
coefficient
(10-5/°C)
Young΄s
modulus
(GPa)
Temperature Conductivity DensityPoisson΄s
ratio
(°C) (W/m°C) (kgm-3)
0 480 60 7880 380 1.15 210 0.3
100 500 50 7880 340 1.2 200 0.3
200 520 45 7800 315 1.3 200 0.3
400 650 38 7760 230 1.42 170 0.3
600 750 30 7600 110 1.45 80 0.3
800 1000 25 7520 30 1.45 35 0.3
1000 1200 26 7390 25 1.45 20 0.3
1200 1400 28 7300 20 1.45 15 0.3
1400 1600 37 7250 18 1.45 10 0.3
1550 1700 37 7180 15 1.45 10 0.3
5.5 Meshing Geometry
Meshing the geometry is creation of finite element model, which consists of nodes
and elements. Fig 5.3 shows the meshed model of the plate that is to be welded. Meshing is
done through following three important steps as
a) Set element attributes.
b) Set meshing controls.
c) Generate mesh

7/27/2019 welding project report.pdf
http://slidepdf.com/reader/full/welding-project-reportpdf 46/61
46
a) Element attributes: -
Before starting generation of a mesh appropriate elements must be defined. The
Solid70 element type is being used for meshing the plate using ET command. The material
properties for analysis are appliedwith thehelp of MP command.
Figure5.3 - Meshed Model
b) Meshing controls: -
After setting the element attributes, the element density is required to be defined for
meshing the model. The element or mesh density is set by using ESIZE, ESHAPE, KESIZE
and LESIZE command.
Type of elements : Solid 45
No. of Nodes : 12393
No. of elements : 8250

7/27/2019 welding project report.pdf
http://slidepdf.com/reader/full/welding-project-reportpdf 47/61
47
c) Mesh generation: -
There are two main types of meshing as free & mapped mesh. Meshing can be made
by using AMESH, VMESH commands. But 3-D model must be meshed with only VMESH
command only. The plate is meshed by using VMESH (mapped) command. Then the solidmodel is meshed by using solid 70 element by creating the FEA model having no. of nodes
12393 and no. of elements 8250 as shown in fig.5.3 and is used for further processing then
in FEA solution the FEM model created is analysed for coupled field analysis (also termed
as coupled field analysis).After completion of simulation the results are read and tabulated
by using post-processing stage.
5.6 Boundary Conditions
The welding process simulation was carried out in three different steps. As the
welding process is time dependent the transient thermal structural coupled field analysis is
carried out by using boundary conditions as mentioned earlier [Cristian Simion, Corneliu
Manu, Saleh Baset and Julian Millard],
5.7 Solution
This is the one of the important stage in FE analysis. With the help of ANTYPEcommand the type of the solution is specified as transient. Then by using SOLVE command
program solves the analysis using numerical methods for three different stages.
5.8 Post Processing
In post processing section, the results of stress analysis were reviewed. There are two types
of post processing methods viz. /POST1 & /POST26. With /POST1 only static analysis
results can be viewed and with /POST26 mainly time dependent analysis results are seen.
/POST26 is also termed as time history post processing.

7/27/2019 welding project report.pdf
http://slidepdf.com/reader/full/welding-project-reportpdf 48/61
48
CHAPTER 6
RESULTS AND DISCUSSION
Depending upon the simulation results, shrinkage or distortion of the weldment can be
predicted. In this way, the experimental analysis, which is costly, can be avoided. The
temperature near the region of weld bead and the HAZ decreases rapidly proportional to the
distance from the centre of the heat source. The different results obtained by using FEA are
studied as follows.
6.1. Temperatureat Different Distances from Center Line of Weld with FEA.
During study of welding process, it has been found that the magnitude and distribution of
Figure 6.1. Temperature Distribution in Steel Plate after Welding at T = 100 Sec

7/27/2019 welding project report.pdf
http://slidepdf.com/reader/full/welding-project-reportpdf 49/61
49
residual stresses is strongly influenced by temperature distribution through the various
crossections of the plates and mechanical properties of material at elevated temperatures.
As the welding process progresses, both the weld metal and the base metal experience an
increase in temperature. At the solidus temperature, the material within the fusion zone
begins to liquefy. Upon cooling, a reverse process occurs and the fusion zone solidifies to
complete the joining process
A 3 D model showing the relation between temperature and distance from weld at 100
seconds after the completion of welding process is shown in fig. 6.1. The relation between
temperature and distance from weld can be predicted by getting tabular data from the graph
as shown in table no.6.1.From graph as shown in fig. 6.2, we can see that temperature of
Figure6.2 - Graphbetween Temperature and Distance from Center Line of the Weld at100 Sec
welded plate goes on decreasing drastically from weld center line from 0 to 85 mm and after
85 mm it becomes almost constant up to 100 mm. The temperature distribution as a
consequence of thermal load was employed to calculate equivalent shrinkage forces. 3D
finite element elastic structural analysis was conducted to estimate the deformations and
0
50
100
150
200
250
300
350
400
450
500
0 5 10 15 20 25 30 35 40 45 50 55 60 65 70 75 80 85 90 95 100
FEA
FEA

7/27/2019 welding project report.pdf
http://slidepdf.com/reader/full/welding-project-reportpdf 50/61
50
residual stresses.The variation in temperature profile and the distribution of thermal stresses
was simulated with different welding parameters, e.g. the number of welding layer during
the butt welding and the welding speed.[Chun-Ho Yin , Chao-Ming Hsu and Jao-Hwa
Kuang; 2013] The distributions and the peak magnitude of residual stress with different
welding parameter were also simulated.
Table no.6.1-Temp.(k)(results from FEA) v/s Distance From Weld(mm)
Sr. no.Distance From
Weld(mm)Temp.(k)(results from FEA)
1 0 450
2 5 446
3 10 446
4 15 442
5 20 441
6 25 433
7 30 421
8 35 418
9 40 415
10 45 40811 50 380
12 55 370
13 60 368
14 65 366
15 70 362
16 75 346
17 80 344
18 85 332
19 90 332
20 95 33121 100 331

7/27/2019 welding project report.pdf
http://slidepdf.com/reader/full/welding-project-reportpdf 51/61
51
6.2 Strain Calculation with FEA
Anundesirable result of the induced nonlinear thermal cycles associated with the welding
processisthedevelopmentofresidualstresses. Thefluidmaterial in the fusion zone is
Table no.6.2- strain (results from FEA) v/s Distance fromWeld (mm)
Sr. no. Distance From Weld(mm)Strain x10
-3(from
FEA)
10 67.2
2 1 46.08
3 2 43.2
4 3 40.325 4 19.2
6 5 6.72
7 6 4.8
8 8 4.8
9 10 2.88
10 15 1.92
11 20 1.92
12 25 1.728
13 30 1.53614 35 1.248
15 40 0.96
16 45 0.864
17 50 0.768
18 55 0.672
19 60 0.576
20 65 0.48
21 70 0.192
22 75 0.105623 80 0.1056
24 85 0.1056
25 90 0.0864
26 95 0.0864
27 100 0

7/27/2019 welding project report.pdf
http://slidepdf.com/reader/full/welding-project-reportpdf 52/61
52
bounded by the solid HAZ material & unaffected base metal. The solid material adjacent to
the fusion zone acts as a mechanical constraint which results in inelastic strains being
produced as the fusion zone material gets solidified. As the fusion zone gets solidified, the
grain growth progresses from the heat affected zone toward the center of the weld. The
elastic strains tend to result in tensile residual thermal stresses in the fusion zone. From the
graph as shown in fig.6.3, the values of strains at different distances from center line of the
Distance From Weld(mm)
Figure6.3 -Graph between Strain at Mid Section Perpendicular to the Weld of theASTM36 Steel Plate along its Length Direction
weld can be obtained. The value of strain for different distances from center line of the weld
is shown in table 6.2. It can be seen from the table that the value of strain goes on decreasing
0
10
20
30
40
50
60
70
80
0 2 4 6 10 20 30 40 50 60 70 80 90 100
Strain (from FEA)
Strain (from FEA)

7/27/2019 welding project report.pdf
http://slidepdf.com/reader/full/welding-project-reportpdf 53/61
as the distance from the cente
strain the value of stress gets
observed in the parts due to we
6.3 StressCalculation with F
Fig. 6.4shows the von moises
in axial direction formanualme
in welded plate of single V-butt
zone.Table no.6.3givesthevalu
weldcentre whenplatethicknes
53
r of weld gets increased. As stress is directly
varied according to the value of stress. The m
lding process is 67.3 x10⁻³
mm.
A
lot in FEASoftware. Fig.6.5 showsthe graph o
talarcwelding obtained by FEA. The highest resi
joints has been observed in the weld metal adjace
es of residualstresses distributionagainstthed
is 3 mm.Itis clearfromthe plotthatheat
Figure 6.4 - Von Mises Plots
roportional to
aximum strain
residualstress
dual stress level
nt to the fusion
stance from

7/27/2019 welding project report.pdf
http://slidepdf.com/reader/full/welding-project-reportpdf 54/61
54
affectedzone extendsupto 38mm onbothsidesoftheweldment.Itisseenthatthe residual stress in
the transverse direction for butt weldingof3mmthick platescomesoutto bemaximum
(320Mpa)in thecentre ofweldment. Simulated results are in a good agreement with
experimental results, which shows the reliability of FEA or equivalent load method. Von
mises residual stress goes on decreasing rapidly in transverse direction in areas near the weld
region. In contrast to this, welding deformation shows a smooth continuous increasing
behavior. The residual stress distribution is ununiform through the thickness of plate with
maximum value at the top surface of plate and decreases gradually to minimum at the
bottom. Every mode of deformation has greater value in case when thickness is very small.
Figure 6.5 - Graph between residual stress at mid section perpendicular to weld of the
ASTM36 steel plate along its length direction
An increase in plate thickness causes reduction of residual stresses in areas adjacent to fusion
zone. Weld induced stresses are the one which are major contributors to the overall stress
states in welded structural components. Residual stresses may be determinable to the
performance of component assemblies and can be induced, in addition to distortions failures
through stress corrosion cracking, brittle fracture and can cause to the detoriation of fatigue
life.
-300
-200
-100
0
100
200
300
400
1 1 2 3 6 6 8 8 9 9 1 0
FEA Stress
FEA Stress

7/27/2019 welding project report.pdf
http://slidepdf.com/reader/full/welding-project-reportpdf 55/61
55
Table No.6.3- Stress (in Mpa)Results from FEA V/S Distance from Weld (mm)
Sr. no. Distance From Weld(mm) FEA Stress(Mpa)
1 0 270
2 5 320
3 10 290
4 15 150
5 20 -110
6 25 -180
7 30 -220
8 35 -80
9 40 -55
10 45 -30
11 50 -10
12 55 -5
13 60 10
14 65 20
15 70 20
16 75 30
17 80 30
18 85 35
19 90 40
20 95 40
21 100 40
6.4 ComparisonoftheFEMwithExperimentalResultsforAxial ResidualStresses
The values ofaxialresidualstresses calculatedbythe finite element method are compared
withthe experimental results[M.Jeyakumar; 2011]with the help of tabular data as shown in
table no.6.4. The results from these tables are obtained from the graph as shown in figure6.6.

7/27/2019 welding project report.pdf
http://slidepdf.com/reader/full/welding-project-reportpdf 56/61
56
Table no.6.4-comparison of experimental stress v/s FEA stress
Sr. no.Distance From
Weld(mm)
Experimental
Stress(Mpa)FEA Stress
1 0 350 270
2 5 390 320
3 10 300 290
4 15 100 150
5 20 -120 -110
6 25 -200 -180
7 30 -125 -220
8 35 -100 -80
9 40 -50 -55
10 45 -25 -30
11 50 -5 -10
12 55 0 -513 60 5 10
14 65 10 20
15 70 15 20
16 75 18 30
17 80 20 30
18 85 22 35
19 90 25 40
20 95 28 40
21 100 30 40
These results are obtained by reading the results at various nodes and elements at various
distances of the plate along x axis and across y-z plane. These results show that
thecomputatedfinite element resultsarevery closeto the experimentalresults.There is a little
variation between the two results because in actual practice there are different types of heat
losses and error in manual welding process which causes ununiform distribution of heat
through welding path. The results emphasize the ability of this method to create quality
results which are in agreement with experimental data and to offer the possibility to a better
calculation of residual stress field characteristics as well as to reduce the conservatism its
components quantification according to the current integrity assessment procedures. Despite
the shortcomings in relation to the need for information related to the welding process and

7/27/2019 welding project report.pdf
http://slidepdf.com/reader/full/welding-project-reportpdf 57/61
57
Figure 6.6 -ComparisonoftheFEA ResultswithExperimentalResultsforAxial ResidualStresses
For complex material data, numerical modeling is practically the only method able to fully
characterize the residual stress field over the whole structure without imposing any
limitations related to his geometry or size. After having residual stress distributions data,
subsequent simulations of stress relief by mechanical loading or by post weld heat
treatments can be performed. Validated by experiments, FE modeling techniques can be an
effective support for integrity assessments of structures containing welds.
CHAPTER 7
-300
-200
-100
0
100
200
300
400
500
0 10 20 30 40 50 60 70 80 90 100
Experimental Stress(Mpa)
FEA Stress

7/27/2019 welding project report.pdf
http://slidepdf.com/reader/full/welding-project-reportpdf 58/61
58
CONCLUSIONS
From the present study the following major conclusions are drawn -
1) In case of experimental stress analysis it will require the prototype of the structure to be
analyzed while analysis by FEA software eliminates that and so the cost & time of product
design also gets reduced. With the help of FEA software the behavior of the structure can be
studied for any number of welds. By using different mesh densities the results can be
obtained with great accuracy. Thus FEA is one of the important tool for thermal and
structural analysis which gives results very fast. Thetime and cost required to find residual
stress in the parts due to welding process using FEA software is very less as compared to the
experimental method. Calculation of Residual stress for any complicated welding process as
well any complicated structure is possible by using finite element methods without altering
the physics of the problem.
2) Themaximum strain observed in the butt welded steel plate is found to be 67.2 x10⁻³
at the
region of weld.The maximum temperature at 100 seconds after completion of welding
process, observed in the butt welded steel plate is found to be 450 K at the region of weld
and it goes on decreasing along the length of plate. Finally the temperature at 100 seconds at
a distance of 100 mm from the center line of the weld after completion of welding process is
found to be 331 K which is the minimum temperature along the length of the butt welded
steel plate. Distribution of temperature, strain and residual stresses with respect to distancefrom weld are showed in tabulated form as well as by using graph for better understanding
of the welding process. The maximum residual stress observed in the butt welded steel plate
is found to be 320 Mpa at a distance of 5mm from the center line of the weld.
References

7/27/2019 welding project report.pdf
http://slidepdf.com/reader/full/welding-project-reportpdf 59/61
59
1. Adak, M. & N. R. Mandal. 2010. Numerical and experimental study of mitigation of welding
distortion. Applied Mathematical Modelling 34(1): 146-158.
2. Alexander, R., E. Bohnart, and R. Witcraft. Welding, The Fundamentals of Welding,
Cutting, Brazing, Soldering, and Surfacing of Metals. John Deere Publishing. 2000.
3. Althouse, A., K. Bowditch, W. Bowditch, and C. Turnquist. Modern Welding. The
Goodheart-Wilcox, Company, Inc. 1988.
4. American Welding Society: The AWS Certified Welder Program (Brochure).
5. Anderson, W., T. Hoerner, and V. J. Morford. Metals and Welding. Hobar Publications.
1988. AWS QC7-93. Standard for AWS Certified Welders. American Welding Society.
1993.
6. Andrea Capriccioli, Paolo Frosi,” Multipurpose Ansys Fe Procedure For Welding Processes
Simulation”, Fusion Engineering And Design Xxx (2009) Xxx–Xxx
7. Bai-Qiao Chen,2011, Prediction of Heating Induced Temperature Fields and Distortions in
Steel Plates, M.E. thesis, department of Naval Architecture and Marine Engineering,Institu
Super Techno, December 2011
8. Biswas, P., Mandal, N.R. & Sha, O.P. 2007. Three dimensional finite element prediction of
transient thermal history and residual deformation due to line heating. Journal of Engineering
for the Maritime Environment, Part M 221(1): 17-30.
9. Chen, B.Q., Adak, M., & Guedes Soares, C. 2011. Effects of Weld Parameters on the
Temperature-time History in Steel Plates. Maritime Technology and Engineering [In Press],
C. Guedes Soares et al.,(Eds), London, UK: Taylor & Francis Group.
10. Chen, T.Y. & Chen, B.Z. 1991. Ship Structural Mechanics. China: Shanghai Jiaotong
University Press. Chapter 7, 8, 9: 134-238.
11. Chun-Ho Yin, Chao-Ming Hsu, and Jao-Hwa Kuang, The temperature and Residual Stress
Distributions of Butt Weld Pass on Nickel Alloy 690 Plate, Advanced Materials Research
Vols. 690-693 (2013) pp 2651-2654 , (2013) Trans Tech Publications, Switzerland
,doi:10.4028/www.scientific.net/AMR.690-693.2651
12. Clausen, H.B. 2000. Plate Forming by Line Heating. PhD Thesis. Department of Naval
Architecture and Offshore Engineering, Technical University of Denmark, April, 2000.ISBN 87-89502-29-9.
13. Cristian Simion, Corneliu Manu, Saleh Baset, Julian Millard,” Distortions Generated By
Welding Process Using Ansys-Fea”
14. Deng,D., Murakawa,H.: Numerical Simulation of Temperature Field And Residual Stresses
In Multi-Pass Welds In Stainless Steel Pipe And Comparison With Experimental
7/27/2019 welding project report.pdf
http://slidepdf.com/reader/full/welding-project-reportpdf 60/61
60
Measurements, Comput. Mater. Sci., 2006, 37:269-277.
15. Dragi Stamenković, Msc (Eng), Finite Element Analysis Of Residual Stress In Butt Welding
Two Similar Plates, Udk: 519.673:621.791.5 Cosati: 12-01, 20-12, 13-05
16. Friedman, E. 1975. Thermomechanical analysis of the welding process using the finite
element method. Trans. A.S.M.E. J. Pressure Vessel Tech 973(3): 206-213.
17. Gery, D., Long, H. & Maropoulos, P. 2005. Effects of welding speed, energy input and heat
source distribution on temperature variations in butt joint welding. J. Materials Processing
Technology 167: 393-401.
18. Goldak, J.A., Chakravarti, A. & Bibby, M.J. 1984. A New Finite Element Model for
Welding Heat Sources. Metallurgical Transactions B 15B: 229-305
19. Gurinder Singh Brar, Finite Element Simulation of Residual Stresses in Butt Welding of
Two AISI 304 Stainless Steel Plates, International Journal on Theoretical and Applied
Research in Mechanical Engineering (IJTARME) , ISSN : 2319 – 3182, Volume-2, Issue-1,
2013, pp75-79
20. Harwig, D., Longenecker, D. & Cruz, J. 1999. Effects of Welding Parameters and Electrode
Atmospheric Exposure on the Diffusible Hydrogen Content of Gas Shielded Flux Cored Arc
Welds. Welding Research Supplement 78(9): 314-321.
21. Heinze, C., Schwenk, C. & Rethmeier, M. 2011. Influences of Mesh Density and
Transformation Behavior on the Result Quality of Numerical Calculation of Welding
Induced Distortion. Simulation Modeling Practice and Theory 19(9): 1847–1859.
22. Jeffus, Larry. Welding: Principles and Applications. 4th Edition. Delmar 1999.
23. Jonsson,M., Karlsson,L., Lindgren,L.E. Deformations And Stresses In Butt-Welding Of
Large Plates With Special Reference To The Mechanical Material Properties, J. of Eng.
Mat. And Tech., 1985, Vol.107, Pp.256-270.
24. M Sundar1, G Nandi, A Bandyopadhyay And S C Roy “Assessment Of Residual Stress And
Distortion In Welding By Finite Element Method”, Proceedings Of The International
Conference On Mechanical Engineering 2005 (Icme2005) 28- 30 December 2005, Dhaka,
Bangladesh
25. M.Jeyakumar, Residual Stress Evaluation In Butt-Welded Steel Plates,Indian Journal Of Engineering &Material Sciences,Vol.18,December 2011,Pp.425-434
26. Mahapatra, M.M., Datta, G.L., Pradhan, B., & Mandal, N.R. 2007. Modelling the Effects of
Constraints and Single Axis Welding Process Parameters on Angular Distortions in One-
Sided Fillet Welds. Proc. IMechE, Part B: J. Engineering Manufacture 221(3): 397–407.

7/27/2019 welding project report.pdf
http://slidepdf.com/reader/full/welding-project-reportpdf 61/61
27. Matthews, J. & Sellon, W. Arc Welding: A Basic Manual of Instruction for Learning How to
Use Arc Welding. The James F. Lincoln Arc Welding Foundation. Cleveland, OH.
28. Michaleris, P. & DeBiccari, A. 1997. Prediction of Welding Distortion. Welding Res. Suppl
76: 172-181.
29. Michaleris, P. & Sun, X. 1997. Finite Element Analysis of Thermal Tensioning TechniquesMitigating Weld Buckling Distortion. Welding Journal, 76(11): 451–457.
30. Mollicone, P., Camilleri, D., Gray, T.G.F. & Comlekci, T. 2006. Simple Thermo-Elastic–
Plastic Models for Welding Distortion Simulation. Journal of Materials Processing
Technology 176: 77–86.
31. Murakawa, H., Serizawa, H. & Shibahara, M. 2005. Prediction of Welding Hot Cracking
Using Temperature Dependent Interface Element – Modelling Of Interfaces. Math. Model.
Weld Phen. 7: 539–554.
32. P.M.Gedkar and Dr. D.V. Bhope,” Finite Element Analysis of Pipe T-Joint”, P.M.Gedkar etal. / International Journal of Engineering Science and Technology (IJEST), Vol. 4 No.01
January 2012
33. Pornwasa WONGPANYA, Welding Residual Stresses in Two Competing Single V-Butt
Joints, Journal of Metals, Materials and Minerals, Vol.19 No.1 pp.67-75, 2009.
34. Properties of ASTM 36 Mild/Low Carbon, Steel, from website.
35. Rosenthal, D. 1946. The Theory of Moving Sources of Heat and Its Application to Metal
Treatments. Trans. A.S.M.E 68: 849-866.
36. S. Sarkani, V. Tritchkov, and G. Michaelov, ―An efficient approach for computing residual
stresses in welded joints, Finite Elements in Analysis and Design, vol. 35, pp. 247-268,
2000.
37. Taylor, G., Hughes, M., Strusevich, N. & Pericleous, K. 1999. Finite Volume Methods
Applied to the Computational Modeling of Welding Phenomena. Second International
Conference on CFD in the Minerals and Process Industries, Melbourne, Australia 1-6.
38. Tsai, C.L. & Jung, G.H. 2004. Plasticity-Based Distortion Analysis for Fillet Welded Thin-
Plate T-joints. Weld. J. 83(6): 177–187.
39. Viorel Deaconu, Finite Element Modelling of Residual Stress - A Powerful Tool in the Aidof Structural Integrity Assessment of Welded Structures, 5th Int. Conference Structural
Integrity of Welded Structures (ISCS2007), Timisora, Romania, 20-21 Nov 2007