well-bore bottom stress concentration and induced core...
TRANSCRIPT
ABSTRACT
The orientation, spacing, and shape of drilling-induced disking, petal, and petal-centerline frac-tures in core commonly are remarkably uniform.These fractures result from concentrations of in-situ stress by the well-bore bottom-hole cavity, andin oriented core their strikes commonly have beenused as indicators of the horizontal principal stressdirections; however, an understanding of howthese varied fractures are produced has been limit-ed by the lack of detailed knowledge of the distri-bution of stresses near the bottom hole. In thispaper, we present our result of studying thesestress concentrations using full three-dimensionalfinite-element modeling for a variety of applied far-field in-situ stress conditions and as a function ofcore stub length. In nearly all cases, purely tension-al concentrated stresses are generated within thecore by the compressive in-situ stresses. The direc-tions and magnitudes of these tensions vary withthe applied stress, indicating the morphology ofmany of the observed drilling-induced core frac-tures. Cupped-shape disking fractures result from astate of uniform horizontal (biaxial) stress; thesefractures also initiate within the rock at the root ofthe core stub. As the horizontal stresses becomemore anisotropic, the point of fracture initiationshifts to the surface of the core, and saddle-shapedcore disks are possible. Such fractures strike in thedirection of the most compressive in-situ horizontalprincipal stress. Increasing the magnitude of theoverburden stress eventually results in petal and
petal-centerline fractures. Centerline fracturingcan be produced by high overburden stress with ashort core stub. The length of the core stub hassubstantial inf luence on the magnitudes of theconcentrated stresses. The greatest tensile stressinitially increases rapidly with core stub length,but reaches a plateau for lengths greater thanapproximately 40% of core diameter, placing max-imum bounds on the spacing between successivefractures along a core. Although more work isrequired to accurately predict the shape ofdrilling-induced fractures, the present results indi-cate that the morphology of the fracture alonecontains substantial information on the in-situstress state existing in the rock mass prior to thedrilling of the well bore.
INTRODUCTION
Drilling into the earth results in a redistribution,or concentration, of stress in the vicinity of thewell bore. These concentrated stresses affect drill-bit penetration, create well-bore wall breakouts,produce inadvertent hydraulic fractures, and dam-age cores. Elegant solutions for the stresses concen-trated near a well bore with circular cross sectionare well known (Kirsch, 1898; Hiramatsu and Oka,1962) and have been crucial in predicting the initia-tion of hydraulic fractures (e.g., Hubbert and Willis,1957) and breakouts (e.g., Gough and Bell, 1981);however, near the bottom hole, which obviouslypasses each point in the final well bore duringdrilling, allowing the bottom-hole stress concentra-tions the first opportunity to influence the rock,these solutions do not apply. Most particularly, thebottom-hole stress concentrations produce drilling-induced core fractures that are thought to containsubstantial information about the state of in-situstress. Because any information on the state of in-situ stress states that can be gleaned from core orwell logs is useful in production development, it isimportant that the bottom-hole stress concentra-tions be well understood to aid in interpretingobserved core fractures.
1909
©Copyright 1997. The American Association of Petroleum Geologists. Allrights reserved.
1Manuscript received April 1, 1996; revised manuscript receivedDecember 2, 1996; final acceptance June 19, 1997.
2Institute of Geophysics, Meteorology, and Space Physics, Department ofPhysics, University of Alberta, Edmonton, Alberta, Canada; e-mail:[email protected], [email protected]
This work is supported in part by NSERC Lithoprobe Supporting ScienceGrant, NSERC, and the Alberta Oil Sand Technology and ResearchAuthority. D. Schmitt acknowledges the assistance of the A. V. Humboldtfoundation during revisions of this paper. Constructive reviews andcomments of B. R. Kulander, J. C. Lorenz, and S. L. Dean were greatlyappreciated. This paper is Lithoprobe submission number 882.
Well-Bore Bottom Stress Concentration and Induced Core Fractures1
Yongyi Li and Douglas R. Schmitt2
AAPG Bulletin, V. 81, No. 11 (November 1997), P. 1909–1925.

Visible drilling-induced core fractures take avariety of shapes, commonly known as disking,petal, and petal-centerline fractures (Kulander etal., 1979, 1990) (Figure 1). The creation of thesefractures is attributed to the concentration of thein-situ stress by the well-bore cavity (Figure 2).Along a core these fractures commonly are of uni-form shape and spacing, and they have long beenconsidered to be indicators of both far-field in-situ stress magnitudes and directions. There havebeen many attempts to provide quantitative rela-tionships between the geometry of these frac-tures and the magnitudes of in-situ stresses in thepast few decades (Jaeger and Cook, 1963;Leeman, 1964; Durelli et al., 1965; Obert andStephenson, 1965; Sugawara et al . , 1978;GangaRao et al., 1979; Stacey, 1982; Miguez et al.,1987; Maury et al., 1988; Borm et al., 1989; Dyke,1989; Perreau, 1989; Haimson and Lee, 1995;Röckel, 1996). Success, however, has mostly beenlimited to obtaining in-situ stress orientationsusing oriented core (Friedman, 1969; Kulander etal., 1979, 1990; Lenhoff et al., 1982; Nelson et al.,1987; Paillet and Kim, 1987; Plumb and Cox,1987; Laubach and Monson, 1988; Lorenz and
Finley, 1988; Lorenz et al., 1990; Natau and et al.,1990; Wang and Sun, 1990; Kutter, 1991; Engelder,1993; Bankwitz and Bankwitz, 1995) based on theempirical observation that the core fractures strikein the direction of the greatest horizontal principalcompression. Problems basic to the localization ofincipient failure, the failure mechanism, the quanti-tative relationship between the state of stress androck physical properties, the geometry of well-borebottom, and the geometry of these fractures remainunsolved because the stress concentrations in thevicinity of the well bore have not been obtained.Determining the far-field in-situ stress magnitudes(i.e., magnitudes existing in the earth prior todrilling the well bore and remaining outside thezone of stress concentration at the bottom hole)from the geometry of the induced core fractures isnot yet practical.
Part of the reason for this state of affairs is thatderiving a set of formulas for the complete three-dimensional (3-D) stress concentrations is difficulteven for the seemingly simple geometry at the bot-tom hole and has not been carried out. The earlierexpressions (e.g., Kirsch, 1898) are able to exploitgeometric symmetries to produce relatively simpleexpressions for the stress concentrations along acircular well bore. This is not possible once thebottom hole is included. As a result, aside fromJaeger and Cook’s (1963) analysis of core disking,which employed the expressions of Tranter andCraggs (1945), workers have mostly employednumerical calculations to estimate stress concentra-tions (Chang, 1978; Sugawara et al., 1978; Lorenzand Finley, 1988; Dyke, 1989). The results of thesestudies suggest that failure generally initiates in ten-sion at the root or the side of the core; however,these earlier studies did not provide indications ofthe orientations of the concentrated stress withinthe core. The orientations are crucial to under-standing the interactions between the far-field in-situ stresses, the drill-bit weight, and the well-boref luid pressure. Furthermore, a systematic studyconsidering in detail the evolution of the stressconcentration with core stub length has not beenpublished.
Our study builds on the earlier numerical resultswith a systematic 3-D finite-element modeling ofthe stress concentrations produced by the princi-pal components of the far-field in-situ stresses, thedrill-bit weight, and the well-bore fluid pressure.These applied forces hereafter are referred to as theprimary stress conditions; more complex states ofstress are obtained by superposing the primaryresults. In order that the results will be of use toother workers, the calculated stress concentrationsare first described in some detail. A nearly continu-ous measure of the changes in stress concentrationwith core length is also provided for the different
1910 Well-Bore Fractures
uphole
(a)
(b)
diameter = 2.3 in (5.8 cm)
diameter = 3.5 in (8.9 cm)
uphole
Figure 1—(a) Core disk fractures in a massive sulfidecore of 2.3 in (5.8 cm) diameter, and (b) petal fracturesin a granite core of 3.5 in (8.9 cm) diameter.

primary stress conditions. The implications of thecalculations are discussed, especially with regard tothe creation of core petal, petal-centerline, anddisking fractures.
NUMERICAL CALCULATION
In our study, the finite-element method isemployed in the calculations because it can deter-mine stress states for the asymmetric bottom-holegeometry. Four primary stress conditions are con-sidered: (1) the greatest compressive horizontalprincipal stress SH directed along the x direction atthe azimuth of Φ = 0°; (2) the vertical principallithostatic stress (overburden) Sv directed parallelto the well-bore axis; (3) the drill-string weight Sbvertically applied uniformly at the bottom of thekerf (i.e., the cut of the core bit); and (4) the well-bore fluid pressure Sp applied perpendicularly to allthe free surfaces of the well bore. Note that inthese calculations the principal tectonic stressesare orthogonal to the vertical well bore, with theremaining and least compressive horizontal princi-pal stress Sh directed in the y direction along anazimuth of Φ= 90° (Figure 2). The stress concentra-tions produced by Sh can be obtained by an appro-priate rotation of the solutions for SH, and individu-al calculations are not necessary.
The modeled core bit has a 100 mm internaldiameter and 140 mm outside diameter with a flatkerf bottom. Because the well-bore axis is vertical,symmetry considerations allow the calculationsover only one quadrant of the well bore, allowinguse of more and smaller elements in the near vicini-ty of the well-bore cavity where the stress concen-trations are most rapidly changing. This quadranthas dimensions of 100 × 100 × 150 cm in the x, y,and z directions, respectively, and contains 4220elements and 5432 nodes. The bottom of the verti-cal borehole is in the center of the model, 75 cmbelow the top surface. The external boundaries arewell removed from this point, so boundary effectsare ignored. Displacements on the surfaces at Φ =0°, at Φ = 90°, and at the base of the model are con-strained in the normal direction as expected fromthe model symmetry.
Details of the finite-element mesh are shown inFigure 2. The finite-element package ANSYS™ wasused in the modeling. We refer frequently to theinner and outer corners of the kerf; these are sim-ply the corners of the cut adjacent to the core stub(which remains completely attached to the rockmass) and the well-bore wall, respectively. The sizeof the elements is kept as small as possible close tothe corners of the kerf, where the greatest stressconcentrations appear. Higher resolutions areobtained by using 20-node elements near the kerf
inner corner. The coring process is modeled byadding new layers of elements to the top of theexisting core stub in each successive calculation.This procedure has the advantage that the ele-ments at the well-bore bottom remain the same inall the calculations, and guarantees that the resolu-tion of the modeling is not affected by the use ofdifferent elements. In total, 12 calculations werecarried out for each primary stress case to simu-
Li and Schmitt 1911
•
•
••
•••
•••
•••
•
•
••••
•
•
•
• ••
••
••
•
••
••
•• •
•
••
••
(b)
SH
Sh
x (Φ = 0 )o
y(Φ
= 9
0 )
o
••• • •• •• ••
(a)
x
Sv
SH
0
kerf
core stubSp
Sb
z
d/2
l
Figure 2—Mesh of finite-element model: (a) side viewand (b) top view. The stresses applied are the greatesthorizontal stress, SH; the least horizontal stress, Sh; theoverburden, Sv; well-bore fluid pressure, Sp; and weightof drill bit, Sb.

late the coring process, with the core stub length lincreasing from zero to the core diameter d (Figure2); the stress concentrations did not substantiallychange for larger core stub lengths. Smaller incre-ments of core length were employed for short corestubs where the stress concentrations most rapidlyevolved.
The rock medium is assumed to have a Young’smodulus of 20 GPa and a Poisson’s ratio of 0.25. Avalue of 20 MPa (2900 psi) was chosen for the mag-nitude of the primary applied stresses. This value istypical of the lithostatic vertical stress at depthsnear 1000 m in sedimentary basins. The geometry,applied stresses, and Young’s modulus could all bepresented more generally in dimensionless form,but the scales chosen are typical of those encoun-tered in practical situations.
Because the medium is linearly elastic andisotropic, the stress concentrations produced by amore complex state of in-situ stress are obtained byscaling and superposing stress concentrations areobtained for the primary conditions. This processis done to provide further insight into the patterns
of stress concentration for biaxial horizontal far-field stress (SH = Sh), for hydrostatic far-field stress(SH = Sh = Sv), and for a more complex case (SH = Sv= Sp = Sb, Sh = 0).
Illustration of the complete tensor informationfor the multitude of 3-D calculations (84 in all) isimpractical; consequently, only a limited numberof our calculations are presented in graphicalform. The results are reported in terms of the mag-nitudes and directions of the principal concentrat-ed stresses in vertical planes at Φ = 0° and 90°.Comparison of the tensional and shear stress mag-nitudes suggests that the former is most responsi-ble for core fracturing (Dyke, 1989; Haimson andLee, 1995), and only the most tensile principalstress is contoured. The magnitude of the otherprincipal stress and the maximum shear stress (σ1 – σ3)/2 (hereafter referred to as shear stress)may be inferred from the corresponding plots ofthe principal concentrated stress orientations.Tensional stress contours and principal stress ori-entations are shown only for core lengths of 0.0,1.0, 2.5, and 5.0 cm.
1912 Well-Bore Fractures
Table 1. Summary of Well-Bore Bottom Stress Concentrations Under Primary Stress Conditions
Greatest Tensional Stresses Greatest Shear Stresses
Applied Stress Magnitude Magnitude FractureCondition Location & Direction Location & Direction Produced
Horizonal Φ = 0° Core 9 MPa Φ = 0° 35.5 MPa Saddle-shaped diskinguniaxial, side (1305 psi), Inner corner (5147 psi), originating at innerSH = 20 MPa 110° 125° kerf corner at(2900 psi) Φ = 90° Inner 25 MPa Φ = 90° 31 MPa Φ = 90°
corner (3625 psi), Outer corner (4495 psi),135° 75°
Overburden, Inner corner 41 MPa Inner corner 15.5 MPa Petal fracturing Sv = 20 MPa (5945 psi), (2247 psi) originating from(2900 psi) 135° inner kerf corner;
Outer corner 18.5 MPa centerline fracture (2682 psi), possible for short 20° core stub
Weight on Inner corner 11.5 MPa Outer corner 6 MPa Tensional failure at drill bit, (1667 psi), (870 psi), inner corner aidsSb = 20 MPa 140° 18° fracture initiation,(2900 psi) Outer corner 16 MPa but not propagation
(2320 psi), 35°
Fluid pressure, Inner corner 11.5 MPa Inner corner 14 MPa Tensional failure atSp = 20 MPa (1667 psi), (2030 psi), inner corner may(2900 psi) 110° 20° aid fracture
initiation,Outer corner 60 MPa but not propagation
(8700 psi), into core50°

RESULTS AND OBSERVATIONS
Primary Stress Conditions
As described, stress concentrations were indi-vidually calculated for the four separate appliedprimary stress conditions. In this section, fea-tures of the resulting concentrated stress fieldsare noted, but their implications are discussed inthe following sections. The concentrated stressmagnitudes and their orientations and type ofcore fracture expected are summarized in Table1. Stress directions are reported by their anglefrom core axis (z direction). The orientationsgiven for the maximum shear stresses are thosefor the corresponding minimum or maximumprincipal compressive stress oriented at 45° dif-ference to the maximum shear stress (σ1 – σ3)/2.The stress sign convention used in rock mechan-ics is applied here, with compression positiveand tension negative.
Uniaxial Horizontal StressSH = 20 MPa, Sh = Sv = Sp = Sb = 0
Contours of the least compressive stress σ3 at Φ = 0° and 90° are shown in Figure 3. The largestpositive and negative stress magnitudes are foundat these azimuths, and fractures are most likely to
originate from points within the vertical planes sooriented. The less extreme stress concentrations atother azimuths therefore are not shown.
At Φ = 0°, a small tensional concentration of5–15% of SH appears inside the core. A large ten-sional stress zone with stress magnitudes nearlythat of SH appears on the well-bore wall a distanceapproximately one core diameter above the well-bore bottom (Figure 3). This stress concentrationagrees with the well-known plane-strain solution ofKirsch (1898) (see Timoshenko and Goodier, 1970)for a hole in an infinite plate. Two other tensionalzones are on the sides of the core, and these growwith core stub length. The top of the core is alsounder weak tension.
At Φ = 90°, the well-bore wall stresses removedfrom the well-bore bottom agree with Kirsch’s(1898) plane-strain solution. Tension exists at theinner corners of the kerf (Figure 3). These ten-sional zones extend toward the core root, withthe core stub lengthening. The magnitude of thistensile stress is only 10% of SH when there is nocore stub, but rapidly increases to 125% of SH atcore length of 4 cm.
Corresponding stress orientations for the corelengths of 0, 1.0, and 2.5 cm are given in Figure 4.Here, the principal stress orientations are given bythe directions, and the magnitudes are representedby the proportional length of the lines. Thin solid
Li and Schmitt 1913
Figure 3__Contours (MPa)of the least compressiveprincipal stress σ3 at Φ = 0° and 90° under horizon-tal uniaxial stress SH = 20MPa for core stub lengthsof (a) 0 cm, (b) 1 cm, (c) 2.5 cm, and (d) 5.0 cm.

lines represent compression, and thick solid linesrepresent tension. In Figure 4, compression domi-nates at Φ = 0°. These compressive stresses aremainly horizontal, but deviate at the corners of thekerf, where the greatest compressive stresses arelocated. Weak tensions at the core side and top aredirected parallel to the surface. The greatest shearstresses at this azimuth are also at the corners ofthe kerf; they increase from about 75 to 175% themagnitude of the applied far-field SH with corelength. In contrast, at Φ = 90°, the stress regime ispredominantly tensional (Figure 4). The tensilestresses deviate toward the inner corners of thekerf, where they reach a maximum of 120% of SH.
The existence of a core stub strongly influencesthe state of stress at the well-bore bottom. Initially,
at Φ = 0° the dominant stresses on the well-boresurface are horizontal and compressive (Figure 4).These stresses increase when the core stub forms.At Φ = 90°, the surface stresses are horizontal andtensional. When no core stub exists, tensionincreases toward the well-bore wall. The tensionalstresses increase substantially as the core stubgrows, especially near the kerf.
OverburdenSv = 20 MPa, SH = Sh = Sp = Sb = 0
For this primary applied stress condition, a largeconcentrated tension with a magnitude 60% of Svexists before the core stub at the bottom of thewell bore (Figure 5). This tension migrates to theinner corner of the kerf, and its peak magnitudeincreases to 200% of Sv. The greatest shear stress islocated at the outer corner of the kerf; this stressremains relatively constant at 125% of Sv , regardlessof the core length.
The orientations of the tensile stresses at and inthe vicinity of the inner kerf corner are similar
1914 Well-Bore Fractures
40 MPa
Φ = 0 Φ = 90o o
(a)
(b)
(c)
Figure 4__Orientations of principal stresses at Φ = 0° and90° under horizontal uniaxial stress SH = 20 MPa for corestub lengths of (a) 0 cm, (b) 1 cm, and (c) 2.5 cm. Thinsolid lines represent compression, and thick solid linesrepresent tension.
Figure 5__Contours (MPa) of σ3 under overburden Sv = 20MPa for core stub lengths of (a) 0 cm, (b) 1 cm, (c) 2.5cm, and (d) 5.0 cm.

(Figure 6) to those of the uniaxial case at Φ = 90°,but the magnitudes are greater. High compressivestresses are at the outer corner of the kerf, buttheir magnitudes and orientations remain nearlyconstant.
The concentrated stresses at the well-bore bot-tom are essentially horizontal and tensional (Figure6). When no core stub exists, the magnitudes ofthese tensile stresses are almost uniform until verynear the well-bore wall. The greatest tensionalstress exists at the inner corner when the core stubis produced.
Weight on Drill BitSb = 20 MPa, SH = Sh = Sv = Sp = 0
A uniform compressive traction of 20 MPa isapplied only over the area of the base of the kerf tosimulate the weight of the drill bit. This producescompression immediately beneath the drill bit andtension at the inner and outer corners of the kerf(Figures 7, 8). The magnitude of the tensile stress atthe inner corner increases to 12 MPa as the corelength grows to 4 cm, and remains almost constantfor longer lengths. A tensile stress of 24 MPa existsat the outer kerf corner. This stress is also nearlyindependent of core length. The tensile stresses atthe inner kerf corner are oriented in a direction
similar to those observed in the previous two cases(uniaxial case at Φ = 90°). Tensile stresses existonly in a small area near the kerf corners. Littlestress concentration is produced within the corestub, indicating that the weight of the drill bit doesnot significantly influence material in the body ofthe core.
Well-Bore Fluid PressureSp = 20 MPa, SH = Sh = Sv = Sb = 0
A uniform well-bore pressure of 20 MPa wasapplied to model the effect of f luid pressure onstress concentrations. The contours of σ3 areshown in Figure 9. A tensional stress of 20 MPa isproduced on the well-bore wall approximately onecore diameter above the well-bore bottom. This ispredicted from Lamé’s solution for a hole in an infi-nite plane under an internal pressure (seeTimoshenko and Goodier, 1970). In addition, ten-sion appears near the outer corners of the kerf,where a very large tensile stress with a magnitude
Li and Schmitt 1915
40 MPa
(a)
(c)
(b)
(d)
Figure 7__Contours (MPa) of σ3 under drill-bit weight Sb= 20 MPa for core stub lengths of (a) 0 cm, (b) 1 cm, (c)2.5 cm, and (d) 5.0 cm.
Figure 6—Orientations of principal stresses underoverburden Sv = 20 MPa for core stub lengths of (a) 0 cm, (b) 1 cm, (c) 2.5 cm, and (d) 5.0 cm. Thin solidlines represent compression, and thick solid lines rep-resent tension.

300% of Sp and independent of core length results.Compression dominates inside the core, but thesestresses decrease from the top toward the root ofthe core.
High tensile stresses at the outer kerf corner areoriented about 45° from the horizontal (Figure 10).Small tensile stresses at the bottom of the kerf arehorizontally directed. The orientations of the ten-sile stresses at the inner kerf corner are again simi-lar to the previous three cases (uniaxial case at Φ =90°). The orientations of compressive principalstresses indicate that the upper part of the core isalmost in a state of hydrostatic compression.
From the fluid pressure, all stresses oriented nor-mal to the cutting surface are compressive (Figure10). When no core stub yet exists, the horizontalstresses at the bottom change from compression totension from the borehole axis to its outer wall.Once the core stub is produced, tension isobserved at the base of the kerf.
In practice, during coring an additional 8-m-longcolumn of rock may rest on the top of the core stubwithin the core barrel. The additional stressesadded to the top of the core stub by this columnare quite small in comparison to the primary stressconditions described. For example, an 8 m columnof dense limestone, with density of approximately2.6 g/cm3, results in an additional vertical load of
only 0.21 MPa (30.4 psi) and, as a result, is ignoredfor the present.
Combined Stress Conditions
The stress concentrations resulting from each ofthe primary stress conditions are instructive whenconsidered in isolation; however, such stress con-ditions are rarely, if ever, encountered in real situa-tions. To explore more realistic conditions, the pri-mary stress concentrations may be appropriatelyscaled relative to each other and superposed bysimply adding the corresponding stress compo-nents at the nodal points. New principal stressmagnitudes and orientations are then easily deter-mined using standard methods (see Timoshenkoand Goodier, 1970). Three illustrative examples of(1) a horizontal biaxial stress condition (SH = Sh),(2) a hydrostatic stress condition (SH = Sh = Sv),and (3) a combination of primary tractions (SH = Sv= Sp = Sb, Sh = 0) are presented in the following
1916 Well-Bore Fractures
40 MPa
(a)
(c)
(b)
(d)
Figure 8—Orientations of principal stresses underdrill-bit weight Sb = 20 MPa for core stub lengths of (a)0 cm, (b) 1 cm, (c) 2.5 cm, and (d) 5.0 cm. Thin solidlines represent compression, and thick solid lines rep-resent tension.
Figure 9—Contours (MPa) of σ3 under well-bore fluidpressure Sp = 20 MPa for core stub lengths of (a) 0 cm,(b) 1 cm, (c) 2.5 cm, and (d) 5.0 cm.

sections. The first two cases are symmetric withrespect to the borehole axis. The last case repre-sents a highly anisotropic stress condition becauseSh = 0. Important observations on peak stress loca-tions for these cases are compiled in Table 2.
Horizontal Biaxial StressSH = Sh = 20 MPa, Sv = Sp = Sb = 0
This stress condition is the same as if a uniformhorizontal radial stress were applied to the modelboundary. Figure 11 shows the contours of σ3 fora variety of core lengths. Two tensional zonesappear with increasing core length. The mostprominent zone is at the root, and the other zoneis directed circumferentially around the core. Thetensile stresses at the root increase initially, butthen decline once the core is longer than 2.5 cm.The tensile stresses on the core side increase untila core length of 7 cm is reached. High shear stress-es are located at both the inner and outer cornersof the kerf. At the inner kerf corner, the shearstresses increase when the core length is less than2 cm, and essentially remain constant at 28.2 MPapast this point.
The tensile principal stresses are oriented nearlyvertical (Figure 12). High compression at and belowthe kerf is aligned almost horizontally, but deviates
close to the kerf corners. The stresses within thecutting surface are horizontally compressive.
Hydrostatic Stress ConditionSH = Sh = Sv = 20 MPa, Sp = Sb = 0
A hydrostatic stress condition is formed bysuperposing the overburden and the biaxial stresscases. Contours of σ3 and the orientations of princi-pal stresses are given in Figures 13 and 14, respec-tively. High tension appears circumferentiallyaround the core once a core stub is formed. Thegreatest tensile stress in this region increases to 12MPa with core lengths to 7 cm. The tensional zonealso expands in volume. Relatively high tension isobserved at the very top of the core, but compres-sion is seen toward the root. A nearly tension-freezone is initially located at the well-bore bottom.This zone persists and expands at the root of shortcore stubs (<2.5 cm). The zone diminishes andmoves upward with longer core (5 cm).
The orientations of maximum principal stress σ3for both the biaxial and hydrostatic cases are simi-lar. The most tensional stresses are on the surfaceof the core. The most compressive stresses con-verge at the outer kerf corner. On the cutting sur-face, horizontal compressive stresses dominate.
Effect of Bit Weight and Well-Bore FluidPressure
We consider an example that superposes bothfluid pressure and drill-bit weight with the overbur-den and uniaxial stress. The applied confiningstresses are SH = Sv = Sb = Sp = 20 MPa and Sh = 0.The applied stress normal to the cutting surface isdoubled due to the superposition of both Sb and Sp.
The orientations with magnitudes are shown inFigure 15. At Φ = 90°, high tension exists belowthe cut. The greatest tension, originally located atthe outer corners, migrates to the inner cornerswhen a core stub is formed. The greatest tensilestress at the inner corner reaches a (realisticallyunattainable) maximum of 80.5 MPa at a corelength of 3.0 cm. This magnitude is twice as largeas the magnitude of the tensile stresses on the well-bore wall at Φ = 0°. Compressive stresses dominateat Φ = 0°, and the greatest shear stress at the outerkerf corner has a magnitude of 22 MPa.
DISCUSSION
In the previous sections, the stress concentra-tions for four primary and three illustrative com-bined stress conditions are described. High stressconcentrations appear near the well-bore bottomin nearly all the cases. A drilling-induced fracture is
Li and Schmitt 1917
40 MPa
(a)
(c)
(b)
(d)
Figure 10__Orientations of principal stresses under well-bore fluid pressure Sp = 20 MPa for core stub lengths of(a) 0 cm, (b) 1 cm, (c) 2.5 cm, and (d) 5.0 cm. Thin solidlines represent compression, and thick solid lines rep-resent tension.

expected if this tensional stress exceeds thestrength of the rock. In the following section, pos-sible failure modes are discussed in light of the cal-culated stress concentrations. Modes of failurefavored by the primary stress cases are discussedfirst to evaluate the effectiveness of each stress con-dition in favoring certain kinds of fracture. Variouscriterions for fracture could be employed, but forthe preliminary analysis here we take the simplestand assume that mode I (tensile) fractures open inthe direction of the greatest tension and propagateperpendicular to it.
Primary Stress Conditions
For the uniaxial stress case (Figures 3, 4), twoimportant points arise with respect to failure of therock at the well-bore bottom. First, although themagnitudes of the greatest tensile stress at Φ = 90°(5–125% of SH) are less than that of the greatestshear stresses at Φ = 0° (75–175% of SH), tensilefailure is more likely because the tensile strength ofrock is generally small relative to the compressivestrength. As a result, tensional failure is expected toinitiate at the inner corners at Φ = 90°. Second, ini-tially the fracture would propagate downward at anangle of 0–40° from the horizontal away from theinner kerf corners (normal to the direction of themaximum tensile stress) toward the root of the
core. The tensile stress orientations at the bottomof the well bore at Φ = 0° in Figure 4 suggest thatthe continued propagation is subhorizontal. This isconsistent with saddle-shaped core disking.
In the case with only overburden, Sv, the orienta-tions of the tensile stresses at and in the vicinity ofthe inner kerf corner (Figure 6) are similar to thoseof the uniaxial case at Φ = 90° (Figure 4). In thiscase, a tensile fracture would follow a path down-ward into the rock mass below the well-bore bot-tom along a trajectory expected for petal fractures.This suggests that a large overburden stress may bea necessary requirement for producing these typesof fractures. Alternatively, the horizontally directedtension at the top surface of a short core stubmight induce centerline fracturing.
The weight on the drill bit has been suggested asproducing petal fracturing (Lorenz and Finley,1988; Kulander et al., 1990). This suggestion wasbased on the observation (Lorenz and Finley, 1988)that the trajectory of the greatest compressivestress determined from a finite-element model issimilar to the shape of the petal fractures. Theresults here indicate that less than 1 cm away fromthe inner kerf corner and into the body of the corestub the concentrated stresses produced by thedrill-bit weight are all compressive. These stresseswould retard any further advance of a tensile frac-ture into the body of the core. An increase in themagnitude of the drill-bit weight is not expected to
1918 Well-Bore Fractures
Table 2. Summary of Stress Concentrations Under Combined Stress Conditions
Greatest Tensional Stresses Greatest Shear Stresses
Applied Stress Magnitude Magnitude FractureCondition Location & Direction Location & Direction Produced
Biaxial, Root of core 5.2 MPa Inner corner 28.2 MPa Cup-shaped diskingSH = Sh (754 psi), (4089 psi), fracture initiating at= 20 MPa 0° 120° the root of the core;(2900 psi) Side surface 8.5 MPa Outer corner 25 MPa small fracturing into
(1232 psi), (3625 psi), core from side35° 75°
Hydrostatic, Side surface 11 MPa Outer corner 32 MPa Fracture initiatingSH = Sh = Sv (1595 psi), (4640 psi), above inner kerf = 20 MPa 15° 50° corner(2900 psi) Top surface 8.5 MPa
(1232 psi), 90°
SH = Sv Φ = 90° 80.5 MPa Φ = 0° 22 MPa Petal or petal-= Sb = Sp Inner corner (1167 psi), Outer corner (3190 psi), centerline fracturing= 20 MPa 120° 110° originating from inner(2900 psi) Outer corner 42 MPa Φ = 90° 41 MPa kerf corner
(6090 psi), Inner corner (5945 psi)90°

significantly change this scenario because the con-centrated compression so generated is also propor-tionally magnified. Near the inner kerf corner, how-ever, and under bit weights of 1000–10,000 kg,tensions are generated with magnitudes rangingfrom 0.76 to 7.6 MPa. This range of values suggeststhat the drill-string weight might aid or result in theincipient fracture initiation at the inner corner, butwould not promote additional propagation into thecore. In isolation from any other primary stressconditions, the drill-bit weight would first promotetensile failure into the borehole wall from the outerkerf corner.
Well-bore fluid pressure similarly produces hightensional stresses at the outer kerf corner, suggestingthat this stress condition is favorable to tensional frac-turing into the borehole wall. An inner corner ten-sion would aid initiation of fracture but, as the stress-es soon become compressive, it would not assistfracture propagation. The intrusion of pressuredfluid along the surface of the crack, however, is notconsidered here and could influence propagation.
Combined Stress Conditions
The results of the present calculations of biaxialstress conditions are consistent with those ofSugawara et al. (1978), who found high tension atthe root of the core, and a magnitude of the great-est tensile stresses of about 25% that of the appliedstress. In this study, we found that the orientationsof the principal tensile stresses remain verticalalong the core axis. Away from the core axis, theorientations are still nearly vertical; this stress con-dition could be responsible for cup-shaped coredisking. This axisymmetric stress distribution is ingood agreement with the morphology of the frac-tures produced in the “pinching” experiments ofJaeger and Cook (1963), where cylinders of rockwere subject to a uniform radial compression.
The hydrostatic case is a superposition of thebiaxial and the overburden cases, and illustrates thecompeting influences of these two stress condi-tions. Along and near the core axis, the verticalcomponent of the stresses for the biaxial case aretensional, but are compressive for the overburdencase. Consequently, their superposition diminishesthe tension inside and at the root of the core. Forexample, for a core length less than one-quarter thecore diameter, the region at the root of the core isnearly free of tension, due to the competing influ-ences of the vertical and horizontal stresses.
Li and Schmitt 1919
40 MPa
(a)
(c)
(b)
(d)
Figure 12__Orientations of principal stresses under biax-ial stress condition SH = Sh = 20 MPa for core stublengths of (a) 0 cm, (b) 1 cm, (c) 2.5 cm, and (d) 5.0 cm.Thin solid lines represent compression, and thick solidlines represent tension.
Figure 11—Contours (MPa) of σ3 under biaxial stresscondition SH = Sh = 20 MPa for core stub lengths of (a) 0 cm, (b) 1 cm, (c) 2.5 cm, and (d) 5.0 cm.

This stress interaction between the biaxial andoverburden cases also may explain qualitatively thecore-disking experiments of Obert and Stephenson(1965). Their experiments began at a trial radialpressure Sro applied uniformly to intact cylinders ofrock. These cylinders were then axially coredunder stress. If no core fracturing was observed,the radial stress on the sample was increased andthe procedure repeated until core diskingoccurred. Further experiments were done underthe application of compression parallel to the axisof the cylinder. Numerous trials showed that for avariety of sedimentary and igneous rocks, the criti-cal applied stresses at which core disking occurredcould be described by a linear relation Sr = Sro +kSv, or ∆Sr = kSv, where k is a constant with a valueof less than 1. This is in agreement with a simplecriterion that failure occurs once the stress concen-trations reach the tensile strength of the material,and with the observations from Figures 11 and 13that an increase in Sv requires a correspondingincrease in Sr to result in core disking.
For the final complex case with a combination ofall the stresses (Figure 15), the core stub is every-where in compression at Φ = 0°. At Φ = 90°, how-ever, substantial horizontal tension is produced atthe well-bore bottom prior to formation of the corestub, and stress orientations shown might promotecenterline fracturing. Once a core stub exists, hightensional stresses are produced at the inner kerfcorner at Φ = 90°, more suggestive of a petal frac-ture that would become a petal-centerline fracturewith continued propagation.
In the earth, the state of stress is not so clear asin the illustrative examples. The far-field stressstates will generally be anisotropic (SH ≠ Sh ≠ Sv).Well-bore fluid pressure depends on drilling-fluiddensity. Drill-bit weights can change drasticallywith the removal of the drill string during core bitreplacement. It is impossible to outline here all thepotential combinations that might arise, and thismust be done on a case-by-case basis. This task isfurther complicated by the observation that theapplied stresses result in competing stress concen-trations that can cancel each other. This is mostapparent in Figure 14, where the tension at thecore root generated by the uniform biaxial far-fieldcompression, as shown in Figure 12, is eliminatedby the addition of the vertical overburden stress Sv ,whose effects are shown in Figure 6.
1920 Well-Bore Fractures
40 MPa
(a)
(c)
(b)
(d)
Figure 14—Orientations of principal stresses underhydrostatic stress condition SH = Sh = Sv = 20 MPa forcore stub lengths of (a) 0 cm, (b) 1 cm, (c) 2.5 cm, and(d) 5.0 cm. Thin solid lines represent compression, andthick solid lines represent tension.
Figure 13__Contours (MPa) of σ3 under hydrostatic stresscondition SH = Sh = Sv = 20 MPa for core stub lengths of(a) 0 cm, (b) 1 cm, (c) 2.5 cm, and (d) 5.0 cm.

A number of general observations from theabove results are important. First, petal or petal-centerline fractures appear to exist only in the pres-ence of a substantial overburden stress Sv. Second,the consistent strikes of saddle-shaped disk andpetal fractures observed in the field (e.g., Kulanderet al., 1990) are related, as expected, to differencesin the magnitudes of the horizontal stresses. Thestrikes of these fractures will be parallel to SH.Finally, the points of initiation of drilling-inducedcore fractures also depend on the stress state, as
suggested by fractographic observations in core(e.g., Bankwitz and Bankwitz, 1995).
Effect of Core Length on Stress Concentration
The effects of core stub length on stress concen-tration have been shown, in previous sections, tobe significant, because the redistribution of the far-field stresses depends on the bottom-hole geome-try. Thinking of the stresses as areally distributedforces, the existence of the core stub constrains thedisplacements of the materials due to applicationsof the stresses. Because the material is continuous,a push or a pull generated at one spot within thematerial will inf luence the motion of adjacentpoints. Consequently, a change in the geometry ofthe bottom hole due to growth of the core stubwith drilling must result in a different distributionof the stress within the material. Here, the implica-tions of these changing stress concentrations withcore stub length are considered.
The magnitudes of the greatest tensile and shearstresses generated by the primary stress conditionsat the inner kerf corner are plotted vs. core stublength in Figure 16. The overburden produces thegreatest tensile stress, with a magnitude of about200% of Sv (Figure 16a). This is followed by the uni-axial stress case, with a magnitude about 125% ofSH , also at Φ = 90°. The weight of the drill bit andthe f luid pressure produce tensile stresses withsmaller magnitudes near 60% of Sb or Sp.
The curves for the overburden Sv and drill-bitweight Sb increase monotonically with core stublength, reaching a limit once the core length is 40%of the core diameter, although most of the changeoccurs before the core stub length reaches 25% ofthe core diameter. In contrast, the curves for theuniaxial SH and well-bore fluid pressure Sp casesreach a maximum prior to leveling off. The stresspeak for the uniaxial case is at a core length of 40%of the core diameter, and for fluid pressure is at acore length of 15% of the core diameter. Underthese two stress conditions, if tensional failureoccurs, the spacing of core fractures is limited tothe length of the core stub at which these maxi-mum tensions occur. If the rock has not failed intension before these core lengths are reached,core fractures are not expected. Under the over-burden Sv and drill-bit weight Sb conditions, ten-sional failure may occur at any core stub length,although most of the increase in stress concentra-tion occurs for core stubs shorter than 25% of thecore diameter.
For the uniaxial stress condition SH, the stressconcentrations at Φ = 0° have the highest shearstresses, with a magnitude about 175% of SH(Figure 16b). Overburden Sv and fluid pressure Sp
Li and Schmitt 1921
40 MPa
Φ = 0 Φ = 90o o
(a)
(b)
(c)
Figure 15—Orientations of principal stresses at Φ = 0°and Φ = 90° under SH = Sv = Sb = Sp = 20 MPa and Sh = 0 forcore stub lengths of (a) 0 cm, (b) 1 cm, and (c) 2.5 cm.Thin solid lines represent compression, and thick solidlines represent tension.

produce shear stresses with magnitudes about 75%of the applied stress. As with Figure 16a, the great-est shear stresses of the overburden Sv and theweight on drill bit Sb increase monotonically. The
greatest shear stresses of the uniaxial stress SH andthe fluid pressure Sp cases have a maximum value.
The greatest tensile and shear stresses vs. corelength for the three combined stress conditions are
1922 Well-Bore Fractures
-10
0
10
20
30
40
50
0 0.2 0.4 0.6 0.8 1.0
Sp
Sb
SH
Sv
Ten
sile
str
ess
(-1
MP
a)(a)
0
5
10
15
20
25
0 0.2 0.4 0.6 0.8 1.0
Sbiaxial
Shydrostatic
1/4Sall primary stresses
(c)
5
10
15
20
25
30
35
40
0 0.2 0.4 0.6 0.8 1.0
She
ar s
tres
s (M
Pa)
Normalized core stub length (l/d)
Sp
Sb
Sv
SH
(b)
0
5
10
15
20
25
30
35
0 0.2 0.4 0.6 0.8 1.0
Normalized core stub length (l/d)
1/4Sall primary stresses
Shydrostatic
Sbiaxial
(d)
Figure 16—The relationship between the greatest tensile and shear stresses and the normalized core stub length(l/d). (a and b) Tensile and shear stresses under the greatest horizontal stress SH = 20 MPa, overburden Sv = 20 MPa,well-bore fluid pressure Sp = 20 MPa, and the weight of drill bit Sb = 20 MPa; (c and d) tensile and shear stressesunder biaxial stress condition SH = Sh = 20 MPa, hydrostatic stress condition SH = Sh = Sv = 20 MPa, and all primarystress condition SH = Sv = Sp = Sb = 20 MPa. Note that the stress concentrations values shown for the last case arescaled by a factor of 0.25 from their larger true values to fit on the plot.
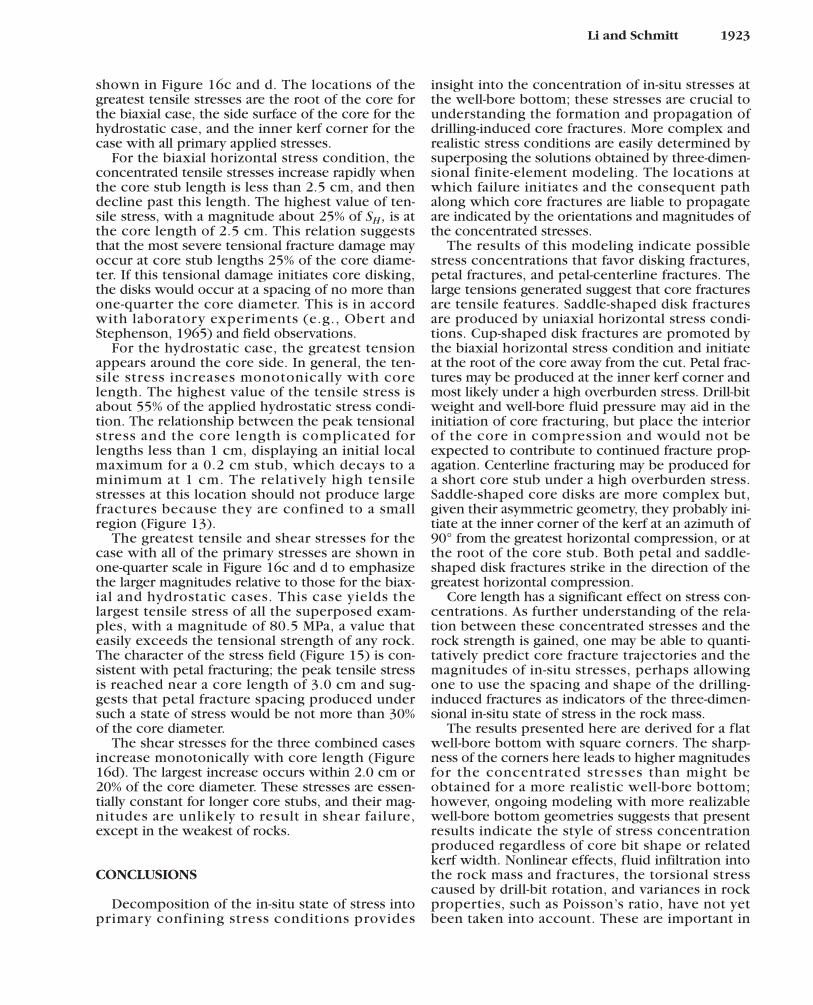
shown in Figure 16c and d. The locations of thegreatest tensile stresses are the root of the core forthe biaxial case, the side surface of the core for thehydrostatic case, and the inner kerf corner for thecase with all primary applied stresses.
For the biaxial horizontal stress condition, theconcentrated tensile stresses increase rapidly whenthe core stub length is less than 2.5 cm, and thendecline past this length. The highest value of ten-sile stress, with a magnitude about 25% of SH , is atthe core length of 2.5 cm. This relation suggeststhat the most severe tensional fracture damage mayoccur at core stub lengths 25% of the core diame-ter. If this tensional damage initiates core disking,the disks would occur at a spacing of no more thanone-quarter the core diameter. This is in accordwith laboratory experiments (e.g., Obert andStephenson, 1965) and field observations.
For the hydrostatic case, the greatest tensionappears around the core side. In general, the ten-sile stress increases monotonically with corelength. The highest value of the tensile stress isabout 55% of the applied hydrostatic stress condi-tion. The relationship between the peak tensionalstress and the core length is complicated forlengths less than 1 cm, displaying an initial localmaximum for a 0.2 cm stub, which decays to aminimum at 1 cm. The relatively high tensilestresses at this location should not produce largefractures because they are confined to a smallregion (Figure 13).
The greatest tensile and shear stresses for thecase with all of the primary stresses are shown inone-quarter scale in Figure 16c and d to emphasizethe larger magnitudes relative to those for the biax-ial and hydrostatic cases. This case yields thelargest tensile stress of all the superposed exam-ples, with a magnitude of 80.5 MPa, a value thateasily exceeds the tensional strength of any rock.The character of the stress field (Figure 15) is con-sistent with petal fracturing; the peak tensile stressis reached near a core length of 3.0 cm and sug-gests that petal fracture spacing produced undersuch a state of stress would be not more than 30%of the core diameter.
The shear stresses for the three combined casesincrease monotonically with core length (Figure16d). The largest increase occurs within 2.0 cm or20% of the core diameter. These stresses are essen-tially constant for longer core stubs, and their mag-nitudes are unlikely to result in shear failure,except in the weakest of rocks.
CONCLUSIONS
Decomposition of the in-situ state of stress intoprimary confining stress conditions provides
insight into the concentration of in-situ stresses atthe well-bore bottom; these stresses are crucial tounderstanding the formation and propagation ofdrilling-induced core fractures. More complex andrealistic stress conditions are easily determined bysuperposing the solutions obtained by three-dimen-sional finite-element modeling. The locations atwhich failure initiates and the consequent pathalong which core fractures are liable to propagateare indicated by the orientations and magnitudes ofthe concentrated stresses.
The results of this modeling indicate possiblestress concentrations that favor disking fractures,petal fractures, and petal-centerline fractures. Thelarge tensions generated suggest that core fracturesare tensile features. Saddle-shaped disk fracturesare produced by uniaxial horizontal stress condi-tions. Cup-shaped disk fractures are promoted bythe biaxial horizontal stress condition and initiateat the root of the core away from the cut. Petal frac-tures may be produced at the inner kerf corner andmost likely under a high overburden stress. Drill-bitweight and well-bore fluid pressure may aid in theinitiation of core fracturing, but place the interiorof the core in compression and would not beexpected to contribute to continued fracture prop-agation. Centerline fracturing may be produced fora short core stub under a high overburden stress.Saddle-shaped core disks are more complex but,given their asymmetric geometry, they probably ini-tiate at the inner corner of the kerf at an azimuth of90° from the greatest horizontal compression, or atthe root of the core stub. Both petal and saddle-shaped disk fractures strike in the direction of thegreatest horizontal compression.
Core length has a significant effect on stress con-centrations. As further understanding of the rela-tion between these concentrated stresses and therock strength is gained, one may be able to quanti-tatively predict core fracture trajectories and themagnitudes of in-situ stresses, perhaps allowingone to use the spacing and shape of the drilling-induced fractures as indicators of the three-dimen-sional in-situ state of stress in the rock mass.
The results presented here are derived for a flatwell-bore bottom with square corners. The sharp-ness of the corners here leads to higher magnitudesfor the concentrated stresses than might beobtained for a more realistic well-bore bottom;however, ongoing modeling with more realizablewell-bore bottom geometries suggests that presentresults indicate the style of stress concentrationproduced regardless of core bit shape or relatedkerf width. Nonlinear effects, fluid infiltration intothe rock mass and fractures, the torsional stresscaused by drill-bit rotation, and variances in rockproperties, such as Poisson’s ratio, have not yetbeen taken into account. These are important in
Li and Schmitt 1923

certain situations. Further work involving these fac-tors, the effects of boundary shear stresses, and thedetermination of the propagation paths of the ten-sile fractures is presently underway.
REFERENCES CITEDBankwitz, P., and E. Bankwitz, 1995, Fractographic features on
joints of KTB drill cores (Bavaria, Germany), in M. S. Ameen,ed., Fractography: fracture topography as a tool in fracturemechanics and stress analysis: Geological Society SpecialPublication 92, p. 39–58.
Borm, G., C. Lempp, O. Natau, and T. Röckel, 1989, Instabilities ofborehole and drillcores in crystalline rocks, with examplesfrom the KTB pilot hole: Scientific Drilling, v. 1, p. 105–114.
Chang, P. S., 1978, Determination of in-situ stress based on finite-element modeling: Master’s thesis, West Virginia University,Morgantown, West Virginia, 92 p.
Durelli, A. J., L. Obert, and V. J. Parks, 1965, Stress required to ini-tiate core disking: Transactions of the Society of MiningEngineers, AIME, v. 241, p. 269–275.
Dyke, C. G., 1989, Core disking: its potential as an indicator of principal in-situ stress directions, in V. Maury and D. Fourmaintraux, eds., Rock at great depth: Rotterdam,Balkema, v. 2, p. 1057–1064.
Engelder, T., 1993, Stress regimes in the lithosphere: Princeton,Princeton University Press, p. 171–175.
Friedman, M., 1969, Structural analysis of fractures in cores fromSaticoy field, Ventura County, California: AAPG Bulletin, v. 53,p. 367–389.
GangaRao, H. V., S. H. Advani, P. Chang, and S. C. Lee, 1979, In-situstress determination based on fracture responses associated withcoring operation: Proceedings, 20th Symposium on RockMechanics, University of Texas at Austin, Balkema p. 683–691.
Gough, D. I., and J. S. Bell, 1981, Stress orientations from oil-wellfractures in Alberta and Texas: Canadian Journal of EarthSciences, v. 18, p. 638–645.
Haimson, B. C., and M. Y. Lee, 1995, Estimating deep in-situstresses from borehole breakouts and core disking—experi-mental results in granite: Proceedings of the InternationalWorkshop on Rock Stress Measurement at Great Depth, 8thInternational Congress on Rock Mechanics, BalkemaPublishing, Tokyo, v. 3.
Hiramatsu, Y., and Y. Oka, 1962, Stress around a shaft or levelexcavated in ground with a three-dimensional stress state:Memoirs of the Faculty of Engineering, Kyoto University, v. 24,p. 56–76.
Hubbert, M. K., and D. G. Willis, 1957, Mechanics of hydraulicfracturing: Transactions of the Society of Mining Engineers,AIME, v. 210, p. 153–163.
Jaeger, J. C., and N. G. W. Cook, 1963, Pinching-off and disking ofrocks: Journal of Geophysical Research, v. 68, p. 1759–1765.
Kirsch, G., 1898, Die theorie der elastizität und die bedürfnisse derfestigkeitslehre: Zeitschrift der Vereines Deutscher Ingenieure,v. 42, p. 797–807.
Kulander, B. R., C. C. Barton, and S. L. Dean, 1979, The applicationof fractography to core and outcrop investigations: TechnicalReport for U.S. Department of Energy, Contract EY-77-Y-21-1321, METC/SP-79/3, 174 p.
Kulander, B. R., S. L. Dean, and B. J. Ward, 1990, Fractured coreanalysis: AAPG Methods in Exploration Series 8, 88 p.
Kutter, H. K., 1991, Influence of drilling method on boreholebreakout and core disking: 7th International Congress on Rock
Mechanics, p. 1659–1663.Laubach, S. E., and E. R. Monson, 1988, Coring-induced fractures:
indicator of hydraulic fracture propagation in a naturally frac-tured reservoir: Society of Petroleum Engineers Technicalpapers, SPE 18164, University Microfilms International, AnnArbor, Michigan, p. 587–596.
Leeman, E. R., 1964, The measurement of stress in rock, part 1:Journal of the South African Institute of Mining and Metallurgy,v. 65, p. 76–80.
Lenhoff, T. F., T. K. Stefansson, and T. M. Wintczak, 1982, Thecore disking phenomenon and its relation to in-situ stress atHanford: SD-BEI-T1-085, Rockwell Hanford Operations,Richland, Washington, 131 p.
Lorenz, J. C., and S. J. Finley, 1988, Significance of drilling- and coring-induced fractures in Mesaverde core, northwesternColorado: SAND87-1111, UC Category 92, Sandia NationalLaboratories, Albuquerque, New Mexico, 36 p.
Lorenz, J. C., J. F. Sharon, and N. R. Warpinski, 1990, Significanceof coring-inducing fractures in Mesaverde core, northwesternColorado: AAPG Bulletin, v. 74, p. 1017–1029.
Maury, V., F. J. Santarelli, and J. P. Henry, 1988, Core disking: areview, Sangorm Symposium: Rock Mechanics in Africa,Steeledag, Johannesburg, p. 221–231.
Miguez, R., J. P. Henry, and V. Maury, 1987, Le discage: unemethod indirecte d’evaluation des contraintes in-situ: JournéesUniversitaires de Géotechnique—St-Nazaire, InstitutUniversitaire de Technologie, p. 353–360.
Natau, O., G. Borm, and T. Röckel, 1990, Influence of lithologyand geological structure on the stability of KTB pilot hole, inV. Maury and D. Fourmaintraux, eds., Rock at great depth:Rotterdam, Balkema, v. 3, p. 1487–1490.
Nelson, R. A., L. C. Lenox, and B. J. Ward, Jr., 1987, Oriented core:its use, error, and uncertainty: AAPG Bulletin, v. 71, p. 357–367.
Obert, L., and D. E. Stephenson, 1965, Stress conditions underwhich core disking occurs: Society of Mining EngineersTransactions, v. 232, p. 227–235.
Paillet, F. L., and K. Kim, 1987, Character and distribution of bore-hole breakouts and their relationship to in-situ stresses in deepColumbia River basalts: Journal of Geophysical Research, v. 92,no. B7, p. 6223–6234.
Perreau, P. J., 1989, Tests of ASR, DSCA, and core disking analysesto evaluate in-situ stresses: Society of Petroleum Engineers SPEPaper 17960, p. 325–336.
Plumb, R. A., and J. W. Cox, 1987, Stress directions in easternNorth America determined to 4.5 km from borehole elongationmeasurements: Journal of Geophysical Research, v. 92, no. B6,p. 4805–4816.
Röckel, T., 1996, Der Spannungszustand in der tieferen Erdkrusteam Beispiel des KTB-Programms: Ph.D. dissertation, UniversitätFridericiana zu Karlsruhe, Karlsruhe, 141 p.
Stacey, T. R., 1982, Contribution to the mechanics of core disking:Journal of the South African Institute of Mining and Metallurgy,v. 82, p. 269–275.
Sugawara, K., Y. Kameoka, T. Saito, Y. Oka, and Y. Hiramatsu,1978, A study on core disking of rock: Journal of JapaneseAssociation of Mining, v. 94, p. 19–25.
Timoshenko, S. P., and J. N. Goodier, 1970, Theory of elasticity:New York, MacGraw-Hill, 567 p.
Tranter, C. J., and J. W. Craggs, 1945, The stress distribution in along circular cylinder when a discontinuous pressure is appliedto the curved surface: Philosophy Magazine, v. 36, p. 241–250.
Wang, C. Y., and Y. Sun, 1990, Oriented microfractures in CajonPass drill cores: stress field near the San Andreas fault: Journalof Geophysical Research, v. 95, p. 11,135–11,142.
1924 Well-Bore Fractures

Li and Schmitt 1925
Yongyi Li
Yongyi Li received his B.Sc.(1982) and M.Sc. (1985) degrees inengineering geology from ChengduCollege of Geology and the ChineseAcademy of Sciences, respectively,and his Ph.D. (1997) in geophysicsfrom the University of Alberta. Hewas employed by the ChineseAcademy of Sciences as a researchassistant from 1985 to 1989. Hisresearch interests include experi-mental rock physics, in-situ stress measurement, and3-D seismic imaging.
Douglas R. Schmitt
Douglas R. Schmitt is an associ-ate professor of geophysics in theDepartment of Physics at theUniversity of Alberta. He holds aB.Sc. degree (physics, 1980) fromthe University of Lethbridge and aPh.D. (geophysics, 1987) from theCalifornia Institute of Technology.Schmitt has worked as an explo-ration geophysicist for TexacoCanada and carried out postdoctor-al research in the Rock and Borehole Physics Project atStanford University. His laboratory does field and labora-tory research in rock physics and mechanics with appli-cations to mining seismology and reservoir monitoring.
ABOUT THE AUTHORS