west pointe a la hache freshwater diversion ba-04 · the west pointe a la hache (ba-04) project...
TRANSCRIPT
Monitoring Series No. BA-04-MSTY-0498-1
THREE-YEAR COMPREHENSIVE MONITORING REPORT
WEST POINTE A LA HACHE FRESHWATERDIVERSION
BA-04
State Wetland Restoration Project
Edward L.Haywood IIIWilliam M. Boshart
Louisiana Department of Natural ResourcesCoastal Restoration Division
P.O. Box 94396Baton Rouge, LA 70804-9396
April 1998

ii
TABLE OF CONTENTS
Page
LIST OF FIGURES . . . . . . . . . . . . . . . . . . . . . . . . . . . . . . . . . . . . . . . . . . . . . . . . . . . . . . . . . . . iii
LIST OF TABLES . . . . . . . . . . . . . . . . . . . . . . . . . . . . . . . . . . . . . . . . . . . . . . . . . . . . . . . . . . . . iv
ACKNOWLEDGMENTS . . . . . . . . . . . . . . . . . . . . . . . . . . . . . . . . . . . . . . . . . . . . . . . . . . . . . . . v
ABSTRACT . . . . . . . . . . . . . . . . . . . . . . . . . . . . . . . . . . . . . . . . . . . . . . . . . . . . . . . . . . . . . . . . . vi
INTRODUCTION . . . . . . . . . . . . . . . . . . . . . . . . . . . . . . . . . . . . . . . . . . . . . . . . . . . . . . . . . . . . . 1
METHODS . . . . . . . . . . . . . . . . . . . . . . . . . . . . . . . . . . . . . . . . . . . . . . . . . . . . . . . . . . . . . . . . . . 4
RESULTS . . . . . . . . . . . . . . . . . . . . . . . . . . . . . . . . . . . . . . . . . . . . . . . . . . . . . . . . . . . . . . . . . . . 8
DISCUSSION . . . . . . . . . . . . . . . . . . . . . . . . . . . . . . . . . . . . . . . . . . . . . . . . . . . . . . . . . . . . . . . 13
CONCLUSION . . . . . . . . . . . . . . . . . . . . . . . . . . . . . . . . . . . . . . . . . . . . . . . . . . . . . . . . . . . . . . 16
LITERATURE CITED . . . . . . . . . . . . . . . . . . . . . . . . . . . . . . . . . . . . . . . . . . . . . . . . . . . . . . . . 17
APPENDIX . . . . . . . . . . . . . . . . . . . . . . . . . . . . . . . . . . . . . . . . . . . . . . . . . . . . . . . . . . . . . . . A-1
iii
LIST OF FIGURES
Figure Page
1. Locations of hydrologic sampling stations at West Pointe a la Hache . . . . . . . . . . . . . . . 2
2. West Pointe a la Hache project area location illustrating locations of vegetation sampling stations from 1997 . . . . . . . . . . . . . . . . . . . . . . . . . . . . . . . . . . . . . . . . . . . . . . . 5
3. West Pointe a la Hache project area location illustrating locations of vegetation sampling stations from 1992 . . . . . . . . . . . . . . . . . . . . . . . . . . . . . . . . . . . . . . . . . . . . . . . 7
4. Salinity comparisons of the three operational categories at the five continuous recorder stations . . . . . . . . . . . . . . . . . . . . . . . . . . . . . . . . . . . . . . . . . . . . . . . . . . . . . . . . . 9
5. Salinity comparisons of the three operational categories at the 17 discrete monthly hydrologic stations . . . . . . . . . . . . . . . . . . . . . . . . . . . . . . . . . . . . . . . . . . . . . . . 10

iv
LIST OF TABLES
Table Page
1. Plant species and related frequencies for two vegetation surveys, 1992 and 1997 . . . . . 11
2. Siphon operations . . . . . . . . . . . . . . . . . . . . . . . . . . . . . . . . . . . . . . . . . . . . . . . . . . . . . . . 14

v
ACKNOWLEDGMENTS
We would like to acknowledge and extend our appreciation to Norman Davidson of the LouisianaDepartment of Natural Resources, Database Analysis Section (LDNR/DAS) for his writing of thefirst draft of this report and for his statistical analysis of the hydrologic data. We would also like tothank Brian Zielinski, also of the LDNR/DAS, who prepared the SPOT image figures; and GregorySteyer and Dan Llewellyn, LDNR Biological Monitoring Section, for their critical reviews of earlierversions of the document.
vi
ABSTRACT
Historically the Mississippi River was the source of sediment for the entire Louisiana coastal marshsystem. Unfortunately, due to a combination of natural processes such as subsidence and sea-levelrise, and anthropogenic factors including canal dredging, sediment diversion and extensive leveeconstruction along the Mississippi River, the river now funnels sediments over the continental shelfand can no longer maintain and create coastal marsh habitat. Freshwater introduction in the formof manmade diversions were designed to utilize the Mississippi River beginning in the late 1800’sand early 1900’s to benefit those areas directly adjacent to the river. Several freshwater diversionsare in existence today, one of which is located in West Pointe a la Hache, Louisiana. The WestPointe a la Hache project area, located within the Barataria Basin in Plaquemines Parish, containsapproximately 9,300 ac (3,765 ha) of open-water and 7,600 ac (3,076 ha) of brackish marsh. Thefreshwater diversion structure consists of eight 72-in (1.83 m) diameter siphon tubes with acombined maximum discharge of 2,144 cubic feet per second (cfs) (64 cubic meters per second[cms] ). All operational changes are performed by Plaquemines Parish Government (PPG). Thesechanges are directed by an operations scheme developed in 1992 by Brown and Root, Inc., based ona TABS-2 environmental model and were revised in 1993 by PPG and the Louisiana Department ofNatural Resources, Coastal Restoration Division (LDNR/CRD). The main objective of the WestPointe a la Hache project is to introduce freshwater through the west bank of the Mississippi River,thereby protecting the project area from continued saltwater intrusion. The diverted river water willcontribute freshwater, nutrients, and alluvial sediments into the project area, improving growingconditions for the target plant species, Spartina patens (marshhay cordgrass). Specific measurablegoals were established to evaluate project effectiveness. These goals are to: (1) increase marsh toopen-water ratio; (2) reduce and stabilize mean salinity; and (3) increase relative abundance of thetarget plant species (S. patens).
The freshwater diversion siphon at West Pointe a la Hache appears to be making gradualimprovements in the project area marsh since its initial opening on January 8, 1993. One of theprimary goals of the monitoring plan, the reduction of ambient salinity, has been met even at themost southern reaches of the project area. While the direct effects of the siphon are difficult todetermine (due to confounding seasonal effects), it does appear that a strong inverse relationshipexists between salinity and siphon discharge. This increase in freshwater may be responsible for theappearance of new plant species more indicative of lower salinity marshes that were previouslyunreported in the area. Additional benefits, such as sediment accretion and an improvement onmarsh to open-water ratio, remain to be determined.
1
INTRODUCTION
The Mississippi River was historically the source of sediment for the entire Louisiana coast. Thissystem represents 96 % of the deltaic wetlands on the Gulf of Mexico and is actually a compositeof seven river deltas created by the Mississippi over the last 7,000 years. Over the course of this timeperiod, the river created approximately 14,000 mi2 (36,260 km2) of marshland (Rude 1990).Unfortunately, due to a combination of natural processes such as subsidence, sea-level rise, andanthropogenic factors including canal dredging, sediment diversion and extensive levee constructionalong the Mississippi River, the river now funnels sediments over the continental shelf and can nolonger maintain and create coastal marshes. For these reasons, Louisiana has the highest rate of landloss in the United States (Wells and Coleman 1987; Dunbar et al. 1992). The process of leveeconstruction has had a dramatic impact on the general ecology of the marsh and altered the onceuniform distribution of freshwater out of the river into the marsh-estuary complexes (Bowman et al.1995).
Freshwater introductions in the form of manmade diversions were designed to utilize the MississippiRiver as early as the late 1800’s and early 1900’s to draw river water into the rice fields that existedalong the river. The first controlled freshwater diversion for fish and wildlife purposes wasconstructed at Bayou Lamoque in 1956. The freshwater from this project was diverted into lowerCalifornia Bay in the Breton Sound Basin to enhance oyster production (Bowman et al. 1995). Theessential goals of modern freshwater diversions are 1) to manage the productivity of wildlife andfishery resources by controlling salinity, and 2) to benefit marsh maintenance (Roberts et al. 1992).Fishery resources depend upon the immigration and emigration of larval, post-larval, and juvenileorganisms in the saline, brackish, and fresh/intermediate marsh nursery grounds and thereforedepend on the sustained habitat gradient from fresh to saline wetlands. Several other studies todetermine the feasibility of large-scale controlled freshwater diversions from the Mississippi Riverto the adjacent estuarine areas were conducted in the past by the U. S. Army Corps of Engineers(USACE) (USACE 1982). These studies indicated that controlled diversion to these areas istechnically feasible and would result in substantial overall net benefits to estuarine organisms. Otherstudies point to salinity as being the single most important factor in determining the distributionallimits and abundance of the majority of estuarine organisms (Gunter et al. 1974; Chatry and Chew1985). The second goal, marsh maintenance, is achieved when sediments from the freshwaterdiversion help to balance the accretion deficit as a result of subsidence. This decrease in netsubsidence aids in reducing tidal water exchange and accompanying salinity, subsequently protectingfreshwater and low-salinity wetland plants from salt-related stress (Roberts et al.1992). Severalfreshwater diversions currently exist along the Mississippi River and one such diversion occurs onthe west bank of the Mississippi River at West Pointe a la Hache, Louisiana.
The West Pointe a la Hache (BA-04) project area, located within the Barataria Basin in PlaqueminesParish, contains approximately 9,300 ac (3,765 ha) of open-water and 7,600 ac (3,076 ha) of brackishmarsh (figure 1). The area includes Lake Judge Perez to the northwest, and is bounded to the southby Bayou Grand Cheniere, to the southeast by the Socola Canal, and to the north by the Mississippi

Figure 1. Locations of hydrologic sampling stations at West Pointe a la Hache.
2
3
River back protection levee. The average rate of change from marsh to non-marsh (including lossto both open-water and commercial development) has been increasing since the 1930’s. Marsh lossrates for the Pointe a la Hache quadrangle were 0.28 mi2/yr (0.73 km2/yr) between 1932 and 1958,0.75 mi2/yr (1.94 km2/yr) between 1958 and 1974, 0.71 mi2/yr (1.84 km2/yr) between 1974 and 1983,and 0.75 mi2/yr (1.94 km2/yr) between 1983 and 1990 (Dunbar et al. 1992). The freshwater diversionstructure, located at river mile 48.9 (above Head of Passes) at West Pointe a la Hache, consists ofeight 72-in (1.8m) diameter siphon tubes with a combined maximum discharge of 2,144 cfs (64.32cms). The siphons empty into a designated discharge pond with four outfall channels (Brown &Root, Inc. 1992). All operational changes are performed by Plaquemines Parish Government (PPG).These changes are directed by an operations scheme developed in 1992 by Brown and Root, Inc.,based on a TABS-2 environmental model and were revised in 1993 by PPG and the LouisianaDepartment of Natural Resources, Coastal Restoration Division (LDNR/CRD). The revisedoperations scheme calls for the structure to be operated at full capacity for all months except Marchand April when it is to be operated at two pipes.
The soil types found within the project area consist of the Gentilly muck, Lafitte-Clovelly muck, andTimbalier-Belle Pass soil types. The Gentilly muck is found mainly along the Grand Chenierenatural ridge system and is characterized as being a poorly drained, very fluid mineral soil. TheLafitte-Clovelly muck is scattered throughout the inner marsh and is characterized as a poorlydrained, very fluid, slightly saline and organic soil. The Timbalier-Belle Pass association ischaracterized as a poorly drained organic type soil. The surface layer of all the soils within theproject area is composed of organics and very susceptible to erosion especially when not protectedby vegetation (U.S. Soil Conservation Service 1991).
In 1949, O’Neil classified the area as brackish marsh consisting mainly of Scirpus olneyi (three-cornered grass) and S. patens (Brown & Root, Inc. 1992). In 1978, Chabreck and Linscombeclassified the area as 66% saline marsh, 28% brackish marsh, and 6% non-marsh. The saltmarsh wasdominated by Juncus roemerianus (black needlerush), S. patens, and Spartina alterniflora (smoothcordgrass). The area was reclassified in 1988 by Chabreck and Linscombe as brackish marsh andobservations in 1991 by the Soil Conservation Service (currently Natural Resources ConservationService) indicated that the brackish marsh was deteriorating and being encroached upon by salinemarsh (Brown & Root, Inc. 1992).
The main objective of the West Pointe a la Hache project is to introduce freshwater through the westbank of the Mississippi River, thereby protecting the project area from continued saltwater intrusion.The diverted river water will contribute freshwater, nutrients, and alluvial sediments into the projectarea, improving growing conditions for the target plant species, Spartina patens (marshhaycordgrass). Specific measurable goals were established to evaluate project effectiveness. Theseinclude: (1) increase marsh to open-water ratio, (2) reduce and stabilize mean salinity, and (3)increase relative abundance of the target plant species (S. patens) (LDNR 1996).
4
METHODS
The LDNR/CRD, responsible for all hydrologic monitoring of the West Pointe a la Hache project,records salinity (in parts per thousand [ppt]) at the top and bottom of the water column along withstation depth (ft), specific conductance (µsiemens/cm), and water temperature ( 1C) on a monthlybasis at 17 stations throughout the project area (figure 1). Health-related water quality (fecalcoliform, most probable number/100 ml [MPN/100ml]) is sampled by PPG in concurrence withmonthly hydrologic monitoring. Water level was measured at five staff gauge stations surveyed tothe National Geodetic Vertical Datum (NGVD) until October 1997 when these stations were re-surveyed to the North American Vertical Datum (NAVD).
Daily siphon discharge in cubic feet per second (cfs) was formulated from the head differentialbetween the river and the marsh staff gauges and the number of pipes in operation. Any missingvalues for daily gauge readings were interpolated from known values, and linear shifts in dischargeincrease or decrease were applied to unknown ranges, in an attempt to estimate the daily amount ofdischarge entering the project area through the siphons. In addition, monthly flow means werecalculated and grouped into one of three categories: no flow (0 cfs [0 cms]/month), partly operational(0<x<1072 cfs [32.16 cms]/month) or fully operational (>1072 cfs [32.16 cms]/month). Thisdistinction of discharge information is an improvement on the former designation of “operational”and “non-operational” because it takes into account periods when siphon discharge is minimal.
In order to obtain spatial inference on the overall salinity of the project area during different phasesof siphon operation, bottom salinity data from the 17 monthly monitoring stations was analyzed ina one-way ANOVA that tested mean salinities of the three levels of siphon operation (noflow, partlyoperational, and fully operational). Post-ANOVA Tukey pairwise comparisons were used toinvestigate mean differences when models were found to be significant. Historic data that had beentabulated on a weekly or bi-weekly basis was averaged to obtain monthly means for each station.These data were coalesced with recent data to form a holistic data set beginning with the earliestsampling date (May 28, 1992). Finally, data from all stations (for each respective month) wereaveraged to obtain a value indicative of the overall project area salinity for each month. These“monthly project area means” were the observations used in the model.
Salinity, specific conductance, water temperature, and water level were recorded hourly at fivestations beginning on January 8, 1993 (figure 1). These data were recorded with either HydrolabDatasonde 3, YSI Model 6000 or 6920 continuous dataloggers. Daily means were calculated forsalinity and water level, and a one-way ANOVA was performed on each recorder-station data set,testing whether mean salinities were equal during all three stages of siphon operation. Post-ANOVATukey pairwise comparisons were used to investigate mean differences when models were found tobe significant.
Plant species composition and relative abundance were measured at 36 stations (1m2-plots) inSeptember-October 1997 using the Braun-Blaunquet sampling protocol (Mueller-Dombois andEllenberg 1974) (figure 2). These vegetation data represent a five year difference from the first

5
Figure 2. West Pointe a la Hache project area location illustrating locations of vegetation sampling stations from 1997.

6
vegetation survey, performed in June 1992 (Ensminger 1992) (figure 3). Although differentmethodologies were employed during both studies (ocular estimates in 1992 vs. Braun-Blaunquetin 1997, as well as different station locations and numbers [21 in 1992 vs. 36 in 1997]), speciescomposition and relative abundance were qualitatively compared in an attempt to determine plantcommunity changes that may be due to siphon operation. Species richness (number of species) wasalso compared between the two sample periods. Species richness is useful as an index ofenvironmental stress and/or shift in community type because species richness generally increases aswe move from saline to more intermediate marsh types (Palmisano and Chabreck 1972).
Fecal coliforms were analyzed with a one-way ANOVA model similar to that used in the salinityanalysis. Under guidelines established by the U.S. Department of Health and Human Services, theFDA’s National Shellfish Sanitation Program (NSSP) requires that fecal coliform counts betabulated as the most probable number per 100 ml (MPN/100ml) (Brown and Root, Inc. 1991). Thisis achieved by taking the geometric mean of a series of samples, in order to account for variation inthe sampling procedure. According to NSSP guidelines, any series of samples whose geometricmean is greater than 14 MPN represents a contaminated water source (Brown and Root, Inc. 1991).Therefore, geometric means were calculated for each month’s samples, and then the ANOVA wasperformed on the three levels of siphon operation, to determine whether or not fecal coliform countswere higher during certain phases of siphon operation.
Marsh to open-water ratios were determined from color-infrared aerial photography (scale=1:12,000). Initial photography was obtained in 1992. Changes in marsh to open-water ratio willbe evaluated in future progress reports.

7
Figure 3. West Pointe a la Hache project area location illustrating locations of vegetation sampling stations from 1992.
8
RESULTS
Approximately 5.6 yrs of hydrologic monitoring data have been accumulated since monitoring wasinitiated in May 1992 (approximately 25 months at “noflow”, 19 months at “partly operational”, and23 months at “fully operational,” Appendix 1). Salinities are significantly lower ( % = 0.05 ) at allfive recorders during months when the siphons are fully operational as opposed to those monthswhen there is no siphon discharge (figure 4). Furthermore, periods of “partly operational” status atall recorders have mean salinities that are less than periods of no flow. Tukey pairwise comparisonsat each station were significant for all three operational categories except station 10, fully vs. partlyoperational. Mean salinities parts per thousand (ppt) for all five stations are significantly differentat all three levels of siphon operation, with the only exception being station 10, where mean salinitiesduring periods of partly operational siphon status (7.3 ppt ± 0.18 s.e.) are not statistically differentfrom fully operational status (6.9 ppt ± 0.12 s.e.).
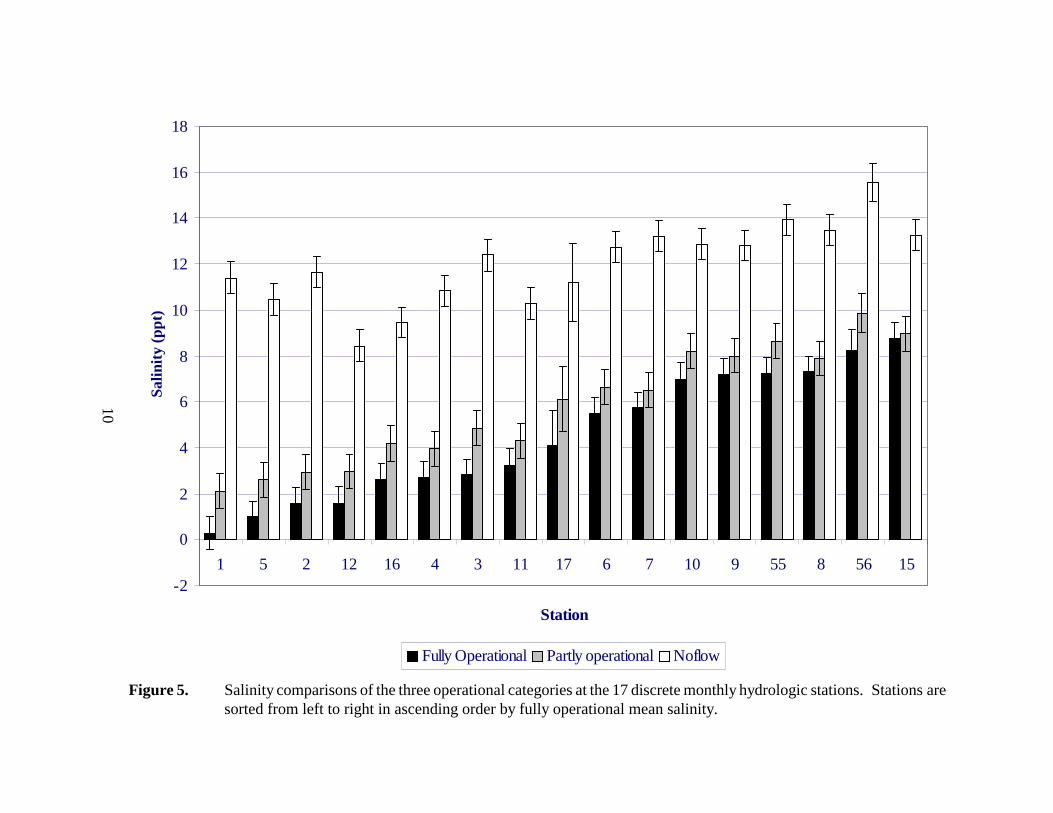
Similarly, discrete station salinity readings indicated significant differences (F = 346.20, df = 2, p< 0.0001) in overall mean project area salinity between fully operational status (4.62 ppt ± 0.22 s.e.)and periods of inoperation (11.77 ppt ± 0.19 s.e.), as well as partly operational status (5.65 ppt ± 0.26s.e.). During periods of siphon operation (either partly or fully), the lowest mean salinities wererecorded from stations 1, 2, 3, 4, 5, 12, and 16 which are located closest to or north of the structurelocation. Additionally, highest salinities recorded during periods of siphon operation occurred atstations 8, 9, 10, 15, 55, and 56 which are located farthest from the structure (figure 5).
In contrast, water levels and fecal coliform were not as affected by siphon discharge as was salinity.In the immediate outfall pond (station 1) a relationship exists between siphon discharge and waterlevel (via simple linear regression, R2 = 0.31, p < 0.0001). However, average monthly water levelstaken from a group of the nearest stations (1, 2, 3, 5, and 6) do not show statistical differences orrelationships between siphon operational status (fully operational, 1.19 ft NGVD [± 0.09 s.e.]; partlyoperational, 1.34 ft NGVD [± 0.09 s.e.]; noflow, 0.92 ft NGVD [± 0.11 s.e.]). This observation wassimilar for the continuous recorder water level data, which did not reveal any informativerelationship between siphon operation and water level. At station 7, the continuous recorder nearestto the siphon, mean water level above depth sensor was highest during periods of no flow (2.54 ft± 0.03 s.e.) as opposed to fully operational (2.4 ft ± 0.04 s.e.). There were no significant differencesin fecal coliform bacteria levels among the three phases of siphon operation (F = 1.75, df = 2, p =0.1814), where the arithmetic means for each level were: 85.06 MPN/100ml, fully operational (13.43s.e.); 51.78 MPN/100ml, partly operational (6.41 s.e.); 69.10 MPN/100ml, no flow (14.08 s.e.).
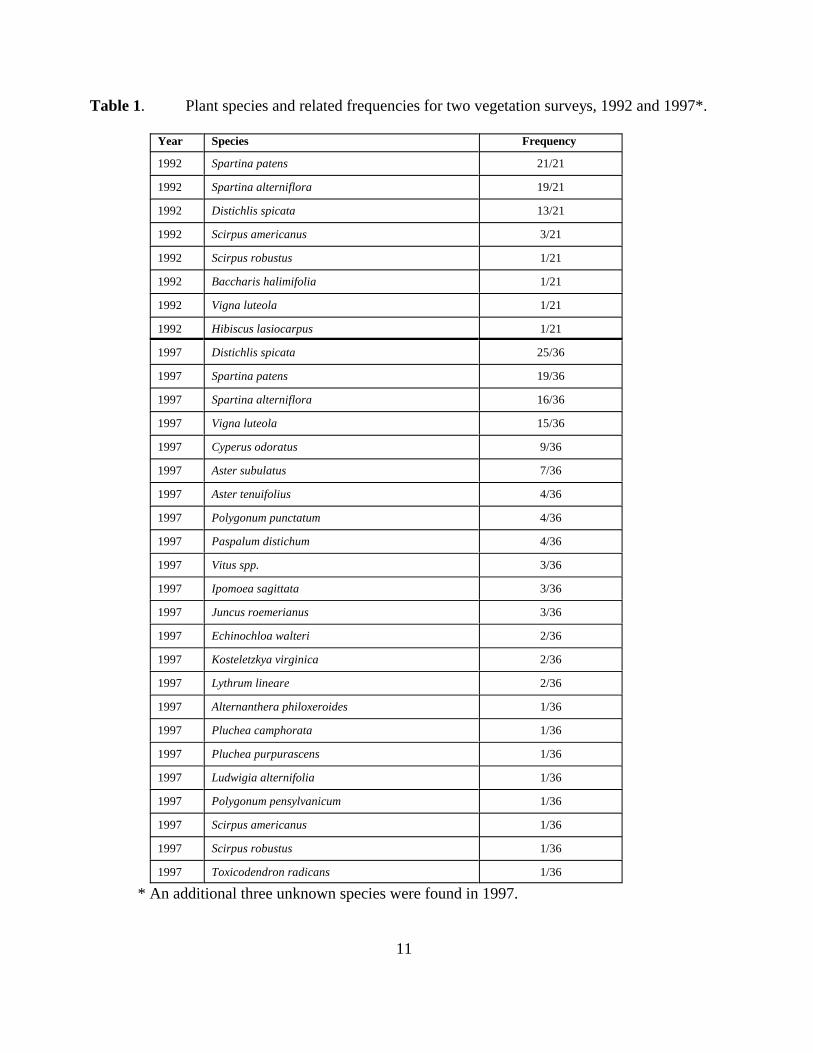
The preconstruction vegetation survey performed in June 1992 revealed a total of 8 species at 21sites with a mean species richness at each site of 2.86 (± 0.13 s.e.) with no apparent spatial patternof distribution throughout the project area. The 1997 survey revealed an increase in species richness,as 26 species were tabulated at 36 sites (table 1). Mean species richness at each individual stationwas 3.58 (± 0.27 s.e.).

0
2
4
6
8
10
12
14
16
7 10 17 55 56
Station
Salin
ity
(ppt
)
Fully Operational Partly Operational Noflow
Figure 4. Salinity comparisons of the three siphon operational categories at the five continuous recorder stations.
9
-2
0
2
4
6
8
10
12
14
16
18
1 5 2 12 16 4 3 11 17 6 7 10 9 55 8 56 15
Station
Salin
ity
(ppt
)
Fully Operational Partly operational Noflow
Figure 5. Salinity comparisons of the three operational categories at the 17 discrete monthly hydrologic stations. Stations aresorted from left to right in ascending order by fully operational mean salinity.
10
11
Table 1. Plant species and related frequencies for two vegetation surveys, 1992 and 1997*.
Year Species Frequency
1992 Spartina patens 21/21
1992 Spartina alterniflora 19/21
1992 Distichlis spicata 13/21
1992 Scirpus americanus 3/21
1992 Scirpus robustus 1/21
1992 Baccharis halimifolia 1/21
1992 Vigna luteola 1/21
1992 Hibiscus lasiocarpus 1/21
1997 Distichlis spicata 25/36
1997 Spartina patens 19/36
1997 Spartina alterniflora 16/36
1997 Vigna luteola 15/36
1997 Cyperus odoratus 9/36
1997 Aster subulatus 7/36
1997 Aster tenuifolius 4/36
1997 Polygonum punctatum 4/36
1997 Paspalum distichum 4/36
1997 Vitus spp. 3/36
1997 Ipomoea sagittata 3/36
1997 Juncus roemerianus 3/36
1997 Echinochloa walteri 2/36
1997 Kosteletzkya virginica 2/36
1997 Lythrum lineare 2/36
1997 Alternanthera philoxeroides 1/36
1997 Pluchea camphorata 1/36
1997 Pluchea purpurascens 1/36
1997 Ludwigia alternifolia 1/36
1997 Polygonum pensylvanicum 1/36
1997 Scirpus americanus 1/36
1997 Scirpus robustus 1/36
1997 Toxicodendron radicans 1/36
* An additional three unknown species were found in 1997.
12
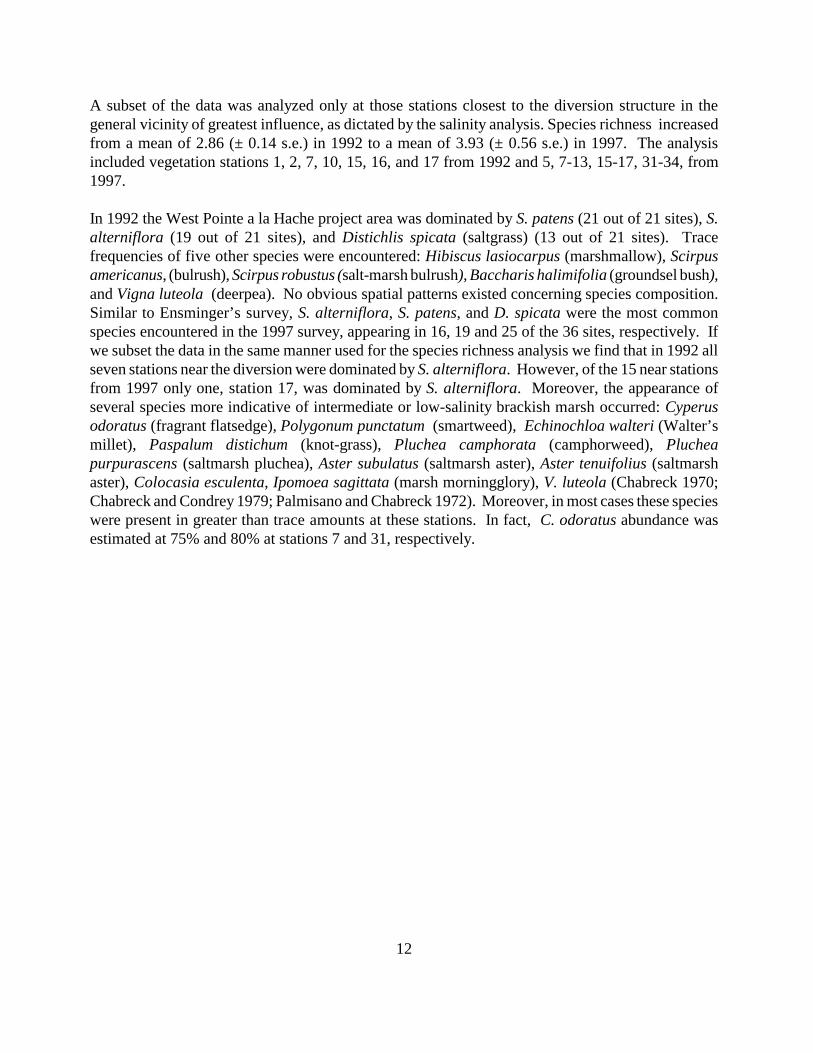
A subset of the data was analyzed only at those stations closest to the diversion structure in thegeneral vicinity of greatest influence, as dictated by the salinity analysis. Species richness increasedfrom a mean of 2.86 (± 0.14 s.e.) in 1992 to a mean of 3.93 (± 0.56 s.e.) in 1997. The analysisincluded vegetation stations 1, 2, 7, 10, 15, 16, and 17 from 1992 and 5, 7-13, 15-17, 31-34, from1997.
In 1992 the West Pointe a la Hache project area was dominated by S. patens (21 out of 21 sites), S.alterniflora (19 out of 21 sites), and Distichlis spicata (saltgrass) (13 out of 21 sites). Tracefrequencies of five other species were encountered: Hibiscus lasiocarpus (marshmallow), Scirpusamericanus, (bulrush), Scirpus robustus (salt-marsh bulrush), Baccharis halimifolia (groundsel bush),and Vigna luteola (deerpea). No obvious spatial patterns existed concerning species composition.Similar to Ensminger’s survey, S. alterniflora, S. patens, and D. spicata were the most commonspecies encountered in the 1997 survey, appearing in 16, 19 and 25 of the 36 sites, respectively. Ifwe subset the data in the same manner used for the species richness analysis we find that in 1992 allseven stations near the diversion were dominated by S. alterniflora. However, of the 15 near stationsfrom 1997 only one, station 17, was dominated by S. alterniflora. Moreover, the appearance ofseveral species more indicative of intermediate or low-salinity brackish marsh occurred: Cyperusodoratus (fragrant flatsedge), Polygonum punctatum (smartweed), Echinochloa walteri (Walter’smillet), Paspalum distichum (knot-grass), Pluchea camphorata (camphorweed), Plucheapurpurascens (saltmarsh pluchea), Aster subulatus (saltmarsh aster), Aster tenuifolius (saltmarshaster), Colocasia esculenta, Ipomoea sagittata (marsh morningglory), V. luteola (Chabreck 1970;Chabreck and Condrey 1979; Palmisano and Chabreck 1972). Moreover, in most cases these specieswere present in greater than trace amounts at these stations. In fact, C. odoratus abundance wasestimated at 75% and 80% at stations 7 and 31, respectively.

13
DISCUSSION
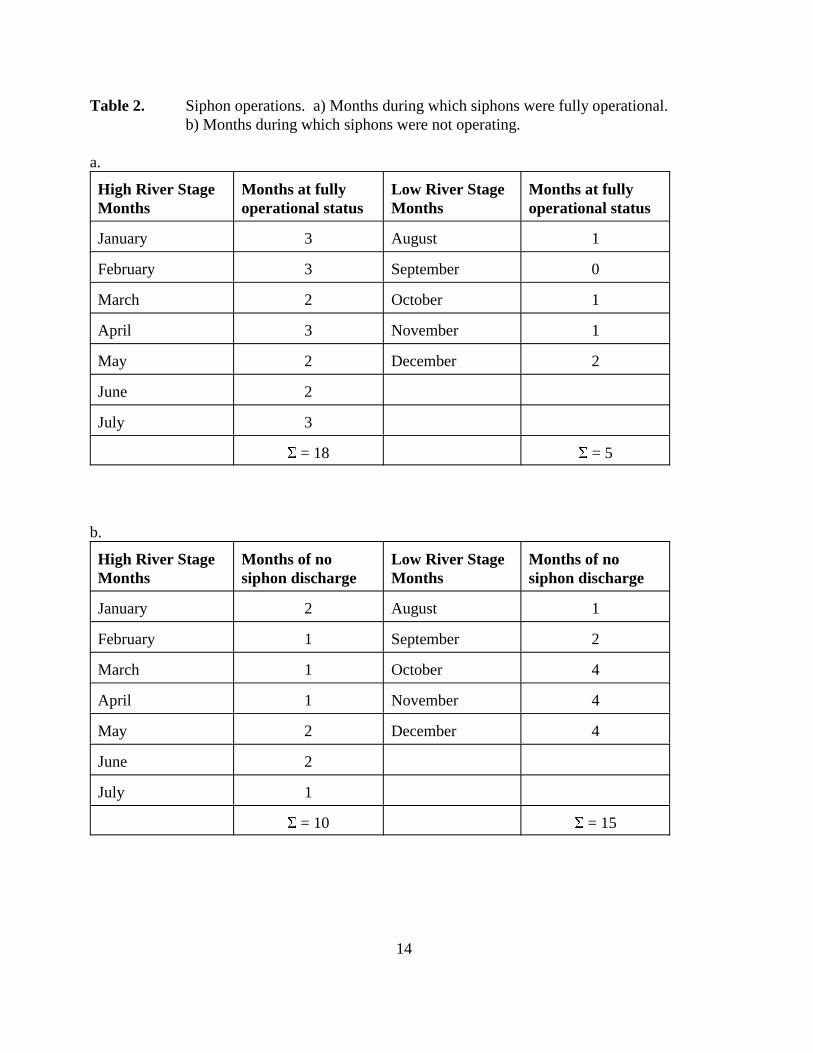
The prevalence of months that the siphons were at fully operational status (18 out of 23) coincide withperiods of high river stage (winter - mid summer). This is an obvious feature of the project design,because sufficient head differential between river stage and marsh stage is necessary for properoperation of the siphons. However, the Barataria estuary is naturally fresher during this time of theyear, because of the Mississippi River’s influence (Swenson and Swarzenski 1995). Similarly, 15 ofthe 25 months of “no flow” occur between August and December, when there is insufficient headdifferential to operate the siphons. The low river stages at this time in the year have historicallyresulted in higher salinities in the estuary (Swenson and Swarzenski 1995). Therefore, an inherentsource of bias exist in the interpretation of the direct effects of the siphon and its operational status(table 2). All five continuous recorder stations exhibited reductions in mean salinity from periods ofinoperation to periods of partly and fully operational status. By looking at the discrete stationsindividually, we were able to evaluate spatial effects of siphon operation on salinity. These resultssuggest siphon influence is inversely related to distance from the structure. Stations 12 and 16exhibited low salinities even though they were located slightly farther from and north of the siphonoutflow probably due in part to the fact that they have the lowest mean salinities during periods ofinoperation. They are located in a section of the project area that is not as subject as the rest of theproject area to the saltwater spikes that travel up through Grand Bayou from the Gulf of Mexico.Thus, the overriding trend apparent from both the continuous recorder and discrete data sets showsa definite reduction in salinity across the project area when the siphons are in operation, as opposedto periods of inoperation.
Operation of the siphons apparently has no effect on the water levels within the project area. Therelationship between siphon operation and mean water levels does not appear to be a causative one.Water levels at station 7, as well as other stations farther from the outfall, are likely governed largelyby wind and tidal events, with little or no influence from the diversion structure. One possibleexplanation for water level remaining unchanged, despite the frequent inputs of large amounts of riverwater, is the location of the outfall pond in relation to Grand Bayou and the Jefferson Lake canal,which can serve as conduits for the introduced freshwater. These channels are wide enough (and deepenough) to quickly disperse incoming river water further south, instead of allowing sheet flow acrossthe marsh. The West Pointe a la Hache outfall management plan will address this problem, andrelated problems of sediment dispersion and accretion.
In addition to water levels, changes in fecal coliform levels in the West Pointe a la Hache project areacould not be directly attributed to contamination from the Mississippi River since there were highcoliform levels present in all 3 phases (full, partial, and non-operational) of siphon operation. It isalso pertinent to note that the region was considered contaminated prior to construction of the siphon(Brown and Root, Inc. 1991), so point source contamination (from the Mississippi River) does notappear to be the single factor governing coliform counts in the West Pointe a la Hache project area.
14
Table 2. Siphon operations. a) Months during which siphons were fully operational.b) Months during which siphons were not operating.
a.
High River StageMonths
Months at fullyoperational status
Low River StageMonths
Months at fullyoperational status
January 3 August 1
February 3 September 0
March 2 October 1
April 3 November 1
May 2 December 2
June 2
July 3
= 18 = 5
b.
High River StageMonths
Months of no siphon discharge
Low River StageMonths
Months of nosiphon discharge
January 2 August 1
February 1 September 2
March 1 October 4
April 1 November 4
May 2 December 4
June 2
July 1
= 10 = 15

15
The higher post construction vegetation species richness lends support to the previous salinityanalyses concerning the freshening effects of the siphons. Higher species richness is generallyassociated with more fresh or intermediate marsh than with saline or high salinity brackish marshes(Palmisano and Chabreck 1972). Although the predominant species present in 1992 were wellrepresented in 1997, the addition of other species more suited for fresher environs may indicate thatthe freshwater inputs from the siphons are causing a gradual shift in the plant community to a moreintermediate - brackish vegetation assemblage. It is important to note that it is not clear at this timeif the difference in the plant community data between 1992 and 1997 resulted from the difference inthe locations (i.e., spatial variability) or number of stations or from the difference over time (i.e.,temporal variability).

16
CONCLUSIONS
The freshwater diversion siphon at West Pointe a la Hache appears to be making gradualimprovements on the project area marsh since its initial opening on January 8, 1993. One of theprimary goals of the monitoring plan, the reduction of ambient salinity, has definitely been met, evenat the most southern reaches of the project area. While the direct effects of the siphon are difficultto determine (due to confounding seasonal effects), it does appear that there is a strong inverserelationship between salinity and siphon discharge thus reducing the negative effects of saltwaterintrusion. This increase in freshwater may also be responsible for the appearance of new plant speciesmore indicative of lower salinity marshes that were previously unreported in the area. Additionalbenefits, such as sediment accretion and an improvement on marsh to open-water ratio, remain to bedetermined.

17
LITERATURE CITED
Bowman, P. E., W. S. Perret, and J. E. Roussel 1995. Freshwater introduction and implications forfisheries production in Louisiana. Baton Rouge, LA: Department of Wildlife and Fisheries.
Brown and Root, Inc. 1991. LaReussite and West Pointe a la Hache prediversion water monitoringreport. Unpublished final report prepared for Plaquemines Parish government, Departmentof Health and Hospitals. Belle Chasse, La: Brown and Root, Inc.
Brown and Root, Inc. 1992. West Pointe a la Hache freshwater diversion siphon. A management,operation, and monitoring plan. Unpublished final report prepared for Plaquemines Parishgovernment, Department of Health and Hospitals. Belle Chasse, La.: Brown and Root, Inc.
Chabreck, R.H. 1970. Marsh zones and vegetation types in the Louisiana coastal marshes. 1970. Ph. D. dissertation. Louisiana State University.
Chabreck, R.H., and R.E. Condrey 1979. Common Vascular Plants of the Louisiana Marsh. BatonRouge: Louisiana State University Center for Wetland Resources. Sea Grant Publication No.LSU-T-79-003. 117 pp.
Chabreck, R.H., and J. Linscombe 1978. Vegetative type map of the Louisiana coastal marshes.New Orleans: Louisiana Department of Wildlife and Fisheries. Scale 1:62,500.
Chabreck, R.H., and J. Linscombe 1988. Vegetative type map of the Louisiana coastal marshes.New Orleans: Louisiana Department of Wildlife and Fisheries. Scale 1:62,500.
Chatry, M., and D. Chew 1985. Freshwater diversion in coastal Louisiana: Recommendations fordevelopment of management criteria. Fourth coastal marsh and estuary managementsymposium, pp.71-84
Dunbar, J. B., L. D. Britsch, and E. B. Kemp III 1992. Land Loss Rates Report 3: Louisiana CoastalPlain. Technical Report GL-90-2. Vicksburg, Miss.: U.S. Army Corps of Engineers. 65 pp.
Ensminger, A. B. 1992. Vegetative delineations for the West Pointe a la Hache freshwater diversionoutfall area project No. BA-04. Unpublished final report prepared for the LouisianaDepartment of Natural Resources/Coastal Restoration Division. Belle Chasse, La.: Wetlandsand Wildlife Management Co.
Gunter, G., A. Venkataramiah, and G. J. Lakshmi 1974. Studies on the effects of salinity andtemperature on the commercial shrimp, Penaeus aztecus ives, with special regard to survivallimits, growth, oxygen consumption and ionic regulation. Vicksburg, Miss. U. S. ArmyEngineer Waterways Experiment Station. 134 pp..

18
Louisiana Department of Natural Resources (LDNR) 1996. West Pointe a la Hache Freshwater Diversion (BA-04) Monitoring Plan. Unpublished monitoring plan. Baton Rouge: CoastalRestoration Division, Biological Monitoring Section.
Mueller-Dombois, D., and H. Ellenberg 1974. Aims and Methods of Vegetation Ecology. NewYork: John Wiley & Sons, Inc.
O’Neil, T. 1949. The muskrat in the Louisiana coastal marsh. Louisiana Wildlife and Fisheriescommission, New Orleans, LA. 152 pp.
Palmisano, A. W., and R. H. Chabreck 1972. The relationship of plant communities and soils of theLouisiana coastal marshes. Louisiana State U. Ag. Exp. Sta. Bull. 664. Louisiana StateUniversity.
Roberts, D. W., J. L. van Beck, S. Fournet, and S. J. Williams 1992. Abatement of wetland loss inLouisiana through diversions of Mississippi River water using siphons. U. S. GeologicalSurvey Open - File Report 92-274. Reston, VA.
Rude, K. 1990. Deltaic Gulf Coast Wetlands. Ducks Unlimited. Nov/Dec. pp.41-57
Swenson, E. M., and C. M. Swarzenski 1995. Water levels and salinity in the Barataria-TerrebonneEstuarine System. In D. J. Reed, ed. Status and Historical Trends of Hydrologic Modification, Reduction in Sediment Availability, and Habitat Loss/Modification in the Barataria and Terrebonne Estuarine System. BTNEP Publ. No. 20, Barataria-TerrebonneNational Estuary Program, Thibodaux, Louisiana.
U. S. Soil Conservation Service 1991. Feasibility Report for Project No. BA-4: West Pointe a laHache Diversion Siphon, Plaquemines Parish, Louisiana. Unpublished report prepared forthe Louisiana Department of Natural Resources/Coastal Restoration Division. Alexandria,La.: U.S. Department of Agriculture, Soil Conservation Service. 30pp.
United States Army Corps of Engineers (USACE) 1982. Feasibility report on freshwater diversionto Barataria and Breton Sound Basins/Department of the Army, New Orleans District, Corpsof Engineers.
Wells, J. T., and J. M. Coleman 1987. Wetland loss and the subdelta life cycle. Estuarine, Coastaland Shelf Science. 25: 111-125.

Appendix 1. Average monthly siphon discharge (cfs) May 1992 - December 1997.
Month Avg. Discharge Month Avg. Discharge Month Avg. Discharge
May ‘92 0.00 April ‘94 1081.82 March ‘96 975.53
June ‘92 0.00 May ‘94 565.93 April ‘96 1250.00
July ‘92 0.00 June ‘94 603.99 May ‘96 1795.59
August ‘92 0.00 July ‘94 308.43 June ‘96 1648.90
September ‘92 0.00 August ‘94 137.27 July ‘96 1241.12
October ‘92 0.00 September ‘94 393.18 August ‘96 1268.91
November ‘92 0.00 October ‘94 0.00 September ‘96 326.53
December ‘92 0.00 November ‘94 0.00 October ‘96 167.81
January ‘93 1095.99 December ‘94 0.00 November ‘96 488.48
February ‘93 1400.06 January ‘95 0.00 December ‘96 1784.92
March ‘93 432.61 February ‘95 0.00 January ‘97 1466.85
April ‘93 400.42 March ‘95 0.00 February ‘97 1736.73
May ‘93 1490.92 April ‘95 0.00 March ‘97 1883.84
June ‘93 1313.02 May ‘95 0.00 April ‘97 1073.30
July ‘93 1244.06 June ‘95 0.00 May ‘97 1036.91
August ‘93 773.37 July ‘95 1246.03 June ‘97 1007.60
September ‘93 795.89 August ‘95 812.25 July ‘97 unknown*
October ‘93 1688.71 September ‘95 749.47 August ‘97 29.35
November ‘93 1271.08 October ‘95 0.00 September ‘97 0.00
December ‘93 1929.14 November ‘95 0.00 October ‘97 0.00
January ‘94 1482.45 December ‘95 0.00 November ‘97 0.00
February ‘94 1868.26 January ‘96 0.00 December ‘97 0.00
March ‘94 1968.13 February ‘96 892.30
* In July 1997, an average of three pipes remained in operation, so this month was assigned to the“partly operational” status.
A-1